
Asian tourism seasonality, with an James Cook University.
This file is part of the following reference:
Chen, Tingzhen (2010) Asian tourism seasonality, with an
emphasis on China’s Golden Week system. PhD thesis,
James Cook University.
Access to this file is available from:
http://eprints.jcu.edu.au/19000
Asian tourism seasonality, with an emphasis on China’s Golden Week system
Thesis submitted by Tingzhen Chen
Bachelor in Tourism Management (Hons)
For the degree of Doctor of Philosophy
Tourism, School of Business
James Cook University
Townsville
January 2010
Abstract
Seasonality is a distinguishing characteristic of tourism, and it has economic
importance thus attracting attention from the academic area as well as from the
business and policy making domains. The aim of this thesis is to explore the
seasonality phenomenon in Asian tourism, with a particular emphasis on residents’
and managers’ views of China’s Golden Week system. The discussion on this topic
starts with a review of key aspects of seasonality in the tourism context, including its
definition, causes and impacts. Previous studies on seasonality conducted in the
context of Western countries are initially considered. This work is followed by an
introduction to seasonality in Asian studies, with a brief discussion of Japan’s Golden
Week and a focus on China’s Golden Week system which is the centre of this study.
Based on the literature review, an opportunity exists to better understand seasonality
in Asian tourism, particularly the residents’ and managers’ views of China’s Golden
Week system. Three studies are implemented to address these research opportunities.
The first study was based on secondary data analysis and it was designed to
characterise the seasonality phenomenon in Asian tourism. Secondary data of monthly
tourist arrivals to five key Asian countries and four Chinese areas over a time period
were selected to identify the seasonality patterns. By comparing the variances
between monthly tourist arrivals and the average monthly tourist arrivals, six
seasonality patterns were identified and named after six basic landforms – the rolling
hills, the plain, the single-peak mountain, the multi-peak mountain, the basin and the
plateau. Applying this coding system to over 270 cases, it was found that extreme
vii
seasonality patterns do not dominant Asian tourism, but multiple seasonality patterns
exist and vary across Asian countries, even within one country (China).
The second study was a quantitative study where a questionnaire survey was applied.
The questionnaires were conducted in China over five locations to collect Chinese
respondents’ (N=450) views of seasonality and Golden Week travelling. By assessing
20 seasonality concerns identified from the literature, this study found that the
crowding issue was the most powerful factor influencing tourists’ decisions on when
to travel. The amount of rain and very high temperatures were also important
influences. The Chinese respondents were least influenced by religious and cultural
factors, special events and the amount of sunshine. According to their appraisal of
their Golden Week travelling experiences, the Golden Week system was very popular
for the Chinese residents as it provided them with seven days in which to undertake
long-distance and more relaxed trips. This length of time also gave them the
opportunity to enjoy nice weather, more activities, and chances to go travelling with
families and friends. Nevertheless, some problems resulting from Golden Week
system were identified, such as the crowding issue, higher prices and lower level of
service. Most of the respondents noted these factors as likely issues reducing their
satisfaction with Golden Weeks travel.
The final study was approached by in-depth interviews. A form of discourse analysis
was applied to present the interview results. This study sought specific views of
seasonality and the Golden Week system from the Chinese tourism managers’
perspective. The interviewees were presented with the six seasonality patterns
identified in the first study and asked about their perceptions. There was not a single
viii
commonly accepted pattern as an ideal model for tourism businesses. The single-peak
mountain pattern and the multi-peak mountain pattern were perceived as the most
likely to occur in the hotel and catering area. The other patterns were identified as
relatively infrequent in all business areas. Managers’ reactions to the Golden Week
system revealed that this holiday system was very welcome by most of the tourism
businesses although some management and environment problems were noted. All the
managers were looking forward to a brighter future from Golden Week business.
This thesis has attempted to provide a different format to identify tourism seasonality
(the six-pattern coding system in the first study). Besides the findings mentioned
above, this thesis has also addressed two literature gaps, one is the combination of 20
seasonality concerns and the exploration of their influence on tourists’ travelling time
period (discussed in the second study). A second contribution is a multi-regional view
from tourist business managers establishing how these industry personnel view the
Golden Weeks. A further contribution lies in converting perspectives gathered in
Mandarin into the English academic tourism literature (discussed in the second and
third study). This thesis also highlighted future areas for tourism seasonality study in
other parts of the world where the seasonality phenomenon is not well researched. It
has also pointed out the significance of research on the Chinese Golden Week market
for tourism worldwide.
ix
Table of contents
Statement of access .........................................................................................................i
Statement of sources ......................................................................................................ii
Statement of the contribution of others........................................................................ iii
Declaration on Ethics....................................................................................................iv
Acknowledgements........................................................................................................v
Abstract ........................................................................................................................vii
Table of contents............................................................................................................x
Chapter outline..............................................................................................................xi
List of tables.................................................................................................................xv
List of figures........................................................................................................... xviii
x
Chapter outline
Chapter 1 – Introduction and literature review ........................... 1
1.1
Introduction: overview and significance of research ....................................1
1.2
Review of literature........................................................................................4
1.2.1
Introduction to tourism seasonality........................................................4
1.2.2
Explanation of tourism seasonality........................................................4
1.2.3
Japan’s Golden Week ..........................................................................14
1.2.4
China’s Golden Weeks ........................................................................15
1.3
Gaps in the literature and opportunities for research .................................21
1.4
Proposed research framework.....................................................................21
1.5
Aims of this research....................................................................................22
1.6
Methodological approaches and considerations .........................................23
1.7
Outline of chapters: the three studies in the thesis ......................................25
Chapter 2 – Seasonality patterns in Asian tourism (Study 1) ... 27
2.1 Introduction........................................................................................................27
2.2 Research objectives............................................................................................29
2.3 Data and methodology.......................................................................................29
2.3.1
Secondary data .....................................................................................29
2.3.2
Measures of seasonality .......................................................................31
2.3.3
Modelling seasonality patterns ............................................................34
2.3.4
Method details......................................................................................34
2.4 Results and discussion .......................................................................................35
2.4.1 Type 1 – The rolling hills pattern ...............................................................35
2.4.2 Type 2 – The plain pattern ..........................................................................38
2.4.3 Type 3 – The single-peak mountain pattern ...............................................39
2.4.4 Type 4 – The multi-peak mountain pattern.................................................42
2.4.5 Type 5 – The basin pattern..........................................................................43
2.4.6 Type 6 –The plateau pattern .......................................................................44
2.5 Conclusion and implications..............................................................................46
xi
Chapter 3 – Chinese travellers’ attitudes towards seasonality and
Golden Week travelling (Study 2) ............................................ 50
3.1 Introduction........................................................................................................51
3.1.1 Background information – China’s Golden Week holiday system ............51
3.1.2 Seasonality influences in China ..................................................................53
3.2 Research gaps and study objectives...................................................................56
3.3 Data and methodology.......................................................................................57
3.3.1 Questionnaire design...................................................................................57
3.3.2 Data collection and sampling......................................................................58
3.3.3 Data analysis methods.................................................................................60
3.4 Results and discussion .......................................................................................60
3.4.1 Demographic profiles of respondents .........................................................60
3.4.2 Previous travelling experiences ..................................................................62
3.4.3 Overview of seasonality influences ............................................................64
3.4.4 Experience in Golden Weeks travelling .....................................................85
3.5 Conclusion and implications............................................................................120
Chapter 4 – The perspectives of tourism managers towards
seasonality and the Golden Weeks tourism (Study 3) ............ 121
4.1 Introduction......................................................................................................122
4.1.1 Management of seasonality issues ............................................................122
4.1.2 Management of Golden Week tourism issues ..........................................123
4.2 Gaps and objectives .........................................................................................124
4.3 Data and methodology.....................................................................................125
4.3.1 In-depth interview.....................................................................................125
4.3.2 Profiles of businesses interviewed ............................................................127
4.3.3 Discourse analysis.....................................................................................129
4.4 Results and discussion .....................................................................................130
4.4.1 Views of the six seasonality patterns ........................................................130
4.4.2 Views of advantages that Golden Weeks bring to business .....................140
xii
4.4.3 Views of the disadvantages that Golden Weeks bring to businesses........142
4.4.4 Previous or existing Golden Weeks promotions.......................................144
4.4.5 Managers’ expectations of Golden Weeks from tourism stakeholders –
government, the tourism businesses and tourists...............................................147
4.5 Conclusion and implication – summary of Study Three ..................................155
Chapter 5 – Conclusions, discussions and implications ......... 158
5.1 Introduction: review of the objectives of the thesis .........................................158
5.2 Overview of results from the three studies.......................................................159
5.2.1 Results from Study One ............................................................................160
5.2.2 Results from Study Two ...........................................................................161
5.2.3 Results from Study Three .........................................................................164
5.2.4 Links between results from the three studies............................................167
5.3 Implications of the thesis .................................................................................169
5.3.1 Contributions at a conceptual level...........................................................169
5.3.2 Contributions at a managerial level ..........................................................170
5.3.3 Contributions to the Mandarin studies in tourism, particularly in China’s
Golden Week tourism ........................................................................................171
5.4 Limitations of the thesis ...................................................................................173
5.5 Areas for future research .................................................................................175
5.5.1 Applications of the seasonality patterns to other parts of the world.........175
5.5.2 Identifying the influential factors on seasonality patterns in terms of visitor
demographic characteristics...............................................................................175
5.5.3 Studying the behaviours of Golden Week tourists ...................................176
5.5.4 Exploring tourism authority’s views of seasonality and Golden Weeks from
the aspect of the Chinese government ...............................................................177
5.6 Final remarks...................................................................................................178
Reference list .......................................................................... 180
xiii
Appendices ............................................................................. 200
I.Questionnaire targeting Chinese residents for Study Two (English version) .....200
IIQuestionnaire targeting Chinese residents for Study Two (Mandarin version)..204
III.Question list interviewing Chinese tourism managers for Study Three (English
version) ..................................................................................................................208
IV.Question list interviewing Chinese tourism managers for Study Three (Mandarin
version) ..................................................................................................................212
V.Public presentations of this research..................................................................216
xiv
List of tables
Table 1. 1 – Classification of causes of tourism seasonality .........................................5
Table 1. 2 – Causes of seasonality in tourism demand ..................................................9
Table 1. 3 – Japan’s Golden Week ..............................................................................14
Table 1. 4 – The dates of National Day Golden Week holiday in 2007 ......................16
Table 1. 5 – Golden Weeks timetable..........................................................................17
Table 1. 6 – Advantages of mixed-method approach in social research .....................23
Table 2. 1 – Studies measuring tourism seasonality ....................................................33
Table 2. 2 – Markets to five countries performing in the rolling hills pattern.............37
Table 2. 3 – Markets to four Chinese areas performing in the rolling hills pattern.....37
Table 2. 4 – Markets performing in the single-peak mountain pattern........................40
Table 2. 5 – The peaks and bases for Chinese visitors to Thailand (2000 – 2006),
Singapore (2000 – 2006) and Korea (2000 only) ........................................................41
Table 3. 1 – China’s public holidays ...........................................................................55
Table 3. 2 – Questionnaire distributions ......................................................................59
Table 3. 3 – Respondents’ demographic profiles.........................................................62
Table 3. 4 – Number of places the respondents had visited.........................................63
Table 3. 5 – The time periods for Chinese travellers...................................................64
Table 3. 6 – The overall means for seasonality influences (N=450) ...........................66
Table 3. 7 – Seasonality influences for respondents from different parts of China.....68
Table 3. 8 – Seasonality influences for respondents by gender...................................71
Table 3. 9 – Seasonality influences for respondents by age ........................................72
Table 3. 10 – Seasonality influences for respondents by education ............................75
Table 3. 11 – Seasonality influences for respondents by occupation ..........................78
Table 3. 12 – Seasonality influences for respondents by income ................................81
Table 3. 13 – Items with significant differences (indicated by asterisk) among
different demographic groups ......................................................................................84
Table 3. 14 – Advantages and disadvantages for travelling Chinese New Year Golden
Week ............................................................................................................................85
xv
Table 3. 15 – Advantages and disadvantages for travelling in May Day Golden Week
......................................................................................................................................88
Table 3. 16 – Advantages and disadvantages for travelling in National Day Golden
Week ............................................................................................................................91
Table 3. 17 – Residence of respondents: Non-frequent / Frequent tourists
crosstabulation .............................................................................................................96
Table 3. 18 – Age of respondents: Non-frequent / Frequent tourists crosstabulation .97
Table 3. 19 – Gender of respondents: Non-frequent / Frequent tourists crosstabulation
......................................................................................................................................97
Table 3. 20 – Education level of respondents: Non-frequent / Frequent tourists
crosstabulation .............................................................................................................98
Table 3. 21 – Occupation of respondents: Non-frequent / Frequent tourists
crosstabulation ...........................................................................................................100
Table 3. 22 – Monthly income of respondents: Non-frequent / Frequent tourists
crosstabulation ...........................................................................................................102
Table 3. 23 – Residence of respondents: Non-Golden-week / Golden-week tourists
crosstabulation ...........................................................................................................103
Table 3. 24 – Age of respondents: Non-Golden-week / Golden-week tourists
crosstabulation ...........................................................................................................104
Table 3. 25 – Gender of respondents: Non-Golden-week / Golden-week tourists
crosstabulation ...........................................................................................................105
Table 3. 26 – Education level of respondents: Non-Golden-week / Golden-week
tourists crosstabulation...............................................................................................106
Table 3. 27 – Occupation of respondents: Non-Golden-week / Golden-week tourists
crosstabulation ...........................................................................................................108
Table 3. 28 – Monthly income of respondents: Non-Golden-week / Golden-week
tourists crosstabulation...............................................................................................109
Table 3. 29 – Variables used in discriminant analysis of groups with different travel
levels (Frequent versus non-frequent) .......................................................................110
Table 3. 30 – Tests of significance of the discriminant functions level ....................111
Table 3. 31 – Canonical discriminant function coefficients and loadings for the related
variables that contribute the most to the function......................................................112
Table 3. 32 – Functions at group centroids................................................................112
xvi
Table 4. 1 – Development of Golden Week system ..................................................124
Table 4. 2 – Question list for interviews....................................................................126
Table 4. 3 – Demographic details of the interviewees in Beijing..............................127
Table 4. 4 – Demographic details of the interviewees in Xi’an.................................128
Table 4. 5 – Demographic details of the interviewees in Shanghai area ...................128
Table 4. 6 – Demographic details of the interviewees in Guangzhou & Guangxi
Province .....................................................................................................................129
Table 4. 7 – The managers’ perceptions of the plateau pattern .................................131
Table 4. 8 – The managers’ perceptions of the plain pattern.....................................133
Table 4. 9 – The managers’ perceptions of the basin pattern ....................................134
Table 4. 10 – The managers’ perceptions of the single-peak mountain pattern ........136
Table 4. 11 – The managers’ perceptions of the multi-peak mountain pattern .........137
Table 4. 12 – The managers’ perceptions of the rolling hills pattern ........................138
Table 4. 13 – Managers’ views of advantages and trends for the Golden Weeks .....140
Table 4. 14 – Managers’ views of the disadvantages that Golden Weeks bring to
business ......................................................................................................................142
Table 4. 15 – Previous or existing Golden Weeks promotions..................................144
Table 4. 16 – Managers’ expectations directed at the Chinese government..............147
Table 4. 17 – Managers’ expectations directed at the tourists...................................149
Table 4. 18 – Managers’ expectations directed at the whole tourism industry..........150
Table 4. 19 – Managers’ expectations and planning directed at the travel agency
sector ..........................................................................................................................151
Table 4. 20 – Managers’ expectations and planning directed at the attractions sector
....................................................................................................................................152
Table 4. 21 – Managers’ expectations and planning directed at the hotel and catering
sector ..........................................................................................................................153
Table 4. 22 – Managers’ expectations and planning directed at the transportation
sector ..........................................................................................................................154
Table 5. 1 – The characteristics of the 14 academic research papers ........................172
xvii
List of figures
Figure1. 1 – Temperature and relative humidity conditions for human thermal comfort
........................................................................................................................................7
Figure1. 2 – Push and pull factors causing seasonality in the tourist destination........10
Figure1. 3 – Numbers of tourists during Golden Weeks (Million)..............................18
Figure1. 4 – Revenue during Golden Weeks (billion Chinese Yuan) .........................19
Figure1. 5 – Outline of key topics in the thesis ...........................................................22
Figure1. 6 – Chapter outline for the thesis...................................................................26
Figure 2. 1 – Illustration of the Lorenz curve ..............................................................32
Figure 2. 2 – Illustration of the rolling hills pattern.....................................................36
Figure 2. 3 – Illustration of the plain pattern ...............................................................38
Figure 2. 4 – Illustration of the single-peak mountain pattern.....................................39
Figure 2. 5– Illustration of the multi-peak mountains pattern .....................................42
Figure 2. 6– Illustration of the basin pattern................................................................43
Figure 2. 7– Illustration of the plateau pattern.............................................................45
Figure 3. 1 – Frequencies of advantages mentioned by respondents for travelling in
CNY .............................................................................................................................86
Figure 3. 2 – Frequencies of disadvantages mentioned by respondents for travelling in
CNY .............................................................................................................................86
Figure 3. 3 – Frequencies of advantages mentioned by respondents for travelling in
May Day Golden Week ...............................................................................................89
Figure 3. 4 – Frequencies of disadvantages mentioned by respondents for travelling in
May Day Golden Week ...............................................................................................89
Figure 3. 5 – Frequencies of advantages mentioned by respondents for travelling in
National Day Golden Week .........................................................................................92
Figure 3. 6– Frequencies of disadvantages mentioned by respondents for travelling in
National Day Golden Week .........................................................................................92
Figure 3. 7 – Frequencies of the advantages of CNY Golden Week by Golden-week
tourists (N=125) and non-Golden-week tourists (N=325).........................................114
xviii
Figure 3. 8 – Frequencies of the disadvantages of CNY Golden Week by Goldenweek tourists (N=125) and non-Golden-week tourists (N=325) ...............................114
Figure 3. 9 – Perceptions of CNY Golden Week – % of variables mentioned..........115
Figure 3. 10– Frequencies of the advantages of May Day Golden Week by Goldenweek tourists (N=125) and non-Golden-week tourists (N=325) ...............................116
Figure 3. 11– Frequencies of the disadvantages of May Day Golden Week by Goldenweek tourists (N=125) and non-Golden-week tourists (N=325) ...............................116
Figure 3. 12 – Perceptions of May Day Golden Week – % of variables mentioned .117
Figure 3. 13 – Frequencies of the advantages of National Day Golden Week by
Golden-week tourists (N=125) and non-Golden-week tourists (N=325) ..................118
Figure 3. 14 – Frequencies of the disadvantages of National Day Golden Week by
Golden-week tourists (N=125) and non-Golden-week tourists (N=325) ..................118
Figure 3. 15 – Perceptions of National Day Golden Week – % of variables mentioned
....................................................................................................................................119
Figure 5. 1 – Relations between results from the three studies .................................168
xix
Chapter 1 – Introduction and literature review
Chapter structure
1.1 Introduction: overview and significance of research
1.2 Review of literature
- 1.2.1 Introduction to tourism seasonality
- 1.2.2 Explanation of tourism seasonality
- 1.2.3 Japan’s Golden Weeks
- 1.2.4 China’s Golden Weeks
1.3 Gaps in the literature and opportunities for research
1.4 Proposed research framework
1.5 Aims of this research
1.6 Methodological approaches and considerations
1.7 Outline of chapters
1.1 Introduction: overview and significance of research
This thesis explores Asian seasonality patterns in tourism. The work includes a
particular focus on the impacts of China’s Golden Weeks system. Seasonality, or the
fluctuations in tourist numbers depending on the season, is one of the characteristics
inherent in tourism. The concentration of tourist flows in short periods of a year
results in inefficiency in the tourism industry and can be a great burden on the social
and physical environment of the destination area (Getz & Nilsson, 2004; Mitchell &
Murphy, 1991). Seasonality may also affect conditions of tourism employment and
stress resources at peak times (Flognfeldt, 2001; Krakover, 2000). The seasonality
phenomenon therefore is a major concern to many tourism managers and policy
makers, as well as to researchers.
Seasonality is generally influenced by two major factors – natural and institutional.
Natural seasonality is related to weather and climate while institutional factors refer to
public holidays, school and industrial holidays. They are not independent but interact
with each other and together shape seasonality patterns.
1
Key aspects of seasonality have been studied, including general concepts, definitions
and the measurement of seasonality (Bar-On, 1975; Baum & Lundtorp, 2001; Butler,
1994a; Grainger & Judge, 1996; Hartmann, 1986; Lundtorp, 2001; Sutcliffe &
Sinclair, 1980). Other topics such as the school holiday season and the sport tourism
seasonality have been also considered (Higham, 2006; Klemm & Rawel, 2001). To
date, most case studies on seasonality have been carried out in cold-weather
destinations, such as Denmark, England, Ireland, Norway, Canada and New Zealand
(Commons & Page, 2001; Douglas & Barden, 1999; Hinch et al., 2001; Kennedy &
Deegan, 1999; Lundtorp et al., 1999; Sorensen, 1999; Thor, 2001). Time series data
and empirical analyses were used in these studies to look at the demand variations in
peak-seasons and off-seasons. Most of the solutions attempted to mitigate the level of
seasonality by extending the peak season or by targeting new markets.
Even though the importance of tourism seasonality is known to all, there is still a lack
of in-depth studies. Literature on tourism seasonality focuses on the relationship
between demand and visitation, on economic effects on employment and on practices
to reduce seasonality at specific locations (Butler & Mao, 1997). But limited research
exists about the in-depth concepts or a theory of tourism seasonality and the
measurement of this problem (Hartmann, 1986). Surprisingly apart from studies of
skiing in North America, research studies about the United States and Canadian
markets do not feature prominently in the seasonality literature (Goeldner, 1992;
Goeldner & Ritchie, 2003). Additionally, the seasonality problem has been
infrequently studied in Asian tourism.
The first and most comprehensive appraisal of seasonality in tourism was completed
by Bar-On (1975), who examined data from 16 countries over a seventeen-year period.
His work demonstrated the widespread nature of seasonality in European and North
American destinations but, like many subsequent researchers, he seemed to ignore
Asia Pacific destinations. Based on its diverse tourist resources, particularly its natural
beauty, and because of its rapid economic development, Asia is becoming an
important part of international tourism (Pacific Asia Travel Association [PATA],
2006). Due to the nature of tourism seasonality and its economic importance for the
tourism industry, the seasonality problem in the Asian area needs research and
managerial attention. It is acknowledged that there are major variations within Asian
2
destinations and source markets when considering seasonality issues. National holiday
systems vary, climates vary and the roles of domestic and international visitors are
different.
The study of seasonality in the context of tourism in China is the key focus on Asian
tourism in this thesis. China has become one of the most popular destinations and is a
significant destination in international tourism. Since the implementation of the “Open
Door” policy by the government, travelling to and from this oriental country has
become a prominent seasonal activity. China’s rich and colourful tourist resources,
unique traditions and centuries-old history attract both domestic and international
visitors in rising number. According to the report of China National Tourism
Administration, there were 125 million inbound tourists to China in 2006, and the
number in 2007 was 132 million.
In the Chinese context institutional seasonality is very important. The establishment
of the Golden Week in 1999 particularly boosted domestic travel for Chinese citizens
(Wu, Zhu & Xu, 2000). Before 2008, China had three “Golden Week” holidays in a
year – Spring Festival (Chinese New Year), International Labour Day (May Day) and
National Day. In 2008, the May Day holiday was cut down to one day. However,
three new one-day holidays were added – the traditional Tomb-Sweeping Day,
Dragon-boat Festival and Mid Autumn Festival. As the holidays turned out to be
“golden” for the economy they became known as the “Golden Weeks” (Xinhua,
2006a). Meanwhile, more foreign countries have been added to the list of the Chinese
Approved Destination Status (ADS), a policy which officially allows Chinese
residents to travel abroad. As a result, it is now fashionable for Chinese to travel to the
ADS countries during the three Golden Weeks. Traditionally, the chief beneficiaries
of the Chinese tourism trade have been the Northeast and Southeast Asian countries
(Zhang, 2006) which have benefited, and will benefit even more, from the Chinese
Golden-week tourists. It is the perspectives and impacts of this emerging, seasonally
based concentration of Chinese travel both within China and for popular Asian
countries that is at the heart of this research. In order to explore the academic context
for undertaking studies in this area, a review of the previous literature is undertaken in
the following section.
3
1.2 Review of literature
1.2.1
Introduction to tourism seasonality
Seasonality, of course, exists in a wide range of industries and areas, not only in
tourism; however, there is no universally accepted definition of seasonality in tourism.
In one case it is described as “a temporal imbalance in the phenomenon of tourism,
which may be expressed in terms of dimensions of such elements as numbers of
visitors, expenditure of visitors, traffic on highways and other forms of transportation,
employment, and admissions to attractions” (Butler, 1994a, p. 332). Allcock (1994)
thinks the most important defining element of seasonality is that tourist flows
concentrate in short periods of the year. Bar-On (1975) defines seasonality as the
effects of demand occurring each year with more or less the same timing and
magnitude. In Koenig-Lewis and Bischoff’s (2005) opinion, seasonality can be
described as some sort of pattern in the visits that recur each year.
Most of the seasonality definitions only describe this phenomenon in general terms.
Koenig-Lewis and Bischoff (2005) point out that there is a lack of a quantifiable
definition about when tourism seasonality occurs, how the tourism seasons can be
differentiated, and how tourism seasonality can be compared between different
destinations or years. Literature on tourism seasonality focuses on the relationship
between demand and visitation, and on economic effects on employment and
practices to reduce seasonality at specific locations (Butler & Mao, 1997). But limited
research exists about the in-depth concepts or a theory of tourism seasonality and the
measurement of this problem (Hartmann, 1986). This lack of precision is a key
consideration and opportunity for the development of research in this thesis. It can be
argued that in some areas of study well specified measurement and exacting
description of phenomenon is a necessary building block for enhancing research
(Becher, 1989; Pearce, 2005). The better description of seasonality is an example of
this kind of research development in the tourism field.
1.2.2
Explanation of tourism seasonality
Table 1.1 introduces some of the suggested explanations and causes of tourism
seasonality provided by different researchers.
4
Author
Table 1. 1 – Classification of causes of tourism seasonality
Categories of causes of tourism seasonality
Bar-On(1975)
Natural seasonality, institutionalized seasonality, calendar
effects, sociological and economic causes
Hartmann (1986)
Natural seasonality, institutionalized seasonality
Hylleberg (1992)
Weather, calendar effects, and timing decisions
Butler (1994a)
Natural seasonality, institutionalized
seasonality,
social
pressure and fashion, sporting seasons, inertia and tradition
Butler/Mao (1997)
Physical and socio/cultural factors in the tourism generating
and receiving areas
Baum/Hagen (1999)
Climate/weather, social customs/holidays, business customs,
calendar effects, and supply side constraints
Frechtling (2001)
Climate/weather, social customs/holidays, business customs,
and calendar effects
(Source: based on Koenig-Lewis & Bischoff, 2005)
Seasonality is seen by many authors as being caused by similar conditions. The
seasonality phenomenon is influenced by two factors – “natural” and “institutional”.
Almost all the researchers place these two factors first in their list of causes of tourism
seasonality. Natural factors usually refer to climate/weather conditions while the
institutional seasonality is based on the available holidays and reflects social norms
and practices. Regular business conferences and sporting events in particular
destinations may influence tourism seasonality in specific years. All these factors –
natural, institutional and other effects impact on tourism seasonality to different
extents.
1) Natural seasonality
As most outdoor tourist activities depend heavily on the climate and weather (Smith,
1990), the natural conditions in a destination have a pronounced influence on the
area’s tourism seasonality. Hartmann (1986) states that natural seasonality is
predictable as the climate is relatively stable in a particular destination and recurs with
little change. However, climate change, including global warming, may affect future
tourism seasonality (Agnew & Viner, 2001; Butler & Mao, 1997; Scott et al., 2007).
5
Natural seasonality results from the regular variation in climatic conditions –
temperature, rainfall, snowfall and daylight (Bar-On, 1975; Baum, 1999). Natural
seasonality impacts on society to different extents, as the farther the destination is
from the Equator, the greater are the seasonality differences (Hartmann, 1986; Butler,
1994a).
Studies in cold weather destinations indicate that most visitors arrive in summer and
few travel when it is cold in the off-season. However, in the equatorial or tropical
destinations, the extreme humidity will influence human thermal comfort (Burton,
1995). Figure 1.1 is Burton’s chart (1995) showing human thermal comfort by crossreferencing a range of temperatures and humidity. The best conditions for human
thermal comfort are from 18-29 degrees Celsius with humidity between 40 and 60
percent. Less desirable conditions are heat over 35 degrees and humidity over 30
percent. Except for winter sports, nearly all tourists find activities uncomfortable if
the temperatures are extremely low. High humidity is debilitating for most visitors
and limits most tourist activities.
Obviously, natural conditions play an important role in shaping the seasonality pattern.
As the climate in a specific location is relatively stable and unchangeable, it is hard or
very expensive to solve the natural seasonality problems by extending the peak season.
However, this problem has been addressed internationally in a few select locations.
Many destinations with natural seasonality try to attack this problem by creating
artificial environments, such as indoor skiing in Dubai (Tourism Dubai, 2006), and
tropical indoor swimming beaches in Europe, Japan and North America for winter use.
Those efforts are notable exceptions to the prevailing power of climate to influence
tourism.
6
10
20
30
40
50
60
70
80
90
Temperature
ºC
50
50
40
30
20
10
0
v er
y ho
seve
r
t
life-threatening
hot zone
e str
ess
zone
enervatin
hot
g
lazy
warm
1
40
2
30
oppressive
3
sticky
4
moist
5
optimum
fresh
cool
mild
6
keen
cold
raw
7
-20
10
0
8
cold stress
-10
20
-10
-20
limit of leisure activities
-30
9
life-threatening cold zone
-30
-40
-40
10
20
30
40
50
60
70
80
90
Relative humidity %
PHYSICAL ACTIVITY OPTIONS AND THERMAL COMFORT ZONES
1 life-threatening hot zone - survival activities only
2 severe stress zone - extreme sports dangerous
3 very hot-enervating-oppressive - swimming, cooling activities
4 hot-lazy-sticky - limited periods of strenuous activities
5 warm-optimum-moist - all leisure activities
6 fresh-cool mild - strenuous activities still possible
7 keen-cold-raw - few water sports, some strenuous activities
8 cold stress - winter sports
9 life-threatening cold zone - survival activities only
(Adapted from Burton, 1995)
Figure1. 1 – Temperature and relative humidity conditions for human thermal comfort
(Source from Pearce & Vogt, 2005)
7
2) Institutional seasonality
Another important factor influencing seasonality is the institutional holiday. However,
institutional seasonality is less predictable than natural seasonality. It is the result of
multiple human decisions, involving social, cultural, religious and ethnic factors
(Baum, 1999). These human decisions are often enshrined in legislation (Butler,
1994b).
The holiday (i.e. school holidays, industrial holidays and public holidays - Easter,
Christmas) is one of the institutional forms that impacts most on tourism seasonality.
The most common form is public holidays. At the very beginning, public holidays
were mostly single days but, since the early nineteenth century, they have been
expanded into weekends and even longer breaks, and have become increasingly
important for the tourism industry (Butler, 1994a). The dates of some public holidays,
such as Easter, vary from year to year; however, they are predictable (Bar-On, 1975;
Hyllebery, 1992). Frechtling (2001) points out that certain events that recur regularly,
such as sport events (e.g. Olympic Games), as well as celebrations and festivals, will
influence tourism seasonality in particular years for select destinations.
School and industrial holidays have more impact on tourism seasonality than do
public holidays. School holidays normally take place in summer when there is a
longer time to travel and when there is pleasant weather, both of which promote
family tourist activities (Butler, 1994a; Hinch & Jackson, 2000). Hartmann (1986)
argues that the fixed school holiday is the most difficult obstacle in reducing
seasonality. One solution to this problem is to expand the customer base during the
fixed holiday season, and this has been successfully adopted by Eurocamp, a tour
operator (Klemm & Rawel, 2001). However, Lundtorp et al. (1999) point out that
little research has been done on whether people seek to travel at certain times of the
year or simply whether tourists have to travel in the peak season because of their
children’s fixed school holidays.
3) Other causes of seasonality
Bar-On (1975) also draws attention to the sociological and economic impacts of
seasonality. Airfares and accommodation prices increase at peak times and are
8
reduced at off-peak times, and these varying prices may increase or decrease the
concentration of tourist flows.
Social pressure or fashion, sporting seasons and traditions significantly influence
seasonality (Butler, 1994a). Social pressure or fashion occurs when people participate
in specific social activities in particular destinations at certain times of the year in
order to be seen visiting the currently “fashionable” location. Sporting seasons refer to
the fact that some sports, such as skiing, can only be undertaken at a certain time. The
tradition factor refers to the fact that “many people take holidays at peak seasons
because they have always done so, and old habits tend to die hard’ (Butler, 1994a, p
333).
Calendar effects are identified as another important aspect of seasonality (Frechtling,
2001). The effects result from the different days in a month (e.g. 28 days only in
February in some years) and the different numbers of weekends in a month. Most
short-haul leisure tourist activities concentrate on weekends. The unequal
distributions of weekends throughout months or years may influence tourism statistics
(Frechtling, 2001).
Table 1.2 identifies the five main causes of tourism seasonality suggested by
Frechtling (2001) and Baum (1998).
Table 1. 2 – Causes of seasonality in tourism demand (Source: Frechtling, 2001;
italicized material has been added from Baum, 1998)
Cause of seasonality
Tourism examples
Climate/Weather
Summer vacations, snow skiing, fall foliage tours,
popularity of tropical destinations in the winter, cruise line
departures, ocean resort demand, transport access
Social customs/Holiday Christmas/New Year holidays, school breaks, industrial
holidays or ‘fortnights’, travel to visit friends and
relatives, fairs and festivals, religious observances,
pilgrimages
Business customs
Conventions and trade shows, government assemblies,
political campaign tours, sports events
Calendar effects
Number of days in the month; number of weekends in the
month, quarter, season or year, date of Easter
Supply side constraints
Availability of labour (school holidays, competition from
other sectors, i.e. agriculture); alternative use of facilities
(schools to hotels)
9
The five factors are not independent but interact. Lundtorp et al. (1999) further argue
that the causes of tourism seasonality can be differentiated into push- and pull-factors,
as Figure 1.2 presents.
Figure1. 2 – Push and pull factors causing seasonality in the tourist destination
(Source: based on Lundtorp et al. 1999)
4) Impacts of seasonality
The impacts of seasonality are various and complex but it is probable that these
impacts have been exacerbated following the growth of mass tourism (Wall & Yan,
2003).
Some of these effects are positive. For most tourism-related sectors, the peak season
generates considerable business. The large number of tourist arrivals and activities
significantly boosts the local economy, by creating jobs and income for residents
(O’Reilly, 1986). A study of Australian travellers at Easter time reveals that the
considerable tourist activity on the Easter weekend generates high total visitor nights
and high total expenditure (O’Halloran, 2002). Similarly, a study of Australian
Christmas travel revealed that the longer duration trips taken over the Christmas
period resulted in the higher expenditure per trip over the Christmas period than that
in the non-Christmas period (Grey, 2002).
10
Less positively, the concentration of tourist flows in short periods of the year will
result in crowding at the destination, traffic congestion, overuse of infrastructure and
lower quality standards of service during the peak-season (Getz & Nilsson, 2004; Koc
& Altinay, 2007). By way of contrast, there may be low rates of hotel occupancy and
employment in the off-season (Jeffrey & Barden, 2001). Over-development of land to
cope with the flows may damage the environment, and so diminish local social
activities and cultural pursuits (Grant et al., 1997; Koenig-Lewis & Bischoff, 2005).
Generally speaking, seasonality is often regarded as a problem to be tackled rather
than an opportunity for development in tourism. It has great economic importance, but
is generally considered to be the reason for difficulty in gaining access to capital, for
staffing problems, and for uneconomic returns on investment (Butler & Mao, 1997).
According to Baum (1999), seasonality affects all aspects of the supply-side
behaviour in tourism, including marketing, the labour market, business finance,
stakeholder management and many aspects of operations. The following are the major
disadvantages of tourism seasonality from the supply perspective:
-
short business operating season with major periods of closure or reduced level of
operation;
-
the consequent need to generate a full year’s revenue within a short operating
season while servicing fixed costs over a twelve month period;
-
under utilization of capital assets which are inflexible and, generally, do not have
obvious alternative uses;
-
the consequent problems of attracting inward investment in tourism;
-
problems in maintaining the supply chain on the basis of a short operating season;
-
problems in ensuring sustained support from transport providers such as airlines
and shipping companies who are reluctant to maintain commitment to, and invest
in, highly seasonal operations;
-
short-term employment rather than sustainable long-term jobs creating high levels
of either off-season unemployment or temporary outward migration; and
-
problems of maintaining service and product quality standards in the absence of
permanent, long-term employees (Baum & Lundtorp, 2001, p2).
11
A selection of case studies on tourism seasonality demonstrates some existing
research concerns. The studies can also be seen as typical of site specific research,
where there is often an emphasis on one group of stakeholders; for example visitors or
residents or managers.
Lundtorp et al. (1999) surveyed tourists in Bornholm, a tourist destination in a
peripheral region in Northern Europe, to explain the phenomenon of seasonality from
the demand side. They divided the travellers into two categories: main-season and offseason visitors. The categories were based on several aspects, such as accommodation
usage, length of stay, and attitudes about the importance of activities. They found that
there was no evidence from the visitors to support the idea of promoting the resort as
an off-season destination.
Hinch et al. (2001) explored attitudes towards visits to Fort Edmonton Park, Canada.
They adopt a ‘theoretical leisure constraints’ research framework. Two alternative
leisure constraints models were discussed — the hierarchical and the non-hierarchical
models. The hierarchical model differentiates between general attitudes and
motivations, intrapersonal (seasonal travel preferences, e.g. natural factors),
interpersonal (e.g. companions with similar seasonal travel preferences) and structural
constraints (e.g. institutional factors). It is assumed that these factors are taken into
account in a hierarchical way as part of the decision-making process of an individual
regarding the timing and destination of the holiday. The non-hierarchical leisure
constraints framework explores seasonality using qualitative methods. The key
finding from the two constraints models indicated that the influence of individual
natural and institutional factors was not consistent. Such models can be helpful both
in the design of questionnaires and in the development of guidelines for in-depth
interviews.
Thor (2001) used the Jotunheimen area in Norway as a study site and recommended
ways to cope with strong seasonality-based tourism. Besides normal procedures, such
as importing students in the high season, combinations with agriculture and
government employees, expanding seasons by special events, the new adjustments to
seasonality were exit travel at low seasons (e.g. migrant workers, expanding personal
12
knowledge) and exporting knowledge and goods (e.g. chefs designing other menus,
craftspeople selling their goods in shops at other places).
The case study of Eurocamp by Klemm and Rawel (2001) provides further
perspectives on European seasonality. Eurocamp was originally a small British
company. Its product, self-drive camping holidays, was positioned as a lifestyle
product aimed at middle class professionals with young families in the United
Kingdom. To solve the seasonality problem caused by fixed school holidays,
Eurocamp widened the appeal of the holidays through product development (e.g. the
introduction of mobile homes), and introduced the Eurocamp product to a non-UK
customer base, Netherlands, Germany and other European countries. It finally became
the leading and most innovative company in the tourism sector.
There is a study examining the social impacts caused by tourism seasons in Positano,
Italy (Canosa et al., 2001). They considered the community attitudes to tourism
seasonality. In particular they discussed the different perceptions between two groups
of adolescent residents’ (aged 13 – 15 years old and aged 16 – 19 years old) attitudes
to tourism. Their findings revealed that tourism seasonality was one of the significant
factors shaping the lives of the young residents. The older adolescents believed a
greater affect on their current life and expressed a stronger desire to move away from
their home town.
In a review of the tourism seasonality literature, Andriotis (2005) suggested that there
were three main strategies to overcome seasonality: diversification of the product mix,
change of the customer mix and aggressive pricing. Bearing in mind that tourism
seasonality can be more serious in island destinations, he investigated the seasonality
phenomenon in Crete. His study showed that Crete had a high concentration of
tourism activities. However, most tourism enterprises ignored local variations in
regional income and worried little about dispersing tourists, and so there was little
chance to develop tourism for all citizens in Crete. Andriotis (2005) suggested
expanding the seasons by attracting new markets, such as senior citizens,
conference/incentive tourism and specialized tourism; however, policies to reduce
seasonality by increasing tourists out of peak-season should be carefully made, as the
seasonality was accepted as a way of life by most locals, who looked forward to the
13
quiet season without tourists. This finding is similar to the study about Positano and
suggests that for some stakeholders seasonality is a welcome phenomenon.
Shih et al, (2009) examined the impact of weather on downhill ski lift ticket sales in
two ski resorts in Michigan, USA. As suggested by ski facility managers that weather
conditions have different impacts on peak and off-peak sales, the researchers
identified the relationship between weather and sales in two seasons – peak season
and off-peak season, using regression analyses. In the linear models, the explanatory
variables included five daily weather variables (maximum temperature, minimum
temperature, snowfall, snow depth, and wind chill), gasoline prices, the price of a
standard ski lift ticket, the Consumer Confidence Index (CCI – represent the income
factor), and three dummy variables (weekend, holiday and year). Their findings
suggested that weather variables do indeed have a statistically significant impact on
downhill ski lift ticket sales. Their results also revealed that the greatest influences on
daily lift ticket sale at both seasons were the two temporal variables – time of the
week and holidays.
These Western studies have been supplemented by a small number of studies of
seasonality in Asia. The first of these studies focused on Japan’s Golden Week.
1.2.3
Japan’s Golden Week
In Japan, the term Golden Week is applied to the period containing the public
holidays shown in Table 1.3.
th
29 April
Table 1. 3 – Japan’s Golden Week
Greenery Day (until 2006)
Showa Day (from 2007)
3rd May
Constitution Memorial Day
4th May
“Between Day” (until 2006)
Greenery Day (from 2007)
5th May
Children’s Day, also known as Boys’ Day
May Day (on 1st May) is not a public holiday, but is nevertheless often granted as a
holiday by many companies.
14
In combination with well-placed weekends, the Golden Week has become one of
Japan's three busiest holiday seasons, besides New Year and Obon week (Obon is an
annual Buddhist event to commemorate ancestors. Obon week in mid August is one
of Japan’s three major holiday seasons (Japan-guide, 2006)). The majority of
companies, administrations, schools and universities are on holiday during this long
period. May is a pleasant season to travel in Japan. During Golden Week, many
people take vacations and travel around the country. So the tourism prices increase
and the most popular sightseeing and amusement places are very crowded at that time.
Also airports and train stations are crammed with tourist flows. Further, it is
extremely difficult to book accommodation and transport in this week (Shizuko,
2006). An increasing number of Japanese people are now travelling abroad during
Golden Week (Rosenbaum & Spears, 2006). Some foreign destinations, such as
mainland Asian countries, Guam, Saipan, Hawaii, and cities on the USA west coast
such as Los Angeles, Seattle, and San Francisco, are congested during this time by
large numbers of Japanese tourists.
Japanese tourists in Golden Weeks are likely to spend more money than in other
periods. Rosenbaum and Spears (2006) conducted questionnaires on “non-Golden”
and “Golden” Japanese tourists vacationing in Waikiki (Honolulu, Hawaii).
Compared to “non-Golden” Japanese tourists, “Golden” Japanese tourists spend
significantly more on gifts during their stays. They were also better-educated and
more interested in participating in diverse vacationing and leisure activities.
1.2.4
China’s Golden Weeks
In September 1999, the Chinese government issued the policy “Methods for having
days off for annual festivals and commemoration days throughout the country”. The
policy was intended to promote domestic tourism amongst Chinese. Three gold
tourism weeks were formed around the Spring Festival (Chinese New Year),
International Labour Day (May Day) and National Day (China National Tourism
Administration [CNTA], 2006a). Generally, each of them is a three-day holiday, but
the government will declare it to be a seven-day holiday, substituting a weekend for
normal working days. That is three days of paid holiday are given, one weekend is
added and two further working days are swapped with the adjunct weekend so that
15
workers in Chinese companies have seven continuous days of holiday. An example
illustrated in Table 1.4 would help to understand this holiday system.
Table 1. 4 – The dates of National Day Golden Week holiday in 2007
Monday Tuesday Wednesday Thursday Friday Saturday Sunday
Sep
24
25
26
27
28
29
30
Oct
1
2
3
4
5
6
7
In 2007, the holiday period for National Day Golden Week lasted from 1st to 7th
October. The real public holidays for National Day were 1st, 2nd and 3rd October. But
the government announced the previous weekend 29th and 30th September as two
working days with the 4th and 5th becoming substitute days for the weekend work. By
combining the following weekend – 6th and 7th, there were seven days for the holiday.
The resulting seven-day holidays are called “Golden Weeks”, which have become and
ideal time for the Chinese to make either short or long haul trips. Table 1.5 shows the
dates of Golden Weeks holidays from 1999 to 2009.
The Chinese New Year ushers in a week of official holidays, but because Chinese
New Year follows the Chinese Lunar Calendar, the date of this holiday week varies
considerably from year to year. It generally takes place in January or February. From
the year 2000 to 2009, the 2001, 2004, 2006 and 2009 Chinese New Year occurred in
January, and the others in February (Table 1.5). On the other hand, the holiday
periods for Labour Day and National Day are consistent, and range from 1st to 7th May
and from 1st to 7th October respectively, except the National Day Golden Week in
2008, which started from 29th September to 5th October.
16
Table 1. 5 – Golden Weeks timetable
Chinese New Year International Labour Day
National Day
1999
N/A
N/A
1st – 7th October
2000
5th – 11th February
1st – 7th May
1st – 7th October
2001
24th – 30th January
1st – 7th May
1st – 7th October
2002
12th – 18th February
1st – 7th May
1st – 7th October
2003
1st – 7th February
1st – 7th May
1st – 7th October
2004
21st – 27th January
1st – 7th May
1st – 7th October
2005
9th – 15th February
1st – 7th May
1st – 7th October
2006
29th January – 4th 1st – 7th May
1st – 7th October
February
2007
18th – 24th February
1st – 7th May
1st – 7th October
2008
6th – 12th February
1st – 3rd May*
29th September –
5th October
2009
25th – 31st January
1st – 3rd May*
1st – 8th October**
(Source: Chinese Government online Gov.cn, 05/06/2009)
(*: From the year 2008, the May Day holiday was reduced to one day, resulting in
three-day holiday which was combined with two-day weekend. **: It was combined
with a one-day public holiday – Mid-Autumn Day.)
1.2.4.1 Impacts on domestic tourism
China is a large country with many different climates and types of landscape. It has
both a continental and seasonal climate. Most regions are in the temperate zone but
the southern areas are in the tropical or subtropical zone, while the northern areas are
in the Frigid Zone. Climates in different areas vary greatly, but generally April, May,
September and October are the best time for travelling to China’s popular destinations
when the weather is the most comfortable (Chinatour, 2006). Therefore, two Golden
Weeks – International Labour Day holiday and National Day holiday occur at
seasonally propitious times. The Chinese New Year holiday takes place in January or
February when it is winter in China. However, it is good time for trips to Hainan
Island in the south and to Northeast Harbin which has a world-famous ice-lantern
festival (Chinatour, 2006).
17
It can be argued that the three Golden Weeks are all influential for travelling around
China. The Golden Weeks were initiated to expand domestic demand and stimulate
consumption. They have rapidly become a part of Chinese life. The seven-day long
vacations provide a good time for the whole family to travel around the country and
make long-distance trips. However, the concentration of tourist flows has brought
congested traffic, overcrowded attractions and poor services in some places. Hence
some people in China have suggested cancelling Golden Weeks or reforming the
Golden Weeks system (Zhao & Mei, 2005). However, other commentators argue it is
too early to call off the Golden Weeks (Wu & Wei, 2005). In the latter view, long
holidays have not only motivated consumption and boosted the economy, but they
have also enhanced people’s quality of life. These two factors are sufficient to
outweigh any problems from the holidays. Wu and Wei (2005) also believe the
problems can be solved by managing supply and demand.
In the first Golden Week – National Day (1st October, 1999), there was an increase in
domestic tourists. From then on, official reports showed that the domestic travel
industry enjoyed increases in both tourist arrivals and revenue. Figure 1.3 and 1.4
present the tourist numbers and tourism revenues respectively from the first Golden
Week – National Day holiday in 1999 – to National Day holiday in 2006. Because a
serious epidemic of SARS broke out around May 2003 in China, there were no
statistics of tourist number and tourism revenue on International Labour Day holiday
in 2003.
160
140
120
million
100
CNY
80
May Day
National Day
60
40
20
0
1999
2000
2001
2002
2003
2004
2005
2006
Figure1. 3 – Numbers of tourists during Golden Weeks (Million) (Source: People
Daily, 2003a; Chinatour, 2007)
18
70
60
billion yuan
50
CNY
40
May Day
National Day
30
20
10
0
1999
2000
2001
2002
2003
2004
2005
2006
Figure1. 4 – Revenue during Golden Weeks (billion Chinese Yuan) (Source: People
Daily, 2003a; Chinatour, 2007)
From Figure 1.3 and 1.4 it can be seen that the system of Golden Weeks has had a
powerful impact on China’s tourism. In the first Golden Week holiday – National Day
holiday in 1999, 28 million people travelled around China during the seven-day
holiday. From then on, the tourist numbers during the Golden Weeks holiday kept
growing and reached 132.8 million during the National Day holiday in 2006. Tourism
revenue also increased annually every Golden Week from 14.1 billion Chinese yuan
on National Day holiday in 1999 to 55.9 billion Chinese yuan on National Day
holiday in 2006. The Chinese have learned to relax, travel and loosen their wallets
since the Golden Weeks’ policy was initiated.
1.2.4.2 Impacts on other Asian areas and countries
The three week-long holidays are considered as one of the significant factors
influencing Chinese outbound tourism (Zhang, 2006). The Golden Weeks not only
influence China’s domestic tourism, but also impact on other countries’ inbound
tourism, particularly the Southeast Asian areas and countries. As two special
administrative regions influenced by western culture, Hong Kong and Macao are
among the most popular destinations for the mainland’s Golden Weeks tourists. After
the implementation of relaxed individual travel permits to Hong Kong and Macao in
July 2003 (CNTA, 2006b), the two regions were shocked by the massive influx of
mainland’s visitors during the Golden Weeks holidays.
19
Mainland China’s Golden Weeks have especially brought “gold” to Hong Kong. The
mainland's tourism golden week has become a prime consuming week in Hong Kong,
and purchasing in the so-called "shopping paradise" has already become a major
attraction for many Chinese mainland tourists. However, visiting scenic spots has also
become a popular activity for tourists. The tourism-related sectors in Hong Kong treat
the Golden Week seriously and share considerable revenues brought about by the
National Day holiday(Oct. 1- 7). The Golden Week has, in fact, become a peak
consuming week in Hong Kong. In the National Day holiday in 2003, with a fullrange of preparations by the tourism-related sectors, Hong Kong welcomed over
287,000 Chinese mainland visitors from Sept. 28 to Oct. 5. Of these, 80,000 to 90,000
came as "individual tourists". Analysts said that if each mainland tourist spends 6,000
HK dollars (777 US dollars) on average during their stay in Hong Kong, 1.7 billion
HK dollars (220 million US dollars) could be expected to pour into Hong Kong
during this particular Golden Week (People Daily, 2003b). The Chinese mainland's
Golden Week can be seen as substantially boosting Hong Kong's holiday economy.
Macao welcomed more than 270,000 visitors from mainland China during the Golden
Week period from 1st to 7th October in 2004 (Xinhua, 2004). Mainland China has
become the major source of Macao’s tourist market growth.
The Golden Weeks holidays also boost the tourism market of China's neighboring
countries of the Association of Southeast Asian Nations (ASEAN). Singapore,
Malaysia and Thailand have maintained their popularity as destinations for Chinese
tourists. Besides the traditional tourist attractions, increasingly more Chinese would
also like to travel to other ASEAN nations such as the Philippines and Vietnam.
About 100,000 Chinese tourists visited the Philippines in 2005, up 200 percent on the
previous year, and the multiple choices of transport modes to Vietnam were also
convenient for Chinese tourists (Xinhua, 2006b).
Chinese New Year holidays happen in China’s winter time. Many Chinese citizens
like to choose those places which are comparatively warm or hot to celebrate their
traditional festival. Southeast Asian countries, including Singapore, Thailand and
Malaysia are the favourite destinations, as they lie in the tropical zone with pleasant
weather during January or February. Some Chinese citizens even travel to Australia
20
for a completely different experience of Chinese New Year (Xinhua News Agency,
2006).
1.3 Gaps in the literature and opportunities for research
The seasonality phenomenon in tourism has received considerable attention both in
academic and practical domains. However, most of the literature focuses on
describing seasonality and its causes. Many of the case studies focus on one group of
stakeholders and do not develop the seasonality concept or consider its measurement
in detail. Most of the studies have been conducted in Europe and North America.
There is lack of research in general on tourism seasonality in Asian countries. There
remain measurement problems, the need for a broader range of structure and further
solutions. Given the increasing importance of Asian countries in international tourism
and the influence of seasonality on tourism, an opportunity exists to investigate with
greater precision the seasonality phenomenon in Asian tourism.
As mentioned above, most studies have mainly discussed the broad patterns and
causes of seasonality. There has only been limited study of the regional effects of
seasonality. These natural effects can be predicted as the regional climate is relatively
stable. But what about the institutional effects? How will the institutional factors
influence the tourism industry and tourists? In particular, how does the system of
China’s Golden Weeks impact on its domestic tourism and how will it influence its
neighbouring countries? China has become an important source of international
tourists and so it is necessary to pay attention to the impact of the Golden Weeks, as a
special instance of a force shaping seasonality in the Asia Pacific region.
1.4 Proposed research framework
Bearing in mind that there is lack of detailed conceptual work on tourism seasonality,
especially in the Asian area, and the two basic factors that influence seasonality, this
project utilized a combination of secondary data analysis and surveys to develop a
comprehensive coding scheme for seasonality patterns in Asian tourism. The research
also explores how the natural and institutional factors influence Chinese tourists’
travelling decision and how the tourism managers deal with the seasonality issues.
The proposed research framework of this project is presented as Figure 1.5.
21
Seasonality patterns
(Asian-Tropical-area):
secondary data analysis
(quantitative)
Tourists’ travelling time
decision: questionnaires
(quantitative)
Natural factors
Managers’ perceptions
& solutions: interviews
(qualitative)
Institutional factors
(China’s Golden Weeks
particularly)
Other factors
Figure1. 5 – Outline of key topics in the thesis
1.5 Aims of this research
The overall aim of this research is to understand the seasonality phenomenon in Asian
tourism, with a focus on Chinese tourism, particularly the Golden Week system. More
specifically, the objectives of this research are as follows:
1) To construct a comprehensive coding framework of seasonality patterns in
Asian tourism;
2) To explore the impacts of Chinese tourists on Asian tourism seasonality,
particularly the Golden Weeks’ tourists;
3) To identify how strongly the seasonality factors influence visitors’ travelling
time period;
4) To identify visitors’ travelling experiences during Golden Weeks;
5) To explore tourism managers’ perceptions of seasonality patterns;
6) To explore tourism managers’ reactions to Golden Week travelling;
7) To explore tourism managers’ planning for Golden Week travelling.
22
1.6 Methodological approaches and considerations
In order to meet the research aim, it is necessary to develop an organizing research
framework or blueprint for conducting the studies to meet specific research objectives
(Yin, 2003). As outlined in Figure 1.5, a mixed-method approach, which combines
elements of both quantitative and qualitative research, was utilised in this thesis.
1.6.1 Mixed-method approach
The mixed-method approach is rapidly and increasingly applied in social research as a
research style (Brewer & Hunter, 1990; Creswell & Plano Clark, 2007; Greene,
Caracelli, & Graham, 1989; Johnson & Christensen, 2004; Johnson & Onwuegbuzie,
2004; Tashakkori & Teddlie, 2003). It is viewed as a way that has complementary
strengths offered by quantitative and qualitative methods (Johnson & Christensen,
2004; Neuman, 2002). The quantitative approach involves statistical analysis. It is
used to draw conclusions or to test hypotheses relying on numerical evidence, and is
concerned more with deduction, confirmation and explanation (Bryman, 2001;
Johnson & Onwuegbuzie, 2004; Veal, 2005). By way of contrast, the qualitative
approach is used to generate hypotheses or theories, focusing on induction,
exploration and understanding (Peterson, 1994; Veal, 2005). The mixed-method
approach is therefore a combination of strengths from both methods to ensure a better
understanding of the social phenomenon. The advantages of mixed-method approach
are recognized by scholars as summarised in Table 1.6.
Table 1. 6 – Advantages of mixed-method approach in social research
Scholars
Advantages
Hammersley
•
(1996)
Eliminate the weaknesses of each method (quantitative &
qualitative) employed on its own
Neuman
•
Avoid specific sources of error inherent in a single methodology
(2002)
•
The complementary strengths offered by qualitative and
quantitative methods
Creswell
•
The ability to demonstrate convergence in results through
(2003)
triangulation rather than only one research method
Tashakkori & •
Allow the researcher to meet with the confirmatory and
Teddlie(2003)
exploratory research objectives in the same study in the meantime
23
Tourism is widely accepted as a multi-disciplinary area of study as it involves many
industries and sector for catering the needs of travellers (Gunn, 1994), although there
is little consideration of the topic of mixed-method approach in tourism research. Due
to its multi-disciplinary nature, a variety of methods and approaches were adapted in
the tourism literature. It has been suggested that the mixed-method approach can be
used more frequently in the tourism study (Davies, 2003; Pansiri, 2005).
There are five purposes for using mixed-method approach: triangulation,
complementarity, development, initiation and expansion (Greene, Caracelli & Graham,
1989). The mixed-method approach was employed in the current research according
to specific development purpose, which has been stated as “seeks to use the results
from one method to help develop or inform the other method, where development is
broadly construed to include sampling and implementation, as well as measurement
decisions” (Greene, et al., 1989, P259). The “expansion purpose” also has a role in
this thesis and is defined as: “seeks to extend the breadth and range of inquiry by
using different methods for different inquiry components” (Greene, et al., 1989, P259).
1.6.2 Mixed-method approach in this thesis
As mentioned in the literature review there is currently little consideration of
seasonality issues in Asian tourism at the conceptual and theoretical level. Objective 1
in section 1.5 was set to fill this literature gap. Quantitative methods were first used to
review seasonality issues in Asian tourism. Seasonality patterns in Asian tourism were
generated by statistical analyses and these results subsequently provided a basis for
designing a new research approach to identify seasonality issues from managerial
perspective where a qualitative method was employed. This is one of the reasons for
using mixed-method approach in this thesis – development: using results from one
method to shape a subsequent method (Greene, et al., 1989). The instrument to meet
with Objective 5 in a later stage of this research would be difficult to establish without
the information resulting from the method employed in the earlier stage. Therefore,
the later method depends on the early one.
Objective 3-4 and Objective 5-7 focused on the seasonality phenomenon in the
Chinese context. Although the seasonality variables could be measured in a
quantitative way, it was recommended from the literature that the use of quantitative
24
approach alone would not be sufficient to understand this social phenomenon,
particularly in the Chinese context. It is advised to look into the cultural insights when
conducting tourism research in Asia Pacific region (Pearce, 2004; Ryan, Gu & Zhang,
2009). A particular argument was given to be sensitive to qualitative tourism research
in the Chinese context. Ryan et al (2009) have stated that when dealing with the
impact of tourism in China relying on purely quantitative research and likert scales is
inadequate to capture important Chinese norms. Quantitative and qualitative methods
were combined and employed in two separate stages to address Objective 3-4 and
Objectives 5-7 respectively. The quantitative methods were used to measure the
extent influenced by seasonality factors while the qualitative approaches were utilised
to explore how the tourists and managers think their experiences contribute to
seasonality influences. Therefore the seasonality phenomenon was investigated and
more fully understood from different approaches which were identified as another
purpose for using mixed-method approach – expansion (Greene, et al., 1989).
The following section will discuss the mixed-method research design and explained
the kind of data collection in each stage. It should be noted that the data collection
procedure and data analysis methods will be explained in detail in the subsequent
chapters.
1.7 Outline of chapters: the three studies in the thesis
This project consisted of three studies. The first one is based on secondary data
analysis where quantitative approach was employed. Data used are obtained from the
official tourism websites of five key Asian countries – Japan, Korea, Singapore,
Thailand and Malaysia, and four Chinese regions – Beijing, Hainan Island, Hong
Kong and Macau. Figures of monthly tourist arrivals were selected to run tables and
charts and construct a scheme of seasonality patterns. Based on the results of the first
study, questionnaires were designed for the second and third studies. The second
study is self-administrated surveys which aim to identify to what extent the
seasonality factors influence Chinese tourists’ travelling decision which was measured
by Likert-type questions, and their attitudes towards Golden Weeks travelling which
were explored by applying qualitatively open-ended questions. The final study
employs face-to-face interviews. Seasonality patterns resulting from the first study
were presented to tourism managers to explore how the relevant authorities respond to
25
the seasonality phenomenon and how they present and manage the Golden Weeks’
impacts on the tourism industry. Figure 1.6 provides a schematic outline of this
project.
Chapter 1
Introduction
Thesis Overview
Literature Review
Chapter 2 Study 1:
Asian data –
Seasonality patterns
in Asian tourism
Chapter 3 Study 2:
Visitors’ views –
seasonality influences
& GW experiences
Chapter 4 Study 3:
Managers’ views –
seasonality impacts &
GW business
Chapter 5 Discussions and Conclusions
– summary of key findings and
implications for the tourism industry;
– Limitations and proposed future
studies
Figure1. 6 – Chapter outline for the thesis
26
Chapter 2 – Seasonality patterns in Asian tourism
(Study 1)
Chapter structure
2.1 Introduction
2.2 Research objectives
2.3 Data and methodology
- 2.3.1 Seasonality data
- 2.3.2 Measures of seasonality
- 2.3.3 Modelling seasonality patterns
- 2.3.4 Data details
2.4 Results and discussion
2.5 Conclusion and implication
2.1 Introduction
As outlined in the previous chapter, seasonality is caused by two major factors –
natural and institutional. It is further influenced by other factors, such as social
pressure and fashion, sporting events, and traditions (Butler, 1994a). These factors
interact with each other and impact on tourism to different extents; as a result, various
types of seasonality patterns are formed. Three basic patterns of seasonality are
identified by Butler and Mao (1997): (1) single-peak, (2) two-peak and (3) non-peak.
The most common one is the single-peak seasonality (Lopez Bonilla et al, 2006),
which is most likely to produce extreme seasonality. The extreme peak was found to
happen mostly in summer in the northern hemisphere (Duval, 2004; Getz & Nilsson,
2004; Higham & Hinch, 2002). As Fernandez (2003) indicated, the single-peak
seasonality also generally prevails in southern European countries, such as Spain,
Portugal, Greece and Cyprus. Two-peak seasonality usually occurs in some
mountainous areas, which are attractive for both summer and winter tourists (Butler &
Mao, 1997). And non-peak seasonality appears in urban destinations, including Hong
Kong and Singapore, where there are no obvious fluctuations among monthly tourist
arrivals (Butler & Mao, 1997). In a study on Spanish tourism seasonality, a fourth
27
pattern named multiple-peak seasonality was identified by Lopez Bonilla et al, (2006).
In their study, the seasonality fluctuations appeared within the high season.
The peak season concept refers to the intense concentration of visitors at a given time.
It is, of course, necessary to record the relativities of the level of concentration of
visitors in order to identify the seasonality pattern. There are, however, few clear
empirical measures or agreed on parameters to define these patterns. The existing
research focuses on general concepts, definitions and the recording of seasonal or
month by month data (Bar-On, 1975; Baum & Lundtorp, 2001; Butler, 1994a;
Grainger & Judge, 1996; Hartmann, 1986; Lundtorp, 2001; Sutcliffe & Sinclair, 1980).
Koenig-Lewis and Bischoff (2005) point out that there are few quantifiable definitions
about when tourism seasonality occurs, how the tourism seasons can be differentiated,
and how tourism seasonality can be compared between different destinations or years.
A key opportunity exists therefore for researchers to define more precisely the nature
of seasonality patterns.
To date, most case studies have been carried out in the cold-weather destinations, such
as Denmark, England, Ireland, Norway, Canada and New Zealand (Commons & Page,
2001; Douglas & Barden, 1999; Hinch et al., 2001; Kennedy & Deegan, 1999;
Lundtorp et al., 1999; Sorensen, 1999; Thor, 2001). It is widely accepted that the
extremely cold weather limits tourists’ activities and results in the obvious seasonality
phenomenon. As suggested in Chapter One, there has been less formal consideration
of the possibility that extreme humidity and extremely high temperatures may also
affect the level of tourist comfort and so may also result in considerable seasonality.
In particular there is a lack of research on tropical seasonality. Additionally, from
reviewing the literature on tourism seasonality, it is apparent that most attention is
given to Europe and North America. Little seasonality research exists for desert
environments and in locations such as Asia, Africa, South America and the Middle
East. For the present interests and given the increasing importance of Asian countries
in international tourism and the influence of seasonality on tourism, an opportunity
exists to investigate the seasonality phenomenon in Asian tourism.
China, as Asia’s biggest country in terms of land area, covers various types of climate,
including the cold weather (e.g. Beijing) and the typical tropical climate (e.g. Hainan
28
Island). Due to its vast area and the rich natural and historic resources, China is
becoming one of the most popular destinations and is predicted by United Nations
World Tourism Organization (UNWTO) to be the top destination for tourists by 2020
(People Daily, 2002). Further, with the rapid development of its economy, more and
more Chinese travel domestically. And it is becoming a fashion for the Chinese to
travel overseas, particularly after the implementation of Golden Week system. The
Chinese tourism industry was surprised after the first Golden Week by the masses of
tourists. As the Golden Week system is maturing and travellers gain confidence, the
resulting impact will extend more and more to neighbouring and popular Asian
destinations. To get the most benefits from the Golden Week system, the first step is
to find out how this institutional factor influences the tourism market and shapes the
seasonality patterns within China and Asia.
2.2 Research objectives
The aim of this study is to provide a comprehensive coding system for Asian
seasonality by using secondary data and incorporating several Asian and tropical
examples into the data sources. Particular attention is given to China to investigate the
impact of its Golden Week system. Therefore, the objectives of this study are as
follows:
1) To construct a comprehensive coding framework of seasonality patterns in
Asian tourism;
2) To explore the impacts of Chinese tourists on Asian tourism seasonality,
particularly the role of the Golden Weeks’ tourists.
2.3 Data and methodology
2.3.1
Secondary data
Secondary data analyses are employed here to help achieve the aims of this study.
Secondary data are existing data which can be used for a specific project, although the
purpose of the project may be different to the initial purpose behind collecting the
data (Veal, 2005). The advantages of using secondary data in research are obvious –
less expensive and obtained rapidly (Hakim, 1982; Zikmund, 2003). This study
involves five Asian countries and four Chinese areas. As time and budget are limited,
it is difficult for the researcher to go to all the places for data collection. Therefore,
29
secondary data is a good source for this research. Also, primary data collection can
not be carried out in some cases, and in these instances secondary data can provide a
rich database. Secondary data permits analyses for studies of trends over time (Hakim,
1982). The present study explores the seasonality phenomenon over an extended time
period. In this case, secondary data can be usefully employed to help understand the
seasonality phenomenon.
While secondary data have advantages for research, there are also disadvantages
which result from the fact the data were not originally set to meet the needs of current
study. Those disadvantages may include:
(1) Outdated information,
(2) Variation in definition of terms,
(3) Different units of measurement, and
(4) Lack of information to verify the data’s accuracy (Zikmund, 2003, pp137).
Care therefore needs to be taken in aligning the research aims and the quality of the
available material. Secondary data are particularly useful for addressing two general
categories of research objectives – descriptive fact finding and model building
(Zikmund, 2003). Fact finding is a simple form of research which employs secondary
data for collecting descriptive information to support decision making. And model
building is more complicated and involves specifying relationships among multiple
variables. One of this study’s objectives is to construct a framework of seasonality
phenomenon, which locates the work in the predominantly descriptive category of
data use. Previous tourism related data can be applied to build up a scheme of
seasonality patterns. In keeping with the overall aim of the thesis and a number of
points made in Chapter One, the nature of the work being conducted in this part of the
thesis may be seen as the necessary descriptive detailing of a phenomenon in
anticipation of producing a framework for subsequent refined conceptual treatment
and application.
There are many sources of secondary data. The main ones are company information,
government agencies, educational institutions, archival material, and internet-based
resources. The data for this study are mainly extracted from official tourism websites
which help to guarantee the trustworthiness of data. Five key Asian countries were
30
selected – Japan, Korea, Singapore, Thailand and Malaysia. The data were adopted
from their national official tourism websites respectively – Japan National Tourist
Organization, Korea National Tourism Organization, Singapore Tourism Board,
Tourism Authority of Thailand and Tourism Malaysia. And four top Chinese tourist
areas – Beijing, Hainan Island, Hong Kong and Macau, were also included to form
this study. The secondary data were provided from the four official tourism websites –
Beijing Tourism Administration, Hainan Tourism, Hong Kong Tourism Board and
Macau Tourism. The choice of these destinations was influenced by the need to select
a mix of tropical and cold water settings and to use destinations which are both
popular and have good quality and accessible data.
Secondary data of monthly tourist arrivals to these five key Asian countries, ranging
from the year 2000 to 2006, and monthly tourist arrivals, both overseas and domestic,
to the four top Chinese tourist areas, ranging from the year 2002 to 2006 were used to
construct tables and charts for further analysis. As the secondary data were not
designed to meet the needs of present study, the format did not fit the current
requirements. In such cases, data conversion (or data transformation) is necessary.
Data conversion is “the process of changing the original form of data to a format
suitable to achieve the research objective” (Zikmund, 2003, pp137). On the original
official websites, tourist arrivals were reported in numbers, expenditures, length of
stay, purposes of visits, and visitors’ source regions. To meet the aims of this study,
data conversion was needed. The problem of how to transform the data depends in
part on how to measure the seasonality problem. Attention to this problem is
considered in the following section.
2.3.2
Measures of seasonalityk
The number of visitors is regarded as the basic unit for measuring tourism seasonality.
A review of literature reveals that two measurements – seasonality indicator and the
Gini-coefficient are used most often for describing the distribution of visitors during
the year (Lundtorp, 2001). The seasonality indicator is the inverse value of the
seasonality ratio, which is calculated as:
12
R = v n / v , v0 = ∑ vi , vn = v0 / 12
i =1
31
Where vn is the highest number of visitors, v is the average number of visitors and
v0 is the total number of visitor arrivals during the year. Therefore, the seasonality
indicator is defined as:
−
ω = v/ v n
1 / 12 ≤ ω ≤ 1
The seasonality indicator was found to be influenced by extreme values and has been
rejected as a problematic way to measure the equality of monthly data (Wanhill,
1980). The Gini-coefficient thus remains as a tool to consider. It is well-known for
measuring inequalities in economics and is derived from Lorenz curve (King, 1999).
Figure 2. 1 – Illustration of the Lorenz curve
The Gini coefficient is defined as the area between the Lorenz curve and the perfect
equality line, divided by the area underneath the perfect equality line: G =
A
A+ B
The following table displays some of previous research which studied the seasonality
phenomenon in tourism.
32
Table 2. 1 – Studies measuring tourism seasonality
Researcher Study
Measure
BarOn
Analyses the seasonality pattern of tourist Average monthly seasonal
(1975)
arrivals for 16 different countries over a factors, “seasonal range”,
17-year time frame.
“seasonality ratio”, “peak
seasonal factor”
Yacoumis
Examines the seasonality pattern of “coefficient of seasonal
(1980)
foreign tourist arrivals in Sri Lanka.
variation”,
“seasonality
ratio”
Sutcliffe
Identify “changes in the pattern” & “pure Lorenz
curves,
and
changes in the level of seasonality” in coefficients,
Sinclair
tourist arrivals in Spain over the period deviations
(1980)
1951-1976.
Drakatos
Derive seasonal factors for different Coefficients of variability,
(1987);
nationalities of visitors to Greece from 12- coefficient of variation,
Donatos
month moving averages, and compare the concentration
and Zairis acuteness of seasonality for different amplitude
(1991)
regions.
Wilton
Estimate the magnitude of the seasonal Seasonal
and
factors for 113 national tourism indicators deviations
Wirjanto
over the period 1986-1997.
Gini
standard
indices,
ratios,
similarity indices
absolute
(1998)
Wall
and Identify the structure, characteristics and Monthly ratios, seasonal
Yan
intensity of temporal fluctuations in index
(2003)
China’s international visitor arrivals from
1980 to 1998.
In these studies, the two tools – seasonality indicator and Gini-coefficient were
somewhat useful in demonstrating the importance of seasonality concentration and
dispersion. However, Lundtorp (2001) pointed out that these two measures fail to
describe the patterns for individual months and they are not able to reveal the
important seasonality changes during the year. Furthermore, relatively little research
33
has been done to examine the ways of quantifying and comparing empirical patterns
(Koenig-Lewis & Bischoff, 2005).
2.3.3
Modelling seasonality patterns
The seasonality phenomenon is affected by various factors which result in diverse
patterns. As noted earlier, three basic forms are recognized: one-peak seasonality,
two-peak seasonality, and non-peak seasonality (Butler & Mao, 1997). They are
categorized according to the number of peaks in a year. In order to identify the
patterns of seasonality, it is necessary to define “peak”. Peak is the high season which
refers to a concentration of visitors in a period time. There are several ways to
measure the level of concentration. In a study by Lim and McAleer (2001), the peak
was identified as those months with the seasonality ratio ( R ) superior to the unit (=1),
i.e. R f 1 . Lopez Bonilla et al. (2006) further developed this system into their study.
They looked at the seasonality indices corresponding to the average season. In their
study, four seasonality patterns were identified:
-
non-peak seasonality: the interval of the peak does not exceed one
month;
-
single-peak seasonality: the interval of the peak is between one and
four months;
-
multiple-peak seasonality: the interval of the peak exceeds four months;
-
two-peak seasonality: there are two discontinuous peaks over the year.
Based on the accessible data and the ideas from previous research, this study tries to
find a format to express seasonality which can be easily accepted and which can
effectively display the nature of seasonality variations. The variable of monthly tourist
arrivals was selected, corresponding to the average monthly tourist arrivals, to build a
coding system to identify seasonality patterns. In essence, the framework builds on
these previous efforts and attempts to extend the existing work with both an appealing
and easily quantified approach to labelling seasonal variations.
2.3.4
Method details
Monthly data of total visitor arrivals, Chinese visitors and the visitors from five
continents – Asia, Europe, Americas, Oceania and Africa to the five key Asian
countries, and monthly data of domestic visitors and overseas visitors to the four
34
Chinese areas, were chosen to provide a comprehensive data set. First of all, data of
monthly tourist arrivals in the five key Asian countries and four Chinese areas were
extracted from their official tourism websites. The beginning date was chosen on the
grounds of availability of the monthly data. Data were provided in web-page format,
and the visitor arrivals were recorded based on origin markets. Then the data were restructured into Excel to describe monthly arrivals from each market. Average monthly
arrivals were compared for every month for every year using Pivot Table and Pivot
Chart report. Seasonality patterns were obtained from the variations between monthly
tourist arrivals and average monthly tourist arrivals.
2.4 Results and discussion
In all, there were 285 charts used to consider the seasonality patterns in Asian tourism.
By looking at variances between monthly tourist arrivals and average monthly tourist
arrivals, the 285 charts were categorized into six groups and named after six basic
types of landforms – the rolling hills, the plain, the single-peak mountain, the multipeak mountain, the basin and the plateau. An iterative process of looking at possible
patterns and defining and refining them was undertaken to distinguish among the
many tables. The process was underpinned by a strong approach of being able to
define the types in quantitative terms. For each of the types identified there is a verbal
definition, an illustration, a quantitative measure and some examples.
2.4.1 Type 1 – The rolling hills pattern
•
Verbal definition: This pattern is similar to the landform of rolling hills, which
refer to the land rising and falling in long gentle slopes.
35
•
Illustration:
900000
800000
700000
600000
500000
400000
300000
200000
100000
0
Arrivals
Average
Jan Feb Mar Apr May Jun Jul Aug Sep Oct Nov Dec
Figure 2. 2 – Illustration of the rolling hills pattern
•
Empirical measure:
Figure 2.2 illustrates the rolling hills pattern. The thick solid line represents
monthly tourist arrivals while the thin solid line shows the average. The long
vertical bars indicate 20% variation compared to the mean while the short vertical
bars indicate 5% variation compared to the mean. The empirical measures for the
rolling hills pattern are as follows:
-
Three or more points above the mean, which vary by no more than 20% but at
least by 5% from the mean;
-
Three or more points below the mean, which vary by no more than 20% but at
least by 5% from the mean.
•
Examples:
This is the most common pattern in the cases examined. Sixty percent of the cases
studied conform to this pattern. In Table 2.2 and Table 2.3 below, those markets
with an asterisk conformed to this pattern.
36
Table 2. 2 – Markets to five countries performing in the rolling hills pattern
Source\
Japan
Korea
Singapore
Thailand
Malaysia
Destination
Americas
*
*
*
*
Asia
*
*
*
*
Africa
*
Europe
*
Oceania
*
Total
*
China
*
*
*
*
*
*
*
Generally speaking, except for Malaysia, tourism seasonality in the other four
Asian countries conforms to the rolling hills pattern in terms of total inbound
visitors. For the five continental markets, American visitors are most likely to be
in this pattern, followed by the Asian visitors. American visitors conform to the
rolling hills pattern when visiting all five destination countries while the pattern
applies to four Asian source markets. As Asian visitors dominate the total inbound
visitors in the five Asian destinations (Japan National Tourism Organization, 2006;
Korea National Tourism Organization, 2006; Singapore Tourism Board, 2006;
Tourism Authority of Thailand, 2006; Tourism Malaysia, 2006), the performance
of Asian visitors shapes the overall patterns. Both African and Oceania visitors
conform to this pattern when they go to Korea and Thailand. European visitors are
least likely to fall into this pattern, and it applies only when they visit Korea.
Regarding the particular source market – China, this is an uncommon pattern for
the outbound Chinese visitors as well. It only applies when the Chinese travel to
Japan.
Table 2. 3 – Markets to four Chinese areas performing in the rolling hills pattern
Source\
Beijing
Hainan
Hong Kong
Macao
Destination
Domestic
*
Overseas
37
*
*
*
*
By looking at the four areas within China, the rolling hills pattern seems to
dominate the seasonality patterns in China’s domestic tourism. Except Hainan
Island, Chinese domestic visitors to Beijing, Hong Kong and Macao are in the
rolling hills pattern. This pattern applies to overseas visitors only when they go to
visit Hong Kong and Macao.
There is no extremely high or low point in this pattern. The highest and the lowest
points do not vary by more than 20% from the mean. However, exceptions exist
when special events happen. In 2002, both African and European visitors to Korea
did not fit the rolling hills pattern, peaking in May and in June respectively. And
in 2006, overseas visitors to Macao peaked in December with more than a 20%
variance from the mean.
2.4.2 Type 2 – The plain pattern
•
Verbal definition: This pattern is similar to the landform of a plain, which
refers to a large stretch of flat land.
•
Illustration:
1200000
1000000
800000
Arrivals
600000
Average
400000
200000
0
Jan Feb Mar Apr May Jun Jul Aug Sep Oct Nov Dec
Figure 2. 3 – Illustration of the plain pattern
•
Empirical measure:
Figure 2.3 illustrates the plain pattern. The thick solid line represents monthly
tourist arrivals while the thin solid line shows the average. The short vertical bars
38
indicate 5% variation compared to the mean. The empirical measures for the plain
pattern are as follows:
-
Every point varies by no more than 5% from the mean.
•
Examples:
This is not a common pattern among the cases examined. Only seven percent of
the cases studied conform to this pattern, that is, the total visitors and Asian
visitors to Malaysia over a seven-year time period. It shows that Malaysia has no
obvious seasonality in terms of total inbound visitors or Asian visitors.
Neither the Chinese market nor any Chinese destinations fall into this pattern.
2.4.3 Type 3 – The single-peak mountain pattern
•
Verbal definition: This pattern is similar to the landform of a single-peak
mountain, which refers to clearly defined elevated land, with a single
distinctive high point.
•
Illustration:
25000
20000
15000
Arrivals
10000
Average
5000
0
Jan Feb Mar Apr May Jun Jul Aug Sep Oct Nov Dec
Figure 2. 4 – Illustration of the single-peak mountain pattern
•
Empirical measure:
Figure 2.4 illustrates the single-peak mountain pattern. The thick solid line
represents monthly tourist arrivals while the thin solid line shows the average. The
39
long vertical bars indicate 20% variation compared to the mean. The empirical
measures for the single-peak mountain pattern are as follows:
-
One or more points above the mean, which vary by 20% or more from the
mean and which are consecutive;
•
Examples:
Table 2.4 and Table 2.5 describe those groups belonging to this pattern with their
very high and very low points indicated. Twenty-four percent of the cases studied
conform to this pattern.
Table 2. 4 – Markets performing in the single-peak mountain pattern
Japan
Singapore
Malaysia
Origin\
Destination Peak
Base
Africa
October
December December February #April
Oceania
September January
Europe
October
Peak
July
December
Base
Peak
Base
#November
February January November
March
June
(# indicates it only applies to the year 2000 & 2001)
African visitors to Japan are most likely to concentrate in October, while they are
least likely to go to Japan in December. But when they go to Singapore, December
seems to be the most popular month, while February has the lowest number of
African visitors. And when they go to Malaysia, this pattern applies to them only
in the year 2000 and 2001. The peak and the lowest months for European visitors
to Japan are the same as for African visitors, but European visitors conform to a
single-peak mountain pattern when they go to Malaysia instead of Singapore.
Most European visitors go to Malaysia in March while the least number go in June.
Oceania visitors also conform to this pattern when they go to visit the three
countries – Japan, Singapore and Malaysia; however, their peak and low months
are different from each other respectively. They go to visit Japan peaking in
September and travel there least in January. But January is the peak in terms of
going to Malaysia for them, while they are least likely to go to Malaysia in
November. The peak and lowest months for them to travel to Singapore are
completely different as well, peaking in July and being lowest in February.
40
Some exceptions exist in the year 2002 in this category as well. For both the
markets of African visitors and European visitors to Japan, their peak is in June
instead of October in the year 2002.
Table 2. 5 – The peaks and bases for Chinese visitors to Thailand (2000 – 2006),
Singapore (2000 – 2006) and Korea (2000 only)
Thailand
Singapore
Korea (2000)
Peak
Base
Peak
Base
Peak
Base
January/
October
2000-2003:
June
August
January
February
January/
February
2004-2006:
July-August
The Chinese visitors tend to be most likely to perform in the single-peak mountain
pattern. Among the five Asian destinations examined, this pattern applies to the
Chinese visitors when they go to Thailand, Singapore and Korea in the year 2000 with
different peaks and low points. January or February is the most popular month for the
Chinese visitors to go to Thailand, and they are least likely to visit Thailand in
October. As mentioned before, the Chinese New Year (CNY) is based on the Chinese
Lunar calendar, so the dates of CNY are different from year to year. In accord with
the calendar, it was found that the peak month for Chinese visitors to Thailand follows
the month of CNY month, that is, their peak month in 2001, 2004 and 2006 fell in
January as CNY fell in this month in these years, and the rest are in February. So it is
the same with the Chinese visitors to Singapore from the year 2000 to 2003. However,
the peak for them to go to Singapore shifted from January or February in 2000-2003
to July and August from 2004 to 2006. And the Chinese visitors were least likely to
visit Singapore in June. In 2000, the Chinese visitors to Korea concentrated in August,
and they were least likely to go there in January. However, from 2001, the seasonality
pattern for Chinese visitors to Korea shifted to be in the multi-peak mountains which
will be discussed in the following section.
41
2.4.4 Type 4 – The multi-peak mountain pattern
•
Verbal definition: This pattern is similar to a landform of multi-peak
mountains, which refers to land higher than a hill, with two or more distinctive
high points.
•
Illustration:
70000
60000
50000
40000
Arrivals
30000
Average
20000
10000
0
Jan
Feb
Mar
Apr
May Jun
Jul
Aug Sep
Oct
Nov
Dec
Figure 2. 5– Illustration of the multi-peak mountains pattern
•
Empirical measure:
Figure 2.5 illustrates the multi-peak mountains pattern. The thick solid line
represents monthly tourist arrivals while the thin solid line shows the average. The
long vertical bars indicate 20% variation compared to the mean. The empirical
measures for the multi-peak mountain pattern are as follows:
-
Two or more points above the mean, which vary by 20% or more from the
mean and at least two of which are not consecutive.
•
Examples:
Two percent of cases studied conform to this pattern. African visitors to Malaysia
tend to conform to this pattern from the year 2002 to 2006. Their peaks come in
January, March and October. African visitor arrivals in these three months are
more than 20% above the mean. An examination of the charts reveals that there is
a shift of seasonality for African visitors to Malaysia. In the previous two years
examined (2000 and 2001), they displayed the single-peak mountain pattern.
42
This pattern applies to Chinese outbound visitors when they go to visit Malaysia
as well. And the peaks for them come in February, May and August from 2000 to
2004. In the year 2005 and 2006, May became a low month for them, and
November became another peak, together with February and August. As
mentioned above, there is a shift for the Chinese visitors to Korea. From the year
2001 to 2006, they fall into the multi-peak mountains pattern. Except the year
2002, the peak months for them were August and October, and the low seasons
came in January or February, and June. However, June is the very peak season for
them to Korea in 2002, together with the other two peaks, August and October.
This pattern does not exist in China’s domestic tourism.
2.4.5 Type 5 – The basin pattern
•
Verbal definition: This pattern is similar to the landform of a basin, which
refers to an area of low land largely surrounded and defined by higher land.
•
Illustration:
400000
350000
300000
250000
Arrivals
200000
Average
150000
100000
50000
0
Jan Feb Mar
Apr May Jun
Jul
Aug Sep
Oct
Nov Dec
Figure 2. 6– Illustration of the basin pattern
•
Empirical measure:
Figure 2.6 illustrates the basin pattern. The thick solid line represents monthly
tourist arrivals while the thin solid line shows the average. The long vertical bars
43
indicate 20% variation compared to the mean. The empirical measures for the
basin pattern are as follows:
-
Two or more consecutive points below the mean, at least one of which varies
by 20% or more from the mean;
-
Those consecutive low points mentioned above are in the middle of the pattern;
-
On the left side of those consecutive low points mentioned above, the points
are on the decline;
-
On the right side of those consecutive low points mentioned above, the points
are on the increase.
•
Examples:
Seven percent of cases studied conform to this pattern. In this pattern, tourist
arrivals are most likely to visit at both the very beginning and the very end of the
year; and the low seasons happen in the middle of the year. The seasonality type
for European visitors to Thailand and Singapore fits this pattern. The low seasons
for European visitors to Thailand last from May to September; while they go to
Singapore least in May but start to rise from July.
For the Chinese market, both domestic visitors and overseas visitors to Hainan
performed in this seasonality pattern as well. The very low season for them is
from June to September; however, there are slightly more domestic visitors in July
and August (when it is China’s school summer holiday) than in June and
September.
2.4.6 Type 6 –The plateau pattern
•
Verbal definition: This pattern is similar to the landform of a plateau, which
refers to a flat highland area with at least one steep face.
44
•
Illustration:
350000
300000
250000
200000
Arrivals
150000
Average
100000
50000
0
Jan Feb
Mar
Apr May Jun July Aug Sep
Oct
Nov Dec
Figure 2. 7– Illustration of the plateau pattern
•
Empirical measure:
Figure 2.7 illustrates the plateau pattern. The thick solid line represents monthly
tourist arrivals while the thin solid line shows the average. The vertical bars indicate
10% variation compared to the mean. The empirical measures for the plateau pattern
are as follows:
-
The first two/three and the last one/two points are below the mean, and the
others are above the mean;
-
The points above the mean vary by 10% or more from the mean.
•
Examples:
No cases examined in the five key Asian countries fit this pattern, but this pattern
suits the performance of overseas visitors to Beijing. In the plateau pattern, travellers
are least likely to visit either at the beginning or at the end of the year; and for the rest
months of the year, there is little fluctuation of tourist arrivals and each arrival is
above the monthly mean arrival. In the case of overseas visitors to Beijing, the low
season fell in January, February and December; and overseas tourists tend to visit
Beijing over the remaining months.
45
2.5 Conclusion and implications
The six patterns identified provide a comprehensive and inclusive approach to
seasonality in Asian tourism. The most basic and common type was the rolling hills
pattern. Among the 285 cases examined, 60% of them correspond to this pattern. This
finding confirms the view that extreme seasonality, as evidenced in the single or
multi-peak mountain types, does not dominate Asian tourism. Nevertheless
seasonality in some new and different forms appears in the data. The basin pattern and
the plateau pattern turn out to perform in a completely different way. Among the cases
examined, the European visitors to Thailand and Singapore and the domestic and
overseas visitors to Hainan Island conform to the basin pattern; while only the
overseas visitors to Beijing fit the plateau pattern. By looking at the location of
Hainan (in the south of China) and Beijing (in the north of China), it is easy to see that
the climates in the two places are completely different. The climate at beginning and
the end of year is very cold in Beijing while it is quite cool in Hainan Island; and in
the middle of the year, it is very hot in Hainan while it is cool in Beijing. The
differences in climate result in the different seasonality patterns for the two areas,
which indicate that in this instance the powerful natural factors play an important part
in shaping the local seasonality pattern.
Only the total visitors and the Asian visitors to Malaysia appear to be in the one and
only pattern, the plain, which could be interpreted as a flow of visitor arrivals with no
time linked changes in tourism demand. Many specific markets show strong
seasonality in relation to certain destinations. Among the six patterns discussed above,
the last four patterns have extremely high or low seasons, which affect both tourists’
travelling experience and tourism management in the destinations. The concentrations
of tourists in short time periods will bring more profits to tourism business, but
crowds may be a great burden to the attractions and reduce tourists’ satisfaction as
well. The low seasons may impose high costs for labour and reduce income through
little use of tourism infrastructure. It is important for the tourism industry to strive to
achieve the most efficient seasonality patterns which may benefit both themselves and
their tourists. As mentioned in the example of the fourth pattern, the multi-peak
mountain, there is a shift of seasonality pattern for African visitors to Malaysia, from
the single-peak mountain to the multi-peak mountains, which suggests that Tourism
46
Malaysia may have undertaken marketing to create more attractive points to bring in
more African visitors.
In this study the six seasonality patterns were derived by identifying the variations
between monthly tourist arrivals and average tourist arrivals. The method is simple
and effective, and it quantifies and further develops the seasonality patterns
mentioned by Butler and Mao (1997). This study not only verifies how much
seasonality exists in Asian area, but also identifies the patterns and fills the gap in
describing the individual monthly patterns further revealing the importance of
seasonality changes previously assessed by the seasonality indicator and the Ginicoefficient (Lundtorp, 2001). As established in the study of Spanish tourism
seasonality by Lopez Bonilla et al (2006), diverse locations even in the one country
(China) showed significant differences with regard to seasonality patterns. The coding
system for the seasonality patterns employed examples from several countries and
over a long time period, and thus addressed requests by researchers to quantify and
compare empirical patterns (Koenig-Lewis & Bischoff, 2005).
The operation of major world events is apparent in the data. The outbreak of SARS in
2003 had a serious impact on the tourism seasonality patterns. All the 2003 cases
examined in this study showed a sharp decline from April to June when SARS broke
out. Another important point is that both African and European visitors to Japan and
Korea performed differently in the year 2002. The two markets peaked in June in
2002 when more travellers visited Japan and Korea. The 17th football World Cup was
held in Japan and Korea from 31st May to 30th June. This study shows that this event
affected African and European markets considerably, but did not influence visitors
from other continents very much. The Chinese tourists also responded to this event
held in the neighbouring countries. Although there is not an obvious change in the
fluctuations of Chinese visitors to Japan, there is a different peak for visiting Korea in
2002. In that year, June became the most popular month for the Chinese to visit Korea,
instead of their normal peak, which is August. Another sporting event also had an
influence on the Macau tourism seasonality pattern. In December 2006, when the
International Kart Grand Prix was held in Macau, there was an increase of tourist
arrivals from overseas to Macau, with a 20% increase compared to the average
monthly arrivals. This event made Macau perform in the single-peak mountain pattern
47
in 2006 in terms of overseas visitors, which is quite different to its normal pattern –
the rolling hills pattern.
As indicated by Koenig-Lewis and Bischoff (2005), Chinese outbound tourism and
particularly the Chinese New Year present an interesting area for research. This study
found several interesting points by looking specifically into the performance of
Chinese visitors. Generally speaking, there are two favourite time periods for them to
travel overseas. One is the month with Chinese New Year (CNY). As discussed above
in the six patterns, the month with CNY is the peak or one of the peaks for Chinese
visitors to go to Thailand from 2000 to 2006, to Singapore from 2000 to 2003, and to
Malaysia from 2000 to 2006. In one of the previous studies, CNY was found to be an
influential factor in shaping the seasonality patterns for inbound tourists to China. In
that study by Wall and Yan (2003), it was found that the number of Compatriots
(which can be also regarded as overseas Chinese) to China is higher for the month
containing CNY than for the preceding and following months. The other one is
August when the school summer holiday comes. August is the favourite month for
Chinese to visit Korea from 2000 to 2006 (except 2002). For 2004 to 2006, the peak
time to visit Singapore for Chinese tourists was August.
The coding scheme defining the six seasonality patterns can be applied to various uses
within the tourism area. First, tourism managers can apply the coding scheme to
identify benchmarks and form comparisons. From this information they may choose
to follow a number of established strategies. There are multiple ways to extend and
modify seasonality benefits through promotion and incentives, including pricing
options, developing special attractions and fostering events. Additionally, some jobs
and tasks in tourism facilities may be able to be shifted to predicted low season times
when pressure on staff and managers are less. Secondly, the seasonality coding
scheme can be used by the policy makers when they are planning certain tourismrelated events. Sports events in particular may be used in this way. It is insightful and
necessary to conceptualize key sport events as tourist attractions (Higham, 2006). As
mentioned above, the Chinese, African and European markets were affected by the
World Cup. The implication for the related policy makers is to arrange specific events,
notably sports, to target specific markets in order to mitigate side effects resulting
from the low seasons. Finally, the coding scheme established here can also be applied
48
to future academic studies. Good conceptual analysis and theory building in tourism
research relies on a comprehensive and rich understanding of the phenomenon. The
scheme proposed here may help provide a contribution to this understanding. These
six patterns are based on examining cases using a strong Asian and tropical focus.
They could also be applied and tested in the study of seasonality patterns in other
countries and for other climate conditions. These extensions, comparisons and
checking procedures could be undertaken in the Middle East, Africa and central and
South America.
49
Chapter 3 – Chinese travellers’ attitudes towards
seasonality and Golden Week travelling (Study 2)
Chapter structure
3.1 Introduction
- 3.1.1 Background information – China’s Golden Week holiday system
- 3.1.2 Seasonality influences in China
•
3.1.2.1 Natural seasonality influences in China
•
3.1.2.2 Institutional seasonality influences in China
•
3.1.2.3 Other seasonality influences in China
3.2 Research gaps and study objectives
3.3 Method
- 3.3.1 Questionnaire design
- 3.3.2 Data collection and sampling
- 3.3.3 Data analysis methods
3.4 Results and discussion
- 3.4.1 Demographic profiles of respondents
- 3.4.2 Previous travelling experience
- 3.4.3 Overview of seasonality concerns
•
3.4.3.1 Seasonality influences for respondents from different parts of
China
•
3.4.3.2 Seasonality influences for respondents by gender
•
3.4.3.3 Seasonality influences for respondents by age
•
3.4.3.4 Seasonality influences for respondents by education
•
3.4.3.5 Seasonality influences for respondents by occupation
•
3.4.3.6 Seasonality influences = for respondents by income
•
3.4.3.7 Summary of seasonality influences in terms of demographic
groups
- 3.4.4 Experience of Golden Weeks travelling
•
3.4.4.1 Experience of Chinese New Year Golden Week travelling
•
3.4.4.2 Experience of May Day Golden Week travelling
•
3.4.4.3 Experience of National Day Golden Week travelling
50
•
3.4.4.4 Summary of Chinese travellers’ experiences among the three
Golden Weeks
- 3.4.5 Explaining travellers’ perceptions of seasonality and Golden Weeks
tourism
•
3.4.5.1 Demographic characteristics of groups with different travelling
experiences
1) Frequent tourists versus non-frequent tourists
2) Golden-week tourists versus non-Golden-week tourists
•
3.4.5.2 Discriminant analysis of tourists’ perceptions of seasonality
between groups with different travel levels
•
3.4.5.3 Comparison of perceptions of Golden Week travelling between
Golden-week tourists and non-Golden-week tourists
3.5 Conclusion and implications – summary of Study 2
3.1 Introduction
3.1.1 Background information – China’s Golden Week holiday system
As noted in Chapter One, the Golden Week holidays were set up by the Chinese
government in October 1999, seeking to boost consumption and expand domestic
demand. Before May 2008, China had three “Golden Weeks” for Spring Festival
(Chinese New Year), International Labour Day (May Day) and National Day holidays.
The “Golden Weeks” are actually three days only as a weekend on one side of the
holiday is designated as two working days. The seven-day holiday week has become a
significant opportunity for the development of China’s tourism market. China’s
tourism industry has been growing at double-digit rates for almost 10 consecutive
years. An estimated 28 million Chinese travelled during the first Golden Week in
1999. In 2007, this number had increased to over 120 million (McCabe, 2007).
Golden Weeks have become a part of the Chinese life and since then the Chinese have
spent more and more each year at tourist hot spots across the country – a total of more
than $70 billion over seven years up to May 2006, according to official statistics. The
prolonged holidays indeed turned out to be “golden” for the economy.
Despite the great benefits for economic development, problems are arising as a result
of visitor concentration over the short time periods. The rising number of visitors has
51
exerted great pressure on the transportation, catering and hotel and tourism
infrastructure. There have been disputes concerning whether or not to cancel the
Golden Weeks system. People who argue for cancelation of the Golden Weeks system
have argued that so many people move at the same time that it has made travel in the
Golden Weeks a nightmare. An analogy in Western countries is to view the Golden
Weeks as three times more intense than Christmas. Flights are fully booked, trains and
buses are jammed and the highways are congested in every direction. And the
contradictions between consumer demand and service capacity caused by the
imbalanced development has negatively influenced the quality of people’s travelling
experience. Previous studies indicated that once an attraction reaches its carrying
capacity, every additional tourist will increase every other tourists’ travelling cost,
which means that the satisfaction level for existing tourists will be reduced (He, 2002;
Feng, 2005).
All the negative phenomena mentioned above have resulted in calls for cancelling the
Golden Week system ranging from ordinary people, to government policy makers and
to academic researchers. The question is framed as whether the Golden Week system
should be cut off or not? Taking China’s low development level into consideration, on
23rd November, 2004, a Chinese tourism authority from CNTA declared to the public
that China will continue to implement the Golden Week holiday system. This
statement was supported by some Chinese academics. Their research showed that the
Golden Week system reflects the inherent requirement of Chinese residents; therefore
the cancellation would directly suppress the travel demand for residents (Gao, 2005;
Liu, D.Q., 2005; Liu, S.M., 2005; Zhang, 2001; Zhang & Wang, 2005). It was
decided however that the system should be kept under constant review and change
made whenever necessary. As mentioned in Chapter One, from 2008, the May Day
holiday was reduced to one day, with new one-day holidays for the Tomb-sweeping
(Qingming) Festival, Dragon Boat Festival and Mid-Autumn Festival.
The Golden Week holiday system is a nation wide policy, which is acting as a
powerful measure to protect and nurture tourism by the Chinese people and to
regulate the development of China’s tourism industry. Problems arising in Golden
Weeks travelling have resulted from the imbalance between rising demands of
tourism for Chinese people and inadequate supply. Such problems may still occur in
52
China’s tourism development even without the Golden week system. Therefore, the
cancellation of Golden Week holiday system will not avoid these problems. Some
academics argue that the way to solve those problems is to manage, not to cancel the
system (Zhang & Wang, 2005). Therefore, it is important for policy makers to look
into the actual needs of the Chinese people and their attitudes concerning Golden
Weeks travelling. The present study seeks to contribute to this understanding.
3.1.2 Seasonality influences in China
As discussed extensively in Chapter One, seasonality patterns are basically influenced
by two factors – natural and institutional, and other factors, like special events and
religions. Such factors interact with each other and influence people’s decision
making to different extents. It is hard to determine which factor is more influential for
policy makers to take into account when they are making policy decisions concerning
seasonality. It could be of assistance to policy makers to know the travelling public’s
attitudes concerning seasonality.
To clarify the seasonality issues in China, a brief review of the general ideas presented
about seasonality previously are summarised as follows. These studies and
considerations contribute substantially to the construction of the study in this chapter.
3.1.2.1 Natural seasonality influences in China
Natural seasonality is the result of regular variation in climatic conditions –
temperature, rainfall, snowfall and daylight (Barry & Perry, 1973; Boucher, 1975;
Butler, 1994a). China, with its vast territory and abundant resources, has a continental
and seasonal climate. Most parts are in the temperate zone but the southern areas are
in tropical or subtropical zone while northern areas are in the frigid zone. China has a
four-season climate, however, climates in different areas are complicated. For
example, northern Heilongjiang Province has a winter climate the year round without
much of a summer, while Hainan Island has a summer climate the year round without
a true winter. Generally, the northeast experiences hot and dry summers and bitterly
cold winters. The north and central region has almost continuing rainfall, hot summers
and cold winters. The southeast region has substantial rainfall, with subtropical
summers and cool winters. Central, western and southern China are also susceptible to
flooding. As a result, the natural seasonality in China varies in different areas. People
53
from different parts of China will be influenced by different natural seasonality
concerns.
3.1.2.2 Institutional seasonality influences in China
Institutional seasonality is the outcome of a combination of religious, cultural, ethnic
and social factors – periods of religious worship, holidays or pilgrimages as well as
school or industry holidays. The public holiday is one of the most common forms that
affect tourism, and the most significant elements of institutionalized seasonality are
school and industry holidays (Butler, 1994a).
In China, there are currently seven official public holidays which are applicable to the
whole population and four official public holidays applicable to specific sections of
the population, as illustrated in Table 3.1.
54
Date
Table 3. 1 – China’s public holidays
Name
Duration
1st January
New Year
Remarks
1 day
1st day of 1st lunar Chinese New Year
3 days*
month
Last day of last
lunar month from
2008
8th March
International
Half-day
Women’s Day
Applicable
to
women
5th Solar Term (4th Qingming Festival
1 day
th
April or 5 April)
Applicable
from
2008
1st May
Labour Day
3 days* (1 day)
1 day since 2008
4th May
Youth Day
Half-day
Applicable to youth
above the age of 14
th
th
5 day of 5 lunar Dragon
Boat 1 day
month
Festival
1st June
Children’s Day
Applicable
from
2008
1 Day
Applicable
to
children below the
age of 14
1st August
Army Day
Half-day
Applicable
to
military personnel
in active service
15th day of 8th lunar Mid-Autumn Day
1 day
month
1st October
Applicable
from
2008
National Day
3 days*
(* indicates that the three-day holiday is combined with two well-placed weekends to
form a week long holiday, which is named Golden Week as mentioned in Chapter
One.)
School holidays are another good time for the Chinese to go travelling either within
China or internationally. Basically, there are two school holidays per year in China,
one is the winter holiday between mid January and mid February and the other is the
summer holiday period in July and August. The latter one is the more preferred
travelling time as it lasts longer and it occurs in the season with good weather.
55
3.1.2.3 Other seasonality influences in China
Other seasonality influences include social pressure or fashion, sporting seasons and
traditions (Butler, 1994a). With the economic development, the Chinese people have
become more enthusiastic travellers (Liu, 2009). Indeed travelling is becoming
fashionable for the Chinese. After the introduction of the two-day weekend system in
1995 in China, people tended to quite enjoy two relaxing days travelling in local
surrounds. And since the implementation of Golden Week system from 1998,
domestic tourism has been growing vigorously. In 1998, the number of domestic
tourists reached 695 million, spending a total of 239.1 billion yuan (RMB – Chinese
currency) – 10 percent and 74 percent increases over 1995, respectively (Asianinfo,
2000). With the development of the Chinese people’s living standards, Chinese
citizens have an increasingly strong interest in travelling abroad. In recent years, it has
become more common to see Chinese tourists during the three Golden Weeks at the
Sydney Opera House, Egypt’s pyramids, Mount Fuji in Japan and other scenic spots
around the world.
The factor of sporting seasons seems not to influence Chinese tourism seasonality
very much. However, it was reported that the 2008 Olympic Games had brought in
large number of tourists to Beijing after the Olympic Games. Beijing received a
record number of tourists during the weeklong Spring Festival in 2009. The municipal
tourism authority said that it handled 3.24 million domestic tourists from 25th to 31st
January, 2009, up 20 percent on last year (CNTA, 2009a). The Olympic venues are
among the most popular attractions. The main Olympic venue of Bird’s Nest opened
to the public from 1st October 2008. The stadium attracted 60,000 tourists on its
opening day and an average of 20,000 to 30,000 visitors every day since then (CNTA,
2009b). Approximately 80,000 people visited the Bird’s Nest and Water Cube during
the first four days of the 2009 CNY Golden Week. With the development and
progress of society, these ancillary seasonality influences are influencing and will
increasingly shape the seasonality patterns of Chinese tourism.
3.2 Research gaps and study objectives
Disputes concerning the Golden Weeks holiday system appear likely to continue. It is
obvious that all the problems resulting from Golden Weeks travelling can not be
ignored; however, the impacts of Golden Weeks both on China’s economy and
56
Chinese life should be taken into account by the policy makers. Golden Weeks have
offered great opportunities for economic restructuring and employment expansion in
popular tourist destinations. The goal of the Chinese government in setting up the
Golden Week system is to assist China’s 1.3 billion people to enjoy the holiday. In
particular, this system acts as a guarantee for employees of private enterprises in
China to have and to enjoy their holiday rights. Therefore, in order to solve the
Golden Weeks’ problems, simply cancelling the system is not a solution. As it is a
policy for the whole nation, it is important to review this system from the perspective
of the Chinese people. In brief it is necessary for the policy makers to listen to what
the general public are saying about their Golden Weeks’ travelling.
The research components of this chapter initially present Chinese concerns about
seasonality based on demographic factors. In this section, the respondents are divided
into groups according to their demographic profiles – residence, gender, age,
education level, occupation and level of income. Within each demographic category,
the means of their ratings on 20 seasonality influences are compared among the
groups. The next section focuses on the Chinese attitudes towards Golden Weeks
travelling. The advantages and disadvantages regarding their travelling experiences in
each Golden Week will be identified. Finally the respondents will be divided into two
groups based on two different categories of previous travelling experiences – frequent
travellers versus infrequent travellers, and Golden-week tourists versus non-Goldenweek tourists. Within each category, their perceptions and attitudes towards
seasonality and Golden Week travelling will be compared.
3.3 Data and methodology
3.3.1 Questionnaire design
The questionnaire in this study was developed with the aim of providing basic
information about Chinese views of seasonality influences and their attitudes towards
travelling in the Golden Weeks. The questionnaire followed a largely structured
format with mostly closed-ended questions, but also contained a limited number of
open-ended questions. It has been argued that survey questionnaire designed with
some open-ended questions effectively supplements researcher driven categories and
options (Lazarsfeld et al, 1944; Mckennell, 1974; Moser & Kalton, 1971; Schuman &
Presser, 1996).
57
The questionnaire contained three main sections.
Part A began with gathering
demographic information from respondents, including their age, gender, education,
occupation, income level and their previous travelling experiences both domestic and
international. Part B sought to identify how strongly the seasonality factors influence
the respondents’ decision making on when to travel. It was presented as a structured
table with a seven-point Likert type scale (from “not strongly at all” to “very
strongly”) for each variable. Those variables were constructed according to the two
major factors – natural and institutional as well as other factors that influence the
seasonality patterns. The final part of this questionnaire used open-ended questions
which asked respondents about the advantages and disadvantages of travelling in each
Golden Week.
3.3.2 Data collection and sampling
The questionnaire was administered to Chinese respondents in China. It was first
constructed in English and then translated into Mandarin. Then the translation was
verified by back-translating the questionnaire into English to correct any expressions
lost in the translation process and to improve the reliability of the translation
(Graciano, 2001). Finally the responses were translated back into English for coding.
The full-scale survey was conducted between early April and late September, 2007.
Five major Chinese tourist locations were chosen for the distribution of the
questionnaire: Beijing, Shanghai, Xi’an, Quanzhou and Guangzhou & Guangxi
province. The five places were chosen for two reasons: one is that they are all popular
tourist places in China, the other is that the selection covers different parts of China –
North (Beijing), East (Shanghai), West (Xi’an) and Southeast (Quanzhou and
Guangzhou & Guangxi province).
Due to time and cost constrains and anticipated response rates, the questionnaires
were distributed through a snowball sampling method. Each of the researcher’s
friends in the six places was given 10 copies of the questionnaire. Those friends
include students in universities, employees in private companies or government, or
businessmen who are self-employed. They completed one by themselves, and were
asked to distribute the others to their family members and their colleges in the study
58
locations. The aim of using the snowball approach was to target a group of people
with diverse ages. The contacts of the researcher were studying or working in
different areas which helped to contact respondents with different educational and
travel backgrounds. The completed surveys were collected from the contacts within
two weeks of the initial distribution.
A total of 530 copies were distributed in the five locations, 100 each in Beijing,
Shanghai, and Quanzhou, 110 in Xi’an and 120 in Guangzhou & Guangxi Province.
These figures were based on the feedback from the distributing personnel and a
planned effort to reach tourists in each location. Out of 100 copies of the
questionnaire distributed in Beijing, 5 questionnaires were not returned and 9
questionnaires were invalid either because they were empty or uncompleted; out of
100 questionnaires distributed in Shanghai, 15 questionnaires were not returned and
11 questionnaires were invalid either because they were empty or uncompleted; out of
110 questionnaires distributed in Xi’an, all were returned and 6 questionnaires were
invalid either because they were empty or uncompleted; out of 120 questionnaires
distributed in Guangzhou & Guangxi province, 27 questionnaires were not returned
and 11 questionnaires were invalid either because they were empty or uncompleted;
and out of 100 questionnaires distributed in Quanzhou, all were returned and valid.
The overall response rate was 84%. Table 3.2 summarises the key statistics for survey
completions.
Beijing
Table 3. 2 – Questionnaire distributions
Number
Number
Number
not Total
distributed returned returned
or rate
invalid
100
86
9
86%
Shanghai
100
79
26
74%
Xi’an
110
104
6
95%
81
38
68%
Survey
distributions
Guangzhou & 120
Guangxi
Province
Quanzhou
100
100
0
100%
Total
530
450
79
85%
59
response
3.3.3 Data analysis methods
SPSS was used to assist data analysis in this study. There were several methods
applied in the analyses according to the different types of data available and different
purposes for each individual part.
First, the respondents’ demographic profiles were described by frequency, which
provides numbers and percentages for each sub-group. Secondly, one-way ANOVA
was employed to compare the means of respondents’ ratings on the 20 seasonality
influences for each demographic group. For the gender comparison, the t-test was
used as there were only two groups. Then there is a detailed description of Chinese’s
travelling experiences in each of the Golden Weeks, including advantages and
disadvantages. The last section explained travellers’ perceptions of seasonality and
Golden Week tourism, by linking to their previous travel experiences – frequent
tourists versus non-frequent tourists and Golden-week tourists versus non-Goldenweek tourists. It employed a cross tabulation, which was used to present the
demographic characteristics for groups based on their previous travel experiences and
Chi-square was applied to test the significances of the differences. Additionally,
discriminant analysis was applied to assess which of the 20 seasonality influences
contribute most to differentiate groups with varied travel levels – frequent tourists
versus non-frequent tourists. The application of the discriminant analysis was
selectively applied in this research to the variable of travel experience which has been
shown to be one of the most effective integrating factors linking traveller
characteristics (Pearce & Lee, 2005). Finally a descriptive appraisal of the perceptions
of the advantages and disadvantages of travelling in Golden Weeks between GoldenWeek tourists and non-Golden-Week tourists was constructed using frequencies and
plots of the factors reported by the two groups.
3.4 Results and discussion
3.4.1 Demographic profiles of respondents
Table 3.3 presents the information concerning the respondents’ demographic profiles.
The sample consisted of 48.4% males and 51.6% females. In terms of age, most of the
respondents (66.0%) fell into the “18 - 30” group. While this distribution reflects the
snowball approach used, it is broadly consistent with the demographics of the cities
studied (National Bureau of Statistics of China, 2009; Zhang, 2005) since this age
60
group is a dominant part of the Chinese urban population. The others (44.0%) were
from the older age groups, with 23.6% from the “31 - 45” group and 10.4% from the
“more than 45” category.
In terms of education, only 16.0% of the respondents had not completed high school
or the high school degree while 20.0% of them had been awarded the technical or
vocational certificate. Around 17.1% of the respondents were still undertaking their
university courses. A larger group (38.7%) had finished their university undergraduate
degree while only a small number had obtained or were undertaking their post
graduate degree, either at the masters or doctoral level.
The occupation of the respondents included various fields. A number of them were
professionals/lecturers (24.4%) and a number students (21.6%). There were also
smaller groups of clerical worker and labourers. In terms of income, the majority of
them (37.1%) earned between ¥500 and ¥2000 (RMB, Chinese currency) per month,
followed by 26.0% earning between ¥ 2001 and ¥ 8000 and 14.9% more than
¥8000. A further 18.9% of the respondents had no income, which can be interpreted
as largely due to their student status.
61
Demographic
Table 3. 3 – Respondents’ demographic profiles
Frequency (N=450)
Percentage (%)
profiles
Gender
Age
Education level
Male N=218
48.4
Female N=232
51.6
18 ~ 30 N=297
66.0
31 ~ 45 N=106
23.6
More than 45 N=47
10.4
High school degree or under N=72
16.0
Technical / Vocational N=90
20.0
Current university student N=77
17.1
University graduate N=174
38.7
Post graduate (master/doctorate) N=29 6.4
Others N=8
Occupation
Executive
1.8
/
Government
position 11.1
N=50
Income
Professional / Lecturer N=110
24.4
Business N=38
8.4
Skilled worker N=34
7.6
Labour / Famer N=16
3.6
Student N=97
21.6
Office / Clerical N=67
14.9
Other N=38
8.4
No income or less than RMB ¥ 500 18.9
N=85
RMB¥500 ~ RMB ¥2000 N=167
37.1
RMB ¥2001 ~ ¥8000 N=117
26.0
More than ¥8000 N=67
14.9
Other N=14
3.1
3.4.2 Previous travelling experiences
Table 3.4 presents the number of places that the respondents had visited both within
China and overseas. When the respondents were asked how many Chinese cities they
62
had visited, most of them (44.2%) responded with the answer of five or more. Fortythree percent had travelled to two to four Chinese cities, with 16.2% to four places,
14.4% to three places and 12.7% to two places. There were still 12.4% of respondents
with little travel experience within China, 6% had travelled to just one place and 6.4%
had never travelled within China.
When describing their previous overseas travelling experience, more than two thirds
of the respondents (69.3%) said they had never travelled overseas before. This reveals
that the Chinese lack overseas travel experiences. This finding confirms previous
studies which mentioned that the Chinese had limited outside world experiences
(Chang, 2007; Wei, et al. 1989). Among those respondents with overseas travel
experiences, 17.3% of them had travelled to one foreign country or place; 9.4% had
travelled to two to four places (6.7% - two, 1.6% - three, 1.1% - four); and 4.0% had
travelled to five or more foreign countries.
No.
of 0
Table 3. 4 – Number of places the respondents had visited
1
2
3
4
5 or more
places
Within
29
27
57
65
73
199
China
(6.4%)
(6.0%)
(12.7%)
(14.4%)
(16.2%)
(44.2%)
Overseas
312
78
30
7
5
18
(69.3%)
(17.3%)
(6.7%)
(1.6%)
(1.1%)
(4.0%)
With respect to the times during which they travelled, the respondents provided
different responses for travelling within China and for travelling overseas. For the
responses to travelling within China, the majority (42.6%) said that they normally
travelled during three Golden Week holidays, with 6.0% on Chinese New Year,
20.7% on May Day and 16.2% on National Day holiday respectively. For the school
holiday period, 33.1% of the sample indicated they travelled in this period. As
mentioned before in the introduction of this chapter, the school holiday, particularly
the summer holiday is an ideal time for travelling over an extended time period and
enjoying better weather. Working leave is another good option for the Chinese to
travel within China, fitting 21.3% of the responses in this sample. Only 14.0% of the
respondents undertook their domestic travelling on weekends. Another 21.3%
63
responded to this question with “other”. Among those who specified “other”, “on
business travel” was the most frequent answer. Some respondents specified “other” as
“just took a break whenever I wanted to”.
The situation is completely different in the responses to the time spent travelling
internationally. As most of respondents had little international travelling experience,
the majority (71.1%) of answers to this question were “other”, and “other” here was
specified as “never travelled internationally before”. Working leave is the time taken
most (13.3%) by those who had travelled internationally, followed by school holiday
(10.0%). Only 7.6% of respondents travelled internationally during the three Golden
Week holidays, with 2.0% on Chinese New Year, 2.7% on May Day and 2.9% on
National Day holiday respectively. This may due to the expensive cost of travelling
internationally. The seven-day holiday is long enough for Chinese to go abroad, but
most of them can not afford to travel abroad and would rather travel within China due
to financial issues. Only 1.6% stated that they undertook international travel on
weekends. The two-day weekend only offers the opportunity to travel to neighbouring
countries.
Travel time
Table 3. 5 – The time periods for Chinese travellers*
Within China
International
Weekends
63 (14.0%)
7 (1.6%)
Chinese New Year holiday
27 (6.0%)
9 (2.0%)
May Day holiday
92 (20.4%)
12 (2.7%)
National Day holiday
73 (16.2%)
13 (2.9%)
School holiday
149 (33.1%)
45 (10.0%)
Working leave
96 (21.3%)
60 (13.3%)
Others
96 (21.3%)
320 (71.1%)
(*Note: as this was a multiple-answer question, respondents could choose as many
answers as apply to them, the total number of responses here exceeds the sample
number 450.)
3.4.3 Overview of seasonality influences
Table 3.6 presents the mean value for the itemised factors shaping seasonality. The
results indicate that overall, personal factors influence the respondents’ decision64
making most concerning when to travel (mean = 4.67), followed by the natural factors
(mean = 4.62). The mean values for institutional factors and social factors are less
than 4.00, with 3.96 and 3.22 respectively. But within the institutional factors, the
mean value for Golden Weeks is above 4.00 (mean = 4.15), which indicates that
Golden Weeks act as a significant factor influencing respondents’ decision-making
for when to travel. It seems that social factors have least impact on respondents’
decision-making for choosing their travel time.
When looking into the single influence, the most powerful one is “crowding” (mean =
5.65). This may due to the large population of China. It is almost impossible to image
1.3 billion people travelling at the same time. Most of the respondents would have had
an experience of the “crowding” problem in their previous travelling experience. The
next two factors influencing the choice of travel period were the “amount of rain”
(mean = 5.45) and “very high temperature” (mean = 5.44). These data indicate that
when people were deciding on their travelling time, they would strongly consider wet
weather and very high temperatures. The mean value for the remaining influences is
less than 5.00. However, the figure for “overall cost (transport and accommodation)”
is quite close to 5.00 (mean = 4.92), which indicates that money is still an important
influence for the Chinese people when they are making a decision on when to travel.
The “very low temperature” (mean = 4.84), the “travel companions” (mean = 4.63)
and the “standard of service at the time of the year” (mean = 4.53) are also
considerable factors for shaping the time to travel. By way of contrast, the “religious
and cultural factors”, the “special events” and the “amount of sunshine” were less
powerful in influencing people’s decision-making concerning their travelling time,
with mean values of 3.00, 3.12 and 3.21 respectively. This result indicates that the
Chinese people are not strongly influenced by the religious and cultural factors in
their travelling time decision making.
65
Natural
Table 3. 6 – The overall means for seasonality influences (N=450)
Mean Institutional Mean Personal
Mean Social
Mean
4.62
factors
3.96
factors
4.67
factors
3.22
Amount of 5.45
School
3.64
Your favourite 3.82
Fashion
3.53
rain
commitments
Very high 5.44
Work
Special
3.12
temperature
commitments
factors
Very
low 4.84
temperature
Long
time to travel
3.93
Time available
4.46
events
3.71
Overall
cost 4.92
weekend/
(transport
public
accommodation)
4.18
3.00
and
&
cultural
factors
holiday
High
Religious
Golden
Mean Travel
4.63
humidity
Weeks
4.15
companions
Amount of 3.21
Celebrating
4.34
Standard
sunshine
Chinese
service at the
New Year
time
of
of 4.53
the
year
Celebrating
4.07
Crowding
5.65
May Day
Celebrating
4.04
National
Day
In the subsequent sections of this chapter, these means are analysed in more detail by
considering the differences among the respondents. The data reported derive from the
results of t-tests or one-way ANOVA on the means of the ratings on seasonality
influences. In the associated tables the two columns on the right hand side of the table
report F values and significant levels resulting from t-tests or one-way ANOVAs. A
significant level α = 0.05 is set for the analysis. Those significant levels with an
asterisk indicate that there are significant differences between groups on that variable.
The Scheffe post hoc test was applied to identify the significant differences among the
means. Means with significant differences received different notations in the
following tables.
66
3.4.3.1 Seasonality influences for respondents from different parts of China
Table 3.7 provides the means for each seasonality influence for respondents from
different parts of China. Based on the places where the surveys were conducted, the
respondents were divided into five groups for this ANOVA analysis – Beijing (group
1), Shanghai (group 2), Xi’an (group 3), Quanzhou (group 4), and Guangzhou &
Guangxi province (group 5).
67
Table 3. 7 – Seasonality influences for respondents from different parts of China
Items
Beijing Shanghai Xi’an
QuanGuangzhou
F
Sig.
zhou
and Guangxi value (*)
Amount of 5.06a
5.72a
5.39a
5.50a
5.63a
2.139 0.075
rain
Very
high 5.43a
5.72a
5.35a
5.26a
5.54a
1.182 0.318
temperature
Very
low 4.71a,b
5.35b
4.70a,b 4.58a
4.98a,b
2.973 0.019
temperature
*
a
a
a
a
a
High
4.17
4.28
4.16
4.06
4.27
0.242 0.914
humidity
Amount of 3.26a
3.39a
3.36a
2.80a
3.32a
1.423 0.225
sunshine
School
3.80a,b
4.29b
3.46a,b 2.82a
4.06b
6.412 0.000
commitments
*
a,b
b
a,b
a
a,b
Work
3.94
4.44
4.15
3.38
3.80
3.292 0.011
commitments
*
a,b
b
a,b
a
a,b
3.65
Long
4.28
3.73
3.28
3.74
2.678 0.031
weekends/
*
Public
holidays
4.13a
Your
4.10a
3.97a
3.32a
3.62a
3.115 0.093
favourite
time to travel
Time
4.72b
5.08b
4.37a,b 3.79a
4.52a,b
5.104 0.000
available
*
Travel
4.90a
4.99a
4.68a
4.15a
4.51a
2.781 0.076
companions
Overall cost
4.65a,b
5.05a,b
5.22a,b 4.41a
5.33b
4.611 0.001
*
Standard of 4.57a
4.76a
4.62a
4.10a
4.69a
2.394 0.050
service at the
time of year
Crowding
5.71a,b
6.13b
5.64a,b 5.35a
5.49a,b
3.672 0.006
*
a,b
a,b
a,b
a
b
Fashion
3.88
3.39
3.35
3.16
3.96
3.702 0.006
*
a
a
a
a
a
Religious and 3.12
2.91
2.91
2.92
3.20
0.460 0.765
cultural
factors
Special
3.20a
3.10a
3.09a
2.82a
3.47a
1.596 0.174
events
4.59a
Celebrating
4.32a
4.45a
4.01a
4.38a
1.189 0.315
Chinese New
Year
Celebrating
4.17a
4.08a
4.30a
3.91a
3.86a
0.837 0.502
May Day
Celebrating
4.02a
4.09a
4.30a
3.92a
3.84a
0.791 0.532
National Day
68
Means with different notations (a versus b) were reliably differently in the Scheffe
post hoc tests.
Among the four dimensions of seasonality influences as categorised in Table 3.6,
there were three items with significant differences in the institutional factors and the
personal factors respectively, while there was one each in the natural factors and the
social factors.
The three items with significant differences in the dimension of institutional factors
were “school commitments”, “work commitments” and “long weekend/public
holidays”. For the item of “school commitments”, Quanzhou respondents showed
significantly lower rating than the respondents from Shanghai and Guangzhou and
Guangxi Province. Considering “work commitments”, the only difference was
between respondents from Quanzhou and respondents from Shanghai, where
Quanzhou respondents put less emphasis than respondents from Shanghai. And for
the item of “long weekend/public holidays”, again the difference existed between the
Quanzhou group and Shanghai group, where Shanghai respondents’ ratings were
considerably higher than Quanzhou respondents. All the groups showed no
differences in opinion toward celebrating the three Golden Weeks.
Half of the six items in the personal factors had significant differences among the
groups. “Time available” was an important factor influencing travel time period for
respondents from Shanghai and Beijing, with the means over 4.50; however, it was
relatively weak in influencing Quanzhou respondents’ travel time period (mean less
than 4.00). Respondents from Quanzhou rated overall cost as less important than
respondents from Guangzhou and Guangxi Province in “overall cost”, and there was
no difference among other groups. Except for Quanzhou, the means for respondents
from the other four locations were more than 4.50. Concerning the problem of
“crowding”, Quanzhou respondents rated this item significantly lower than Shanghai
respondents, while there was no significant difference among other groups. And the
means for all the groups on this item were more than 5.00.
The only item with significant differences among the groups in the natural factors was
“very low temperature”, where Shanghai respondents rated this feature more highly
69
than respondents from Quanzhou. The item “fashion” was the only social factor where
significant differences were found. Here Quanzhou respondents rated fashion lower
than respondents from Guangzhou and Guangxi Province, and there were no
differences among the other groups.
3.4.3.2 Seasonality influences for respondents by gender
Table 3.8 illustrates the views of seasonality influences by different gender groups.
According to the results of the independent t-test, the different gender groups had the
same attitudes towards most of the seasonality influences. Differences only arose
between males and females in two items: “amount of rain” and “school commitments”.
The results showed that females took more consideration of the “amount of rain” than
males when they made a decision on travelling time. But considering the “school
commitments”, males valued it more than females during their decision making. No
significant difference was identified between groups on other seasonality influences.
70
Table 3. 8 – Seasonality influences for respondents by gender
Items
Female
Male
T value
Sig. (*)
Amount of rain 5.68
5.22
3.028
0.003*
Very
high 5.56
5.32
1.705
0.089
temperature
Very
low 4.82
4.86
-0.275
0.783
temperature
High humidity 4.17
4.19
-0.124
0.901
Amount
of 3.13
3.30
-0.916
0.360
sunshine
School
3.42
3.87
-2.173
0.030*
commitments
Work
3.75
4.12
-1.903
0.058
commitments
3.65
3.78
-0.666
0.506
Long
weekends/
Public holidays
Your favourite 3.78
3.85
-0.354
0.724
time to travel
Time available 4.30
4.62
-1.678
0.094
Travel
4.60
4.66
-0.312
0.755
companions
Overall cost
4.97
4.88
0.531
0.596
4.51
0.243
0.808
Standard
of 4.55
service at the
time of year
Crowding
5.70
5.59
0.817
0.414
Fashion
3.54
3.51
0.204
0.838
Religious and 3.81
2.89
1.221
0.223
cultural factors
Special events 3.22
3.01
1.300
0.194
4.49
4.19
1.611
0.108
Celebrating
Chinese New
Year
Celebrating
4.22
3.91
1.700
0.090
May Day
Celebrating
4.20
3.88
1.772
0.077
National Day
3.4.3.3 Seasonality influences for respondents by age
Means of seasonality influences for respondents by age are displayed in Table 3.9
with the F values and significant levels. Based on the age range they provided, the
respondents were divided into three groups for this ANOVA analysis – age 18 - 30
(Group 1), age 31 - 45 (Group 2) and age 46 or older (Group 3).
71
Table 3. 9 – Seasonality influences for respondents by age
18 – 30
31 – 45
46 or older F value
Sig. (*)
of 5.60a
5.34b
4.81a
5.236
0.006*
Items
Amount
rain
Very
high
temperature
Very
low
temperature
High
humidity
Amount of
sunshine
School
commitments
Work
commitments
Long
weekends/
Public
holidays
Your
favourite
time to travel
Time
available
Travel
companions
Overall cost
Standard of
service at the
time of year
Crowding
Fashion
Religious
and cultural
factors
Special
events
Celebrating
Chinese New
Year
Celebrating
May Day
Celebrating
National Day
5.54a
5.35a
5.06a
2.190
0.113
4.89a
4.69a
4.87a
0.570
0.566
4.22a
3.98a
4.38a
1.115
0.329
3.31a
2.87a
3.38a
2.092
0.125
3.93b
3.07a
3.06a
7.933
0.000*
4.14b
3.49a
3.55a,b
4.650
0.010*
3.94b
3.32a,b
3.17a
5.498
0.004*
4.06b
3.40a,b
3.21a
7.470
0.001*
4.85b
3.74a
3.60a
17.594
0.000*
4.90b
4.07a
4.15a
9.290
0.000*
4.95a
4.69b
4.86a
4.41a,b
4.91a
3.85a
0.094
5.723
0.910
0.004*
5.72a
3.68b
3.19b
5.57a
3.33a,b
2.65a
5.36a
2.98a
2.62a
1.544
4.190
4.214
0.215
0.016*
0.015*
3.30b
2.92a,b
2.43a
6.162
0.002*
4.44a
4.25a
3.96a
1.443
0.237
4.21a
3.87a
3.66a
2.457
0.087
4.20a
3.78a
3.62a
3.137
0.056
Different age groups showed the same view on most of the natural factors. There was
significant difference among groups on the only one item, which was the “amount of
72
rain” in the natural dimension. The respondents aged 31 – 45 rated this item
significantly higher than the younger group and the older group, while there was no
difference between the youngest group and the oldest group.
In the institutional dimension, there was no significant difference among age groups
on the influences of celebrating the three Golden Weeks. However, views were
strongly different among different age groups on the other institutional factors. The
respondents aged 18 – 30 rated higher than the other two groups of respondents aged
31 or older on the item of “school commitments”. Rating on the item of “work
commitments”, the oldest group (age 46 or older) showed no difference to the
youngest group (age 18 – 30) and the middle age group (age 31 – 45), but the middle
age group rated work commitments as significantly less important than the youngest
group. Concerning the “long weekends / public holidays”, the middle age group
showed no difference to the other two groups respectively, but significant difference
existed between the other two groups, where the youngest group rated higher than the
oldest group.
In the personal dimension, there were significant differences among age groups on all
the items except two concerns – “overall cost” and “crowding”, which all the groups
rated highly. The youngest group showed higher influence than the other two older
groups on the items of “time available” and “travel companions” while the other two
older groups showed no difference to each other. On the other two items with
significant difference – “your favourite time to travel” and “standard of service at the
time of year”, the middle age group had no different opinion to the other two groups
respectively while differences existed between these two groups. Ratings on both of
the items, the mean for the youngest group was significantly higher than that for the
oldest group.
The age groups had different views on all the three social factors. The youngest group
tended to be more religiously/culturally concerned than the other two groups. On the
other two items – “fashion” and “special events”, the middle age group showed no
difference to the other two groups, but differences existed between these two groups.
The youngest group rated fashion significantly higher than the oldest group on both
items.
73
3.4.3.4 Seasonality influences for respondents by education
Table 3.10 displays the means of seasonality influences by respondents with different
education backgrounds. The F values and significant levels resulting from one-way
ANOVA are also attached to the left of the figure. By responding to the highest
degree they obtained, the respondents were divided into 5 groups – high school degree
or under (Group 1), technical/vocational (Group 2), current university student (Group
3), university graduate (Group 4) and post graduate, including master and doctorate
(Group 5).
74
Table 3. 10 – Seasonality influences for respondents by education
University Post
F
Technical Current
Items
High
university graduates graduates value
school /
degree vocational students
or
under
Amount of 5.65a
5.24a
5.49a
5.57a
5.31a
0.929
rain
Very
high 5.18a,b 5.13a,b
5.36a,b
5.87b
4.97a
5.867
temperature
Very
low 4.49a
4.62a
4.86a
5.19a
4.41a
3.702
temperature
High
4.22a
3.94a
4.18a
4.36a
3.72a
1.430
humidity
Amount of 3.00a,b 2.71a
2.94a,b
3.62a,b
3.72b
4.413
sunshine
School
3.11a
2.97a
3.77a,b
4.02a,b
4.72b
6.471
commitments
Work
3.26a
3.49a
4.01a,b
4.07a,b
5.07b
6.334
commitments
3.39a,b 3.21a
Long
3.83a,b
4.05a.b
4.17b
3.437
weekends/
Public
holidays
3.28a,b 3.14a
Your
4.03a,b,c
4.21b,c
4.52c
7.627
favourite
time to travel
Time
3.42a
3.67a
4.88b
4.93b
5.86b
16.845
available
Travel
3.89a
4.50a,b
4.88a,b
4.90a,b
5.07b
4.434
companions
Overall cost 4.53a
4.19a
5.14a
5.12a
4.59a
2.109
Standard of 3.94a
4.08a,b
4.87b
4.78a,b
4.90b
6.449
service at the
time of year
Crowding
5.07a
5.38a,b
5.94b
5.88b
6.03b
6.684
Fashion
3.04a
3.29a,b
3.82b
3.80a,b
3.24a,b
3.621
2.85a
Religious
2.77a
2.99a
3.10a
3.55a
1.238
and cultural
factors
Special
2.85a
2.97a
3.47a
3.16a
3.17a
1.386
events
4.15a
Celebrating
4.03a
4.57a
4.44a
4.79a
1.517
Chinese New
Year
Celebrating
4.21a
3.74a
3.97a
4.25a
4.07a
1.165
May Day
Celebrating
4.10a
3.69a
3.99a
4.23a
4.14a
1.216
National Day
75
Sig.
(*)
0.447
0.000*
0.130
0.223
0.002*
0.000*
0.000*
0.009*
0.000*
0.000*
0.002*
0.079
0.000*
0.000*
0.006*
0.294
0.238
0.196
0.326
0.303
Respondents with different education backgrounds had the same view on “amount of
rain”, “very low temperature” and “high humidity” when they made a travelling time
decision, however, there were differences among groups on the other two of the
natural factors. For the item of “very high temperature”, there was no difference
among groups of respondents with high school degree only or under that, respondents
with technical / vocational degree and respondents who were current university
students. The different opinions existed between respondents who were university
graduates and those who were post graduates, and the former one rated significantly
higher than the latter one. Regarding the “amount of sunshine”, the different views
were between the groups of respondents with technical / vocational degree and those
who were post graduates, where the post graduates rated higher than the previous ones.
The means of rating on this item showed no statistical difference among the other
three groups.
In the dimension of institutional factors, different groups had no different views on
celebrating the three Golden Weeks factors, but great differences existed among
groups on the other three institutional factors. For the items of “school commitments”
and “work commitments”, post graduates rated higher than respondents with high
school degree or under and respondents with technical / vocational degree; and there
was no difference between current university students and university graduates. When
thinking about the influence of the factor of “long weekends / public holidays”, post
graduates thought it more important than respondents with technical / vocational
degree while there was no difference on the means of rating on this item among the
other groups.
In the personal dimension, all the groups showed the same opinion only on the item of
“overall cost (accommodation and transport)”. Various differences existed among
groups on the other personal factors. For the item of “your favourite time to travel”,
respondents with high school degree or under and technical / vocational workers rated
statistically lower than the respondents who were post graduates; and the respondents
with technical / vocational degree also rated lower than respondents who were
university graduates. The other groups showed no difference on this item. But when
considering the “time available”, there was no different views between the
respondents who obtained only high school degree or under and respondents with
76
technical / vocational degree, and there was no different views among the other three
groups; but the means for the former two groups were significantly lower than the
latter three groups of respondents who obtained higher education degree. Regarding
the “travel companions”, the different views were between the groups of respondents
with high school degree only or under and those who were post graduates, where the
former group rated significantly lower (mean less than 4.00) than the latter group
(mean more than 5.00). There was no difference among other groups. Concerning the
“standard of service at the time of year”, respondents with high school degree or
under rated lower than the respondents who were current university students and post
graduates. On the perception of “crowding”, all the groups rated very high on this
item, with all the means more than 5.00. Significant difference existed among groups,
where the respondents with high school degree only or under rated lower than the
respondents who were current university students, who were university graduates and
who were post graduates.
In the three social factors, all the groups only showed differences on the item of
“fashion”, where respondents with high school degree or under rated lower than
current university students; and there was no difference among other groups.
3.4.3.5 Seasonality influences for respondents by occupation
Opinions of seasonality influences for respondents with different occupations are
illustrated in Table 3.11. By answering what job they are doing, the respondents are
divided into seven groups – executive / governor (Group 1), professional / lecturer
(Group 2), business (Group 3), skilled worker (Group 4), labour / farmer (Group 5),
student (Group 6), and officers / clerical (Group 7).
77
Table 3. 11 – Seasonality influences for respondents by occupation
Item
Executive
/
Governor
Professional
Business
Skilled
worker
Labourer
/ Farmer
Student
Officer /
clerical
F
value
Sig.
(*)
Amount of
rain
Very high
temperature
Very low
temperature
High
humidity
Amount of
sunshine
School
5.50a
5.39a
5.34a
5.47a
5.62a
5.48a
5.31a
0.161
0.987
5.14a
5.72a
5.37a
5.56a
4.62a
5.46a
5.27a
1.838
0.090
4.80a
4.94a
4.87a
5.06a
4.31a
4.95a
4.39a
1.338
0.239
4.38a
4.16a
4.42a
4.53a
4.00a
4.28a
3.79a
1.127
0.346
3.20a
3.03a
4.11a
3.68a
3.50a
3.66a
2.73a
3.063
0.143
3.20a
3.57a
3.21a
3.65a
3.19a
4.87b
3.22a
6.338
3.76a
4.20a
3.45a
4.35a
3.44a
4.46a
3.70a
2.072
0.000
*
0.056
Long
weekends/
Public
holidays
Your
favourite
time
to
travel
Time
available
Travel
companions
Overall cost
Standard of
service at
the time of
year
Crowding
Fashion
3.74a
3.88a
3.18a
4.36a
3.00a
4.12a
3.67a
1.915
0.077
3.86a,b
3.95b
3.95b
3.71a,b
2.38a
4.33b
3.46a,b
3.241
0.004
*
4.22a,b
4.77a,b
4.13a,b
4.38a,b
3.69a
5.52b
3.76a
7.372
4.82a
4.54a
4.68a
4.47a
3.94a
5.21a
4.52a
1.950
0.000
*
0.072
5.26a
4.48b
4.81a
4.71b
5.00a
4.71b
5.00a
4.41a,b
4.81a
3.12a
5.23a
4.80b
4.25a
4.19a,b
2.521
3.211
0.354
0.004
*
5.80a
3.46a,b
5.69a
3.51a,b
5.68a
3.21a,b
5.74a
3.97b
5.06a
2.19a
5.88a
3.85b
5.55a
3.48a,b
1.011
2.732
Religious
and cultural
factors
Special
events
Celebrating
Chinese
New Year
Celebrating
May Day
Celebrating
National
Day
3.02a
3.13a
3.11a
3.06a
2.12a
3.11a
2.79a
0.941
0.418
0.013
*
0.465
3.22a,b
2.87a,b
3.21a,b
3.62b
2.00a
3.53b
3.07a,b
2.862
4.14a,b
4.44b
4.34a,b
4.79b
2.88a
4.56b
4.67b
2.489
3.78a,b
4.08a,b
4.39b
4.79b
2.69a
4.12a,b
4.48b
3.144
3.78a,b
4.00a,b
4.26b
4.94b
2.75a
4.18a,b
4.49b
3.360
commitments
Work
commitments
/ lecturer
For all the groups with different occupations, there was no difference among them on
all the items of the natural factors.
78
0.010
*
0.022
*
0.005
*
0.003
*
In the dimension of institutional factors, the groups showed various differences on
most items, except “work commitments” and “long weekends / public holidays”. The
students put more focus on the item of “school commitments” than all the other
groups while there was no difference among these other groups. Different from other
demographic groups, the groups divided by occupation showed different opinions on
the items of celebrating the three Golden Weeks. For the item of “celebrating CNY”,
the group of labourers / farmers rated significantly lower than three groups who were
skilled workers, students and officers / clericals while there was no difference among
other groups. For the other two items – celebrating the other two Golden Weeks, the
mean for the labourers / farmers again was very low. The statistics showed the
labourers / farmers rated significantly lower than three other groups who were
businessmen, skilled workers and officers / clericals while there was no difference
among other groups.
All the groups hold the same opinion on half of the personal factors, which were
“travel companions”, “overall cost” and “crowding”. For the other three items,
various differences existed among groups. When considering the factor of “your
favourite time to travel”, the labourers / farmers rated significantly lower than
professional persons / lecturers, businessmen and students, while there was no
difference among other groups. For the item of “time available”, the students group
rated highest among all the groups, and the mean for this group was significantly
higher than the labourers / farmers and officers / clericals while the means showed no
significant difference among other groups. For the factor of “standard of service at the
time of year”, the group of labourers / farmers rated lowest among all the groups and
their mean was significantly lower than the means of executives / governors,
professionals / lecturers, businessmen, and the students.
Among the three social seasonality influences, differences existed among groups in
two concerns – “fashion” and “special events”. For the both of them, the labourers /
famers rated significantly lower than the skilled workers and students while there was
no significant difference among other groups. Respondents from different occupation
fields showed no difference on the influence of the religious and cultural factors on
their decision of travelling time period.
79
3.4.3.6 Seasonality influences for respondents by income
Table 3.12 displays the views on seasonality influences from respondents with
different levels of income. Based on their monthly income in Chinese currency, the
respondents are divided into 4 groups – no income or less than RMB $500 (Group 1),
RMB $500 – 2000 (Group 2), RMB $2001 – 8000 (Group 3) and more than RMB
$8000 (Group 4).
80
Item
Table 3. 12 – Seasonality influences for respondents by income
More than F
RMB
No income RMB
value
– RMB
– $2001
or less than $500
$8000
8000
RMB $500 2000
of 5.59a
5.49a
5.50a
5.24a
0.647
Amount
rain
Very
high
temperature
Very
low
temperature
High
humidity
Amount of
sunshine
School
commitments
Work
commitments
Long
weekends/
Public
holidays
Your
favourite
time to travel
Time
available
Travel
companions
Overall cost
Standard of
service at the
time of year
Crowding
Fashion
Religious
and cultural
factors
Special
events
Celebrating
Chinese New
Year
Celebrating
May Day
Celebrating
National Day
Sig. (*)
0.585
5.52a
5.36a
5.67a
5.33a
1.151
0.328
4.87a
4.74a
5.07a
4.78a
0.954
0.414
4.31a
4.12a
4.27a
4.09a
0.381
0.767
3.51a
3.10a
3.12a
3.30a
0.917
0.433
4.47b
3.43a
3.43a
3.48a
5.098
0.002*
4.22a
3.87a
3.90a
3.70a
0.844
0.470
4.07a
3.50a
3.86a
3.63a
1.692
0.168
4.18a
3.54a
3.81a
3.91a
2.149
0.093
5.16b
4.11a
4.27a
4.72a,b
5.891
0.001*
5.01a
4.44a
4.68a
4.66a
1.688
0.169
5.22b
4.72a
5.05b
4.38a
4.25a
4.51a
4.91a,b
4.66a
4.427
0.976
0.004*
0.404
5.78a
3.71a
3.22a
5.47a
3.23a
2.77a
5.79a
3.78a
3.03a
5.78a
3.57a
3.19a
1.743
2.667
1.504
0.157
0.198
0.213
3.68b
2.85a
3.09a,b
3.15a,b
4.294
0.005*
4.62a
4.02a
4.45a
4.49a
2.354
0.072
4.20a
3.76a
4.40a
4.03a
2.771
0.143
4.25a,b
3.69a
4.39b
3.94a,b
3.550
0.015*
81
The one-way ANOVA results showed that people belonging to different income range
had the same opinion on natural seasonality influences when they made decision on
travel time period.
In terms of the institutional factors, differences among groups existed on two items –
“school commitments” and “celebrating National Day”. Respondents with no income
or less than RMB $500 seemed to value “school commitments” more than the other
three groups when they chose travel time period. And the rating on “celebrating
National Day” for respondents with income between RMB $500 – 2000 was
statistically lower than that for respondents with income between RMB $2001 – 8000
while there was no difference among other groups.
In the personal dimension, people with different income levels had different attitudes
on the two factors – “overall cost” and “time available”. For the financial concern,
respondents with no income or less than RMB $500 rated highest for the importance
of the “overall cost” for making decision on their travel time period while the
respondents with income between RMB $2001 – 8000 rated lowest, and their mean
was significantly lower than those respondents with lower incomes. Concerning the
“time available”, respondents with no income or less than RMB $ rated higher than
respondents with income between RMB $500 – 2000 and respondents with income
between RMB $2001 – 8000, and the group of respondents with lowest income show
no difference to the group of respondents with the highest income.
In the area of social factors, all the groups had similar responses on two items –
“fashion” and “religious and cultural factors”. The different opinions existed on only
one social factor – “special events”. Respondents with no income or less than RMB
$500 valued the factor of “special events” more than respondents with income
between RMB $501 – 2000 while there was no difference among other groups.
3.4.3.7 Summary of seasonality influences in terms of demographic groups
Results from one-way ANOVA and t-test showed that significant differences existed
among demographic groups in various aspects of seasonality influences. For the
groups divided by their original places, people from Shanghai generally put more
emphasis on the natural influences, the institutional influences and some of the
82
personal and social influences (time available and crowding); by contrast, people from
Quanzhou rated lower than people from the other four places on most of the 20
seasonality influences. There were not many differences between the gender groups.
Different opinions only arose between male and female when they considered the two
items – “amount of rain” and “school commitments”. The factor of “amount of rain”
influenced females’ travel time decisions making to a greater extent while males
thought more about the factor of “school commitments”. In the age group, significant
differences existed among groups on many items of seasonality influences. The
results obviously showed that the young group (age 18 – 30) rated higher than the
middle age group (age 31 – 45) and the oldest group (age 46 or older) on most of the
seasonality concerns. People with different education backgrounds had different
opinions over many aspects of seasonality influences. Generally speaking, people
with university degrees or postgraduate qualifications rated higher on the institutional
influences, the social influences and the personal influences; while people with high
school degree only or under rated higher than others on the natural influences.
Opinions varied among groups from different working fields. People with different
occupations held the same opinion on the natural influences. However, their attitudes
towards influences on other dimensions varied as their occupations varied. The group
of “labourers /famers” rated lowest on most of those items where significant
differences existed. The group of “students” rated relatively highest on these items –
“school commitments”, “work commitments”, “your favourite time to travel”, “time
available”, “travel companion”, “standard of service at the time of year”, and
“crowding”. Within the last category, people with different levels of income, different
opinions existed in five items – two in the institutional dimension, two in personal
dimension and one in social dimension. The group with no / lower income rated
significantly higher than other groups on those items with significant difference.
Table 3.13 summarises those items with significant differences among groups within
each demographic category. It can be easily seen that all the demographic groups had
different opinions towards the influence of “school commitments”; by contrast, the
opinion on the influence of “high humidity” was the same within each demographic
group, and only the different age groups had different ideas on the item of “religious
and cultural factors” and respondents with different education backgrounds had
83
different opinions on the item of “very high temperature” while respondents from
different locations showed difference on the item of “very low temperature”.
Table 3. 13 – Items with significant differences (indicated by asterisk) among
different demographic groups
Concerns\demographics Origin Gender Age Education Occupation Income
Crowding (M=5.65)
*
*
Amount of rain
*
*
(M=5.45)
Very high temperature
*
(M=5.44)
Overall cost (M=4.92)
*
*
Very low temperature
*
(M=4.84)
Travel companions
*
*
(M=4.63)
*
*
*
Standard of service at
the time of year
(M=4.53)
Time available
*
*
*
*
*
(M=4.46)
Celebrating CNY
*
(M=4.34)
High humidity
(M=4.18)
Celebrating May Day
*
(M=4.07)
Celebrating National
*
*
Day (M=4.04)
Work commitments
*
*
*
(M=3.93)
Your favourite time to
*
*
*
travel (M=3.82)
Long weekends/ Public *
*
*
holiday (M=3.71)
School commitments
*
*
*
*
*
*
(M=3.64)
Fashion (M=3.53)
*
*
*
*
Amount of sunshine
*
(M=3.21)
Special events
*
*
*
(M=3.12)
Religious and cultural
*
factors (M=3.00)
84
3.4.4 Experience in Golden Weeks travelling
As mentioned in the literature review above, travelling in the Golden Weeks is
becoming a controversial topic among the Chinese. The public opinions could be
considered by the policy makers when they make decisions on whether to keep or to
cancel or to make changes to the Golden Weeks system. This study asked the
respondents to express their ideas on the advantages and disadvantages of Golden
Weeks travelling. By summarising their ideas expressed in words, there are 11
advantages and seven disadvantages mentioned for Chinese New Year Golden Week;
seven advantages and six disadvantages mentioned for May Day Golden Week; eight
advantages and seven disadvantages mentioned for National Day Golden Week. Table
3.14, 3.15 and 3.16 summarise the advantages and disadvantages for each Golden
Week resulting from the respondents’ answers.
3.4.4.1 Experience in Chinese New Year Golden Week travelling
Table 3. 14 – Advantages and disadvantages for travelling Chinese New Year Golden
Week
Advantages
Chinese New Year Golden Week
(N=476)
1 (N=122)
Time available
2 (N=71)
Can go travelling with family and friends
3 (N=64)
Full of CNY festive atmosphere
4 (N=51)
Experience different CNY traditions and customs in other places
5 (N=34)
Fewer tourists, not crowded (service/transport/attractions)
6 (N=31)
Escape from VFR
7 (N=26)
Personally like travelling in winter
8 (N=21)
VFR
9 (N=19)
More travelling routes to choose, and more activities to take part in
10 (N=19)
Good weather
11 (N=18)
Relatively lower price, with discounts and concessions
Disadvantages
(N=524)
1 (N=199)
Too many people travelling, short of transport tickets during the
CNY travel season
2 (N=141)
The tradition of CNY is to VFR, no time available for travelling; if
go travelling, will lose the opportunity of getting together with
friends and relatives
3 (N=82)
Too cold, and sometimes it rains
4 (N=64)
Higher prices for travelling and transport
5 (N=20)
The closure of transport and service industry will bring in some
inconveniences
6 (N=15)
Lower level of the quality of service
7 (N=3)
The scenery is not as beautiful as in spring and autumn
85
1 Time available
2 With family and friends
3 CNY atmosphere
4 Different CNY experiences
5 Fewer tourists
6 Escape from VFR
7 Personally like
8 VFR
9 More activities
10 Good weather
11 Lower prices
140
120
122
100
80
71
64
60
51
40
34
31
26
20
21
19
19
18
0
Advantages mentioned for CNY Golden Week
Figure 3. 1 – Frequencies of advantages mentioned by respondents for travelling in
CNY (As every respondent can mention more than one advantage, the total frequency
of advantages mentioned is more than 450. This also applies to the other two Golden
Weeks.)
200
199
1 Too crowded
2 Against CNY traditon
180
160
3 Too cold
141
4 Higher prices
140
5 Closure of transport and service industry
120
100
80
6 Lower service
7 Not beautiful scenery
82
64
60
40
20
20
15
3
0
Disadvantages mentioned for CNY Golden Week
Figure 3. 2 – Frequencies of disadvantages mentioned by respondents for travelling in
CNY (As every respondent can mention more than one advantage, the total frequency
of advantages mentioned is more than 450. This also applies to the other two Golden
Weeks.)
86
There were a lot of advantages mentioned by respondents for travelling in CNY
Golden Week. The most frequently mentioned one was “time available”, mentioned
by near 1/3 of the respondents (122 out of 450). Since CNY was considered as the
most important festival for the Chinese, a parallel to the importance of Christmas in
Western countries, many of the advantages mentioned by respondents were related to
the celebration of CNY. Fourteen point two percent of respondents said that it was
good to travel during CNY Golden Week as it was “full of CNY festive atmosphere”
everywhere; 11.3% respondents referred to “experience different CNY traditions and
customs in other places” and 15.8% said they were happy as they could “go travelling
with family and friends” since most Chinese were on holiday and back home for CNY.
Other advantages were mentioned less than 50 times. Twenty-one respondents said
that CNY Golden Week provided them with a good chance to visit friends and
relatives, while 34 said that going out for travelling during this holiday was a good
way to escape from visiting friends and relatives. As it was a public holiday, this week
turned out to be peak time for travelling. Only a small portion of respondents
considered travelling during this week could experience the three benefits – fewer
tourists (7.6%), lower prices (4.0%) and more activities (4.2%). With regards to the
natural seasonality concerns, 26 respondents said they “personally like travelling in
winter”. “It is good weather” was mentioned just 19 times, which indicated that winter
is not a good time for travelling for most of the Chinese.
With regard to the disadvantages of travelling in CNY Golden Week, nearly half of
the respondents (44.2%) pointed out that one of the big problems was that there were
too many people travelling at the same time which results in crowding and the
shortage of transport tickets. And 31.3% of the respondents agreed that travelling
outside during the CNY was against the CNY tradition, resulting in missing the
chance to visit friends and relatives. This indicated that the Chinese valued their
tradition a lot. The cold weather during CNY was another problem which prevented
people travelling. Eighteen point two percent of respondents said that they did not
want to go travelling as it was too cold, and sometimes it was rainy. Further, 14.2% of
the respondents referred to the higher prices for travelling during CNY. There were
another three disadvantages mentioned by a small portion of respondents. Four point
four percent said the closure of some transport and service industry during the holiday
87
would be inconvenient, 3.3% said they were unhappy with the lower level of service
quality during the holiday, and zero point six percent of them said they did not enjoy
the winter scenery as it was not as beautiful as it was in either spring or autumn.
3.4.4.2 Experience in May Day Golden Week travelling
Table 3. 15 – Advantages and disadvantages for travelling in May Day Golden Week
Advantages
May Day Golden Week
(N=473)
1 (N=179)
Nice weather, neither too cold nor too hot
2 (N=141)
Holiday time is long enough to make a long distance trip
3 (N=45)
Best natural scenery
4 (N=42)
To take a break and relax from stressful work
5 (N=36)
Most of the attractions are well prepared, and most facilities are
accessible, staff are in a positive state (More activities available at
the attractions)
6 (N=27)
Can go travelling with friends and colleagues
7 (N=3)
Fashion
Disadvantages
(N=600)
1 (N=335)
Too crowded at the destinations
2(N=84)
Higher prices than usual on accommodations and transportation
3 (N=59)
Inconvenient transport, accommodation and dinning – hard to buy
tickets
4 (N=53)
Traffic congestion
5 (N=39)
Hot weather
6 (N=30)
Lower level of service standard
88
180
179
160
140
1 Good weather
2 Long holiday time
3 Best natural scenary
4 Relax
5 More activities
6 With family and friends
7 Fashion
141
120
100
80
60
45
42
40
20
0
36
27
3
Advantages mentioned for May Day Golden Week
Figure 3. 3 – Frequencies of advantages mentioned by respondents for travelling in
May Day Golden Week
350
335
1 Too crowded
2 Higher prices
3 Closure of transport and service industry
4 Traffic congestion
5 Hot weather
6 Lower service
300
250
200
150
100
84
59
50
0
53
39
30
Disadvantages mentioned for May Day Golden Week
Figure 3. 4 – Frequencies of disadvantages mentioned by respondents for travelling in
May Day Golden Week
There were seven advantages mentioned by the respondents for travelling during May
Day Golden Week. May Day holiday is in the middle of the year when the spring is
about to end and the summer is approaching in China. As a result, the weather then
was very nice for travelling which was identified by 39.7% respondents as an
advantage of travelling during May Day Golden Week. “Time available for
travelling” was mentioned as an advantage for travelling in the first Golden Week by
89
31.3% of the respondents. The other five advantages were mentioned by no more than
10% of the respondents respectively. As May Day comes at the end of spring and the
beginning of summer, 10% of the respondents said that when travelling during the
May Day holiday they could enjoy the “best natural scenery”. 9.3% referred to this
holiday as a good opportunity and excuse for them to take a break from the stressful
work in the middle of the year. About 8% respondents pointed out that there were
more activities and facilities available during the May Day Golden Week, which
could bring them more fun and make them happier to travel during this time period.
Six percent of the respondents said that one of the benefits was that most of the people
were on holiday so that they could go travelling with families and friends. At last,
only three respondents said they went travelling during this holiday due to the
influence of fashion.
Disadvantages mentioned for this holiday focused almost exclusively on problems
from transportation and attractions. “Too crowded” was mentioned most as a very
serious problem. Nearly three quarters of the respondents said that the worst thing was
the crowding at the destination, while another 11.8% added “traffic congestion” to the
problem list. As a result, it was very hard for travellers to buy the transportation and
accommodation tickets. Thirteen point one percent of the respondents said the
inconvenience of arranging their travel transportation and accommodation frustrated
their travelling mood. “Higher price” was a policy carried out by most tourism
businesses during the peak season, and 18.7% of the respondents said that the “higher
price” on accommodation and transportation during May Day holiday unacceptable.
Even though the price during the holiday was higher than usual, the service standard
was seen as less; a perspective pointed out by 6.7% of the respondents. Besides those
problems arising from destination and transport crowding, a weather-related problem
was mentioned as a disadvantage while travelling during this holiday. Eight point
seven percent of the respondents said that they felt it somewhat hot to travel during
the May Day holiday, although 39.8% considered it as nice weather for travelling, as
illustrated above. This indicated that different people have different feeling towards
the weather at the same time while they were travelling.
90
3.4.4.3 Experience in National Day Golden Week travelling
Table 3. 16 – Advantages and disadvantages for travelling in National Day Golden
Week
Advantages
National Day Golden Week
(N=484)
1 (N=179)
Cool climate for travelling
2 (N=129)
Holiday time is long enough to make a long distance trip
3 (N=48)
To celebrate our country’s great birthday, full of festive atmosphere
4 (N=40)
More activities with discounted prices at the destinations
5 (N=34)
To take a break and relax from stressful work
6 (N=27)
It is time for harvest, can taste various kinds of fruits
7 (N=25)
Easy to get travelling companions
8 (N=2)
fashion
Disadvantages
(N=580)
1 (N=334)
Too crowded at the destinations
2 (N=81)
Higher prices than usual on accommodations and transportation
3 (N=54)
Traffic congestion
4 (N=52)
Inconvenient transport, accommodation and dining – hard to buy
tickets
5 (N=31)
Lower level of service standard
6 (N=15)
Much work to do before the end of the year
7 (N=13)
Bad weather
91
180
160
140
120
100
80
60
40
20
0
179
1 Good weather
2 Long holiday time
3 To celebrate National Day
4 More activities
5 Relax
6 Harvest time for fruits
7 With family and friends
8 Fashion
129
48
40
34
27
25
2
Advantages mentioned for National Day Golden Week
Figure 3. 5 – Frequencies of advantages mentioned by respondents for travelling in
National Day Golden Week
350
1 Too crowded
2 Higher prices
3 Traffic congestion
4 Closure of transport and service industry
5 Lower service
6 Much work to do
7 Bad weather
334
300
250
200
150
100
50
81
54
52
31
15
13
0
Disadvantages mentioned for National Day Golden Week
Figure 3. 6– Frequencies of disadvantages mentioned by respondents for travelling in
National Day Golden Week
Eight advantages were mentioned by respondents for travelling during National Day
holiday. The most frequently mentioned one was the “cool weather for travelling”. As
the National Day is on the 1st October, the weather then is neither hot nor cold which
is just perfect for travelling. Thirty-nine point eight percent of the respondents said
they enjoyed travelling in the cool weather, followed by “holiday time is long enough
to make a long distance trip” (28.7% of the respondents). As National Day is regarded
92
as the birthday of this country, there are celebrations throughout the whole country. In
this case, 10.7% of the respondents said that the fully festive atmosphere would make
their journeys more pleasant. The other five advantages were mentioned by less than
10% of the respondents. Eight point nine percent of the respondents said it was good
to travel during the National Day Golden Week as there were more activities provided
at the destinations, and some of them were even made with a discounted price. Seven
point six percent felt relaxed while travelling as this holiday entitled them to escape
from the stressful work. As the National Day comes in the autumn when most of the
fruits are ripe, 6% of the respondents mentioned that they could have more chances to
taste the natural fruits while travelling around. “Easy to get travelling companion”
was mentioned by 5.6% of the respondents. Only two respondents said that it was
good to travel as it was the fashion.
With regards to the disadvantages mentioned for the National Day Golden Week, the
responses were more or less the same as those for the May Day Golden Week. Most
disadvantages mentioned were related to the problems arising from the large amount
of people travelling out at the same time. Seventy-four point two percent of the
respondents all pointed out that it was too crowded at the destinations, and 12% added
that the traffic congestion was terrible too. Eleven point six percent of the respondents
said it was very hard for them to book their accommodation and transportation during
this holiday. The price was also a big concern for the travellers. Eighteen percent of
the respondents said they could not accept such high prices during this Golden Week.
Although the price was higher than usual, the service quality was not better than usual,
but even worse, as pointed out by 6.9% of the respondents. Early October is quite cool,
but still 2.9% of the respondents said they did not like to go travelling during this
holiday due to the bad weather then. Compared to problems of travelling in May Day,
an additional problem was mentioned for travelling in National Day. As October is
approaching the end of the year, 3.3% of the respondents complained that they had to
make use of this holiday to make up their unfinished work as they did not want to
leave it to the next year.
3.4.4.4 Summary of Chinese experiences in three Golden Weeks travelling
Generally speaking, the Golden Week system is welcome by the public as they get
various benefits from it. The most significant one was that this system provided them
93
time availability which makes their travelling feasible. More than 27% of the
respondents mentioned “time available” as a great benefit for each Golden Week.
Good weather at that time was another considerable advantage mentioned by 39.8%
of the respondents for travelling in May Day and National Day Golden Weeks.
However, as Chinese New Year happens in winter when it is quite cold then in China,
only 4.2% of the respondents mentioned the weather as an advantage for travelling
during CNY Golden Week. The Chinese people have a strong traditional concept,
therefore, they were happy with the CNY holiday as this offered them the chance to
“experience different CNY traditions and customs in other places” (11.3%), to enjoy
the “CNY festive atmosphere” (14.2%) while travelling, and to “go travelling with
families and friends” (15.8%). Other benefits mentioned for May Day and National
Day Golden Weeks were that this holiday system provided “more activities to
participate in” (about 8%) and the opportunity to “take a break and relax” (about 8%).
Another good point resulting from the holiday system was that they “can go travelling
with families and friends”, which was mentioned by about 6% of the respondents for
the two Golden Weeks.
The negative side of Golden Week holiday system consistently arose from the
problem of crowding. More than 74% of the respondents said it was quite a headache
to travel during May Day and National Day Golden Weeks as it was “too crowded”.
Forty-four point two percent of respondents mentioned the crowding problem for
CNY travelling. More than 10% of the respondents mentioned “traffic congestion”
and “inconvenient transport, accommodation and dining” respectively for travelling
during May Day and National Day holiday and these two problems were also the
result of crowding. Another serious problem was their complaints about prices.
“Higher price than usual” was mentioned by 14.2% for CNY, 18.7% for May Day and
18% for National Day. Besides the problems of crowding and higher prices, there
were another two negative features that many of the respondents did not like about
travelling during CNY – “too cold, and sometimes it rains” (18.2%) and “if I go
travelling, will lose the opportunity of getting together with friends and families”
(31.3%). Other problems for travelling during May Day and National Day holiday
were about the standard of service and the weather, but each of them were mentioned
by less than 10% of the respondents.
94
3.4.5 Explaining travellers’ perceptions of seasonality and Golden Weeks
tourism
As mentioned early in this chapter, a part of the questionnaire for this study was
designed to explore the respondents’ previous travelling experience. This was
undertaken by asking the respondents’ domestic and overseas travelling experience in
two ways – how many places they have travelled to and when did they make their
trips. As discussed before, most Chinese have limited overseas travelling experience,
therefore, in this section, the respondents are divided into two groups – frequent
tourists and non-frequent tourists, based on the number of domestic places to which
they have travelled (less than 5 – non-frequent tourists, 5 or more – frequent tourists),
and they are also divided as – Golden Week tourists and non-Golden Week tourists,
based on whether they made their domestic trips during Golden Week holiday or not.
3.4.5.1 Demographic characteristics of groups with different travelling
experiences
1) Frequent tourists versus non-frequent tourists
(1) Residence
Respondents from Shanghai are most likely to be frequent tourists. Among the
frequent tourists, 27.1% of them are from Shanghai. Respondents from Beijing
(22.6%) and Xi’an (20.6%) also are quite frequent travellers. Less than 20% of
frequent tourists are from Quanzhou, and the respondents from Guangzhou and
Guangxi Province are the least likely to be frequent tourists (10.1%). Within each
residence group, more than half of the Beijing respondents and Shanghai respondents
are frequent tourists; however, the situation is different in other three places, with over
60% belonging to the non-frequent tourists group respectively.
95
Table 3. 17 – Residence of respondents: Non-frequent / Frequent tourists
crosstabulation
Non-frequent/Frequent tourists
NonFrequent
Total
frequent
Beijing
Number
41
45
86
%
within
Beijing 47.7%
52.3%
100.0%
respondents
% within non-frequent/ 16.3%
22.6%
19.1%
frequent tourists
Shanghai
Number
25
54
79
% within Shanghai 31.6%
68.4%
100.0%
respondents
% within non-frequent/ 10.0%
27.1%
17.6%
frequent tourists
Xi’an
Number
63
41
104
%
within
Xi’an 60.6%
39.4%
100.0%
respondents
% within non-frequent/ 25.1%
20.6%
23.1%
frequent tourists
Quanzhou Number
61
39
100
% within Quanzhou 61.0%
39.0%
100.0%
respondents
% within non-frequent/ 24.3%
19.6%
22.2%
frequent tourists
Guangzhou Number
61
20
81
&Guangxi % within Guangzhou 75.3%
24.7%
100.0%
Province
&
Guangxi
respondents
% within non-frequent/ 24.3%
19.6%
18%
frequent tourists
Total
Number
251
199
450
%
within
total 55.8%
44.2%
100.0%
respondents
% within non-frequent/ 100.0%
100.0%
100.0%
frequent tourists
Pearson Chi-square
35.544
Sig.
0.000*
(2) Age
According to the statistics, the younger the respondents, the more likely they tend to
be frequent tourists. The number of young (under 31) frequent tourists is more than
six times of that of older (more than 45) frequent tourists. However, there are more
non-frequent tourists than frequent tourist in any age group.
96
Table 3. 18 – Age of respondents: Non-frequent / Frequent tourists crosstabulation
Non-frequent/ Frequent tourists
Non-frequent
Frequent
Total
Not more Number
165
132
297
than 31
% within respondents 55.6%
44.4%
100.0%
not more than 31
% within non-frequent/ 65.7%
66.3%
66.0%
frequent tourists
31 ~ 45
Number
59
47
106
% within respondents 55.7%
44.3%
100.0%
aged 31 ~ 45
% within non-frequent/ 23.5%
23.6%
23.6%
frequent tourists
More than Number
27
20
47
45
% within respondents 57.4%
42.6%
100.0%
more than 45
% within non-frequent/ 10.8%
10.1%
10.4%
frequent tourists
Total
Number
251
199
450
% within respondents 55.8%
44.2%
100.0%
in all age groups
% within non-frequent/ 100.0%
100.0%
100.0%
frequent tourists
Pearson Chi-square
0.060
Sig.
0.971
(3) Gender
Males are more likely to be frequent tourists than females. And there are more nonfrequent tourists than frequent tourists in both male and female groups.
Table 3. 19 – Gender of respondents: Non-frequent / Frequent tourists crosstabulation
Non-frequent/ Frequent tourists
Non-frequent
Frequent
Total
Male
Number
115
103
218
%
within
male 52.8%
47.2%
100.0%
respondents
% within non-frequent/ 45.8%
51.8%
48.4%
frequent tourists
Female
Number
136
96
232
%
within
female 58.6%
41.4%
100.0%
respondents
% within non-frequent/ 54.2%
48.2%
51.6%
frequent tourists
Total
Number
251
199
450
% within respondents 55.8%
44.2%
100.0%
in both gender groups
% within non-frequent/ 100.0%
100.0%
100.0%
frequent tourists
Pearson Chi-square
1.569
Sig.
0.210
97
(4) Education
The university graduates seem to like travelling most, as more than half of the
frequent tourists fall into the university graduates group, followed by the technical /
vocational group (19.6%), the current university students group (12.1%), and the
group with high school degree or under (11.1%); and the post-graduate group is least
likely to travel, composing 5.5% of the frequent tourists. Within each group with
different education backgrounds, only the university graduates group has more
frequent tourists than non-frequent tourists; in other groups, there are more nonfrequent tourists than frequent tourists.
Table 3. 20 – Education level of respondents: Non-frequent / Frequent tourists
crosstabulation
Non-frequent/Frequent tourists
Non-frequent Frequent
Total
High
Number
50
22
72
school
% within respondents with 69.4%
30.6%
100.0%
degree or high school degree or under
under
% within non-frequent/ 20.6%
11.1%
16.3%
frequent tourists
Technical/ Number
51
39
90
Vocational % within respondents with 56.7%
43.3%
100.0%
technical/ vocational degree
% within non-frequent/ 21.0%
19.6%
20.4%
frequent tourists
Current
Number
53
24
77
university
31.2%
100.0%
% within respondents who 68.8%
student
are
current
university
students
% within non-frequent/ 21.8%
12.1%
17.4%
frequent tourists
University Number
71
103
174
graduate
% within respondents with 40.8%
59.2%
100.0%
university graduate degree
% within non-frequent/ 29.2%
51.8%
39.4%
frequent tourists
PostNumber
18
11
29
graduate
% within respondents with 62.1%
37.9%
100.0%
(master/
post-graduate degree
doctorate) % within non-frequent/ 7.4%
5.5%
6.6%
frequent tourists
Total
Number
243
199
442
% within total respondents
55.0%
45.0%
100.0%
% within non-frequent/ 100.0%
100.0%
100.0%
frequent tourists
Pearson Chi-square
26.872
Sig.
0.000*
98
(5) Occupation
Frequent tourists cover all areas of the occupation classification with different
percentages for each one. The largest portion of them is professional / lecturer
(30.7%), followed by student (17.6%), office / clerical (16.1%), and executive /
governor (11.6%). The percentages for any of the others are less than 10.0%, with the
labour / farmer composing the fewest, 1.0%. Within the individual occupation
category, only the professional / lecturer group has more frequent tourists (55.5%)
than non-frequent tourists. This may be due to the fact that the Chinese lecturers have
two school holidays (summer holiday and winter holiday), which provide them with
more time available for more travelling. The different percentages between nonfrequent tourists and frequent tourists do not vary a lot for each occupation category,
except for two groups – labour / farmer (87.5% - non-frequent and 12.5% frequent)
and student (63.9% - non-frequent and 36.1% frequent). The percentages of nonfrequent tourists for each other groups are well above 40%. This shows that the labour
/ farmer group is most likely to be non-frequent tourists, followed by the student
group. Although the student group have two school holidays as the lecturers have,
they presumably have little income which limits their travels.
99
Table 3. 21 – Occupation of respondents: Non-frequent / Frequent tourists
crosstabulation
Non-frequent/Frequent tourists
NonFrequent
Total
frequent
Executive / Number
27
23
50
Governor
% within executives/ 54.0%
46.0%
100.0%
governors
% within non-frequent/ 10.8%
11.6%
11.1%
frequent tourists
Profession Number
49
61
110
al/
% within professionals 44.5%
55.5%
100.0%
Lecturer
/ lecturers
% within non-frequent/ 19.5%
30.7%
24.4%
frequent tourists
Business
Number
21
17
38
% within Businessmen 55.3%
44.7%
100.0%
% within non-frequent/ 8.4%
8.5%
8.4%
frequent tourists
Skilled
Number
19
15
34
worker
%
within
skilled 55.9%
44.1%
100.0%
workers
% within non-frequent/ 7.6%
7.5%
7.6%
frequent tourists
Labour / Number
14
2
16
Farmer
% within labourers / 87.5%
12.5%
100.0%
farmers
% within non-frequent/ 5.6%
1.0%
3.6%
frequent tourists
Student
Number
62
35
97
% within students
63.9%
36.1%
100.0%
% within non-frequent/ 24.7%
17.6%
21.6%
frequent tourists
Office/
Number
35
32
67
Clerical
% within officers / 52.2%
47.8%
100.0%
Clericals
% within non-frequent/ 13.9%
16.1%
14.9%
frequent tourists
Others
Number
24
14
38
% within respondents 63.2%
36.8%
100.0%
in other occupations
% within non-frequent/ 9.6%
7.0%
8.4%
frequent tourists
Total
Number
251
199
450
%
within
total 55.8%
44.2%
100.0%
respondents
% within non-frequent/ 100.0%
100.0%
100.0%
frequent tourists
Pearson Chi-square
16.007
Sig.
0.025*
100
(6) Income
Among the frequent tourists, 30.6% of them are from the less than RMB $ 500
monthly income bracket and RMB $ 500 ~ RMB $ 2000 monthly income bracket
respectively. Twenty-four point nine percent of them belong to the more than RMB $
2000 monthly income bracket. The smallest portion of frequent tourists is from the no
income bracket. Looking at the individual income level, it can e be seen from Table
3.22 that the more income earned, the more likely respondents are to travel. Seventyone point six percent of the people with more than RMB $ 2000 monthly income are
frequent tourists, compared to 28.4% of them are non-frequent tourists. And more
than half of the people with RMB $ 500 to RMB $ 2000 monthly income are frequent
tourists. By contrast, less than 40% of people with no income and less than RMB $
500 monthly income are frequent tourists respectively. This indicates that income is a
key factor facilitating travel in China.
101
Table 3. 22 – Monthly income of respondents: Non-frequent / Frequent tourists
crosstabulation
Non-frequent/ Frequent tourists
Non-frequent
Frequent
Total
No income
Number
58
27
85
% within respondents 68.2%
31.8%
100.0%
have no income
% within non-frequent/ 23.9%
14.0%
19.5%
frequent tourists
Less than Number
108
59
167
RMB $500 % within respondents 64.7%
35.3%
100.0%
with monthly income
less than RMB $500
% within non-frequent/ 44.4%
30.6%
38.3%
frequent tourists
RMB $500 Number
58
59
117
~
RMB % within respondents 49.6%
50.4%
100.0%
$2000
with monthly income
between RMB $500 ~
RMB $2000
% within non-frequent/ 23.9%
30.6%
26.8%
frequent tourists
More than Number
19
48
67
RMB $2000 % within respondents 28.4%
71.6%
100.0%
with monthly income
more than RMB $2000
% within non-frequent/ 7.8%
24.9%
15.4%
frequent tourists
Total
Number
243
193
436
% within respondents in 55.7%
44.3%
100.0%
all income level groups
% within non-frequent/ 100.0%
100.0%
100.0%
frequent tourists
Pearson Chi-square
32.943
Sig.
0.000*
2) Golden-week tourists versus Non-Golden-week tourists
(1) Residence
Most respondents do not travel during Golden Week (72.2%). Among those who
travel during Golden Week, 26.4% are from Xi’an, 22.4% are from Quanzhou and
20.8% are from Beijing. Less than 1/5 of them are from Shanghai (16.8%) and
Guangzhou and Guangxi Province (13.6%). Within each place, more than 65% of the
residencies are non-Golden-week tourists respectively, with Guangzhou and Guangxi
Province are in the leading place (79.0%).
102
Table 3. 23 – Residence of respondents: Non-Golden-week / Golden-week tourists
crosstabulation
Non-Golden-week/Golden-week tourists
Golden-week Total
NonGoldenweek
Beijing
Number
60
26
86
%
within
Beijing 69.8%
30.2%
100.0%
respondents
20.8%
19.1%
% within non-Golden- 18.5%
week/
Golden-week
tourists
Shanghai
Number
58
21
79
% within Shanghai 73.4%
26.6%
100.0%
respondents
16.8%
17.6%
% within non-Golden- 17.8%
week/
Golden-week
tourists
Xi’an
Number
71
33
104
%
within
Xi’an 68.3%
31.7%
100.0%
respondents
26.4%
23.1%
% within non-Golden- 21.8%
week/
Golden-week
tourists
Quanzhou Number
72
28
100
% within Quanzhou 72.0%
28.0%
100.0%
respondents
22.4%
22.2%
% within non-Golden- 22.2%
week/
Golden-week
tourists
Guangzhou Number
64
17
81
&Guangxi % within Guangzhou 79.0%
21.0%
100.0%
Province
&
Guangxi
respondents
13.6%
18%
% within non-Golden- 19.7%
week/
Golden-week
tourists
Total
Number
325
125
450
%
within
total 72.2%
27.8%
100.0%
respondents
100.0%
100.0%
% within non-Golden- 100.0%
week/
Golden-week
tourists
Pearson Chi-square
2.989
Sig.
0.560
103
(2) Age
Looking at the crosstab for age groups below, it can be found that the older the people
are, the less likely they are to be Golden-week tourists. More than half of the Goldenweek tourists are not more than 31 years old (68.0%), followed by 24.0% of them
between 31 ~ 45. Only 8.0% of them are more than 45 years old. Within each age
range group, over 70% of each are non-Golden-week tourists, with the group of more
than 45 in the leading (78.7%, and 71.7% for 31 ~ 45, and 71.4% for not more than
31).
Table 3. 24 – Age of respondents: Non-Golden-week / Golden-week tourists
crosstabulation
Non-Golden-week/Golden-week tourists
Golden-week Total
NonGoldenweek
Not more Number
212
85
297
than 31
% within respondents 71.4%
28.6%
100.0%
not more than 31
68.0%
66.0%
% within non-Golden- 65.2%
week/
Golden-week
tourists
31 ~ 45
Number
76
30
106
% within respondents 71.7%
28.3%
100.0%
aged 31 ~ 45
24.0%
23.6%
% within non-Golden- 23.4%
week/
Golden-week
tourists
More than Number
37
10
47
45
% within respondents 78.7%
21.3%
100.0%
more than 45
8.0%
10.4%
% within non-Golden- 11.4%
week/
Golden-week
tourists
Total
Number
325
125
450
% within respondents 72.2%
27.8%
100.0%
in all age groups
100.0%
100.0%
% within non-Golden- 100.0%
week/
Golden-week
tourists
Pearson Chi-square
1.110
Sig.
0.574
104
(3) Gender
In the gender groups, female are more likely to travel during Golden Week than male.
Among the Golden-week tourists, 53.6% of them are female. And within each gender
group, more than 70% of them each are non-Golden-week tourists. However, the
portion for female (71.1%) is slightly lower than that for male.
Table 3. 25 – Gender of respondents: Non-Golden-week / Golden-week tourists
crosstabulation
Non-Golden-week/ Golden-week tourists
Golden-week Total
NonGoldenweek
Male
Number
160
58
218
%
within
male 73.4%
26.6%
100.0%
respondents
46.4%
48.4%
% within non-Golden- 49.2%
week/
Golden-week
tourists
Female
Number
165
67
232
%
within
female 71.1%
28.9%
100.0%
respondents
53.6%
51.6%
% within non-Golden- 50.8%
week/
Golden-week
tourists
Total
Number
325
125
450
% within respondents 72.2%
27.8%
100.0%
in both gender groups
100.0%
100.0%
% within non-Golden- 100.0%
week/
Golden-week
tourists
Pearson Chi-square
0.290
Sig.
0.590
(4) Education
Among the Golden-week tourists, nearly half of them are the university graduates
(41.6%), followed by technical / vocational (20.8%). Other education backgrounds
occupy less than 20% each, 16.8% for current university students, 13.6% for high
school degree or under, and only 7.2% for post-graduates. Within each education level,
it is the same situation as in other demographic categories, where there are more nonGolden-week tourists than Golden-week tourists. It seems that the higher education
level the group is, then proportionally there is a larger number of Golden-week
tourists (31.0% of the post-graduates are Golden-week tourists while 23.6% of the
high school degree or under are Golden-week tourists).
105
Table 3. 26 – Education level of respondents: Non-Golden-week / Golden-week
tourists crosstabulation
Non-Golden-week/Golden-week tourists
Golden-week Total
NonGoldenweek
High
Number
55
17
72
school
23.6%
100.0%
% within respondents 76.4%
degree or with
high
school
under
degree or under
13.6%
16.3%
% within non-Golden- 17.4%
week/
Golden-week
tourists
Technical/ Number
64
26
90
Vocational % within respondents 71.1%
28.9%
100.0%
with
technical/
vocational degree
20.8%
20.4%
% within non-Golden- 20.2%
week/
Golden-week
tourists
Current
Number
56
21
77
university
27.3%
100.0%
% within respondents 72.7%
student
who
are
current
university students
16.8%
17.4%
% within non-Golden- 17.7%
week/
Golden-week
tourists
University Number
122
52
174
graduate
29.9%
100.0%
% within respondents 70.1%
with
university
graduate degree
41.6%
39.4%
% within non-Golden- 38.5%
week/
Golden-week
tourists
PostNumber
20
9
29
graduate
31.0%
100.0%
% within respondents 69.0%
(master/
with
post-graduate
doctorate) degree
7.2%
6.6%
% within non-Golden- 6.3%
week/
Golden-week
tourists
Total
Number
317
125
442
%
within
total 71.7%
28.3%
100.0%
respondents
100.0%
100.0%
% within non-Golden- 100.0%
week/
Golden-week
tourists
Pearson Chi-square
1.158
Sig.
0.885
106
(5) Occupation
Most Golden-week tourists are concentrated in two areas of work – professional /
lecturer (25.6%) and executive / governor (23.2%), followed by office / clerical
(16.0%) and student (12.8%). Golden-week tourists in other occupation areas are less
than 10% - business (8.8%), skilled worker (7.2%), labour / farmer (4.8%) and others
(1.6%). Looking into separate occupation areas, only the executive / governor group
has more Golden-week tourists (58.0%) than non-Golden-week tourists. For other
occupations, more than 70% of them are non-Golden-week tourists respectively,
except for the labour / farmer group, since 62.5% of them are non-Golden-week
tourists. The student group has the highest portion of non-Golden-week tourists,
because 83.5% of them report not travelling during the Golden Weeks.
107
Table 3. 27 – Occupation of respondents: Non-Golden-week / Golden-week tourists
crosstabulation
Non-Golden-week/Golden-week tourists
Non-GoldenGoldenTotal
week
week
Executive / Number
21
29
50
%
within
executives/ 42.0%
Governor
58.0%
100.0%
governors
% within non-Goldenweek/ Golden-week tourists
Professional Number
% within professionals /
/ Lecturer
lecturers
% within non-Goldenweek/ Golden-week tourists
Number
Business
% within Businessmen
% within non-Goldenweek/ Golden-week tourists
Number
Skilled
% within skilled workers
worker
% within non-Goldenweek/ Golden-week tourists
Labour
/ Number
% within labourers /
Farmer
farmers
% within non-Goldenweek/ Golden-week tourists
Number
Student
% within students
% within non-Goldenweek/ Golden-week tourists
Number
Office/
% within officers / Clericals
Clerical
% within non-Goldenweek/ Golden-week tourists
Number
Others
% within respondents in
other occupations
% within non-Goldenweek/ Golden-week tourists
Number
Total
% within total respondents
% within non-Goldenweek/ Golden-week tourists
Pearson Chi-square
6.5%
23.2%
11.1%
78
70.9%
32
29.1%
110
100.0%
24.0%
25.6%
24.4%
27
71.1%
8.3%
11
28.9%
8.8%
38
100.0%
8.4%
25
73.5%
7.2%
9
26.5%
7.7%
34
100.0%
7.6%
10
62.5%
6
37.5%
16
100.0%
3.1%
4.8%
3.6%
81
83.5%
24.9%
16
16.5%
12.8%
97
100.0%
21.6%
47
70.1%
14.5%
20
29.9%
16.0%
67
100.0%
14.9%
36
94.7%
2
5.3%
38
100.0%
11.1%
1.6%
8.4%
325
72.2%
100.0%
125
27.8%
100.0%
450
100.0%
100.0%
39.568
Sig.
0.000*
(6) Income
Among the Golden-week tourists, the largest portion falls into the bracket of people
with less than RMB $ 500 monthly income (45.5%), followed by the bracket of
108
people with RMB $ 500 ~ RMB $ 2000 monthly income (27.3%). The other two
brackets occupy less than 20% each – 16.5% for the group with more than RMB $
2000 monthly income and 10.7% for the one with no income. There is still a bias
between the portion of non-Golden-week and Golden-week tourists, with more than
65% of them being non-Golden-week tourists within each income bracket. The group
with no income has the highest percentage (84.7%) of non-Golden-week tourists. The
group of people with less than RMB $ 500 monthly income has a slightly lower
portion of non-Golden-week tourists than the other groups (67.1%).
Table 3. 28 – Monthly income of respondents: Non-Golden-week / Golden-week
tourists crosstabulation
Non-Golden-week/ Golden-week tourists
Non-GoldenGolden-week Total
week
Number
No
72
13
85
%
within
respondents
have
no
income
84.7%
15.3%
100.0%
income
% within non-Golden-week/
Golden-week tourists
Less than Number
% within respondents with
RMB
monthly income less than
$500
RMB $500
% within non-Golden-week/
Golden-week tourists
Number
RMB
$500
~ % within respondents with
monthly income between
RMB
RMB $500 ~ RMB $2000
$2000
% within non-Golden-week/
Golden-week tourists
Number
More
% within respondents with
than
monthly income more than
RMB
RMB $2000
$2000
% within non-Golden-week/
Golden-week tourists
Number
Total
% within respondents in all
income level groups
% within non-Golden-week/
Golden-week tourists
Pearson Chi-square
22.9%
10.7%
19.5%
112
67.1%
55
32.9%
167
100.0%
35.6%
45.3%
38.3%
84
71.8%
33
28.2%
117
100.0%
26.7%
27.3%
26.8%
47
70.1%
20
29.9%
67
100.0%
14.9%
16.5%
15.4%
315
72.2%
121
27.8%
436
100.0%
100.0%
100.0%
100.0%
8.975
Sig.
0.030*
109
3.4.5.2 Discriminant analysis of tourists’ perceptions of seasonality between
groups with different travel levels
There were two different travel levels identified in this study. As categorised
previously, people travelling to five or more Chinese places are regraded as frequent
tourists while those travelling to less than five places are non-frequent tourists.
The main objective of this section of the results is to determine the seasonality
variables that contribute most to the distinction between groups with different travel
levels – frequent tourists versus non-frequent tourists. Discriminant analysis is a
statistical technique which is used to investigate and simultaneously describe the
significant differences between two or more exclusive groups on several dependent
variables (Brown & Tinsley, 1983; Diekhoff, 1992; Johnston, 1978; Murphy, 1983;
Pearch & Lee, 2005). Therefore discriminant analysis was applied here to provide an
objective method of comparing the responses. Variables measuring respondents’
feeling towards seasonality influences were examined (The 20 seasonality influences
were listed earlier in Table 3.29).
Table 3. 29 – Variables used in discriminant analysis of groups with different travel
levels (Frequent versus non-frequent)
Classification
Variables categories
Number (20)
Perceptions
seasonality
of 1) Natural factors – amount of rain, very high 5
(7- temperature,
very
low
temperature,
high
point scale for humidity, amount of sunshine
factors influence 2) Institutional factors – school commitments, 6
on
making work commitments, long weekends / public
travelling time – holidays, celebrating CNY, celebrating May
very strongly/not Day, celebrating National Day
at all)
3) Social factors – fashion, religious and cultural 3
factors, special events
4) Personal factors – your favourite time to 6
travel, time available, travel companions,
overall cost, standard of service at the time of
year, crowding
110
It is basically assumed that to achieve optimum results, the distriminant variables are
low in multicollinearity when conducting a discriminant analysis (Diekhoff, 1992;
Pearce & Lee, 2005). In this case, Pearson correlation was used to test the
intercorrelations among the 20 seasonality concerns. All the R values from the
calculation ranged from .065 to .436, which showed relatively low correlations among
the 20 seasonality influences. This result enables their use as discriminant variables in
the discriminant analysis.
Among the various methods of discriminant analysis, the Stepwise Discriminant
Analysis (SDA) was chosen in order to see which variables have the greatest power
for discriminating between groups. All the 20 seasonality influences were entered into
a SDA process. SDA is a technique to calculate discriminant functions with which to
discriminate the groups. Table 3.30 presents the results for the discriminant function.
With an eigenvalue of .028, the function accounted for 100% of the explained
variance. The canonical correlation associated with the function was .164, showing
that the function is related to the group differences. The relatively high value of
Wilk’s Lambda (.973) indicated not a strong separation of the groups. The chi-square
test of Wilk’s Lambda (12.150) showed that the overall separation of groups achieved
using this discriminant function is significant at the level of .002.
Table 3. 30 – Tests of significance of the discriminant functions level
Function Eigenvalue Variance Canonical Wilk’s
ChiSig.
1
.028
(%)
Correlation Lambda
Square
Level
100
.164
12.150
.002
.973
An iterative process of SDA starts with a single variable, calculates the rate of success
for discrimination, adds another variable, calculates the improvement or worsening in
discrimination, adds another variable, and so on until there are no longer any variables
improving the results (Klawiter, 2000). By doing so, this approach chooses which
variables in a data set have the best discriminatory power and which ones are not
useful.
Stepwise procedure resulted in two attributes that were significantly related to
tourists’ travelling frequencies – “overall cost” and “crowding”. Discriminant
111
function coefficients and loadings were examined to determine which related variable
contributes the most to the function. Table 3.31 lists the coefficients and loadings in a
descending order. Given the low intercorrelation among the discriminant variables, an
examination of the standardized discriminant function coefficients suggests that
travellers’ perception of “overall cost” contributes most in discriminating between
groups, followed by their perception of “crowding”. The same result can be achieved
by investigating the discriminant loadings. The unstandardized discriminant function
coefficients were provided to apply to the raw values of the variables for classification
purpose.
Table 3. 31 – Canonical discriminant function coefficients and loadings for the
related variables that contribute the most to the function
Variables
Unstandardized
Standardized
Discriminant
Coefficients
Coefficients
Loadings
Overall cost
.472
.838
.632
Crowding
-.564
-.802
-.586
(Constant)
.864
NA
NA
Tourists
Table 3. 32 – Functions at group centroids
Function
Non-frequent tourists
.147
Frequent tourists
-.186
The functions at group centroids, the mean discriminant scores for each of the
dependent groups, are also identified in the process. The non-frequent-tourist group
has a positive value (.147) while the frequent-tourist group has a negative value (.186). Looking back at Table 3.31, the sign of the coefficients associated with the
influence “overall cost” is positive while that with the influence “crowding” is
negative. This indicates that people with more concern on “overall cost” are more
likely to result in the non-frequent-tourist group. In other words, people who are
concerned more with “overall cost” are less likely to travel. It was not surprising to
find that overall cost had a negative correlation with the tourists’ travelling
frequencies since cost is well established as one of the major barriers to travel (Botha
et al, 1999; Chen & Hsu, 2000; Clark & Downing, 1984; Gilbert & Hudson, 2000;
112
Jackson, 2000; Krumpe & McLaughlin, 1982; Morley, 1994; Nyaupane & Andereck,
2008). The more barriers tourists have, the less frequently they travel. The results
suggest that price cuts could help travel agencies or tourist attractions entice tourists’
spur-of-the-moment demand although the cost constraint has been identified as a
difficult problem to overcome (Nyaupane & Andereck, 2008).
The negative discriminant coefficients associated with the concern “crowding”
revealed that people who perceived “crowding” as a more influential factor are more
likely to be in the frequent-tourist group. People with more travel experiences
considered crowding as a more important factor influencing their travelling time
period than people who did not travel much. Previous studies also suggested that the
crowding issue is a major constraint to leisure travel (Jackson, 2005; Walker &
Virden, 2005). This indicated that crowding was indeed a problem existing in tourism
area and it did affect tourists’ travel experiences, which should be considered by
tourism related authorities and business.
3.4.5.3 Comparison of perceptions of Golden Week travelling between Goldenweek tourists and non-Golden-week tourists
As identified previously in this chapter, people who have travelled during Golden
Week holidays are treated as Golden-week tourists while those who never travelled
during Golden Week are non-Golden-week tourists. In this section, the perceptions of
Golden Week travelling between these two groups will be explored by identifying
their descriptions of the separate Golden Week travel experiences which were
identified for the whole sample earlier in this chapter.
(1) CNY Golden Week
Figure 3.7 and 3.8 present the frequencies mentioned for each variable describing the
advantages and disadvantages by both Golden-week tourists and non-Golden-week
tourists. By examining the tendency of the graph lines, it can be seen that the most
frequently mentioned advantage/disadvantage variable and the least frequently
mentioned advantage/disadvantage variable are quite similar between the Goldenweek-tourist group and the non-Golden-week-tourist group. However, as identified
earlier, there is an uneven distribution of these two groups (Number of Golden-week
tourists = 125; number of non-Golden-week tourists = 325), a plot (Figure 3.9) of the
113
relative frequency of variables mentioned by both groups was applied to further
explore the differences between these two groups.
Golden-week
Non-Golden-week
100
Frequencies mentioned
90
80
86
70
60
52
50
40
30
36
49
33
20
19
18
10
21
13
15
20
11
10
9
10
8
20
14
7
0
Time With family Different
CNY
Fewer
available and friend CNY atmosphere tourists
experience
Escape
More
from VFR activities
Lower
prices
VFR
17
6
2
Personally Good
like
weather
Figure 3. 7 – Frequencies of the advantages of CNY Golden Week by Golden-week
tourists (N=125) and non-Golden-week tourists (N=325)
Golden-week
Frequencies mentioned
160
140
Non-Golden-week
149
120
105
100
80
60
40
53
50
36
20
43
29
21
0
Too Crowded Against CNY
tradition
Too cold
Higher prices
13
7
Closure of
transport and
service
industry
10
5
Lower
services
2
1
not beautiful
scenery
Figure 3. 8 – Frequencies of the disadvantages of CNY Golden Week by Goldenweek tourists (N=125) and non-Golden-week tourists (N=325)
114
Figure 3. 9 – Perceptions of CNY Golden Week – % of variables mentioned
In Figure 3.9, the residuals represent the variations regardless of the number of times
the variable is mentioned. The diagonal line indicates equal mention by both groups.
Therefore, the largest residuals show the greatest differences in the perceptions,
notably with “more activities”, “personally like”, “good weather”, “CNY atmosphere”,
“with family and friend”, “against CNY tradition” and “too crowded”. Six of these
features are more dominant in the perception of non-Golden-week tourists than
Golden-week tourists. Only two of these features were identified as disadvantages of
CNY Golden Week experiences, and other disadvantage variables are quite close to
the equal line. This indicates that irrespective of whether or not the respondents had
previous Golden Week travel experiences, their perceptions of the drawbacks of CNY
Golden Week are relatively similar to each other. However their previous travel
experiences influence their perceptions of the benefits of CNY Golden Week. Six of
the advantage variables are far away from the equal line, two of which are more
dominant in the perception of Golden-week tourists while the other four are more
dominant in the perception of non-Golden-week tourists. It can be found that the two
features – “lower prices” and “more activities” which are more dominant in the profits
of Golden-week tourists are more objective benefits while the other four features are
115
more subjective benefits. It is clear that people believe more in what they have
experienced.
(2) May Day Golden Week
The same procedure as stated in CNY Golden Week was employed to document the
perceptions of May Day Golden Week by the same two groups. The graph lines in
Figure 3.10 and 3.11 show similar tendency of frequencies of the advantage
/disadvantage variables for both groups. A plot (Figure 3.12) of the relative frequency
of variables mentioned by both groups was further examined.
Golden-week
Non-Golden-week
Frequencies mentioned
140
120
127
100
94
80
60
52
40
47
33
32
20
14
13
9
0
Good weather Long holiday
time
Relax
With family
and friends
27
13
9
Best natural
scenary
3
0
Fashion
More activities
Figure 3. 10– Frequencies of the advantages of May Day Golden Week by Goldenweek tourists (N=125) and non-Golden-week tourists (N=325)
Golden-week
Non-Golden-week
Frequencies mentioned
300
250
245
200
150
100
90
59
50
25
0
Too crowded
Higher prices
43
16
Closure of
transport and
service industry
40
13
Traffic
congestion
31
8
20
10
Lower service
Hot weather
Figure 3. 11– Frequencies of the disadvantages of May Day Golden Week by Goldenweek tourists (N=125) and non-Golden-week tourists (N=325)
116
Figure 3. 12 – Perceptions of May Day Golden Week – % of variables mentioned
In Figure 3.12, the largest residuals show the greatest differences in the perceptions of
May Day Golden Week occurring with “relax” and “with family and friends”. More
of the non-Golden-week tourists believed that travelling in May Day Golden Week
made them relax more than did the Golden-week tourists. And the Golden-week
tourists valued more than the non-Golden-week tourists the chance to travel with
family and friend provided by May Day Golden Week. Both of these two features
were identified as benefits of May Day Golden Week. All the disadvantage variables
of May Day Golden Week are on or close to the equal line. This indicates that both
groups have the similar perceptions on the drawbacks of May Day Golden Week.
(3) National Day Golden Week
Again, the same procedure was applied to the perceptions of National Day Golden
Week by two groups. Graph lines in Figure 3.13 and 3.14 show a similar tendency of
frequencies on advantage/disadvantage variables by both groups. A plot (Figure 3.15)
of the relative frequency for variables mentioned was employed to further identify the
different perceptions of National Day Golden Week between the two groups.
117
Golden-week
Non-Golden-week
Frequencies mentioned
140
120
129
100
86
80
60
40
50
43
28
27
21
20
0
Good
weather
Long
To celebrate
holiday time National
Day
More
activities
26
19
8
14
11
12
With family Harvest time
and friends
for fruits
8
Relax
2
0
Fashion
Figure 3. 13 – Frequencies of the advantages of National Day Golden Week by
Golden-week tourists (N=125) and non-Golden-week tourists (N=325)
Golden-week
Non-Golden-week
Frequencies mentioned
300
250
242
200
150
100
50
92
54
27
0
Too crowded Higher prices
39
15
Traffic
congestion
38
14
21
10
8
5
13
2
Closure of Lower service Bad weather Much work to
transport and
do
service
industry
Figure 3. 14 – Frequencies of the disadvantages of National Day Golden Week by
Golden-week tourists (N=125) and non-Golden-week tourists (N=325)
118
Figure 3. 15 – Perceptions of National Day Golden Week – % of variables mentioned
The plot result in Figure 3.15 show the greatest differences in the perceptions
occurring with “relax”, “with family and friends” and “to celebrate National Day”.
Among these three features, two of them are the same with the finding in the
perceptions of May Day Golden Week, including their associations with the two
groups. The additional feature showing differences between groups is “to celebrate
National Day”. In China, the National Day is also named the Great Country Mother’s
Birthday. It is more dominant in the perception of Golden-week tourists than nonGolden-week tourists. Again, these three features were identified as benefits of
National Day Golden Week. All the disadvantage variables are relatively close to the
central line, which indicates that both groups have similar perceptions of the
drawbacks of National Day Golden Week.
(4) Summary of perceptions of the three Golden Weeks by Golden-week tourists
and non-Golden-week tourists
The plots of the relative frequency of variables mentioned for three Golden Weeks by
the two groups – Golden-week-tourist group and non-Golden-week-tourist group
reveal that both groups have relatively few variations in their perceptions of the
drawbacks of Golden Weeks. The differences only appeared for the perceptions of
119
CNY Golden Week. For the benefits of Golden Weeks, various differences occur in
the perceptions of CNY Golden Week while there are only two features in May Day
Golden Week and three in National Day Golden Week. CNY is a traditional festival
in China and is regarded as the most important festival in China.
3.5 Conclusion and implications
This study examined the attitudes towards seasonality and Golden Week tourism from
the Chinese travellers’ perspective. It is found that different seasonality influences
influence visitors’ travel time choices. Among the four categories of seasonality
influences identified – natural, institutional, personal and social, the personal
influences were found to be the most influential. Personal influences included costand time-related constraints and the crowding issue which were suggested to be
among the most widely and intensely experienced constraints (Jackson, 2000; Jackson,
2005; Walker & Virden, 2005).
Also, the crowding issue and the higher prices were identified by the Chinese
travellers as the top two problems resulting from the Golden Weeks in this study. On
the other hand, the long holiday time resulting from the Golden Week system was
identified as the top benefit that this system provided for the Chinese citizens.
This study further explained the perceptions of seasonality from the perspective of
travellers with two different travel histories – frequent tourists and non-frequent
tourists. The findings again showed that travellers with different travel experiences
had different perceptions of seasonality particularly with the crowding and cost issues.
A further perspective on seasonality and Golden Week tourism will be explored from
the Chinese tourism managers’ perspective in the final study in the next chapter.
120
Chapter 4 – The perspectives of tourism managers
towards seasonality and the Golden Weeks tourism
(Study 3)
Chapter structure
4.1 Introduction
- 4.1.1 Management of seasonality issues
- 4.1.2 Management of Golden Week tourism issues
4.2 Research gaps and study objectives
4.3 Method
- 4.3.1 In-depth interview
- 4.3.2 Profiles of businesses interviewed
- 4.3.3 Discourse analysis
4.4 Results and discussion
- 4.4.1 Views of the six seasonality patterns
•
4.4.1.1 Views of the plateau pattern
•
4.4.1.2 Views of the plain pattern
•
4.4.1.3 Views of the basin pattern
•
4.4.1.4 Views of the single-peak mountain pattern
•
4.4.1.5 Views of the multi-peak mountain pattern
•
4.4.1.6 Views of the rolling hills pattern
- 4.4.2 Views about the advantages that Golden Week brings in to their business
- 4.4.3 Views about the disadvantages that Golden Week brings in to their
business
- 4.4.4 Managers’ previous/ existing Golden Week promotions
•
4.4.4.1 Hotel and catering
•
4.4.4.2 Transportation
•
4.4.4.3 Travel agency
•
4.4.4.4 Attractions
- 4.4.5 Managers’ expectations of Golden Week by related tourism stakeholders
– government, tourism business and tourist
•
4.4.5.1 Expectations of government
121
•
4.4.5.2 Expectations of tourism business
1) Travel agency
2) Attractions
3) Hotel and catering
4) Transportation
•
4.4.5.3 Expectations about tourists
1) Before travelling
2) During travelling
3) After travelling
- 4.4.6 Managers’ business planning to attract Golden Week tourists
1) Hotel and catering
2) Transportation
3) Travel agency
4) Attractions
4.5 Conclusion and implications – summary of Study 3
4.1 Introduction
This chapter looks at the phenomenon of seasonality and Golden Week travelling
from the perspective of managers in different tourism areas. This study uses a
qualitative approach where the technique of in-depth interviews with open-ended
questions was applied. The interviewees are managers working in different tourism
areas, including hotel and catering, tourism transportation, travel agencies and tourist
attractions. There are three parts in the interview contents: (1) perception – what
would they do to manage the six seasonality patterns identified in Study One; (2)
reaction – how do they perceive the advantages and disadvantages of the Golden
Week system for their business; (3) planning – what do they expect from tourism
stakeholders, and what will they do in future Golden Weeks. The main objective of
this study is to identify specific views of seasonality and the Golden Week from the
managers’ perspectives.
4.1.1 Management of seasonality issues
Considerable research on seasonality highlights numerous ways to even out the peaks
and troughs (McEnnif, 1992; Owens, 1994; Wilton & Wirjanto, 1998; Yacoumis,
122
1980). The methods discussed include new product developments and new market
segments which all focus on stretching the peak seasons. There are six basic supply /
demand matching strategies identified by Weaver and Oppermann (2000): increase
demand outside peak season, reduce demand in the peak season, redistribute demand,
increase supply in the peak season, reduce supply and redistribute or restructure
supply. These provide a categorisation for both academics and tourism related
business to overview and overcome seasonality issues. However there is lack of
studies to evaluate the impacts of those strategies (Baum & Hagen, 1999). A previous
study carried out on this topic indicated that instead of relying upon visitation
statistics or measures of tourist expenditure, policy decisions and managerial
procedures need to consider how seasonality is conceptualised by tourism operations
and businesses (Duval, 2004).
4.1.2 Management of Golden Week tourism issues
The Golden Week system is a policy issued by the Chinese government to stimulate
consumption, expand domestic demand and improve the quality of people’s life. As
the policy maker, the government acted as a leader to regulate and direct the whole
market. With the supervision and management from the government, the Golden
Week market is maturing. Table 4.1 shows the main characteristics at each step during
the development Golden Week system.
123
Table 4. 1 – Development of Golden Week system
Characteristics in each step
National
Increased travel demand; tourism enterprises short of experience;
Day, 1999
limited variety of products
May
Day, A spontaneous and disorderly state; considerable demand which made
2000
the tourism enterprises ill-prepared; forecasts had been conservative;
prices up in both transportation and accommodation which resulted in
a lot of transport problems and losses for travel enterprises
National
Improved set up of Tourism Information Forecast System, advanced
Day, 2000
notice of leave; travel agencies learnt from previous lessons and made
early preparation; travel not so clustered to the hot destinations,
unpopular destinations started to gain attention, more variety of
products, more dispersed destinations; consumers chose self-assisted
travelling; prices increasing
May
Day, Early peak; more promotions before holiday, well prepared, quality
2001
better managed and looked forward to the long term interest; wider
distribution of hot spots; self-driving tours increasing
National
Extension of time from both the beginning and the end of the holiday;
Day, 2001
formation of two markets – sightseeing market and holiday market;
significant increase in self-driving tours and peri-urban travel
May
Day, Early peak in hot spots, extension of peak period; received a
2002
substantial increase in hot spots, more travelling to the central and
western regions; the two markets – sightseeing and holiday becoming
mature
(Source: Li, et al., 2003)
4.2 Gaps and objectives
As identified in the first study, the seasonality phenomenon exists in Asian tourism,
including China. It is important to consider whether tourism related business and
operations themselves perceive seasonality as a problem and how their businesses
react to seasonality. In this section the six seasonality patterns identified in Study One
were presented to tourism managers to see whether their business conforms to these
patterns. Further managers were asked how they manage seasonality problems in their
business. The impacts of the Golden Week system in China is growing, therefore, the
124
advantages and disadvantages of Golden Week travelling have to be evaluated. Policy
makers could potentially take into account the opinions of all tourism stakeholders.
Earlier the views of tourists’ travelling experiences during Golden Weeks were
explored in Study Two, and this information can serve as a comparison to the
perception of Golden Week travelling from the perspective of managers. Therefore,
the objectives of this study are as follows:
(1) To explore the perception of tourism seasonality from the managers’ view and
summarise their methods in coping with the problems resulting from
seasonality;
(2) To present both the benefits and problems that Golden Week system brings in
tourism related business;
(3) To summarise their successful marketing strategies involving the Golden
Weeks;
(4) To identify their expectations for the future of Golden Weeks; and
(5) To identify managers’ planning toward Golden Week in the future.
4.3 Data and methodology
An interview with open-ended questions was applied in this study. The qualitative
approach of an interview is valuable to identify a range of views and attitudes. Such
approaches help investigate the why and how of decision making. There is a wide
range of qualitative research methods which include in-depth interviews, group
interviews/focus groups, participant observation, ethnography and biographical
research (Veal, 2005). In considering these approaches, the in-depth interview is a
good instrument to explore tourism managers’ views and planning strategies toward
Golden Week, because of its flexibility and the detail it can generate in respondents’
answers (Gomm, 2004).
4.3.1 In-depth interview
In-depth interviews usually refer both to semi-structured and unstructured interviews
(Bryman, 2004). In an in-depth interview, a list of open-ended questions can be
prepared in advance of the interview. In this study, a list of open questions covering
both seasonality and Golden Week travelling was prepared by the researcher. The
open questions provide more room for interviewees to talk about their views and ideas
when compared to providing structured forced choice answers. During the interviews,
125
the managers were encouraged to talk about specific strategies applied in their
business as examples to express their attitudes and perceptions of seasonality and
Golden Week travelling. And as this is a one-on-one interview, unlike a focus group
for example, the views from the interviewees would not influence each other (Gomm,
2004). Table 4.2 provides a list of open questions prepared for interviews.
Section
1. Perception
2. Reaction
3. Planning
4.
Demographic
questions
Table 4. 2 – Question list for interviews
Questions
What would you do to manage these patterns of seasonality?
(Graphs of six seasonality patterns identified in Study 1 attached.)
a. Plateau
b. Plain
c. Basin
d. Single-peak mountain
e. Multi-peak mountain
f. Rolling hills
1) What do you think are the advantages for business of:
a. Chinese New Year?
b. May Day holiday?
c. National Day holiday?
2) What do you think are the disadvantages for business of:
a. Chinese New Year?
b. May Day holiday?
c. National Day holiday?
3) How much planning in terms of special products or services do
you do for Golden Weeks?
1) What do you expect in the future for the Golden Weeks from:
a. The government?
b. The tourism industry?
c. The tourists?
2) What will you do to better meet the challenge of Golden Weeks
travelling?
1) What does your business belong to?
a. Hotel and catering
b. Transportation
c. Travel agency
d. Attraction
2) How long have you managed business?
There are four sections for the interviews, and each of them seeks views about
different topics. Questions in Section One are related to seasonality patterns, and the
responses generated linked to Objective One. Section Two focuses on present
reactions about the Golden Weeks and is applied to meet Objective Two and Three.
The later section identified future issues and was directed at Objective Four and Five.
126
And the last section was simple general business information. These questions were
guidelines only. According to the responses of interviewees, some questions may be
added or taken out, and their sequence might change; however, the main topics
remained unchanged.
Interviews, though, are costly in both time and money. The sampling method should
therefore select interviewees with a high level of representativeness or who are
particularly selected for their specialist knowledge. In this study, business information
was initially obtained from tourism official websites. Then the potential interviewees
were selected and approached by email or telephone. According to their responses, a
time schedule was set up for further interviews.
4.3.2 Profiles of businesses interviewed
Interviews were conducted among tourism related business and operations in China
and they were conducted in Mandarin. In all, 30 interviews were carried out in five
leading tourist places in China. The researcher travelled to the business locations and
conducted the interviews from 20th May 2007 to 20th September 2007. Table 4.3 – 4.6
present the demographic details of the interviewees’ business.
1) Beijing (Northern China):
Table 4. 3 – Demographic details of the interviewees in Beijing
Business name
Business type
Year established
Beijing Tian’an International Travel Agency
Travel agency
1987
Beijing Ocean International Travel Agency
Travel agency
1996
Beijing Temple of Heaven
Attraction
1949
Beijing Xiangshan Park
Attraction
1956
Beijing Beihai Park
Attraction
1925
127
2) Xi’an (Central Western China):
Table 4. 4 – Demographic details of the interviewees in Xi’an
Business name
Business type Year established
Shaanxi Overseas Tourist Co. Ltd
Travel agency
Shaanxi Xi’an Hanguang Joy Hotel
Hotel
1998
and 2006
catering
Shaanxi Xi’an Hyatt Hotel
Hotel
and 1990
catering
Shaanxi Xi’an China Travel Agency
Travel agency
Shaanxi Xi’an Qujiang Huibinyuan Hotel
Hotel
2000
and 2002
catering
Shaanxi Xi’an Beilin Museum (the Museum Attraction
1944
of Xi’an Forest of Stele)
Shaanxi Provincial Museum of History
Attraction
1991
Shaanxi Banpo Museum
Attraction
1953
Shaanxi Xianyang Museum
Attraction
1962
3) Shanghai area (Central Eastern China):
Table 4. 5 – Demographic details of the interviewees in Shanghai area
Business name
Business type Year established
Shanghai Travel Agency
Travel agency
Shanghai Hotel
Hotel
2000
and 1995
catering
Shanghai
Chatian
International
Travel Travel agency
1986
Agency
Shanghai Xinghua Hotel
Hotel
and 2001
catering
Shanghai Longhua Multiple-travel Town
Attraction
1997
Hangzhou Lingyin Temple
Attraction
1954
Hangzhou West Lake
Attraction
1997
Jiangsu Suzhou Zhuozheng Garden
Attraction
1951
Jiangsu Suzhou Tiger Hill
Attraction
1982
128
4) Guangzhou & Guangxi Province (Southern China):
Table 4. 6 – Demographic details of the interviewees in Guangzhou & Guangxi
Province
Business name
Business type Year established
Guilin Wuzhou Mother Dragon Temple
Attraction
1982
Guangxi Weizhou Island National Park
Attraction
2004
Guangxi Xin’ao Marine Transportation Ltd
Transportation
1989
Shipping Transportation
1985
Guangxi
Guilin
Sightseeing
company
Guangxi Yangshuo Xi’jie Hotel
Hotel
and 2000
catering
Guangzhou Shangri-La Hotel
Hotel
and 2007
catering
Guangzhou Travel Agency
Travel agency
n/a
All together, there were seven businesses in the hotel and catering area, two in
tourism transportation system, seven from travel agencies and 14 from tourist
attractions. The resulted interviews thus covered diversity in business types from
across the country.
4.3.3 Discourse analysis
The aim of discourse analysis is to provide a critical understanding of how language is
deployed. It allows the analyst to consider the words, phrases and sentences in a
discourse as evidence of an attempt to communicate the speaker’s or the writer’s
message to the hearer or reader (Brown & Yule, 1983; Gomm, 2004; Xiao, 2006).
There are many ways to interpret how particular kinds of communication are put
together and how these formats convey the meanings inside the communication, such
as analysis by interrogative insertion, membership category analysis and problemsolution discourses (Gomm, 2004). Different researchers use different ways to analyse
discourses according to their specific research purposes.
Discourse analysis is regarded as most successful when used as a method to interpret
rich qualitative texts and records, such as in-depth interviews (Keith, 2006). Basically
the procedure of discourse analysis includes four sequential steps identified by Gibson
129
(2002): (1) editing; (2) identifying and summarizing key words or phrases; (3) making
inferences; and (4) finally grouping inferences under a common theme(s) and subthemes (categorization).
Before proceeding with such an analysis, editing the interviewing transcription is
needed. This is due to the fact that many discourses are not presented in a perfectly
useable form. As mentioned before, the interviews were conducted in Mandarin.
Therefore, editing was done at the same time as the translation.
After editing, the transcript was summarised by identifying key words or phases
which were highlighted with different colours for further analysis. This process can be
considered as a key step in discourse analysis (Gibson, 2002).
Then inferences were derived from the identified keywords and phrases. It is
necessary to be careful when making inferences. The process of making inferences is
to explore the ideas from the responses of the interviewees. Where the meaning of the
key words was unclear, the surrounding text was examined to provide clues as to what
the interviewees might have meant by using these words (Gibson, 2002).
Finally the inferences were grouped under common themes and sub-themes, and then
discussion can be directed at these themes and sub-themes. Themes are common
threads of meaning in the data. Thematic analysis is the usual way to analyse data
from qualitative interviews (Gomm, 2004).The detail and thoroughness of the
approach were the main reasons for employing this form of analysis in the present
study.
4.4 Results and discussion
4.4.1 Views of the six seasonality patterns
In this section, the six seasonality patterns identified in Study One were presented to
interviewees. They were asked about their perceptions of each pattern and how they
managed or would manage such patterns in their business. After translating and
minimal editing, and following the thematic grouping approach in discourse analysis,
the first task was to decide what the themes were (Gomm, 2004). In the discourses
concerning each seasonality pattern, the interviewees generally evaluated how well
130
they thought this pattern applied to their business. The next response was often an
explanation of the reasons driving this pattern. And most of them also suggested some
business strategies to deal with the patterns. Therefore, their responses for each
pattern are grouped into three themes: (1) perception, (2) causes of this pattern, and (3)
business solutions to this pattern.
4.4.1.1 Views of the plateau pattern
Theme
Table 4. 7 – The managers’ perceptions of the plateau pattern
Corresponding inferences
Number
of
inferences
Perception
fit our business(8), not a good model for business(4), 16
never experienced(2), demand exceeds supply(1), not
so bad(1)
reasons for it not being an ideal business pattern – 5
plants and facility(2), carrying capacity is limited(2),
need time to protect and repair the heritage(1)
Reasons
extremely cold climate in December & January(6), 12
holiday system(3), suitable weather for travelling(2),
people’s travelling time preference(1)
Solutions
staff training(4), facility maintenance(3), staff leave 9
arrangement(1), visit frequent customers(1)
introduce some special travel products in winter(e.g. 7
skiing & sightseeing the ice carving in Harbin, spa
tourism
and
marketing(2),
flower
increase
exhibition)(3),
the
do
more
diversity(1),
price
bundling(1)
raise price to control the flow(1), arrange resources 3
rationally(1), not any effective treatment to manage
this phenomenon(1)
According to their responses concerning the plateau pattern, there is no strongly
positive or negative perception from the respondents. Although this pattern shows that
demand exceeds supply, it is not regarded as an ideal model for business. Some of the
131
respondents pointed out directly that this pattern was not the one their business
wanted. There are many reasons for this response. For every business, particularly the
attractions, their carrying capacity is limited making any peaks or overloads
undesirable. Additionally, they need time to repair the facilities and protect heritage
buildings and green areas. Referring to the interviews, it can be seen that those who
said this pattern fits their business are mainly located in the northern part of China
(Beijing and Xi’an); and those who “never” experience this pattern are from the
southern part of China (Guangzhou City and Guangxi Province).
It seems that the plateau pattern is strongly related to the regional geography and
climate, and this can be confirmed by looking at their responses on the causes of this
pattern. The natural factors are the most frequently mentioned reasons for shaping this
pattern. It is very cold at the beginning and at the end of a year in the north of China,
while the weather is quite comfortable for travelling during the middle of a year.
Further the institutional factor is also mentioned as a secondary influence shaping this
pattern. Three Golden Weeks are the three major long public holidays, and two of
them (May Day and National Day) are in the middle of the year. And the long school
summer holiday is in July and August. There is therefore a coalition of environmental
and institutional forces for the Northern and Western businesses.
Managers’ responses to solutions about this pattern can be grouped into three
categories. The first one is how to overcome the dead season at the beginning and at
the end of the year. Holding special events plays an important role here. Successful
examples were mentioned, such as skiing and sightseeing, notably the ice carving in
Harbin, North China. Other effective methods include improving service and
providing products with more diversity. As this pattern is not regarded as an ideal
pattern, the second group of ideas focused on how to reduce the negative effects of the
long peak season. Not many methods were suggested, but one approach was to
increase the price to control the flow during the high season. Another
recommendation was to redistribute supply. Others said there was not any one
effective treatment to manage this phenomenon so far. The last category focuses on
how to make use of the quiet season. Staff training and facility maintenance are two
important tasks for the business. It was also suggested that the low season is a good
time for staff to take a break and to visit important customers for feedback.
132
4.4.1.2 Views of the plain pattern
Theme
Table 4. 8 – The managers’ perceptions of the plain pattern
Corresponding inferences
Number
of
inferences
Perception
not ideal for business(9), detrimental to the sustainable 10
development(1)
stable(3), it’s great if it keeps at a high level(2), easy to 8
run and manage for business(1), higher and stable
income(1), avoid maintaining cost(1)
suits our business(2), hardly experienced(1), not a 7
common type(1), suits tourism in Guangdong and
Hainan Island(1), has both pros and cons(1), the trend
for business(1)
Reasons
at least one or two highlights in a year(2), limited time 10
available for travelling(2), festival activities and
holiday
system(2),
extremely
cold
weather
in
winter(1), dry seasons for shipping(1), travel time
concentrated(1), choice of suitable weather(1)
not much affected by climate(1), more rational to make 2
travel decisions(1)
Solutions
special events(8), strengthen advertising and increasing 14
popularity(1), be prepared at all time(1), staff leave
arrangement(1),
staff
training(1),
visit
VIP
customers(1), facility maintenance(1)
This pattern is regarded as an uncommon one and was hardly experienced by the
managers interviewed. The pattern was described as suiting tourism in Guangdong
and Hainan Island where there is not any extremely cold weather during the year. This
pattern has both advantages and disadvantages for the conduct of business. If the
business falling in this pattern keeps operating at a high level, it is good as it produces
high and stable profits and avoids any maintenance cost. It is considered by many to
133
be a desirable trend for business income. Although this pattern looks stable and is
likely to be most profitable, many of them did not think it is an ideal model for
business as it can be detrimental to sustainable development due to high pressure on
resources and staff.
This pattern was considered to be the result of stable and desirable climate factors and
a mature market where the customers make their decisions more rationally. Many
other factors, however, make this pattern uncommon in China. The climate is the most
important factor as it changes all the time in most regions, and people prefer to travel
with suitable weather. Another aspect is the institutional factor, particularly the
holiday system. The public holiday system forces people to travel at a concentrated
time. From this perspective it was suggested that if the government can distribute the
holidays more evenly, it is possible to redistribute the peak season.
As it is considered a slightly problematic model for business due to sustained pressure
and no “down time”, special events are highly recommended as an effective tool to
vary the plain pattern. More marketing and advertising on targeted markets were
considered to be helpful. Staff training and facility maintenance were seen as
necessary, whether or not the business adhered to the plain pattern.
4.4.1.3 Views of the basin pattern
Table 4. 9 – The managers’ perceptions of the basin pattern
Corresponding inferences
Number
of
inferences
Perceptions never experienced/not suits our business(13), only 21
experienced in 2003 when SARS broke out(3), not
ideal for business(2), suits Northeast China area(1),
relatively short business time(1), in business cities(1)
Reasons
school summer holiday(5), middle of the year is best 11
time for travelling(2), important events at middle
year(2), wet season for shipping(1), people’s travel
preference(1)
climate(7)
7
Theme
Solutions
target on off-season tourists(1), cut down price(1), 6
offer special products(1), advertising(1), look for new
markets(1), government policy(1)
134
Perceptions of the basin pattern reveal that this is not a typical business pattern. And it
is also not good for business as the business time is relatively short. This pattern suits
tourism in northeast China where the weather is cool in the middle of the year, and in
business cities. However, some businesses in other locations experienced this type of
pattern in 2003 when SARS broke out in March.
The main reason shaping this pattern comes down to the climate. The climate
situation in China makes this pattern one which Chinese businesses do not appreciate,
as it tends to be associated with a slump in activity. Also the school summer holiday
comes in the middle of the year which is a perfect time for people to travel. In
addition, some important events take place during the middle of the year which bring
a lot of tourists. Both of these stimuli to demand can boost the low period of lesser
tourism activity represented by the basin pattern.
Some suggestions are provided on how to better run businesses which conform to this
basin pattern. Price, products and people are three elements for improvements.
Cutting down the price, introducing special products and targeting new markets are
three possible ways to overcome the off-season problems resulting from this pattern.
But when something unexpected happens, like the breakout of SARS in 2003, the first
important thing for the business is to take corresponding actions in line with
government policy.
135
4.4.1.4 Views of the single-peak mountain pattern
Table 4. 10 – The managers’ perceptions of the single-peak mountain pattern
Theme
Corresponding inferences
Number
of
inferences
Perceptions
July - August(10), not ideal for business(4), seldom 25
experienced(2), resorts for summer(1), October(1), an
extreme(1), suits destinations either very suitable or
very unsuitable for travelling(1), family groups(1),
student groups(1), suits our business(1), maintenance
cost(1), staff payments(1)
Reasons
school summer holiday(6), climate(3), beautiful 10
natural view(1)
Solutions
strength supervision(1), guarantee service quality(1), 7
attentions to security issues(1), staff training(1), staff
leave
arrangement(1),
visit
customers
for
feedbacks(1), facility maintenance(1)
raise reputation(2), more marketing strategies(1), 6
create more peaks(1), offer special products(1), target
new markets(1)
This is an extreme pattern in seasonality. In the views of many managers, July –
August is absolutely the peak for tourism in China, particularly for some summer
resorts. This pattern suits those destinations which are either very suitable or very
unsuitable for travelling most time of year. It is not considered as an ideal model for
some business, but others indicated that this pattern did suit their business. For those
who were in this pattern, they found that the majority of their customers in the peak
season were family groups and student groups; and also out of peak season, the issue
of maintenance costs and staff payments can not be ignored.
The reasons for resulting in this pattern are mainly due to the school summer holiday.
The latter holiday period has been seen as its own golden time for most tourism
business. And some natural factors are added to shape this pattern.
136
As it is an extreme pattern, many suggestions were given on how to deal with the peak
time. The safety issue is the most important thing for attention. Secondly the service
quality should be maintained to meet with customers’ satisfaction level. Finally
incentives must be provided for staff. Additionally, there were suggestions about how
to create more peaks for business as most of them were not satisfied with one peak for
a year. Two most effective ways are introducing new products and targeting new
markets. Most managers wanted to create multiple peaks for their business. The
pattern of such multi-peak mountain form will be discussed in the next section.
4.4.1.5 Views of the multi-peak mountain pattern
Table 4. 11 – The managers’ perceptions of the multi-peak mountain pattern
Theme
Corresponding inferences
Number
of
inferences
Perceptions
never experienced(2), not ideal for business(1), often 8
happens in hotel business(1), suits our business(1),
suits destinations where most of time is ideal for
travelling(1), would be better if the peak time can be
extended(1), slack in the week following the peaks(1)
Reasons
Golden Week holiday system(9), school summer 19
holiday(4), climate(3), Chinese tradition – spring
outing(2), environmental issues(1)
Solutions
offer special products(5), improve public image and 15
reputation(2),
promotions(2),
marketing(1),
attract
more
business
research
groups(1),
on
staff
training(1), target special markets(1), staff leave
arrangement(1), safety programme(1)
Perceptions of the multi-peak mountain pattern tend to be more positive compared to
other patterns. Only one of the managers did not agree it was good for business. Many
hotels fall in this pattern. It was expected that each of the peak time periods could be
extended. And if a very slack time occurs in the week following the peaks,
particularly in the hotel industry, there may even be close to zero occupancy for the
following week.
137
The major reason to form the multi peaks is due to the holiday system, such as the
three Golden Weeks and school summer holiday, which provides most with people
time available and their travelling possible. Some of the multi peaks are the results of
Chinese tradition. There is a long history for the Chinese to go out to get involved in
nature in spring. This tradition is named seeking spring, which the Chinese believe
can help them start with a good beginning for the year.
Many ideas were suggested for creating more peaks for business. A good reputation
of the business is a necessary start. Traditional marketing methods, like offering a
variety of products, as well as targeted markets are effective tools. The business
groups are highlighted as an attractive market for the hotel industry. In addition, a
well organized safety programme is strongly recommended. And staff training and
facility maintenance are also important after every peak.
4.4.1.6 Views of the rolling hills pattern
Theme
Table 4. 12 – The managers’ perceptions of the rolling hills pattern
Corresponding inferences
Number
of
inferences
Perceptions
never experienced(10), good for environment and 23
facility(2), not good for business(2), happens in hotel
industry frequently(1), suits destinations in Southeast
China area(1), good for business(1), sustainable
tourism(1), affect business(1), short slack time is
necessary(1), in some years(1), mature business(1),
continuing tourist arrivals(1)
Reasons
climate(2), endless novelty and good ideas(1)
3
Solutions
staff relax(1), facility maintenance(1), extend the peak 6
time(1), introduce wider ranges of products(1), staff
training(1), staff leave arrangement(1)
This is another pattern which was perceived to happen frequently in the hotel industry.
There is a very good perception of this pattern although some of the managers still
hold different opinions. The rolling hills pattern provides a basis for business to
138
develop in a sustainable way. The continuing customers help business keep running,
avoiding any unnecessary cost. Business in this pattern was regarded as mature.
Not many reasons were identified for this pattern. Good climate all the year round is
the basic element. To attract continuing customers, there must be new and special
products provided all the time, which means that the businesses need to be good at
diversifying their offerings.
Recommendations relating to this pattern include introducing a greater variety of
products to extend the peak time. Also, staff training and facility maintenance were
mentioned as a continuing concern, so that the business can develop in a sustainable
way.
4.4.1.7 Summary of perceptions of the six seasonality patterns
Perceptions of the six seasonality patterns varied among managers from different
locations and different industry sectors. None of the six patterns was seen by all as an
ideal model for their business although some of their businesses conformed to specific
patterns. The rolling hills pattern was considered as a trend for mature businesses. For
many managers, one of their main concerns was with the extreme seasonality and how
to both overcome the off season and extend the peak season. According to their
opinions, the natural factors play an important role in shaping most of these
seasonality patterns. As a result, there is not much that the business can do to effect
change. However, the institutional, social and personal factors are not trivial. For the
institutional factors, the holiday system is the most important one. How the
government distributes the national holidays will influence the country’s tourism
seasonality to a considerable extent. For social and personal factors, marketing
methods can be adopted to help business overcome the off season. These approaches
can be based on some Chinese traditions and people’s travelling preference. An
example would be to go to the temple fairs during the Lantern Festival. Special events
are highly recommended by most managers as an effective way to attract customers in
both the peak and off season. Another managers’ concern was how to develop their
business in a sustainable way. Staff training and facility maintenance are always
necessary to be included in the business schedule. Although the aim of business is to
pursue profit as much as possible, many of the managers agreed that all the business
139
should be responsible for environmental issues. Such stated awareness is a promising
sign for sustainable tourism and development in China’s future (Li, 2004).
As identified in the opinions about the six patterns, most tourism managers showed
great interest in creating a peak time for business. The three Golden Weeks are now
the major travelling time for Chinese. In the following section, the views of the
managers when asked about the advantages and disadvantages that the Golden Weeks
bring are recorded. In the corresponding inferences reported in Table 4.13, managers
often provided more than one statement which supported the theme identified in the
discourses.
4.4.2 Views of advantages that Golden Weeks bring to business
Table 4. 13 – Managers’ views of advantages and trends for the Golden Weeks
Theme
Corresponding inferences
Number
of
inferences
more customers(22), higher price(10), more profits(9), 70
Golden
is higher level of satisfaction(4), more expenditure(4),
Week
really golden participate in more activities(3), very welcome by our
to
our business(3),
business.
cover
cost
of
off-season(2),
many
celebration events(2), good cooperation with other
business(2), higher level of service(2), good weather(2),
development
for
business(2),
make
bookings
beforehand(1), increase business recognition(1), make
full use of tourism resources(1)
No
not too many differences from usual(3), no benefits from 4
differences
inbound tours(1)
Trends
family groups(6), overseas travel(2), easy to form and 10
organize tourist groups(1), self-drive travel(1)
As specified in Table 4.13, the responses to the advantages that Golden Weeks bring
into business were grouped into three categories – two current attitudes and one more
broadly based view concerning the future. One of the attitudes is that Golden Week is
140
really golden for businesses, which was supported by a lot of positive statements. The
Golden Week system is welcomed very much by most of the managers. For one thing,
it is obvious that there are more customers during the Golden Weeks. And according
to the government policy, the tourism industries can carry out the peak-season price
policy, which makes the price higher than usual. More customers and the higher
prices result in more profits for business. Further, the Golden Week customers are
seen as being in a positive mood which makes them participate in more activities for
heightened satisfaction. Business benefits from this as there is more expenditure from
customers with fewer complaints. Such outcomes in turn increase the business
reputation. In addition, as all the businesses are very busy during the Golden Weeks,
there is good cooperation with each other in order to improve regional efficiencies.
Different business sectors share useful information which helps them to organize
more activities and serve the customers with a higher level of service quality. Also,
the profit made during Golden Week helps to cover the cost in the off-season. In all,
this holiday system gives benefits to the development of business in diverse ways.
A second but minor theme was provided by managers who stated that the Golden
Weeks made no difference to their business, compared to normal weeks. However,
those who held this opinion only occupy a small portion of the respondents. By
looking at their business profile, it is found that these business paid greater attention
to inbound markets although they did have domestic business as well. One of the
managers suggested that foreign tourists should avoid travelling to China during the
Golden Weeks.
Many respondents pointed out trends in Golden Week travelling characteristics which
are beneficial for their business. One of the most commonly agreed points was that
the Golden Week tourists are mostly family groups. Another trend is that there are
more and more Chinese travelling overseas during Golden Weeks. Although this is
not a new market, there are still only a small number of people travelling overseas
during Golden Week. So there is great potential in developing this market. There is
also an emerging relatively newer, independent market in the domestic business.
There are a growing number of Chinese people who prefer self-drive travelling. The
United Nations World Tourism Organization (UNWTO) (2000) has described the
predominance of self-drive transport internationally. Particularly in Australia and
141
USA, the self-drive market is popular for domestic tourists (Prideaux & Carson, 2003).
A study on self-drive tourism market indicated that self-drive tourism is more popular
where there are multiple overnight destinations and opportunities for a longer length
of stay (Prideaux & Carson, 2003). This provides the tourism industry with an
opportunity to introduce new products with diversity to attract this market.
4.4.3 Views of the disadvantages that Golden Weeks bring to businesses
Table 4. 14 – Managers’ views of the disadvantages that Golden Weeks bring to
business
Theme
Corresponding inferences
Number
of
inferences
Management
short of staff(11), safety issues(8), short of 40
transport(4), too much pressure on staff(4), limited
carrying capacity(3), overuse of facility(3) not
enough parking area(2), not any problem(2), lower
level of service(1), cut down the price(1), low(near
zero) occupancy rate after Golden Weeks(1)
Tourists
lower level of satisfaction(4), more complaints(2), 7
encounter bad experience and impression(1)
Environment
too crowded(9), a lot of rubbish left(8), damage to 24
environment(4), affecting the plants’ growth(2),
uncivilized tourist behaviour will do damage to the
heritage(1)
Although the Golden Week holiday system does bring a lot of benefits to business,
problems still arise due to the concentration of tourists in short time period. Based on
a consideration of the responses by managers, the problems business encounters
during Golden Weeks are categorized into three aspects – management, tourists and
environmental issues.
One of the major problems for managers is that they can be short of staff. In the first
ever Golden Week, all the tourism businesses were shocked by the huge tourist flow.
Although they arranged more staff to work in the following Golden Weeks, the
number of tourists kept growing every Golden Week which made the business short
142
of staff every time. The employment problem exists in all the places where
seasonality is involved. Another major problem in management is the safety issue.
The chance of incidents occurring rises during Golden Weeks. It is hard for business
to control unexpected incidents. Emergency measures are necessary to avoid or
reduce the occurrence of incidents and to ensure the safety of both customers and
property. In addition, the use of facilities is another great concern by management. On
the one hand most of the facilities were overloaded which made them much more
vulnerable and thus increase maintenance costs. On the other hand, there were not
enough infrastructures to accommodate the Golden Weeks tourists, such as car parks
and the public transport. All of these problems are challenges to business management.
Although it was mentioned above that Golden Week tourists were happier than usual,
some managers said that they had more customer complaints during Golden Weeks.
They pointed out that it was hard to maintain customers’ satisfaction, and some
Golden Weeks customers left with bad experience and impressions. These problems
impede business development.
Another substantial concern is related to the environment. Most managers agreed that
everyone, including business and customers should be responsible for environmental
issues. From the business aspect, more customers mean more business. However,
substantial crowds add a burden to environment. For example, a lot of rubbish left by
tourists and uncivilized tourist behaviour during Golden Weeks can spoil the
environment and damage the heritage sites.
These are side effects caused by Golden Week system, and by balancing the positives
and negatives, tourism businesses benefit more from this holiday system rather than
suffer from it. New tourism businesses are eager to get to know about Golden Week
market while the experienced tourism businesses are trying to expand this market. By
looking back and summarising what has been done to manage effectively in past
Golden Weeks, the whole tourism system can know more about this market and learn
from those successful experiences. In the following section, some successful
promotional efforts concerning Golden Weeks in previous years or at the present time
being are discussed.
143
4.4.4 Previous or existing Golden Weeks promotions
Theme
Table 4. 15 – Previous or existing Golden Weeks promotions
/ Corresponding inferences
Number
business type
Hotel
inferences
and cooperate
catering
of
preferential
with
price
travel
agency(3),
system(3),
provide
special 13
extra
services(3), price bundling(2), reduce the number
of business groups and get in more provisional
individuals(1), flexible time for checking in and
out(1)
Transportation
special package(2) –
e.g., special lunch, 4
photography services, more flights(1), more
staff(1)
Travel agency
new tour routes(3), marketing(2), introduce self- 10
assist travel itinerary(2), family-base tour(1), price
bundling(1), advertisements(1)
Attraction
special
events(10),
price
bundling(5),
price 25
adjustment(2), more staff including volunteers(2),
more activities(2), extend open hours(1), provide
souvenirs(1), limit tourist number for protection
purpose(1), free(1)
The responses from managers concerning what their business had done to successfully
deal with Golden Weeks were grouped into four themes by their business types.
4.4.4.1 Hotel and catering
For the hotel businesses the aim is to ensure a high occupancy rate. During the Golden
Weeks, cooperation with travel agencies can bring in several tourist groups and
guarantee high occupancy figures. Discounts and special travel itineraries can be a
boost to customers and ensure business. However, as a condition of cooperating with
travel agents, the hotels have to reduce their prices to be attractive to travel agencies
and their clients. Many hotels tend to carry out such strategies during Golden Weeks.
On one hand, they have often contracted with a travel agency with a part of their
accommodation to guarantee a base occupancy rate; yet again, they keep certain
144
rooms for walk-in customers since during the Golden Weeks, there are also more
individual customers. Also, the hotels have introduced some special products to attract
individual customers. As well as a special preferential price system, the hotels also
provided customers with package accommodation, flexible time for checking in and
out and extra services. The extra services included free breakfast, transfer between
hotels and attractions, transport booking, free city tours, and so on. In summary,
hotels are stimulated by the Golden Weeks period to develop and modify their
products in a variety of ways.
4.4.4.2 Transportation
A shortage of transport was a common problem mentioned by both tourists and
managers. Both the frequency of transport and providing more transport options were
seen as important options. Managers from the transport sector who were interviewed
confirmed these goals as the major tasks for their business during Golden Weeks. In
addition, they also introduced special package for Golden Week customers. The
packages included meals or packages with accommodation. Also, some additional
services were available. For example, in one ship based sightseeing company, there
were professional photographers on board who assisted tourists in taking quality
photographs. Like the hotel sector, managers in the transport business had responded
to Golden Weeks needs in a number of ways but most often with expanded and
specialised services involving packaging.
4.4.4.3 Travel agency
Travel agencies act as an intermediary in tourism and are particularly powerful for
organizing travel in China where independent self-organized travel is only just
beginning (Chen, 2005; Zhang, 1995). There were many ways travel agencies
promoted their Golden Week business. One traditional method used was simply to do
more marketing research and introduce new tour itineraries. Special Golden Week
products were advertised via various ways of media, such as newspaper, travel
magazine, TV, or radio. Attractive flyers were considered by the respondents as
economic and effective tools. As mentioned above, there were trends among Golden
Week travellers – more family groups and more self-drive travelling. In line with the
trends, many travel agencies offered some special packages to meet family needs and
introduced self-assist travel itineraries. New tour itineraries were also created by
145
cooperating with other tourism sectors. One successful example was cooperation
between a travel agency and an airline company. By cooperation, they introduced a
stop-over programme – on the way to Australia from China, it was possible to choose
one country (like the Philippines) to stop over for one or two nights so that customers
can experience another different destination. This was reported as very attractive and
welcomed by Golden Week customers. Again the themes of extra packaging and new
opportunities were a feature of the overall efforts managers reported to deal with
Golden Week opportunities.
4.4.4.4 Attractions
Most responses concerning promotion were from the attraction sector. Among these
promotions by attractions, the use of a special event was the most commonly
employed approach and seen to be the most effective. Combined with local culture
and tradition, special events provided a chance for locals to be involved and for
tourists to experience local life. Extra services provided for visitors were also another
attractive point for tourists. There were a lot of extra services provided which were
well received by Golden Week tourists. Some attractions provided electronic or audio
guides for tourists which can assist tourists travelling around the attraction and also
help reduce the need for more guiding staff. Some attractions offered an information
desk, free tea, a recharger for mobile phones, and automatic shoe-cleaning machines.
All of these additions were designed to make it more convenient for tourists during
their visiting. Other convenient measures include providing tour buses, wheelchairs
for the disabled as well as baby trolleys. Another widely adopted strategy was price
adjustment. But there were two different price strategies applied in the Golden Weeks
– double prices and preferential prices. Generally speaking, the big and well-known
attractions increased prices to make more profits and control the flow while the small
and new attractions preferred to offer a discount price to attract more customers.
The points noted demonstrate that different types of tourism businesses have their
own different strategies and methods to promote Golden Weeks and manage Golden
Week issues. There is a common agreement among all tourism businesses – their
individual power is limited, and cooperation with other stakeholders can help improve
their performance in the Golden Week market. It is appropriate therefore that the
following section probes the topic of what the tourism businesses expected from
146
related stakeholders – government, the tourism business and even the tourists
themselves.
4.4.5 Managers’ expectations of Golden Weeks from tourism stakeholders –
government, the tourism businesses and tourists
Most managers and tourism personnel interviewed held a positive view towards
Golden Weeks development. They tried their best to create a Golden Week market.
Tourism is consistently seen an industry system, and it involves various stakeholders
(Farrell &Twining-Ward, 2004; Gunn, 1994). This means that a single unit cannot
achieve its aim by itself. Instead, the development in tourism necessitates cooperation
among stakeholders. In this section of the research, managers were asked about what
they expected other stakeholders could do for development in the Golden Weeks.
4.4.5.1 Managers’ expectations directed at government
Table 4. 16 – Managers’ expectations directed at the Chinese government
Theme
/ Corresponding inferences
Number
stakeholders
Government
of
inferences
strengthen
supervision
and
management(10), 39
strengthen protection of the ecological environment
/ cultural relic (7), work out and improve holiday
system(7),
develop
sustainable
tourism(4),
strengthen law enforcement(2), cancel the Golden
Week system(2), provide more public tour buses to
attractions(2), policy support on special events(2),
not helpful(2), policy support on promotion(1)
As the policy maker, the Chinese government acts as a supervisor and leader in
Golden Week tourism. First of all, there is still a lot to be done to improve the holiday
system. A more rational allocation of holiday time and more public transport were the
prime concern of tourism business. During the course of this research in 2007 there
was a small change in the holiday system. The second Golden Week – May Day
holiday was reduced to one day, with two new public holidays – one on 5th April
(Qingming Festival) and another one on lunar calendar 15th August (Mid-Autumn
Day). These three single holidays were connected with a two-day weekend to form
147
three long weekend holidays. However, according to the newspaper comments, the
performances of the new holiday system did not satisfy business (Wu, 2009). They
called for the return of the May Day Golden Week while they two new holidays can
still remain. The very fact that the Chinese government changed the holiday system
once does indicate the potential for further modification based on business,
community and research input.
Secondly, the government is expected to strength its supervision and management
over the Golden Week market to ensure everything was undertaken in line with legal
procedures. In the early phase of the Golden Week system, the market was completely
new and certainly a mass market. The regulations set up by the government
encouraged rapid market expansion. Although it is becoming mature, the
government’s leading role in this market is still important and necessary. The
businesses expected the government to overview the whole market and make full use
of its powers. Such efforts include micro management such as regulating tourism
prices, attending to tourism quality and tourism activities as well as macro-issues such
as providing infrastructure and marketing information.
Finally, the managers also expected some policy support from the government. As
mentioned previously, some managers pointed out that the environmental issues
should be considered while developing Golden Week travelling. Here they expected
policy support from government to protect ecological environments and cultural relics.
They believed that the regulations issued by government were powerful. Further
special events were seen as one of the most effective marketing tools. In this case,
many managers believed special events should be supported by government policy
and if this occurs better promotion campaigns will be put in place.
Again, the discourses are not unanimous. A small number of managers interviewed
did not think that the government was of any help to their business. Two of them
expected the government to cancel the Golden Week system. When they were asked
about the reasons, they stated that tourism was part of the market economy which
should develop on its own and avoid interference from government.
148
4.4.5.2 Managers’ expectations directed at the tourists
Theme
Table 4. 17 – Managers’ expectations directed at the tourists
/ Corresponding inferences
Number
Stakeholders
Tourist
of
inferences
be careful of safety issue(6), don’t litter(5), behave 17
35
well – don’t do any damage(3), learn more about
the culture(1), locals give way to outside tourists(1),
have a good sense of timing(1)
don’t make a blindfold decision based on price or 12
fashion(4),
pre-book
transport
and
accommodation(4), be sensible and be aware of
crowding (2), regard Golden Week travelling as a
way to enrich the spiritual life(2)
more
understanding(4),
higher
level
of 6
satisfaction(1), suggestions and advices(1)
Tourists are the targets that all the businesses are seeking to satisfy and from whom
they draw their profits. However, as one of the stakeholders involved in tourism,
tourists were also expected to contribute to making the system work. The expectations
concerning tourists cover the whole process of travelling.
1) Before travelling
Customers were advised to make a careful decision. It was recommended that they
should avoid making up their minds by judging the prices or following the fashion.
Tourists were advised to think about what they really want, and choose the suitable
product for themselves. Also, the customers should be aware that the huge tourist flow
will result in crowding problems everywhere. They were also expected to undertake
some preparations, such as book their accommodation and transport beforehand. Once
well prepared, Golden Week travelling can be treated as a way to experience nature,
get to know more people and enrich their spiritual life.
2) During travelling
The first important thing for tourists while travelling is to consider the issue of safety.
Managers suggested that everyone should be expected to be more careful of their
149
personal and property safety. And when involved in any tourism activity, they were
expected to be good tourists. It is very important to have a good sense of timing
during the busy Golden Weeks. Doing everything on scheduled time helps to avoid
any unnecessary trouble to the business or to the tourists themselves. Also, good
tourists should be responsible for the environment. In particular they should not litter
and also take good care of the heritage relics. In addition, in many famous places of
interest, there need to be a tolerance between tourists and locals in visiting popular
locations.
3) After travelling
All the businesses tried their best to serve customers and hoped they had a higher
level of satisfaction. The businesses appreciated the understanding from the tourists.
In order to improve their Golden Week travelling experience, the tourists were
expected to give their constructive comments and suggestions after their Golden
Week travelling. The feedbacks from tourists will help managers improve their
service and make out better strategies to develop Golden Week travelling.
4.4.5.3 Sectors specific expectations, including business planning
Table 4. 18 – Managers’ expectations directed at the whole tourism industry
Theme
/
Corresponding inferences
Number
Stakeholders
of
inferences
Tourism
all sectors work together – with a reasonable 9
industry
price(2), provide more options for tourists(2),
provide
“all-in-one”
service
package(1),
exchange information(1), share resources(1), set
up an institution to investigate(1), pay more
attention to environment(1)
Various expectations from the tourism industry were identified. According to their
responses, there were general expectations applied to the tourism industry as a whole,
and also there are some specific expectations directed to different business areas.
Golden Week was seen as a “big cake” for tourism business, so every one wanted to
have a generous portion of this market. Most of the businesses agreed that all the
business sectors should work together. They suggested working out a programme
150
named an “all-in-one” service package which provided everything for customers. In
this programme, all the different business types should work as linked sectors in an
institution, where they cooperate with each other, exchange information and follow
the same price system. They should be managed by the same rules and be more
responsible to the environment. Following are the expectations and business planning
directed towards individual business sectors.
1) Travel agency
Table 4. 19 – Managers’ expectations and planning directed at the travel agency
sector
Theme
/
Corresponding inferences
Number
of
Travel agency
Expectation
inferences
cooperate with attractions and transport to develop 16
and design various tour routes(7), organize the tour
groups(5), confirm time and number for hotel
booking(2), exchange experience with other travel
agencies(1), design special tour routes(1)
Planning
create tour routes(4), DIY(Do-It-Yourself) tour – to 13
meet the various demands from different levels of
consumption(2), holiday vacation – focus on the
high-standard
products
for
the
wealthy
individuals(1), special events(1), improve quality of
tour guides(1), pre-paid fees(1), low cost tours(1),
cooperate with local agents(1), not any at the
moment(1)
Acting as a medium of interchange, there are a lot of expectations on travel agencies.
Other business types expected the travel agency to cooperate with them and organize
their tour groups during the busy time. Attractions and transport were expected to
work with them to create a variety of tour routes while the hotels want to guarantee
their occupancy rate by confirmation group bookings from travel agencies. For the
travel agencies, they were expected to share experiences with each other.
151
There were two major directions implicated for the planning of travel agencies. One
was the traditional way – creating new tour routes. The other was to explore and
target new markets. There were two new markets identified by travel agencies
interviewed. One was the self-assist travelling market which was pointed out as one of
the Golden Week travelling trends; and the other was the wealthy individuals who are
seeking high-standard holidays. Additionally, the travel agencies realised that they
needed self-improvement as well. Improving the quality of tour guides was an
important part of their management planning. Also, they needed to enhance the
relationship with local agents.
2) Attractions
Table 4. 20 – Managers’ expectations and planning directed at the attractions sector
Theme
/
Corresponding inferences
Number of
Attractions
inferences
Expectation learn from other attractions with successful Golden Week 10
experience(2), tighten up on safety precautions(1),
provide unique souvenirs(1), special events(1), “smile
service”(1), improve service quality and facility(1), more
activities(1), make use of resources(1), safety issue(1)
Planning
special events and activities(8), improve facility(4), 28
promotion(2) – media, go to university, improve service
quality – cooperate with police station and cleaning
company to provide a more safe and comfortable place
for tourist(2), more staff(2), strengthen management(2),
cooperate with other tourism industries(1), create
products(1), raise up the price(1), cooperate with locals –
give way to outside tourists(1), limit tourists number(1),
pay attention to the environment(1), better protection on
cultural relics(1), survey for improvements(1)
Expectations directed at attractions focused on their management. For one thing, the
attractions should guarantee their service, or even provide better service during
Golden Week travelling. Good suggestions included special events, “smile service
152
based” and souvenirs. It is also helpful for attractions to learn from other successful
experiences in dealing with Golden Week tourists. Additionally, it is important for
attraction management to pay attention to safety issues. They were expected to work
with related sectors, such as the hospital and fire departments, to devise
countermeasures for safety issues.
The planning within the attraction field touches various areas. From the promotion
aspect, many attractions will undoubtedly continue to hold special events and
activities which have been recognized as an effective promotional method. Also, some
attractions planned to undertake promotion via media or advertise directly at
universities or in schools. Managers planned to strengthen their efforts in a number of
ways. One technique was to employ more qualified staff and improve facilities.
Another technique was to cooperate with other businesses, including other tourism
industries and safety-related departments, such as the police station and the fire
department. Beyond these actions, their planning efforts were also directed at
environmental issues. By doing so, they will limit the tourist numbers at peak time
and also provide more protection of key cultural relics. Some of the attractions also
planned to assess tourists’ responses through questionnaires to help development of
their business.
3) Hotel and catering
Table 4. 21 – Managers’ expectations and planning directed at the hotel and catering
sector
Theme / Hotel
Corresponding inferences
Number of
and catering
Expectation
inferences
strengthen safety management(2), pay more attention 6
to food safety(1), special menu(1), food culture(1),
improve service standard(1)
Planning
accept
more
individual
customers(3),
increase 16
price(2), use a deposit system(2), not any at the
moment(2),
cooperate
with
travel
agency(1),
incentives(1), expand the scale of hotel(1), strengthen
the management(1), improve service quality(1), pay
attention to all complaints(1), price bundling(1)
153
In the hotel and catering area, safety is again an important concern. Managers are
expected to guarantee visitors’ personal safety and food safety. The variety of
products is another way they can do to contribute to the development of Golden Week
business. By combining local culture, they can introduce unique menus and special
accommodation packages to enrich customers’ Golden Week travelling experience.
At the same time, the service quality should be consistently positive.
The Golden Week planning within the hotel and catering area focused on
management improvement. The first concern was to guarantee the occupancy rate. By
doing so, they would maintain good links with travel agencies which bring in large
numbers of tour groups. In conjunction with this cooperation, managers preferred to
work out a booking system which would require certain deposits from any travel
agency. The deposit depended on the cooperation history, the number of tour groups
and so on. Another concern in the managers’ planning was receiving more individual
Golden Week tourists. Several measures were suggested to help attract more
individual travellers. And these measures were about service improvement, incentives
and special packages. In addition, some business managers highlighted an intention to
use a price strategy – effectively price increases. Only one of the hotel businesses
interviewed indicated that it would expand its business scale in the future.
4) Transportation
Table 4. 22 – Managers’ expectations and planning directed at the transportation
sector
Theme
/
Corresponding inferences
Number
of
Transportation
Expectation
inferences
Follow
the
requests
from
others(1),
more 2
frequencies and options for the Golden Weeks(1)
Planning
more ships(1), higher frequencies(1), cooperate with 6
locals – give way to outside tourists(1), more
staff(1), bigger boats in wet season(1), small ferry
in dry season(1)
154
Greater transport availability and greater frequencies during Golden Weeks were two
major tasks for the improvement of the tourism transport sector. However, the
assumption of doing so was that they should obey the rules issued by government
policy makers.
The planning for transportation area was also quite clear – more transport and more
frequent services. However, the transport companies need to take consideration of
maintaining cost in the off-season. One of their planning steps is to cooperate with
local people, who will be advised to give precedence to tourists from other places
during Golden Weeks.
The expectations from tourism businesses for all tourism stakeholders showed that the
businesses were interested in the Golden Week market. And their planning strategies
indicated that they were confident about the future development of Golden Week
travelling.
4.5 Conclusion and implication – summary of Study Three
This chapter used the qualitative method of a detailed face to face interview to explore
views and perceptions from tourism managers. Thematic discourse analysis was
applied to present the results of the interviews with selected tourism stakeholders who
represented different components of tourism. The managers were from the hotel and
catering area, transportation, travel agencies and attractions. The objective of this
study was to identify the specific views of managers on the tourism seasonality
phenomenon and Golden Week travelling in China. This chapter presented the views
from three aspects – perceptions on seasonality patterns, reactions to the Golden
Week tourism and planning for future Golden Week tourism.
In summary, none of the six patterns identified in Study One was widely accepted as
ideal by the business managers interviewed. The plateau pattern was experienced by
more managers compared to the other patterns. Many suggestions were provided to
create more peaks and overcome problems in the off-seasons. One of the most popular
methods was to highlight a special event. Events and festivals have also been
identified by previous studies as the most common strategy to combat seasonality
(Baum, 1998; Getz, 1991; Koenig-Lewis & Bischoff, 2005).
155
The managers’ reactions concerning Golden Week travelling were also analysed.
Firstly, the advantages and disadvantages that the businesses encountered were
identified. The advantages were obvious as more customers meant more business, and
higher prices meant more profits. The Golden Week system provided managers with
an opportunity to develop their businesses. However problems also arose due to the
huge tourist flows. The main problems in management include not enough staff,
overuse of facilities and the low visitation and occupancy rate in the following month.
A previous study indicated that the total amount of consumption sold in the months
with three Golden Weeks ranked at the top of sale amount while the sale amount in
the following months was at the bottom (Ren, 2007). In the present study, the
interviews with managers tended to confirm the variability between Golden Weeks
and other time periods. By better balancing the advantages and disadvantages, the
Golden Week system would be more welcome to tourism business.
Secondly, managers’ promotional efforts during Golden Weeks were explored. Based
on their different functions in the tourism market, diverse types of business have
alternate ways to promote Golden Week products. But they all had a common idea
which is that cooperation with other stakeholders made for better results. Additionally,
price bundling was identified within all the different types of tourism businesses as a
successful strategy promoting their Golden Week business by many managers.
Previous research showed that the strategy of price bundling can reduce the cost of
products and provide the suppliers with the opportunity to achieve more profits from
the same products, while this strategy can also create demand-associated benefits
(Bakos and Brynjolfsson, 1999; Garrow et al, 2006; Kim, et al, 2009; Stremersch &
Tellis, 2002).
Finally, regarding their future planning for Golden Week business, managers
identified their expectations concerning the role of other tourism stakeholders. They
also explained their own planning in the near future. The government was still
expected to guide and supervise the development of Golden Week market. However,
as tourism is a market-led economy, the contradiction between supply and demand
can only be solved by the market itself. All the different sectors of tourism business
were expected to work together, share information and create products, with the
156
common aim to develop the whole market. Within their own business, many of them
have determined specific planning strategies to meet the needs of Golden Week
tourism. This indicates that most businesses are growing in confidence with the
development of the Golden Week system. The connections between these views and
those of the visitors will be discussed in the next chapter.
Discourse analysis was applied throughout the whole analysis of this study. This
approach has great power to interpret the perspective or world-view of particular
people or groups (Gomm, 2004; Keith, 2006). As stated in the research method for
this study, the interviews were conducted in Mandarin. Due to cultural differences,
there are problems resulting from conducting research in China and from transferring
tourism concepts when considering the Chinese context (Roy et al., 2001; Ryan et al.,
2009), such as the different ways to express the concept of tourism peak seasons in
Mandarin. Here the use of discourse analysis helps to overcome those problems as
specific focus on interview discourses can provide significant insights that are not
always discernable when using other methods (Keith, 2006).
All the interviews were conducted in Mandarin and all the discourses were translated
into English from Mandarin by the researcher. By doing so, it helped to keep the
consistency in three steps: (1) information obtained from different interviewees; (2)
processing of discourse analysis; and (3) translation from Mandarin to English.
157
Chapter 5 – Conclusions, discussions and
implications
Chapter structure
5.1 Introduction: review of the objectives of the thesis
5.2 Overview of results from the three studies
- 5.2.1 Results from Study 1
- 5.2.2 Results from Study 2
- 5.2.3 Results from Study 3
- 5.2.4 Links between the results from the three studies
5.3 Limitations of the thesis
5.4 Implications of the thesis
5.5 Areas for future research
- 5.5.1 Applications of the seasonality patterns to other parts of the world
- 5.5.2 Identifying the influential factors on seasonality patterns in terms of
visitor demographic characteristics
- 5.5.3 Studying the behaviours of Golden Week tourists
- 5.5.4 Exploring tourism authority’s views of Golden Weeks from the aspect of
the Chinese government
5.6 Final remarks
5.1 Introduction: review of the objectives of the thesis
This project examined the seasonality phenomenon in Asian tourism, with a particular
focus on China’s Golden Week travelling. Previous studies pointed out that
considerable gaps still exist in tourism seasonality issues. There is lack of sound
theoretical framework to measure seasonality problems. Furthermore, most of
research has been done in the cultural context of Western countries and little is know
about seasonality-related issues in other parts of the world. Chinese tourism,
particularly the Golden Week travelling, was perceived to represent a particularly
interesting area of research, considering the enormous growth rates already observed
and forecast. An objective of this thesis is to enhance the body of knowledge by
providing a comprehensive coding system for seasonality phenomenon in Asian
158
tourism. Further attention is given to exploring China’s Golden Week travelling from
the views of both tourists and managers. In the section dealing with tourists, the
respondents were asked about how the seasonality influences influence their decision
making of travelling time and their experiences in Golden Week travelling. In dealing
with managerial perspectives, this project explored managers’ attitudes toward
seasonality by presenting them with six seasonality patterns derived from the earlier
secondary analysis. Also, the managers were asked to share their previous / existing
marketing promotions and future planning for Golden Week travelling.
This concluding chapter summarises all the studies presented in the previous chapters
and reviews how the results meet with the aims of this project. It discusses the key
attributions of this project to both academic and practical areas. Limitations of this
thesis are pointed out for the attention of future researchers. Finally some
recommendations are also highlighted.
5.2 Overview of results from the three studies
The three studies were conducted individually but they interacted with each other to
some extent. Study One identified six seasonality patterns based on tourist arrivals to
five key Asian countries and four top Chinese tourist areas. The six seasonality
patterns are: the plateau pattern, the plain pattern, the basin pattern, the single-peak
mountain pattern, the multi-peak mountain pattern and the rolling hills pattern. These
findings were then utilized to create further questions for the subsequent study where
the perceptions of seasonality were explored from the perspective of managers in
different sectors of tourism business. Study Two and Study Three were carried out in
China. Study Two was a self-administered questionnaire with structured questions and
open-ended questions. Twenty seasonality concerns derived from literature review
were presented to respondents to explore how these factors influence their decision
making on travelling time. Study Three was in-depth interview with semi-structured
questions. The six seasonality patterns identified from Study One were presented to
tourism managers to explore their views on seasonality phenomenon. In both Study
Two and Three, respondents were asked to illustrate their Golden Week experiences.
159
5.2.1 Results from Study One
The aim of Study One is set to examine the seasonality phenomenon in Asian tourism
and provide a coding framework to measure seasonality. This study is based on
secondary data analysis. Five key Asian countries – Japan, Korea, Singapore,
Malaysia and Thailand, and four top Chinese tourist areas – Beijing, Hainan Island,
Hong Kong and Macao were selected as the target markets, due to the available and
accessible data. Secondary data of monthly tourist arrivals to the five Asian countries
from the year 2000 to 2006, and monthly tourist arrivals to the four Chinese areas
from the year 2002 to 2006 were chosen to provide a comprehensive data set and help
to address the seasonality research gap in Asian tourism (Koenig-Lewis & Bischoff,
2005). The monthly data to five Asian countries include total visitor arrivals, Chinese
visitor and the visitors from five continents – Asia, Europe, Americas, Oceania and
Africa; and the monthly data to four Chinese areas were divided into domestic visitors
and overseas visitors. Average monthly tourist arrivals were compared for every
month for every year using Pivot Table and Pivot Chart report, and the seasonality
patterns were derived from the variations between monthly tourist arrivals and
average monthly tourist arrivals.
All together six patterns were identified from 285 charts and they were named after
six basic types of landforms – the plateau, the plain, the basin, the single-peak
mountain, the multi-peak mountain and the rolling hills. Based on Butler and Mao’s
(1997) three general seasonality patterns – one-peak seasonality, two-peak seasonality
and non-peak seasonality, Lopez Bonilla et al. (2006) further improved this by adding
a fourth pattern named multi-peak seasonality.
This six-pattern coding system
provides a simple and effective method to identify seasonality. This study not only
examined how much seasonality existed in Asian area, but also evaluated what kinds
of seasonality patterns existed.
More specifically, by applying the six-pattern coding system, it was found that the
seasonality patterns vary within Asian areas and also differ within one country. One
previous study found out that several seasonality patterns might exist within one area
(Lopez Bonilla et al., 2006). However, most of the cases (60%) examined here fall
into the rolling hills pattern, which indicated that extreme seasonality did not
dominate Asian tourism. This is different to the view of previous research where it
160
was found that the most common pattern was single-peak pattern (Getz & Nilson,
2004; Higham & Hinch, 2002; Lopez Bonilla et al., 2006).
There were further interesting findings in Study One. One of them is that there is a
shift of seasonality patterns for African visitors to Malaysia, from the single-peak
mountain to the multi-peak mountain. This possibly indicates successful marketing
promotions by Tourism Malaysia for the African market. Another finding is that
major world events had influences on seasonality patterns. The most influential one
was the outbreak of SARS in 2003. Statistical results from the cases examined
showed a sharp decline of tourist arrivals from April to June when SARS broke out.
This finding reinforces the fact that tourism is vulnerable and confirms the view that a
downturn in tourism can often be attributed to the security and health concerns (Kim
& Wong, 2006). On the other hand, special events, including sports, had a positive
effect on seasonality patterns. During the FIFA 2002 World Cup, the number of
tourist arrivals from Africa, Europe and China to Japan and Korea was significantly
higher than in the same month in other years. This result was consistent with previous
research (Kim & Wong, 2006; Kulendran & Wong, 2005). The last but not the least
finding of interest is that CNY and school summer holiday are two important
determinants of seasonality patterns for the performance of Chinese visitors.
5.2.2 Results from Study Two
This study was a questionnaire survey which was designed to address how seasonality
influences affect tourist decision making on when to travel. The study also explored
the travelling experience in Golden Weeks. The questionnaire was consisted of three
parts. First of all the respondents were asked to provide some basic information about
their demographic characteristics. Then 20 seasonality influences derived from
literature review were structured into a table with seven-point likert type scale. The
respondents were asked to rate how strongly the seasonality influences influenced
their decision on when to travel. Finally a section with open-ended questions which
allowed the respondents to describe the pros and cons of their Golden Week travelling
was used.
The survey was administered in Mandarin to Chinese respondents in six Chinese
tourist cities, which cover the south to the north, and the east to the west of China. 530
161
copies of questionnaires were distributed using a snowball sampling over the six
places, resulting in 450 copies returned and valid. Their responses were analysed in
terms of demographic characteristics. And there are some interesting findings in two
key areas – seasonality concerns and Golden Week travelling experiences.
5.2.2.1 Findings relating to Chinese respondents’ seasonality influences
The 20 seasonality influences can be grouped into four categories – natural influences,
institutional influences, social influences and personal influences. The overall result
showed that the personal influences influence the respondents’ decision-making most
about when to travel, followed by natural influences, institutional influences and
social influences in a descending order. With regard to the individual influence, there
is no previous research studying the all 20 influences as a whole, however, the
personal issues have been studied as separate items. By combining the 20 influences
together, this study found that the most powerful one to influence tourists’ decision
for the time to travel was crowding, followed by the amount of rain and the very high
temperature. Previous research pointed out that crowding had a negative impact on
tourist’s satisfaction (Bonn et al., 2007; Eroglu & Machleit, 1990; Harrell et al., 1980;
Perdue, 2002). And the extreme climate was also shown to influence the comfort level
of tourists (Burton, 1995; Pearce & Vogt, 2005). On the other hand, the least powerful
determinants are religious and cultural factors, special events and the amount of
sunshine. Special event was considered as an attractive factor for tourists by many
academics. This is contradicted by one of the findings in this section.
The seasonality influences were analysed further in terms of demographic groups. For
respondents from different parts of China, their views varied on many of the
influences. Generally people from Shanghai tended to rate seasonality influences
more highly while people from Quanzhou rated them as of less importance. There was
not much difference between gender groups. They only had different views on two
items – females thought more about the “amount of rain” while “school commitment”
was more influential for males. For the age groups, the younger people gave high
ratings to most of the seasonality influences, except one – the amount of sunshine,
which the more senior tourists thought about more when making their travelling time
decisions. Concerning their education background, people with lower levels of
education tended to focus more on the natural influences while those with higher
162
levels of education rated significantly higher on the institutional, social and personal
influences. Occupation did not act as an influential factor on the respondents’ views
for natural influences, but the views on the other three categories varied a lot among
different occupations. Generally the labourer/farmer group provided significantly
lower ratings while the student group gave higher ratings on most influences in the
three categories. Price is always considered as a sensitive factor for tourists; therefore,
the income of the respondents will influence their decision making to some extent. In
this study, people with lower level of income considered price more when making
their travelling time decision compared to those with higher level of income.
5.2.2.2 Findings about the Golden Week travelling experiences
The open-ended questions describing the respondents’ Golden Week travel
experiences received mixed responses, both positive and negative. Overall, it can be
concluded that Golden Week is generally welcomed by the public. By summarising
their good experiences, it can be seen that the benefits they got from the Golden Week
system mainly focused on four aspects:
(1) Time available. Time availability is an essential factor for travelling. The Golden
Week system, like other holiday systems, first of all guarantees the time for travelling.
And the time is not only available to individuals; the holiday system is applied to all
Chinese. Therefore, the Golden Week system provides extra chances for them to
travel with either friends or families. The special feature of the Golden Week system
is its length. It lasts for seven days which allows tourists to make long-distance trips,
or even go abroad for travelling. With the long holiday, they can have a more relaxed
time, escaping from busy work and daily trifles.
(2) Great weather. As mentioned in the findings for their views on seasonality
concerns, there were two aspects of weather – rain and temperature that play an
important part when the tourists make a decision on when to travel. When discussing
their Golden Week travelling experiences, many of them referred to the great weather
during the Golden Week travelling. The climate is nice at the time of three Golden
Weeks in most parts of China, which was an added benefit for the tourists to enjoy
their Golden Week holiday.
163
(3) More activities. As there are special days in these three Golden Weeks for Chinese,
various activities and celebratory opportunities are scheduled throughout the country.
The festive atmosphere can definitely influence tourists’ moods and result in higher
level of tourists’ satisfaction. Secondly, most attractions will open all their tourist
resources to customers and even arrange more activities to accommodate the Golden
Week tourists. Also the travel agencies tend to introduce more new travel itineraries
for customers to choose. All of these help the tourists enjoy a more colourful trip.
(4) Others. There are a lot more advantages for each separate Golden Week. For
example, during the CNY, travellers can visit novel settings and experience different
local CNY customs. And the May Day Golden Week provides people with a chance
to “touch nature” and gain the feeling of springtime. In the National Day Golden
Week, everyone can be involved in celebrating the nation-wide event.
Although there are many good things in Golden Week travelling, travellers also
encountered some problems as well. The most common and serious one was the
crowding issue. Crowding did not only happen at the destinations, but also on the way
to or back from travel. The crowding problem was often due to transport and
accommodation limitations. Crowding was identified previously as a most powerful
factor that influenced respondents’ decision making on when to travel. All of these
forces definitely reduced tourists’ satisfaction level. Another headache for tourists was
the higher price during Golden Weeks. The price for attractions or transport and
accommodation was two or three times of that in the off-peak season. The high price
is a burden for those tourists with low income and affects the satisfaction level for all
tourists. Although the prices are higher than usual, the tourists did not receive
exemplary service. A lower level of service was pointed out by respondents as a
problem for all three Golden Weeks.
5.2.3 Results from Study Three
The final study used a qualitative research approach where an in-depth interview with
semi-structured questions was applied. The objective of this study was to identify the
specific views of seasonality and Golden Week travelling from the managers’
perspective. In this case, the question list for interview covered the following topics:
(1) Perceptions of seasonality. The six seasonality patterns identified in Study One
164
were presented to the interviewees and they were asked how their business manage
those patterns; (2) Reaction to Golden Week travelling. The interviewees were asked
to describe the advantages and disadvantages that Golden Week system brought into
their business; (3) Future planning. The managers were asked to address their
expectation from tourism stakeholders and expound their strategies toward better
Golden Week business.
In all, there were 30 interviews conducted across China, and the businesses involved
covered four basic types of tourism business: seven in the hotel and catering area, two
in tourism transportation system, seven in travel agency industry and 14 from tourist
attractions. Discourse analysis was adopted to process and consider the results. The
following points are the key findings in this study.
5.2.3.1 Perceptions of seasonality patterns
The perceptions of the six seasonality patterns are different among managers from
different locations and different business sectors. Generally there was not a pattern
accepted by all as an ideal model for their business development. A relatively large
portion of interviewees agreed that the rolling hills pattern was the trend for tourism.
The plain pattern, the basin pattern and the rolling hills pattern were identified as an
uncommon pattern encountered in their businesses, while the single-peak and multipeak mountain patterns were most likely to occur in the hotel and catering industry.
Irrespective of the type of the pattern, what concerned the managers most was the lack
of income in the off season. Therefore, their solutions suggesting how to cope with
seasonality focused on creating more peak seasons and extending peak periods.
According to their responses, it seemed that the very peak time is not regarded as a
problem for their business running. Golden Weeks were the three very peak times for
tourism business, and they were very much welcomed by the managers.
5.2.3.2 Reaction to Golden Week travelling
The managers’ reactions to Golden Week travelling were very positive. From the
business aspect, they expect as many customers as possible. The advantages of
Golden Week system brings into their business are not only more customers, but also
a higher price system and more active customers, all of which result in high profit.
However, there are also problems they encountered in Golden Weeks in the areas of
165
management, tourist behaviour and the environment. The main problems were
shortages of staff, overuse of facilities, safety issues, complaints and damage to
environment. Despite those various problems, most interviewees showed confidence
in dealing with Golden Week business, and they reported some successful methods
they had used. According to their successful experience, good cooperation between
businesses is very important and effective, and can help solve such problems as staff
numbers, overuse of facilities, and safety issues. In order to guarantee customers’
satisfaction, they tried to provide extra services to customers. However, only one of
the responses referred to the environment issue, limiting tourist number for protection
purpose. Most of the businesses were looking forward to even better Golden Week
business.
5.2.3.3 Planning for the future
Tourism businesses expected a bright future of Golden Week with hard work from
tourism related stakeholders. The government was expected to keep its role of
supervision and management, and to strengthen its policy support for special events.
The tourism businesses were expected to cooperate with each other more closely and
develop the Golden Week market in a sustainable way. And the tourists were
expected to be more rational and mature either when they make decision of travelling
time or during Golden Week travelling.
From their business aspect, managers have described a blueprint for Golden Week
business in the future. First of all, with the development of Golden Week market,
most of the tourist businesses, except for the hotel businesses, planned to expand their
business scale. The expansion will include more staff, more and better facilities, and
more varieties of products. Secondly, the businesses will enhance their marketing
approach. Special events remain as the most important way to attract customers, while
other methods will assist growth. The other methods include getting feedbacks from
customers, targeting new markets, and offering special packages. Last but not the least
is strengthening management. The ways to improve management include providing
better education and training for staff, offering special services and adjusting price
systems.
166
Most of the interviewees believed that by working hard and working well together
with all tourism stakeholders, the Golden Week system would be golden for everyone.
5.2.4 Links between results from the three studies
This thesis has used a mixed-method approach to identify seasonality patterns in
Asian tourism, particularly in China, with a focus on the perception of Golden Weeks’
impact on tourism from both travellers’ views and the managerial perspective. The
combination of quantitative and qualitative methods has helped to explore the
seasonality phenomenon from different facets, and the findings from each stage acted
as complementary and supplementary to each other, which all contributed to a better
understanding of this complex social phenomenon. The relations of the key findings
from different studies are summarised as follows:
167
Seasonality
Examine & Evaluate –
Study 1
Existence
Managerial perception –
Study 3
Most common pattern
– Rolling Hills
Very peaks – Golden
Weeks & school
summer holiday
Tourists – Study 2
Golden Weeks impact
Long time
Advantages
Advantages
Good weather
More activities
Disadvantages
More visitors
Disadvantages
Higher prices
Lower level service:
- short of staff
- overuse of facilities
- personnel safety concerns
- damage to environment
Figure 5. 1 – Relations between results from the three studies
168
5.3 Implications of the thesis
The aim of this project was to study the seasonality phenomenon in Asian tourism,
with a particular focus on China’s Golden Weeks. By carrying out three studies within
the Asian area, especially in China, this project attempted to contribute knowledge to
the seasonality field at both a conceptual level and at a managerial level.
5.3.1 Contributions at a conceptual level
As an important characteristic of tourism, seasonality has received a great deal of
attention, especially in recent years. However, most of the previous research was done
in the context of western countries (Koenig-Lewis & Bischoff, 2005). Study One in
this project looked at the seasonality patterns in some key Asian countries. It is found
that although extreme seasonality dose not dominate Asian tourism, there are various
seasonality patterns existing. By analysing Asian seasonality issues associated with
specific countries examples, it is hoped that this study will add some understanding of
tourism seasonality in the parts of world where seasonality-related issues had not been
studied in detail.
Study Two in this project filled a different gap in extending the study of seasonality.
Little research had been done about the forces influencing the desire to travel at
certain times of the year (Lundtorp et al., 1999; Koenig-Lewis & Bischoff, 2005). In
this study, 20 seasonality influences derived from seasonality literature were
combined and the respondents were asked to rate on those 20 variables about how
strongly they influenced their travelling time period. A new and diverse set of
findings are provided by the study to understand Chinese travel choices and the role
of seasonality.
Finally, the perspectives of the Chinese tourism managers were considered in detail in
this research and provided a strong confirmation of the value of the Golden Week
system from their perspective. Importantly for the future of the Golden Week system
these positive views were reasonably well aligned with the advantages reported by
Chinese citizens.
169
5.3.2 Contributions at a managerial level
From the managerial view, there are some interesting findings in these three studies
which can prove beneficial to tourism managers and policy-makers.
The results found in Study One can be applied to management in Asian tourism and
Chinese tourism market as well. Firstly, six seasonality patterns were identified in the
five key Asian countries by arrivals from different continents. Tourists from different
continents to the same destination appeared to be in the same seasonality pattern, but
it was found out that the peak times for them were different from continent to
continent. In this case, the destination managers do not need to carry out any
programme to redistribute tourist arrivals from those continents to bring about a
decrease in seasonality concentrations. Secondly, a shift of patterns was identified in
some destinations, such as African visitors to Malaysia where a transition from the
single-peak mountain to the multi-peak mountain was noted. This result suggests that
it is possible to create more peaks through suitable marketing methods. One of the
effective methods is to promote sports events, which are now often identified as
effective tourist attractions (Higham, 2006). Finally, this study confirmed a statement
by previous researcher that CNY market has potential development (Koenig-Lewis &
Bischoff, 2005). It was found in this study that those months with CNY were peak
time for Chinese visitors to those key Asian countries. Therefore, the tourism
operators should be prepared for this growing market.
Findings in Study Two will benefit those tourism businesses dealing with Golden
Week tourists. The good experiences pointed out by respondents indicated the good
jobs the businesses had done and they should keep doing so. One of the examples is
that many respondents were happy that there were more activities and they could go
travelling with friends and families during Golden Weeks. In this case, the tourism
operators should keep providing a good spectrum of activities which are familyfriendly to satisfy Golden Week tourists. The negative experiences reported offer
ways for the businesses to improve. The respondents complained a lot about the
crowding issue, higher prices and lower level service, and creative management to
address these issues approve to be a desirable step forward.
170
Study Three revealed findings related to tourism business. It was highly
recommended that good cooperation among different businesses was necessary and
important to deal with Golden Weeks. As the Chinese government is regarded as the
supervisor and leader in the Golden Week market, it is expected that the government
should continue to coordinate the cooperation among different business sectors.
Special events were recommended as effective promotions by many tourism managers.
Thus it is significant to organize special events to promote tourism.
5.3.3 Contributions to the Mandarin studies in tourism, particularly in China’s
Golden Week tourism
As mentioned in the literature review, travelling in Golden Weeks is becoming a
pressing topic within China and its contribution to the development of China’s
economy is obvious. However, during the development of this project, it was hard to
find information concerning China’s Golden Week tourism in English. The limited
information obtained for this research was mainly commentaries or reviews on
newspapers, such as People’s Daily (English version). From this perspective, the
current research contributed to a better understanding of China’s Golden Week
tourism in the following ways. Firstly, this research collected information related to
China’s Golden Week tourism in both English and Mandarin, which presented a
comprehensive and objective understanding of Golden Week tourism. Secondly, a
large part of this research was conducted in the Chinese context but the findings were
reported academically in English, which added new knowledge to the existing
understanding of this phenomenon in a wider academic area. Finally, this research
provided a new research orientation for exploring the phenomenon of Golden Week
tourism in China.
Besides commentaries and reviews on Golden Week tourism from newspaper, other
information sources for Golden Weeks utilised in this research were from 14
academic reports. All of them were written in Mandarin. Searching “Golden Week
tourism” research in Mandarin resulted in 14 academic reports. The focuses and
research methods of these 14 academic research papers are summarised as follows:
171
Table 5. 1 – The characteristics of the 14 academic research papers
Number of papers
Existing problems & countermeasures
8
Exploring future developing trends
4
Impacts on tourist flow
2
General
10
Specific destination
4
Research
Theoretical (qualitative) approach
12
methodology
Empirical (quantitative) approach
2
Research Focus
Research Scope
From Table 5.1, it can be seen that problems resulting from Golden Week system are
the major concern for the Chinese scholars in this area. However, the problems they
identified are similar to each other and the countermeasures they suggested lack
supportive evidence. There is need for theoretical innovation and research diversity in
the Asia Pacific research area (Pearce, 2004). The current study addressed the Golden
Week problems in a novel way, from the experiences of both travellers and tourism
businesses, which provided an intrinsic and objective view of this phenomenon in a
different way. The two studies of impacts on tourist flow revealed that the Golden
Week system did influence the distribution of tourist arrivals within a year (Zhang &
Bao, 2007). However, there is little research exploring this relationship. The current
research provided a platform to link seasonality issues with the Golden Week system.
The six-seasonality-pattern identified in this study was treated as a model to measure
the impacts of the Golden Week system on some Asian countries as well as China’s
domestic tourism. As revealed in the findings in Study 1 and Study 3, Chinese New
Year holiday is an important time for Chinese travelling abroad, and the three Golden
Weeks were the very peak times for most of the tourism businesses in China.
By reviewing these 14 research papers on Golden Week tourism, it is found that only
four of them focused on specific destinations. And among these four papers, there are
only two destinations involved – Wulingyuan and Fuzhou city, as three of them are
about Wulingyuan. The research scope related to Golden Week tourism is therefore
relatively limited. This thesis was designed to reach a wider scope to explore this
complex phenomenon, by employing secondary data analysis involving Beijing,
Hainan Island, Hong Kong and Macau, and collecting fresh data including Beijing,
172
Shanghai, Xi’an, Guangzhou & Guangxi Province, and Quanzhou, which helped to
cover research within China from north to south, and from east to the west. As a result,
it provided a more comprehensive understanding of this phenomenon.
Most of the previous research papers are theoretical (qualitative) approaches, with a
small amount of empirical (quantitative) approaches (only two of them). And even for
the two empirical papers, they are about the same destination (Wulingyuan) on the
same topic (impacts on tourist flow). This thesis utilised a mixed-method approach to
study the phenomena of seasonality and Golden Week in China’s tourism, combining
quantitative and qualitative approaches. As discussed in Chapter 1, mixed-method
approach helps to provide a more comprehensive and objective way to better
understand the complex social phenomena.
This research project tries to contribute additional knowledge and innovative research
approach to extending the Mandarin studies in tourism.
5.4 Limitations of the thesis
There are several research methods applied into this project, including secondary data
analysis, quantitative questionnaires and qualitative approach. As stated in the
methodology section in each study, every method has its strengths and weaknesses.
Their strengths are the reasons that those methods were adopted in this project,
however, the inherent weaknesses resulted in some inevitable limitations in this
project. The following section will identify such limitations.
First of all, the six seasonality patterns were derived from secondary data analysis in
Study One (Chapter Two). As mentioned in Chapter Two, the data set was selected
due to the accessibility of quality data. At the first stage of Study One, according to
the aims the destinations were chosen by the need to select a mix of tropical and cold
water settings; however, there were not data of monthly tourist arrivals available for
some chosen destinations. Particularly in China, few destinations have provided data
of monthly tourist arrivals. In the study on seasonality patterns in Spain by Lopez
Bonilla et al. (2006), they looked at the data from all regions of Spain and they found
out various patterns across the regions. It was suggested not to generalize the
seasonality patterns for a wide area (Lopez Bonilla et al., 2006). If there were more
173
data available on other regions of China, like Northeast of China and Southwest of
China, more seasonality patterns or further findings could be derived from a richer
data set.
Secondly, snow ball sampling was employed in Study Two (Chapter Three) due to
time, cost constrains and anticipated response rate. Therefore, the representation of
respondents to the whole population can not be guaranteed. By analysing respondents’
demographic profiles, it showed that the respondents tended to be young and a
relatively small portion of them were famers / labourers, which is a segment which
still occupies a large population within China. As a result, some of the findings in this
study might not be applied to the general population with wide competence. Also
open-ended questions were used in the questionnaire for this study. Although openended questions are suitable for respondents to describe the experiences using their
own words (Gomm, 2004), sometimes what their words mean were not clear to the
researcher. The uncertainty of words might result in reducing the diverse responses to
a much smaller number of categories (Gomm, 2004). The researcher tried to minimise
this problem by discussing those words with other Chinese colleagues with the same
cultural and language backgrounds as the respondents. It is hoped that such efforts
have reduced this problem but undoubtedly some interpretations in the open-ended
data may not be perfect.
Finally, the last study employed in-depth interviews with semi-structured questions.
As mentioned in Study Three (Chapter Four), interviews are costly in both time and
money. At first the potential interviewees selected covered all areas of tourism
industries with an equal portion on each business sector. However their willingness to
assist resulted in a biased distribution of interviewees in different business sectors.
The researcher had tried to approach more interviewees from the sector with relatively
low response rate but failed due to unknown reason (not reply at all). The time and
financial issue did not allow the research keep trying to approach more interviewees.
The data would have been more reliable had they been collected from interviewees
with a more equal distribution in different business sectors.
174
5.5 Areas for future research
Seasonality is an important phenomenon in tourism. It has been given attention from
both academic and managerial perspectives, and it deserves more research from all the
aspects of tourism. Based on gaps existing in the literature and limitations identified
in this project, several areas for future research in the tourism seasonality field are
discussed as follows.
5.5.1 Applications of the seasonality patterns to other parts of the world
As identified in the literature review, most seasonality related research has been
carried out in the context of Western Countries thus little is know in other parts of the
world. Chapter Two of this thesis studied the seasonality phenomenon in Asian area
and identified six seasonality patterns. The coding system of six seasonality patterns
therefore can be applied to the Middle East, Africa and Central and South America.
First of all, data of monthly tourist arrivals to key countries in Middle East, Africa and
Central and South America could be obtained from their national tourism official
database. The length of time period for analysis will depend on the data availability.
The monthly tourist arrivals should include domestic tourists and international tourists.
And the international tourists could be further divided into groups according to which
continents they came from. Then the coding system in Chapter Two will be applied to
identify seasonality patterns in these areas. Such a study would not only investigate
the seasonality phenomenon in these areas but also classify which seasonality patterns
apply. The seasonality patterns identified could be analysed with examples of tourist
arrivals from different continents in specific years. Such studies could help understand
the causes and effects of seasonality in tourism of further areas of the world.
5.5.2 Identifying the influential factors on seasonality patterns in terms of visitor
demographic characteristics
Chapter Two of this thesis identified six seasonality patterns by analysing data of
visitors from different generating areas. It was found out that visitors from different
continents to the same destination appeared in different seasonality patterns. Chapter
Three further identified visitors’ views of 20 seasonality influences in terms of
demographic characteristics. The results revealed that the seasonality influences
influenced visitors’ decision making of travelling time period to different extents
175
among different demographic groups. Previous research also indicated that there was
lack of knowledge about which factor is the more important among the various causes
of seasonality (Hinch et al., 2001; Lundtorp et al., 1999). A future study is suggested
to examine Asian seasonality patterns associated with visitors’ demographic profiles.
First of all, data of monthly tourist arrivals to selected key Asian countries could be
obtained from official tourism databases, and the tourists could be grouped by
demography – gender, age and education, and by some tourist behaviour
characteristics – purposes of visit and expenditure. The selection of grouping factors
is based on the key findings of Chapter Three in this thesis and the basic tourist
information would be available in most destinations. Different demographic groups
were found out to have different views of seasonality influences in Chapter Three.
The investigation could pursue the issue of the seasonality patterns for tourists from
different gender, age, education and income groups.
Further, tourist behaviour is an important concern in tourism research. Some previous
research has pointed out that seasonality patterns can be influenced by some tourist
behaviours. Koc and Altinay (2007) analysed the seasonality patterns in Turkish
inbound tourism and found that the seasonality pattern in per person tourist spending
is considerably dependent on the seasonality pattern in tourist arrivals. A previous
study of seasonality variation for a coastal resort found that shoulder-season visitors
differed significantly from peak-season visitors in terms of benefits they sought
during travelling (Bonn et al., 1992). Therefore, in another future study, seasonality
patterns in Asian tourism could be explored combining the variables of visitors’
expenditure and their purposes of visits. In such a study, different ranges of
expenditure and different purposes could be the grouping factors, and the coding
system of six seasonality patterns could be applied to identify the seasonality patterns
for tourist arrivals with different expenditure ranges and different purposes. Such
work could identify whether these two variables of tourist behaviour will influence
seasonality patterns.
5.5.3 Studying the behaviours of Golden Week tourists
As mentioned in Chapter Four, Golden Week market is newly emerging and the focus
from both academic and political sources is on whether or not to cancel the Golden
176
Week system. According to findings in Chapter Three and Chapter Four, the Golden
Week system is welcome both by visitors and tourism businesses. Therefore the
Golden Week market deserves attention from all aspects. Tourist behaviour is “a link
and a force in understanding tourism” (Pearce, 2005, p9). There are several variables
to describe groups of tourists and their behaviour, including demographic factors,
travelling style distinctions and product and activity classifications (Pearce, 2005).
Some of the demographic characteristics of Golden Week tourists have been
identified in Chapter Three, but future study could further explore this market by
studying the travelling styles of the Golden Week tourists. Also as mentioned in
literature in Chapter One, Japanese Golden Week tourists spent more than tourists in
other time period (Rosenbaum & Spears, 2006). Thus tourist expenditures should be
included in this research. According to the interviews in Chapter Four, the managers
pointed out several trends of Golden Week market. Future studies could be designed
to explore this claim and if it is established then further weight would be added to the
case to continue the Golden Weeks.
5.5.4 Exploring tourism authority’s views of seasonality and Golden Weeks from
the aspect of the Chinese government
Chapter Four explored the views of seasonality and Golden Weeks travelling by
interviewing a variety of tourism operators in China. The important role of the
Chinese government in developing Golden Week market was emphasized by most of
the tourism managers. The Chinese government is not only a policy-maker, but also a
supervisor and leader in the tourism market. The development of Chinese market
largely depends on how the government thinks of this market and what they will do
with this market. Therefore it could be interesting to look at the views of seasonality
and Golden Weeks travelling from the government aspect.
Interviews with semi-structured question list could be applied in such a study. And the
interviewees could be tourism related officers from the municipal level, the provincial
level and the national level. Although there is a unified policy for tourism offices at
all different levels, seasonality varies from area to area and the development levels of
Golden Week markets differ from each other in different places. The regional tourism
offices will have their own specific strategies to cope with their regional seasonality
and Golden Weeks problems. The municipal level and provincial level will cover vast
177
areas as mentioned above in the future study on Golden Week tourist behaviour.
Research in this area could aim to collect as much information as possible to help
identify different views of all possible seasonality patterns and Golden Weeks
problems. The semi-structured question list will cover the topics followed in the
managers’ interviews in this study. These topics were:
1) Perception – What do you think of the performance of six seasonality patterns
(identified in Study 1)? Which pattern does your regional/national tourism appear?
2) Reaction – What do you think of the performance of Golden Weeks market in your
region / in the whole China? What are the major problems existing in this market?
3) Planning – What concerns the government most regarding seasonality issues and
development of Golden Weeks market? How will the government make an effort to
mitigate seasonality problems and improve Golden Weeks market? What does the
government expect from tourism business operators and tourists themselves?
5.6 Final remarks
Seasonality exists everywhere and is unavoidable. The complex causes of this
phenomenon in tourism make it difficult to deal with all the resulting issues. To be
successful, one should face the problem and solve it, instead of escaping from it. The
approach to deal with seasonality problems is to understand more about this
phenomenon, including its nature, causes, resulting effects, and trends. Seasonality
patterns in the Asian area were identified and associated studies considered to specify
the causes and effects. As a result, the seasonality findings identified might be helpful
in both expanding potential peak seasons and mitigating ill-effects of seasonality.
Golden Weeks are extreme peak seasons. They are really a golden time for tourism
businesses as they maximize their profit during those weeks. However the Golden
Week system is also designed as a right for the Chinese citizens to enjoy their life. It
is important whether or not the Chinese people enjoy their Golden Weeks. As China
has a large population, crowding is inevitable. There are many techniques that the
tourism operators can employ to overcome the crowding issues during peak time, such
as good cooperation with other sectors, better quality of service and enhanced security.
178
The Golden Week system makes it possible for the ordinary people in China to travel
in terms of available time and money. All of the tourism industry should work
together to develop this market and provide a quality experience for the Golden Week
tourists.
I want to go to Guilin; I want to go to Guilin.
But when I have available time, I don’t have money.
I want to go to Guilin; I want to go to Guilin.
But When I have available money, I don’t have time.
-
A Chinese song “I want to go to Guilin”, by Xiao Han
179
Reference list
Agnew, M.D., & Viner, D. (2001). Potential impacts of climate change on
international tourism. Tourism and Hospitality Research, 3(1), 37-60.
Allcock, J.B. (1994). Seasonality. In S.F. Witt & L. Moutinho (Eds.), Tourism
Marketing and Management Handbook. (pp. 86-92). New York: Prentice
Hall.
Andriotis, K. (2005). Seasonality in Crete: problem or a way of life? Tourism
Economics, 11(2), 207-224.
Asianinfo. (2000). Tourism in China. Retrieved March 15, 2009, from Asianinfo
Web site:
http://www.asianinfo.org/asianinfo/china/pro-tourism.htm
Bakos, Y., & Brynjolfsson, E. (1999). Bundling information goods: pricing, profits
and efficiency. Management Science, 45(12), 1613-1630
Bar-On, R.V. (1975). Seasonality in Tourism – a guide to the analysis of seasonality
and trends for policy making (2 vols). London: The Economist
Intelligence Unit Ltd.
Barry, R.O., & Perry, A.H. (1973). Synoptic climatology-methods and applications.
London: Methuen
Baum, T. (1998). Responding to seasonality in peripheral destinations. In Insights –
Tourism Intelligence Papers (A107-115). British Tourist Authority, English
Tourist Board: London.
Baum, T. (1999). Seasonality in tourism: understanding the challenges. Tourism
Economics, 5(1), 5-8.
180
Baum, T., & Hagen, L. (1999). Responses to seasonality: the experiences of
peripheral destinations. International Journal of Tourism Research, 1(5), 299312.
Baum, T., & Lundtorp, S. (2001). Seasonality in tourism: an introduction. In T.
Baum & S. Lundtorp (Eds.), Seasonality in Tourism. (pp. 1-4). Oxford:
Pergamon.
Becher, T. (1989). Academic tribes and territories. Milton Keynes: The Society for
Research into Higher Education and the Open University Press.
Bonn, M.A., Furr, H.L., & Uysal, M. (1992). Seasonal variation of coastal resort
visitors: Hilton Head Island. Journal of Travel Research, 31, 50-56.
Bonn, M.A., Sacha, M., Mathews, J., Dai, M., Hayes, S., & Cave, J. (2007). Heritage /
cultural attraction atmospherics: creating the right environment for the
heritage / cultural visitor. Journal of Travel Research, 45, 345-354.
Botha, C., Crompton, J.L., & Kim, S.S. (1999). Developing a revised
competitive position for sun/lost city, South Africa. Journal of Travel
Research, 37, 341-352.
Boucher, K. (1975). Global Climate. London: English University Press.
Brown, G., & Yule, G. (1983). Discourse analysis. Cambridge: Cambridge University
Press.
Brown, M.T., & Tinsley, H.E.A. (1983). Discriminant analysis. Journal of Leisure
Research, 15(4), 290-310.
Brewer, J., & Hunter, A. (1990). Multimethod research: A synthesis of styles. Sage
Publications: USA.
181
Bryman, A. (2001). Social research methods. Oxford University Press, Oxford ; New
York.
Bryman, A. (2004). Social research methods (2nd ed.). Oxford: Oxford University
Press.
Burton, R. (1995). Travel geography (2nd ed.). Great Britain: Pearson Education.
Butler, R. W. (1994a). Seasonality in tourism: issues and problems. In A.V., Seaton
(Ed.), Tourism: the State of the Art. (pp. 332-339). Chichester: Wiley.
Butler, R.W. (1994b). Seasonality in tourism: issues and implications. In T. Baum
& S. Lundtorp (Eds.), Seasonality in tourism. (pp. 5-21). UK: Elsevier
Science Ltd.
Butler, R. W., & Mao, B. (1997). Seasonality in tourism: Problems and measurement.
In P. E. Murphy (Ed.), Quality management in urban tourism. (pp. 9-23).
Chichester: John Wiley and Sons.
Canosa, A., Brown, G., & Bassan, H. (2001). Examining social relations between
adolescent residents and tourists in an Italian Coastal Resort. Journal of
Tourism Studies, 12(1), 50-59.
Chang, S. (2007). A cross cultural comparison of food preferences employing risk
perception and sensation seeking influences. Unpublished PhD’s thesis, James
Cook University, Townsville.
Chen, J.S., & Hsu, C.H. (2000). Measurement of Korean tourists’ perceived images of
overseas destinations. Journal of Travel Research, 38, 411-416.
Chen, L.P. (2005). Current situation and development of independent travel in China.
Retrieved August 3, 2009, from the Self-assist Travelling Web site,
http://travel.china.com/zh_cn/zizhuyou/11031102/20050530/12354612.html
182
Chinatour (2006) China weather information. Retrieved July 27, 2006, from
Chinatour Web site,
http://www.chinatour.com/weather/weather.htm
Chinatour (2007) China tourism and travel related statistics. Retrieved January 26,
2007, from Chinatour Web site,
http://www.chinatour.com/data/data.htm
China National Tourism Administration. (2006a). Tourist Policy. Retrieved June 05,
2006, from CNTA Web site,
http://www.cnta.com/lyen/2policy/principles-1.htm
China National Tourism Administration. (2006b). Individual travel permits to Hong
Kong and Macao. Retrieved July 30, 2006, from CNTA Web site,
http://www.cnta.com.cn/news_detail/oldshow.asp?id=9011
China National Tourism Administration. (2009a). Beijing sees record festival tourists.
Retrieved March 15, 2009, from CNTA Web site,
http://en.cnta.gov.cn/html/2009-2/2009-2-11-16-5-27732.html
China National Tourism Administration. (2009b). Olympic venues popular among
tourists during Chinese lunar new year. Retrieved March 15, 2009,
from CNTA Web site,
http://en.cnta.gov.cn/html/2009-1/2009-1-31-19-4-49592.html
Chinese Government online. (2009). China factfile: holidays. Retrieved June 5, 2009,
from Chinese Government online Web site,
http://english.gov.cn/2005-08/16/content_23785.htm
Clark, R.N., & Downing, K.B. (1984). Why here and not there: the conditional
vature of recreation choice. In G.H. Stankey & S.F. McCool (Eds.),
Proceedings-symposium on recreation choice behaviour. (pp. 61-69). Ogden,
UT:USDA Intermountain Research Station.
183
Commons, J., & Page, S. (2001). Managing seasonality in peripheral tourism
regions: the case of northland, New Zealand. In T. Baum & S. Lundtorp
(Eds.), Seasonality in tourism. (pp. 153-172). Oxford: Pergamon.
Creswell, J.W. (2003). Research design: qualitative, quantitative and mixed methods
approaches (Second edition). California: Sage.
Creswell, J. W., & Plano Clark, V. L. (2007). Designing and conducting mixed
methods research. Thousand Oaks, CA: Sage.
Davies, B. (2003). The role of quantitative and qualitative research in industrial
studies of tourism. International Journal of Tourism Research, 5(2), pp. 97111.
Diekhoff, G. (1992). Statistics for the social and behavioural sciences: univariated,
bivariate, multivariate, Dubuque. IA: WEilliam C. Brown.
Donatos, G., & Zairis, P. (1991). Seasonality of foreign tourism in the Greek Island of
Crete. Annals of Tourism research, 18(3), 515-519.
Douglas, J., & Barden, R. D. (1999). An analysis of the nature, causes and marketing
implications of seasonality in the occupancy performance of English hotels. In
T. Baum & S. Lundtorp (Eds.), Seasonality in Tourism. (pp. 119-140). Oxford:
Pergamon.
Drakatos, C. (1987). Seasonal concentration of tourism in Greece. Annals of Tourism
Research, 14(4), 582-586.
Duval, D.T. (2004). When buying into the businesses, we knew it was seasonal:
perceptions of seasonality in Central Otago, New Zealand. International
Journal of Tourism Research, 6, 325-337.
184
Eroglu, S.A. & Machleit, K. (1990). An empirical study of retail crowding:
Antecedents and Consequences. Journal of Retailing, 66(2), 201-202.
Farrell, B., & Twining-Ward, L. (2004). Reconceptualising tourism. Annals of
Tourism Research, 31(2), 274-295.
Feng, Q.L. (2005). On the negative externality and its counter measures of the holiday
tourism. Economic and Social Development, 3(2), 28-30.
Fernandez, M.A. (2003). Decomposing seasonal concentration. Annals of Tourism
Research, 30(4), 942-956.
Flognfeldt, T. (2001). Long-term positive adjustments to seasonality: consequences of
summer tourism in the Jotunheimen Area, Norway. In T. Baum & S. Lundtorp
(Eds.), Seasonality in Tourism. (pp. 109-117). Oxford: Pergamon.
Frechtling, D.C. (2001). Forecasting tourism demand: methods and strategies.
Oxford: Butterworth-Heinemann.
Gao, S.L. (2005, January 26). Paid leave can not replace Golden Weeks. China
Tourism News.
Garrow, L., Ferguson, M., Keskinocak, P., & Swann, J. (2006). Expert opinions:
current pricing and revenue management practices across U.S. industries.
Journal of Revenue and Pricing Management, 5(3), 237-247.
Getz, D. (1991). Festivals, special events and tourism. Van Nostrand Reinhold: New
York.
Getz, D., & Nilsson, P.A. (2004). Responses of family businesses to extreme
seasonality in demand: the case of Bornholm, Denmark. Tourism Management,
25, 17-30.
185
Gibson, D.A. (2002). On-property hotel financial controllers: a discourse analysis
approach to characterizing behavioural roles. Hospitality Management, 21,
5-23.
Gilbert, D., & Hudson, S. (2000). Tourism demand constraints – a skiing participation.
Annals of Tourism Research, 27(4), 906-925.
Goeldner, C.R. (1992). Trends in North American tourism. American Behavioral
Scientist, 36, 144-153.
Goeldner, C.R., & Ritchie, J.R. (2003). Tourism: principles, practices, philosophies
(electronic resource). Retrieved September 10, 2009, from James Cook
University Net library Web site,
http://elibrary.jcu.edu.au/login?url=http://www.netLibrary.com/urlapi.asp?acti
on=summary&v=1&bookid=82032
Gomm, R. (2004). Social research methodology: a critical introduction. Bristol:
Palgrave MacMillan.
Graciano, S. (2001). Back-Translation. Apuntes, 9(4). Retrieved July 2, 2009, from
http://www.apuntesonline.org/translation/articles/art.vol9no4.backtranslation.h
tm
Grainger, J., & Judge, G. (1996). Changing patterns of seasonality in hotel and
tourism demand: an analysis of Portsmouth monthly arrivals data discussion
paper. (Number 73). Department of Economics, Portsmouth: University
of
Portsmouth.
Grant, M., Human, B., & Pelley, B. (1997). Seasonality. In Insights – Tourism
Intelligence Papers. (A5 – 9). British Tourist Authority, English Tourist Board:
London.
186
Greene, J. C., Caracelli, V. J. & Graham, W. F. (1989). Toward a conceptual
framework for mixed-method evaluation design. Educational Evaluation and
Policy Analysis, 11(3), pp. 255-74.
Grey, R. (2002). Will Santa find me? – Domestic Christmas travel, 1998-2001.
Tourism Research Report, 4(2).
Gunn, C.A. (1994). Tourism planning: basic, concepts, cases (3rd ed.). New York:
Taylor and Francis.
Hakim, C. (1982). Secondary analysis in social research: a guide to data sources and
methods with examples. George Allen & Unwin: UK.
Hammersley, M. (1996). The relationship between qualitative and quantitative
research: Paradigm loyalty versus methodological eclecticism. In J.T.E.
Richardson (ed.), Handbook of Research in Psychology and the Social
Sciences. Leicester UK: BPS Books.
Harrell, G.D., Hutt, M.D., & Anderson, J.C. (1980). Path analysis of buyer behaviour
under conditions of crowding. Journal of Marketing Research, 17, 45-51.
Hartmann, R. (1986). Tourism, seasonality and social change. Leisure Studies, 5(1),
25-33.
He, X.R. (2002). On the negative externality and its counter measures of the holiday
tourism market in our country. Journal of Science of Hunan Normal
University, 31(6), 83-86.
Higham, J. (2006). Sport tourism as an attraction for managing seasonality. In H.
Gibson (Ed.), Sport tourism: concepts and theories. (pp. 106-130). New
York: Taylor & Francis Inc.
Higham, J., & Hinch, T.D. (2002). Tourism, sport and seasons: the challenges and
potential of overcoming seasonality in the sport and tourism sectors. Tourism
Management, 23, 175-185.
187
Hinch, T.D., Hickey, G., & Jackson, E.L. (2001). Seasonal visitation at Fort
Edmonton Park: an empirical analysis using a leisure constraints
framework.
In T. Baum & S. Lundtorp (Eds.), Seasonality in Tourism. (pp. 173-186).
Oxford: Pergamon.
Hinch, T.D., & Jackson, E.L. (2000). Leisure constraints research: its value as a
framework for understanding tourism seasonality. Current Issues in
Tourism, 3(2), 87-106.
Hylleberg, S. (1992). General introduction. In S. Hylleber (Ed.), Modelling
seasonality. (pp. 3-14). Oxford: Oxford University Press.
Jackson, L. (2000). Will research on leisure constraints still be relevant in the twentyfirst century? Journal of Leisure Research, 32(1), 62-68.
Jackson, L. (Ed.). (2005). Constraints to Leisure. State College, PA: Venture.
Japan-guide. (2006). Living in Japan, Obon week. Retrieved July 26, 2006, from
Japan-guide Web site,
http://www.japan-guide.com/e/e2286.html
Japan National Tourism Organization. (2006). Statistical information. Retrieved
March 21, 2006, from Japan National Tourism Organization Web site,
http://www.jnto.go.jp/eng/ttp/sta/index.html
Jeffrey, D., & Barden, R. (2001). An analysis of the nature, causes and marketing
implications of seasonality in the occupancy performance of English hotels. In
T. Baum & S. Lundtorp (Eds.), Seasonality in tourism. (pp. 119-140).
Amsterdam: Pergamon.
Johnston, R.J. (1978). Multivariate statistical analysis in geography. London:
Longman.
Johnson, R. B., & Christensen, L. B. (2004). Educational research: Quantitative,
qualitative, and mixed approaches. Boston, MA: Allyn and Bacon.
188
Johnson, R.B., & Onwuegbuzie, A.J. (2004). Mixed methods research: A research
paradigm whose time has come. Educational Researcher 33(7), pp.14-26.
Keith, J. (2006). Discourse analysis. In M. Walter (Ed.), Social research methods: an
Australian perspective. (pp. 135-158). Oxford: Oxford University Press.
Kennedy, E., & Deegan, J. (1999). Seasonality in Irish tourism, 1973 – 1995. In T.
Baum & S. Lundtorp (Eds.), Seasonality in Tourism. (pp. 51-74). Oxford:
Pergamon.
Kim, J., Bojanic, D., & Warnick, R. (2009). Price bundling and travel product pricing
practices used by online channels of distribution. Journal of Travel Research,
47(4), 403-412.
Kim, S.S., & Wong, K.F. (2006). Effects of news shock on inbound tourist demand
volatility in Korea. Journal of Travel Research, 44, 457-466.
King, W. (1999). Measuring inequality in income distribution. Retrieved May 25,
2006, from Drexel University Web site,
http://william-king.www.drexel.edu.
Klawiter, B. (2000). An investigation into the potential for geochemical/
geoarchaeological Provenance of Prairie du Chien Cherts. Unpublished
Master thesis, the University of Minnesota.
Klemm, M., & Rawel, J. (2001). Extending the school holiday season: the case
of
Eurocamp. In T. Baum & S. Lundtorp (Eds.), Seasonality in tourism. (pp.
141-151). Oxford: Pergamon.
Koc, E., & Altinay, G. (2007). An analysis of seasonality in monthly per person
tourist spending in Turkish inbound tourism from a market segmentation
perspective. Tourism Management, 28, 227-237.
189
Koenig-Lewis, N., & Bischoff, E.E. (2005). Seasonality research: the state of the art.
International Journal of Tourism Research, 7, 201-219.
Korea National Tourism Organization. (2006). Statistical information. Retrieved
March 21, 2006, from Korea National Tourism Organization Web site,
http://www.knto.or.kr/eng/07_statistics/tss_main.jsp
Krakover, S. (2000). Partitioning seasonal employment in the hospitality industry.
Tourism Management, 21(5), 461-471.
Krumpe, E.E., & McLaughlin, W.J. (1982). A model of recreationists’ decisionmaking process. In D.W. Lime (Ed.), Forest and River Recreation:
Research Update. (pp. 94-99). St Paul: University of Minnesota Press.
Kulendran, N., & Wong, K.F. (2005). Modelling seasonality in tourism forecasting.
Journal of Travel Research, 44, 163-170.
Lazarsfeld, P., Berelson, B., & Gaudet, H. (1944). The People’s Choice. US:
Columbia University Press.
Li, D., Liu, X.P., & Yang, Y. (2003). The impacts of Golden Week system on China
travel agency industry and the trend for its future development. Journal of
Beijing International Studies University, 5, 44-47.
Li, W. (2004). Environmental management indicators for ecotourism in China’s
nature reserves: A case study in Tianmushan Nature Reserve. Tourism
Management, 25, 559-564.
Lim, C., & McAleer, M. (2001). Monthly seasonal variations: Asian tourism to
Australia. Annals of Tourism Research, 28, 68-82.
Liu, C. (2009). Chinese Trade: What Changes Have There Been In the Last Ten
Years. Retrieved July 15, 2009, from the BYM News Web site,
http://www.bymnews.com/china/html/changing_china.html
190
Liu, D.Q. (2005, October 14). Golden Week and the ordinary people. China Tourism
News.
Liu, S.M. (2005, May 23). Thoughts and recommendations on the Golden Week.
China Tourism News.
Lopez Bonilla, J.M., Lopez Bonilla, L.M., & Altamira, B.S. (2006). Patterns of tourist
seasonality in Spanish regions. Tourism and Hospitality Planning &
Development, 3(3), 241-256.
Lundtorp, S. (2001). Measuring tourism seasonality. In T. Baum & S. Lundtorp
(Eds.), Seasonality in tourism. (pp. 23-50). Oxford: Pergamon.
Lundtorp, S., Rassing, C.R., & Wanhill, S. (1999). Off-season is no season: the
case of Bornholm. In T. Baum & S. Lundtorp (Eds.), Seasonality in tourism.
(pp. 51-74). Oxford: Pergamon.
Manyou. (2006). The best time to travel. Retrieved July 09, 2006, from Manyou Web
site,
http://www.manyou.com/
McCabe, A. (2007). 120 million Chinese celebrate Golden Week. Retrieved October
28, 2008, from Canada.com Web site,
http://www.canada.com/topics/news/world/story.html?id=99936605-ef454f62-9f73-44b466697bd3
McEnnif, J. (1992). Seasonality of tourism demand in the European Community. EIU
Travel and Tourism Analysis, 3, 67-88.
Mckennell, A. (1974). Surveying attitudes structures: a discussion of principles and
procedures. Quality and Quantity, 7, 203-294.
Mitchell, L.S., & Murphy, P. (1991). Geography and tourism. Annals of Tourism
Research, 18(1), 57-60.
191
Morley, C. (1994). Discrete choice analysis of the impact of tourism prices. Journal
of Travel Reserch, 32(3), 8-14.
Moser, C. A., & Kalton, G. (1971). Survey methods in social investigation. Ashgate:
Dartmouth Publishing Co Ltd.
Murphy, P. (1983). Perceptions and attitudes of decision-making groups in tourism
centres. Journal of Travel Research, 21(3), 8-12.
National Bureau of Statistics of China. (2009). China City Population Statistics
Report. Retrieved September 8, 2009, from National Bureau of Statistics of
China Web site,
http://www.stats.gov.cn/
Neuman, W.L. (2002). Social research methods: Qualitative and quantitative
approaches (Fifth edition). Pearson Allyn & Bacon: Boston.
Nyaupane, G.P., & Andereck, K.L. (2008). Understanding travel constraints:
application and extension of a leisure constraints model. Journal of Travel
Research, 46(4), 433-438.
O’Halloran, M. (2002). Show me the bunny: travel activity and expenditure of
overnight Easter travellers. Tourism Research Report, 4 (1), 23-32.
O’Reilly, A.M. (1986). Tourism carrying capacity: concept and issues. Tourism
Management, 7, 254-258.
Owens, D.J. (1994). The all-season opportunity for Canada’s resorts. The Cornell
Hotel and Restaurant Administration Quarterly, 35(5), 28-41.
Pacific Asia Travel Association. (2006). Destination profiles, about Asia Pacific.
Retrieved July 24, 2006, from PATA Web site,
http://www.pata.org/patasite/index.php?id=121
192
Pansiri, J. (2005). Doing tourism research using the pragmatism paradigm: An
empirical example. Tourism and Hospitality Planning & Development, 3(3),
pp. 223-240.
Pearce, P.L. (2004). Theoretical innovation in Asia Pacific tourism research. Asia
Pacific Journal of Tourism Research, 9(1), pp. 57-70.
Pearce, P.L. (2005). Tourist behaviour: themes and conceptual schemes. Clevedon:
Channel View Publications.
Pearce, P.L., & Lee, U. (2005). Developing the travel career approach to tourist
motivation. Journal of Travel Research, 43, 226-237.
Pearce, P.L., & Vogt, H. (2005). Warriors, emperors and tourists: Environmental
setting factors and visitor comfort at two Chinese tourist attractions. China
Tourism Research, 1(2/3), 161-177.
People Daily. (2002). China top destination for tourists by 2020: World Tourism
Body. Retrieved February 26, 2009, from People Daily Web site,
http://english.peopledaily.com.cn/200207/07/eng20020707_99238.shtml
People Daily. (2003a). Facts and figures: China’s 11 Golden Weeks. Retrieved June
5, 2006, from People Daily Web site,
http://english.people.com.cn/200310/01/eng20031001_125287.shtml
People Daily. (2003b). Mainland’s “Golden Week” boosts HK’s holiday economy.
Retrieved July 16, 2006, from People Daily Web site,
http://english.people.com.cn/200310/08/eng20031008_125514.shtml
Perdue, R.R. (2002). Perishability, yield management, and cross-product elasticity: a
case study of deep discount season passes in the Colorado ski industry.
Journal of Travel Research, 41, 15-22.
193
Peterson, G. (1994). Challenges of qualitative inquiry and the need for follow-up in
descriptive science. Journal of Phenomenological Psychology, 25(2), pp. 174189.
Prideaux, B., & Carson, D. (2003). A framework for increasing understanding of selfdrive tourism markets. Journal of Vacation Marketing, 9, 307-313.
Ren, P. (2007). The analysis of gains and losses for travel in the Golden Week.
Journal of Mianyang Normal University, 26(7), 18-20.
Rosenbaum, M.S., & Spears, D.L. (2006). Who buys what? Who does that? The
case of Golden Week in Hawaii. Journal of Vacation Marketing, 12(3),
246-255.
Roy, A., Walters, P., & Luk, S. (2001). Chinese puzzles and paradoxes: conducting
business research in China. Journal of Business Research, 52, 203-210.
Ryan, C., & Gu, H. (2009). Tourism in China: Destination, Communities and Culture.
New York: Taylor and Francis.
Ryan, C., Gu, H., & Zhang, W. (2009). The context of Chinese tourism – an overview
and implications for research. In C. Ryan & H. Gu (Eds.), Tourism in China:
Destination, Communities and Culture. (pp. 328-337). New York: Taylor and
Francis.
Schuman, H., & Presser, S. (1996). Questions and answers in attitude survey:
Experiments on question form, wording and context. Thousand Oaks, Canada:
Sage.
Scott, D., Jones, B., & Konopek, J. (2007). Implications of climate and environmental
change for nature-based tourism in the Canadian Rocky Mountains: A case
study of Waterton Lakes National Park. Tourism Management, 28, 570-579.
Shih, C., Nicholls, S., & Holecek, D.F. (2009). Impact of weather on downhill ski lift
ticket sales. Journal of Travel Research, 47, 359-372.
194
Shizuko, M. (2006). Golden Week in Japan. Retrieved July 14, 2006, from GoJapan
Web site,
http://gojapan.about.com/cs/japaneseholidays/a/goldenweek.htm
Singapore Tourism Board. (2006). Tourism statistics publications. Retrieved March
26, 2006, from Singapore Tourism Board Web site,
http://app.stb.gov.sg/asp/tou/tou03.asp
Smith, K. (1990). Tourism and climate change. Land Use Policy, 7(2), 176-180.
Sorensen, N.K. (1999). Modeling the seasonality of hotel nights in Denmark by
county and nationality. In T. Baum & S. Lundtorp (Eds.), Seasonality in
tourism. (pp. 75-88). Oxford: Pergamon.
Stremersch, S., & Tellis, G.J. (2002). Strategic bundling: a new synthesis for
marketing. Journal of Marketing, 66(1), 55-72.
Sutcliffe, C.M., & Sinclair, M.T. (1980). The measurement of seasonality within the
tourist industry: an application to tourist arrivals in Spain. Applied Economics,
12(4), 429-441.
Tashakkori, A., & Teddlie, C. (Eds.). (2003). Handbook of mixed methods in social
and behavioural research. Thousand Oaks, CA: Sage.
Theodorakis, P.N., & Mantzavinis, G.D. (2005). Inequalities in the distribution of
rural primary care physicians in two remote neighbouring prefectures of
Greece and Albania. Rural and Remote Health, 5, 457. Retrieved July 20,
2006, from
http://www.rrh.org.au
Thor, F. (2001). Long-term positive adjustments to seasonality: consequences of
summer tourism in the Jotunheimen area, Norway. In T. Baum & S. Lundtorp
(Eds.), Seasonality in tourism. (pp. 109-117). Oxford: Pergamon.
195
Tourism Authority of Thailand. (2006). Tourism statistics – International. Retrieved
March 26, 2006, from Tourism Authority of Thailand Web site,
http://www2.tat.or.th/stat/web/static_download.php?Rpt=nmt
Tourism Dubai. (2006). Introduction. Retrieved July 25, 2006, from Tourism Dubai
Web site,
http://dubaitourism.co.ae/disabled/default.asp?SubCatID=65
Tourism Malaysia. (2006). Tourism statistics. Retrieved March 26, 2006, from
Tourism Malaysia Web site,
http://www.tourism.gov.my/statistic/tourist_arrivals.asp
United Nations World Tourism Organisation. (2000). Tourism market trends: world
overview and tourism topics. Madrid: United Nations World Tourism
Organisation.
United Nations World Tourism Organization. (2004). Tourism congestion
management at Natural and cultural sites, a guidebook. Madrid, Spain:
United Nations World Tourism Organisation.
Veal, A.J. (2005). Business research methods: a managerial approach (2nd ed.).
NSW: Pearson Education Australia.
Walker, G., & Virden, R. (2005). Constraints on outdoor recreation. In L. Jackson
(Ed.), Constraints to leisure. (pp. 201-219). State College, PA: Venture.
Wall, G., & Yan, M. (2003). Disaggregating visitor flows – the example of China.
Tourism Analysis, 7(3/4), 191-205.
Wanhill, S.C.R. (1980). Tackling seasonality: a technical note. International Journal
of Tourism Management, 1(4), 243-245.
Weaver, D., & Oppermann, M. (2000). Tourism Management. Brisbane: Wiley.
196
Wei, L., Crompton, J. L., & Reid, L. M. (1989). Cultural conflicts: experiences of US
visitors to China. Tourism Management, 10(4), 322-332.
Wikipedia. (2006). Golden Week in Japan. Retrieved July 16, 2006, from Wikipedia
Web site,
http://en.chinabroadcast.cn/ce_critoday/archives/2006/05/09/news/jp.htm
Wilton, D., & Wirjanto, T. (1998). An analysis of the seasonal variation in the
ational Tourism Indicators – a report prepared for the Canadian Tourism
Commission. Department of Economics. University of Waterloo: Waterloo.
Wu, B., Zhu, Hong. & Xu, X. (2000). Trends in China’s domestic tourism
development at the turn of the centure. International Journal of Contemporary
Hospitality Management, 12/5, 296-299.
Wu, N., & Wei, X. (2005). Too early to call off. Should Golden Week holiday be
cancelled? Retrieved July 16, 2006, from Beijing Review Forum Web site,
http://www.bjreview.com.cn/En-2005/05-09-e/09-zm.htm
Wu, Y.X. (2009, March 8). The voices of restoration of May Day Golden Week are
growing louder. Yanzhao Metropolitan Newspaper.
Xiao, H. (2006). The discourse of power: Deng Xiaoping and tourism development in
China. Tourism Management, 27, 803-814.
Xinhua. (2004). Every weekend “golden” for Macao’s tourism. Retrieved July 30,
2006, from People’s Daily Web site,
http://english.people.com.cn/200410/09/eng20041009_159427.html
Xinhua. (2006a). Golden Week provides big increase in revenues. Retrieved June 5,
2006, from China Broadcast Web site,
http://en.chinabroadcast.cn/725/2006/05/08/[email protected]
197
Xinhua. (2006b). ASEAN tourism market benefits from China's week-long holiday.
Retrieved July 16, 2006, from China Broadcast Web site,
http://en.chinabroadcast.cn/811/2006/05/07/[email protected]
Xinhua News Agency. (2006). Tourists in Sichuan choose warm places to celebrate
Lunar New Year. Retrieved July 27, 2006, from Xinhua News Agency Web
site,
http://www.china.org.cn/english/travel/156838.htm
Yacoumis, J. (1980). Tackling seasonality – the case of Sri Lanka. International
Journal of Tourism Management, 1(2), 84-98.
Yin, R.K. (2003) Case study research: Design and methods (3rd ed.). Sage
Publications: Thousand Oaks, CA.
Zhang, G. (1995). China’s tourism development since 1978: policies, experiences, and
lessons learned. In A. Lew & L. Yu (Eds.), Tourism in China: geographic,
political, and economic perspectives. (pp. 3-18). Boulder: Westview Press.
Zhang, G. (2006, November 06-09). China’s outbound tourism: an overview. Paper
presented at the World Travel Market – ChinaContact Conference, London,
UK.
Zhang, J.P. (2005). Population issues in Shanghai. Retrieved September 8, 2009,
from Education Pioneer Web site,
http://www.edupioneer.com/newdili/zt/shrkxa.doc
Zhang, Z. (2001). Prospect anticipation and the theoretical analysis of tourist
consumption of long vacation. Consumer Economics, 17(4), 26-28.
Zhang, Z. & Bao, J. (2007). Impact of holiday policy upon tourist flow in world
heritage site: Taking Wulingyuan of Hunan as a case. Geographical Research,
26(6), pp. 1295-1303.
198
Zhang, H., & Wang, Y.L. (2005, October 19). Look at the Golden Week system with
the scientific concept of development. China Tourism News.
Zhao, P., & Mei, T. (2005). Call of Golden Week. Should Golden Week holiday be
cancelled? Retrieved July 16, 2006, from Beijing Review Forum Web site,
http://www.bjreview.com.cn/En-2005/05-09-e/09-zm.htm
Zikmund, W.G. (2003). Business research methods (7th edition). USA: Thomson
South-Western.
199
Appendices
I.
Questionnaire targeting Chinese residents for Study Two
(English version)
Hello, my name is Tingzhen, and I am a PhD student from James Cook University. I
am studying visitors’ reaction to tourism seasonality, Golden Weeks travel in
particular. Thanks for participating in this survey, and it will take you 15 minutes to
complete this questionnaire. I won’t need your name, so your responses will be
completely confidential. If you want to find out any more about this study, or the
results of my research, please call the number: +61 7 4781 6780, or email me:
[email protected].
1. Demographic questions:
1) Age
A. Under 18 B. 18 ~ 30 C. 31 ~ 45 D. 46 ~ 60 E. More than 60
2) Gender
A. Male B. Female
3) Education level: Highest level of education obtained. If you are currently
undertaking studying, please indicate only the highest level of education completed to
date
E. Post-graduate (Master/Doctorate)
A. High school degree or under
F. Other (Please specify)
B. Technical/vocational
__________________________
C. Current university student
D. University graduate
4) Occupation: What is your current occupation?
G. Student
A. Executive
H. Office/clerical
B. Professional
I. Retired
C. Tradesperson
J. Other (Please specify)
D. Retail/marketing
______________________
E. Skilled worker
F. Labour/farmer
5) Income: Please indicate your current monthly income level
F. AU$5,001 ~ AU$6,500
A. No income
G. AU$6,501 or above
B. Less than AU$500
H. Other (Please specify)
C. AU$501 ~ AU$2,000
______________________
D. AU$2,001 ~ AU$3,500
E. AU$3,501 ~ AU$5,000
6) Previous travel experience:
- How many Chinese cities have ever travelled to?
200
D. 3
A. 0
E. 4
B. 1
F. 5 or more
C. 2
- When did you normally make your travel within China?
E. School holiday
A. Weekends
F. Working leave
B. Chinese New Year holiday
G. Other (Please specify)
C. May Day holiday
________________
D. National Day holiday
- How many foreign countries have ever travelled to?
D. 3
A. 0
E. 4
B. 1
F. 5 or more
C. 2
- When did you normally make your travel overseas?
A. Weekends
B. Chinese New Year holiday
C. May Day holiday
D. National Day holiday
E. School holiday
F. Working leave
G. Other (Please specify) ________________
201
2. Structured questions:
1) How strongly do the following factors influence you when you make your decision
on when to travel: (please rate on a 7 point scale)
(7=very strongly; 6=strongly; 5=somewhat strongly; 4=neutral; 3=not very strongly;
2=not strongly; 1=not at all)
7
6
5
4
3
2
1
Amount of rain
Very high temperature
Very low temperature
High humidity
Amount of sunshine
School commitments
Work commitments
Long weekends/Public holidays
Your favourite time to travel
Time available
Travel companions
Overall cost (accommodation & transport)
Standard of service at the time of year
Crowding
Fashion
Religious or cultural factors
Special events
Celebrating Chinese New Year
Celebrating May Day
Celebrating National Day
3. Open-ended questions:
1) What do you think are the advantages of travelling during the time around:
- Chinese New Year?
_________________________________________________________________
_________________________________________________________________
_________________________________________________________________
- May Day holiday?
_________________________________________________________________
_________________________________________________________________
_________________________________________________________________
- National Day holiday?
_________________________________________________________________
_________________________________________________________________
_________________________________________________________________
202
2) What do you think are the disadvantages of travelling during the time around:
- Chinese New Year?
_________________________________________________________________
_________________________________________________________________
_________________________________________________________________
- May Day holiday?
_________________________________________________________________
_________________________________________________________________
_________________________________________________________________
- National Day holiday?
_________________________________________________________________
_________________________________________________________________
_________________________________________________________________
203
II.
Questionnaire targeting Chinese residents for Study Two
(Mandarin version)
您好,我叫陈亭真,是詹姆斯.库克大学的一名在读博士生。 我的专业是旅游管
理,方向是研究游客对旅游季节性现象的反应,特别是中国游客对黄金周出行
旅游的看法和感受。 感谢您参与我的问卷调查, 本问卷将花您 15 分钟的时间
完成所有的问题。 您的答卷不必署名,因此您所给的所有讯息也将是完全保密
的。 如果您想了解更多关于我的问卷调查,或者是关于我的研究项目的结果,
请拨打电话: +61 7 4781 6780, 或者发电子邮件给我: [email protected].
第一部分:
1) 年龄
A. 小于 18 岁 B. 18 ~ 30 C. 31 ~ 45 D. 46 ~ 60 E. 大于 60 岁
2) 性别
A. 男 B. 女
3) 学历: 您所取得的最高学历。 如果您目前仍在学习, 请给出您所取得的最高
学历。
A. 高中毕业及其以下
E. 研究生毕业
B. 专科毕业
F. 博士毕业
C. 大学本科在读
G. 其他 __________
D. 大学本科毕业
4) 职业: 您目前的职业是_________________________(请写出)。
5) 收入: 请指出您目前的月收入状况。
A. 没有收入
B. <¥1500
C. ¥1500~¥2999
D. ¥3000~¥4499
E. ¥4500~¥5999
F. ¥6000~¥7499
G. ≥¥7500
H. 其他 ______________________
6) 以往的旅游经历:
- 您曾到过多少个中国城市旅游(不含香港和澳门)?
E. 4
A. 0
B. 1
F. ≥5
C. 2
D. 3
- 您以往的国内游一般选择何时出游?
A. 周末
C. 五一节假期
B. 春节假期
D. 国庆节假期
204
E. 学校假期
G. 其他 ________________
F. 工作假期
- 您曾到过多少个国家和地区旅游(包括香港和澳门)?
E. 4
A. 0
B. 1
F. ≥5
C. 2
D. 3
- 您以往的海外游或港澳游一般选择何时出游?
A. 周末
B. 春节假期
C. 五一节假期
D. 国庆节假期
E. 学校假期
F. 工作假期
G. 其他 _______________
205
第二部分:
1) 如下因素多大程度上影响您出游时间的选择:
(7=影响非常大; 6=影响大; 5=影响有点大; 4=一般; 3=影响不是非常大; 2=影响
不大; 1=没有影响)
7=
影
响
非
常
大
6=
影
响
大
5=
影
响
有
点
大
4=
一
般
3=
影
响
不
是
非
常
大
2=
影
响
不
大
1=
没
有
影
响
多雨
非常高的温度(热)
非常低的温度(冷)
非常潮湿
阳光充足
学校的寒假、暑假等假期
工作假期
双休日/公共假日
您个人偏爱的出游季节
空闲时间
出行同伴
费用(包括住宿和交通)
该季节的旅游服务水平
拥挤
热点/精品旅游线路
宗教或文化因素
特殊活动(如网球公开赛,博览会等)
欢度春节
欢度五一假期
欢度国庆假期
第三部分:
1) 您觉得在下列各黄金周出行旅游好在哪:
- 春节假期?
_________________________________________________________________
_________________________________________________________________
_________________________________________________________________
- 五一节假期?
_________________________________________________________________
_________________________________________________________________
206
_________________________________________________________________
- 国庆节假期?
_________________________________________________________________
_________________________________________________________________
_________________________________________________________________
2) 您觉得在下列各黄金周出行旅游有什么不好的:
- 春节假期?
_________________________________________________________________
_________________________________________________________________
_________________________________________________________________
- 五一节假期?
_________________________________________________________________
_________________________________________________________________
_________________________________________________________________
- 国庆节假期?
_________________________________________________________________
_________________________________________________________________
_________________________________________________________________
207
III.
Question list interviewing Chinese tourism managers for
Study Three (English version)
1. Perceptions
What would you do to manage these patterns of seasonality?
a) The plateau
350000
300000
250000
200000
Arrivals
150000
Average
100000
50000
0
Jan Feb Mar
Apr May Jun July Aug Sep
Oct
Nov Dec
__________________________________________________________________
__________________________________________________________________
__________________________________________________________________
b) The plain
1200000
1000000
800000
Arrivals
600000
Average
400000
200000
0
Jan Feb Mar Apr May Jun Jul Aug Sep Oct Nov Dec
__________________________________________________________________
__________________________________________________________________
__________________________________________________________________
208
c) The basin
400000
350000
300000
250000
Arrivals
200000
Average
150000
100000
50000
0
Jan Feb Mar
Apr May Jun
Jul
Aug Sep
Oct
Nov Dec
__________________________________________________________________
__________________________________________________________________
__________________________________________________________________
d) The single-peak mountain
25000
20000
15000
Arrivals
10000
Average
5000
0
Jan Feb Mar Apr May Jun Jul Aug Sep Oct Nov Dec
__________________________________________________________________
__________________________________________________________________
__________________________________________________________________
e) The multi-peak mountain
70000
60000
50000
40000
Arrivals
30000
Average
20000
10000
0
Jan
Feb
Mar
Apr
May Jun
Jul
Aug Sep
Oct
Nov
Dec
__________________________________________________________________
__________________________________________________________________
__________________________________________________________________
209
f) The rolling hills
900000
800000
700000
600000
500000
400000
300000
200000
100000
0
Arrivals
Average
Jan Feb Mar Apr May Jun Jul Aug Sep Oct Nov Dec
__________________________________________________________________
__________________________________________________________________
__________________________________________________________________
2. Reactions
1) What do you think the advantages for business of:
- Chinese New Year?
__________________________________________________________________
__________________________________________________________________
__________________________________________________________________
- May Day holiday?
__________________________________________________________________
__________________________________________________________________
__________________________________________________________________
- National Day holiday?
__________________________________________________________________
__________________________________________________________________
__________________________________________________________________
2) What do you think the disadvantages for business of:
- Chinese New Year?
__________________________________________________________________
__________________________________________________________________
__________________________________________________________________
- May Day holiday?
__________________________________________________________________
__________________________________________________________________
__________________________________________________________________
- National Day holiday?
__________________________________________________________________
__________________________________________________________________
__________________________________________________________________
210
3) How much planning in terms of special products or services do you do for
Golden Weeks?
__________________________________________________________________
__________________________________________________________________
__________________________________________________________________
3. Planning for the future
1) What do you expect in the future for the Golden Weeks From the government?
From the customers? From the tourism industry?
__________________________________________________________________
__________________________________________________________________
__________________________________________________________________
2) What will you do to better meet the challenge of Golden Weeks travelling?
__________________________________________________________________
__________________________________________________________________
__________________________________________________________________
4. Demographic questions
1) What does your business belong to?
A. Hotel B. Transport C. Travel agency D. Attraction
2) How long have you managed business?
__________________________________________________________________
211
IV.
Question list interviewing Chinese tourism managers for
Study Three (Mandarin version)
1. 对旅游季节性现象的看法
您如何看待下列各种不同模型的旅游季节性现象?您的公司是否处于或经历
过类似的模型?您是如何面对和处理的?您曾采取过何种有效的措施吗?
a) 高原型
350000
300000
250000
200000
Arrivals
150000
Average
100000
50000
0
Jan Feb Mar
Apr May Jun July Aug Sep
Oct
Nov Dec
__________________________________________________________________
__________________________________________________________________
__________________________________________________________________
b) 平原型
1200000
1000000
800000
Arrivals
600000
Average
400000
200000
0
Jan Feb Mar Apr May Jun Jul Aug Sep Oct Nov Dec
__________________________________________________________________
__________________________________________________________________
__________________________________________________________________
212
c) 盆地型
400000
350000
300000
250000
Arrivals
200000
Average
150000
100000
50000
0
Jan Feb Mar
Apr May Jun
Jul
Aug Sep
Oct
Nov Dec
__________________________________________________________________
__________________________________________________________________
__________________________________________________________________
d) 单峰型
25000
20000
15000
Arrivals
10000
Average
5000
0
Jan Feb Mar Apr May Jun Jul Aug Sep Oct Nov Dec
__________________________________________________________________
__________________________________________________________________
__________________________________________________________________
213
e) 多峰型
70000
60000
50000
40000
Arrivals
30000
Average
20000
10000
0
Jan
Feb
Mar
Apr
May Jun
Jul
Aug Sep
Oct
Nov
Dec
__________________________________________________________________
__________________________________________________________________
__________________________________________________________________
f) 连绵型
900000
800000
700000
600000
500000
400000
300000
200000
100000
0
Arrivals
Average
Jan Feb Mar Apr May Jun Jul Aug Sep Oct Nov Dec
__________________________________________________________________
__________________________________________________________________
__________________________________________________________________
2. 对黄金周的反应
1) 您觉得您的公司在下列各黄金周的受益有哪些:
- 春节假期?
__________________________________________________________________
__________________________________________________________________
__________________________________________________________________
- 五一节假期?
__________________________________________________________________
__________________________________________________________________
__________________________________________________________________
- 国庆节假期?
__________________________________________________________________
__________________________________________________________________
__________________________________________________________________
214
2) 您觉得下列各黄金周给您的公司带来哪些不便?
- 春节假期?
__________________________________________________________________
__________________________________________________________________
__________________________________________________________________
- 五一节假期?
__________________________________________________________________
__________________________________________________________________
__________________________________________________________________
- 国庆节假期?
__________________________________________________________________
__________________________________________________________________
__________________________________________________________________
3) 您的公司曾针对黄金周推出何种特别策划,特殊旅游线路和服务吗?可以
简单举例说明吗?
__________________________________________________________________
__________________________________________________________________
__________________________________________________________________
3. 对黄金周旅游的期许
1) 您觉得在今后的黄金周里,各旅游相关部门应该如何努力来不断地提高和
完善我们的黄金周旅游体制?您希望政府部门怎么做?旅游相关行业怎么
做?对游客们的期许呢?
__________________________________________________________________
__________________________________________________________________
__________________________________________________________________
2) 您的公司有何策划来更好地应对黄金周?
__________________________________________________________________
__________________________________________________________________
__________________________________________________________________
4. 关于您的公司
1)您的公司属于旅游行业中的哪个部门?
A. 酒店,旅店 B. 旅游交通 C. 旅行社 D. 旅游景点
2)您的公司成立于哪一年?
__________________________________________________________________
215
V.
Public presentations of this research
A modified and condensed version of one part of Chapter Two of this thesis was
presented at the 14th Asia Pacific Tourism Association Annual Conference, Bangkok,
Thailand, 2008.
Chen, T. & Pearce, P.L. (2008). A comprehensive approach to Asian seasonality
patterns in tourism. In Y. Hwang (Ed.), Tourism proceeding 14th Asian Pacific
Tourism Association Annual Conference: Tourism & Hospitality in Asia
Pacific, Bangkok, Thailand, July 9 – 12, 2008, 465-474.
The conference paper received a Best Paper Award at the conference.
216

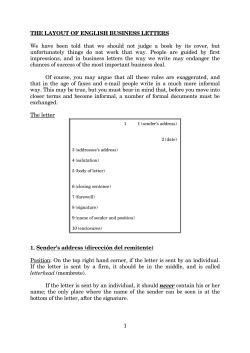


© Copyright 2026