
The Value of the Nonprofit Arts and Culture Field in Illinois
The Value of
the Nonprofit
Arts and Culture
Field in Illinois
A Social Return on
Investment Analysis
with Donors Forum
March 2015
SOCIAL IMPACT
RESEARCH CENTER
A
PROGRAM
Report Information
Report Authors: Amy Terpstra and Jennifer Clary
Research Team: Jennifer Clary, Amy Terpstra, Ariel Ruiz Soto, and Suniya Farooqui
Suggested Citation: Terpstra, A., & Clary, J. (2015, March). The value of the
nonprofit arts and culture field in Illinois: A social return on investment analysis.
Chicago: Social IMPACT Research Center with Donors Forum.
Advisory Committee Members:
Jennifer Armstrong, Illinois Arts Council Agency
Julie Burros, Chicago Department of Cultural Affairs and Special Events
Fatima Butler, Chicago Public Art Group
Brian Inman, Arts Alliance Illinois (formerly)
Ra Joy, Arts Alliance Illinois
Giselle Mercier, Elevarte Community Studio
Angelique Power, The Joyce Foundation
Jonathan Vandenbrug, Arts Alliance Illinois
Donors Forum gratefully acknowledges The Wallace Foundation for their support of
Building a Stronger Illinois: The Public Nonprofit Partnership Initiative.
Some of the data used for this report were provided by the Cultural Data Project
(“CDP”), an organization created to strengthen arts and culture by documenting and
dissemininating information on the arts and culture sector. Any interpretation of the
data is the view of the Social IMPACT Research Center at Heartland Alliance and
does not reflect the views of the Cultural Data Project. For more information on the
Cultural Data Project, visit www.culturaldata.org.
The Social IMPACT Research Center
The Social IMPACT Research Center is a program of Heartland Alliance, the leading antipoverty organization in the Midwest. IMPACT does research that helps leaders create change.
We collaborate with clients to measure and grow their social impact. Our user-friendly work
enables nonprofits, foundations, and governments to advance real-world solutions to poverty.
To learn more, visit www.socialimpactresearchcenter.org, follow us on Twitter
@IMPACTHeartland or like us on Facebook at www.facebook.com/social.impact.research.
Donors Forum
Donors Forum is the premier resource for networking and education, information and
knowledge, and leadership and advocacy on behalf of philanthropy and nonprofits in Illinois. As
a membership association of grantmakers, nonprofits, and advisors, Donors Forum serves its
constituents by promoting an effective and informed philanthropic and nonprofit sector.
Copyright © 2015 by the Social IMPACT Research Center at Heartland Alliance.
All rights reserved.
1 The Value of the Nonprofit Arts and Culture Field in Illinois
Table of Contents
Introduction and Key Findings...................................................................................................................................... 3
Determining Value................................................................................................................................................................... 6
Outcomes ................................................................................................................................................................................ 6
Beneficiaries.......................................................................................................................................................................... 6
Evidencing and Discounting......................................................................................................................................... 7
Assigning Value.................................................................................................................................................................... 8
More Discounting...............................................................................................................................................................10
Calculating Social Return............................................................................................................................................. 11
Understanding SROI Findings.....................................................................................................................................12
Appendices................................................................................................................................................................................13
Appendix A: Arts and Culture Field Survey.......................................................................................................13
Appendix B: Impact Maps............................................................................................................................................14
Appendix C: Calculating Social Return on Investment............................................................................ 18
Appendix D: Detailed Explanation of Sources and Methods for Each Outcome......................19
This report is available online at: www.socialimpactresearchcenter.issuelab.org
2 The Value of the Nonprofit Arts and Culture Field in Illinois
INTRODUCTION AND key findings
HoW To READ
This Report
This report is a narrative explanation
of the work of the arts and culture
field and the changes it brings
about in the world for individuals
and for society. The main chapter,
Determining Value, walks through the
arts and culture SROI process step
by step. The sidebar contains helpful
methodological explanations that
outline how and why decisions were
made. Readers who want the full set
of data sources, figures, and methods
should refer to Appendices B, C, and
D.
T
his Social Return on Investment (SROI) analysis compares the public and
private investment into the Illinois nonprofit arts and culture field to the
social and economic value it creates for the individuals who experience the
programs as participants, audience members, visitors and event-goers, and for
society as a whole.
Arts and culture programs encompass performing, visual, and fine arts as
well as heritage, folklife, digital media, applied arts such as architecture
and graphic design, and other creative activities. Arts and culture programs
are quite diverse, and while some focus on the generation, sharing, and
experiencing of art in its various forms, many arts and culture programs are
preventative in nature or use arts and culture as an intervention strategy.
The following activities and characteristics are illustrative of many arts and
culture programs:
• Provide classes, workshops, and camps to youth and adults focused
on developing artistic skills and using arts to give voice to or address
social issues
• Promote, produce, or provide access to a variety of arts and culture
experiences
• Stimulate curiosity, creativity, and thinking
• Use art as a therapeutic tool to explore and address trauma, and to
support improved mental and physical health more broadly
• Run activities and events to promote community engagement and civic
pride
• Provide leadership and employment opportunities for youth and adults
• Provide forums for artists to meet and engage in critique and shared
learning
• Saving and restoring historic sites, properties, and artifacts
• Collect and preserve artifacts and archival materials
• Hands on training focused on preservation and conservation skills
• Support cultural, educational, and social organizations and events
Key Findings
Almost $1.9 billion is invested in over 1,400 Illinois nonprofits that do arts and
culture work, and those groups engage individuals over 38 million times each
year. Only 7% of that investment is from public sources, and the remainder
is from private sources like foundations as well as earned income from ticket
sales, membership dues, and the like. What does this investment in Illinois’s
arts and culture field yield?
• Every dollar invested into the Illinois nonprofit arts and culture field
generates an estimated $27 in socio-economic value.
3 The Value of the Nonprofit Arts and Culture Field in Illinois
• $23 of this socio-economic value accrues to individuals participating in
nonprofit arts and culture programs, events, and activities.
• $4 of this socio-economic value accrues to society through increased
tax revenue, increased spending in the state due to arts and culture
jobs, and the ripple effect of audience spending in Illinois.
HoW IS sroi
DIFFERENT THAN
ROI?
The real utility of an SROI lies in its ability to reveal if and how our investments
into programs pay off. And on that, this SROI of the nonprofit arts and culture
field in Illinois is clear: investing in arts and culture yields dividends.
The SROI methodology uses the same
core concepts and calculations as a
Social Return on Investment Background
traditional ROI or cost benefit. Where
it differs is in the inclusion of outcomes
that are not strictly economic. With an
SROI, we explore all the outcomes
a field affects, research each one,
and include even the social and
environmental outcomes that have
enough evidence to justify their
inclusion. When it comes time to put
a value on the outcomes, we gather
How do we understand and communicate the value of nonprofits? As a field,
the tools we’ve had at our disposal to answer this question have yielded
unsatisfyingly incomplete answers. Cost-benefit analyses and return on
investment analyses, the most common and well-known tools for this sort of
purpose, were developed by investors and businesses to assess profits. This
is appropriate for investors and businesses as their main objective is making
money and turning a profit. However, these tools are insufficient when it comes
to capturing the value nonprofits create since for nonprofits value does not
equate turning money into dividends.
feedback from experts and use
reasonable judgment to ascribe proxy
values to the outcomes that don’t have
an inherent market value.
Put another way, a standard ROI
and cost benefit reflect the money
a program or policy or decision
generates and the money it saves (the
money that won’t have to be spent).
Our SROI studies include both money
generated and money saved due to
the work of the sector but adds in the
value we’ve calculated for the social
and environmental outcomes. Most
ROIs usually only include value that
accrues to one beneficiary, usually
society or taxpayers. We add in
the value that accrues to program
participants, too.
This is why our findings reflect a higher
ratio than you’re used to seeing; we
are being far more inclusive.
Value for nonprofits is a much broader concept. It’s about money generated or
costs avoided, sure, but it’s also about creating more abstract things like social
cohesion, civic engagement, or reduced human suffering.
Because the existing tools that measure value were designed for for-profit
enterprises, using them to assess the value of nonprofits by definition yields
an incomplete picture of nonprofit value. Because of this, nonprofits continue
to be thought of as charities, the work they do as kind and compassionate, but
ultimately dispensable when budgets get tight.
This has led Donors Forum to engage a research partner, the Social IMPACT
Research Center, and to explore other techniques that give equal weight
to—or at least space for—social and environmental value in addition to pure
economic value. Social Return on Investment (SROI) emerged as fitting this
bill.
SROI has roots in a California-based group called REDF that began
experimenting in the late 1990s with how to understand investments into social
enterprises against the impact of those social enterprises. SROI is not an
entirely new method—it’s a traditional return on investment model expanded
to suit organizations whose primary aims are to create positive change in the
world. It’s a framework that starts with the economic role nonprofits play—as
job creators, as avoiders of costly social problems—but that also includes
the social and the environmental role nonprofits play—as builders of human
capital, as pillars in communities, as protectors of air, land, and water.
4 The Value of the Nonprofit Arts and Culture Field in Illinois
The SROI concept garnered attention and considerable traction in Europe.
REDF’s original concept and methods have been refined there with the
emergence of the European SROI Network in 2004, nef’s primer on the
subject released later that same year, followed by several other guides in
2005 through 2007. This eventually led to the founding of the SROI Network
in 2008, which, with the support of the UK Cabinet Office, released a guide
to conducting SROI and has been providing thought leadership, tools, and
methodological guidance for the analytical framework ever since. SROI
Network affiliates have opened in countries around the world, including the
United Kingdom, Australia, France, The Netherlands, Sweden, and Japan.
Using a Social Return on Investment analysis for three nonprofit fields in
Illinois, youth development, arts and culture, and environment, Donors Forum
is in essence proposing a paradigm shift in how we define and measure value
and how to think about the important role Illinois nonprofits play in making the
state a better place to live, work, and play.
5 The Value of the Nonprofit Arts and Culture Field in Illinois
determining value
methodological
iNSIGHTS
We begin the SROI process by
establishing a theory of change
for the arts and culture field, which
crystallizes what change the work of
arts and culture programs bring about.
In addition to research, a group of
stakeholders—experts on arts and
culture—helped do this.
OUTCOMES...Change Created by the Arts and Culture Field
Arts and culture programs have an impact in many different areas. The
programs:
• Increase economic security and workforce engagement
• Increase social, emotional, and physical well-being
• Increase economic development
• Create stronger communities through increased social cohesion
• Reduce crime
• Preserve art, artifacts, and relics which contribute to greater
understanding of human history
• Increase critical thinking and problem-solving abilities, a more
inquisitive and perceptive mind
• Increase awareness of and access to needed services
• Increase community vibrancy and uniqueness
Some of these outcomes are more closely linked to the work of arts and
culture nonprofits and more easily substantiated than others. For instance,
arts and culture practitioners on a daily basis see how their programs help
people better understand their own histories to foster greater understanding of
what ties people together, thereby making participants less likely to disrespect
others, resulting in reductions in crime and victimization. But this sort of chain
of events has not been sufficiently evidenced with research to warrant its
inclusion in this analysis.
Another example is physical health. While it widely accepted that arts and
culture can contribute to improved healing times for surgical patients, for
example, evidence is lacking when it comes to understanding the impact of
arts and culture on physical health more broadly, and thus physical health is
less present than social or emotional health in this analysis.
The outcomes that rose to the top as warranting inclusion after a researchbased reality check are:
• Increase economic security and workforce engagement
• Increase social, emotional, and physical well-being
• Increase economic development
• Stronger communities
BENEFICIARIES...The People and Groups that Experience the Changes
Here is where we determined
who benefits from arts and culture
programs. The expert stakeholders
The outcomes are experienced uniquely by participating individuals and by
society.
6 The Value of the Nonprofit Arts and Culture Field in Illinois
once again helped us sort this out.
Conceivably, all sorts of people
and groups benefit from arts and
culture…from participating individuals
to businesses to communities.
We opted to stay focused on the
primary beneficiaries, participating
individuals, and society since “society”
encompasses the communities and
As the people who experience the programs first-hand, individual participants
in arts and culture activities and events benefit directly and personally
from arts and culture programs. Arts and culture participants are different
from participants in other fields in that they may not actually be distinctly
participating in a program. Rather, participating individuals may be audience
members or people attending a museum, for instance, either from Illinois or
from other places. Using this understanding of who benefits from arts and
culture programs we are able to assess the impact of Illinois arts and culture
organizations on anyone they touch.
systems all Illinoisans experience and
rely on.
Of the list of outcomes above, participating individuals experience increased
economic security, increased social, emotional, and physical well-being, and
strengthened communities because of nonprofit arts and culture programs.
Society—taxpayers, institutions, the shared economy—also benefits, though in
a slightly different way, by the impact of arts and culture programs on fostering
increased workforce engagement and economic development, and stronger
communities.
EVIDENCING AND DISCOUNTING...Substantiating Claims but Not Over
Claiming
This next step involves finding
evidence to support the claim that arts
and culture programs create these
changes in Illinois. With this being a
field-wide analysis, it’s obviously not
feasible to gather the necessary data
from each arts and culture program in
the state because a) no two programs
are collecting the exact same outcome
data in the exact same way, b)
programs are likely not collecting all
the different types of outcome data
needed, and c) even if they are, they
don’t have to give it to anyone who
asks.
So, we had to look elsewhere to
evidence these outcomes. We
used a combination of secondary
data sources (like the U.S. Census
Bureau’s American Community
Survey), a survey of arts and culture
nonprofits in Illinois conducted for the
purposes of this project, and studies/
evaluations done on arts and culture
programs.
Each of these benefits or outcomes can be operationalized and quantified into
something more concrete. The evidence that arts and culture programs create
positive change that is important to participating individuals can be seen in the
following ways:
Arts and culture programs increase economic security for participating
individuals:
• the number of youth graduating minus the number that would have
graduated anyway without being in a program.
• the number of people employed by nonprofit arts and culture programs
minus the number who likely would have had employment in other
fields in the absence of arts and culture programs.
Arts and culture programs increase social, emotional, and physical wellbeing for participating individuals:
• the number of participating individuals involved in civic, social, and
community activities minus the number who would be engaged in these
ways even without exposure to nonprofit arts and culture programs,
events, or activities.
• the number of participating individuals who experience reduced stress
or anxiety minus the number who would have experienced reduced
stress or anxiety without exposure to nonprofit arts and culture
programs, events, or activities.
• the number of participating individuals with positive self-concept or selfesteem minus the number who would have had positive self-concept
or self-esteem without exposure to nonprofit arts and culture programs,
7 The Value of the Nonprofit Arts and Culture Field in Illinois
The other important thing going on
events, or activities.
here is that we are being very careful
to not over claim the impact of arts and
culture programs. We are discounting
impact by subtracting out what would
likely have happened anyway, since,
for example, most kids would graduate
high school even if they weren’t in
Arts and culture programs increase social cohesion and tolerance
through increased cultural understanding and awareness for
participating individuals:
• the number of individuals participating in Illinois nonprofit arts and culture
programs, events, and activities who experience increased understanding
or awareness of different cultures and lifestyles.
an arts and culture program. When
possible, we use studies on arts and
culture programs that have control
The evidence that arts and culture programs create positive change that is
important to society can be seen in the following ways:
groups to isolate the effect of the arts
and culture program on each outcome.
See Appendix D for details on all data
sources and methods used.
How is SROI different than program
evaluation or a research study? An
evaluation seeks to determine how
well a program is meeting its goals,
essentially how effective the program
is in changing the things it sets out to
change. Evaluations generally yield
results like, “73% of participants in
the program voted in the last election,
compared to 63% of the control group
youth who did not participate in the
program.”
SROI studies are very different. Their
primary purpose is to determine the
value of the change programs or the
field creates in the world. Evaluation
findings are a critical input in SROI
studies and are used as evidence
that programs in the sectors really do
create the changes they set out to
make.
Here is where SROI really
distinguishes itself. We do the same
thing that an ROI or cost benefit
analysis would do by calculating
Arts and culture programs increase workforce engagement throughout
Illinois:
• the number of arts and culture field full-time equivalents that spend their
money in Illinois communities minus the number who would likely find
employment in another field if the arts and culture field didn’t exist.
• the number of youth who pay more taxes because they graduate high
school minus the number that would have graduated anyway without
being in an arts and culture program.
Arts and culture programs increase economic development throughout
Illinois:
• the number of cultural tourists who visit communities throughout the
state of Illinois and spend money in those communities beyond the cost
of admission to arts and culture events and activities.
• the number of audience members whose spending towards arts
and culture events and activities contribute to generating jobs in the
economy and as a result increase household income in the state.
• the number of audience members whose spending towards arts and
culture events and activities has a ripple effect that contributes to
increased local and state revenue.
ASSIGNING VALUE...Expressing Value in Dollars Even When an Outcome
Seems Social Not Economic
For each positive change that arts and culture programs create for youth
and their families and for society, value is created. Some of the value that
is created is quite easily put into monetary terms, such as how much more
money a person will earn annually with a high school diploma than without
one. For other outcomes, such as people being more civically engaged, the
value is less tangible because it does not have an inherent market value.
Nonetheless, it is critically important to determine the value of all the positive
change arts and culture programs create, not just the values that are easy
to look up with a quick Internet search. Otherwise, the true value of arts and
culture programs will be greatly understated.
the monetary value of each clearly
8 The Value of the Nonprofit Arts and Culture Field in Illinois
monitizable result of the field’s work—
money that’s generated and money
saved through avoided costs. But we
The value of arts and culture programs in Illinois accrues distinctly to
participating individuals and to society. Participating individuals reap the
following value as a result of arts and culture programs:
also do the same thing for the results
that are more social in nature and do
not have a clear market value, like
wages earned or spending avoided
do. In essence, we use a monetary
stand-in or a proxy value for the social
outcomes in order to give them more
equitable and concrete standing and
Arts and culture programs increase economic security for participating
individuals:
• For the youth who will graduate high school thanks to arts and culture
programs, each will earn $7,732 more annually on average than if they
dropped out.
• For the individuals who are employed in FTE jobs in the nonprofit arts
and culture field, each will net $32,354 annually on average.
to present a more holistic picture of the
value created by nonprofits.
All these monetary values have
been thoroughly researched and
informed by stakeholders who know
and understand arts and culture.
Where several approaches for
valuing outcomes emerged, we used
averaging or the most conservative
one.
All values are represented in 2013
dollars. Read all about the sources
and methods used for assigning value
in Appendix D.
Here is an example of an outcome
that doesn’t have an easily identifiable
market value. Most people would
agree that participating in arts and
culture activities and events helps
increase understanding of different
cultures and lifestyles, leading to
increased social cohesion or tolerance.
But how do you express that value in
dollars? One way to think about it is,
how else would someone learn about
different cultures or ways of life if they
weren’t involved in arts and culture
programs, and what’s the cost of those
alternate activities? In this instance,
attending a museum might reasonably
instill increased cultural understanding
Arts and culture programs increase social, emotional, and physical wellbeing for participating individuals:
• For the individuals involved in civic, social, and community activities
because of arts and culture programs, they each are receiving a benefit
that equates to the average individual campaign donation, $67, since
donating to a campaign could achieve the same type of engagementrelated outcome for people.
• For the individuals who experience improved mental or physical health,
they each are receiving a benefit that equates to the value of cognitive
behavioral therapy (CBT), $1,875, since therapy could achieve the
same stress- and anxiety-relieving effect as arts programming.
• For the individuals who experience increased life satisfaction through
volunteering for and helping to advance the missions of arts and culture
programs, the benefit to them is $1,313, the per person annual value of
charitable giving.
• For the individuals who engage in creative expression towards personal
development and a better understanding of the self, they each receive
a benefit that equates to the value of an arts-related class, $414.
Arts and culture programs increase social cohesion and tolerance
through increased cultural understanding and awareness for
participating individuals:
• For the individuals who participate in arts and culture programs, events,
and activities and thus have increased understanding of different
cultures and lifestyles, they each receive a benefit that equates to the
value of what one would pay to visit an Illinois museum, $11.
Society experiences a different sort of value, even when it experiences the
same positive changes that participating individuals experience:
Arts and culture programs increase workforce engagement throughout
Illinois:
• The value to society of the youth who pay more taxes because they
graduate high school is $2,597, which is the difference between annual
total taxes paid by a high school graduate and a drop out.
• The value to society of the economic ripple effect of each arts and
9 The Value of the Nonprofit Arts and Culture Field in Illinois
and awareness. So, we can research
the cost of museum admission and
use that dollar value as a proxy for
the value of arts and culture programs
culture field full-time equivalent job is $58,546, which is the value
of one nonprofit arts and culture job in taxes paid, wages spent in
communities, and the corresponding spending that those dollars
facilitate.
as it relates to social cohesion for
participating individuals.
Our approach to evidencing outcomes
and valuing them relies on using
the best available research and
information in a common-sense
manner. We recognize that this is
inherently imprecise and doesn’t
constitute rigorous evaluation. We
believe that at the sector or field level,
it is directionally accurate.
Arts and culture programs increase economic development throughout
Illinois:
• The value to society of increased economic development through
tourism that happens as a result of arts and culture programs is $30
per cultural tourist, the average spending of cultural tourists beyond the
price of admission to an event or activity.
• The value to society of arts and culture tourists and audiences is $34,
which is the amount that household income increases as a result of
audience spending generating jobs in the economy.
• The value to society of increased economic development through
tourism that happens as a result of arts and culture programs is $7 for
each tourist or audience member, which is the amount of increased
state and local revenue as a result of audience spending.
MORE DISCOUNTING..Accounting for Weakening Effects Over Time and
Other Non-Monetary Investments
This concept—what would have
happened naturally in the absence
of the program—is called the
“counterfactual” in research terms. In
SROI-speak, it’s called “deadweight.”
In an effort to not over claim arts and culture’s contribution to creating change
for participants and society, we’ve already excluded the portion of results that
would likely have happened even in the absence of arts and culture programs.
There are several other ways we must discount impact in order to further
ensure we’re not over attributing impact to arts and culture programs.
First, we have to assess whether the outcomes last beyond the duration of
programming. For example, to the degree that arts and culture programs
help facilitate high school graduation, the question becomes: does the benefit
of high school graduation extend beyond the moment in time in which it is
achieved? Obviously, the answer here is yes; no one un-graduates high
school, so the benefit of a high school diploma—higher earnings potential—
lasts a lifetime.
This SROI analysis of the Illinois
nonprofit arts and culture field
covers the 5-year impact of 1 year
of programming. This is in contrast
to other approaches that sometimes
estimate the life-long impact.
Appendix D has all the detail
about what duration and drop-off
we ascribed, with the help of our
stakeholders and research, to each
outcome.
Other outcomes, like reduced stress or anxiety, aren’t so clear cut. Once a
participant is no longer engaged in the arts and culture program, event, or
activity, they will have to find other outlets or strategies for managing their
stress and anxiety. So there is little to no effect that lingers into the postprogram years.
In instances where the outcome duration lasts beyond the year in which arts
and culture programs are providing services, there is one more time-related
consideration: does the magnitude or strength of the outcome drop-off in
subsequent years? For example, there is a case to be made that increased
understanding and awareness of different cultures and lifestyles resulting in
increased social cohesion in one year makes it much more likely a participant
10 The Value of the Nonprofit Arts and Culture Field in Illinois
will continue to have increased tolerance and understanding in subsequent
years. But the without the direct engagement with arts and culture, the
awareness-boosting affect is likely less, so it’s important to discount the social
cohesion impacts of arts and culture in the post-program years.
This concept in SROI terms is called
attribution.
The final consideration for discounting impact has to do with whether the
investments made into the arts and culture field—the nearly $1.9 billion
from public and private funders—is the only investment that can lay claim to
facilitating the outcomes. In addition to monetary resources, nonprofits often
rely on volunteers and in-kind donations, which represent money that didn’t
have to be spent, so we also subtract out the share of the arts and culture
field’s impact that can be attributed to volunteers and in-kind donations.
CALCULATING SOCIAL RETURN
It’s easier to understand this by looking
at a table that lays out all the numbers.
If you’re interested, see Appendices B
and C.
To determine the SROI, we first multiply the quantity associated with each
outcome by its financial proxy value and then subtract out the deadweight and
attribution shares. For the outcomes that will last past the program year, we do
the same for each subsequent year up to post-program year 5, reducing each
estimate by the drop-off share.
The next step is to apply something called a discount rate. A discount rate is
an accounting principle applied to estimates of future value. It honors the idea
that money today is more desirable—it has more utility and less risk—today
than 5 years down the road. After applying the discount rate of 10% to each
year, then adding those values together and subtracting the value of the initial
$1.9 billion investment into the arts and culture field in Illinois, the resulting
number is the net present value.
From there, the math is simple: divide the net present value over the initial
investment.
The Illinois nonprofit arts and culture field creates $27 in socio-economic value
for every dollar invested, $23 of which is experienced by the participating
individuals and $4 of which is experienced by society.
11 The Value of the Nonprofit Arts and Culture Field in Illinois
understanding sroi findings
T
sroi
RESOURCES
Want to understand what SROI is all
about?
The SROI Network
REDF’s SROI portfolio
nef
The Canadian Community Economic
Development Network
Considering doing an SROI and
want more detail?
The SROI Networks’ Guide to SROI
A report on Valuing SROI
Need some examples of how others
have done SROI?
The Children’s Aid Society’s SROI of
Community Schools
The SROI Network’s collection of
SROI case studies
Women’s Support Network’s report on
three SROI pilot projects
his SROI analysis compares the money from public and private sources
that is invested in the arts and culture field in Illinois to the value that
the field creates for participating individuals and for society. The finding is
expressed as a ratio: For every $1 that is invested into this sector, $27 are
generated in economic and social benefits. Any dollar value that the sector
generates above $1 means that the investment in the program has not only
paid for itself but has generated additional value. The higher the SROI finding,
the bigger the bang for the buck.
Because this SROI analysis is inclusive of social outcomes that are usually not
considered in traditional return on investment analyses, and because we add
together the value that the participating individuals get and the value society
experiences because of this field, the SROI findings ratio is higher than most
people are used to seeing.
This is not to say this SROI is 100% inclusive. On the contrary, there were
many outcomes that our expert advisors and providers felt were important,
like that arts and culture programs help individuals develop a more thoughtful
and inquisitive mind. After investigating all the outcomes, however, we could
only include those for which there was evidence. Quite simply, the research
base was sorely lacking in its examination of many arts and culture program
outcomes, including impact on how people think.
The funding, research, and policy world should take note: though SROI helps
us see a broader picture of impact and value, we’re still only illuminating a
piece of the picture. Until investments and commitments to conducting ongoing
rigorous research for arts and culture are made, we’ll be unable to get that
complete picture that we desire.
This is to say that in a perfect world where all the necessary research existed
to give us great evidence for all SROI calculations, individual SROI studies
would be comparable. But in the real world, with its lack of sufficient evidence
to substantiate all outcomes, that’s not the case. So SROI studies, at least this
arts and culture SROI and the others Donors Forum has commissioned, vary
in how comprehensive they are in capturing the change fields and programs
create—to compare is a false enterprise.
Where the real utility in an SROI lies is in its ability to assure us that our
investments pay off and to demystify exactly how they pay off. And on that, this
SROI of the nonprofit arts and culture field in Illinois is clear: investing in arts
and culture yields dividends.
12 The Value of the Nonprofit Arts and Culture Field in Illinois
APPENDIX A
ARTS AND CULTURE FIELD SURVEY
To construct this SROI analysis of the arts and culture field in Illinois, we obtained data compiled by the Cultural Data Project (CDP) from nonprofit arts and culture
organizations throughout the state of Illinois to use as basic input and output data. The Cultural Data Project is an organization created to strengthen arts and
culture by documenting and disseminating information on the arts and culture sector.
CDP provided data for all arts and culture organizations in Illinois that had completed a CDP Data Profile as of September 24, 2014—a total of 888 organizations,
representing 60% of arts and culture nonprofits in Illinois. Responses to each question were weighted by the share of contributing organizations to estimate totals
for the entire nonprofit arts and culture field in Illinois.
13 The Value of the Nonprofit Arts and Culture Field in Illinois
APPENDIX B
IMPACT MAPS
The following impact maps lay out the theory of change for the nonprofit arts and culture field in Illinois. There are two maps: one displaying what changes
for participating individuals and another displaying what changes for society—taxpayers, institutions, the shared economy—as a result of the nonprofit arts
and culture field working in communities throughout the state. They are called impact maps because they logically lay out the connections between the
economic, social, and/or environmental change the field creates, how many people are impacted, and what the value of that is to those impacted.
This SROI and these impact maps reflect a 5-year time horizon of impact for 1 year of programming. This is to say that this is not an analysis of a lifetime
value.
These two impact maps are high-level summaries of this analysis. Appendix C is the natural extension of these Appendix B impact maps and lays out the
investments into the nonprofit arts and culture field and compares those total investments to the discounted impact of the field—resulting in the SROI
finding. Appendix D examines each row of each impact map and spells out all of the data sources, rationale, and any assumptions used in conducting the
analysis.
14 The Value of the Nonprofit Arts and Culture Field in Illinois
PARTICIPATING INDIVIDUALS
Discounting Impact (how much
others contributes to change)
Outcomes (what changes)
Description
How would
the
beneficiary
describe the
changes?
Increased
economic
security
Increased
social,
emotional, and
physical well
being
Outcome
Indicator
Financial
Proxy
Value
Calculating
Impact
Quantity
Duration
Outcomes
start
How much
change
was there?
How many
years
does it
last after
end of
program?
Does it
start in
during the
program
or after
What is
the value
of the
change?
Deadweight
Attribution
Dropoff
Quantity times
financial proxy,
less deadweight,
displacement and
attribution
How would the
program describe
the changes?
How do you
measure it?
Youth graduate
from high school
# youth
graduating
202,269
5
After
$7,732
78%
20%
0%
$275,240,051
People are
employed in
nonprofit arts and
culture sector
# FTE jobs in
sector
13,189
0
During
$32,354
59%
20%
0%
$138,935,285
Participants are
involved in civic,
social, and
community
activities
# voters
22,156,663
5
During
$67
63%
20%
25%
$437,275,796
Participants have
improved mental
health
# participants with
reduced stress or
anxiety
5,019,308
0
During
$1,875
38%
20%
0%
$4,705,601,073
Increased life
satisfaction
# volunteers
104,061
0
During
$1,313
27%
20%
0%
$79,792,513
Personal
development/selfactualization/creativ
e expression
# participants with
positive self
concept
30,888,048
5
During
$414
0%
20%
25%
$10,227,922,519
15 The Value of the Nonprofit Arts and Culture Field in Illinois
Strengthened
communities
Increased social
cohesion/tolerance
# participants in
arts and culture
activities/events
20,849,432
5
During
$11
0%
20%
25%
$187,049,194
16 The Value of the Nonprofit Arts and Culture Field in Illinois
SOCIETY
Discounting Impact (how much
others contributes to change)
Outcomes (what changes)
Description
How would
the
beneficiary
describe the
changes?
Increased
workforce
engagement
Increased
economic
development
Outcome
How would the
program describe
the changes?
Indicator
How do you
measure it?
Financial
Proxy
Value
Calculating
Impact
Quantity
Duration
Outcomes
start
How much
change
was there?
How many
years
does it
last after
end of
program?
Does it
start in
during the
program
or after
What is
the value
of the
change?
Deadweight
Attribution
Dropoff
Quantity times
financial proxy,
less deadweight,
displacement and
attribution
People are
employed in
nonprofit arts and
culture sector
# FTE jobs in
sector
13,189
0
During
$58,546
59%
20%
0%
$251,408,305
Youth graduate
high school
# youth graduate
202,269
5
After
$2,597
78%
20%
0%
$92,443,920
Increased tourism
# of cultural
tourists
38,610,060
5
During
$30
0%
20%
25%
$926,125,269
Increased
household income
due to audience
spending
# participants in
arts and culture
activities/events
38,610,060
5
During
$34
0%
20%
25%
$1,047,807,431
Increased local and
state revenue due
to audience
spending
# participants in
arts and culture
activities/events
38,610,060
5
During
$7
0%
20%
25%
$214,028,919
17 The Value of the Nonprofit Arts and Culture Field in Illinois
APPENDIX C
CALCULATING SOCIAL RETURN ON INVESTMENT
Government investment in
nonprofit arts and culture
programs
Private investment in nonprofit
arts and culture programs
Total Investment
$127,537,981
$1,748,880,252
$ 1,876,418,233
Program Year
Year 1
Year 2
Year 3
Year 4
Year 5
Total
$18,215,946,305
$13,407,893,100
$10,147,840,817
$7,702,801,606
$5,869,022,197
$4,493,687,641
Present value of each year
(Discount rate = 10%)
$18,215,946,305
$12,188,993,727
$8,386,645,304
$5,787,228,855
$4,008,621,130
$2,790,226,475
Total Present Value (PV)
$51,377,661,796
Net Present Value (PV minus the
investment)
$49,501,243,563
Social Return Value per amount invested in Illinois’s nonprofit arts and culture field
$27
Note: There is no set standard for what discount rate to use in SROI or in other forms of value assessment like ROI and cost-benefit analyses. Some
analysts use the U.S. Treasury Rate, which is relatively low and amounts to discounting future value by only 1-3%. Others opt to use rates more in line with
high-risk investing, upwards of 20%. In an effort to acknowledge the uncertainty associated with predicting future outcomes of social and environmental
programs and to acknowledge that value today is more desirable than value at some point in the future, this analysis applies a 10% discount rate over 5
years.
18 The Value of the Nonprofit Arts and Culture Field in Illinois
APPENDIX D
DETAILED EXPLANATION OF SOURCES AND METHODS FOR EACH OUTCOME
This appendix examines each row of the impact maps in Appendix B and spells out all of the data sources, rationale, and any assumptions used in
conducting the analysis. The column headings from the impact maps in Appendix B are transposed as row headings in the following tables here in
Appendix D.
While these tables lay out the numbers used and the calculations performed, it is important to note that if a person tries to recreate the calculations with a
calculator, he or she will in most instances not arrive at the exact final numbers. This is because in our calculations we most often used unrounded
numbers and here we present rounded numbers for clarity sake.
All dollar values are in 2013 dollars.
We used the most rigorous studies possible to evidence outcomes, though endeavoring to do this often revealed holes in the research base more than it
yielded satisfyingly appropriate studies. Where there was no solid evidence that the field produced a certain outcome, we excluded that outcome from this
analysis.
Where assumptions needed to be made, we sought out the expert advice of the project advisors, applied common sense and logical thinking, and then
made very conservative assumptions so as not to overstate the impact of the field.
19 The Value of the Nonprofit Arts and Culture Field in Illinois
PARTICIPATING INDIVIDUALS: Increased Economic Security—Youth Graduate
Nonprofit arts and culture organizations serve to increase their participants’ economic security when, with the help of youth-oriented arts and culture programs, the
participants graduate from high school, thereby increasing their potential earning power.
Quantity: How much
change was there?
202,269, youth
graduating
From the Cultural Data Project, we learn that Illinois arts and culture programs, events, and institutions experienced
1
38,610,060 participation instances in the course of a year. 0.5 percent of all people in the United States are low-income
2
17 year olds, the age at which a youth is closest to graduation age. Research shows that graduation rates for low
3
socioeconomic status youth with high exposure to the arts is 96%.
((38,610,060 * 1%) * 96% = 202,269 youth graduating
Duration: How
many years does it
last after end of
program? (maximum
of 5 years)
Outcomes Start:
Does it start during
the program or after?
Financial Proxy
Value: What is the
value of the change?
Discounting
Impact: Deadweight
Discounting
Impact: Attribution
5 years
The earning power of having a high school diploma over not having one lasts beyond the year the diploma is earned.
After
Some youth likely graduate high school while still involved in arts and culture programs, but many will not.
$7,732, the
annual earnings
differential
between those
with a high
school diploma
and those
without
The median annual earnings for an Illinoisan without a high school diploma or equivalency is $19,688 compared to
4
$27,420 for those with a high school diploma or equivalency.
78%
Research shows that 78% of low socioeconomic status youth graduate high school even without involvement in the arts.
20% of this
outcome can be
There are two other potential major “investments” into nonprofit arts and culture programs that can take some of the credit
6
for producing this outcome: volunteers and in-kind donations. The total value of volunteer hours in Illinois is $7.2 billion.
$27,420 - $19,688 = $7,732 more in annual earnings potential for high school graduates.
5
1
See Appendix A for details on the Cultural Data Project.
U.S. Census Bureau’s 2013 American Community Survey 1-year estimates program. Low-income refers to annual household incomes below 200% of the federal poverty level.
Catterall, J., Dumais, S., & Hampden-Thomspon, G. (2012, March). The arts and achievement in at-risk youth: Findings from four longitudinal studies. Available at http://arts.gov/sites/default/files/Arts-At-RiskYouth.pdf
4
U.S. Census Bureau’s 2012 American Community Survey 1-year estimates program. 2012 wages inflated to 2013 dollars using the U.S. Department of Labor, Bureau of Labor Statistics’ CPI Detailed Report Data for
November 2014, available at http://www.bls.gov/cpi/cpid1411.pdf. 2012 to 2013 inflation factor is 1.0146.
5
Catterall, J., Dumais, S., & Hampden-Thomspon, G. (2012, March). The arts and achievement in at-risk youth: Findings from four longitudinal studies. Available at http://arts.gov/sites/default/files/Arts-At-RiskYouth.pdf
6
Corporation for National & Community Service. Volunteering and civic engagement in Illinois. Available at http://www.volunteeringinamerica.gov/IL. Reflects 2013.
2
3
20 The Value of the Nonprofit Arts and Culture Field in Illinois
attributed to inkind donations
7
The entire Illinois nonprofit sector has a combined revenue of $73 billion and the arts and culture programs included in
8
this analysis have a total revenue of $3.2 billion, which is 4.4% of the total nonprofit revenue in the state. Multiply the $7.2
billion of volunteer time value by 4.4% to estimate the share of the volunteer time value that belongs to the arts and culture
field. Divide that figure by the $3.2 billion in arts and culture field revenue to arrive at 9.8%, which is how much the value of
volunteer time represents of the total environment field revenue.
($7,200,000,000 * (3,205,192,726 / $73,312,774,643)) / 3,205,192,726 = 9.8%
There are no good data sources to understand the total value of in-kind donations to programs in the Illinois arts and
culture field. In light of this, we estimated the in-kind donation value to be equal to that of the value of volunteer time and
so double the 9.8% and round to a 20% attribution discounting rate.
Discounting
Impact: Drop-off
0%
While the earning power of a high school diploma has dropped off over the course of the last several decades, it is unlikely
that there would be noticeable depreciation in a 5-year time period.
Calculating Impact
Quantity times financial
proxy, less
deadweight,
displacement and
attribution
Calculating Social Return
Year 0
Year 1
Year 2
Year 3
Year 4
Year 5
$275,240,051
$-
$275,240,051
$275,240,051
$275,240,051
$275,240,051
$275,240,051
7
8
Discount rate = 10%
Urban Institute. National Center for Charitable Statistics. Available at http://nccsweb.urban.org/tablewiz/tw.php
See Appendix A for details on the Cultural Data Project.
21 The Value of the Nonprofit Arts and Culture Field in Illinois
PARTICIPATING INDIVIDUALS: Increased Economic Security—People Are Working
Nonprofit arts and culture programs employ people, providing wages and work experience.
Quantity: How much
change was there?
13,189, full-time
equivalents
working in the
arts and culture
field
From the Cultural Data Project, we learn that Illinois arts and culture programs, events, and institutions employ 13,189 full9
time equivalent employees.
Duration: How
many years does it
last after end of
program? (maximum
of 5 years)
Outcomes Start:
Does it start during
the program or after?
Financial Proxy
Value: What is the
value of the change?
0 years
Employment in the field lasts for the duration of the program year.
During
The benefit of paid work begins and ends during the program period.
$32,354, the
annual net
income of people
employed in arts
and culture
Inflate to 2013 dollars the average annual earnings of several arts-related occupations (fine artists, craft artists, and all
10
11
other related artists and related workers) and subtract out the total estimated taxes paid annually, to get $32,354, the
annual net income of people employed in arts and culture.
Discounting
Impact: Deadweight
59%
59% of Illinoisans age 16 and over are employed, so we assume that if their arts and culture field job weren’t available,
12
59% of employees would find work elsewhere.
Discounting
Impact: Attribution
20% of this
outcome can be
attributed to inkind donations
There are two other potential major “investments” into nonprofit arts and culture programs that can take some of the credit
13
for producing this outcome: volunteers and in-kind donations. The total value of volunteer hours in Illinois is $7.2 billion.
14
The entire Illinois nonprofit sector has a combined revenue of $73 billion and the arts and culture programs included in
15
this analysis have a total revenue of $3.2 billion, which is 4.4% of the total nonprofit revenue in the state. Multiply the
$7.2 billion of volunteer time value by 4.4% to estimate the share of the volunteer time value that belongs to the arts and
culture field. Divide that figure by the $3.2 billion in arts and culture field revenue to arrive at 9.8%, which is how much the
value of volunteer time represents of the total environment field revenue.
9
See Appendix A for details on the Cultural Data Project.
Bureau of Labor Statistics. Occupational Outlook Handbook, 2014-15 edition, craft and fine artists. Available at http://www.bls.gov/ooh/arts-and-design/craft-and-fine-artists.htm#tab-5. 2012 wages inflated to 2013
dollars using the U.S. Department of Labor, Bureau of Labor Statistics’ CPI Detailed Report Data for November 2014, available at http://www.bls.gov/cpi/cpid1411.pdf. 2012 to 2013 inflation factor is 1.0146.
11
See Appendix D, SOCIETY: Increased Workforce Engagement and Economic Development—People are Employed in Nonprofit Arts and Culture Jobs and Pay Taxes and Spend Their Wages in Illinois
Communities.
12
U.S. Census Bureau’s 2012 American Community Survey 1 year estimates program.
13
Corporation for National & Community Service. Volunteering and civic engagement in Illinois. Available at http://www.volunteeringinamerica.gov/IL. Reflects 2013.
14
Urban Institute. National Center for Charitable Statistics. Available at http://nccsweb.urban.org/tablewiz/tw.php
15
See Appendix A for details on the Cultural Data Project.
10
22 The Value of the Nonprofit Arts and Culture Field in Illinois
($7,200,000,000 * (3,205,192,726 / $73,312,774,643)) / 3,205,192,726 = 9.8%
There are no good data sources to understand the total value of in-kind donations to programs in the Illinois arts and
culture field. In light of this, we estimated the in-kind donation value to be equal to that of the value of volunteer time and
so double the 9.8% and round to a 20% attribution discounting rate.
Discounting
Impact: Drop-off
0%
Since this outcome does not accrue past the program, there is no need to calculate drop off.
Calculating Impact
Quantity times financial
proxy, less
deadweight,
displacement and
attribution
Calculating Social Return
Year 0
Year 1
Year 2
Year 3
Year 4
Year 5
$138,935,285
$138,935,285
$-
$-
$-
$-
$-
Discount rate = 10%
23 The Value of the Nonprofit Arts and Culture Field in Illinois
PARTICIPATING INDIVIDUALS: Increased Social, Emotional, and Physical Well-Being—Participants Are Involved in Civic, Social, and
Community Activities
Nonprofit arts and culture programs provide opportunities for people to be engaged in the world around them and to cultivate a commitment to being engaged
citizens of their communities. A key way to express civic engagement is by voting.
Quantity: How much
change was there?
22,156,663
people civically
involved as
evidenced by
voting
From the Cultural Data Project, we learn that Illinois arts and culture programs, events, and institutions experienced
16
36,610,060 participation instances in the course of a year. Seventy-seven percent of the U.S. population are adults, ages
17
18 and over, of voting age. Research shows that over 75% of adults who participated in the arts voted in the last
18
presidential election.
(36,610,060 * 77%) * 75% = 22,156,663 people civically involved as evidenced by voting
19
Duration: How
many years does it
last after end of
program? (maximum
of 5 years)
Outcomes Start:
Does it start during
the program or after?
Financial Proxy
Value: What is the
value of the change?
5 years
Civic, social, and community engagement are learned behaviors that tend to be life-long or at least persistent.
During
This outcome begins to accrue to the beneficiaries while the arts and culture field is actively working.
$67, value of
expressions of
civic
engagement,
expressed as the
average
individual
campaign
contribution
People express their civic engagement by voting, but there is no inherent monetary value associated with the act for
people who vote. Other ways people express their civic engagement is by donating to campaigns. In this way, the average
campaign contribution can be used as a proxy for the value that voters put on their ability to express themselves through
20
the vote. The average individual campaign contribution to the Obama campaign in the last presidential election was $67.
Discounting
Impact: Deadweight
Discounting
Impact: Attribution
63%
Research shows that 63% of adults voted in the last presidential election despite not engaging in the arts.
20% of this
outcome can be
There are two other potential major “investments” into nonprofit arts and culture programs that can take some of the credit
22
for producing this outcome: volunteers and in-kind donations. The total value of volunteer hours in Illinois is $7.2 billion.
21
16
See Appendix A for details on the Cultural Data Project.
U.S. Census Bureau’s 2013 American Community Survey 1-year estimates program.
18
National Endowment for the Arts. Art-goers in their communities: Patterns of civic and social engagement. Available at http://arts.gov/sites/default/files/98.pdf
19
Youniss, J., McLellan, J., & Yates, M. (1997, March). What we know about engendering civic identity. American Behavioral Scientist, 40(5). Available at http://www.crcresearch.org/forum_archive/filescrcresearch/file/youniss_97.pdf
20
Tau, B. (2013, January 19). Obama campaign final fundraising total: $1.1 billion. Politico. Available at http://www.politico.com/story/2013/01/obama-campaign-final-fundraising-total-1-billion-86445.html
21
National Endowment for the Arts. Art-goers in their communities: Patterns of civic and social engagement. Available at http://arts.gov/sites/default/files/98.pdf
17
24 The Value of the Nonprofit Arts and Culture Field in Illinois
attributed to inkind donations
23
The entire Illinois nonprofit sector has a combined revenue of $73 billion and the arts and culture programs included in
24
this analysis have a total revenue of $3.2 billion, which is 4.4% of the total nonprofit revenue in the state. Multiply the
$7.2 billion of volunteer time value by 4.4% to estimate the share of the volunteer time value that belongs to the arts and
culture field. Divide that figure by the $3.2 billion in arts and culture field revenue to arrive at 9.8%, which is how much the
value of volunteer time represents of the total environment field revenue.
($7,200,000,000 * (3,205,192,726 / $73,312,774,643)) / 3,205,192,726 = 9.8%
There are no good data sources to understand the total value of in-kind donations to programs in the Illinois arts and
culture field. In light of this, we estimated the in-kind donation value to be equal to that of the value of volunteer time and
so double the 9.8% and round to a 20% attribution discounting rate.
Discounting
Impact: Drop-off
25%
While this outcome may persist beyond the program year, short of other experiences, there may be drop off, so drop off is
set at 25%.
Calculating Impact
Quantity times financial
proxy, less
deadweight,
displacement and
attribution
Calculating Social Return
Year 0
Year 1
Year 2
Year 3
Year 4
Year 5
$437,275,796
$437,275,796
$437,275,796
$327,956,847
$245,967,635
$184,475,727
$138,356,795
22
23
24
Discount rate = 10%
Corporation for National & Community Service. Volunteering and civic engagement in Illinois. Available at http://www.volunteeringinamerica.gov/IL. Reflects 2013.
Urban Institute. National Center for Charitable Statistics. Available at http://nccsweb.urban.org/tablewiz/tw.php
See Appendix A for details on the Cultural Data Project.
25 The Value of the Nonprofit Arts and Culture Field in Illinois
PARTICIPATING INDIVIDUALS: Increase Social, Emotional, and Physical Well-Being—Participants Have Improved Mental Health
The nonprofit arts and culture field provides opportunities for people to be creative, express themselves, meet other likeminded people, or just take a break from
the daily grind. These are important components for managing stress and anxiety and having good mental health.
Quantity: How much
change was there?
5,019,308 people
with reduced
anxiety and
stress levels
From the Cultural Data Project, we learn that Illinois arts and culture programs, events, and institutions experienced
25
38,610,060 participation instances in the course of a year. Twenty percent of the U.S. population experiences anxiety
26
disorders. Research shows that among 65% of people in high stress situations, like caring for a family member with
27
cancer, taking an art class significantly lowered their anxiety levels and also lowered stress.
(38,610,060 * 20%) * 65% = 5,019,308 people with reduced stress levels
Duration: How
many years does it
last after end of
program? (maximum
of 5 years)
Outcomes Start:
Does it start during
the program or after?
Financial Proxy
Value: What is the
value of the change?
0 years
Without sufficient research to indicate that exposure to the arts in one year facilitates improved mental health in future
years, we set duration at 0 years, indicating that we only claim that this benefit of arts and culture programming occurs
during the same year people are exposed to arts and culture events, programs, etc.
During
This outcome begins to accrue to the beneficiaries while the arts and culture field is actively working.
$1,875, the value
of having
reduced stress
and anxiety,
measured by the
cost of therapy
Another way people can reduce their stress and deal with their anxiety is by attending therapy, so the cost of cognitive
behavioral therapy (CBT) is a proxy for the value people who experience a stress-relieving effect of art programming may
put on that benefit. While rates for CBT can vary quite a bit from provider to provider, most published rates fall in the $125
28
range for one session. CBT is a short-term treatment, typically provided in 10 to 20 sessions, so we use the average of
15 sessions.
$125 * 15 = $1,875
Discounting
Impact: Deadweight
38%
Research shows that 38% of study participants who were given a placebo saw improvement related to their anxiety
29
disorder.
Discounting
Impact: Attribution
20% of this
outcome can be
There are two other potential major “investments” into nonprofit arts and culture programs that can take some of the credit
30
for producing this outcome: volunteers and in-kind donations. The total value of volunteer hours in Illinois is $7.2 billion.
25
See Appendix A for details on the Cultural Data Project.
National Alliance on Mental Illness. Anxiety disorders fact sheet. Available at http://www2.nami.org/factsheets/anxietydisorders_factsheet.pdf
Walsh, S., Radcliff, S., Castillo, L., Kumar, A., & Broschard, D. (2006, January). A pilot study to test the effects of art-making classes for family caregivers of patients with cancer. Oncology Nursing Forum, 34(1).
Available at http://www.ncbi.nlm.nih.gov/pubmed/17562630
28
Cognitive Behavior Therapy Center of Silicon Valley. Frequently asked questions. Available at http://cognitivebehaviortherapycenter.com/frequently-asked-questions/
29
Barlow, D.H., Gorman, J.M., Shear, K., & Woods, S.W. (2000). Cognitive-behavioral therapy, Imipramine, or their combination for panic disorder: A randomized controlled trial. Journal of the American Medical
Association, 283(19), 2529-2536.
30
Corporation for National & Community Service. Volunteering and civic engagement in Illinois. Available at http://www.volunteeringinamerica.gov/IL. Reflects 2013.
26
27
26 The Value of the Nonprofit Arts and Culture Field in Illinois
attributed to inkind donations
31
The entire Illinois nonprofit sector has a combined revenue of $73 billion and the arts and culture programs included in
32
this analysis have a total revenue of $3.2 billion, which is 4.4% of the total nonprofit revenue in the state. Multiply the
$7.2 billion of volunteer time value by 4.4% to estimate the share of the volunteer time value that belongs to the arts and
culture field. Divide that figure by the $3.2 billion in arts and culture field revenue to arrive at 9.8%, which is how much the
value of volunteer time represents of the total environment field revenue.
($7,200,000,000 * (3,205,192,726 / $73,312,774,643)) / 3,205,192,726 = 9.8%
There are no good data sources to understand the total value of in-kind donations to programs in the Illinois arts and
culture field. In light of this, we estimated the in-kind donation value to be equal to that of the value of volunteer time and
so double the 9.8% and round to a 20% attribution discounting rate.
Discounting
Impact: Drop-off
0%
Since this outcome does not accrue past the program, there is no need to calculate drop-off.
Calculating Impact
Quantity times financial
proxy, less
deadweight,
displacement and
attribution
Calculating Social Return
Year 0
Year 1
Year 2
Year 3
Year 4
Year 5
$4,705,601,073
$4,705,601,073
$-
$-
$-
$-
$-
31
32
Discount rate = 10%
Urban Institute. National Center for Charitable Statistics. Available at http://nccsweb.urban.org/tablewiz/tw.php
See Appendix A for details on the Cultural Data Project.
27 The Value of the Nonprofit Arts and Culture Field in Illinois
PARTICIPATING INDIVIDUALS: Improved Social, Emotional, and Physical Well-Being—Increased Life Satisfaction
Nonprofit arts and culture programs offer many volunteer opportunities. When people volunteer, they are more engaged with the world around them, feel more
connected to their communities, develop relationships with other people, and generally derive a sense of purpose and life satisfaction.
Quantity: How much
change was there?
104,061 annual
volunteers in arts
and culture
From the Cultural Data Project, we learn that 104,061 people volunteer at Illinois arts and culture programs, events, and
institutions in the course of a year.
Duration: How
many years does it
last after end of
program? (maximum
of 5 years)
Outcomes Start:
Does it start during
the program or after?
Financial Proxy
Value: What is the
value of the change?
0 years
The benefit to volunteers of volunteering likely is experienced while the volunteering is taking place.
During
This outcome begins to accrue to the beneficiaries while the arts and culture field is actively working.
$1,313, the per
person value of
annual charitable
giving
People volunteer for various reasons, and one reason is help advance the mission of the organizations for which they
volunteer their time. Another way to achieve that same objective of furthering the organization’s mission is to donate
money. In this way, average annual charitable giving can be used as a proxy to express the value that volunteers derive
for themselves when they volunteer their time. The average annual giving amount in Illinois according to an analysis of tax
33
34
returns, inflated to 2013 dollars is $3,466. Divide this by the average Illinois household size of 2.64 to get the per
person value of charitable giving.
$3,466 / 2.64 = $1,313, the per person value of annual charitable giving in Illinois
35
Discounting
Impact: Deadweight
27%
27% of Americans volunteered through or for an organization in the last year, so we assume that if they hadn’t
volunteered with the nonprofit arts and culture field, 27% would still volunteer elsewhere.
Discounting
Impact: Attribution
20% of this
outcome can be
attributed to inkind donations
There are two other potential major “investments” into nonprofit arts and culture programs that can take some of the credit
36
for producing this outcome: volunteers and in-kind donations. The total value of volunteer hours in Illinois is $7.2 billion.
37
The entire Illinois nonprofit sector has a combined revenue of $73 billion and the arts and culture programs included in
38
this analysis have a total revenue of $3.2 billion, which is 4.4% of the total nonprofit revenue in the state. Multiply the
$7.2 billion of volunteer time value by 4.4% to estimate the share of the volunteer time value that belongs to the arts and
33
National Center for Charitable Statistics, The Urban Institute, Center on Nonprofits and Philanthropy. (2011). Profiles of individual charitable contributions by state, 2011. Available at
http://nccsweb.urban.org/knowledgebase/showFile.php?file=bmNjczExMzQ=. Updated 2011 values to 2013 dollars using the U.S. Department of Labor, Bureau of Labor Statistics’ CPI Detailed Report Data for
November 2014, available at http://www.bls.gov/cpi/cpid1411.pdf. 2011 to 2013 inflation factor is 1.0356.
34
U.S. Census Bureau’s 2012 American Community Survey 1-year estimates program.
35
Bureau of Labor Statistics. (2014, February). Volunteering in the United States—2013. Available at http://www.bls.gov/news.release/pdf/volun.pdf
36
Corporation for National & Community Service. Volunteering and civic engagement in Illinois. Available at http://www.volunteeringinamerica.gov/IL. Reflects 2013.
37
Urban Institute. National Center for Charitable Statistics. Available at http://nccsweb.urban.org/tablewiz/tw.php
38
See Appendix A for details on the Cultural Data Project.
28 The Value of the Nonprofit Arts and Culture Field in Illinois
culture field. Divide that figure by the $3.2 billion in arts and culture field revenue to arrive at 9.8%, which is how much the
value of volunteer time represents of the total environment field revenue.
($7,200,000,000 * (3,205,192,726 / $73,312,774,643)) / 3,205,192,726 = 9.8%
There are no good data sources to understand the total value of in-kind donations to programs in the Illinois arts and
culture field. In light of this, we estimated the in-kind donation value to be equal to that of the value of volunteer time and
so double the 9.8% and round to a 20% attribution discounting rate.
Discounting
Impact: Drop-off
0%
Since this outcome does not accrue past the year of program activity, there is no need to calculate drop off.
Calculating Impact
Quantity times financial
proxy, less
deadweight,
displacement and
attribution
Calculating Social Return
Year 0
Year 1
Year 2
Year 3
Year 4
Year 5
$79,792,513
$79,792,513
$-
$-
$-
$-
$-
Discount rate = 10%
29 The Value of the Nonprofit Arts and Culture Field in Illinois
PARTICIPATING INDIVIDUALS: Improved Social, Emotional, and Physical Well-Being—Participants Experience Personal Development, SelfActualization, or Creative Expression
Nonprofit arts and culture programs offer creative outlets, providing opportunities for creative expression that contributes to personal development and a better
understanding of the self, thereby contributing to improved self-confidence and self-image.
Quantity: How much
change was there?
30,888,048
participants with
improved
confidence
From the Cultural Data Project, we learn that Illinois arts and culture programs, events, and institutions experienced
39
38,610,060 participation instances in the course of a year. Research shows that 80% of arts event participants report an
40
increase in self confidence after the event or activity.
38,610,060 * 80% = 30,888,048 participants with increased self-confidence
Duration: How
many years does it
last after end of
program? (maximum
of 5 years)
Outcomes Start:
Does it start during
the program or after?
Financial Proxy
Value: What is the
value of the change?
5 years
The effects of an arts and culture event on participants’ confidence may persist beyond that one event and the year in
which it occurred.
During
This outcome begins to accrue to the beneficiaries while the arts and culture field is actively working.
$414, the value
of having a
creative outlet,
measured by
cost of artsrelated classes
The value to participating individuals of having an outlet for creative expression can be understood as the money people
41
are willing to pay for an arts-related class. A 10-class card, plus the $15 registration fee, comes to a total of $414.
Discounting
Impact: Deadweight
0%
The studies showing increased confidence assess increases due to the arts and culture program/event/activity and so
42
deadweight is set at 0%.
Discounting
Impact: Attribution
20% of this
outcome can be
attributed to inkind donations
There are two other potential major “investments” into nonprofit arts and culture programs that can take some of the credit
43
for producing this outcome: volunteers and in-kind donations. The total value of volunteer hours in Illinois is $7.2 billion.
44
The entire Illinois nonprofit sector has a combined revenue of $73 billion and the arts and culture programs included in
45
this analysis have a total revenue of $3.2 billion, which is 4.4% of the total nonprofit revenue in the state. Multiply the
$7.2 billion of volunteer time value by 4.4% to estimate the share of the volunteer time value that belongs to the arts and
39
See Appendix A for details on the Cultural Data Project.
Matarasso, F. (1997). Use or Ornament? The Social Impact of Participation in the Arts. Available at http://www.feisean.org/downloads/Use-or-Ornament.pdf
41
American Rhythm Center. Class pricing. Available at http://www.arcchicago.org/class-pricing.html
42
Matarasso, F. (1997). Use or Ornament? The Social Impact of Participation in the Arts. Available at http://www.feisean.org/downloads/Use-or-Ornament.pdf
43
Corporation for National & Community Service. Volunteering and civic engagement in Illinois. Available at http://www.volunteeringinamerica.gov/IL. Reflects 2013.
44
Urban Institute. National Center for Charitable Statistics. Available at http://nccsweb.urban.org/tablewiz/tw.php
45
See Appendix A for details on the Cultural Data Project.
40
30 The Value of the Nonprofit Arts and Culture Field in Illinois
culture field. Divide that figure by the $3.2 billion in arts and culture field revenue to arrive at 9.8%, which is how much the
value of volunteer time represents of the total environment field revenue.
($7,200,000,000 * (3,205,192,726 / $73,312,774,643)) / 3,205,192,726 = 9.8%
There are no good data sources to understand the total value of in-kind donations to programs in the Illinois arts and
culture field. In light of this, we estimated the in-kind donation value to be equal to that of the value of volunteer time and
so double the 9.8% and round to a 20% attribution discounting rate.
Discounting
Impact: Drop-off
25%
While the confidence gained from an arts and culture event may last beyond the year in which the event occurred, it may
also experience a drop off effect, and so set drop off is set at 25%.
Calculating Impact
Quantity times financial
proxy, less
deadweight,
displacement and
attribution
Calculating Social Return
Year 0
Year 1
Year 2
Year 3
Year 4
Year 5
$10,227,922,519
$10,227,922,519
$10,227,922,519
$7,670,941,889
$5,753,206,417
$4,314,904,813
$3,236,178,610
Discount rate = 10%
31 The Value of the Nonprofit Arts and Culture Field in Illinois
PARTICIPATING INDIVIDUALS: Strengthened Communities—Increased Social Cohesion and Tolerance Through Cultural Awareness and
Understanding
Nonprofit arts and culture programs contribute to the stability and sustainability of strong communities by promoting understanding of different cultures and
lifestyles, thereby fostering positive relationships between people and reducing social isolation and exclusion.
Quantity: How much
change was there?
20,849,432,
people
participating in
arts and culture
events/activities
From the Cultural Data Project, we learn that Illinois arts and culture programs, events, and institutions experienced
38,610,060 participation instances in the course of a year. Research shows that 54% of people who attend arts and
46
cultural offerings report learning about other people’s cultures.
Duration: How
many years does it
last after end of
program? (maximum
of 5 years)
Outcomes Start:
Does it start during
the program or after?
5 years
The effects of an arts and culture program on people’s understanding of other cultures and lifestyles may persist beyond
any one event and the year in which it occurred.
During
Though it extends beyond the year under examination, this outcome begins accruing to the beneficiaries during the
program period.
Financial Proxy
Value: What is the
value of the change?
$11, the average
cost of admission
to Illinois
museums
The value to participating individuals of increased social cohesion and tolerance can be understood as the money people
are willing to pay to go a museum to learn about different cultures and lifestyles. Averaging suggested donation and
admission prices for museums from around the state of Illinois comes out to $11.
Discounting
Impact: Deadweight
0%
The studies showing increased understanding of other cultures assess increases due to the arts and culture
47
program/event/activity and so deadweight is set at 0%.
Discounting
Impact: Attribution
20% of this
outcome can be
attributed to inkind donations
There are two other potential major “investments” into nonprofit arts and culture programs that can take some of the credit
48
for producing this outcome: volunteers and in-kind donations. The total value of volunteer hours in Illinois is $7.2 billion.
49
The entire Illinois nonprofit sector has a combined revenue of $73 billion and the arts and culture programs included in
50
this analysis have a total revenue of $3.2 billion, which is 4.4% of the total nonprofit revenue in the state. Multiply the
$7.2 billion of volunteer time value by 4.4% to estimate the share of the volunteer time value that belongs to the arts and
culture field. Divide that figure by the $3.2 billion in arts and culture field revenue to arrive at 9.8%, which is how much the
value of volunteer time represents of the total environment field revenue.
46
Matarasso, F. (1997). Use or Ornament? The Social Impact of Participation in the Arts. Available at http://www.feisean.org/downloads/Use-or-Ornament.pdf
Matarasso, F. (1997). Use or Ornament? The Social Impact of Participation in the Arts. Available at http://www.feisean.org/downloads/Use-or-Ornament.pdf
48
Corporation for National & Community Service. Volunteering and civic engagement in Illinois. Available at http://www.volunteeringinamerica.gov/IL. Reflects 2013.
49
Urban Institute. National Center for Charitable Statistics. Available at http://nccsweb.urban.org/tablewiz/tw.php
50
See Appendix A for details on the Cultural Data Project.
47
32 The Value of the Nonprofit Arts and Culture Field in Illinois
($7,200,000,000 * (3,205,192,726 / $73,312,774,643)) / 3,205,192,726 = 9.8%
There are no good data sources to understand the total value of in-kind donations to programs in the Illinois arts and
culture field. In light of this, we estimated the in-kind donation value to be equal to that of the value of volunteer time and
so double the 9.8% and round to a 20% attribution discounting rate.
Discounting
Impact: Drop-off
25%
While the greater understanding of different cultures and lifestyles gained from an arts and culture program or event may
last beyond the year in which it occurred, it may also experience a drop off effect, and so drop off is set at 25%.
Calculating Impact
Quantity times financial
proxy, less
deadweight,
displacement and
attribution
Calculating Social Return
Year 0
Year 1
Year 2
Year 3
Year 4
Year 5
$187,049,194
$187,049,194
$187,049,194
$140,286,895
$105,215,172
$78,911,379
$59,183,534
Discount rate = 10%
33 The Value of the Nonprofit Arts and Culture Field in Illinois
SOCIETY: Increased Workforce Engagement—People are Employed in Nonprofit Arts and Culture Jobs and Pay Taxes and Spend Their Wages
in Illinois Communities
Nonprofit arts and culture programs employ thousands of Illinoisans who then pay taxes and spend a portion of their wages in their communities, infusing money
into the local economy and precipitating an economic ripple effect as the businesses they spend their money at now have more money to spend.
51
Quantity: How much
change was there?
13,189 full-time
equivalent jobs in
the arts and
culture field
From the Cultural Data Project, we learn that there are 13,189 full-time equivalent jobs in the Illinois arts and culture field.
Duration: How
many years does it
last after end of
program? (maximum
of 5 years)
Outcomes Start:
Does it start during
the program or after?
Financial Proxy
Value: What is the
value of the change?
0 years
Employment in the field lasts for the duration of the program year.
During
People are employed during the year under examination.
$58,546, the
value of one
nonprofit arts and
culture field job
to society, in
taxes paid,
spending in
communities,
and the ripple
effect of
spending
To determine total taxes paid, we inflate to 2013 dollars the median wages and taxes paid by educational attainment,
53
and also inflate to 2013 dollars the median annual earnings of the nonprofit workforce by educational attainment. We
determine if the median nonprofit earnings by educational level are higher or lower than the median earnings of the
workforce overall and by how much, which results in a percentage. We then multiply that percentage by the average taxes
paid by education level to get the estimated amount of taxes paid by education level for Illinois nonprofit workers. As a final
54
step, we derive a weighted annual taxes paid figure using educational attainment data on the nonprofit workforce. This
results in $13,065 in annual total taxes paid.
52
To determine the ripple effect of earnings spent in Illinois, we start with the average wage of people employed in the arts
55
and culture field after taxes, $45,419. Subtract out the average total taxes paid, resulting in $32,354 left to spend. Using
the average personal savings rate of 4.8%, we subtract out the share of wages saved, leaving the share of wages likely to
56
be spent, $30,801. Illinois renters spend an average of 30.4% of their income on housing costs and the remaining 69.6%
51
See Appendix A for details on the Cultural Data Project.
CollegeBoard. Trends in higher education: Median earnings and tax payments by education level, 2008. Available at http://trends.collegeboard.org/education-pays/figures-tables/median-earnings-and-tax-paymentseducation-level-2008. 2008 prices inflated to 2013 dollars using the U.S. Department of Labor, Bureau of Labor Statistics’ CPI Detailed Report Data for November 2014, available at http://www.bls.gov/cpi/cpid1411.pdf.
2008 to 2013 inflation factor is 1.0820.
53
Building a Stronger Illinois. Nonprofit employees. Available at http://buildingstrongeril.com/statewide-profile/nonprofit-employees/#.VJ2lrF4Al. 2011 prices inflated to 2013 dollars using the U.S. Department of Labor,
Bureau of Labor Statistics’ CPI Detailed Report Data for November 2014, available at http://www.bls.gov/cpi/cpid1411.pdf. 2011 to 2013 inflation factor is 1.0356.
54
Building a Stronger Illinois. Nonprofit employees. Available at http://buildingstrongeril.com/statewide-profile/nonprofit-employees/#.VJ2lrF4Al. 2011 prices inflated to 2013 dollars using the U.S. Department of Labor,
Bureau of Labor Statistics’ CPI Detailed Report Data for November 2014, available at http://www.bls.gov/cpi/cpid1411.pdf. 2011 to 2013 inflation factor is 1.0356.
55
See Appendix D, PARTICIPANTS: Increased Economic Security—People Are Working.
56
Bureau of Economic Analysis. Comparison of personal saving in the National Income and Product Accounts (NIPAs) with personal saving in the Flow of Funds Accounts (FFAs). Available at
http://www.bea.gov/national/nipaweb/nipa-frb.asp. 10-year personal savings average of 4.8% (2004-2013).
52
34 The Value of the Nonprofit Arts and Culture Field in Illinois
57
on other things. Multiply the amount spent on housing by the Illinois housing multiplier of 1.5862, and multiply the
58
remainder by the retail multiplier of 2.1359. To account for the fact that some spending likely happens outside of Illinois,
subtract 25%.
$32,354 – ($32,354 * 4.8%) = $30,801 of wages likely to spend.
$30,801 * 30.4% = $9,363 spent on housing costs and $30,801 * 69.6% = $21,437 spent on other things.
($9,363 * 1.5862) + ($21,437 * 2.1359) = $60,641
$60,641 – ($60,641 * 25%) = $45,480, the value of wages spent in Illinois communities and the ripple effect they produce.
$45,480 + $13,065 = $58,546, the value of taxes paid and the ripple effect of wages spend in Illinois communities for one
nonprofit arts and culture field worker
Discounting
Impact: Deadweight
59%
59% of Illinoisans age 16 and over are employed, so we assume that if their arts and culture field job weren’t available,
59
59% of employees would find work elsewhere.
Discounting
Impact: Attribution
20% of this
outcome can be
attributed to inkind donations
There are two other potential major “investments” into nonprofit arts and culture programs that can take some of the credit
60
for producing this outcome: volunteers and in-kind donations. The total value of volunteer hours in Illinois is $7.2 billion.
61
The entire Illinois nonprofit sector has a combined revenue of $73 billion and the arts and culture programs included in
62
this analysis have a total revenue of $3.2 billion, which is 4.4% of the total nonprofit revenue in the state. Multiply the
$7.2 billion of volunteer time value by 4.4% to estimate the share of the volunteer time value that belongs to the arts and
culture field. Divide that figure by the $3.2 billion in arts and culture field revenue to arrive at 9.8%, which is how much the
value of volunteer time represents of the total environment field revenue.
($7,200,000,000 * (3,205,192,726 / $73,312,774,643)) / 3,205,192,726 = 9.8%
There are no good data sources to understand the total value of in-kind donations to programs in the Illinois arts and
culture field. In light of this, we estimated the in-kind donation value to be equal to that of the value of volunteer time and
so double the 9.8% and round to a 20% attribution discounting rate.
Discounting
Impact: Drop-off
0%
Since this outcome does not accrue past the program, there is no need to calculate drop off.
57
U.S. Census Bureau’s 2012 American Community Survey 1 year estimates program.
Bureau of Economic Analysis. RIMS II Economic Output Multiplier. On file with author. More information about RIMS II available at http://blog.bea.gov/tag/rims-ii/
59
U.S. Census Bureau’s 2012 American Community Survey 1 year estimates program.
60
Corporation for National & Community Service. Volunteering and civic engagement in Illinois. Available at http://www.volunteeringinamerica.gov/IL. Reflects 2013.
61
Urban Institute. National Center for Charitable Statistics. Available at http://nccsweb.urban.org/tablewiz/tw.php
62
See Appendix A for details on the Cultural Data Project.
58
35 The Value of the Nonprofit Arts and Culture Field in Illinois
Calculating Impact
Quantity times financial
proxy, less
deadweight,
displacement and
attribution
Calculating Social Return
Year 0
Year 1
Year 2
Year 3
Year 4
Year 5
$251,408,305
$251,408,305
$-
$-
$-
$-
$-
Discount rate = 10%
36 The Value of the Nonprofit Arts and Culture Field in Illinois
SOCIETY: Increased Workforce Engagement—Youth Graduate and Pay Higher Taxes
Nonprofit arts and culture programs serve to increase youth’s economic security when, with the help of the program, the participants graduate from high school,
thereby increasing their potential earning power. Society benefits by commanding higher tax revenue from the higher wages earned by the higher educated youth.
Quantity: How much
change was there?
202,269, youth
graduating
From the Cultural Data Project, we learn that Illinois arts and culture programs, events, and institutions experienced
63
38,610,060 participation instances in the course of a year. 0.5 percent of all people in the United States are low-income
64
17 year olds, the age at which a youth is closest to graduation age. Research shows that graduation rates for low
65
socioeconomic status youth with high exposure to the arts is 96%.
(38,610,060 * 0.5%) * 96% = 202,269 youth graduating
Duration: How
many years does it
last after end of
program? (maximum
of 5 years)
Outcomes Start:
Does it start during
the program or after?
Financial Proxy
Value: What is the
value of the change?
5 years
The earning power of having a high school diploma over not having one lasts beyond the year the diploma is earned.
After
Some youth likely graduate high school while still involved in arts and culture programs, but many will not.
$2,597, the
difference
between total
taxes paid by a
high school
graduate and a
non-graduate
The average total taxes paid by a high school graduate is $7,682 and by a non-high school graduate is $5,085, inflated to
66
2013 dollars, for a difference of $2,597.
Discounting
Impact: Deadweight
Discounting
Impact: Attribution
78%
Research shows that 78% of low socioeconomic status youth graduate high school even without involvement in the arts.
20% of this
outcome can be
There are two other potential major “investments” into nonprofit arts and culture programs that can take some of the credit
68
for producing this outcome: volunteers and in-kind donations. The total value of volunteer hours in Illinois is $7.2 billion.
67
63
See Appendix A for details on the Cultural Data Project.
U.S. Census Bureau’s 2013 American Community Survey 1-year estimates program. Low-income refers to annual household incomes below 200% of the federal poverty level.
Catterall, J., Dumais, S., & Hampden-Thomspon, G. (2012, March). The arts and achievement in at-risk youth: Findings from four longitudinal studies. Available at http://arts.gov/sites/default/files/Arts-At-RiskYouth.pdf
66
CollegeBoard. Trends in higher education: Median earnings and tax payments by education level, 2008. Available at http://trends.collegeboard.org/education-pays/figures-tables/median-earnings-and-tax-paymentseducation-level-2008. 2008 prices inflated to 2013 dollars using the U.S. Department of Labor, Bureau of Labor Statistics’ CPI Detailed Report Data for November 2014, available at http://www.bls.gov/cpi/cpid1411.pdf.
2008 to 2013 inflation factor is 1.0820.
67
Catterall, J., Dumais, S., & Hampden-Thomspon, G. (2012, March). The arts and achievement in at-risk youth: Findings from four longitudinal studies. Available at http://arts.gov/sites/default/files/Arts-At-RiskYouth.pdf
68
Corporation for National & Community Service. Volunteering and civic engagement in Illinois. Available at http://www.volunteeringinamerica.gov/IL. Reflects 2013.
64
65
37 The Value of the Nonprofit Arts and Culture Field in Illinois
attributed to inkind donations
69
The entire Illinois nonprofit sector has a combined revenue of $73 billion and the arts and culture programs included in
70
this analysis have a total revenue of $3.2 billion, which is 4.4% of the total nonprofit revenue in the state. Multiply the
$7.2 billion of volunteer time value by 4.4% to estimate the share of the volunteer time value that belongs to the arts and
culture field. Divide that figure by the $3.2 billion in arts and culture field revenue to arrive at 9.8%, which is how much the
value of volunteer time represents of the total environment field revenue.
($7,200,000,000 * (3,205,192,726 / $73,312,774,643)) / 3,205,192,726 = 9.8%
There are no good data sources to understand the total value of in-kind donations to programs in the Illinois arts and
culture field. In light of this, we estimated the in-kind donation value to be equal to that of the value of volunteer time and
so double the 9.8% and round to a 20% attribution discounting rate.
Discounting
Impact: Drop-off
0%
While the earning power of a high school diploma has dropped off over the course of the last several decades, it is unlikely
that there would be noticeable depreciation in a 5-year time period.
Calculating Impact
Quantity times financial
proxy, less
deadweight,
displacement and
attribution
Calculating Social Return
Year 0
Year 1
Year 2
Year 3
Year 4
Year 5
$92,443,920
$-
$92,443,920
$92,443,920
$92,443,920
$92,443,920
$92,443,920
69
70
Discount rate = 10%
Urban Institute. National Center for Charitable Statistics. Available at http://nccsweb.urban.org/tablewiz/tw.php
See Appendix A for details on the Cultural Data Project.
38 The Value of the Nonprofit Arts and Culture Field in Illinois
SOCIETY: Increased Economic Development—Tourism
Nonprofit arts and culture programs are one of the biggest draws for tourism. Each time someone participates in or attends an arts and culture program, event, or
institution, they spend money in the surrounding community at restaurants, on transportation and parking, on hotels, and in other businesses.
Quantity: How much
change was there?
38,610,060
tourist visits
From the Cultural Data Project, we learn that Illinois arts and culture programs, events, and institutions experienced
71
38,610,060 participation instances in the course of a year.
Duration: How
many years does it
last after end of
program? (maximum
of 5 years)
Outcomes Start:
Does it start during
the program or after?
Financial Proxy
Value: What is the
value of the change?
5 years
Tourism relies in large measure on a place’s reputation which is built upon the experiences of tourists in years past.
Therefore, duration is set at 5 years, indicating that the role arts and culture plays attracting tourists and facilitating
increased economic develop as a result, lasts beyond the one year under analysis here.
During
This outcome begins to accrue to the beneficiaries while the arts and culture field is actively working.
$30, the average
spending of
cultural tourists
beyond price of
admission
Cultural tourists who are Illinois residents spend on average an additional $26.28 beyond the price of any admission to an
arts and culture event or institution (in 2013 dollars). Non-resident cultural tourists spend more, $59.63. Of cultural tourists
72
in Illinois, 88.9% are Illinois residents and 11.1% are non-Illinois residents.
Discounting
Impact: Deadweight
0%
Since the number of cultural tourists and the money they spend in Illinois beyond the price of admission are specific to
nonprofit arts and culture, deadweight is set to 0%.
Discounting
Impact: Attribution
20% of this
outcome can be
attributed to inkind donations
There are two other potential major “investments” into nonprofit arts and culture programs that can take some of the credit
73
for producing this outcome: volunteers and in-kind donations. The total value of volunteer hours in Illinois is $7.2 billion.
74
The entire Illinois nonprofit sector has a combined revenue of $73 billion and the arts and culture programs included in
75
this analysis have a total revenue of $3.2 billion, which is 4.4% of the total nonprofit revenue in the state. Multiply the
$7.2 billion of volunteer time value by 4.4% to estimate the share of the volunteer time value that belongs to the arts and
culture field. Divide that figure by the $3.2 billion in arts and culture field revenue to arrive at 9.8%, which is how much the
value of volunteer time represents of the total environment field revenue.
(88.9% * $26.28) + (11.1% * $59.63) = $30, the average spending of cultural tourists beyond the price of admission
($7,200,000,000 * (3,205,192,726 / $73,312,774,643)) / 3,205,192,726 = 9.8%
71
See Appendix A for details on the Cultural Data Project.
Arts Alliance Illinois, & Americans for the Arts (2012). Arts & economic prosperity IV: The economic impact of nonprofit arts and culture. Available at
http://www.artsalliance.org/sites/default/files/Arts%20&%20Economic%20Prosperity%20IV%20-%20State%20of%20Illinois.pdf. 2010 values inflated to 2013 dollars using the U.S. Department of Labor, Bureau of Labor
Statistics’ CPI Detailed Report Data for November 2014, available at http://www.bls.gov/cpi/cpid1411.pdf. 2010 to 2013 inflation factor is 1.0683
73
Corporation for National & Community Service. Volunteering and civic engagement in Illinois. Available at http://www.volunteeringinamerica.gov/IL. Reflects 2013.
74
Urban Institute. National Center for Charitable Statistics. Available at http://nccsweb.urban.org/tablewiz/tw.php
75
See Appendix A for details on the Cultural Data Project.
72
39 The Value of the Nonprofit Arts and Culture Field in Illinois
There are no good data sources to understand the total value of in-kind donations to programs in the Illinois arts and
culture field. In light of this, we estimated the in-kind donation value to be equal to that of the value of volunteer time and
so double the 9.8% and round to a 20% attribution discounting rate.
Discounting
Impact: Drop-off
25%
While it’s reasonable to say that the impact of this outcome lasts beyond one year, there may be some drop off, so drop off
is set at 25% to indicate that the effect may wear off short of any other activity.
Calculating Impact
Quantity times financial
proxy, less
deadweight,
displacement and
attribution
Calculating Social Return
Year 0
Year 1
Year 2
Year 3
Year 4
Year 5
$926,125,269
$926,125,269
$926,125,269
$694,593,952
$520,945,464
$390,709,098
$293,031,823
Discount rate = 10%
40 The Value of the Nonprofit Arts and Culture Field in Illinois
SOCIETY: Increased Economic Development—Local and State Government Has Increased Revenue
When arts and culture participating individuals attend an event and spend their money on other things beyond the price of admission, not only does that initial
spending contribute to the economy, but local and state government revenue is increased through increased tax revenue.
Quantity: How much
change was there?
38,610,060
tourist visits
From the Cultural Data Project, we learn that Illinois arts and culture programs, events, and institutions experienced
76
38,610,060 participation instances in the course of a year.
Duration: How
many years does it
last after end of
program? (maximum
of 5 years)
Outcomes Start:
Does it start during
the program or after?
Financial Proxy
Value: What is the
value of the change?
5 years
Tourism relies in large measure on a place’s reputation which is built upon the experiences of tourists in years past.
Therefore, duration is set at 5 years, indicating that the role arts and culture plays attracting tourists and facilitating
increased economic develop as a result, lasts beyond the one year under analysis here.
During
This outcome begins to accrue to the beneficiaries while the arts and culture field is actively working.
$7, the value of
increased state
and local
revenue per
tourist visit
Research on Illinois culture tourism shows that local revenue increases $7,617 and state revenue $6,641 for every
77
$100,000 in arts and culture organization expenditures due to arts and culture attendee spending. The total revenue
(used here as stand in for expenditures) for the arts and culture field in Illinois divided by $100,000 is $18,764. Multiply that
by the local and state revenue increases and add together then divide over the total participation instances to arrive at a
per tourist instance value.
((($1,876,418,233 / $100,000) * $7,617) + (($1,876,418,233 / $100,000) * $6,641)) / 38,610,060 = $7, the value of
increased state and local revenue per tourist visit
Discounting
Impact: Deadweight
0%
Since the number of cultural tourists and the money they spend in Illinois beyond the price of admission are specific to
nonprofit arts and culture, deadweight is set to 0%.
Discounting
Impact: Attribution
20% of this
outcome can be
attributed to inkind donations
There are two other potential major “investments” into nonprofit arts and culture programs that can take some of the credit
78
for producing this outcome: volunteers and in-kind donations. The total value of volunteer hours in Illinois is $7.2 billion.
79
The entire Illinois nonprofit sector has a combined revenue of $73 billion and the arts and culture programs included in
80
this analysis have a total revenue of $3.2 billion, which is 4.4% of the total nonprofit revenue in the state. Multiply the
$7.2 billion of volunteer time value by 4.4% to estimate the share of the volunteer time value that belongs to the arts and
culture field. Divide that figure by the $3.2 billion in arts and culture field revenue to arrive at 9.8%, which is how much the
76
See Appendix A for details on the Cultural Data Project.
Arts Alliance Illinois, & Americans for the Arts (2012). Arts & economic prosperity IV: The economic impact of nonprofit arts and culture. Available at
http://www.artsalliance.org/sites/default/files/Arts%20&%20Economic%20Prosperity%20IV%20-%20State%20of%20Illinois.pdf. 2010 values inflated to 2013 dollars using the U.S. Department of Labor, Bureau of Labor
Statistics’ CPI Detailed Report Data for November 2014, available at http://www.bls.gov/cpi/cpid1411.pdf. 2010 to 2013 inflation factor is 1.0683
78
Corporation for National & Community Service. Volunteering and civic engagement in Illinois. Available at http://www.volunteeringinamerica.gov/IL. Reflects 2013.
79
Urban Institute. National Center for Charitable Statistics. Available at http://nccsweb.urban.org/tablewiz/tw.php
80
See Appendix A for details on the Cultural Data Project.
77
41 The Value of the Nonprofit Arts and Culture Field in Illinois
value of volunteer time represents of the total environment field revenue.
($7,200,000,000 * (3,205,192,726 / $73,312,774,643)) / 3,205,192,726 = 9.8%
There are no good data sources to understand the total value of in-kind donations to programs in the Illinois arts and
culture field. In light of this, we estimated the in-kind donation value to be equal to that of the value of volunteer time and
so double the 9.8% and round to a 20% attribution discounting rate.
Discounting
Impact: Drop-off
25%
While it’s reasonable to say that the impact of this outcome lasts beyond one year, there may be some drop off, so drop off
is set at 25% to indicate that the effect may wear off short of any other activity.
Calculating Impact
Quantity times financial
proxy, less
deadweight,
displacement and
attribution
Calculating Social Return
Year 0
Year 1
Year 2
Year 3
Year 4
Year 5
$1,047,807,431
$1,047,807,431
$1,047,807,431
$785,855,573
$589,391,680
$442,043,760
$331,532,820
Discount rate = 10%
42 The Value of the Nonprofit Arts and Culture Field in Illinois
SOCIETY: Increased Economic Development—Illinois Household Income Increases
When arts and culture participating individuals attend an event and spend their money on other things beyond the price of admission, not only does that initial
spending contribute to the economy, but more jobs are created as a result of that spending, which translate to increased income for some Illinois households.
Quantity: How much
change was there?
38,610,060
tourist visits
From the Cultural Data Project, we learn that Illinois arts and culture programs, events, and institutions experienced
81
38,610,060 participation instances in the course of a year.
Duration: How
many years does it
last after end of
program? (maximum
of 5 years)
Outcomes Start:
Does it start during
the program or after?
Financial Proxy
Value: What is the
value of the change?
5 years
Tourism relies in large measure on a place’s reputation which is built upon the experiences of tourists in years past.
Therefore, duration is set at 5 years, indicating that the role arts and culture plays attracting tourists and facilitating
increased economic develop as a result, lasts beyond the one year under analysis here.
During
This outcome begins to accrue to the beneficiaries while the arts and culture field is actively working.
$34, the value
Research on Illinois culture tourism shows that the spending of cultural tourists helps create jobs, and those tourismcreated jobs result in $69,801 in increased household income for every $100,000 in arts and culture organization
82
expenditures due to arts and culture attendee spending. The total revenue (used here as stand in for expenditures) for
the arts and culture field in Illinois divided by $100,000 is $18,764. Multiply that by $69,801 and then divide over the total
participation instances to arrive at a per tourist instance value.
of increased
household
income per
tourist visit
(($1,876,418,233 / $100,000) * $69,801) / 38,610,060 = $34, the value of increased household income per tourist visit
Discounting
Impact: Deadweight
0%
Since the number of cultural tourists and the money they spend in Illinois beyond the price of admission are specific to
nonprofit arts and culture, deadweight is set to 0%.
Discounting
Impact: Attribution
20% of this
outcome can be
attributed to inkind donations
There are two other potential major “investments” into nonprofit arts and culture programs that can take some of the credit
83
for producing this outcome: volunteers and in-kind donations. The total value of volunteer hours in Illinois is $7.2 billion.
84
The entire Illinois nonprofit sector has a combined revenue of $73 billion and the arts and culture programs included in
85
this analysis have a total revenue of $3.2 billion, which is 4.4% of the total nonprofit revenue in the state. Multiply the
$7.2 billion of volunteer time value by 4.4% to estimate the share of the volunteer time value that belongs to the arts and
culture field. Divide that figure by the $3.2 billion in arts and culture field revenue to arrive at 9.8%, which is how much the
value of volunteer time represents of the total environment field revenue.
81
See Appendix A for details on the Cultural Data Project.
Arts Alliance Illinois, & Americans for the Arts (2012). Arts & economic prosperity IV: The economic impact of nonprofit arts and culture. Available at
http://www.artsalliance.org/sites/default/files/Arts%20&%20Economic%20Prosperity%20IV%20-%20State%20of%20Illinois.pdf. 2010 values inflated to 2013 dollars using the U.S. Department of Labor, Bureau of Labor
Statistics’ CPI Detailed Report Data for November 2014, available at http://www.bls.gov/cpi/cpid1411.pdf. 2010 to 2013 inflation factor is 1.0683
83
Corporation for National & Community Service. Volunteering and civic engagement in Illinois. Available at http://www.volunteeringinamerica.gov/IL. Reflects 2013.
84
Urban Institute. National Center for Charitable Statistics. Available at http://nccsweb.urban.org/tablewiz/tw.php
85
See Appendix A for details on the Cultural Data Project.
82
43 The Value of the Nonprofit Arts and Culture Field in Illinois
($7,200,000,000 * (3,205,192,726 / $73,312,774,643)) / 3,205,192,726 = 9.8%
There are no good data sources to understand the total value of in-kind donations to programs in the Illinois arts and
culture field. In light of this, we estimated the in-kind donation value to be equal to that of the value of volunteer time and
so double the 9.8% and round to a 20% attribution discounting rate.
Discounting
Impact: Drop-off
25%
While it’s reasonable to say that the impact of this outcome lasts beyond one year, there may be some drop off, so drop off
is set at 25% to indicate that the effect may wear off short of any other activity.
Calculating Impact
Quantity times financial
proxy, less
deadweight,
displacement and
attribution
Calculating Social Return
Year 0
Year 1
Year 2
Year 3
Year 4
Year 5
$214,028,919
$214,028,919
$214,028,919
$160,521,689
$120,391,267
$90,293,450
$67,720,088
Discount rate = 10%
44 The Value of the Nonprofit Arts and Culture Field in Illinois
33 West Grand Avenue, Suite 500
Chicago, Illinois 60654
socialimpactresearchcenter.org
ilpovertyreport.org
[email protected]
312.870.4949
SOCIAL IMPACT
RESEARCH CENTER
A
PROGRAM
208 South LaSalle Street, Suite 1540
Chicago, Illinois 60604
donorsforum.org
buildingstrongeril.com
[email protected]
312.578.0090


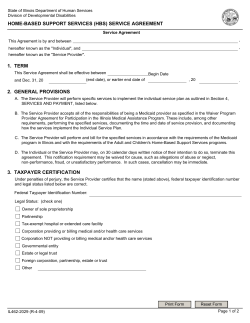


© Copyright 2026