
California Budget Perspective 2015-16
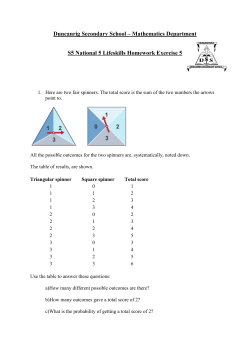
California
Budget
Perspective
2015-16
CHRIS HOENE, EXECUTIVE DIRECTOR
MARCH 24, 2015
CALIFORNIA POLICY FORUM WEBINAR
SPONSORED BY CALNONPROFITS AND
CALIFORNIA PHILANTHROPY
calbudgetcenter.org
The state budget is a
statement about our state’s
values and priorities.
In recent years, budget cuts have weakened
key services and supports that help ensure
that economic prosperity is broadly shared.
| 2
Overview
• California’s fiscal outlook is improving due to economic
growth and new revenues approved by voters in 2012.
• But, the economic recovery has yet to reach many
Californians.
• Even with increased revenues, the Governor’s proposed
budget prioritizes fiscal austerity.
• While the Governor’s proposed budget includes long-term
plans for paying down budgetary debt and saving for a
rainy day, it lacks a similar vision for reinvesting in people,
and communities.
| 3
The Social and Economic
Context of the State Budget
Despite five years of sustained economic
growth the recovery remains uneven and
elusive for many Californians.
| 4
The Governor’s Proposed
2015-16 Budget
New revenues would result in increased
spending on education, paying down
budgetary debt, and saving for a rainy day.
| 5
More Than Four in Five State General Fund Dollars
Support Education or Health and Human Services
Proposed 2015-16 General Fund Expenditures = $113.3 Billion
Source: Department of Finance
| 6
Proposition 2: Paying Down
Budgetary Debt and Saving
for a Rainy Day
Voter approval of Proposition 2 (2014) would
require setting aside $2.4 billion in 2015-16.
| 7
After Being Suspended for Six Years, Required Rainy Day
Fund Deposits and Debt Payments Resumed in 2014-15
Dollars in Billions
Deposit to Budget
Stabilization Account
(BSA)
Repayment of
Budgetary Debt
* 2015-16 proposed.
Note: In 2007-08, state policymakers withdrew the entire $1.5 billion
balance in the BSA to help close a state budget shortfall.
Source: Department of Finance
| 8
K-12 Education and California’s
Community Colleges
New revenues would result in increased
spending per student, paying down debt, and
workforce investments.
| 9
Due to Higher State Revenues, the Minimum Funding
Guarantee for K-14 Education Would Increase in 2015-16
K-12 Proposition 98 Spending Per Pupil, Inflation-Adjusted
* 2014-15 estimated and 2015-16 proposed.
Note: Figures are in 2015-16 dollars. Figures exclude child care and include preschool spending.
Proposition 98 spending reflects both state General Fund and local property tax dollars.
Source: Legislative Analyst's Office
| 10
Due to Higher State Revenues, 2015-16 Spending Per
K-12 Student Would Increase to Just Above 2007-08
K-12 Proposition 98 Spending Per Pupil, Inflation-Adjusted
* 2014-15 estimated and 2015-16 proposed.
Note: Figures are in 2015-16 dollars. Figures exclude child care and include preschool spending.
Proposition 98 spending reflects both state General Fund and local property tax dollars.
Source: Legislative Analyst's Office
| 11
Early Education: Child Care
and Preschool
Proposed spending and the number of slots
remain below pre-recession levels.
| 12
Support for Child Care and Preschool Is $1.1 Billion Below
2007-08, Even With the Recent Increase in Funding
Total Funding for Subsidized Child Care and Preschool Slots in California, Inflation-Adjusted
Note: Figures are in 2015-16 dollars and include federal and state funds. Child care includes
CalWORKs and non-CalWORKs programs.
Source: Department of Finance
| 13
State Budget Cuts Have Reduced Child Care and
Preschool Slots by More Than One-Fifth Since 2007-08
Slots in California Funded With Federal and/or State Dollars
Note: Child care includes CalWORKs and non-CalWORKs programs. A portion of the drop since
2007-08, roughly 3,000 slots, is due to a new methodology for calculating funded slots in several
small child care programs.
Source: Department of Finance
| 14
Human Services
A lack of reinvestment leaves the state’s
safety net severely weakened by years of
funding cuts.
| 15
Under the Governor’s Proposal, CalWORKs Grants Would
Remain Far Below the Deep-Poverty Threshold
Annualized Maximum Grant for a Family of Three as a Percentage of the Federal Poverty Line
Note: Grants are for high-cost counties beginning in 1996. Prior to 1998, grants were provided through the Aid to
Families with Dependent Children Program. The 2015 grant reflects a 5% increase scheduled for April 2015.
Source: CBP analysis of Department of Social Services, US Department of Health and Human Services, and US
Social Security Administration data
| 16
Due to Budget Cuts, State Spending for SSI/SSP Grants
Is More Than One-Third Below the 2007-08 Level
General Fund Expenditures in Billions, Inflation-Adjusted
Note: Figures are in 2015-16 dollars. All figures are estimates except for 2015-16,
which is proposed.
Source: Department of Social Services
| 17
SSI/SSP Grants for Individuals No Longer Lift
Seniors and People With Disabilities Out of Poverty
Maximum Monthly Grant for Individuals as a Percentage of the Federal Poverty Line
Source: Department of Social Services and US Department of Health and Human Services
| 18
1107 9th Street, Suite 310
Sacramento, California 95814
916.444.0500
[email protected]
@CalBudgetCenter
@ChrisWHoene
calbudgetcenter.org


© Copyright 2026