
Analysis of the Benefits and Costs of CalMHSA`s Investment in
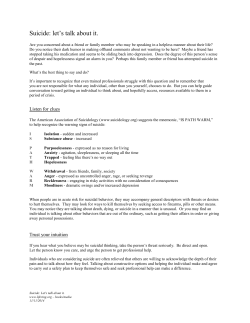
Analysis of the Benefits and Costs of CalMHSA’s Investment
in Applied Suicide Intervention Skills Training (ASIST)
J. Scott Ashwood, Brian Briscombe, Rajeev Ramchand, Elizabeth May, M. Audrey Burnam
S
uicide and suicide attempts are a substantial societal burden in the United States. Nationally, there were approximately 41,000 suicide deaths (a rate of 13.0 suicides per
100,000 people) in 2013 and 836,000 emergency department visits resulting from suicide attempts in 2011 (Centers for
Disease Control and Prevention, 2015a). Suicide is a leading cause
of death in the United States, especially among 15- to 24-yearolds (American Association of Suicidology, 2014), and the annual
economic costs of suicide deaths nationwide are high: Estimates
put this figure at $34.6 billion in combined medical bills and lost
wages (Centers for Disease Control and Prevention, 2012).
Preventing suicide in California is one of the three primary
initiatives of the California Mental Health Services Authority
(CalMHSA). CalMHSA’s statewide suicide prevention initiative,
part of the prevention and early intervention program funded
by the Mental Health Services Act (Proposition 63) of 2004,
includes activities and tools that target and support Californians at risk for suicide. Training and educational programs
are a key component of this initiative. In partnership with
LivingWorks Education (LWE), a suicide intervention training company, CalMHSA offered a training-for-trainers (T4T)
course in Applied Suicide Intervention Skills Training (ASIST),
an intensive two-day suicide intervention workshop, from 2011
to 2013. This course prepared individuals to conduct ASIST
workshops, thereby building suicide prevention capacity within a
community. ASIST is a form of gatekeeper training that teaches
participants—community members such as clergy, first responders, teachers, and other “gatekeepers” who are likely to come in
contact with people at risk of suicide—how to recognize suicide
risk factors and how to intervene to improve immediate safety
and link at-risk individuals to appropriate resources. The ASIST
program was chosen because of evidence supporting its effectiveness in improving the confidence of participants to intervene
with high-risk individuals (LWE, 2013).
In 2011, the RAND Corporation was asked to design and
implement an evaluation of CalMHSA’s three prevention and
early intervention initiatives. As part of this ongoing evaluation,
we are estimating the financial return for investments in key
program components, including suicide prevention. Using data
collected during CalMHSA’s ASIST efforts, as well as outside estimates of the effectiveness of ASIST and similar programs, we have
calculated the possible economic benefits to California for each
year of CalMHSA’s investment in ASIST. We estimated the possible reductions in suicide attempts resulting from investment in
suicide intervention training, then estimated the financial return
to Californians from reduced medical costs associated with suicide
attempts as well as increased earnings from each life saved.
Key Findings
We estimate that California will benefit from CalMHSA’s investment in ASIST in multiple ways: fewer suicide attempts and
deaths, reduced spending on emergency care and recovery, and
increased earnings. After calculating the associated state income
tax revenue from increased earnings and the state government’s
portion of reduced health care spending, we project a positive
financial benefit for the state government.
Because few studies have quantified the effectiveness of
gatekeeper training programs such as ASIST on the outcomes
we evaluated, we cannot precisely quantify the benefits of this
program. Under reasonable assumptions of effectiveness based
on existing research literature,1 we estimate that for each year of
CalMHSA investment in the ASIST T4T program at least 3,600
suicide attempts and 140 deaths will be prevented over the next
28 years. This represents a reduction of 0.13 percent in the number of suicide attempts and deaths.2 We project the financial benefits of averting these attempts and deaths to be $1,100 per dollar
invested in ASIST by CalMHSA; these benefits include savings
in medical costs and increased earnings. When we examined the
financial gains to the state government alone, we estimated $50
per dollar invested in ASIST training.
A macroeconomic cost-benefit analysis of a policy intervention can never be as complete as a narrow cost-benefit analysis of,
say, a company’s investment in a new machine. When a company calculates the financial return for investing in a machine,
–2–
the costs and benefits are internal to the company’s finances—a
completely measurable microeconomic universe. However, once
we apply this calculation to a macroeconomic universe (beyond
the internal budgets of CalMHSA or the California state government, for example), the societal effects of CalMHSA’s investment
in suicide prevention ripple forever outward and could indirectly
affect every human being on Earth for decades into the future.
In other words, it is always unrealistic to expect to capture all
economic effects in a cost-benefit analysis of suicide prevention.
Therefore, this analysis of costs and benefits is designed to be
comprehensible and informative, rather than exhaustive. Quantifying the relationship between CalMHSA’s investment in ASIST
and California’s gain in wage employment, tax revenues, and
averted medical costs will help policymakers put these investments into perspective.
cal costs are averted), and employment may continue (incapacitation from death or from severe injury is averted). Following other
studies of the financial costs of suicide, we focused on wages
earned and medical costs averted to provide an estimate of the
financial benefits of ASIST (Goldsmith et al., 2002; Safe Work
Australia, 2012; Trent, 2014). Our estimate of the financial benefits of suicide prevention is a lower-bound estimate because many
important benefits of suicide prevention do not have monetary
value, and we were limited to outcomes that can be monetized.
For example, we did not factor in the value of decreased suffering for loved ones. Instead, we compared the costs of a one-year
investment in ASIST to changes in wages and medical costs
associated with decreased suicide attempts and deaths. We also
addressed the tax implications of these changes in wages.
Methods
There are a number of challenges inherent in estimating the
financial benefits of a training program like ASIST: choosing
important outcomes that can be quantified and monetized;
finding evidence of changes in these outcomes directly caused by
the investment in training; defining the relevant time frame over
which to assess the benefits and costs; and defining the relevant
level of aggregation. This section describes our methods for
addressing these challenges.
The data used in this analysis are from the ASIST T4T courses
that CalMHSA delivered in the three fiscal years of 2011–2012,
2012–2013, and 2013–2014. A database tracking these “firstgeneration” ASIST trainers (the type of trainers who go on to
train other trainers, and the type that CalMHSA sponsored)
indicates that, on average, these first-generation trainers will lead
ASIST workshops over the course of three years, and some will
lead workshops for as long as 14 years. We assumed that people
who complete these second-generation ASIST workshops (led
by first-generation trainers) will then go on to work with vulnerable populations for an average of ten years. So, for example, a
first-generation trainer who took the T4T course in 2014 would
train a second generation of trainers through 2028, and a secondgeneration trainer who was trained in 2028 would work with
vulnerable populations until 2038. Therefore, CalMHSA’s original cohort of first-generation ASIST trainers is assumed (directly
and indirectly) to reduce suicide attempts during the years 2011
through 2038. This same period also covers all calculations
related to the medical costs of suicide, since most of these costs
occur at the time of the suicide attempt.
On the assumption that the average worker retires at age 65,
theoretically, the last person affected by CalMHSA’s initial investment in ASIST would be 15 years old in 2038 and would retire in
2087. Thus, people benefiting from the original cohort of ASIST
trainers could earn wages and pay taxes from 2011 through 2087.
These time frames made present value calculations particularly significant: Discounting the benefits occurring in future
years to their present value allowed us to take into account the
time value of money. All of the costs to CalMHSA occurred
between the years 2011 and 2014, while most of the benefits will
occur decades into the future. We discounted all these future
benefits using a 3-percent annual discount rate3 because receiving
benefits sooner is better than receiving benefits later—not only
because of inflation but also because of the opportunity cost of
interest on any money invested over the same period. This time
value of money causes, for example, an estimated $136 million
Outcomes
Many of the most important outcomes of a suicide prevention
program—increased confidence to intervene and decreased suffering for loved ones—are not financial. A financial analysis can
evaluate only outcomes that can be quantified and monetized,
and it is therefore, by its nature, limited in scope. Figure 1
illustrates the conceptual model we used to select outcomes. We
focused on two types of outcomes: short-term and long-term.
The short-term outcomes are the number of ASIST trainers
trained and the number of people they then train during their
tenure as trainers. The long-term outcomes are reductions in
suicide attempts and suicide deaths. All these outcomes can be
quantified, though none has a direct financial value. What is the
value of a saved life in dollars? Even so, we can identify certain
financial outcomes associated with suicide attempts and deaths
and thus can provide an estimate of the value of these long-term
outcomes. For example, when people attempt suicide, they inflict
bodily harm that often leads to hospitalization and/or death.
When attempts are averted, hospitalizations do not occur (mediFigure 1. Simplified Conceptual Model for ASIST Outcomes
Short-Term Outcomes
ASIST T4T
program
RAND RR1115-1
Increase in
number
of ASIST
trainers
Trainers
train
others to
intervene
Long-Term Outcomes
Intervention
reduces
suicide
attempts
Reduction in
attempts
means
reduction
in deaths
Study Time Horizon
–3–
in future nominal wage benefits of averting suicide deaths to
discount to a present value of $76 million.
We also assumed that the ASIST program benefits people
between the ages of 15 and 65. We used this age range because
the Centers for Disease Control and Prevention publishes data on
actual suicide deaths in California only for decedents aged 15 to
64, and also because ASIST-trained personnel mostly engage vulnerable people aged 15 to 64. This assumption affects only wage
income and tax calculations for people who avoided death or full
incapacitation because a suicide attempt was averted.4
The Investment Cost of ASIST
For the purposes of this study, the investment in ASIST included
payments that CalMHSA made from fiscal years 2011–2012
to 2013–2014 to LWE to train ASIST trainers. The investment
costs also included the portion of CalMHSA employees’ salaries
and benefits that covered CalMHSA’s management of the ASIST
under LWE. Since we present our results in terms of benefits per
year of investment, we used the average annual spending over the
three years as our estimate of the annual cost of training.5
Estimating the Reach of ASIST
We know from LWE records that CalMHSA’s investment produced, on average, 79 ASIST trainers per year. LWE’s historical
data indicates that the average trainer will teach 150 people in
ASIST workshops over the course of 14 years. We assumed that
each of these 150 trainees will then actively engage vulnerable
populations for an average of ten years. This means that, taken
together, the 79 trainers will teach suicide intervention techniques to a total of almost 12,000 people.
Estimating the Number of Averted Suicide Attempts
Estimating the number of suicide attempts that these 12,000
trainees may help to avert was difficult. As one literature review
aptly put it: “Reducing suicide attempts and deaths [is] the
ultimate aim of suicide prevention programs, but, due to methodological restrictions, they can be difficult or impossible to
measure reliably” (Rodgers, 2010). One of the primary challenges
is the time needed to measure the impact of the ASIST program,
which, as we described earlier, could last until 2087. We were
therefore unable to say with much certainty how many suicide
attempts and deaths could be prevented by this program.
Most of the research on the ASIST program has focused on
the impact of the workshop on a trainee’s confidence to intervene, rather than on estimating reductions in suicide attempts.
One study found that ASIST workshops significantly enhanced
suicide intervention outcomes among suicide hotline counselors
(Gould et al., 2013). Other researchers have studied the impact of
a similar program—QPR (Question, Persuade, Refer) Gatekeeper
Training for Suicide Prevention—at 32 secondary schools and
found that training increased staff suicide identification behaviors, knowledge, and perceived preparedness (Wyman et al.,
2008). Only one study has looked for evidence of an ASIST-specific effect on attempted suicides. This study found that ASIST
trainees helped to avert more suicides than staff who did not
participate in training—at least in the context of Virginia secondary schools (Cornell, Williams, and Hague, 2006). However,
there are some serious limitations to the Virginia study, and we
have supplemented its effect-size estimates with estimates of other
similar suicide prevention programs.
Since we did not have a reliable study of the impact of ASIST
itself on suicide outcomes, we looked for evidence of the impact
of gatekeeper training in general. A study of another secondary school–based gatekeeper training curriculum, called Signs
of Suicide (SOS), estimated the reduction in suicide attempts
among students exposed to the program (Aseltine et al., 2007).
Both the SOS and the Virginia studies focused on schools only,
whereas our analysis attempted to quantify the impacts of a
much broader range of ASIST trainees, including police, suicide
prevention hotline staff, and so on. A large-scale suicide prevention initiative within the broad population of the U.S. Air Force
featured gatekeeper training programs like ASIST, but we were
unable to convert the effect size of this evaluation into effect per
trainer because the Air Force initiative included more than just
gatekeeper training programs, and the details of the intervention
did not include the number of trainers. Also, generalizing from
a military population to the full California population presented
methodological challenges (Knox et al., 2003).
With these caveats in mind, we chose the SOS study as our
primary source of data on the effectiveness of a gatekeeper training program like ASIST. That study, a randomized controlled
study, documented a 34.8-percent reduction in self-reported suicide attempts between the control group and the group enrolled
in health classes led by SOS-trained teachers. Assuming that
it took one teacher per 30 students to produce this effect, and
using California state data on youth suicide attempts applied to
this cohort, we calculated that each SOS-trained teacher helped
to avert 0.03 suicide attempts per year (see Table 1).6 This is our
estimate of the effectiveness per trainee of gatekeeper training
programs like ASIST.
We know from LWE data collected at ASIST workshops
that ASIST trainees work at schools, hospitals, churches, suicideprevention organizations, military organizations, and many other
places. Given these job categories, and using the general attrition
rates observed by LWE among prior ASIST trainees, we assumed
that the average second-generation ASIST trainee will use his or
her suicide intervention skills over the course of ten years, and
will thus prevent an estimated total of 0.3 suicide attempts (0.03
per year, times ten years). Using these calculations, every 100
ASIST-trained workers would help to avert 30 suicide attempts
during the time they engage their vulnerable populations.
This is a rough estimate that takes into account the fact that
some ASIST trainees will retire or change employment (attrition)
and that some individuals and members of some professions will
engage a higher number of vulnerable people than will others
(intensity).
–4–
Table 1. Translating SOS Study Results to Impact per ASIST
Trainee
Serious Suicide Attempts Among
High School Studentsa
Teachers do not have gatekeeper
training
5.1
Teachers have gatekeeper
training
3.3
Differenceb
1.8
Difference per teacherc
0.03
a Requires visit to emergency department and/or hospitalization
for treatment. Rate based on California Department of Public
Health data for high school–age children.
b This represents a 34.8-percent reduction in attempts among
teachers with gatekeeper training.
c This assumes a 30:1 student:teacher ratio.
It is estimated that the Air Force suicide prevention initiative reduced suicides by 33 percent. It is reassuring that both the
Air Force and SOS initiatives produced similar rates of reduction
in suicides for their respective populations; however, we did not
have the same information on the number of gatekeepers trained
or the number of members of the Air Force that each trainee
had contact with, so we could not estimate the same per-trainee
impact that we could for the SOS study.
The Virginia study estimated that, on average, every person
who attended an ASIST workshop would prevent 0.5 suicide
attempts in each year that he or she engages with vulnerable
populations (Cornell, Williams, and Hague, 2006).7 We have
concerns about the validity of these estimates because of the limitations of that study. The treatment and comparison groups were
not randomly assigned; the comparison students were chosen
based on convenience. Given the weakness of the study design,
the impact observed cannot be cleanly attributed to ASIST training. Because of this limitation and because the impact was estimated to be much larger than observed in any other gatekeeper
training evaluation, we did not believe that the Virginia study
was the best source for our projections. We therefore focused on
projections using estimates from the SOS study.8
Estimating Additional Short-Term Outcomes
After estimating the impact of CalMHSA’s investment in ASIST
T4T on suicide attempts, we next estimated changes in the
number of suicide deaths. On average, one out of every 25 suicide
attempts in the United States will result in death (Drapeau and
McIntosh, 2014). Assuming this ratio holds steady, if an ASIST
trainee prevents 25 suicide attempts, he or she also prevents one
suicide death.
We also project changes in the number of lost workdays.
Using World Health Organization data cited in a recent suicide
prevention costing study,9 we divide the 24 nonlethal suicide
attempts into those that result in minor physical injuries and those
that result in incapacitating (major) physical injuries. According
to this study, 17 percent of nonfatal suicide attempts result in full
incapacity, while the remaining 83 percent result in minor injuries
and short absences from work (Doran and Ling, 2014).
Wage Benefit Calculations
Our model distributes all people whose suicide attempts were
averted across the age and sex spectrum of California’s actual
reported suicides (Centers for Disease Control and Prevention,
2012). We then identified two groups: those who died or were
incapacitated, and those who were not incapacitated. For those
who will never work again (because of death or incapacitation),
we calculated average lifetime wages earned, adjusted for age,
sex, unemployment, death by other causes, and the time value
of money (Lawrence et al. 2011). For all others, whose suicide
attempts did not significantly affect their ability to work, we
calculated a day’s lost wages for each person’s age and sex income
group (Safe Work Australia, 2012).
To estimate the present value of the lifetime wages earned
by thousands of people whose fatal or incapacitating suicide
attempts were averted, we first assigned the wages earned by each
person in each age and sex cohort, based on median weekly earnings data in the United States by age and sex from the Bureau
of Labor Statistics (2014). As each cohort advances in age, its
members enter higher wage-earnings brackets until leaving the
workforce at 65. We adjusted (deflated) the number of people by
their life expectancy, based on the national expected survival life
table (National Cancer Institute, 2000) adjusted for California’s
racial mix (U.S. Census Bureau, 2015). Then we deflated this
number by America’s U-6 unemployment rate of 11 percent and
assume this unemployment rate going forward (Bureau of Labor
Statistics, 2015).10 These adjustments significantly deflated the
future wages earned by people whose death or incapacitation
by suicide was averted, because many of them will die of other
causes or will remain unemployed for other reasons. Finally, we
discounted all wages to their value in 2015 (present value) using
a 3-percent annual discount rate. A more detailed description of
our method is available in the Appendix.
Tax Benefit Calculations
Tax benefit calculations are a subset of the same wage benefits
described above.11 We broke out California state government
tax revenues (the expected California income tax receipts from
each age- and sex-specific cohort of wage earners whose suicide
attempts were averted) because focusing solely on the state government’s finances can be useful for certain fiscal analyses and
state budget preparations. As with wage benefits, these tax estimates took into account age, sex, unemployment, death by other
causes, and the time value of money for each cohort of taxpayers.
There are additional benefits that taxpayers may receive from
suicide prevention. Other studies have focused, for instance, on
taxpayer-financed resource savings (averted government expenditures; see Lee et al., 2012, and Trent, 2014). In the case of averted
–5–
suicides, taxpayers could save money as a result of decreased
publicly funded medical costs. We explore this topic further at
the end of the next section.
Medical Benefit Calculations
Whenever a fatal suicide, a physically incapacitating suicide
attempt, or a suicide attempt resulting in a minor physical injury
is averted, some short-term medical costs are also averted. In this
study, we counted these averted medical costs as a benefit of suicide prevention. This entailed estimating the average short-term
medical costs incurred in each of the three suicide scenarios just
described, and then multiplying that cost by the estimated number of averted suicides and suicide attempts within each scenario.
At least two studies have estimated the costs associated with
each of these three scenarios: one used Australia-specific data
(Safe Work Australia, 2012) and the other used California-specific data (Trent, 2014; see Table 2). A more-detailed description
of our method is available in the Appendix.
It is reassuring to note that both of these studies produced
roughly similar estimates. For the discrepancies that do exist,
there are many possible explanations, including differences in the
study populations’ suicide behaviors and differences in the medical costs by region. Because our study focused on a Californiabased investment, we used only the California estimates in our
calculations. As we did for our lifetime earnings calculations, we
discounted all averted medical costs to their present value.
Some portion of the averted medical costs associated with
suicide prevention are costs that the state of California would
have paid through Medi-Cal, California’s Medicaid health care
program. We estimated these averted Medi-Cal payments using
age- and sex-specific emergency department data from California
hospitals, as reported in 2009 and 2010 to the California Office
of Statewide Health Planning and Development. Based on these
data, and also taking into account the gender and age spectrum
of actual suicide attempts in California, we calculated that MediCal pays for 25.43 percent of all medical costs associated with
suicide attempts. Because California pays one-half of all these
Medi-Cal bills (the federal government pays the other half), we
estimated that 12.7 percent of all averted medical costs related
to suicide prevention will benefit the California state government.
Table 2. Summary of Suicide Medical Cost Estimates
Australia
Suicides resulting in death
Discussion
By combining the best available outside evidence of the effectiveness of gatekeeper training with data from LWE specific to its
ASIST program, we have estimated some of the potential benefits
to California of CalMHSA’s investment in suicide intervention
training. Despite conservative estimates of the effectiveness of
gatekeeper training, we project that CalMHSA’s investment
in ASIST T4T will lead to a reduction in suicide attempts and
deaths over the next 28 years and will yield a large financial
return to the state.
Our projections are based on the ability of three second-generation trainees to prevent just one suicide attempt over ten years.
This yields our estimated return to the state government of $50
for each $1 invested. In fact, the actual effectiveness of ASIST
could be much lower and still yield a positive impact in terms of
suicide outcomes and financial benefits to the state. We estimate
that the actual effectiveness of ASIST could be one-fiftieth the
effectiveness we have assumed in our projections, and the state
government would still break even on its investment. This means
that if the actual effectiveness of ASIST is as low as one prevented
suicide attempt per 160 second-generation trainees, the state government would still get back at least $1 for each $1 invested. This
is on top of the nonmonetary benefits of averted suicide attempts
and deaths.
Table 3. Summary of Investment Costs for ASIST T4T
California
$2,899
$4,116
Suicide attempts resulting in
medical incapacitation
$13,235
$11,023
Suicide attempts resulting in
minor injuries
$495
$1,599
NOTE: All values in 2015 U.S. dollars.
Impact Estimates
In 2015 dollars, we estimated that CalMHSA’s annual investment costs in ASIST averaged just over $350,000 (Table 3).
We estimated that one year of CalMHSA’s investment in
ASIST may help to avert 3,569 suicide attempts over the next 28
years, of which approximately 143 would have been fatal and 581
would have been otherwise incapacitating (see Table 4). Our projections indicate that averting these suicide attempts produces a
present-value benefit of $386 million in future wage income and
$8.6 million in averted medical costs. Taking into account that
an original investment of only $356,000 produced these results,
the benefit-to-cost ratio is 1,108. From society’s perspective, that’s
roughly $1,100 returned for each dollar invested. From the more
narrow perspective of the California state government, approximately $50 will be returned to state coffers for every dollar
invested in ASIST. Table 4 illustrates these calculations.
FY 11/12–13/14 Annual Averages
Annual CalMHSA payments to
LWE for ASIST T4T only
Annual CalMHSA staff salaries
to manage ASIST portion of the
LWE contract
Total annual (average) costs
NOTE: All values in 2015 U.S. dollars.
$344,282
$12,144
$356,426
–6–
Table 4. Annual Cost and Long-Term Benefit Calculations
Estimated Value
Annual costs of ASIST for trainers (see Table 2 for
more details)
Annual number of ASIST trainers trained
Number of workers that 79 ASIST trainers will
train
ASIST effect size (suicide attempts averted per
100 ASIST-trained workers)
Suicide attempts prevented by 11,895 ASISTtrained workers, each working for ten years
$356,426
79.3
11,895
30
3,569
Of which…
result in suicide deaths
143
result in incapacitation
581
result in minor injury
2,845
Present value benefits of all work income gained
from averting suicide attempts
$386,307,488
Of which goes toward paying California state
income tax
$17,031,661
Present value benefits of all medical costs averted
by averting suicide attempts
Of which California state government would
have paid for Medi-Cal
Present value of all wage plus medical benefits
Of which accrue specifically to the California
state government
Broader societal perspective: Benefit:cost ratio of
ASIST (dollars returned for each dollar invested):
Of which, California government budget
perspective: Benefit:cost ratio of ASIST
(dollars returned for each dollar invested):
$8,587,784
$1,091,955
$394,895,273
$18,068,026
$1,108
$51
NOTE: All values in 2015 U.S. dollars.
There are a number of limitations to our analysis. An important limitation is the estimate of ASIST effectiveness. We relied
on an estimate from another gatekeeper program that took place
in a specific environment—a high school—that is hard to generalize to a full population. Nonetheless, we felt that the effectiveness estimate we chose is conservative.12 If so, the observed
effectiveness could be higher and could lead to more averted
attempts and higher returns.
We assumed that those whose lives are saved or who are not
incapacitated by a suicide attempt will be able to live as long as
the average Californian. However, many who attempt suicide suffer from depression or some other mental disorder and may have
shorter lives, either because of a higher likelihood of attempting
suicide again or because of complications from poor physical
health (Colton and Manderscheid, 2006; While et al., 2012).
Including this lower life expectancy in our lifetime earning
estimates could lead to a lower estimated return. To test this, we
recalculated lifetime earnings under the assumption that all those
whose suicides are averted have a mental disorder and therefore
have lower life expectancies.13 This had little effect on our estimates, lowering the estimated benefit-to-cost ratio to $1,000 for
the state as a whole, and $49 for the state government.
In a broader economic analysis, one could consider many
other costs associated with investing in ASIST. For example, the
costs of second-generation training are costs borne by California,
so they could be included in our calculation. We do not include
these costs, however, because they were not part of CalMHSA’s
original investment. Using rough estimates provided by LWE,
the cost of training each second-generation trainee could be as
high as $1,100. If so, the return to the state as a whole drops to
$30 per $1 invested.14 It is not clear how this would affect the
return to the state government, but we do not believe training
costs would come out of the state budget.
We have also not addressed the potential additional medical costs that may result from saving a person’s life: a person who
survives a suicide attempt would at least go on to incur a typical lifetime’s worth of medical costs, whereas a deceased person
would not. It is difficult to estimate lifetime health care spending
for those who do not attempt suicide because of ASIST; however,
we acknowledge such spending would, if included, decrease the
net-benefit estimate.
In a broader economic analysis, one could consider many
other benefits derived from investing in ASIST in addition to other
costs. Most significantly, the incalculable value of lives saved and
suffering averted—by the people who attempt suicide, their relatives, friends, and the surrounding community—was not included
in this study, despite the existence of a body of legal literature
devoted to calculating the dollar value of suffering. Including any
of these additional benefits would increase the net-benefit estimate.
We also did not include the nonwage value of people’s work.
This could include fringe benefits for those who are employed
(Lawrence et al., 2011), and an imputed value for lost household
production/services for those who are otherwise unemployed
(Haddix, et al., 2003; Lee et al., 2012). Even more significantly,
we have not included the multiplier effects of paid wages (nor
have we included the opposite effects of eliminating demand for
medical services from the economy). Whenever economic activity
is added to or subtracted from an economy (such as the added
wages of a person whose suicide was prevented), the economic
impacts reach well beyond the individual’s wages earned as he
or she spends this income and it becomes someone else’s wages
and profit. As stated in the introduction, our goal was not to
be exhaustive, but rather to be comprehensible. We have intentionally focused on wage and medical benefits to highlight the
relationships between one policy intervention and two large,
quantifiable benefits that it produces.
It is impossible to predict exactly how CalMHSA’s investment
in ASIST T4T will impact California; however, we believe that the
impact will be positive and will unfold over the next few decades.
–7–
Methodology Notes and Appendix Tables
Methodology for Calculating Lifetime Earnings
1. Calculate the number of suicides averted and incapacitating suicide attempts averted. Both of these would have
resulted in a complete cessation of lifetime work, so both
follow the same steps below.
2.
Assign total number of averted suicide attempts and
deaths to genders: 79.17 percent male and 20.83 percent
female, based on the actual California suicide deaths
reported in 2012. We assumed that these percentages
hold into the future, and also that they reflect the distribution of incapacitating suicide attempts.
3.
Assign the total males and total females into age groups,
based on Table A.1.
4.
Adjust (deflate) the total number of people in each
age and gender group by their expected survival rate
(Table A.2), multiplied by the number of years they will
remain in that group. For example, for N females beginning in the 55–64 age group who remain in that age
group for five years, the expected number of people to
survive is (0.9926)5 × N.
5.
Adjust (deflate) the total number of people in each
age and gender group by the U-6 unemployment rate.
That is to say, among all the people who survive death,
some of them will remain unemployed. U-6 unemployment includes all forms of unemployment, not just
those captured in standard unemployment rates. For
example, California’s recent official unemployment rate
of 7.3 percent does not include people who have given
up looking for work, but we must include such people in
this analysis because we cannot assume they will produce
income. We use a U-6 unemployment rate of 11 percent
and assume it remains constant into the future.
6.
Model the aging of this population, assigning surviving graduates (see Step 4 but NOT Step 5) of each age/
gender group to progress to the next age cohort. After
they enter each new age cohort, we repeat Steps 4 and
5. Again, note that Step 5 never deflates the number
of people progressing to the next age cohort, because
although they may be unemployed at any one point in
time, they still live to progress to the next age cohort and
may attempt employment again.
7.
Assign starting salary to each averted incident based on
age group and gender, using Table A.3. Multiply each
age/gender cohort by their annual salary ($) and the
number of years that they remain in that age group (Y):
N × $ × Y.
8.
Adjust (discount) the dollar amounts calculated in Step
7 for the time value of money, using a constant annual
discount rate of 3 percent. The formula looks like this:
ResultOfStepSeven/(1+DiscountRate)Y
9.
Calculate Steps 7 and 8 for each age and gender group as
they progress through their lifetimes.
10. Sum the results of all Step 8 calculations to get the total
present value expected income.
Table A.1. Distribution of California Suicides by Age and
Sex, 2012
Table A.2. Annual Expected Survival Rate for Californians,
2000
Age Group
Age Group
Males
Females
Male
Female
16–19
4.0%
4.9%
16–19
0.99905
0.99960
20–24
9.2%
8.6%
20–24
0.99874
0.99956
25–34
18.5%
13.4%
25–34
0.99868
0.99942
35–44
19.4%
20.4%
35–44
0.99769
0.99873
45–54
25.5%
27.8%
45–54
0.99491
0.99710
55–64
23.5%
25.0%
55–64
0.98813
0.99266
SOURCE: Centers for Disease Control and Prevention, 2015b.
NOTE: We only grouped the original raw data into the above age
categories.
SOURCE: RAND calculation based on National Cancer Institute,
2000, and California’s racial profile as measured in U.S. Census
Bureau, 2015.
NOTE: We have assumed year 2000 expected survival remains
constant going forward. RAND has taken the year 2000 expected
survival rates for each racial category, and then compiled a
California-specific survival table based on California’s racial mix.
–8–
Table A.3. Annual Income for Salaried Workers in the
United States, 2013
Age Group
Male ($)
Female ($)
16–19
20,972
18,821
20–24
26,456
23,768
25–34
40,007
35,759
35–44
51,407
41,244
45–54
53,451
40,921
55–64
54,365
41,889
NOTE: We annualized Bureau of Labor Statistics data by
multiplying weekly data by 52 (weeks). We also inflated the
original 2013 data to 2015 dollars using the Consumer Price Index
calculator at http://data.bls.gov/cgi-bin/cpicalc.pl
Methodology for Calculating Medical Costs
1. Calculate the number of suicide attempts averted.
Calculate the number of suicide deaths based on the 25:1
ratio of attempts to deaths reported by the American
Association of Suicidology (2014). In other words, one
out of every 25 suicide attempts results in death.
3.
Calculate the number of incapacitating and medically
minor suicide attempts averted. Of the 24 nonfatal suicide attempts remaining after Step 1, assign 17 percent of
them to incapacitating and 83 percent of them to medically minor groupings, based on Doran and Ling (2014)
citing a World Health Organization study.
Each of these three categories corresponds to its own
average medical costs, as outlined in Table 2 in the main
body of this report. Multiply the number of people
assigned to each category by the dollar amounts for each
category given in Table 2.
5.
We assumed that, on average, each medical event occurs
ten years in the future. The base year is 2015, and the
annual discount rate remains 3 percent. We adjusted Step
3 numbers to their present value to take into account the
time value of money.
Sensitivity of Assumptions on ASIST Effectiveness
Our estimate of the effectiveness of ASIST is based on the
effectiveness of SOS (another gateway training program) among
high school students. There were two key assumptions that we
made in translating the estimated effect from that study to an
estimate that we used in our models. The first assumption was
related to our definition of a suicide attempt, and the second was
related to the ratio of students to teachers. We explore both of
these assumptions in detail in this section. Table A.4 provides a
summary. The rows contain the different definitions of suicide
attempts that we considered, and the last two columns represent
different counts of total teachers. The cells of the last two columns contain the estimated number of averted suicide attempts
per teacher for each combination of definition and number of
teachers. We have highlighted the value used in our analysis.
To estimate the effect of SOS training, the SOS study
evaluated the difference between the treatment and comparison
populations in the percentage of students who self-reported at
least one suicide attempt in the prior three months. The reported
SOURCE: Bureau of Labor Statistics, 2014.
2.
4.
Table A.4. Exploration of Effect Size Assumptions
Averted Suicide Attempts per Teacher
Definition of Suicide Attempt
Source
Percentage of High
School Students
Assumed 30:1
Student:Teacher
Ratio
Assumed 1 Teacher
per Study School
Self-report, any attempt
SOS studya
18.0
1.80
13.59
Self-report, any attempt
2003 YRBSb
8.5
0.85
6.42
Self-report, any injury needing
treatment
2003 YRBSc
2.9
0.29
2.19
Claims, injury from self-harm
emergency department and
hospital
California Department
of Public Health, 2006d
0.3
0.03
0.23
a Aseltine et al., 2007. Percentage of students in 2003 treatment sample who reported attempting suicide at least once in
the past three months multiplied by 4 to get annual percentage.
b Centers for Disease Control and Prevention, 2013. Percentage of respondents who said they had attempted suicide one
or more times in the past 12 months.
c Centers for Disease Control and Prevention, 2013. Percentage of respondents who said their suicide attempt resulted in
an injury, poisoning, or an overdose that had to be treated by a doctor or nurse in the past 12 months.
d EpiCenter, undated. California Department of Public Health data on the number of visits to an emergency department
and the number of hospitalizations that resulted from self-harm.
–9–
percentages, when annualized, are much higher than the percentage reported in a national sample of high school students. In the
comparison population, 4.5 percent reported at least one attempt
in the prior three months in 2003. This is a much higher annual
rate than the 8.5 percent reported in the Youth Risk Behavior
Survey (YRBS; Centers for Disease Control and Prevention,
2013), so we did not want to rely on it as an estimate of the baseline suicide attempt rate.
For our medical cost calculations, we included the costs
of treatment for suicide attempts. The YRBS includes another
self-reported measure: the percentage of students who say they
attempted suicide at least once in the past year, and that the
attempt required medical treatment. We considered this definition
as well, since it is related to our medical cost definitions. An alternative would be to use data on emergency department visits and
hospitalizations that result from self-harm. The California Department of Public Health provides these counts on their website
(EpiCenter, undated). This last definition was the one we chose for
our analysis. It is directly related to our medical cost calculation,
and it yields the most conservative estimate of the effectiveness of
gatekeeper training. As you can see in Table A.4, the estimated
effect of each teacher on suicide attempts varies substantially,
from 0.03 averted attempts for the claims-based definition to 1.8
averted attempts for the annualized attempts reported in the SOS
study (assuming the 30:1 student-to-teacher ratio).
We were concerned about generalizing the estimates from
the SOS study to the broader California population for our analysis. The SOS study was based on a sample of high school students in other states, and the ratio of attempts to deaths among
adolescents is very different than the average for the population.
That means that what adolescents consider a suicide attempt may
be different, and relying on an effect observed on a self-reported
measure for this population could bias our estimates.
The second assumption we made was the assumed number of
teachers that produced the observed decrease in suicide attempts in
the SOS study. The authors of that study did not report the number of teachers who performed the SOS training. As we described
in our report, we assumed a ratio of 30 students per teacher, but
it is possible that there were fewer teachers. The effect per teacher
would be higher with fewer teachers. There were nine schools in
the SOS study, so we provided estimates under the assumption
that there was only one teacher per school. This is likely to be
too low but provides a lower bound. Under this assumption, the
estimated effect per teacher was about 7.8 times higher than the
estimate for the 30:1 assumption. It ranges from 0.23 to 13.59
averted suicide attempts per teacher. If there were more teachers,
the estimated effects would be lower for each definition.
Table A.4 demonstrates that the estimated impact of
CalMHSA’s ASIST program can vary substantially depending on
the assumptions we make about the effectiveness of that training.
In the absence of clear data to assess effectiveness, we chose conservative assumptions. Nonetheless, we project positive benefits
to the state as a result of these investments. It is possible that
the observed benefits will be higher or lower. Using our method
for projecting the financial impact of the ASIST program, we
calculated that if the observed effect of ASIST is as low as 0.0006
averted attempts per trainee, the financial benefit to the state
government would be $1 for each $1 invested. In other words,
the observed effectiveness per trainee would have to be 1/50th
what we assumed for our projections for the state to just break
even, using the model we present in the report. That means the
observed effectiveness can be much lower than what we assumed
in our models, and we would still project a positive financial
return to the state government.
Second-Generation ASIST Costs
In the report, we focus on the costs to CalMHSA of the T4T
training performed by LWE. In this Appendix, we estimate the
maximum costs per trainee that Californians may experience
when CalMHSA’s ASIST trainers train other workers to use
ASIST. Table A.5 contains the summary of these second-generation training costs based on information provided by LWE. We
estimated that each ASIST trainer that CalMHSA sponsored will
go on to train 150 people on how to use ASIST and that this process is currently ongoing. We call these 150 people second-generation ASIST trainees, and we refer to their training workshops
as second-generation training. We estimated that by 2027, some
12,000 such second-generation trainees will have been trained as
an indirect result of CalMHSA’s original investment in training 238 trainers. Note that CalMHSA will not necessarily pay
for any of these second-generation workshops, so these costs are
borne by a wide variety of people and organizations in California.
For example, sometimes a school will decide to pay teachers to
attend such a workshop, usually led by 2 ASIST-trained teachers
per class of 30 second-generation trainees. Therefore, it would
not be reasonable to assume that the state and local governments
bear all of these costs; government organizations (indirectly or
directly) pay only some of these costs. It is more reasonable to
think of these costs as borne by society, even though members
of society are not paying cash for each line item. For example,
although some ASIST trainers are paid an honorarium, others
volunteer their time. Either way, the cost of their time can be
imputed. The same is true for the cost of whatever workshop
Table A.5. Estimates of Second-Generation Training Cost
Components (provided by LWE)
Cost Category
Participant kits
Cost to train one trainee
$41
Trainer/teacher honorarium/salary
$133
Travel
$320
Meeting room (paid or imputed)
Participants’ salaries (imputed)
Total
$40
$557
$1,091
– 10 –
conference room is used for these trainings—whether money
changes hands for the use of the conference room or not, the
conference room still has an implicit cost, often referred to as the
opportunity cost of renting it to someone who would have paid
cash. Table A.5, therefore, contains cost estimates that—whether
imputed or actual—are real costs to society to train each second-
generation ASIST trainer. If added to the costs that CalMHSA
paid for the first generation of ASIST trainers, these costs reduce
the overall society’s benefit-to-cost ratio from 1,108:1 to 30:1.
This is a significant reduction, but it still results in a positive
benefit to society of $30 returned for each $1 invested.
Table A.6. California Income Tax Brackets, 2015
Table A.8. Percentage of Emergency Department Visits for
Self-Harm Paid by Medi-Cal
Annual Income
Tax Rate
$0+
1.00%
Age Group
Males (%)
Females (%)
$7,582+
2.00%
16–19
35.9
40.7
$17,976+
4.00%
20–24
21.1
27.1
$28,371+
6.00%
25–34
15.9
30.3
$39,384+
8.00%
35–44
15.2
29.0
$49,774+
9.30%
45–54
22.7
22.4
$254,250+
10.30%
55–64
21.5
24.3
$305,100+
11.30%
$508,500+
12.30%
SOURCE: All percentages are based on 2009 and 2010 emergency
department records provided by the California Office of Statewide
Health Planning and Development.
$1,000,000+
13.30%
SOURCE: “California Income Tax Brackets 2015,” Tax-Brackets.org,
2015.
NOTE: We assumed these same brackets remain unchanged to
calculate Table A.7.
Table A.7. 2015 California Income Tax Totals, as Percentage
of Total Wages
Age Group
Males
Females
16–19
1.9%
1.7%
20–24
2.4%
2.2%
25–34
3.5%
3.2%
35–44
4.6%
3.7%
45–54
4.7%
3.6%
55–64
4.8%
3.7%
NOTE: Calculations based on Tables A.3 and A.6.
NOTE: Self-harm defined as primary e-code E950-E959. Weighted
average (by percentage of all suicides by age and gender;
Table A.1) of all the above percentages is 25.4 percent, half of
which is paid by California (12.7 percent).
– 11 –
Notes
We base our projections on the assumption that three trainees combined will prevent at least one suicide attempt in ten years.
1
We assume that the average number of deaths from suicide in California during the years 2011 to 2013 would remain the same for the
28 years of our projection. The average for 2011 to 2013 was 3,934
(EpiCenter, undated). We also assume a constant ratio (25:1) of suicide
attempts to suicide deaths. This assumption is discussed in the methods
section of this report.
2
Three percent is commonly used as a discount rate for analyses like
this. For example, it is the rate recommended by the Panel on CostEffectiveness in Health and Medicine (Gold et al., 1996). The Office
of Management and Budget (2014) currently recommends a lower rate
of 1.5 percent but, to keep this analysis consistent with other analyses
of this type, we have used 3 percent. A lower discount rate would yield
higher net benefits and would increase the ratio of benefits to costs.
3
4
This methodology may slightly inflate benefits if ASIST helps a significant number of people over the age of 65, and it may deflate benefits if it
helps a significant number of people under the age of 15.
According to representatives of CalMHSA and LWE, spending was
stable over the three years, so the average is a good estimate of
CalMHSA’s spending per year on training.
5
This study found a 34.8-percent reduction in the rate of self-reported
suicide attempts over the previous three months for the treatment
students relative to the controls (3.0 percent versus 4.6 percent). Both
of these three-month rates yielded annual rates that were much higher
than the national average for this age group (7.8 percent, according to the Youth Risk Behavior Survey [Centers for Disease Control
and Prevention, 2013]), so we used data on the number of emergency
department visits for self-injury/suicide from the California Department
of Public Health to estimate the number of attempts in a year. This gave
us an estimated number of annual suicide attempts for the treatment
(3.3 attempts) and control students (5.1 attempts). When we divided
the difference (1.8 attempts) by the number of students and applied our
assumed ratio of 30 students to each SOS-trained teacher, we got our
estimate of 0.03 attempts per year.
6
Cornell, Williams, and Hague (2006) found that the mean number
of suicide attempts per year at schools where ASIST-trained personnel
7
worked was 0.7, while at control-group schools it was 3.2. This average
annual difference of 2.5 suicide attempts, if it resulted from the effects
of ASIST, mostly likely did not always occur at schools where there
was only one ASIST-trained person. RAND contacted the report’s lead
author to find out how many schools were surveyed, but unfortunately
he no longer had full access to that information. Therefore, we assumed
that, on average, each averted suicide attempt resulted from five ASISTtrained people, making the effect size of one ASIST-trained person 0.5
suicide attempts averted per year. Again, because of the low confidence
we have in this effect size estimate, we did not use these results for our
projections.
Estimates based on Cornell, Williams, and Hague (2006) are higher.
They are not reported here but are available by request from the authors.
8
We acknowledge that there are differences between the population
studied by the World Health Organization and the population of California. These differences could bias our estimates; however, it is difficult
to assess the direction of that possible bias.
9
10
U-6 unemployment includes all forms of unemployment, not just
those captured in standard unemployment rates. For example, California’s recent official unemployment rate of 7.3 percent does not include
people who have given up looking for work, but we must include such
people in this analysis because we cannot assume they will produce
income.
11
When presenting our findings, we do not add these tax benefits to the
wage and medical benefits because this would double count the taxable
portion of wages. Some portion of each person’s wages is paid in taxes,
so all wage calculations already include taxes.
We provide a detailed discussion of our assumptions in the Appendix.
We also discuss the implications of our assumptions on the estimate
and the sensitivity of our estimate to these assumptions. For the analysis
presented above, we chose assumptions that generate the lowest estimate
of effectiveness.
12
We adjusted the likelihood of survival for each age/gender cohort in
our models to reflect the highest relative mortality rate (4.9) reported in
Colton and Manderscheid, 2006.
13
14
We include a detailed discussion of this in the Appendix.
– 12 –
References
American Association of Suicidology, “Suicide in the USA—Based on
2011 Data,” fact sheet, 2014. As of April 8, 2015:
http://www.suicidology.org/Portals/14/docs/Resources/FactSheets/2011/
SuicideUSA2014.pdf
Aseltine, R. H., A. James, E. A. Schilling, and J. Glanovsky, “Evaluating
the SOS Suicide Prevention Program: A Replication and Extension,”
BMC Public Health, Vol. 18, No. 7, 2007, p. 161.
Bureau of Labor Statistics, data on labor force statistics, U.S.
Department of Labor, 2014. As of February 1, 2015:
http://www.bls.gov/webapps/legacy/cpswktab3.htm
———, “Table A-15: Alternate Measures of Labor Underutilization,”
Economic News Release, U.S. Department of Labor, 2015. As of April
8, 2015:
http://www.bls.gov/news.release/empsit.t15.htm
“California Income Tax Brackets 2015,” Tax-Brackets.org, 2015. As of
May 12, 2015:
http://www.tax-brackets.org/californiataxtable
Centers for Disease Control and Prevention, “Suicide: Facts at a
Glance,” fact sheet, 2012. As of April 8, 2015:
http://www.cdc.gov/violenceprevention/pdf/suicide-datasheet-a.pdf
———, “Trends in the Prevalence of Suicide-Related Behavior,
National YRBS [Youth Risk Behavior Survey]: 1991–2013,” fact sheet,
2013. As of April 8, 2015:
http://www.cdc.gov/healthyyouth/yrbs/pdf/trends/us_suicide_trend_
yrbs.pdf
———, “Suicide and Self-Inflicted Injury,” web page, updated
February 6, 2015a. As of April 8, 2015:
http://www.cdc.gov/nchs/fastats/suicide.htm
Gold, M. R., J. E. Siegel, L. B. Russell, and M. C. Weinstein, eds.,
Cost-Effectiveness in Health and Medicine, New York: Oxford University
Press, 1996.
Goldsmith, S. K., T. C. Pellmar, A. M. Kleinman, and W. E. Bunney,
eds., Reducing Suicide: A National Imperative, Washington D.C.:
National Academies Press, 2002.
Gould, M. S., W. Cross, A. R. Pisani, J. L. Munfakh, and M.
Kleinman, “Impact of Applied Suicide Intervention Skills Training
(ASIST) on the National Suicide Prevention Lifeline,” Suicide and LifeThreatening Behavior, Vol. 43, No. 6, 2013, pp. 676–691.
Haddix, A. C., S. M. Teutsch, and P. S. Corso, eds., Prevention
Effectiveness: A Guide to Decision Analysis and Economic Evaluation, New
York: Oxford University Press, 2003.
Knox, K. L., D. A. Litts, G. W. Talcott, J. C. Feig, and E. D. Caine,
“Risk of Suicide and Related Adverse Outcomes After Exposure to a
Suicide Prevention Programme in the US Air Force: Cohort Study,”
BMJ, Vol. 327, 2003, pp. 1376–1380.
Lawrence, B. A., S. Bhattacharya, E. Zaloshnja, P. Jones, T. R. Miller,
P. S. Corso, and C. A. Steiner, Medical and Work Loss Cost Estimation
Methods for the WISQARS Cost of Injury Module, PIRE, 2011. As of
April 8, 2015:
http://www.cdc.gov/injury/wisqars/pdf/wisqars_cost_methods-a.pdf
Lee, S., S. Aos, E. Drake, A. Pennucci, M. Miller, L. Anderson, and
M. Burley, Return on Investment: Evidence-Based Options to Improve
Statewide Outcomes: Technical Appendix Methods and Users Manual,
Olympia, Wash.: Washington State Institute for Public Policy, April 9,
2012.
LivingWorks Education, Applied Suicide Intervention Skills Training:
Evidence in Support of the ASIST 11 Program, Calgary, Alberta, 2013.
———, “Injury Prevention and Control: Data and Statistics
(WISQARS),” online database, updated April 1, 2015b. As of April 8,
2015:
http://www.cdc.gov/injury/wisqars/
LWE—See LivingWorks Education.
Colton, C. W., and R. W. Manderscheid, “Congruencies in Increased
Mortality Rates, Years of Potential Life Lost, and Causes of Death
Among Public Mental Health Clients in Eight States,” Preventing
Chronic Disease, Vol. 3, No. 2, 2006.
Office of Management and Budget, Circular A-94 Appendix C: Discount
Rates for Cost-Effectiveness, Lease Purchase, and Related Analyses,
Washington, D.C., 2014.
Cornell, D., F. Williams, and C. Hague, Evaluation of Student Suicide
Prevention Training in Virginia, Charlottesville, Va.: Virginia Youth
Violence Project, Curry School of Education, University of Virginia,
2006.
Doran, C., and R. Ling, The Economic Cost of Suicide and Suicide
Prevention Behaviour in the NSW Construction Industry and the Impact
of MATES in Construction Suicide Prevention Strategy in Reducing This
Cost, Hunter Medical Research Institute, University of Newcastle, 2014.
As of April 8, 2015:
http://www.matesinconstruction.org.au/flux-content/mic-2013/pdf/
MIC-Report-October-2014.pdf
Drapeau, C. W., and J. L. McIntosh, “U.S.A. Suicide 2012: Official
Final Data,” Washington, D.C.: American Association of Suicidology,
October 18, 2014. As of April 8, 2015:
www.suicidology.org/Portals/14/docs/Resources/
FactSheets/2012datapgsv1d.pdf
EpiCenter, data on California selected injury topics, California
Department of Public Health, undated. As of May 7, 2015:
http://epicenter.cdph.ca.gov/ReportMenus/InjuryDataByTopic.aspx
National Cancer Institute, “2000 Expected Survival Table,” online data
table, National Institutes of Health, 2000. As of April 8, 2015:
http://seer.cancer.gov/expsurvival/2000.html
Rodgers, P., Review of the Applied Suicide Intervention Skills Training
Program (ASIST): Rationale, Evaluation Results, and Directions for Future
Research, Calgary, Alberta: Living Works Education, 2010.
Safe Work Australia, The Cost of Work-Related Injury and Illness for
Australian Employers, Workers and the Community: 2008–09, Canberra,
Australia, March 2012.
Trent, R., “Lifetime Costs of Suicide Deaths, Self-Harm
Hospitalizations, and Self-Harm Emergency Department Cases Treated
and Released, California 2012,” June 13, 2014.
U.S. Census Bureau, “State and County Quick Facts: California,” web
page, U.S. Department of Commerce, 2015. As of April 8, 2015:
http://quickfacts.census.gov/qfd/states/06000.html
While, D., H. Bickely, A. Roscoe, K. Windfuhr, S. Rahman, J. Shaw,
L. Appleby, and N. Kapur, “Implementation of Mental Health Service
Recommendations in England and Wales and Suicide Rates,” Lancet,
Vol. 379, No. 9820, 2012, pp. 1005–1012.
Wyman, P. A., C. H. Brown, J. Inman, W. Cross, K. Schmeelk-Cone,
J. Guo, and J. B. Pena, “Randomized Trial of a Gatekeeper Program for
Suicide Prevention: 1-Year Impact on Secondary School Staff,” Journal
of Consulting and Clinical Psychology, Vol. 76, No. 1, 2008, pp. 104–115.
Acknowledgments
This document benefited from the rigorous technical reviews of Joshua Breslau, Donna Farley, and Carole
Gresenz, which served to improve the quality of this report. In addition, members of the Statewide Evaluation
Experts (SEE) Team, a diverse group of California stakeholders, provided valuable input on the project.
RAND Health
This research was conducted in RAND Health, a division of the RAND Corporation. A profile of RAND
Health, abstracts of its publications, and ordering information can be found at http://www.rand.org/health.
CalMHSA
The California Mental Health Services Authority (CalMHSA) is an organization of county governments working to improve mental health outcomes for individuals, families, and communities. Prevention and Early Intervention programs implemented by CalMHSA are funded by counties through the voter-approved Mental Health
Services Act (Prop. 63). Prop. 63 provides the funding and framework needed to expand mental health services
to previously underserved populations and all of California’s diverse communities.
© Copyright 2015 RAND Corporation
www.rand.org
The RAND Corporation is a nonprofit institution that helps improve policy and decisionmaking through research and
analysis. RAND focuses on the issues that matter most, such as health, education, national security, international
affairs, law and business, the environment, and more. As a nonpartisan organization, RAND operates independent
of political and commercial pressures. We serve the public interest by helping lawmakers reach informed decisions
on the nation’s pressing challenges. RAND’s publications do not necessarily reflect the opinions of its research clients
and sponsors. R® is a registered trademark.
RR-1115-CMHSA


© Copyright 2026