
Stroke CT Angiography (CTA) 4.1 Introduction Death or incapacitating disability can be prevented
Copyright © 2006. Springer. All rights reserved. May not be reproduced in any form without permission from the publisher, except fair uses permitted under U.S. or
applicable copyright law.
Chapter 4
Stroke CT Angiography
(CTA)
Shams Sheikh, R. Gilberto González,
Michael H. Lev
Contents
4.1
4.2
Introduction . . . . . . . . . . . . . . . . . . . . .
Background – General Principles of CTA . . . . .
4.2.1 Advantages and Disadvantages of CTA . . .
4.2.1.1 Potential Advantages . . . . . . . . .
4.2.1.2 Potential Disadvantages . . . . . . .
4.2.2 CTA Scanning Technique: Pearls and Pitfalls
4.2.2.1 Single-slice Protocols . . . . . . . . .
4.2.2.2 Multi-slice Protocols . . . . . . . . .
4.2.3 Radiation Dose Considerations . . . . . . .
4.3 CTA Protocol for Acute Stroke . . . . . . . . . . .
4.3.1 General Considerations . . . . . . . . . . .
4.3.2 Contrast Considerations . . . . . . . . . . .
4.3.2.1 Contrast Timing Strategies . . . . . .
4.3.3 Post-processing: Image Reconstruction . .
4.3.3.1 Image Review . . . . . . . . . . . . .
4.3.3.2 Maximum Intensity Projection . . . .
4.3.3.3 Multiplanar Volume Reformat . . . .
4.3.3.4 Curved Reformat . . . . . . . . . . .
4.3.3.5 Shaded Surface Display . . . . . . .
4.3.3.6 Volume Rendering . . . . . . . . . .
4.4 CTA Protocol for Acute Stroke . . . . . . . . . . .
4.5 Accuracy and Clinical Utility of CTA
in Acute Stroke . . . . . . . . . . . . . . . . . . .
4.5.1 Optimal Image Review . . . . . . . . . . . .
4.5.2 Role of CTA in Acute Stroke . . . . . . . . .
4.6 Future Directions . . . . . . . . . . . . . . . . . .
4.7 Conclusion . . . . . . . . . . . . . . . . . . . . . .
References . . . . . . . . . . . . . . . . . . . . . . . . . .
57
59
59
59
59
61
63
63
63
64
64
65
66
70
70
71
72
73
73
73
77
79
79
79
83
83
83
4.1 Introduction
Death or incapacitating disability can be prevented
or diminished in some patients who present within
6 h of embolic stroke onset by thrombolytic therapy
[1–14].With the recent advent of the Desmotoplase in
Acute Ischemic Stroke (DIAS) Trial results, this time
window may soon be extended to as long as 9 h [15].
In the treatment of anterior circulation stroke, current guidelines support the use of intravenous (i.v.)
recombinant tissue plasminogen activator (rt-PA)
administered within 3 h of stroke [12, 13]. Intra-arterial (i.a.) thrombolysis, which has a longer treatment
window, can be administered within 6 h of anterior
circulation stroke ictus [9]. However, the risk of
intracranial hemorrhage from these agents, as well as
the probability of treatment failure, increases dramatically with time after stroke onset [6, 13, 16]. In
the case of brainstem (posterior circulation) stroke,
the treatment window for thrombolysis is greater
than 6 h, not only because of the apparent increased
resistance of the posterior circulation to hemorrhage, but also because of the uniformly poor outcome of untreated basilar artery strokes and the lack
of alternative therapies [10].
Conventional, noncontrast head CT (NCCT) scanning is performed on all patients prior to treatment,
in order to exclude hemorrhage or a large [greater
than one-third middle cerebral artery (MCA) territory] infarction, both of which are contraindications to
treatment [13, 16]. The role of unenhanced CT in the
evaluation of acute stroke is fully discussed in the
previous chapter. Although NCCT has some value
in predicting patients most likely to be harmed by
thrombolysis, it is of little value in predicting the
EBSCO Publishing : eBook Collection (EBSCOhost) - printed on 9/14/2012 10:19 AM via VANDERBILT UNIV
9783540308102 ; González, R. G..; Acute Ischemic Stroke : Imaging and Intervention
Account: s4136838
57
Copyright © 2006. Springer. All rights reserved. May not be reproduced in any form without permission from the publisher, except fair uses permitted under U.S. or
applicable copyright law.
58
Chapter 4
patients – those with large vessel vascular occlusions
– most likely to benefit from thrombolysis.
Because NCCT and clinical exam alone are limited
in their ability to detect large vessel thrombus, CT
angiography (CTA) has been increasingly advocated
as a first-line diagnostic test for patients presenting
with signs and symptoms of acute stroke. Advancements in scanner technology, novel contrast injection
schemes that allow for uniform vascular and tissue
enhancement, and the availability of rapid postprocessing algorithms have all resulted in the clinically practical detection using CTA of both circleof-Willis thrombus [17, 18] and parenchymal stroke
[19–24].
Due to the narrow time window available for the
initiation of thrombolytic treatment, speed is of the
essence. The rationale in the workup for acute stroke
is therefore to identify as quickly as possible those patients who may benefit from i.a. or i.v. thrombolysis
or other available acute stroke therapies. Importantly, CTA excludes from treatment patients with occlusive stroke mimics [e.g., transient ischemic attack
(TIA), complex migraine, seizure] who will not benefit from, and may be harmed by, such therapies.
The CTA protocol described in this chapter was
designed to provide diagnostically useful information about both the vascular and parenchymal phases of brain enhancement. The administration of contrast serves two purposes: first, to visualize acute clot
in the MCA, distal internal carotid artery (ICA), basilar artery, and other major circle of Willis vessels
(Fig. 4.1); and second, to better delineate potentially
salvageable, underperfused, ischemic areas of the
brain that are at risk for full infarction if circulation
is not restored. More specifically this includes those
areas with a relative lack of contrast enhancement on
CTA source images (CTA-SI), consistent with reduced
blood volume. Indeed, simultaneous recording and
subtraction, on a slice-by-slice basis, of the pre- from
the post-contrast axial images results in quantitative
maps of cerebral blood volume (CBV) [25]. The reasons for, and clinical significance of, this blood volume weighting of CTA-SIs is fully discussed in the
next chapter on CT perfusion. Moreover, CTA-SI can
also be of value in suggesting otherwise unsuspected
regions of vascular occlusion. For example, CTA-SI
S. Sheikh · R.G. González · M.H. Lev
Figure 4.1
Axial maximal intensity projection (MIP) image obtained at the CT scanner console provides a rapid
review of the major intracranial vessels for possible
occlusion
“perfusion deficits” present in multiple vascular territories, visible on post- but not pre-contrast images,
suggests cardiac emboli as the stroke source.
Helical CT is less expensive and more readily available at most hospital emergency departments compared to MRI; therefore, performing CTA can be a
quick and natural extension of the NCCT exam,
an exam that is already routinely obtained as part of
the pre-thrombolysis workup at most institutions.
The addition of CTA seldom adds more than 10 min
of scanning and reconstruction time to that of the
conventional CT examination. With the speed of the
newer generation of multidetector row CT (MDCT)
scanners, a complete “arch-to-vertex” CTA can be
performed during the dynamic administration of a
single bolus of contrast, allowing visualization of the
great vessel origins, carotid bifurcations, and Circle
EBSCO Publishing : eBook Collection (EBSCOhost) - printed on 9/14/2012 10:19 AM via VANDERBILT UNIV
9783540308102 ; González, R. G..; Acute Ischemic Stroke : Imaging and Intervention
Account: s4136838
Copyright © 2006. Springer. All rights reserved. May not be reproduced in any form without permission from the publisher, except fair uses permitted under U.S. or
applicable copyright law.
Stroke CT Angiography (CTA)
of Willis – often obviating the need for further evaluation by MR angiography or ultrasound. Although
complete post-processing of the entire neurovascular
system is typically performed offline (during which
time the patient can be prepared for thrombolysis, if
necessary), the “critical” maximal intensity projection (MIP) reformatted images of the intracranial circulation can routinely be constructed directly at the
CT console in under a minute.
This chapter will discuss the role of CTA in the
diagnosis and triage of acute stroke patients. First,
the general principles of helical CT scanning will be
reviewed, including image acquisition and reconstruction techniques. The stroke CTA protocol will
then be described, followed by specific issues regarding the accuracy and clinical utility of stroke CTA.
4.2 Background –
General Principles of CTA
The development of helical CT in the early 1990s
made possible the rapid acquisition of angiographictype vascular images, with no greater risk of patient
complications than that of routine i.v. contrast-enhanced CT scanning.With helical CT scanning, a slipring scanner design developed in the early 1990s, permits the x-ray tube and detectors to freely rotate
around the gantry for a full 360°, allowing CT image
data to be continuously and rapidly acquired as the
scanner table moves uniformly through the gantry.
This results in the creation of a three-dimensional
helical “ribbon” of data that can be reconstructed at
any arbitrary slice increment, and reformatted in any
arbitrary plane (Fig. 4.2).
4.2.1 Advantages and Disadvantages of CTA
CTA has both advantages and disadvantages compared to other vascular imaging techniques [26–28].
Increasingly, as scanner speed and spatial resolution
continue to improve – for a relatively constant total
radiation dose – with the ongoing development of
more advanced 16-, 32-, and 64-slice multidetector
row CT scanners, these disadvantages are becoming
less restrictive, especially with regard to total iodinated contrast dose.
Chapter 4
4.2.1.1 Potential Advantages
Speed. The entire length of the ICA can be scanned
in under 60 s (the extracranial ICA alone in less than
30 s), minimizing image misregistration from motion
and breathing artifacts, and often reducing contrast
requirements.
Accuracy. CTA provides truly anatomic, non-flow-
dependent data with regard to length of stenoses,
residual lumen diameters and areas, and calcifications; flow-dependent techniques such as MR angiography (MRA) and ultrasound (US) are not able
to provide these data. Figure 4.3 illustrates the accuracy of CTA as compared to contrast-enhanced MRA.
Low Risk. CTA has a lower rate of patient discomfort,
is less expensive, and has considerably lower risk of
stroke and other vascular complications compared to
conventional catheter arteriography. It is also advantageous in situations when MR is contraindicated or
cannot be performed. CTA is typically more readily
available than MR, especially in emergency settings.
CTA, unlike MRA, lends itself to the imaging of acutely ill patients, as there are no restrictions on the type
and quantity of associated support equipment, such
as intravenous pumps, ventilators, or monitoring
hardware. Because CT scan acquisition is more rapid
than that of MRA, CTA is less prone to motion artifact. When CTA is combined with CT perfusion
(CTP) for the evaluation of acute stroke, quantitative
perfusion data can also be obtained, which is not typically possible with MR perfusion imaging.
4.2.1.2 Potential Disadvantages
Limited Field-of-view and Spatial Resolution. With
slower, older generation, single slice helical scanners,
CTA is limited in its ability to optimally evaluate tandem or multiple lesions of diverse vessels. This is usually due to restrictions imposed by either x-ray tube
heating or the contrast bolus dose. Also, for a given
set of imaging parameters (mAs, kV, slice thickness,
etc.), single-slice CTA has slightly decreased in-plane
resolution compared to conventional axial CT imaging. With the newer, faster, multidetector row scanners, these limitations do not typically exist.
EBSCO Publishing : eBook Collection (EBSCOhost) - printed on 9/14/2012 10:19 AM via VANDERBILT UNIV
9783540308102 ; González, R. G..; Acute Ischemic Stroke : Imaging and Intervention
Account: s4136838
59
Copyright © 2006. Springer. All rights reserved. May not be reproduced in any form without permission from the publisher, except fair uses permitted under U.S. or
applicable copyright law.
60
Chapter 4
S. Sheikh · R.G. González · M.H. Lev
a
b
Figure 4.2
Sagittal and coronal MIP images, output from the CT
scanner console, in the plane selected by the user. The
slice thickness is adjusted to target the vessels of interest and “remove” overlying vessels that would obscure
evaluation. a Sagittal MIP image shows the course of
the anterior cerebral artery with variant additional vessels arising from the anterior communicating artery.
b Coronal MIP image shows the ICA and MCA bifurcations bilaterally. c Second coronal MIP image adjusted
to view the basilar artery in its entirety
c
Figure 4.3
a Contrast-enhanced MRA: there
is apparent nonfilling of the left vertebral artery (arrow).
b Curved reformat
from CTA of the
vertebrobasilar
junction now
demonstrates
patent vertebral
arteries (arrow)
a
b
EBSCO Publishing : eBook Collection (EBSCOhost) - printed on 9/14/2012 10:19 AM via VANDERBILT UNIV
9783540308102 ; González, R. G..; Acute Ischemic Stroke : Imaging and Intervention
Account: s4136838
Copyright © 2006. Springer. All rights reserved. May not be reproduced in any form without permission from the publisher, except fair uses permitted under U.S. or
applicable copyright law.
Stroke CT Angiography (CTA)
Chapter 4
Long Post-processing. CTA reconstructions may require long post-processing times. Although axial,
coronal, and sagittal MIP images of the circle of Willis
can typically be obtained at the CT console by technologists in under a minute, more complex reconstructions, such as curved reformats of the entire
length of the carotid or vertebral arteries, can take
considerably longer.
Physiological Data. Unlike MRA and US, CTA is limited in its ability to provide physiological data, such
as flow velocity or direction.
Accuracy of Reconstructions. Dense, circumferential
calcifications can cause beam hardening and degrade
the accuracy of vascular reconstructions. Optimal
methods for measuring small (<1–1.5 mm) vascular
stenosis are under investigation.
Iodinated Contrast Risk. The risks of routine i.v. contrast administration accompany CTA, including the
possibility of allergic or idiosyncratic reactions or
glomerular injury. Compared with US and MRA,
which do not require i.v. contrast, CTA can be inconvenient for routine follow-up studies. Some hospitals
commonly use US and MRA for noninvasive vascular
screening and follow-up of carotid occlusive disease.
In the nonemergency setting, CTA can be reserved for
use as a problem-solving tool when the results of US
and MRA are inconsistent, or when tandem lesions
are present, such as in Fig. 4.4, and can often obviate
the need for conventional catheter arteriography.
4.2.2 CTA Scanning Technique:
Pearls and Pitfalls
The rapid acquisition of the large digital dataset required for CTA places great demands on CT imaging
hardware and software. Because CT image noise is
inversely proportional to x-ray photon flux through a
given axial slice, optimal helical scanning requires a
high x-ray tube heat load capacity.
Certain user-defined imaging parameters are
unique to helical CT scanning. “Pitch” refers to the
ratio between table increment per gantry rotation
and x-ray beam collimation [29].
Figure 4.4
Tandem lesion, with stenosis at the origin of the left
common carotid artery (LCCA) and origin of the left
internal carotid artery (LICA)
Depending on the precise vendor and generation
of scanner (single-slice, 4-slice, 8-slice, 16-slice, etc.),
tube-heating constraints may limit the total deposited tube current [in milliampere-seconds (mAs)]. For
a given tube current (in mAs) and voltage (in kV), increasing the pitch, by increasing the table increment
per gantry rotation, will allow greater coverage; however, there will be fewer photons per slice, resulting in
quantum mottle. When the table travel per rotation is
equal to the beam collimation, there is a one-to-one
ratio between the column of transmitted x-rays and
the detector width; the pitch is “1,” and image quality
is improved [30].When the table travel per rotation is
less than the beam collimation, pitch is less than 1,
and there is “overlap” of photon flux through the
imaged tissue bed, resulting in even greater image
quality. Figure 4.5 illustrates the advantage of overlapping the acquisition of helical data. Hence, in all
our neuroimaging protocols at Massachusetts General
EBSCO Publishing : eBook Collection (EBSCOhost) - printed on 9/14/2012 10:19 AM via VANDERBILT UNIV
9783540308102 ; González, R. G..; Acute Ischemic Stroke : Imaging and Intervention
Account: s4136838
61
Copyright © 2006. Springer. All rights reserved. May not be reproduced in any form without permission from the publisher, except fair uses permitted under U.S. or
applicable copyright law.
62
Chapter 4
S. Sheikh · R.G. González · M.H. Lev
Table 4.1. Optimization of posterior fossa image quality and
minimization of “windmill artifact”
Minimal pitch (0.5–0.6)
Slow table speed (5–7 mm/gantry rotation)
Maximal gantry rotation rate (0.4–0.5 s/rotation)
Thinnest possible acquisition matrix;
thick reformats for image review
a
b
Figure 4.5
“Ribbons” of helical data as acquired from helical CT.
a When the pitch is less than 1, such as in a four-channel system, and the table translation equals three channels, then the ribbon acquired from the first channel of
the second rotation will overlap the ribbon of the
fourth channel of the first rotation. b When the pitch is
greater than 1, more longitudinal area can be covered;
however, the helical data ribbons do not overlap, so
each ribbon must receive a sufficiently high x-ray dose
to obtain a diagnostic image, and the advantages of
overlapping data cannot be used
Hospital (MGH), optimal visualization of posterior
fossa structures is achieved using a pitch <1. In order
to both optimize posterior fossa image quality and
minimize helical “windmill artifact,” we therefore
typically employ a pitch of 0.5–0.6, along with a relatively slow table speed of 5–7 mm/rotation, with the
newest generation of multidetector row scanners.Additionally, in an attempt to reduce motion artifact,
our protocols typically call for the most rapid achievable gantry rotation rate. This can be as fast as 0.5 s
per rotation on the newer 16-slice scanners. Moreover, spatial resolution in the z-direction is optimized
by the acquisition of minimally thin slices, although
image noise and quantum mottle are reduced by the
review of thicker reformatted images (Table 4.1).
Finally, we routinely choose our tube current (in
mAs) setting to be no higher than that which will permit the use of the small – rather than the large – focal
spot size.
By maximizing longitudinal coverage and image
quality, the overall time to complete imaging increases. This demands an increased amount of iodinated
contrast media, so as to adequately opacify the arterial tree being imaged, while minimizing arterial
dilution and wash out, as well as venous opacification. Ideally, the overall dose of contrast agent should
also be minimized so as to lessen the risk of contrastinduced nephropathy (CIN), as well as allergic reaction. Variations on the theme of contrast administration include injection strategies such as a saline bolus
chaser and multiphasic injection, which are explained below. For a given pitch, an increased table
speed permits greater z-direction coverage of the
arterial tree during peak, uniform contrast enhancement, whereas a slower table speed, although provid-
EBSCO Publishing : eBook Collection (EBSCOhost) - printed on 9/14/2012 10:19 AM via VANDERBILT UNIV
9783540308102 ; González, R. G..; Acute Ischemic Stroke : Imaging and Intervention
Account: s4136838
Copyright © 2006. Springer. All rights reserved. May not be reproduced in any form without permission from the publisher, except fair uses permitted under U.S. or
applicable copyright law.
Stroke CT Angiography (CTA)
ing greater image quality, may result in imaging portions of the vascular system with less than optimal
enhancement, and more venous opacification.
4.2.2.1 Single-slice Protocols
In order to achieve optimal arterial image contrast
and resolution, single-slice CTA protocols must
therefore be tailored to the region being studied, the
clinical question being asked, and the heat load capability of the scanner being used. In general, values for
slice acquisition, thickness, scan field of view (FOV),
and pitch should be as small as possible such that the
entire region of interest can be covered in a single
scan. Of note, for both single and multislice scanners,
the diameter of the body part being scanned should
never exceed the scan FOV, or beam-hardening artifact from outside the FOV will result. Conversely,
tube current should be as large as possible, within
tube heating constraints, so as to maximize photon
flux and therefore minimize quantum mottle (image
graininess). The image reconstruction interval
should also be minimized in order to reduce the step
or “zipper” artifact. For example, optimal characterization of a known, focal, carotid bifurcation stenosis
can be achieved using the following single-slice CT
parameters: 1 mm collimation, pitch of 1, 0.5 mm
reconstruction interval, 12 cm FOV, 140 kV, and
250 mA, scanned narrowly around the level of maximal stenosis. Screening of the entire carotid artery,
however, requires 3 mm collimation, a pitch >1, and
typically a reduced tube current and voltage, to permit greater z-direction coverage [27, 28, 31].
4.2.2.2 Multi-slice Protocols
With multidetector row CT (MDCT), the choice of
optimal scan parameters becomes more complex.
Armed with newer x-ray tubes capable of higher heat
capacity, as well as novel detector designs, multislice
scanners can comfortably image entire vascular territories without the aforementioned constraints. The
more rapid MDCT affords imaging of the arterial
phase during more uniform contrast enhancement,
more closely mimicking a catheter arteriogram [32].
Early MDCT scanners, circa 1994, had a detector ar-
Chapter 4
ray of four rows along the z-axis, with four data channels to record the x-ray attenuation. Newer MDCT
scanners employ 16 or more detector rows with varying combinations of individual detector widths, data
channels, maximal z-direction coverage, and minimal slice thickness. Some vendors build detector
arrays with narrower central rows than outer rows –
so-called adaptive array detectors [33]. At the time of
writing, 64-slice scanners will soon be commercially
available, which will be capable of up to 4 cm of z-direction coverage and 0.6-mm-thick slices per gantry
rotation. Such scanners will be ideally suited to coronary artery imaging. Overall, when compared with
single-slice scanners, multislice scanners allow for
reduced contrast dose, shorter scan duration, and
thinner slices.
4.2.3 Radiation Dose Considerations
Interestingly, as the number of detector rows and
channels increases in the evolution of MDCT scanners, allowing more coverage and better resolution,
overall radiation dose to the patient has not significantly increased for a given level of image quality. At
most institutions, the radiation dose for a typical
head CT remains in the range of 0.06–0.12 Gy or
6–12 rad. To put this in context, the limits for occupational exposure to radiation (as set by the Nuclear
Radiology Commission), for negligible likelihood of
harmful effect, is no greater than 50 milli-sievert
(mSv) per year (or 5 rem/year) [34]. In comparison,
environmental exposure to radiation, such as from
radon and cosmic x-rays, is approximately 3.5 mSv/
year, and that of a single chest radiograph is roughly
0.05–0.1 mSv [35, 36]. It is noteworthy that these
limits exist for occupational exposure, but not for
patients, as it is assumed that patient exposure is
diagnostically required.
To compare exposure between different CT protocols, one can use the absorbed dose, usually reported
as the CT dose index (CTDI) in mGy. This concept
was introduced by Jucius and Kambic to predict the
multiple slice average dose at the center of a set of
axial scans [37]. The product of the CTDIvol and the
z-axis coverage for the particular scan then yields the
“dose-length product” (DLP), where CTDIvol is the
EBSCO Publishing : eBook Collection (EBSCOhost) - printed on 9/14/2012 10:19 AM via VANDERBILT UNIV
9783540308102 ; González, R. G..; Acute Ischemic Stroke : Imaging and Intervention
Account: s4136838
63
Copyright © 2006. Springer. All rights reserved. May not be reproduced in any form without permission from the publisher, except fair uses permitted under U.S. or
applicable copyright law.
64
Chapter 4
S. Sheikh · R.G. González · M.H. Lev
Table 4.2. Strategies to reduce radiation dose
Advantages
Disadvantages
Lower tube current (mAs)
Decreased radiation dose
Noisier image
Thinner slices with low tube current (mAs)
Decreased radiation dose
Can reformat to any desired thickness
Source images are too grainy
Automated tube modulation
Decreased radiation dose
Complexity of scan setup
average dose in the standard head CT dosimetry
phantom [38, 39].
With regard to MDCT radiation exposure, several
factors must be weighed. There is up to a 4.5% loss of
efficiency versus single-detector row scanners due to
absorption of radiation in the z-axis by septa between the detector rows [33]. However, with MDCT,
more of the x-ray beam is utilized per rotation due to
the increased number of detector rows, with less of a
penumbra [33]. Subsequently, these effects balance,
and the dose efficiency of MDCT has been shown to
be comparable to that of single-slice helical CT [33].
A related issue is the so-called cone beam effect,
which to date has been a rate-limiting step in the development of larger (32-, 64-slice) detector arrays.
This refers to the fact that the further a given detector
row is from the center of the x-ray beam, the more
angled the beam is through that detector, introducing
nonlinearities to the image reconstruction algorithm.
There are several strategies to reduce radiation exposure in MDCT. Reducing photon flux is the primary means; however, decreasing tube current (mAs)
results in increased image noise, as there are fewer
x-rays per slice interrogated. This “quantum mottle”
therefore becomes exaggerated with thinner slices.As
already noted, the noise associated with thin slices
can be compensated for by review of thicker slab
reformatted images. Indeed, it has been shown that
increasing depth from 4 to 8 cm requires doubling
the tube current (mAs) to maintain the same amount
of noise [38, 39]. Again, to lower the tube current
(mAs) and maintain diagnostic image quality with
MDCT, thinner slices with decreased tube current
(mAs) can be acquired and reconstructed at thicker,
less noisy slice intervals. Table speed and pitch can
also be increased, thereby decreasing exposure, so
long as image quality is not degraded [40].
Lowering kilovoltage peak (kVp) is another strategy to reduce radiation exposure. The kVp setting
reflects both photon number and photon energy.
With higher kVp values, although fewer photons are
absorbed (due to less interaction with biological tissue, which typically has a relatively low “k-edge”),
each photon has higher energy. Hence, calculation of
actual absorbed radiation dose becomes complex for
low kVp scanning, in which tube current (mAs) is
often increased to maintain image quality. Typical
kVp for head CT scanning is 140 or 120 kVp [41]. A
notable exception to this is CTP, which employs
80 kVp, so as to take advantage of the low k-edge of
iodine, in order to increase conspicuity of the relatively small amounts of contrast reaching the brain
parenchyma (see Chapter 5).
Specific advances in MDCT have been directed towards lowering radiation dose. Among these, automatic tube current modulation is more important for
body than for head imaging. With this technique, the
tube current is adjusted according to body diameter
on the scout image, so as to maintain the same total
amount of noise in the image (proportional to photon flux) for any given slice (Table 4.2) [42].
4.3 CTA Protocol for Acute Stroke
4.3.1 General Considerations
A successful CTA protocol requires balancing multiple
scanning, contrast administration, reformatting, and
reconstruction parameters, in order to obtain diagnostically useful images of the enhanced vascular tree. Reformatting here refers to the immediate post-process-
EBSCO Publishing : eBook Collection (EBSCOhost) - printed on 9/14/2012 10:19 AM via VANDERBILT UNIV
9783540308102 ; González, R. G..; Acute Ischemic Stroke : Imaging and Intervention
Account: s4136838
Copyright © 2006. Springer. All rights reserved. May not be reproduced in any form without permission from the publisher, except fair uses permitted under U.S. or
applicable copyright law.
Stroke CT Angiography (CTA)
Table 4.3. General principles of single-slice CT and multidetector row CT (MDCT)
Single Slice CT
MDCT
Standard contrast dose
Reduced contrast dose
Longer imaging time
Shorter imaging time
Thicker slices
Thinner slices
ing of the raw image data into various slice thicknesses, FOVs, and “kernel” formats (such as “bone” or
“brain” algorithms). Reconstruction refers to the creation of summary 2D and 3D projections for image review and interpretation (such as maximum intensity
projection,“MIP,” or volume rendering,“VR”).
Ideally, there should be no venous enhancement;
although, except for specific indications - such as cavernous sinus aneurysm and arterial venous malformation (AVM) assessment – this is seldom clinically
limiting. z-direction coverage, in plane and longitudinal resolution, and signal-to-noise ratio should be
maximized, while minimizing radiation dose, total
amount of contrast administered, and acquisition
slice thickness. Our routine stroke CTA protocol for
8-, 16-, 64-, and sometimes even 4-slice MDCT scanners covers from the great vessel origins at the aortic
arch, to the cranial vertex. A typical 4-slice protocol
might cover only the neck and Circle-of-Willis vessels, and a typical single-slice protocol might be restricted to the Circle of Willis only.
MDCT is preferred over single-detector row helical scanners, as there is improved heat load capacity
of the x-ray tube, which results in more freedom in
selecting the specific imaging parameters. The coverage area can be imaged more quickly with MDCT;
there are more options in selecting pitch, table speed,
and intrinsic slice thickness to obtain a desirable image quality. With continued scanner evolution, the
interaction between these variables is increasingly
complex and nonintuitive; however, in our experience
– for brain imaging – certain general principles have
emerged, as enumerated in Table 4.3. Although increasing pitch or table speed can lead to lowered image quality, this can be overcome by increasing tube
current (mAs). With decreasing pitch, and hence
Chapter 4
more overlap of the helical dataset, raw images benefit from increased density of the x-ray attenuation
data, resulting in less noise.
After reformatting, MDCT data are displayed as
both axial images (usually with a slice thickness
that is a multiple of the acquisition slice thickness)
and reconstructed images (discussed below). With
MDCT, the interslice gap can be arbitrarily selected,
so the subsequent 2D and 3D reconstructed images
will not be subject to “zipper” or “stair step” artifact.
4.3.2 Contrast Considerations
Optimal CTA imaging is dependent on the concentration of intravascular iodine, which in turn is dependent on both choice of contrast and injection
strategy. Nonionic CT contrast agents have been
shown to be safe in an animal model of MCA stroke,
without significant neuronal toxicity, even to already
ischemic neurons [43, 44]. There are several forms of
nonionic contrast, with varying concentrations of
iodine. The relationship between concentration and
enhancement is demonstrated graphically in Fig. 4.6
[45, 46].
Some patients are at higher risk for CIN, most
notably those who are diabetic, who have pre-existing renal dysfunction, or who have a combination of
the two. Nephrotoxicity from contrast media is dose
dependent [47, 48]. Recently, Aspelin et al. [49]
demonstrated the benefit of using iodixanol, an isoosmolar agent, in patients with diabetes and borderline renal function, although this agent has both
increased expense, and increased viscosity at room
temperature, compared to other low osmolar (but not
iso-osmolar) agents [49, 50]. In their randomized
prospective multi-center study, diabetic patients with
renal impairment undergoing angiography had a 3%
incidence of CIN. To counter the increased viscosity
of iodixanol, one can pre-warm the contrast media. It
is noteworthy, however, that some studies have suggested that other low-osmolar agents, with lower cost
and viscosity, may have similarly good safety profiles
with regard to CIN.
For those patients who are allergic to iodinated
contrast media, premedication with anti-histamines
and steroids can blunt the anaphylactic response.
EBSCO Publishing : eBook Collection (EBSCOhost) - printed on 9/14/2012 10:19 AM via VANDERBILT UNIV
9783540308102 ; González, R. G..; Acute Ischemic Stroke : Imaging and Intervention
Account: s4136838
65
Copyright © 2006. Springer. All rights reserved. May not be reproduced in any form without permission from the publisher, except fair uses permitted under U.S. or
applicable copyright law.
66
Chapter 4
S. Sheikh · R.G. González · M.H. Lev
Figure 4.6
When iodine concentration is increased, there is a proportionally greater peak enhancement, shown with
iodine concentration greatest in c and least in a
Although a full discussion of the management of
iodinated contrast allergy is beyond the scope of this
text, it is noteworthy that, in the setting of an acute
stroke, there is insufficient time to complete a course
of steroid administration, which requires many
hours. For such patients, gadolinium may be used as
an alternative CT contrast agent for the evaluation of
acute stroke [51]. Importantly, some researchers have
suggested that – at the doses required for CTA – any
potential advantage of gadolinium over iodinated
contrast, for use in patients with high risk of CIN, is
negated. Figure 4.7 demonstrates the clinical utility
of gadolinium for emergent evaluation of the Circle
of Willis by CTA.
Yet another strategy to decrease total contrast load
is the use of a so-called bolus chaser – saline rapidly
injected immediately following the contrast bolus.
This has the advantage of clearing the “dead space” of
contrast in the i.v. tubing and brachiocephalic/subclavian veins that does not typically contribute to imaging (thereby also reducing streak artifact at the
thoracic inlet). Bolus chasing, which requires the use
of a dual-head CT power injector, has been shown to
be effective in maintaining peak maximum enhancement, with a reduced total contrast dose [52–54]. The
addition of a chaser results in a similar initial rate of
Figure 4.7
Gadolinium-enhanced CTA can be used in an urgent
situation. Here, the top of the internal carotid arteries is
clearly seen, as is the top of the basilar artery
enhancement, and can additionally contribute to a
longer overall duration of enhancement [55], shown
graphically by Fig. 4.8. It is estimated that bolus chasing can reduce total contrast load by an average of
25% or more [56, 57].
4.3.2.1 Contrast Timing Strategies
Achieving adequate arterial opacification depends on
the volume, rate, and duration of contrast administration, graphically depicted in Fig. 4.9. Ideally, imag-
EBSCO Publishing : eBook Collection (EBSCOhost) - printed on 9/14/2012 10:19 AM via VANDERBILT UNIV
9783540308102 ; González, R. G..; Acute Ischemic Stroke : Imaging and Intervention
Account: s4136838
Copyright © 2006. Springer. All rights reserved. May not be reproduced in any form without permission from the publisher, except fair uses permitted under U.S. or
applicable copyright law.
Stroke CT Angiography (CTA)
Chapter 4
Figure 4.8
Use of a saline bolus chaser (b, dashed line) results in a
greater maximum enhancement and a slower delay in
wash out when compared to the standard bolus (a, solid
line).The rectangle shows the ideal enhancement
ing should begin as the arterial tree enhances, and be
completed prior to significant venous opacification –
something not routinely achievable due to the relatively short mean transit time (2–4 s) of contrast
through the capillary bed. This is not typically problematic unless the cavernous sinus is being evaluated,
although, as noted earlier, the extremely rapid imaging achievable with the newest generation of 64-slice
helical scanners lends new importance to various
contrast-timing strategies (Table 4.4).
Indeed, with up to 16-slice scanners, our acute
stroke protocol typically calls for a fixed 25-s prep delay between the onset of contrast administration and
the onset of scanning, except for patients with atrial
fibrillation (or other causes of significantly decreased
cardiac output), who require a longer, 35- to 40-s delay.
Scanners equipped with a “bolus tracking” function can use a variable prep delay, in order to minimize venous enhancement; however, this adds complexity to scanning protocols, and is seldom clinically important unless scanning is very rapid. With
bolus tracking, scanning starts once a preset Hounsfield opacification is reached in a vessel of interest. As
already noted, venous opacification does not routinely interfere with diagnostic evaluation, with the pos-
Figure 4.9
Increasing the injection rate (c has the fastest rate) or
volume (c has the greatest volume) results in a greater
maximum enhancement
sible exception of cavernous sinus evaluation. The
inherent lag within the system, between the desired
time to start imaging and the actual image acquisition, remains the main disadvantage with this technique. This can range from 5 to 15 s, as reported in
several studies [58–60]. Modern scanners have a delay of as long as 4 s with the bolus tracking function.
As an alternative to bolus tracking, a “smartscan”
type function can be used, in which a test bolus is administered to determine the scan delay [61]. A region
of interest is selected, typically in the proximal ICA,
and 10 ml of contrast is injected. This region is
scanned continuously using the “low mAs/kVp”
EBSCO Publishing : eBook Collection (EBSCOhost) - printed on 9/14/2012 10:19 AM via VANDERBILT UNIV
9783540308102 ; González, R. G..; Acute Ischemic Stroke : Imaging and Intervention
Account: s4136838
67
Copyright © 2006. Springer. All rights reserved. May not be reproduced in any form without permission from the publisher, except fair uses permitted under U.S. or
applicable copyright law.
68
Chapter 4
S. Sheikh · R.G. González · M.H. Lev
Table 4.4. Strategies for contrast dose administration
Advantages
Disadvantages
Higher iodine concentration
Better opacification
Higher contrast dose
Higher flow rate
Greater peak enhancement
Larger i.v. access
Vascular injury
Higher injection volume
Greater peak enhancement
Higher iodine load
Iso-osmolar contrast
Less nephrotoxic
Costlier
Increased viscosity
Gadolinium
Can be used in urgent situations,
for patients with severe allergy
Vascular enhancement not as dense;
risk of increased nephrotoxicity
with large gadolinium doses
Saline chaser
Less contrast medium
Requires potentially expensive
specialized dual head CT power
injectors
Decreased streak artifact at origin
of great vessels
Greater absolute difference
in attenuation
Fixed delay
Simple, error free, straightforward
for multiple technologists
in large centers
Must lengthen delay for atrial fibrillation;
may be inadequate for timing
in very rapid newer (64-slice) scanners
Bolus tracking
Accounts for different patient physiology
More complex and time consuming
for the technologist; scanning may not
occur during peak or uniform contrast
enhancement
Test bolus
Accounts for different patient physiology
More complex; requires 10–15 ml
of additional contrast, not required
for imaging
Multiphasic injection
(Fleischmann)
Uniform plateau of enhancement
Requires test bolus
Accounts for varying patient physiology
Requires dual phase CT power injector
Multiphasic,
with exponential decay (Bae)
Uniform plateau of enhancement
Requires multiple assumptions
regarding patient factors that may
not be known or justifiable
Requires CT power injector capable
of exponential decay mode
technique, and the prep delay is chosen as the time
corresponding to 50% of maximal test vessel opacification.As with bolus tracking, however, a test bolus is
seldom clinically necessary. Of the thousands of
CTAs performed at MGH, scanning began too early
with the use of a 25-s delay for only a handful of
patients with low cardiac output secondary to atrial
fibrillation. Figure 4.10 demonstrates the limited utility of a scan when the delay is not chosen correctly.
Both mathematical and animal models have demonstrated that, when there is reduced cardiac output,
intravenous injection will result in a delayed intra-
EBSCO Publishing : eBook Collection (EBSCOhost) - printed on 9/14/2012 10:19 AM via VANDERBILT UNIV
9783540308102 ; González, R. G..; Acute Ischemic Stroke : Imaging and Intervention
Account: s4136838
Copyright © 2006. Springer. All rights reserved. May not be reproduced in any form without permission from the publisher, except fair uses permitted under U.S. or
applicable copyright law.
Stroke CT Angiography (CTA)
Chapter 4
Figure 4.10
Limited evaluation of the vertebral artery due to streak artifact and poor choice of scan delay.In this example, there is a left
C7 transverse process fracture through the foramen transversarium. Fortunately, the ipsilateral vertebral artery, although
poorly opacified, does not enter the foramen at this level.There is poor visualization of the vertebral artery as the majority
of the contrast is venous. Furthermore, sequentially caudad levels demonstrate streak artifact from dense contrast injected in the ipsilateral arm in the left subclavian vein, which obscures evaluation of the origin of the vertebral artery
arterial arrival time, and a greater peak arterial
enhancement [62]. In patients with reduced cardiac
output, therefore, once again, a 35- to 40-s prep delay
is typically employed. Increasing the degree of arterial opacification can be accomplished simply by utilizing either a larger injection volume, or a faster injec-
tion rate. With a test bolus, the time density curve
generally has a slightly different geometry from that
of the main bolus, as shown in Fig. 4.11. This is likely
due to injection of a smaller amount of contrast without a saline flush, which has different dilutional
effects [55].
EBSCO Publishing : eBook Collection (EBSCOhost) - printed on 9/14/2012 10:19 AM via VANDERBILT UNIV
9783540308102 ; González, R. G..; Acute Ischemic Stroke : Imaging and Intervention
Account: s4136838
69
Copyright © 2006. Springer. All rights reserved. May not be reproduced in any form without permission from the publisher, except fair uses permitted under U.S. or
applicable copyright law.
70
Chapter 4
S. Sheikh · R.G. González · M.H. Lev
function” was the “black box,” which substitutes
for the multiple compartment model of Bae et al.’s
approach. Using a discrete Fourier transform, the
injection parameters that will result in a desired
degree and duration of contrast enhancement in
any given vessel can then be calculated. Unlike Bae
et al.’s multi-compartmental model, no estimates or
assumptions regarding patient weight, cardiac output, or other individual details needs to be included
in the calculation. This tailored bolus can result
in more uniform, optimal vascular enhancement,
while simultaneously minimizing contrast requirements [69].
Figure 4.11
Time density curve of a test bolus (a) as compared with
the standard bolus (b). The rectangle demonstrates the
ideal enhancement
As image acquisition takes a finite amount of time,
usually longer than the time required for peak arterial enhancement, the resultant CTA image will include
portions of the arterial tree that are not at peak enhancement. If the degree of arterial enhancement is
not uniform, a thresholding-based reconstructed
image may demonstrate a false occlusion [63, 64]. By
using bolus-shaping strategies, so that arterial enhancement plateaus instead of peaks, more uniform
vascular opacification is achieved and a more representative image of the vascular tree can be displayed.
To determine the appropriate injection strategy,
mathematical models of vascular enhancement have
been developed. Bae et al. [62, 65] used a compartmental approach to model aortic enhancement. From
this model, a multiphasic injection was proscribed by
solving for the inverse of the model, the input function [66]. They found that an exponentially decelerated injection method yields uniform vascular enhancement [67].
Alternatively, Fleischmann and Hittmair [68]
modeled aortic enhancement by treating the entire
body as a “black box,” where the input function was
defined by the administration of a small contrast test
bolus, and the output function was simply the resulting, measured time-attenuation curve. The “patient
4.3.3 Post-processing: Image Reconstruction
4.3.3.1 Image Review
Appropriate image review is as important as optimal
scanning technique for the correct interpretation of
CTA studies. This applies to both image display parameters and three dimensional reconstruction techniques. With regard to soft copy image display, proper window and level settings are essential for optimizing parenchymal stroke detection. During image
review of both NCCT and CTA images, windows and
level settings should be chosen so as to exaggerate
gray matter, white matter contrast, as discussed in
Chapter 3 [70].
The CTA dataset is commonly reformatted into
image slices twice that of the acquired scan width,
however, with some degree of overlap. Even without
overlap, this method may result in a prohibitive number of images for visual review. We therefore typically have two sets of axial reformatted images – one set
with thick slices, for minimal quantum mottle, a minimal number of slices, and therefore optimal visual
image review, and a second set with thin slices and
maximal overlap, for use in 2D and 3D reconstruction. This second set minimizes certain reconstruction artifacts, such as the “zipper” effect.
By reconstructing the reformatted images into a
composite view, with both thicker axial slices and optimally reconstructed images – including MIP, multiplanar volume reformat (MPR), curved reformat,
shaded surface display (SSD), or VR – it is possible to
EBSCO Publishing : eBook Collection (EBSCOhost) - printed on 9/14/2012 10:19 AM via VANDERBILT UNIV
9783540308102 ; González, R. G..; Acute Ischemic Stroke : Imaging and Intervention
Account: s4136838
Copyright © 2006. Springer. All rights reserved. May not be reproduced in any form without permission from the publisher, except fair uses permitted under U.S. or
applicable copyright law.
Stroke CT Angiography (CTA)
evaluate the vessel in its entirety. This becomes
important for lesions at branch points, such as
aneurysms. While occlusions of large vessels may be
obvious from sequential axial images, cutoff of a
tortuous vessel, such as a distal M2 segment of the
MCA, may not be entirely clear without a detailed
and lengthy review of the source images.
Review of reconstructed 2D and 3D images assists
review of the 2D axial source images by providing a
composite image of the vessels. Once this review is
complete, referral to the axial source images can be
made for further evaluation, such as the degree
of stenosis. Confirming the presence of a small
aneurysm or venous sinus thrombosis may be better
accomplished on the thin axial source images as well.
Finally, vascular dissection can be directly visualized
on the axial source images.
Both 2D and 3D reconstructions are time intensive. At our institution, there are dedicated 3D technologists who use stand-alone workstations to output the reconstructed images. Of note, however, many
scanners have easy-to-use reconstruction software
that can be applied directly at the CT console by the
technologist, with only minimal interruption of patient throughput. Specifically, our technologists routinely reconstruct axial, coronal, and sagittal MIP
views through the brain on all or our head CTAs.
These are done using 3-cm-thick slabs with 0.5 cm of
overlap, take only approximately 30 s per imaging
plane to reconstruct, and contribute greatly to a quick
overview of the anterior cerebral artery (ACA, sagittal
plane), MCA (axial and coronal plane), posterior cerebral artery (PCA, axial plane), and vertebral-basilar
(coronal plane) anatomy, as shown in Figs. 4.1 and
4.2.
One potential pitfall of all of these rendering techniques is the obscuration of internal blood vessel lumens by immediately adjacent calcified structures.
This is most problematic for the characterization of
cavernous sinus aneurysms, and for the measurement of residual lumen diameters in the presence of
heavy circumferential calcifications, especially in cases of severe carotid bifurcation occlusive disease [28,
71].A pitfall unique to SSD, which makes it unsuitable
for CT venographic reconstructions, is its elimination of image pixels by thresholding. This feature
Chapter 4
makes it possible to falsely create the appearance of a
vascular stenosis if bone adjacent to a vessel is overthresholded. In what follows, the various reconstruction methods are discussed in more detail:
4.3.3.2 Maximum Intensity Projection
As with MRA, a projected 2D image can be constructed by displaying only pixels with the maximum, or highest, CT attenuation along a given ray.
One of the earliest descriptions of creating MIP images for CTA was by Napel [72]. As noted above, MIP
images can be quickly and easily reconstructed at the
scanner console, and are thereby readily available
and convenient for review. These images can be constructed with a user-defined thickness. Furthermore,
they are less sensitive than axial source images and
SSD images to varying window and level settings. At
Stanford, they have suggested that MIP is superior to
SSD for renal artery stenosis evaluation [73]. Other
Figure 4.12
MIP image of normal carotid bifurcation; atherosclerosis may obscure the underlying enhancing lumen. (BIF
Bifurcation, RCCA right common carotid artery)
EBSCO Publishing : eBook Collection (EBSCOhost) - printed on 9/14/2012 10:19 AM via VANDERBILT UNIV
9783540308102 ; González, R. G..; Acute Ischemic Stroke : Imaging and Intervention
Account: s4136838
71
Copyright © 2006. Springer. All rights reserved. May not be reproduced in any form without permission from the publisher, except fair uses permitted under U.S. or
applicable copyright law.
72
Chapter 4
S. Sheikh · R.G. González · M.H. Lev
a
Figure 4.13
a Coronal and sagittal MIP images demonstrate an apparent
aneurysm of the callosomarginal artery (arrows). b Axial contrast-enhanced source image
confirms the presence of a density in the location shown on the
MIP images (arrow). c Comparison with noncontrast image at
the same location demonstrates
calcification of the falx, there is
no aneurysm (arrow)
b
c
groups have suggested similar results for carotid artery stenosis.
As this technique relies on detecting the highest
pixel on a given ray, it is sensitive to overlap from adjacent bony and opacified venous structures, as
shown in Figs. 4.12 and 4.13. Currently attempts are
being made to subtract the underlying bony structures, but to date these have been limited by multiple
technical factors, not least of which is subtle patient
motion resulting in inaccurate representation of the
composite image.
4.3.3.3 Multiplanar Volume Reformat
Instead of taking the highest attenuation in a pixel
along a given ray, an MPR image is formed by the
mean CT attenuation. It not routinely used by our
group for image review, as the vascular images are
more commonly confounded by overlap from adjacent bone or opacified venous structures. The slab
can be reconstructed at an arbitrary slab thickness, as
in an MIP; here the vertebrobasilar system is shown
in Fig. 4.14. Unlike SSD and VR techniques, 2D MPR
reconstructions do not obscure partially occlusive
thrombus.
EBSCO Publishing : eBook Collection (EBSCOhost) - printed on 9/14/2012 10:19 AM via VANDERBILT UNIV
9783540308102 ; González, R. G..; Acute Ischemic Stroke : Imaging and Intervention
Account: s4136838
Copyright © 2006. Springer. All rights reserved. May not be reproduced in any form without permission from the publisher, except fair uses permitted under U.S. or
applicable copyright law.
Stroke CT Angiography (CTA)
Chapter 4
also subject to interpretative error, analogous to that
of a conventional angiogram; hence, two orthogonal
views are required to accurately screen for vascular
stenosis (which may be elliptical, rather than spherical in nature), as shown in Fig. 4.15. CR is especially
useful for quickly screening for dissection, of both
the cervical internal carotid artery and the vertebral
artery at the skull base, provided these reconstructions are included with the reconstructed image set,
demonstrated in Fig. 4.16.
4.3.3.5 Shaded Surface Display
Figure 4.14
MPR image of vertebrobasilar system
This is a thresholding technique to display all pixels
with attenuation values greater than a user-specified
Hounsfield threshold. Bone, opacified vessels, and
calcification will be captured with a threshold of
80–100 HU; however, most parenchymal structures
will be excluded [74]. SSD is not as useful in acute
stroke evaluation, as only pixels on the surface are
displayed. This limits evaluation for partially occlusive thrombus. It has been most successfully used for
surgical planning, such as for paraclinoid aneurysms.
4.3.3.6 Volume Rendering
4.3.3.4 Curved Reformat
To quickly delineate and review the entire course of a
long, tortuous vessel, such as the carotid or vertebral
arteries, a curved reformatted image is helpful. Here,
the vessel is traced along its course, with the user
selecting the pixels to display on consecutive axial
images. The resultant reconstructed image is displayed in a 2D format. The process of creating curved
reformatted (CR) images is the most time intensive of
any of the rendering techniques discussed here. It is
With VR, unlike with SSD, nonsurface pixels are included in the dataset [75]. This is advantageous, in
that, using thresholding, layers of the vessel can be
“peeled” away or made transparent, so as to demonstrate underlying structures, as shown in Fig. 4.17. To
date, however, there have been no convincing studies
demonstrating the efficacy of VR in evaluation for
acute stroke. This is likely due to the intensive user interaction required to set user-defined parameters of
opacity, window, and level to create diagnostically
appropriate VR projections.
EBSCO Publishing : eBook Collection (EBSCOhost) - printed on 9/14/2012 10:19 AM via VANDERBILT UNIV
9783540308102 ; González, R. G..; Acute Ischemic Stroke : Imaging and Intervention
Account: s4136838
73
Copyright © 2006. Springer. All rights reserved. May not be reproduced in any form without permission from the publisher, except fair uses permitted under U.S. or
applicable copyright law.
74
Chapter 4
S. Sheikh · R.G. González · M.H. Lev
Figure 4.15
Occlusion of left internal carotid artery (LICA). Early and delayed axial images
confirm the occlusion. Curved reformatted images of the LICA display the occlusion. Included are AP and lateral CR images of a normal LICA for comparison
EBSCO Publishing : eBook Collection (EBSCOhost) - printed on 9/14/2012 10:19 AM via VANDERBILT UNIV
9783540308102 ; González, R. G..; Acute Ischemic Stroke : Imaging and Intervention
Account: s4136838
Copyright © 2006. Springer. All rights reserved. May not be reproduced in any form without permission from the publisher, except fair uses permitted under U.S. or
applicable copyright law.
Stroke CT Angiography (CTA)
Chapter 4
Figure 4.16
Left vertebral artery (LVA) dissection on both axial
images and as shown on a curved reformatted image
EBSCO Publishing : eBook Collection (EBSCOhost) - printed on 9/14/2012 10:19 AM via VANDERBILT UNIV
9783540308102 ; González, R. G..; Acute Ischemic Stroke : Imaging and Intervention
Account: s4136838
75
Copyright © 2006. Springer. All rights reserved. May not be reproduced in any form without permission from the publisher, except fair uses permitted under U.S. or
applicable copyright law.
76
Chapter 4
S. Sheikh · R.G. González · M.H. Lev
a
Figure 4.17
a Axial noncontrast and CTA
source images with a subarachnoid hemorrhage (SAH) and the
suggestion of an underlying top
of carotid aneurysm. b Curved reformat, axial MIP, and volume rendered image confirm aneurysm
at the top of the right carotid
artery
b
EBSCO Publishing : eBook Collection (EBSCOhost) - printed on 9/14/2012 10:19 AM via VANDERBILT UNIV
9783540308102 ; González, R. G..; Acute Ischemic Stroke : Imaging and Intervention
Account: s4136838
Copyright © 2006. Springer. All rights reserved. May not be reproduced in any form without permission from the publisher, except fair uses permitted under U.S. or
applicable copyright law.
Stroke CT Angiography (CTA)
Chapter 4
4.4 CTA Protocol for Acute Stroke
Multislice scanners allow flexibility in designing a
rapid, efficient CTA protocol for acute stroke. The
intracranial and extracranial vasculature can be imaged in less than 60 s. Even with the rapid scanning
protocols designed for acute stroke, it remains necessary to tailor the acquisition, so that the images provide optimal visualization not only of an occlusive
circle-of-Willis thrombus, but also of the possible
origin or source of this thrombus. Because detection
of an acute intracranial embolus is our first priority,
the initial phase of our protocol is focused at the circle of Willis. By acquiring the intracranial CTA source
images (also known as: “whole brain perfused blood
volume images” – see Chapter 5) first, we simultaneously acquire the best possible CTA images of the circle of Willis. These images have the least venous contamination, as well as the most uniform arterial
opacification, which is especially critical in the region
of the cavernous sinus, Fig. 4.18.
Subsequently, CTA acquisition of the neck is performed, to evaluate for carotid stenosis as a possible
source of emboli. In this “neck” phase of our protocol,
it is not detrimental if venous opacification is present. Importantly, however, delayed scanning through
the arch typically permits contrast that has pooled in
the subclavian or brachiocephalic veins to be cleared
prior to imaging, decreasing the resultant streak artifact from highly concentrated contrast in these vessels; subsequently, the origin of the great vessels can
be more clearly evaluated. Figure 4.19 shows how
streak at the origin by early scanning can result in
misinterpretation.
After acquiring the CTA of the neck, single slab
quantitative cine CT perfusion can additionally be
performed, depending on the clinical need for these
data in acute stroke triage. This is discussed at length
in Chapter 5, along with specific scanning parameters. A sample stroke CTA protocol, optimized for the
GE 16-slice scanner, is, however, provided for reference in Table 4.5. Using the aforementioned techniques for contrast reduction, including saline bolus
chaser and bolus shaping, it is increasingly possible
to obtain maximal uniform arterial enhancement –
Figure 4.18
Occlusion at the top of the carotid,as best seen on coronal and axial MIP images
and hence diagnostic CTA images – without compromising the contrast dosage required for the addition
of CT cine perfusion.
EBSCO Publishing : eBook Collection (EBSCOhost) - printed on 9/14/2012 10:19 AM via VANDERBILT UNIV
9783540308102 ; González, R. G..; Acute Ischemic Stroke : Imaging and Intervention
Account: s4136838
77
Copyright © 2006. Springer. All rights reserved. May not be reproduced in any form without permission from the publisher, except fair uses permitted under U.S. or
applicable copyright law.
78
Chapter 4
S. Sheikh · R.G. González · M.H. Lev
Figure 4.19
Dense contrast results in streak artifact in the right innominate vein and accounts for apparent nonopacification of the right
common carotid artery (RCCA). On an axial image superior to the apparent obstruction, there is uniform enhancement
EBSCO Publishing : eBook Collection (EBSCOhost) - printed on 9/14/2012 10:19 AM via VANDERBILT UNIV
9783540308102 ; González, R. G..; Acute Ischemic Stroke : Imaging and Intervention
Account: s4136838
Copyright © 2006. Springer. All rights reserved. May not be reproduced in any form without permission from the publisher, except fair uses permitted under U.S. or
applicable copyright law.
Stroke CT Angiography (CTA)
Chapter 4
79
Table 4.5. Sample acute CTA/CTP protocol for GE 16-slice scanner. (CTA CT angiography, CTP CT perfusion, FOV field of view,
ICA internal carotid artery, NCCT noncontrast CT)
Contrast
Range
Slice
Image
thickness spacing
(mm)
(mm)
Table
Pitch
feed
(mm/s)
Tube
Tube
RotaScan
voltage current tion
FOV
(kV)
(mA)
time (s)
Display
FOV
NCCT
None
C1 to
vertex
2.5
2.5
5.62
0.562
140
220
0.5
Head
22
CTA Head
4 ml/s
for 40 ml,
25 s delay
C1 to
vertex
2.5
2.5
5.62
0.562
140
200
0.5
Head
22
CTA Neck
0.8 ml/s
for 30 ml
Arch to
C1
2.5
2.5
5.62
0.562
140
250
0.5
Large
22
Cine CTP
7 ml/s
for 40 ml,
5 s delay
Top of
ICA
5
None,
cine
None
N/A
80
200
1
Head
22
4.5 Accuracy and Clinical Utility
of CTA in Acute Stroke
4.5.1 Optimal Image Review
As noted above, review of both “thick” reformatted
axial source images and 2D/3D reconstructions is
required for appropriate stroke CTA interpretation.
Indeed, given the enormous number of thin slice
axial sections required for 3D reconstruction, a
systematic, practical approach to image review is
required.
Initially, the axial 5-mm-thick noncontrast CT images are reviewed, primarily to exclude hemorrhage –
an absolute contraindication to thrombolysis – but
also to assess for parenchymal hypodensity (a strong
relative contraindication to thrombolysis, if more
than one-third of a vascular territory is involved).
Care is taken to perform image review using narrow
“window width” and “center level” display settings, so
as to maximize the subtle difference between gray
matter and white matter attenuation – thereby maximizing the detection of subtle, edematous, hypodense ischemic regions, as discussed at length in
Chapter 3 [70].
Subsequently, the 2.5- to 3-mm-”thick” axial CTA
source images are reviewed, typically at the scanner
console. Large, proximal circle-of-Willis occlusions,
such as top-of-carotid T-lesions, are easily recognizable, even from the axial source images, and the
“stroke team” can be immediately activated. Simultaneously, at most modern scanner consoles, the CTA
dataset can be reformatted into “thin” (1.25 mm or
less) slices, and quickly reconstructed into axial,
coronal, and sagittal MIP images, facilitating more
sensitive detection of secondary and tertiary branch
occlusions. Even more detailed reconstructions, including curved reformats of the entire neurovascular
system, from arch to vertex, can be created offline on
a 3D workstation by a dedicated technologist.
4.5.2 Role of CTA in Acute Stroke
A major clinical role of CTA in acute stroke management remains the exclusion of unnecessary i.a.
thrombolytic therapy in patients presenting with
acute embolic stroke, but who do not have large vessel occlusions amenable to thrombolysis. Such occlusive stroke mimics include, but are not limited to,
small vessel strokes (e.g., lacunar infarcts), TIAs,
migraine headaches, seizures, and hypoglycemic
events. CTA offers a convenient solution to the problem of efficiently diagnosing primary, secondary, and
– increasingly – tertiary branch levels of intracranial
vascular occlusion, prior to the initiation of thrombolytic therapy.
EBSCO Publishing : eBook Collection (EBSCOhost) - printed on 9/14/2012 10:19 AM via VANDERBILT UNIV
9783540308102 ; González, R. G..; Acute Ischemic Stroke : Imaging and Intervention
Account: s4136838
Copyright © 2006. Springer. All rights reserved. May not be reproduced in any form without permission from the publisher, except fair uses permitted under U.S. or
applicable copyright law.
80
Chapter 4
S. Sheikh · R.G. González · M.H. Lev
b
a
b
a
Figure 4.20
Incidental aneurysm found during evaluation for acute stroke. The collapsed MIP image shows cutoff of the left MCA
stem (arrow, a) and right MCA aneurysm (arrow, b). Corresponding shaded surface display
When considering the possible need for thrombolysis, assessment of Circle-of-Willis anatomy, as well
as of collateral flow distal to an occlusion, was
demonstrated on CTA as early as in 1998 [25]. Indeed,
Kucinski et al. [80] recently showed that collateral
circulation is an independent predictor for outcome
in acute ischemic stroke.Associated lesions in the setting of an acute intracranial vessel occlusion, such as
aneurysms, which would preclude thrombolytic
therapy, although rare, can also be demonstrated by
CTA [21], as shown in Figs. 4.20 and 4.21.
CTA has been shown to be highly accurate in delineating the presence and extent of intracranial
thrombus, Fig. 4.22. In a study of 44 consecutive intra-arterial thrombolysis candidates who underwent
both CTA and the “gold standard” of catheter arteriography, CTA demonstrated a sensitivity and specificity of 98.4% and 98.1%, respectively, for the detection of proximal large vessel thrombus [76].
The degree and level of occlusion have been shown
to be important factors in planning acute stroke therapy. In early studies, intravenous rt-PA for clot lysis
was more likely to be effective in secondary and tertiary MCA branch occlusions than in larger, more
proximal occlusions [6, 81]. In another study using
CTA, there was little benefit from intravenous rt-PA
when there was poor collateralization, autolyzed
thrombi, or proximal “top of carotid” saddle emboli
[82]. In still other studies,“top of ICA” carotid terminus occlusion was demonstrated to be a better
predictor of fatal outcome than an admission unenhanced CT showing greater than one-third MCA
territory hypodensity [83, 84].
Moreover, the source images from the CTA dataset,
assuming an approximate steady-state level of contrast enhancement during scan acquisition, are intrinsically blood volume weighted. Like DWI, these
images can be used to determine tissue with a high
likelihood of infarction in the absence of early, complete recanalization [77]. This topic is discussed more
fully in Chapter 5.
Unlike unenhanced (or perhaps even enhanced)
MRA, CTA is an anatomic imaging technique, and
is therefore not highly likely to yield false-positive
results for occlusion due to slow flow or artifact.
Carotid sonography is also known to be inaccurate in
distinguishing a true carotid occlusion from a hairline lumen. Indeed, accuracy for distinguishing hairline residual lumen from total occlusion of the internal carotid artery using single-slice helical CTA was
found to be excellent, compared to a gold standard of
catheter arteriography [78]. Accuracy rates were 95%
EBSCO Publishing : eBook Collection (EBSCOhost) - printed on 9/14/2012 10:19 AM via VANDERBILT UNIV
9783540308102 ; González, R. G..; Acute Ischemic Stroke : Imaging and Intervention
Account: s4136838
Copyright © 2006. Springer. All rights reserved. May not be reproduced in any form without permission from the publisher, except fair uses permitted under U.S. or
applicable copyright law.
Stroke CT Angiography (CTA)
Chapter 4
Figure 4.21
Acute stroke in a patient with endocarditis.The unenhanced and corresponding diffusion-weighted image (DWI) demonstrates acute infarct in the left parietal/temporal lobe. Evaluation with CTA MIP images clearly demonstrates a bilobed
aneurysm (arrow), which is confirmed on the catheter cerebral angiogram
and 80% for two independent raters, with no statistically significant difference in accuracy between the
two readers.
CTA has also been used to perform serial monitoring of patients with proven internal carotid artery
occlusions. Surprisingly, spontaneous recanalization
of an occluded internal carotid artery has been
demonstrated [79]. In such cases, serial catheter angiography would have been prohibitive in terms of
time, cost, and risk of complications.
Neck CTA can often elucidate the etiology of an intracranial occlusion. In older patients, carotid plaque
can be accurately assessed by CTA. In a study of 82
patients, CTA was shown to be comparable to, and at
times more accurate than, carotid sonography in determining the degree of stenosis [89]. Agreement in
determination of vessel abnormality, plaque morphology, and ulceration between the two methodologies was reported to be 82%, 89%, and 96%,
respectively. Moreover, 11 tandem lesions reported by
EBSCO Publishing : eBook Collection (EBSCOhost) - printed on 9/14/2012 10:19 AM via VANDERBILT UNIV
9783540308102 ; González, R. G..; Acute Ischemic Stroke : Imaging and Intervention
Account: s4136838
81
Copyright © 2006. Springer. All rights reserved. May not be reproduced in any form without permission from the publisher, except fair uses permitted under U.S. or
applicable copyright law.
82
Chapter 4
S. Sheikh · R.G. González · M.H. Lev
Figure 4.22
CT angiography (CTA) maximum intensity projection (MIPs) images with four different orientations demonstrate occlusion of the M1 segment of the right middle cerebral artery
CTA were not detected by sonography. When compared to a surgical gold standard, using North American Symptomatic Carotid Endarterectomy Trial
(NASCET) criteria, degree of stenosis was correctly
shown on CTA 89% of the time, as opposed to 83%
with sonography. CTA did not overestimate stenosis.
CTA was superior to sonography in detecting plaque
ulcerations and vessel abnormalities.
In younger patients, dissection of the carotid
and/or vertebral arteries must be included in the differential diagnosis of acute stroke [85–87]. In 1999,
Oelerich [88] reported satisfactory results with MRA
EBSCO Publishing : eBook Collection (EBSCOhost) - printed on 9/14/2012 10:19 AM via VANDERBILT UNIV
9783540308102 ; González, R. G..; Acute Ischemic Stroke : Imaging and Intervention
Account: s4136838
Copyright © 2006. Springer. All rights reserved. May not be reproduced in any form without permission from the publisher, except fair uses permitted under U.S. or
applicable copyright law.
Stroke CT Angiography (CTA)
in demonstrating craniocervical artery dissection.
Although MR can demonstrate intramural hematoma, this is typically time-dependent, and, as noted
previously, CTA is less prone to error from slow flow
or other artifacts, and can provide a true anatomical
image of the intravascular lumen. CTA can also provide information regarding the false lumen, flap, and
extra-luminal structures – information not necessarily provided even by catheter arteriography.
4.6 Future Directions
As MDCT scanner technology advances, both acquisition speed and extent of z-direction coverage continue to improve. These advances should make possible the use of lower total contrast volumes and more
rapid scanning, without loss of image quality or significantly increased radiation dose.
Increased coverage will not only be of benefit for
cine CT perfusion studies, which are limited to the
detector size of the given MDCT scanner (see Chapter 5), but it may also facilitate more complete neurovascular coverage than is currently obtainable,
namely from the aortic arch to the vertex. Specifically, it may be possible to extend the neck portion of the
CTA acquisition inferiorly to include the left atrium
and left ventricle, so as to assess for endoluminal
thrombus in stroke patients who present with atrial
fibrillation as a possible embolic source. If successful,
this technique has the potential to obviate the need
for more invasive trans-esophageal echocardiography (TEE), which carries the rare but life-threatening
risk of esophageal rupture [90]. CTA could therefore
prove to be of greater value than TEE in acute stroke
patients with atrial fibrillation [91].
Additionally, faster gantry rotation speeds may
make possible “cine CTA fluoroscopy,” with which
difficult-to-detect lesions, such as cavernous sinus
aneurysms or arterial venous malformations, could
be visualized with greater temporal resolution during
arterial, capillary, and venous phases of contrast enhancement. Dedicated studies could display a temporally parsed image, which would mirror the temporal
resolution of the standard cerebral catheter arteriography.
Chapter 4
4.7 Conclusion
CTA is a highly accurate tool for defining the level of
intracranial vascular occlusion in patients presenting
within 6 h of embolic stroke onset. CTA data will likely prove valuable in the rapid triage of such patients
to appropriate therapy, including i.v. and i.a. thrombolytic treatment. For the evaluation of acute stroke
patients, CTA is fast, simple, accurate, and convenient. Clinically relevant information regarding both
vascular patency and parenchymal perfusion can be
obtained during the first pass of a single contrast
bolus in CTA.
Compared with single detector row CTA, there are
fewer restrictions on designing a scanning protocol
with the newer multislice CT scanners, especially
those employing 16 channels or more – facilitating
increased longitudinal coverage within a shorter
scanning time. Complete imaging of the arterial tree
– from arch to vertex – to evaluate for both acute occlusions and chronic stenoses – can be accomplished
during peak arterial opacification. Contrast dose can
be minimized with the use of a saline bolus and multiphasic injection. CTA not only compares favorably
with catheter angiography for detection of acute
large vessel occlusion, but can also provide information regarding collateral flow and lesion extent. By
including neck CTA for acute stroke evaluation,
embolic source and plaque burden at the origins of
the internal carotid arteries can additionally be determined. Other stroke etiologies, such as dissection,
can also be displayed. Finally, CTA of the neck affords
an opportunity to plan catheter angiography, decreasing the time and contrast load required for i.a.
thrombolysis, should it be required.
References
1. Adams HP, Brott TG, Ferlan AJ et al (1996) Guidelines for
thrombolytic therapy for acute stroke: a supplement to the
guidelines for the management of patients with acute
ischemic stroke. Circulation 94:1167–1174
2. Alberts MJ (1998) tPA in acute ischemic stroke – United
States experience and issues for the future. Neurology
51:S53–S55
EBSCO Publishing : eBook Collection (EBSCOhost) - printed on 9/14/2012 10:19 AM via VANDERBILT UNIV
9783540308102 ; González, R. G..; Acute Ischemic Stroke : Imaging and Intervention
Account: s4136838
83
Copyright © 2006. Springer. All rights reserved. May not be reproduced in any form without permission from the publisher, except fair uses permitted under U.S. or
applicable copyright law.
84
Chapter 4
3. Barr JD, Mathis JM, Wildenhain SL, Wechsler L, Jungreis
CA, Horton JA (1994) Acute stroke intervention with intraarterial urokinase infusion. J Vasc Intervent Radiol
5:705–713
4. Caplan L, Mohr JP, Kistler P et al (1997) Should thrombolytic therapy be the first-line treatment for acute
ischemic stroke? N Engl J Med 337:1309–1310
5. Chiu D, Krieger D, Villar-Cordova C et al (1998) Intravenous tissue plasminogen activator for acute ischemic
stroke: feasibility, safety, and efficacy in the first year of
clinical practice. Stroke 29:18–22
6. Del Zoppo GJ, Poeck K et al (1992) Recombinant tissue
plasminogen activator in acute thrombotic stroke. Ann
Neurol 32:78–86
7. Del Zoppo GJ, Pessin MS, Mori E, Hacke W (1991) Thrombolytic intervention in acute thrombotic and embolic
stroke. Semin Neurol 11:368–384
8. Del Zoppo GJ (1995) Acute stroke – on the threshold of a
therapy. N Engl J Med 333:1632–1633
9. Del Zoppo GJ, Higashida RT, Furlan AJ, Pessin MS, Rowley
HA, Gent M (1998) PROACT: a phase II randomized trial of
recombinant pro-urokinase by direct arterial delivery in
acute middle cerebral artery stroke. PROACT Investigators.
Prolyse in acute cerebral thromboembolism. Stroke 29:
4–11
10. Hacke W, Zeumer H, Ferbert A et al (1988) Intra-arterial
thrombolytic therapy improves outcome in patients with
acute vertebrobasilar occlusive disease. Stroke 19:1216–212
11. Hacke W, Kaste M, Fieschi C et al (1995) Intravenous
thrombolysis with recombinant tissue plasminogen activator for acute hemispheric stroke: the European Cooperative Acute Stroke Study (ECASS). J Am Med Assoc
274:1017–1025
12. National Institute of Neurological Disorders for Stroke
rt-PA Stroke Study (1995) Tissue plasminogen activator for
acute ischemic stroke. N Engl J Med 333:1581–1587
13. NINDS Stroke Study Group (1997) Effect of rt-PA on
ischemic lesion size by computed tomography. Preliminary
results from the NINDS rt-PA Stroke Trial. Stroke 28:
2109–2118
14. Sussman BJ, Fitch TS (1958) Thrombolysis with fibrinolysis in cerebral arterial occlusion. J Am Med Assoc 167:
1705–1709
15. Hacke W, Albers G, Al-Rawi Y et al (2005) The DIAS Study
Group. The Desmoteplase in Acute Ischemic Stroke Trial
(DIAS) a phase II MRI-based 9-hour window acute stroke
thrombolysis trial with intravenous desmoteplase. Stroke
36:66–73
16. Von Kummer R, Allen KL, Holle R et al (1997) Acute stroke:
usefulness of early CT findings before thromobolytic therapy. Radiology 205:327–333
17. Lev MH, Nichols SJ (2000) Computed tomographic angiopgraphy and computed tomographic perfusion imaging of hyperacute stroke. Top Magn Reson Imaging 11:
273–287
S. Sheikh · R.G. González · M.H. Lev
18. Lev MH, Farkas J, Rodriguez VR et al (2001) CT angiography in the rapid triage of patients with hyperacute stroke to
intraarterial thrombolysis: accuracy in the detection of
large vessel thrombus. J Comput Assist Tomogr 25:520–528
19. Esteban JM, Cervera V (2004) Perfusion CT and angio CT
in the assessment of acute stroke. Neuroradiology 46:705–
715
20. Garg N, Eshkar N, Tanenbaum L et al (2004) Computed
tomography angiographic correlates of early computed
tomography signs in acute ischemic stroke. J Neuroimag
14:242–245
21. Chuang YM, Chao AC, Teng MM et al (2003) Use of CT angiography in patient selection for thrombolytic therapy.
Am J Emerg Med 21:167–172
22. Cullen SP, Symons SP, Hunter G et al (2002) Dynamic contrast-enhanced computed tomography of acute ischemic
stroke: CTA and CTP. Semin Roentgenol 37:192–205
23. Smith WS, Roberts HC, Chuang NA et al (2003) Safety and
feasibility of a CT protocol for acute stroke: combined CT,
CT angiography, and CT perfusion imaging in 53 consecutive patients. Am J Neuroradiol 24:688–690
24. Verro P, Tanenbaum LN, Borden NM, Sen S, Eshkar N
(2002) CT angiography in acute ischemic stroke: preliminary results. Stroke 33:276–278
25. Hunter GJ, Hamberg LM, Ponzo JA et al (1998) Assessment
of cerebral perfusion and arterial anatomy in hyperacute
stroke with three-dimensional functional CT: early clinical
results. Am J Neuroradiol 19:29–37
26. Schwartz RB (1995) Helical (spiral) CT in neuroradiologic
diagnosis (review; 8 refs). Radiol Clin North Am 33:981–
995
27. Lev MH, Ackerman RH, Lustrin ES et al (1995) Two dimensional spiral CT angiography in carotid occlusive disease:
measurement of residual lumen diameter with ultrasound
correlation. Proceedings of the 33rd Annual Meeting of the
American Society of Neuroradiology, Chicago, Ill.
28. Lev MH,Ackerman RH, Lustrin ES, Brown JH (1995) A procedure for accurate spiral CT angiographic measurement
of lumenal diameter. Proceedings of the 81st Scientific
Assembly and Annual Meeting of the Radiological Society
of North America, Chicago, Ill.
29. Silverman PM, Kalendar WA, Hazle JD (2001) Common
terminology for single and multislice helical CT. Am J
Radiol 176:1135–1136
30. Fox SH, Tanenbaum LN, Ackelsberg S (1998) Future directions in CT technology. Neuroimag Clin North Am 8:497–
513
31. Kallmes DF, Evans AJ, Woodcock RJ et al (1996) Optimization of parameters for the detection of cerebral aneurysms:
CT angiography of a model. Radiology 200:403–405
32. Napoli A, Fleischmann D, Chan FP et al (2004) Computed
tomography angiography: state-of-the-art imaging using
multidetector-row technology. J Comput Assist Tomogr
28:S32–S45
EBSCO Publishing : eBook Collection (EBSCOhost) - printed on 9/14/2012 10:19 AM via VANDERBILT UNIV
9783540308102 ; González, R. G..; Acute Ischemic Stroke : Imaging and Intervention
Account: s4136838
Copyright © 2006. Springer. All rights reserved. May not be reproduced in any form without permission from the publisher, except fair uses permitted under U.S. or
applicable copyright law.
Stroke CT Angiography (CTA)
33. Rydberg J, Bukwalter KA, Caldemeyer KS et al (2000) Multisection CT: scanning techniques and clinical applications. Radiographics 20:1787–1806
34. NRC Committee on the Biological Effects of Ionizing Radiation BV (1990) In: Health effects of exposure to low levels
of ionizing radiation. National Academy Press, Washington
DC
35. Wall BF, Hart D (1997) Revised radiation doses for typical
X-ray examinations. Report on a recent review of doses to
patients from medical X-ray examinations in the UK by
NRPB. National Radiological Protection Board. Br J Radiol
70:437–439
36. McCollough CH, Schueler BA (2000) Calculation of effective dose. Med Phys 27:828–837
37. Jucius RA, Kambic GX (1980) Measurements of computed
tomography x-ray fields utilizing the partial volume effect.
Med Phys 7:379–382
38. Kalendar WA, Wolf H, Suess C (1999) Dose reduction in CT
by anatomically adapted tube current modulation. II.
Phantom measurements. Med Phys 26:2248–2253
39. Kalendar WA, Prokop M (2001) 3D CT angiography. Crit
Rev Diagn Imaging 42:1–28
40. Nickoloff EL, Alderson PO (2001) Radiation exposures to
patients from CT: reality, public perception, and policy. Am
J Roentgenol 177:285–287
41. Ertl-Wagner BB, Hoffmann RT, Bruning R (2004) Multidetector row CT angiography of the brain at various kilovoltage settings. Radiology 231:528–535
42. Kalra MK, Maher MM, Saini S (2004) Radiation exposure
and projected risks with multidetector-row computed tomography scanning: clinical strategies and technologic developments for dose reduction. J Comput Assist Tomogr
28:S46–S49
43. Kendall BE, Pullicino P (1980) Intravascular contrast injection in ischaemic lesions. II. Effect on prognosis. Neuroradiology 19(5):241–243
44. Doerfler A et al (1998) Are iodinated contrast agents detrimental in acute cerebral ischemia? An experimental study
in rats. Radiology 206(1):211–217
45. Han JK et al (2000) Factors influencing vascular and hepatic enhancement at CT: experimental study on injection
protocol using a canine model. J Comput Assist Tomogr
24(3):400–406
46. Bluemke DA, Fishman EK, Anderson JH (1995) Effect of
contrast concentration on abdominal enhancement in the
rabbit: spiral computed tomography evaluation. Acad
Radiol 2(3):226–231
47. Morcos SK, Thomsen HS, Webb JA (1999) Contrast-mediainduced nephrotoxicity: a consensus report. Contrast
Media Safety Committee, European Society of Urogenital
Radiology (ESUR). Eur Radiol 9(8):1602–1613
48. Morcos SK (1998) Contrast media-induced nephrotoxicity–questions and answers. Br J Radiol 71(844):357–365
Chapter 4
49. Aspelin P et al (2003) Nephrotoxic effects in high-risk
patients undergoing angiography. N Engl J Med 348(6):
491–499
50. Pugh ND (1996) Haemodynamic and rheological effects of
contrast media: the role of viscosity and osmolality. Eur
Radiol 6 [Suppl 2]:S13–S15
51. Henson JW et al (2004) Gadolinium-enhanced CT angiography of the circle of Willis and neck. Am J Neuroradiol
25(6):969–972
52. Schoellnast H et al (2003) Abdominal multidetector row
computed tomography: reduction of cost and contrast material dose using saline flush. J Comput Assist Tomogr
27(6):847
53. Schoellnast H et al (2004) Aortoiliac enhancement during
computed tomography angiography with reduced contrast
material dose and saline solution flush: influence on magnitude and uniformity of the contrast column. Invest
Radiol 39(1):20–26
54. Bader TR, Prokesch RW, Grabenwoger F (2000) Timing of
the hepatic arterial phase during contrast-enhanced computed tomography of the liver: assessment of normal values in 25 volunteers. Invest Radiol 35(8):486–492
55. Cademartiri F et al (2002) Parameters affecting bolus
geometry in CTA: a review. J Comput Assist Tomogr 26(4):
598–607
56. Hopper KD et al (1997) Thoracic spiral CT: delivery of contrast material pushed with injectable saline solution in a
power injector. Radiology 205(1):269–271
57. Haage P et al (2000) Reduction of contrast material dose
and artifacts by a saline flush using a double power injector in helical CT of the thorax. Am J Roentgenol 174(4):
1049
58. Kopka L et al (1995) Parenchymal liver enhancement with
bolus-triggered helical CT: preliminary clinical results.
Radiology 195(1):282–284
59. Paulson EK et al (1998) Helical liver CT with computer-assisted bolus-tracking technology: is it possible to predict
which patients will not achieve a threshold of enhancement? Radiology 209(3):787–792
60. Shimizu T et al (2000) Helical CT of the liver with computer-assisted bolus-tracking technology: scan delay of arterial phase scanning and effect of flow rates. J Comput Assist
Tomogr 24(2):219–223
61. Puskas Z, Schuierer G (1996) Determination of blood circulation time for optimizing contrast medium administration in CT angiography. Radiologe 36(9):750–757
62. Bae KT, Heiken JP, Brink JA (1998) Aortic and hepatic contrast medium enhancement at CT, part II. Effect of reduced
cardiac output in a porcine model. Radiology 207(3):
657–662
63. Rubin GD et al (1998) Measurement of the aorta and its
branches with helical CT. Radiology 206(3):823–829
EBSCO Publishing : eBook Collection (EBSCOhost) - printed on 9/14/2012 10:19 AM via VANDERBILT UNIV
9783540308102 ; González, R. G..; Acute Ischemic Stroke : Imaging and Intervention
Account: s4136838
85
Copyright © 2006. Springer. All rights reserved. May not be reproduced in any form without permission from the publisher, except fair uses permitted under U.S. or
applicable copyright law.
86
Chapter 4
64. Rubin GD et al (1993) Three-dimensional spiral computed
tomographic angiography: an alternative imaging modality for the abdominal aorta and its branches. J Vasc Surg
18(4):656–664; discussion 665
65. Bae KT, Heiken JP, Brink JA (1998) Aortic and hepatic contrast medium enhancement at CT, part I. Prediction with a
computer model. Radiology 207(3):647–655
66. Bae KT, Tran HQ, Heiken JP (2000) Multiphasic injection
method for uniform prolonged vascular enhancement at
CT angiography: pharmacokinetic analysis and experimental porcine model. Radiology 216(3):872–880
67. Bae KT, Tran HQ, Heiken JP (2004) Uniform vascular contrast enhancement and reduced contrast medium volume
achieved by using exponentially decelerated contrast material injection method. Radiology 231(3):732–736
68. Fleischmann D, Hittmair K (1999) Mathematical analysis
of arterial enhancement and optimization of bolus geometry for CT angiography using the discrete Fourier transform. J Comput Assist Tomogr 23(3):474–484
69. Fleischmann D et al (2000) Improved uniformity of aortic
enhancement with customized contrast medium injection
protocols at CT angiography. Radiology 214(2):363–371
70. Lev MH, Farkas J, Gemmete JJ et al (1999) Acute stroke: improved nonenhanced CT detection – benefits of soft-copy
interpretation by using variable window width and center
level settings. Radiology 213:150–155
71. Dix JA, Evans AJ, Kallmes DF, Sobel A, Phillips CD (1997)
Accuracy and precision of CT angiography in a model of
the carotid artery bifurcation. Am J Neuroradiol 18:409–
415
72. Napel S et al (1992) CT angiography with spiral CT and
maximum intensity projection. Radiology 185(2):607–610
73. Rubin GD et al (1994) Spiral CT of renal artery stenosis:
comparison of three-dimensional rendering techniques.
Radiology 190(1):181–189
74. Vieco PT, Morin EE 3rd, Gross CE (1996) CT angiography
in the examination of patients with aneurysm clips. Am J
Neuroradiol 17(3):455–457
75. Kuszyk BS et al (1995) CT angiography with volume rendering: imaging findings. Am J Roentgenol 165(2):445–448
76. Lev MH et al (2001) CT angiography in the rapid triage of
patients with hyperacute stroke to intraarterial thrombolysis: accuracy in the detection of large vessel thrombus.
J Comput Assist Tomogr 25(4):520–528
77. Schramm P et al (2002) Comparison of CT and CT angiography source images with diffusion-weighted imaging in
patients with acute stroke within 6 hours after onset. Stroke
33(10):2426–2432
S. Sheikh · R.G. González · M.H. Lev
78. Lev MH et al (2003) Total occlusion versus hairline residual
lumen of the internal carotid arteries: accuracy of single
section helical CT angiography. Am J Neuroradiol 24(6):
1123–1129
79. Nguyen-Huynh MN, Lev MH, Rordorf G (2003) Spontaneous recanalization of internal carotid artery occlusion.
Stroke 34(4):1032–1034
80. Kucinski T et al (2003) Collateral circulation is an independent radiological predictor of outcome after thrombolysis in acute ischaemic stroke. Neuroradiology 45(1):11–18
81. Wolpert SM et al (1993) Neuroradiologic evaluation of
patients with acute stroke treated with recombinant tissue
plasminogen activator. The rt-PA Acute Stroke Study
Group. Am J Neuroradiol 14(1):3–13
82. Wildermuth S et al (1998) Role of CT angiography in patient selection for thrombolytic therapy in acute hemispheric stroke. Stroke 29(5):935–938
83. Kucinski T et al (1998) The predictive value of early CT and
angiography for fatal hemispheric swelling in acute stroke.
Am J Neuroradiol 19(5):839–846
84. Zivin JA (1998) Factors determining the therapeutic window for stroke. Neurology 50(3):599–603
85. Provenzale JM (1995) Dissection of the internal carotid
and vertebral arteries: imaging features. Am J Roentgenol
165(5):1099–1104
86. Adams HP Jr. et al (1995) Ischemic stroke in young adults.
Experience in 329 patients enrolled in the Iowa Registry of
stroke in young adults. Arch Neurol 52(5):491–495
87. Bogousslavsky J, Regli F (1987) Ischemic stroke in adults
younger than 30 years of age. Cause and prognosis. Arch
Neurol 44(5):479–482
88. Oelerich M et al (1999) Craniocervical artery dissection:
MR imaging and MR angiographic findings. Eur Radiol
9(7):1385–1391
89. Debernardi S et al (2004) CT angiography in the assessment of carotid atherosclerotic disease: results of more
than two years’ experience. Radiol Med (Torino) 108(1–2):
116–127
90. Shapira MY et al (1999) Esophageal perforation after
transesophageal echocardiogram. Echocardiography
16(2):151–154
91. Zaidat O et al (2002) The utility of ultrafast cardiac cycle
gated and contrasted spiral computerized axial chest tomography in evaluation of patients with acute stroke and
comparison with transesophageal echocardiography. Proceedings of the 27th International Stroke Conference.
American Stroke Association, San Antonio, Tex.
EBSCO Publishing : eBook Collection (EBSCOhost) - printed on 9/14/2012 10:19 AM via VANDERBILT UNIV
9783540308102 ; González, R. G..; Acute Ischemic Stroke : Imaging and Intervention
Account: s4136838


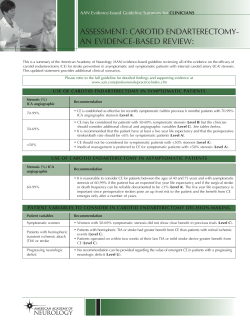


© Copyright 2026