
Developmental Trajectories of Substance Use and Mental Health
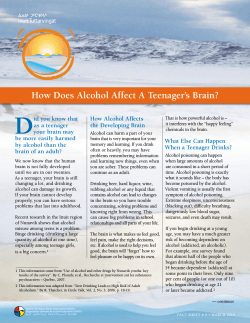
Developmental Trajectories of Substance Use and Mental Health from Adolescence to Adulthood Michael Windle, Ph.D. Emory University Department of Behavioral Sciences and Health Education April 8, 2015 Two Goals of Presentation Overview of some relatively recent developments in the field of alcohol studies. Provide a description and snapshots of a seven‐wave prospective study, funded by NIAAA, entitled Lives Across Time: A Longitudinal Study of Adolescent and Adult Development. Brief Historical Contrast 1970: Alcoholism a disease driven by physiological determinants. Based on treatment samples, alcoholism viewed as a disease typically among middle aged males. 2011: Alcoholism as multi‐determined, gene‐ environment disorder with influences ranging from genes to social‐historical factors. Also viewed as a disorder that develops across time and peaks in late adolescence/early young adulthood. Prevalence of Past-year DSM-IV Alcohol Dependence by Age in the United States, 2001-2002 14% One-Year Prevalence 12% 10% 8% Most people seek treatment at this age 6% 4% Prevalence of DSM-IV Alcohol Dependence in 2001-2002 was 3.8% 2% 0% 12-17 18-20 21-24 25-29 30-34 35-39 40-44 45-49 50-54 55-59 60-64 65-69 Age 18 + yrs. - NIAAA NESARC ( Grant, et al., (2004) Drug and Alcohol Dependence, 74:223-234) 12-17 yrs - U.S. Substance Abuse and Mental Health Services Administration 2003 National Survey on Drug Use and Health (NSDUH) Prevalence of Lifetime Alcohol Dependence by Age of First Use 2001-2002 1991-1992 60 Family History Positive 50 % Prevalence 60 50 Total 40 Family History Negative 40 30 30 20 20 10 10 0 0 <=13 14 15 16 17 18 19 Age at First Alcohol Use Source: Grant and Dawson. J Subst Abuse. 1998. 10(2):163-73. 20 >=21 <=13 14 15 16 17 18 19 20 Age at First Alcohol Use Source: 2001-2002 National Epidemiologic Survey on Alcohol and Related Conditions; Laboratory of Epidemiology and Biometry; DIBR, NIAAA, Bethesda, MD. >=21 Number of Days in Past 30 Drank 5 or More Drinks 4.5 4 Males Females 3.5 3 Days 2.5 2 1.5 1 0.5 0 12 13 14 15 16 17 18 19 20 21 22-23 24-25 26-29 30-34 35-49 50-64 65+ Age U.S. Substance Abuse and Mental Health Services Administration 2003 National Survey on Drug Use and Health (NSDUH) Youth Drink Less Frequently Than Adults, But Drink More Per Occasion 10 Drinks per Occasion Drinking Days per Month 8.91 8 6 4.79 4.87 4 2.67 2 0 Underage Adults (12-17) (26 and older) Source: SAMHSA National Survey on Drug Use and Health, 2002 Public Health Problems Related to Alcohol Use Higher levels of alcohol use associated with three most frequent forms of mortality among adolescents: • Accidental deaths (e.g., fatal auto or boating crashes) Nearly 9 out of 10 teenage auto accidents involve the use of alcohol • Homicides • Suicides Also associated with higher rate of : • STDs, including HIV infection • Teenage pregnancy • Poor school performance and school dropout Age of Onset of Psychiatric Disorders 13 – 20 Years Age 10 – 13 Years 5 – 10 Years Infancy to 5 Years Social Phobias Panic Disorder Bipolar Disorder Alcohol & Drug Use Disorders Eating Disorders Obsessive Compulsive Disorders Anti-social Behavior Conduct Disorder Depression Anxiety Attention Deficit Hyperactivity Disorder Autism Developed from Time Magazine , January 20, 2003, p.82 Brain Disorders Adolescent Structural and Functional Changes in the Brain Increased Efficiency Decrease in gray matter - dendritic pruning Increase in white matter - increased myelination Differential Maturation Across the Brain The limbic system governing emotions matures earlier than the frontal cortex, responsible for planning, self-control, and decision-making. Alcohol and the Brain Neural alterations are occurring in the frontal cortex and regions of the brain that are involved in impulse control, decision-making, planning, and emotional regulation. Findings from animal studies and some human studies conducted with youth suggest alcohol use may impact brain regions associated with these critical brain functions with long-term consequences. A concern that early onset alcohol use may interfere with brain development and maturation and that “binge” drinking may be especially harmful. Alcohol Typologies: 1. Cloninger’s Type 1 and Type 2 alcoholics 2. Fourfold typology (Windle, & Scheidt, 2004)(all dependent): a) Mild Course: later onset, lower levels of use, few childhood behavior problems b) Negative Affect: Highest no. symptoms for depression and GAD c) Chronic‐ASPD: early onset alcohol use, high childhood and adult behavioral problems d) Polydrug: Highest levels of polydrug use and benzodiazepine use Major issues to address given strong empirical data: 1. Marked heterogeneity for alcohol phenotypes (e.g., comorbidity/co‐occurrence; earlier vs. later onset) 2. Temporal dynamics: How do alcohol phenotypes change across time regarding onset, escalation, maintenance of high levels of use, reduction and termination, relapse. Need A Developmental Model of Stability and Change in Alcohol Use Across Time • Why do some youth initiate use and misuse earlier than others? Do factors unrelated to alcohol influence the development of alcohol use and escalation? What factors contribute to the escalation and maintenance of high levels of alcohol use for youth? What factors contribute to youth experimenting but not escalating to higher levels of alcohol use? What factors contribute to youth decreasing their use of alcohol after having engaged in high levels of use? What kinds of interventions work best with what kinds of drinkers and when (e.g., are there critical periods to maximize effectiveness)? Lives Across Time (LAT): A Prospective Study of Adolescent and Adult Development LAT is a longitudinal study that began in Western New York in 1988. The purpose of the LAT is to investigate developmental processes that contribute to various health outcomes among adolescents, young adults, and middle- and older-aged adults. Broader Multifaceted Sociocultural and Historical Contextual Factors Risk Factors Biological Mental/Physical Health Problems •Electrocortical (e.g., P300, EEG) •Alcohol sensitivity •Stress Reduction •Neurotransmitters Externalizing Problems •Alcohol use Disorders •Other drug use disorders •Antisocial behaviors Psychological Family History Of Alcoholism •Assortative mating •Coexisting Disorders •Prenatal effects •Genes •Difficult temperament •Aggression •Conduct disorder •Alcohol expectancies •Lower intelligence •Coping styles •Perceived Competencies Social (Family) •Parenting deficits, (harsh discipline, monitoring) •Marital conflict •Financial strain •Ritual disruption •Difficult sibling relations Social (Extrafamilial) •Peer rejection/isolation •Aggressive social style •Limited friend selection •Lack of prosocial skills Environmental Stressors •Neighborhood •School •Familial •Peer •Unique events (e.g., victimization) Internalizing Problems •Depression •Anxiety •Alienation Other HealthRelated Problems •HIV and other STD’s • Injuries •Suicide Participants at each Wave W1 W2 W3 W4 W5 W6 W7 Mean Age 15.5 16.0 16.5 17.1 23.5 28.7 33.4 Adolescence 975 1,119 1,120 1,049 829 782 800 Parents 1,258 1,123 1,133 Spouses 45 312 507 2,132 2,217 2,440 Young adult Parent Total N 706 746 1,681 1,865 714 1,834 700 1,749 Phase I (Adolescence W1-W4) Four waves of assessment beginning with sophomores and juniors in the Fall semester of high school; three additional assessments were conducted spaced 6 months apart. Predominantly Caucasian, middle class sample. Adolescents completed paper-and-pencil surveys in large classrooms (50 minutes) Primary caregivers completed mail surveys. Phase I (Adolescence W1-W4) Adolescent Risk Factors: • Family history of psychiatric disorders (completed by • • • • • mothers) Childhood behavior problems (ADHD,ODD,CD) Temperamental attributes Quality of adolescent peer and family relationships Stressful life events Functioning of the adolescent’s primary caregiver (e.g., level of caregivers’ depressive symptoms, alcohol/substance use, parental role stress, marital dissatisfaction) Phase I (Adolescence W1-W4) Adolescent Health Outcomes: • Alcohol and illicit drug use • Alcohol-related problems • General and alcohol-related coping mechanisms • Delinquent behaviors • Drinking and driving behaviors • Depressive symptoms • Suicidal ideation and attempts Phase II (Young Adulthood W5-W7) Assessment occurred approximately 5 years after completion of W4 for three periods (15 yrs.) Phase II focused on aspects of the transition from adolescence to young adulthood, a time when young adults are beginning to establish and define adult roles, such as completing their education, establishing careers, and developing serious romantic relationships. Role of parents changed—direct interviews about self. Combination of face-to-face interviews and telephone and mail surveys. Phase II (Young Adulthood W5‐W7) Variables assessed at W5-W7 for all study participants included: • Work experiences (satisfaction, workload) • Alcohol and illicit substance use • Quality of interpersonal relationships (i.e., romantic, familial) • Stressful life events and coping styles • DSM-IV diagnoses of alcohol and substance disorders, depressive disorders, anxiety disorder • Sleep variables (duration; problems) • For parents, medical health outcomes (hypertension, diabetes) Alcohol Problems Index: Frequency of Item Endorsement Among Those Who Drink Percent Reporting Alcohol Problems in the Past 6 Months Item Mean Age= 16.96 (n=832) Mean Age= 24.18 (n=733) Mean Age= 29.28 (n=663) 1. Did things while I was drinking that I regretted the next day 47.7 39.8 27.0 2. Thought about cutting down on my drinking 24.5 26.9 19.0 3. Passed out from drinking 29.6 21.4 12.4 4. Got into a fight or heated argument with someone I didn’t know while drinking 16.6 12.2 4.7 5. Got drunk or high from alcohol several days in a row. 28.9 24.0 13.9 6. Drank alcohol to get rid of a hangover 7.6 7.8 5.1 NOTE: Includes only those study participants who reported drinking alcohol in the past 6 months. Factors that Distinguished Heavy and Problem Drinkers Problem Drinkers: • Family history positive for alcoholism • More childhood externalizing problems (symptoms of • • • • • CD, ADHD, OPPOS) Earlier onset of marijuana and illicit substance use Lower perceived family support More stress-relief drinking Greater disinhibitory behavior while drinking Higher percentage of drug using peers (Windle, 1996, Journal of Studies on Alcohol) Odds Ratio (OR) Between Adolescent Problem Drinking (APD) and Disorders in Young Adulthood Young Adulthood Disorders Alcohol O.R. C.I. 3.44 (2.50‐4.74) Major Depressive 1.09 (0.75‐1.57) Anxiety 0.91 (0.63‐1.32) Other Substance 4.21 (2.89‐6.13) Correlations between Max. Level in Adol. and YA Interpersonal Relations Max. Levels in Adolescence YA Partner Support YA Partner Conflict YA Conflict w/ Mother Alcohol problems ‐.07* .11*** .08* Depressive symptoms ‐.09** .18*** .20*** Stressful events ‐.12*** .17*** .21*** Grade point average .13*** ‐.14** ‐.08* Correlations between Max. Level in Adol. and YA Work Features Max. Levels in Adolescence YA Organizational Commitment YA Job Self‐ Efficacy YA Job Distress Alcohol problems ‐.07* ‐.08* .09* Depressive symptoms ‐.13*** ‐.11** .19*** Stressful events ‐.07* ‐.09* .12*** Grade point average .08* .06 ‐.09** Research Question How do we model the individual trajectories of 760 participants for binge drinking across the age span of 16-25 years of age? Currently collecting DNA samples to pursue studies of G X E X Developmental phase interactions. Considering family‐based GWA study and possibly “select‐case” next‐generation sequencing. Considering adding new generation (cohort) to further examine intergenerational transmission. Binge Drinking Trajectories Individual growth trajectories of binge drinking from middle adolescence into young adulthood (i.e., 16 to 25 years of age) were analyzed using a semi-parametric, group-based approach (Nagin, 1999). We used SAS Macro TRAJ (Jones, Nagin, & Roeder, 2001). Male Binge Drinking Trajectories 330 males were classified into four binge drinking groups based on their growth curve trajectories: Non-Binging Stable Group (n=48) Moderate-Binging Stable Group (n=138) High-Binging Stable Group (n=96) Heavy Binging Group (n=48) The average predicted probabilities for class membership were .96, .90, .90, and .94 for each group, respectively. Trajectories of Depressive Symptoms In addition to identifying trajectory groups (i.e., capturing heterogeneity in individual growth patterns), one can also: Study predictors of different trajectory groups; Study outcomes of different trajectory groups; Make comparisons for different groups (e.g., based on gender, ethnic group, intervention/ control groups) for trajectories, predictors, and outcomes. Current and Future Activities Have collected DNA samples to pursue studies of G X E X Developmental phase interactions. Analyzing parent data for alcohol use and health issues among middle‐aged adults. Submitted NIH proposal to examine Parent‐Young Adult Child interpersonal relationships and their impact on substance use and mental health.


© Copyright 2026