
Daily environmental conditions determine the competition
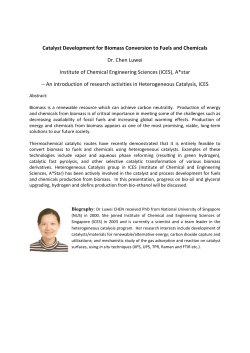
Journal of Ecology
doi: 10.1111/1365-2745.12397
Daily environmental conditions determine the
competition–facilitation balance for plant water status
Alexandra Wright1,2*, Stefan A. Schnitzer1 and Peter B. Reich3,4
1
Department of Biological Sciences, University of Wisconsin-Milwaukee, 3209 N Maryland Ave, Milwaukee, WI 53201,
USA; 2Biological Sciences, Bard College, Annandale-on-Hudson, NY 12504; 3Department of Forest Resources,
University of Minnesota, 1530 Cleveland Ave. N, St. Paul, MN, USA; and 4Hawkesbury Institute for the Environment,
University of Western Sydney, Penrith, NSW 2751, Australia
Summary
1. Plants compete with their neighbours for a finite set of limiting resources, and this decreases individual plant performance, growth and survival. However, neighbouring plants also affect each other
in positive ways.
2. Positive facilitative effects can occur when neighbouring plants ameliorate harsh abiotic conditions (temperature, wind and high irradiation). Thus, when environmental conditions are severe, the
importance of facilitation may increase. The co-occurrence and masking effects of competition and
facilitation among neighbouring plants have made it difficult to tease them apart in the past.
3. We planted bur oak acorns (Quercus macrocarpa) into an experimental diversity gradient in a
central MN grassland that provided a gradient in plant biomass. We predicted that greater biomass
of neighbours would increase both competition and facilitation as measured by impacts on the minimum leaf water potential reached on any given day. Under moderate conditions, competition should
predominate, but under hot/dry conditions, facilitation should become more important. We measured
temperature, humidity and soil moisture in these plots for two growing seasons, as well as oak seedling leaf water potential across a range of daily conditions.
4. On cool/humid days, plant interactions were dominated by competition for soil water: leaf water
potentials of juvenile oaks were lower in plots with greater herbaceous biomass (and higher diversity). Conversely, on hot/dry days, facilitation of the microclimate determined the net effect of plants
on their neighbours: leaf water potentials of juvenile oaks were higher in plots with higher herbaceous diversity and biomass.
5. Synthesis. In terms of plant water status, plant interactions among neighbours can flip from net
negative (competition) to net positive (facilitation) depending on daily abiotic conditions. The relative importance of both positive and negative interactions for plant water status may affect the overall performance of plants over time.
Key-words: climate change, environmental severity, microclimate amelioration, plant–plant interactions, resource limitation, soil moisture, stress-gradient hypothesis, vapour pressure deficit
Introduction
Plants compete for limiting resources and the outcome of
competitive plant interactions can help explain community
composition, global plant distributions and species coexistence (Hardin 1960; Tilman 1977; Bond, Woodward & Midgley 2005). At the individual plant level, competition for
shared resources can decrease growth (Ehleringer 1984; Gordon, Menke & Rice 1989) and increase mortality (Davis et al.
1999) of neighbouring plants. A key limiting resource in
*Correspondence author: E-mail: [email protected]
many ecosystems is soil water. In the short term, when plants
are water limited due to competition for soil water, they may
close their stomates to reduce water loss at the leaf surface,
thus leading to decreased photosynthetic rates, plant growth
and survival (Gordon, Menke & Rice 1989). However, upon
longer-term exposure to water stress, plants may make other
morphological (leaf orientation) or physiological (osmotic
potential) adjustments to retain higher carbon assimilation
rates (Brown, Jordan & Thomas 1976).
Plants may also facilitate each other via amelioration of the
local microclimate (Brooker et al. 2008). In fact, facilitation
may be a component of many plant interactions, but it may
be commonly obscured by competition (Stachowicz 2001;
© 2015 The Authors. Journal of Ecology © 2015 British Ecological Society
2 A. Wright et al.
Bruno, Stachowicz & Bertness 2003). Plants can modify their
local microclimate via shading and evaporative cooling. This
environmental amelioration may be particularly important
when environmental conditions are harsh and would otherwise
cause plant physiological stress (the stress-gradient hypothesis,
Bertness & Callaway 1994). For example, in hot arid ecosystems, environmental facilitation by neighbouring plants often
results in increased germination, growth and survival of plants
growing near neighbours, leading to clumped spatial distributions (Cuesta et al. 2010; Jia et al. 2010; Landero & ValienteBanuet 2010; Armas, Rodrıguez-Echeverrıa & Pugnaire 2011).
In arid systems, physiological constraints related to microclimate may be more important than competition for resources.
Plants may be negatively affected by high rates of water loss at
the leaf surface, due to high vapour pressure deficit in the
microclimate (Wright, Schnitzer & Reich 2014), or directly,
due to photoinhibition at high light levels (Valladares & Pearcy
1997). Facilitation may be dominant in these stressful abiotic
conditions, but weaken and become subordinate to competition
as environmental stress lessens (Callaway et al. 2002).
In the past decade, theoretical and experimental work has
suggested that both competition and facilitation may be ubiquitous in many plant communities, not solely the most arid ones
(Bruno, Stachowicz & Bertness 2003; Montgomery, Reich &
Palik 2010; Wright, Schnitzer & Reich 2014). We posit that, in
terms of plant water status, the temporal dynamics of facilitation relative to competition may be a function of daily
differences in abiotic conditions and therefore may change on a
day-to-day basis. On cool humid days, plant water potential
may be less negative overall, and the effects of facilitation due
to microclimate amelioration from neighbours may be weak. In
these cases, competition for soil water resources may dominate:
plants growing in dense communities may experience more
water stress due to more competition for water below-ground.
Conversely, on hot/dry days, evaporative demand in the microclimate may be high, overall plant water status may be more
negative, and the positive effects of facilitation due to microclimate amelioration from neighbours may dominate. Consequently, both processes may vary in relative strength over time
and the total of competitive and facilitative interactions may
affect longer-term performance (growth and survival).
We planted bur oak acorns (Q. macrocarpa) into 85
2 9 2 m experimental plant communities that varied in species richness from 1 to 16 species (Reich et al. 2012). Plant
biomass increases strongly with species richness in this experiment; hence, the species richness gradient also serves as a
gradient in neighbour density and biomass (Reich et al.
2012). We measured leaf water potential of oaks across a
range of daily conditions at this site. We explored the relative
importance of daily competition and facilitation in terms of
plant water status, and how the balance of these two processes changes over the course of a growing season. We
tested the specific hypothesis that both competition and facilitation are stronger in higher richness/higher biomass plant
communities, but that these processes trade-off over short
time periods depending on the relative severity of daily conditions. We predicted that:
1 On cool humid days, competition for soil water would be
the dominant process driving plant water status, and thus,
plant water status of juvenile oaks in higher diversity/higher
biomass communities would be more negative than plant
water status in lower diversity/lower biomass communities.
2 On hot/dry days, facilitation due to amelioration of the
microclimate would be the dominant process driving plant
water status, and thus, oak plant water status in higher
diversity/higher biomass communities would be less negative than plant water status in lower diversity/lower biomass communities.
Materials and methods
SITE DESCRIPTION
We conducted this study from May 2010 to October 2012 in the
ambient treatment plots of the BioCON plant diversity experiment at
the Cedar Creek Ecosystem Science Reserve (CCESR) in central
Minnesota, USA. Cedar Creek has a continental climate, with cold
winters and warm summers and an average of 660 mm of rainfall per
year (Reich et al. 2001b). Annual temperatures in 2012 were the
warmest on record in the United States (NCDC 2012), and the
CCESR field site was also drier than usual. Annual precipitation for
2012 (January–December) was 495 mm, which was 25% below the
long-term average of 660 mm yr1 (Reich et al. 2001b; Fig. 1).
Mean annual air temperature (January–December) at Cedar Creek,
however, was 8.1 1.3 °C (mean 95% confidence intervals),
which was statistically consistent with the 24-year average
(6.9 1.2 °C, Cedar Creek Ecosystem Science Reserve hourly climate data), though July 2012 was the warmest month on record in
the 24-year temperature data set (23.9 °C, Fig. 1).
Soils at this site are nutrient-poor glacial outwash sand plain with
low water-holding capacity. The BioCON plots were established in
1997 by tilling and fumigating existing vegetation in six experimental
blocks in an old field grassland at the site. Plots were then established
as 2 9 2 m areas that were seeded with randomly assigned herbaceous species (all native or naturalized) from a pool of 16 total species from 4 functional groups – 4 C3 grasses, 4 C4 grasses, 4 legumes
and 4 non-nitrogen fixing herbaceous plants (Achillea millefolium, Agropyron repens, Amorpha canescens, Andropogon gerardi, Anemone
cylindrica, Asclepias tuberosa, Bouteloua gracilis, Bromus inermis,
Koeleria cristata, Lespedeza capitata, Lupinus perennis, Petalostemum villosum, Poa pratensis, Schizachyrium scoparium, Solidago rigida and Sorghastrum nutans,). There were 32 plots with 1 species
(with every monoculture represented twice), 32 plots with 4 species,
9 plots with 9 species and 12 plots with 16 species. Since 1997, species mixes have been maintained by hand weeding to remove any
species that migrated into the plot that were not planted in the original seed mix.
We conducted this experiment along a species richness gradient,
which also provided a gradient in biomass production (Reich et al.
2001a, 2012), and both biomass and diversity may alter the relative
strength of competition and facilitation intensity (Wright et al. 2013;
Wright, Schnitzer & Reich 2014). Increased biomass production with
greater plant diversity leads to reduced resource availability and
increased intensity of competition for colonizing plants (Tilman,
Wedin & Knops 1996; Fargione & Tilman 2005). Increased biomass
production may also be associated with increased protection from
environmental conditions. Consequently, increased biomass and
© 2015 The Authors. Journal of Ecology © 2015 British Ecological Society, Journal of Ecology
Environment and competition–facilitation balance 3
Fig. 1. We measured soil moisture in each
plot on each day of measurement (a). We
also measured relative humidity and air
temperature in each plot, which we used to
calculate vapour pressure deficit (b). We
measured air temperate (solid line) and daily
precipitation (dotted line) at the weather
station at the site (c).
diversity may drive increased facilitation between plants due to amelioration of environmental extremes (Wright et al. 2013). In August
2012, we measured above-ground biomass of herbaceous species in
all 85 plots. Above-ground biomass was clipped in 10 9 100 cm
strips at the soil surface at least 15 cm from plot boundaries (to avoid
edge effects).
We planted six bur oak (Quercus macrocarpa) acorns in all 85
plots in May 2010 and again in May 2012 to increase total seedlings
available for the study. We planted acorns spaced at least 10 cm from
any oak acorn neighbours. We measured leaf number, seedling height
and seedling diameter of all seedlings at the beginning of the growing
season (28 May 2012) and at the end of the growing season (27
August 2012) to assess relative growth rate (RGR) for each seedling.
We also censused seedling emergence at the beginning of the first
growing season (1 July 2010) and at the beginning of the 2012 growing season (28 May 2012). We recorded the survival of all seedlings
that had emerged by 27 August 2012.
In May 2010, we planted a total of 37 bur oak acorns in a nearby
harvest garden and harvested them periodically between July 2010
and July 2012, to derive allometric equations for biomass. We used
these measurements to derive equations for both above-ground biomass (AGB = 0.76 9 diameter 0.02 9 height + 0.11 9 leaves,
r2 = 0.80) and below-ground biomass (BGB = 6.5 9 diameter 0.12 9 height + 0.14 9 leaves, r2 = 0.35), though due to low r2 values for BGB, we used AGB values to calculate RGR. We calculated
above-ground RGR by taking ln(final AGB) – ln(initial AGB)/duration of study.
We measured pre-dawn and midday leaf water potential of a total
of 151 randomly selected oak seedlings (stratified across the diversity
gradient depending on seedling availability; see below), on five different sampling dates in 2012 (June 22, July 11, August 1, August 14
and August 24). For each sampling date, we also excluded seedlings
that were at the largest (> 15 cm tall) or at the smallest (< 5 cm tall)
ends of the seeding size spectrum. In other words, we restricted our
sampling to seedlings that were relatively similar in size across the
herbaceous biomass gradient. We chose sampling dates based on forecast data of maximum daily temperatures at the site, and we
attempted to sample evenly across a range of temperatures
(20–30 °C). Oak leaves began to senesce the week of September 10,
nearly 3 weeks after our final leaf water potential measurements (24
August 2012). The height of the herbaceous canopy varied depending
on herbaceous biomass and species composition. Thus, oak leaves
were more heavily shaded in the higher biomass plots. We sampled
the youngest fully expanded leaf for all leaf water potential measurements. We measured leaf water potential using a Scholander pressure
chamber (Soil Moisture Equipment Corp, Santa Barbara, CA, USA).
Pre-dawn water potential (ψpd) was taken 2 h before dawn each day
(0330–0530), and midday leaf water potential (ψmd) was taken at
solar noon (1200–1400). All measurements were taken by wrapping
leaves in Ziploc bags, excising leaves using a razor blade and immediately transferring to the pressure chamber.
Plants were chosen for water potential measurements based on
sampling at least five oak seedlings per age group per species richness level on each day, each oak having at least 3 leaves fully
expanded at the time of sampling and not sampling from the same
plant two sampling dates in a row. We sampled equally from the
2010 and 2012 age cohorts on each day of sampling. When more
than one plot, or more than one plant within plot, met the above
requirements, the plant was chosen randomly from the subset of available plants. Midday measurements were taken on the same plants as
pre-dawn measurements to assess daily changes in plant water stress
at the individual plant level. We used a comparison between predawn (ψpd) and midday (ψmd) leaf water potential (ψmdψpd) to
detect the daily change in plant water status at the individual plant
level. A total of 27–37 plants were sampled on each sampling date
depending on the constraints described above.
From May 2011 to October 2011 and May 2012 to October 2012,
we measured plot-level air temperature and relative humidity (RH)
on the north-western quadrant of the plot (> 50 cm from the plot
edge) continuously using Maxim iButton dataloggers logging every
5 minutes (Maxim Integrated, San Jose, CA, USA). We then
calculated vapour pressure deficit of the microclimate
17:27Temp
17:27Temp
VPD ¼ 0:6108 eTempþ237:3 RH 0:6108 eTempþ237:3 , (Anderson
100
1936). Dataloggers were installed on wooden tent stakes at approximately 20 cm above the ground surface and covered with plastic Dixie
© 2015 The Authors. Journal of Ecology © 2015 British Ecological Society, Journal of Ecology
4 A. Wright et al.
cups. This ensured that the dataloggers were recording microclimate
conditions 5–15 cm above the height of the oak seedlings (a conservative measure of average microclimate conditions under the herbaceous
canopy). The covers were painted white to reflect direct sunlight and
guard from direct saturation by rainwater. These dataloggers were
installed in all plots where leaf water potential measurements were collected. We also measured shallow soil moisture (~6 cm depth) in these
plots at 11:00 a.m. on the same day as leaf water potential measurements using an HH2 soil moisture meter with theta probe (Delta-T
Devices Ltd, Cambridge, UK). Additional dataloggers were installed
in a randomly assigned subset of plots throughout the rest of the
experimental plots and moved every 2 weeks. We collected site-level
temperature, humidity and vapour pressure deficit measurements from
the Cedar Creek Ecosystem Science Reserve weather station.
ANALYSIS – MICROCLIMATE
We analysed the effects of herbaceous plant biomass on microclimate
(air temperature and vapour pressure deficit) and whether the magnitude of these effects changed depending on site conditions. We calculated plot-level averages for microclimate temperature and VPD for
each day 24-h period during the study (‘plot level’). We also calculated daily averages for air temperature and vapour pressure deficit
data collected from the Cedar Creek weather station (‘site level’). We
conducted separate mixed-effects ANCOVA to assess the effects of daily
conditions (temperature and vapour pressure deficit), and the amelioration of these conditions by the plant community, on microclimate.
To account for spatial autocorrelation associated with the blocked ring
design and temporal autocorrelation associated with taking multiple
measurements on the same plots over time, we included plot nested
within block as a random effect. These two ANCOVAs assessed the following: (i) the fixed effects of daily average temperature at the site
(taken from Cedar Creek weather station data), herbaceous biomass
and their first-order interaction effects on microclimate temperatures
and (ii) the fixed effects of daily average VPD at the site, herbaceous
biomass and their first-order interaction effects on microclimate VPD.
ANALYSIS – SOIL MOISTURE
To assess the effects of daily changes in weather, seasonal trends in
soil moisture at the site (the sandy soil rapidly becomes dry between
major rain events and over the course of the season, Adair et al.
2011) and herbaceous biomass, on soil moisture, we conducted a
mixed-effects ANCOVA with site-level VPD, herbaceous biomass and
day of year as fixed effects. To account for spatial autocorrelation
associated with the blocked ring design and temporal autocorrelation
associated with taking multiple measurements on the same plots over
time, we included plot nested within block as a random effect. Since
we measured soil moisture in a 30-plot subset of the total plots used
for this study, based on where leaf water potential measurements were
taken on any given day, statistical power was too low across the gradient in herbaceous biomass on any single day to include random
effects for ring and plot in this soil moisture statistical model.
ANALYSIS – LEAF WATER POTENTIAL
We conducted a mixed-effects ANCOVA to assess the effects of
herbaceous biomass, site-level climatic conditions (VPD) and their
interaction, on all measures of oak leaf water potential (ψpd, ψmd,
ψmd- ψpd,). For both pre-dawn and midday leaf water potential, we
assessed the effects of site-level VPD for the 6-hr period prior to
water potential measurements. For the daily changes in leaf water
potential (ψmdψpd). we assessed the effects of site-level VPD integrated over this entire period (00:00–14:00). To account for spatial
autocorrelation associated with the blocked ring design and temporal
autocorrelation associated with taking multiple measurements on the
same plots over time, we included plot nested within block as a random effect. To account for differences in the age of seedlings (the
cohort from 2010 or 2012 described above), we included a random
effect for seedling age in the statistical model as well.
We conducted a separate analysis to explore the plot-level mechanisms for competition and facilitation on all three measures of oak
leaf water status (ψpd, ψmd, ψmdψpd,). We directly assessed the
effects of soil water and microclimate VPD on pre-dawn, midday and
daily differences in oak water potential using a mixed-effects ANCOVA
(microclimate VPD comparisons were made using the same time
intervals as described above for site-level comparisons). To account
for spatial autocorrelation of measurements taken within the same
block and temporal autocorrelation associated with taking measurements on the same plot over time, we included plot nested within
block as a random effect. We also included a random effect for seedling age to account for any differences between the two seedling ages
in the statistical model.
ANALYSIS – GROWTH AND SURVIVAL
We analysed the effects of herbaceous biomass on above-ground oak
seedling RGR and proportion survival (arcsine transformed) using a
mixed-effects ANCOVA with plot nested in block and seedling age
(cohort) included as random effects.
We also repeated all of the above analyses by replacing herbaceous
biomass above with species richness. These results were qualitatively
very similar and are included in Appendix S1 in Supporting Information.
Results
Over the course of our five leaf water potential measurement
campaigns, daily temperature was the highest on July 11 and
August 24 and lowest on June 22 and August 14. Relative
humidity was highest in June and lowest in early July. This
resulted in VPD being highest on July 11 and lowest on June
22 (Fig. 1a). There was no correlation between sampling date
and temperature in the plots (Pearson product moment correlation coefficient, r = 0.06, N = 168) and no correlation between
sampling date and relative humidity in the plots (r = 0.16,
N = 168) – in other words, we did not sample all cool/humid
days in the early summer and all hot/dry days in the late summer (Fig. 1a). There was a weak negative correlation between
soil moisture and VPD at the site (r = 0.24, N = 168).
MICROCLIMATE AND SOIL MOISTURE
Under the herbaceous canopy layer (~20 cm above the soil
surface), plots with higher species richness and more aboveground biomass were cooler, more humid and had lower
vapour pressure deficit than plots with less biomass and fewer
species (Table 1, Fig. 2, Appendix S1). The magnitude of the
microclimate amelioration effect was stronger as daily
weather conditions became hotter and drier (significant inter-
© 2015 The Authors. Journal of Ecology © 2015 British Ecological Society, Journal of Ecology
Environment and competition–facilitation balance 5
Table 1. Separate anovas for the effects of daily temperature on microclimate temperature and daily VPD on microclimate VPD. We also tested
for interactions between these factors and above-ground biomass (AGB)
Plot Temp
Plot VPD
Fixed Effect
d.f.†
R2
F
P
Herb AGB
Site Temp
Herb AGB 9 Site Temp
1, 9306
1, 9525
1, 9524
0.96
66.24
211 750
77.47
< 0.0001*
< 0.0001*
< 0.0001*
Herb AGB
Site VPD
Herb AGB 9 Site VPD
1, 8969
1, 9227
1, 9230
0.88
F
P
27.80
50 089
482.5
< 0.0001*
< 0.0001*
< 0.0001*
†
This analysis took into account spatial variation associated with the blocked design (‘block’ in the BioCON framework). In the linear mixedeffects model framework, denominator degrees of freedom ‘float’ based on the degree of variation attributed to random effects. Asterisks (*) indicate statistical significance.
biomass (F1,60 = 30.2, P < 0.0001) plots. Oak emergence
was ~1.59 higher in the highest diversity compared with
one-species plots (F1,80 = 16.5, P = 0.0001) and almost 39
higher in the highest biomass plots (F1,80 = 19.4,
P < 0.0001). Survival of emerged seedlings was equal
across the diversity gradient (F1,80 = 2.15, P = 0.15) but
almost 39 higher in the highest biomass plots (F1,80 = 5.33,
P = 0.02).
Pre-dawn leaf water potential values were unaffected by
daily changes in site-level VPD or community biomass (Fig.
S2, Table 2). The majority of the variation in pre-dawn leaf
water potential values was due to soil moisture, where higher
soil moisture led to less negative pre-dawn leaf water potential
100
200
300
400
500
600
0
Herbaceous aboveground biomass
100
200
300
400
500
4
3
Microclimate VPD (kPa)
4
3
2
1
3
2
1
0
0
(c)
0
Microclimate VPD (kPa)
(b)
4
Microclimate VPD (kPa)
(a)
2
All oaks grew ~29 less in the highest diversity
(F1,57 = 13.6, P = 0.0005) and ~49 less in the highest
1
WATER STRESS, GROWTH AND SURVIVAL
0
action terms, Table 1, Fig. 2). In contrast, soil moisture was
lower in diverse, higher biomass plots over the course of the
season (except for early in the season) and progressively
lower in the highest diversity and highest biomass plots during the growing season (Table S1, Fig. S1, Appendix S1).
Thus, high-diversity plots with high biomass had lower residual soil water availability, but more mesic temperatures and
less atmospheric evaporative demand.
600
Herbaceous aboveground biomass
0
100
200
300
(d)
Biomass microclimate effect
(slope of biomass/VPD line)
0.000
Fig. 2. We measured vapour pressure deficit
in the microclimate of 55 randomly selected
plots over the course of two years. We found
that it was cooler in plots with more aboveground biomass (panels a–c). We also found
that as average VPD at the site increased (on
days when it was hotter and drier), plant
biomass had an increasingly strong
ameliorating effect on microclimate VPD (d).
The dotted line below (d) represents the
significant interaction between site-level VPD
and
community
herbaceous
biomass
(F1,9230 = 482.5, P < 0.0001*).
0.001
0.002
0.003
0.004
0
1
2
Average daily VPD at the site (kPa)
© 2015 The Authors. Journal of Ecology © 2015 British Ecological Society, Journal of Ecology
400
500
600
Herbaceous aboveground biomass
3
6 A. Wright et al.
Table 2. The relationship between site conditions (vapour pressure deficit) and herbaceous biomass on oak leaf water potential. We conducted
separate analyses for pre-dawn, midday and daily changes (diff). For pre-dawn leaf water potential, we compared with the 24-hr period prior to
the pre-dawn measurement. For midday leaf water potential, we compared with the period between pre-dawn and midday. For the daily difference
in leaf water potential, we compared with the 24-hour period prior to the midday measurement (to integrate over the whole day)
Pre-dawn
Midday
Diff
Fixed effect
d.f.†
F
P
d.f.
F
P
d.f.
F
P
Herb biomass
Site VPD
Herb biomass 9 Site VPD
1, 25.2
1, 163
1, 163
1.50
2.25
1.16
0.23
0.14
0.28
1, 29.1
1, 162
1, 162
1.16
30.9
0.01
0.19
<0.0001*
0.94
1, 29.7
1, 160
1, 159
0.73
16.5
8.5
0.40
<0.0001*
0.004*
†
These analyses took into account spatial variation associated with the blocked design (‘block’ in the BioCON framework) and measurements
taken on individuals in the same plots over time. In the linear mixed-effects model framework, denominator degrees of freedom ‘float’ based on
the degree of variation attributed to block differences; this is why denominator degrees of freedom are different depending on the metric
described in this table. Asterisks (*) indicate statistical significance.
and soil moisture declined over the course of the season (Fig.
S3, Table S2).
Midday leaf water potential values were more negative on
hot/dry days with a high VPD, but they did not vary overall
with herbaceous biomass or species richness (Table 2, Appendix S1 – Table 3, Fig. S2). Midday leaf water potential was
more negative when soil moisture was low and when plot
VPD was high (Table S2, Fig. S3b,e).
The difference between pre-dawn leaf water potential
(ψpd) and midday leaf water potential (ψmd) reflects the
change in water status of oak seedlings on a given day. By
subtracting the pre-dawn leaf water potential from the leaf
water potential during the time with the highest evaporative
demand (midday), we can to some extent standardize (i.e.
account for) differences in baseline (pre-dawn) water status
and focus on daily responses. There was no main effect of
(a)
(b)
herbaceous biomass or species richness on the daily change
in leaf water potential (Table 2, Appendix S1 – Table 3).
There was an overall negative effect of VPD on daily
change in leaf water potential, and a significant interaction
between herbaceous biomass and daily VPD (Table 2,
Appendix S1 – Table 3). This effect was not significantly
driven by differences in oak seedling size (Fig. S4). Oak
seedlings growing in higher diversity and higher biomass
plots experienced net competitive effects on cool/humid days
(more negative values of ψmdψpd in higher biomass plots).
In contrast, plants growing in the same plots, experienced
net facilitation from neighbours on hot/dry days (less negative values of ψmdψpd in higher biomass plots, Table 2,
Fig. 3). The daily change in plant water status was driven
by plot-level (microclimate) differences in vapour pressure
deficit (Table S2, Fig. S3f).
(c)
(d)
Fig. 3. We measured pre-dawn leaf water
potential (ψpd) and midday leaf water
potential (ψmd) on five days that varied in
VPD at the site. We then calculated the daily
difference in leaf water potential (ψmdψpd)
on each of those days. We found that leaf
water potential reflected net competition with
higher biomass communities on cool humid
days (a), but net facilitation with higher
biomass communities on hot/dry days (c).
The degree of this effect seemed to change
nonlinearly with 24-h VPD (d). The dotted
line below (d) indicates the two-way
interaction between herbaceous biomass and
12-h site VPD (F1,159 = 8.5, P = 0.004).
© 2015 The Authors. Journal of Ecology © 2015 British Ecological Society, Journal of Ecology
Environment and competition–facilitation balance 7
Discussion
Measures of resource availability and juvenile oak seedling
water status across days of differing evaporative demand
showed differing strengths of facilitation and competition in
this grassland experiment. Pre-dawn leaf water potential of
bur oaks ranged from 0 to 1.0 MPa and was tightly
linked with soil moisture. Similar to previous studies, midday leaf water potential ranged from 1.0 to 3.0 and was
more tightly linked to vapour pressure deficit in the microclimate (Abrams & Knapp 1986). Increasing herbaceous
biomass and species richness (in the seedlings neighbourhood) resulted in both greater resource limitation and in
greater amelioration of environmental stress for the juvenile
oaks. We found that the degree of amelioration of the
microclimate became progressively stronger on hotter/drier
days and this translated to the increasing importance of
facilitation for plant water status. In particular, increasing
herbaceous plant biomass reduced average VPD by 50% on
the hottest/driest days (microclimate amelioration), compared
to low biomass, low-diversity plots. Increasing plant herbaceous biomass reduced available soil moisture by as much
as 50%, particularly late in the season (resource limitation).
While reduced soil moisture in higher biomass, higher
diversity plots likely drove increased competition for water
when soil water was limiting (increasingly over the course
of the season), in terms of oak seedling water status, this
was outweighed by a facilitative advantage conferred in
high-diversity and high-biomass plots when daily conditions
(VPD) were arid.
Oak growth rates in our study were lowest in higher biomass higher diversity plots. We note that due to these differences in oak seedling size and structure, we selected oak
seedlings for leaf water potential measurements that fell
within a narrow size range across the biomass density gradient (a subset of the overall variation in oak sizes). We did
this to reduce variation in leaf water potential measurements
that were directly associated with differences in seedling size
(Cavender-Bares & Bazzaz 2000). We also explored the direct
effects of seedling size, leaf area and total number of leaves
on daily leaf water potential measurements and found no evidence that oak size differences explained the trends in leaf
water potential that we reported here (Fig. S4).
While oak growth was lowest in higher biomass and higher
diversity plots in our study, we predict that the combined
contribution of both competition and facilitation may underlie
this trend. Decreasing oak growth with increasing community
biomass does not necessarily mean that competition for
resources was the only type of interaction happening between
neighbours; it could mean there were just more competitive
days than there were facilitative days. Specifically, competition for soil water between oak seedlings and the herbaceous
plant community was strong below 12-h VPD values of
~1.75 kPa. Above 1.75 kPa, however, competition for soil
water was outweighed by the facilitative effects of microclimate amelioration (VPD). Importantly, 2012 was one of the
hottest and driest years on record. During the 2012 growing
season (May 15–September 31), there were 23 days with
average daily VPD values greater than 1.75 kPa. While our
current data set is necessarily limited in scope (due to the
small number of days sampled), this implies that in terms of
water status, oaks may have experienced predominant facilitative effects of the herbaceous community for ~15% of the
growing season, whereas competition may have dominated
for the remaining ~85% of the time. Though to be clear, this
rough estimate does not account for competition for other
limiting resources, such as nitrogen or light, which may further tip the competition/facilitation balance towards net competition.
Future work should explore these questions in terms of
changes in stomatal conductance, osmotic adjustment, leaf
positioning, carbon assimilation, water-use efficiency and the
specific implications of these temporal variations in VPD for
longer-term plant performance. Reduced VPD in the microclimate has the capacity to decrease water loss at the leaf surface (Ocheltree et al. 2013). While stomatal conductance was
not measured in the current study, this change in VPD may
help maintain higher levels of stomatal conductance and have
a positive effect on overall photosynthetic rates (Ocheltree
et al. 2013) in high-biomass plots on the hottest days. This
pattern is consistent with the results we present here and
would mean that an increased number of days with average
VPD values greater than 1.75 kPa could potentially shift the
plant–plant interaction balance in the future (He, Bertness &
Altieri 2013; Stocker et al. 2013). It should be noted that differences in light levels between experimental plots in this system (Clark et al. 2012) may also affect stomatal conductance,
but relative differences in light patterns among plots should
not shift significantly over time and would not explain these
day-to-day changes in plant interactions. Depending on local
wind conditions, relative differences in CO2 enrichment
between experimental plots may also affect water-use efficiency and longer-tem performance of seedlings, though CO2
levels were not measured at the plot-level in this study. As a
first estimation, these results suggest that plant performance
over the course of a growing season may be influenced by
simultaneously acting competition and facilitation for water
and the potential for each process to mask the presence of the
other (e.g. Montgomery, Reich & Palik 2010).
MICROCLIMATE AMELIORATION AND THE PLANT
COMMUNITY
Our results also demonstrate the potential for a novel positive-feedback loop for microclimate amelioration. We found
that plant communities with less biomass were up to 6 °C
hotter and had more than 2 times higher plot-level VPD on
particularly hot and dry days. Conversely, on cool humid
days, temperature and humidity varied little as a function of
herbaceous biomass (Fig. 2). The gradient in herbaceous biomass from low- to high-diversity differed minimally across
sampling dates in these comparisons, yet the effect that it had
on the microclimate changed. When it is hotter and drier at
the site, more herbaceous biomass may shade and intercept
© 2015 The Authors. Journal of Ecology © 2015 British Ecological Society, Journal of Ecology
8 A. Wright et al.
irradiation that would otherwise heat the microclimate.
Increased irradiation should also reduce relative humidity,
driving the overall effect that we observed on vapour pressure
deficit and plant performance. The greater the degree of environmental warming and drying, the greater the impact of the
boundary layer provided by the herbaceous community. Furthermore, in higher biomass communities, there is more plotlevel photosynthesis (indicated by greater overall productivity)
in higher diversity plots (Reich et al. 2001a) and increased
rates of plot-level transpiration; this may lead to increased
evaporative cooling of the microclimate (due to a higher density of individuals and higher diversity of strategies for dealing with daily conditions). On cooler days (if cool because of
cloud cover), there may be less irradiance overall, and the
shading/evaporative cooling effect may not be happening. The
stress-gradient hypothesis predicts that facilitation is more
important for plants in environmentally severe conditions
(Bertness & Callaway 1994). When environmental severity is
strong, plants experience increased physiological stress, and
this translates to stronger benefits of growing near neighbours.
The stress-gradient hypothesis also predicts that when environmental conditions are mild, there may still be microclimate
amelioration, but it may not translate to strong facilitation.
We show that in terms of plant water status, as the stress-gradient hypothesis predicts, environmental amelioration may be
most important for seedlings on hot and dry days (Fig. 3).
We also show that the magnitude of the actual microclimate
amelioration that is occurring is greater (Fig. 2).
competitive effects (e.g. 85% of days). Conversely, in more
severe environments, the role of competition may be overshadowed by facilitation, possibly leading to the flawed conclusion
that competition is not important in severe environments
(Bruno, Stachowicz & Bertness 2003). If taken to the next
level, the mechanisms behind these day-to-day results may
even scale from days to seasons to interannual variations. Only
through careful examination of both the competitive and facilitative interactions between plants, can we understand plant
community dynamics and make accurate predictions about
how plant communities may change in the future.
Acknowledgements
This research was supported by the Department of Energy Program for Ecological Research Grant DE-FG02-96ER62291, the National Science Foundation
Long-term Ecological Research Grant DEB-1234162, the NSF Long-term
Research in Environmental Biology DEB-0716587 and DEB-1242531 and Ecosystem Sciences (NSF DEB- 1120064) Programs, the University of Minnesota,
the UWM Department of Biological Sciences and the NSF Graduate Research
Fellowship Program. Special thanks to Tali Lee, Susan Barrott and Kally Worm
for assistance in the execution and design of this experiment. We thank Joe
Strini and Hannah Kruse for field assistance during the collection of leaf water
potential data. We also thank Katie Barry and Laura Williams for extensive
comments on previous versions of this manuscript. All authors confirm that
there is no conflict of interest involved in the publication of this study.
Data accessibility
Oak leaf water potential, relative growth rates and plot VPD data: Cedar Creek
Ecosystem Science Reserve Data Catalogue data set ID #adue141. Herbaceous
community biomass data: Cedar Creek Ecosystem Science Reserve Data Catalogue data set ID #ple141.
SUMMARY
The majority of the past work on facilitation in plant communities has focused on documenting case studies where facilitation is dominant (deserts, tundra and salt marshes) with less
focus on determining the relative roles (and masking effects)
of both types of interactions among neighbouring plants. There
is a large body of evidence documenting the shifting importance of competition and facilitation across systems depending
on environmental severity. Specifically, the relative importance
of facilitation tends to increase with increasing environmental
severity at higher elevations (Callaway et al. 2002), in deserts
(Holzapfel & Mahall 1999) and marine systems (Peterson &
Heck 2001). Fewer studies have examined temporal variation
in the drivers of such changes (but see Callaway 1992; Greenlee & Callaway 1996; Baumeister & Callaway 2006; Semchenko et al. 2011). Though predicted by theory (Bruno,
Stachowicz & Bertness 2003), we know of no previous studies
that have documented the shifting balance of competition and
facilitation from 1 day to the next. Here, we demonstrate
threshold environmental conditions (community biomass and
diversity, soil moisture and vapour pressure deficit) that tip the
balance temporally between competition and facilitation for
plant water status and therefore demonstrate the underlying
presence of both. Because both competition and facilitation
are likely ubiquitous in many if not most plant communities,
tests of competition may be missing underlying facilitation
(e.g. 15% of days in our experiment) due to stronger overall
Author contributions
AW designed the oak water potential study with assistance from SS and PR,
AW collected the data pertaining to oak seedling growth and physiology, and
PR conducted the BioCON experiment and organized its data acquisition, AW
analysed the data and wrote the first draft of the manuscript, and all authors
contributed substantially to revisions.
References
Abrams, M.D. & Knapp, A.K. (1986) Seasonal water relations of three gallery
forest hardwood species in northeast Kansas. Forest science, 32, 687–696.
Adair, E.C., Reich, P.B., Trost, J.J. & Hobbie, S.E. (2011) Elevated CO2 stimulates grassland soil respiration by increasing carbon inputs rather than by
enhancing soil moisture. Global Change Biology, 17, 3546–3563.
Anderson, D.B. (1936) Relative humidity or vapor pressure deficit. Ecology,
17, 277–282.
Armas, C., Rodrıguez-Echeverrıa, S. & Pugnaire, F.I. (2011) A field test of the
stress-gradient hypothesis along an aridity gradient. Journal of Vegetation
Science, 22, 818–827.
Baumeister, D. & Callaway, R. (2006) Facilitation by Pinus flexilis during succession: a hierarchy of mechanisms benefits other plant species. Ecology, 87,
1816–1830.
Bertness, M. & Callaway, R. (1994) Positive interactions in communities.
Trends in Ecology & Evolution, 9, 191–193.
Bond, W.J., Woodward, F.I. & Midgley, G.F. (2005) The global distribution of
ecosystems in a world without fire. New phytologist, 165, 525–537.
Brooker, R.W., Maestre, F.T., Callaway, R.M., Lortie, C.L., Cavieres, L.A.,
Kunstler, G. et al. (2008) Facilitation in plant communities: the past, the
present, and the future. Journal of Ecology, 96, 18–34.
Brown, K.W., Jordan, W.R. & Thomas, J.C. (1976) Water stress induced alterations of the stomatal response to decreases in leaf water potential. Physiologia Plantarum, 37, 1–5.
© 2015 The Authors. Journal of Ecology © 2015 British Ecological Society, Journal of Ecology
Environment and competition–facilitation balance 9
Bruno, J., Stachowicz, J. & Bertness, M. (2003) Inclusion of facilitation into
ecological theory. Trends in Ecology & Evolution, 18, 119–125.
Callaway, R. (1992) Effect of shrubs on recruitment of Quercus douglasii and
Quercus lobata in California. Ecology, 73, 2118–2128.
Callaway, R.M., Brooker, R.W., Choler, P., Kikvidze, Z., Lortie, C.J., Michalet, R., Paolini, L., Pugnaire, F.I., Newingham, B. & Aschehoug, E.T. (2002)
Positive interactions among alpine plants increase with stress. Nature, 417,
844–848.
Cavender-Bares, J. & Bazzaz, F.A. (2000) Changes in drought response strategies with ontogeny in Quercus rubra: implications for scaling from seedlings
to mature trees. Oecologia, 124, 8–18.
Clark, C.M., Flynn, D.F.B., Butterfield, B.J. & Reich, P.B. (2012) Testing the
Link between Functional Diversity and Ecosystem Functioning in a Minnesota Grassland Experiment (ed. J.F. Cahill ). PLoS ONE, 7, e52821.
Cuesta, B., Villar-Salvador, P., Puertolas, J., Rey Benayas, J.M. & Michalet, R.
(2010) Facilitation of Quercus ilex in Mediterranean shrubland is explained
by both direct and indirect interactions mediated by herbs. Journal of Ecology, 98, 687–696.
Davis, M., Wrage, K., Reich, P., Tjoelker, M., Schaeffer, T. & Muermann, C.
(1999) Survival, growth, and photosynthesis of tree seedlings competing with
herbaceous vegetation along a water-light-nitrogen gradient. Plant Ecology,
145, 341–350.
Ehleringer, J.R. (1984) Intraspecific competitive effects on water relations,
growth and reproduction in Encelia farinosa. Oecologia, 63, 153–158.
Fargione, J.E. & Tilman, D. (2005) Diversity decreases invasion via both sampling and complementarity effects. Ecology Letters, 8, 604–611.
Gordon, D.R., Menke, J.M. & Rice, K.J. (1989) Competition for soil water
between annual plants and blue oak (Quercus douglasii) seedlings. Oecologia, 79, 533–541.
Greenlee, J. & Callaway, R. (1996) Abiotic stress and the relative importance
of interference and facilitation in montane bunchgrass communities in western Montana. American Naturalist, 148, 386–396.
Hardin, G. (1960) The competitive exclusion principle. Science, 131, 1292–1297.
He, Q., Bertness, M.D. & Altieri, A.H. (2013) Global shifts towards positive
species interactions with increasing environmental stress (ed. M Vila). Ecology Letters, 16, 695–706.
Holzapfel, C. & Mahall, B. (1999) Bidirectional facilitation and interference
between shrubs and annuals in the Mojave Desert. Ecology, 80, 1747–1761.
Jia, X., Dai, X.-F., Shen, Z.-X., Zhang, J.-Y. & Wang, G.-X. (2010) Facilitation can maintain clustered spatial pattern of plant populations during density-dependent mortality: insights from a zone-of-influence model. Oikos,
120, 472–480.
Landero, J.P.C. & Valiente-Banuet, A. (2010) Species-specificity of nurse
plants for the establishment, survivorship, and growth of a columnar cactus.
American Journal of Botany, 97, 1289–1295.
Montgomery, R.A., Reich, P.B. & Palik, B.J. (2010) Untangling positive and
negative biotic interactions: views from above and below ground in a forest
ecosystem. Ecology, 91, 3641–3655.
NOAA National Climatic Data Center, State of the Climate: National Overview
for Annual (2012) Available from http://www.ncdc.noaa.gov/sotc/national/
2012/13. [accessed 14 March 2015].
Ocheltree, T.W., Nippert, J.B. & Prasad, P.V.V. (2013) Stomatal Responses to
Changes in Vapor Pressure Deficit Reflect Tissue-Specific Differences in
Hydraulic Conductance. Plant Cell and Environment, 37, 132–139.
Peterson, B.J. & Heck, K.L. Jr (2001) Positive interactions between suspension-feeding bivalves and seagrass-a facultative mutualism. Marine Ecology
Progress Series, 213, 143–155.
Reich, P., Knops, J., Tilman, D., Craine, J., Ellsworth, D., Tjoelker, M., Lee, T.,
Wedin, D., Naeem, S. & Bahauddin, D. (2001a) Plant diversity enhances ecosystem responses to elevated CO2 and nitrogen deposition. Nature, 410, 809–810.
Reich, P., Tilman, D., Craine, J., Ellsworth, D., Tjoelker, M., Knops, J., Wedin,
D., Naeem, S., Bahauddin, D. & Goth, J. (2001b) Do species and functional
groups differ in acquisition and use of C, N and water under varying atmospheric CO2 and N availability regimes? A field test with 16 grassland species. New Phytologist, 150, 435–448.
Reich, P.B., Tilman, D., Isbell, F., Mueller, K., Hobbie, S.E., Flynn, D.F.B. &
Eisenhauer, N. (2012) Impacts of biodiversity loss escalate through time as
redundancy fades. Science, 336, 589–592.
Semchenko, M., Lepik, M., G€otzenberger, L. & Zobel, K. (2011) Positive
effect of shade on plant growth: amelioration of stress or active regulation of
growth rate? Journal of Ecology, 100, 459–466.
Stachowicz, J.J. (2001) Mutualism, Facilitation, and the Structure of Ecological
Communities: positive interactions play a critical, but underappreciated, role
in ecological communities by reducing physical or biotic stresses in existing
habitats and by creating new habitats on which many species depend. BioScience, 51, 235–246.
Stocker, T.F., Qin, D., Plattner, G.K., Alexander, L.V., Allen, S.K., Bindoff,
N.L. et al. (2013) Technical Summary. In: Climate Change 2013: the Physical Science Basis. Contribution of Working Group I to the Fifth Assess- ment
Report of the Intergovernmental Panel on Climate Change (eds T.F. Stocker,
D. Qin, G.K. Plattner, M. Tignor, S.K. Allen, J. Boschung, A. Nauels, Y.
Xia, V. Bex & P.M. Midgley). Cambridge University Press, Cambridge,
United Kingdom and New York, NY, USA.
Tilman, D. (1977) Resource competition between plankton algae: an experimental and theoretical approach. Ecology, 58, 338–348.
Tilman, D., Wedin, D. & Knops, J. (1996) Productivity and sustainability influenced by biodiversity in grassland ecosystems. Nature, 379, 718–720.
Valladares, F. & Pearcy, R. (1997) Interactions between water stress, sun-shade
acclimation, heat tolerance and photoinhibition in the sclerophyll Heteromeles arbutifolia. Plant Cell and Environment, 20, 25–36.
Wright, A.J., Schnitzer, S.A. & Reich, P.B. (2014) Living close to your neighbors – the importance of both competition and facilitation in plant communities. Ecology, 95, 2213–2223.
Wright, A., Schnitzer, S.A., Dickie, I.A., Gunderson, A.R., Pinter, G.A.,
Mangan, S.A. & Reich, P.B. (2013) Complex facilitation and competition
in a temperate grassland: loss of plant diversity and elevated CO2
have divergent and opposite effects on oak establishment. Oecologia, 171,
449–458.
Received 8 December 2014; accepted 9 March 2015
Handling Editor: Robert Jones
Supporting Information
Additional Supporting Information may be found in the online version of this article:
Figure S1. Soil moisture in all plots according to date of measurement and environmental conditions.
Figure S2. Predawn, midday, and daily diff in leaf water potential
measurements on all days of the study.
Figure S3. The effects of plot-level soil moisture and microclimate
(VPD) on predawn, midday, and daily diff in leaf water potential.
Figure S4. The effect of oak seedling size on the daily change in leaf
water potential experienced by oak seedlings across the community
biomass gradient.
Table S1. Effects of DOY and environmental conditions on soil
moisture (%).
Table S2. The effects of plot-level soil moisture and microclimate
(VPD) on predawn, midday, and daily diff in leaf water potential.
Appendix S1. Analyses repeated using species richness of plots
(instead of herbaceous biomass).
© 2015 The Authors. Journal of Ecology © 2015 British Ecological Society, Journal of Ecology
1
1
2
3
4
5
6
7
8
9
Online Supplemental Material
Figure S1. Soil moisture in all plots according to date of measurement and environmental
conditions. We measured soil moisture in all of the plots where we measured leaf water
potential on the five days when we measured leaf water potential. We found that soil moisture
increased slightly with plant biomass early in the growing season and increasingly decreased
WaterPotential_Aug_2012_edited: Graph Builder
Page 1 of 2
with
plant biomass over the course of the summer (date x herbaceous biomass interaction).
These
relationships
Graph
Builder are the result of the significant interaction between Date and Herbaceous
Biomass (Table S1).
Site%VPD%
Date%
1.24
6/22/12
06/22/2012
18
Soil Moisture vs. HerbTotalBiomass
2.57
1.55
Date
8/1/12
08/01/2012
7/11/12
07/11/2012
1.07
1.47
8/14/12
08/14/2012
8/24/12
08/24/2012
Moisture
SoilSoilMoisture
16
14
12
10
8
6
4
0
400 800 1200
Where(46 rows excluded)
10
0 200 600 1000 1400
0
400 800 1200
HerbTotalBiomass
0 200 600 1000 1400
Total Herbaceous Biomass
0
400 800 1200
Soil Moisture
2
Figure S2. Predawn, midday, and daily diff in leaf water potential measurements on all days of
the study. We measured predawn (ψpd), midday (ψmd), and daily difference (ψmd – ψpd) in
leaf water potential with increasing values of 24 hr VPD (displayed at the bottom next to the
daily averages). We found that midday leaf water potential reflected competition for water on
the coolest days, but remained constant despite competitive predawn values on the hottest/driest
WaterPotential_Aug_2012_edited:
Graph Builder
Page 1 of 2
days.
The displayed data reflect the significant
overall relationship between soil moisture,
predawn
leaf water
potential, and midday leaf water potential (top, Table S2). These changes in
Graph
Builder
predawn and midday leaf water potentials result in the significant interactions between site-level
VPD and herbaceous biomass (bottom of figure, Table 2).
AM_WP_Mpa & 2 more vs. HerbTotalBiomass
Date
8/14/12
7%
1.0696907
10%
1.5070713
8%
2.0614824
1.07
1.24
1.47
1.55
2.57
-0.2
-0.4
-0.6
-0.8
-1.0
-1.0
-1.5
-2.0
-2.5
-3.0
-0.5
-1.0
-1.5
-2.0
-2.5
Where(46 rows excluded)
HerbTotalBiomass
Total Herbaceous
Biomass
20
0
60
0
10
00
20
0
60
0
10
00
-3.0
20
0
60
0
10
00
Daily Diff DayWP_Mpa
Leaf Water Potential
13%
1.0584551
0.0
24 h Site VPD
-3.5
21
7/11/12
8%
0.7168599
20
0
60
0
10
00
PM_WP_Mpa
Midday
Leaf Water Potential
AM_WP_Mpa
Predawn
Leaf Water Potential
Soil Moisture
6/22/14
8/24/12
24_hourbeforemidday_VPD
28/1/14
20
0
60
0
10
00
11
12
13
14
15
16
17
18
19
20
AM_WP_Mpa
PM_WP_Mpa
DayWP_Mpa
3
Figure S3. The effects of plot-level soil moisture and microclimate (VPD) on predawn, midday,
and daily diff in leaf water potential. The relationship between soil moisture (a-c) and vapor
pressure deficit (d-f), on leaf water potential. Predawn leaf water potential is most strongly
controlled by soil moisture (a), but daily change in leaf water potential is most strongly
controlled
by vapor pressure
deficit (f). Lines indicate
aPage
significant
relationship
(Table S2).
WaterPotential_Aug_2012_edited:
Graph Builder
1 of 2
WaterPotential_Aug_2012_edited:
Graph Builder
Builder
WaterPotential_Aug_2012_edited:
Graph
Some
relationships may be non-linear, though non-linearities
were not assessed for the purposes
Graph Builder
Graph Builder
Builder
Graph
of this experiment.
DayWP_Mpa & 2 more vs. Soil Moisture
Predawn%leaf%water%poten;al%(MPa)%
AM_WP_Mpa
AM_WP_Mpa
0.0
(a)
-0.2
-0.4
-0.6
-1.0
(b)
-1.5
-2.0
-2.5
Daily%change%in%leaf%water%poten;al%
DayWP_Mpa
DayWP_Mpa
-0.2
-0.2
-0.4
-0.4
-0.6
-0.6
-1.0
-1.0
(e)
-1.5
-1.5
-2.0
-2.0
Page 2 of 2
-2.5
Graph Builder
Graph Builder
Daily%change%in%leaf%water%poten;al%
AM_WP_Mpa
AM_WP_Mpa
PM_WP_Mpa
PM_WP_Mpa
DayWP_Mpa
DayWP_Mpa
(d)
WaterPotential_Aug_2012_edited:
Graph Builder
-2.5 Page 2 of 2
WaterPotential_Aug_2012_edited: Graph Builder
(c)
-1.0
-1.5
-2.0
-2.5
-1.0
-1.0
(f)
-1.5
-1.5
-2.0
-2.0
-2.5
-2.5
4
6
8
10
12
Soil Moisture
14
Soil%Moisture%(%)%
Where(46 rows excluded)
30
31
32
33
16
Page 1
1 of
Page
of 2
2
DayWP_Mpa
DayWP_Mpa&&22more
morevs.
vs.24hourpredawnVPD
PredawntoMidday
AM_WP_Mpa
0.0
0.0
PM_WP_Mpa
Midday%leaf%water%poten;al%(MPa)%
PM_WP_Mpa
PM_WP_Mpa
PM_WP_Mpa
Midday%leaf%water%poten;al%(MPa)%
AM_WP_Mpa
Predawn%leaf%water%poten;al%(MPa)%
22
23
24
25
26
27
28
29
18
0.5
1.0
1.5
2.0
2.5
24hourMiddayVPD
3.0
3.5
Microclimate%VPD%(kPa)%
Where(46 rows excluded)
4
34
Figure S4. The effect of oak seedling size on the daily change in leaf water potential
35
experienced
by
oak
seedlings
across
theGraph
community
biomassPage
gradient.
The
effects
ofPage
(a)1oak
WaterPotential_Aug_2012_edited:
Graph
Page
Builder
of 2
WaterPotential_Aug_2012_edited:
Graph WaterPotential_Aug_2012_edited:
Builder
1 of 2
WaterPotential_Aug_2012_edited:
Graph Builder
Builder
Page 11 of
of 22
Graph Builder
Page 1 of 2
36WaterPotential_Aug_2012_edited:
seedling above ground
biomass (AGB), (b) average leaf area, and (c) number
of leaves on the
Graph Builder Graph Builder Graph Builder
37 Graph
dailyBuilder
change in leaf water potential experienced over the course of the day. The largest
38
individuals are displayed in red and black. The smallest individuals are displayed in green.
DayWP_Mpa
vs.
HerbTotalBiomass
DayWP_Mpa
vs. HerbTotalBiomass
DayWP_Mpa vs.
HerbTotalBiomass
vs.
HerbTotalBiomass
39
DayVPD
DayVPD
DayVPDvs. HerbTotalBiomass
DayVPD
DayWP_Mpa
0.00
0.00
0.00
0.00
AGB
DW 40
(g)
24 1.3545462
h Site VPD
1.07
1.24
1.47
1.55
2.57
1.3545462
1.4699871
1.5272656
1.975851
2.7754012
1.3545462
1.4699871
1.5272656
1.975851
2.7754012
1.4699871
1.5272656
1.975851
2.7754012
1.3545462
1.4699871
1.5272656
1.975851
2.7754012
0.50
0.50
0.50
0.50
DayVPD
0.00
0"
Daily Diff Leaf Water Potential
DayWP_Mpa
-0.5
-0.5
-0.5
1.3545462
-0.5
1.4699871
1.5272656
DayWP_Mpa
DayWP_Mpa
-1.5
-1.5
-1.5
-2.5
-3.0
Graph
-1.5
-2.0
-0.5 -200
Builder
1.3545462
-2.5
-2.5
-2.5
3.00
-2.0
3.50
DayWP_Mpa
DayWP_Mpa
vs. HerbTotalBiomass
DayWP_Mpa vs.
HerbTotalBiomass
DayWP_Mpa
vs.
HerbTotalBiomass
-2.5
(a)
-3.0
-3.0
1.3545462
1.4699871
1.3545462
-200
400 800 1200
-200
-0.5 -200
-0.5
Daily Diff Leaf Water Potential
DayWP_Mpa
-2.0
DayWP_Mpa
Graph
Builder
-1.0
Builder
Graph Builder Graph
GraphWaterPotential_Aug_2012_edited:
Builder
-2.0
-2.0
DayVPD
DayVPD
DayVPD
DayVPD
400
1200
400
800 1200
1200
800 1200
400 800
-200 400
400 800
-0.5 -200
HerbTotalBiomass
1.4699871
1.3545462
-3.0
Where(46
Where(46
rows excluded)
Where(46
rows excluded)
excluded)
Where(46
rows excluded)
-1.0
-1.0 rows
-1.0
-1.0
-200
400
1200
-200DayVPD
400 800
800 1200
HerbTotalBiomass
HerbTotalBiomass
1.5272656
-200
800 1200
-200 400
400 800
1200 -200
-200
HerbTotalBiomass
1.975851
DayWP_Mpa
-0.5
Graph
WaterPotential_Aug_2012_edited:
WaterPotential_Aug_2012_edited:
Builder
-200WaterPotential_Aug_2012_edited:
400 800 Graph
1200 Builder
-200
400 800
1200
-200 400Graph
800 Builder
1200 -200
-1.5
-1.5
-1.5
-1.5
HerbTotalBiomass
-1.0
DayWP_Mpa
0.0
1.975851
2.7754012
2.7754012
10.0
DayWP_Mpa
1.3545462
1.4699871
1.5272656
1.4699871 vs. HerbTotalBiomass
1.5272656
1.975851
1.5272656
1.975851
2.7754012
1.4699871
1.5272656
1.975851
-3.0
2
400 800 Page
1200 1 of
-200
Graph Builder Graph Builder Graph Builder
DayWP_Mpa
-2.0Where(46
-2.5
-3.0
rows excluded)
-2.0
-2.0
-1.5
-2.0
1.3545462
-2.5
-3.0
-3.0
-3.0
(b)
1.3545462
1.4699871
-2.0excluded)
Where(46 rows
-3.0
-200
-2.5
(c)
-3.0
400 800 1200
DayWP_Mpa
-200 -1.5
400 800 1200
-2.5
2.7754012
40.0 AveLeafArea
Page 11 of
of 22
Page
400
50.0 800 1200
80.0
DayVPD
1.975851
1.4699871
1.5272656
DayVPD
1.4699871
1.5272656
1.3545462
-3.0
400 800
800 1200
1200
-200 400
-200
HerbTotalBiomass
HerbTotalBiomass
DayVPD
1.975851
2.7754012
1.5272656
1.975851
-200 400
400 800
800 1200
1200
-200
HerbTotalBiomass
-200
-1.5 400 800 1200
-200
400 800 1200
HerbTotalBiomass
-200
400 800 1200
2.5
2.7754012
1.975851
2.7754012
7.1
-200
-200
400 800
800 1200
1200
400
11.7
-200
16.3 NumLeaves
20.8
-200 25.4
400 800 1200
30.0
DayWP_Mpa
-2.0
-2.5
-3.0
-200
400 800 1200
-200
400 800 1200
HerbTotalBiomass
Where(46 rows excluded)
Where(46 rows excluded)
Where(46 rows excluded)
-200
400 800
800 1200
1200
400
HerbTotalBiomass
-200
-200
400 800
800 1200
1200
400
HerbTotalBiomass
Total Herbaceous Biomass
-200
-200
400 800
800 1200
1200
400
3.00
3.50
DayWP_Mpa
0.0
10.0
0"
20.0
10"
30.0
20.0
40.0 AveLeafArea
40.020"
40.0
AveLeafArea
Page 1 of 2
WaterPotential_Aug_201
50.030"
50.0
30.0
50.0
60.040"
60.0
60.0
40.0 AveLeafArea
70.050"
70.0
70.0
50.0
80.060.0
80.0
80.0
60"
DayWP_Mpa
DayWP_Mpa
DayWP_Mpa
70.0
70"
2.5
2.5
2.5
80.0
80"
2.7754012
7.1
7.1
7.1
0.01200
400
20.0800
20.0
30.010.0
30.0
30.0
70.0
400 800
800 1200
1200
-200 400
400 800
800 1200
1200
400
-0.5 -200
HerbTotalBiomass
DayWP_Mpa
DayWP_Mpa
-2.0
400
400
800 1200
1200 -200
20.0800
60.0
-2.0
-1.0 rows
-1.0 rows excluded)
-1.0 rows excluded)
Where(46
rows excluded)
excluded)
Where(46
Where(46
Where(46
-1.5
2.7754012
DayWP_Mpa
Ave
LA (cm.2)
10.0
10.0
-2.5 vs.
DayWP_Mpa
DayWP_Mpa
HerbTotalBiomass
vs. HerbTotalBiomass
vs.DayWP_Mpa
HerbTotalBiomass
DayWP_Mpa
400 800 1200
-200
-0.5 -200
Daily Diff Leaf Water Potential
-0.5 -200
-2.5
-2.5
1.00
1.50
1.50
1.50
AGB_Aug27
AGB_Aug27
AGB_Aug27
AGB_Aug27
1.00
2.00
Page 1 of 22.00
Page
Page 1 of 22.00
Page 11 of
of 222.00
1.50
2.50
2.50
2.50
2.50
Page 1 of 2
AGB_Aug27
1.50
-1.0
-0.5
-1.0
-1.0
-1.0
WaterPotential_Aug_2012_edited:
Graph Builder
WaterPotential_Aug_2012_edited:
Graph
WaterPotential_Aug_2012_edited:
Graph Builder
WaterPotential_Aug_2012_edited:
Graph Builder
Builder
-1.5
0.50
0.5"
1.0"
1.5"
2.00
2.0"
3.00
3.00
3.50
3.50
2.50
2.5"
DayWP_Mpa
DayWP_Mpa
3.00
3.0"
3.5"
0.03.50
0.0
1.00
1.00
1.00
2.7754012
1.975851
-200
Num.
Leaves
DayWP_Mpa
2" 2.5 11.7
16.3 NumLeaves
20.87" 7.1
20.8
20.8
25.412"
25.4
25.4
11.7
30.0
30.0
30.0
16"
16.3 NumLeaves
DayWP_Mpa
DayWP_Mpa
DayWP_Mpa
21"
20.8
25"
25.4
30"
30.0
400 800 1200
400
11.7 800 1200
11.7
16.3NumLeaves
NumLeaves
16.3
DayWP_Mpa
5
41
42
43
44
Table S1. Effects of DOY and environmental conditions on soil moisture (%). The relationship
between day of year, daily VPD, and herbaceous biomass on soil moisture in all of the plots
where we measured leaf water potential on the five days when we measured leaf water potential.
Fixed Effect
Date (DOY)
Site VPD
Herb Biomass
Date x Site VPD
Date x Herb Biomass
Site VPD x Herb Biomass
45
46
d.f.†
F
P
1, 167
1, 167
1, 167
1, 167
1, 167
1, 167
145.2
22.79
8.33
5.47
7.63
1.29
<0.0001*
<0.0001*
0.004*
0.02*
0006*
0.26
6
47
48
49
50
51
52
Table S2. The effects of plot-level soil moisture and microclimate (VPD) on predawn, midday,
and daily diff in leaf water potential. The relationship between soil moisture and vapor pressure
deficit, on leaf water potential. Predawn leaf water potential is most strongly controlled by soil
moisture and midday leaf water potential is controlled by both soil moisture and vapor pressure
deficit. Daily changes were controlled by VPD.
Predawn
53
54
55
56
57
Fixed
Effect
Soil
Moisture
Microclima
te VPD
Midday
Diff
d.f.†
F
P
d.f.
F
P
d.f.
F
P
1, 142
49.6
<0.0001*
1, 127
10.6
0.001*
1, 122
0.62
0.43
1, 109
2.85
0.09
1, 85
5.78
0.02*
1, 79
5.21
0.03*
† These analyses took into account spatial variation associated with the blocked design (“Block”
in the BioCON framework) and measurements taken on individuals in the same plots over time
(plot nested in block).
7
58
59
60
61
62
63
64
65
66
67
68
Appendix S1. Analyses repeated using species richness of plots (instead of herbaceous
biomass).
We conducted all analyses included in the main text, but modified to assess the direct effects of
species richness (not biomass) on microclimate, soil moisture, and oak leaf water potential.
These results are qualitatively identical to herbaceous biomass results.
S1. Table 1. Separate ANOVA’s for the effects of species richness and interactions with daily
temperature on microclimate temperature, daily RH on microclimate RH, and daily VPD on
microclimate VPD.
Plot Temp
Fixed Effect
d.f.†
R2
F
P
Species Rich
0.98
46.76
<0.0001*
577337
<0.0001*
Sp Rich x
Daily Temp
1, 74
1,
13451
1,
13461
795.7
<0.0001*
Species Rich
1, 74
0.88
Daily Temp
Daily VPD
Sp Rich x
Daily VPD
69
70
71
72
73
1,
13045
1,
13051
Plot VPD
F
P
46.76
<0.0001*
78302
<0.0001*
1508
<0.0001*
† This analysis took into account spatial variation associated with the blocked design (“Block” in
the BioCON framework). In the linear mixed effects model framework, denominator degrees of
freedom “float” based on the degree of variation attributed to random effects.
8
74
75
76
77
S1. Table 2. The relationship between day of year, daily VPD, and species richness on soil
moisture in all of the plots where we measured leaf water potential on the five days when we
measured leaf water potential.
Fixed Effect
Date (DOY)
Daily VPD
Species Rich
Date x Daily VPD
Date x Sp Rich
Daily VPD x Sp Rich
78
79
80
81
82
83
d.f.†
F
P
1, 167
1, 167
1, 167
1, 167
1, 167
1, 167
145.8
22.1
10.8
6.07
4.47
0.22
<0.0001*
<0.0001*
0.001*
0.02*
0.04*
0.64
S1. Table 3. The relationship between daily average VPD, and species richness on oak leaf
water potential. We conducted separate analyses for predawn, midday and daily changes (diff).
Predawn
Fixed
Effect
Species
Rich
Site VPD
Species
Rich x
Site VPD
84
85
86
87
88
89
90
Midday
Diff
d.f.†
F
P
d.f.
F
P
d.f.
F
P
1, 18
7.34
0.01*
1, 31
0.00
0.95
1, 28
1.75
0.20
1, 162
2.20
0.14
1, 162
31.7
<0.0001*
1, 159
15.7
0.0001*
1, 163
0.65
0.42
1, 160
0.09
0.76
1, 162
5.92
0.02*
† These analyses took into account spatial variation associated with the blocked design (“Block”
in the BioCON framework) and measurements taken on individuals in the same plots over time.
In the linear mixed effects model framework, denominator degrees of freedom “float” based on
the degree of variation attributed to block differences, this is why denominator degrees of
freedom are different depending on the metric described in this table.


© Copyright 2026