
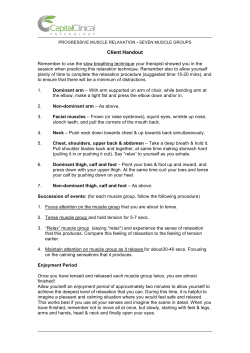
Text (Open Access) - CentAUR
Symmorphosis through dietary regulation:
a combinatorial role for proteolysis,
autophagy and protein synthesis in
normalising muscle metabolism and
function of hypertrophic mice after acute
starvation
Article
Published Version
Creative Commons: Attribution 4.0 (CC-BY)
Open Access
Musaro, A., Collins-Hooper, H., Sartori, R., Giallourou, N.,
Matsakas, A., Mitchell, R., Mararenkova, H., Flasskamp, H.,
Macharia, R., Ray, S., Swann, J. R., Sandri, M. and Patel, K.
(2015) Symmorphosis through dietary regulation: a
combinatorial role for proteolysis, autophagy and protein
synthesis in normalising muscle metabolism and function of
hypertrophic mice after acute starvation. PLoS ONE, 10 (3).
e0120524. ISSN 1932-6203 doi: 10.1371/journal.pone.0120524
Available at http://centaur.reading.ac.uk/40184/
It is advisable to refer to the publisher’s version if you intend to cite from the
work.
Published version at: http://dx.doi.org/10.1371/journal.pone.0120524
To link to this article DOI: http://dx.doi.org/10.1371/journal.pone.0120524
Publisher: Public Library of Science
All outputs in CentAUR are protected by Intellectual Property Rights law,
including copyright law. Copyright and IPR is retained by the creators or other
copyright holders. Terms and conditions for use of this material are defined in
the End User Agreement .
www.reading.ac.uk/centaur
CentAUR
Central Archive at the University of Reading
Reading’s research outputs online
RESEARCH ARTICLE
Symmorphosis through Dietary Regulation: A
Combinatorial Role for Proteolysis,
Autophagy and Protein Synthesis in
Normalising Muscle Metabolism and
Function of Hypertrophic Mice after Acute
Starvation
Henry Collins-Hooper1☯‡, Roberta Sartori2☯‡, Natasa Giallourou3, Antonios Matsakas4,
Robert Mitchell1, Helen Mararenkova5, Hannah Flasskamp1, Raymond Macharia6,
Steve Ray7, Jonathan R. Swann3, Marco Sandri2, Ketan Patel1*
OPEN ACCESS
Citation: Collins-Hooper H, Sartori R, Giallourou N,
Matsakas A, Mitchell R, Mararenkova H, et al. (2015)
Symmorphosis through Dietary Regulation: A
Combinatorial Role for Proteolysis, Autophagy and
Protein Synthesis in Normalising Muscle Metabolism
and Function of Hypertrophic Mice after Acute
Starvation. PLoS ONE 10(3): e0120524. doi:10.1371/
journal.pone.0120524
Academic Editor: Antonio Musaro, University of
Rome La Sapienza, ITALY
Received: April 29, 2014
Accepted: February 5, 2015
Published: March 25, 2015
Copyright: © 2015 Collins-Hooper et al. This is an
open access article distributed under the terms of the
Creative Commons Attribution License, which permits
unrestricted use, distribution, and reproduction in any
medium, provided the original author and source are
credited.
Data Availability Statement: All relevant data are
within the paper and its Supporting Information files.
Funding: This work was supported by BBSRC (BB/
I015787/1, BBJ0164541). The funder had no role in
study design, data collection and analysis, decision to
publish, or preparation of the manuscript.
Competing Interests: One participating member of
our team who conducted this work (Dr. Steve Ray) is
employed by a commercial company—Natural
1 School of Biological Sciences, University of Reading, Whiteknights campus, Reading, United Kingdom,
2 Venetian Institute of Molecular Medicine, University of Padova, Padova, Italy, 3 Department of Food and
Nutritional Sciences, School of Chemistry, Food and Pharmacy, University of Reading, Whiteknights
campus, Reading, United Kingdom, 4 Centre for Cardiovascular and Metabolic Research, Hull York Medical
School, Hull/York, United Kingdom, 5 Department of Cell and Molecular Biology, The Scripps Research
Institute, La Jolla, California, United States of America, 6 Veterinary Basic Sciences, Royal Veterinary
College, London, United Kingdom, 7 Natural Biosciences, University of Reading, Whiteknights campus,
Reading, United Kingdom
☯ These authors contributed equally to this work.
‡ These authors are co-first authors on this work.
* [email protected]
Abstract
Animals are imbued with adaptive mechanisms spanning from the tissue/organ to the cellular scale which insure that processes of homeostasis are preserved in the landscape of size
change. However we and others have postulated that the degree of adaptation is limited
and that once outside the normal levels of size fluctuations, cells and tissues function in an
aberant manner. In this study we examine the function of muscle in the myostatin null
mouse which is an excellent model for hypertrophy beyond levels of normal growth and consequeces of acute starvation to restore mass. We show that muscle growth is sustained
through protein synthesis driven by Serum/Glucocorticoid Kinase 1 (SGK1) rather than
Akt1. Furthermore our metabonomic profiling of hypertrophic muscle shows that carbon
from nutrient sources is being channelled for the production of biomass rather than ATP production. However the muscle displays elevated levels of autophagy and decreased levels
of muscle tension. We demonstrate the myostatin null muscle is acutely sensitive to
changes in diet and activates both the proteolytic and autophagy programmes and shutting
down protein synthesis more extensively than is the case for wild-types. Poignantly we
show that acute starvation which is detrimental to wild-type animals is beneficial in terms of
PLOS ONE | DOI:10.1371/journal.pone.0120524 March 25, 2015
1 / 22
Mechanisms Limiting of Muscle Growth
BioSciences. The authors declare that there is no
conflict of interest, financial implications or other
issues relating to employment, consultancy, patents,
products in development or marketed products with
this arrangement. Working with Dr. Ray does not alter
the authors' adherence to PLOS ONE policies on
sharing data and materials.
metabolism and muscle function in the myostatin null mice by normalising tension
production.
Introduction
Starvation has plagued man from our prehistoric dawn leaving a mark on both the human psyche and genome undoubtedly due to its regularity and its devastating consequences. The most
overwhelming loss of life due to starvation in modern times occurred about 50 years ago during
the Great Leap Forward programme of social engineering in China with the death of 30 million
people [1]. However the incidence of starvation is not confined to times of social instability or
restricted to developing countries. There is a vast body of data that shows the prevalence of
malnutrition and starvation in the general communities of Europe and USA especially amongst
the venerable and aged populations [2].
The concept of ‘lethal weight loss’- the critical level of weight loss beyond which death becomes unavoidable has been explored by zoologists and physicians for almost two centuries.
Some invertebrates can lose as much as 95% of their normal weight prior to death whereas in
humans this figure is closer to 50% [3]. Importantly especially for Western societies, the lethal
weight loss limit declines with age. However it is believed that lethal weight loss can be extended by increasing fat content and there are exceptional cases where obese individuals have maintained normal activity whilst undertaking a full-fasting regime for over 200 days [4]. Therefore
in this scenario high levels of adiposity confer benefit. This seems to contradict the extensive
volume of evidence supporting the belief that obesity is a negative health indicator for a number of conditions including diabetes, hypertension and stroke [5]. The resolution to the paradox was proposed by Neel in the Thrifty Gene Hypothesis (TGH) which proffers the idea that
in the pre-modern times, when food shortages were extremely frequent, it was necessary to deposit fat to safeguard against starvation but that the same trait has become disadvantageous
during modern times when food is plentiful in certain societies [6].
The degree of adaptation to stimuli is normally limited to a range very close to its normal
size and composition. Such limitations are thought to be a universal feature of all normal tissues. This notion is incorporated in a process called symmorphosis which proposes that a biological design will be optimised such that structure is commensurate to normal function [7].
However tissues are not intended to respond to non-physiological parameters since this would
incur costs in terms of development and maintenance. Symmorphosis is essentially an engineering principle, in which unnecessary spare capacity is eliminated and is a feature not only of
biological processes but also everyday objects e.g. kitchen knives are manufactured to cut food
not wood. The concept of symmorphosis is often difficult to test in a biological system as nonphysiological adaptations frequently result in changes to multiple parameters [8]. However this
hurdle has been overcome in a few genetic models that affect only one major tissue.
One classical adaptive process is undertaken by an organism during periods of starvation
when the body fuels essential organs, especially the brain by drawing on the fat and muscle
(with preference for the former over the latter). There is very good evidence both in rodents
and humans that increasing levels of fat act to decrease the mobilisation of muscle protein as a
source for fuel during starvation [9, 10]. Therefore the body reacts to starvation by protecting
the muscle at the expense of fat, presumably because it confers survival advantage.
High organism protein content has always been depicted as a desirable status since it supports cellular function associated with immune system (e.g. white blood cells production of
PLOS ONE | DOI:10.1371/journal.pone.0120524 March 25, 2015
2 / 22
Mechanisms Limiting of Muscle Growth
thymus and bone marrow), nutrient absorption, tissue repair and sexual processes (cellular,
hormonal and psychological). Whilst this is substantiated by a wealth of data, it is imperative
to recognise this concept only applies when muscle hypertrophies by relatively small levels
above the norm, regulated by symmorphosis. This point is clearly exemplified through the numerous studies on the myostatin null mouse. Muscle enlargement takes place by both an increase in fibre number during embryonic development (hyperplasia) as well as pre and post
natal fibre enlargement (hypertrophy) [11, 12]. Following germ-line deletion of myostatin, the
mass of individual skeletal muscles can increase by 200% and accompanied by a near total loss
in body fat. However a number of studies have shown that the hypertrophic muscle of myostatin null mice has impaired force production characteristics and that mutant animals have
lower exercise capacity [13–16]. The decrease in specific force (tension divided by mass) is indicative of aberrant muscle physiology a feature that is also displayed during the ageing process
and in myopathies [17].
In this study we examined the consequence of acute starvation in the myostatin null mouse.
We show that the untreated (i.e. under ad libitum rodent diet) hypertrophic muscle had a metabolic profile indicative of glycolytic based energy production programme, conducive to tissue
growth and elevated baseline levels of a novel signalling pathway that supports protein synthesis revolving around Serum/Glucocorticoid Kinase 1 (SGK1) and that the levels of Akt, the canonical regulator of protein synthesis are actually lower in the myostatin null mouse.
Surprisingly we also found evidence of increased levels of autophagy in resting muscle of the
myostatin null mouse. We show that starvation leads to similar levels of body mass loss in both
the wild type and mutant genotypes but that weight loss originates from differing tissues. In
the myostatin null we show elevated loss of muscle compared to wild-types and that this occurs
through a unique combination of decreased protein synthesis as well as through autophagy
and proteosome mediated peptide breakdown. Significantly we show that these changes result
in the normalisation of myostatin muscle metabolism and function.
Materials and Methods
Ethical approval
All research conducted on animals was performed under license from the United Kingdom
Home Office in agreement with the Animals (Scientific Procedures) Act 1986.
Animal maintenance
Mstn−/− mice were a kind gift from Se-Jin Lee (John’s Hopkins USA). Healthy male C57Bl/6
and Mstn−/− mice were bred and maintained according to the NIH Guide for Care and Use of
Laboratory animals, approved by the University of Reading Animals were housed in the Biological Resource Unit under standard environmental conditions (20–22°C, 12h–12h light–dark
cycle) and provided food and water ad libitum. All mice were of 4 months of age at the commencement of the starvation diet.
Starvation protocol
Mice were moved from normal cages to ones containing a water source as well as copious inedible bedding material to mitigate any effects of hypothermia. Animals were monitored every 6
hours and maintained under starvation conditions for a maximum of 24h.
PLOS ONE | DOI:10.1371/journal.pone.0120524 March 25, 2015
3 / 22
Mechanisms Limiting of Muscle Growth
Puromycin administration
Mice were injected exactly 30 minutes before tissue collection with 0.04 μmol/g body mass puromycin into the peritoneal cavity and then returned to their cages.
Histological analysis and Immunohistochemistry
Mice were euthanized according to Schedule 1 of the Animals Scientific Procedures Act (UK).
All tissue was kept moist with PBS during the muscle dissection process which following resection was immediately frozen in liquid nitrogen-cooled isopentane. Muscles were thereafter
mounted in Tissue Tech freezing medium (Jung) cooled by dry ice/ethanol. Immunocytochemistry was performed on 10 μm cryosections which were dried for 30 minutes before the application of block wash buffer (PBS with 5% foetal calf serum (v/v), 0.05% Triton X-100). All
antibodies were diluted in wash buffer 30 minutes before use. Myosin Heavy Chain (MHC)
type I, IIA and IIB isoforms were identified by using A4.840 IgM (1:1 dilution), A4.74 IgG (1:4
dilution) and BF-F3 IgM (1:1 dilution) supernatant monoclonal primary antibodies (Developmental Studies Hybridoma Bank). Antibodies against SGK, pSGK1 (Cell Signalling), puromycin (Millipore) and p62 were used at concentrations of 1:500, 1:500, 1:5000 and 1:1000 for
respectively. Primary antibodies were visualized using Alexa Fluor 488 goat anti-mouse IgG
(Molecular Probes A11029, 1:200) and Alexa Fluor 633 goat anti-mouse IgM (Molecular
Probes A21046, 1:200) secondary antibodies.
SDH staining
Muscle sections were briefly incubated for 30 minutes at 37°C in a sodium phosphate buffer
containing 75mM sodium succinate (Sigma), 1.1mM nitroblue tetrazolium (Sigma) and
1.03mM phenazine methosulphate (Sigma). Samples were then fixed in 10% formol-calcium
and cleared in xylene prior to mounting with DPX mounting medium (Fisher). Photographic
quantification of the samples was performed on a Zeiss Axioskop2 microscope mounted with
an Axiocam HRc camera. Axiovision Rel. 4.8 software was used to capture the images.
Quantitative RT PCR
Total RNA from the TA was prepared using Promega SV Total RNA Isolation kit from which
cDNA was synthesised using Invitrogen SuperScript III Reverse Transcriptase. Primer Express
3.0 (Applied Biosystems) was used to design PCR primers (Table 1 in S1 Dataset) which were
used together with the Qiagen QuantiTect SYBR Green PCR Kit for quantitative RT-PCR
(qRT PCR). All data were normalized to GAPDH expression.
Western blotting
Muscle proteins were solubilised in lysis buffer (40 mmol Tris pH 7.5, 1 mmol EDTA, 5 mmol
EGTA, 0.5% Triton X100 and protease inhibitors (Calbiochem 539131)). For qualitative analysis, 20 μg of protein was resolved on a 4–12% SDS PAGE before transferring to a PVDF membrane. Quantification of total puromycin incorporation into polypeptides was performed using
a slot blotter by immobilising 6 μg of total solubilised muscle protein.
Membranes were probed for puromycin (mouse anti-puromycin ab 1:1000, Millipore
MABE343), SGK1 pSGK1(rabbit anti SGK ab 1:2500, rabbit anti pSGK ab 1:2500 Cell Signalling 3272) followed by incubation with Horseradish peroxidase-conjugated goat anti-mouse or
goat anti-rabbit secondary antibodies (R&D Systems). Visualization of the proteins were carried out by using enhanced chemiluminescence (ECL, GE Healthcare RPN3000OL1) and
bands quantified by laser densitometry using Gel-Pro Analyzer 6.0 software.
PLOS ONE | DOI:10.1371/journal.pone.0120524 March 25, 2015
4 / 22
Mechanisms Limiting of Muscle Growth
Muscle tension measurements
Dissection of the hind limb was carried out under oxygenated Krebs solution (95% O2 and 5%
CO2). Under circulating oxygenated Krebs solution one end of a silk suture was attached to the
distal tendon of the EDL and the other to a Grass Telefactor force transducer (FT03). The proximal tendon remained attached to the tibial bone. The leg was pinned to a Sylgard-coated experimental chamber. Two silver electrodes were positioned longitudinally on either side of the
EDL. A constant voltage stimulator (S48, Grass Telefactor) was used to directly stimulate the
EDL which was stretched to attain the optimal muscle length to produced maximum twitch
tension (Pt). Tetanic contractions were provoked by stimulus trains of 500 ms duration at, 10,
20, 50, 100 and 200 Hz. The maximum tetanic tension (Po) was determined from the plateau of
the frequency-tension curve.
1
H NMR spectroscopy-based metabonomic analysis
Polar metabolites were extracted from gastrocnemius muscle using the protocol previously described by Beckonert et al. [18]. Briefly, 40–50 mg of muscle tissue was snap frozen in liquid nitrogen and finely ground before further homogenization in 300μL of chloroform:methanol
(2:1) using a tissue lyzer. The homogenate was combined with 300μL of water, vortexed and
spun (13,000 g for 10 minutes) to separate the aqueous (upper) and organic (lower) phases. A
vacuum concentrator (SpeedVac) was used to remove the water from the aqueous phase before
reconstitution in 550 μL of phosphate buffer (pH 7.4) in 100% D2O containing 1 mM of the internal standard, 3-(trimethylsilyl)-[2,2,3,3,-2H4]-propionic acid (TSP). For each sample, a standard one-dimensional NMR spectrum was acquired with water peak suppression using a
standard pulse sequence (recycle delay (RD)-90°-t1–90°-tm-90°-acquire free induction decay
(FID)). RD was set as 2 s, the 90° pulse length was 16.98 μs, and the mixing time (tm) was 0.01
ss. For each spectrum, 8 dummy scans were followed by 128 scans with an acquisition time per
scan of 3.8 s and collected in 64K data points with a spectral width of 12.001 ppm. 1H NMR
spectra were manually corrected for phase and baseline distortions and referenced to the TSP
singlet at δ 0.0. Spectra were digitized using an in-house MATLAB (version R2009b, The Mathworks, Inc.; Natwick, MA) script. To minimize baseline distortions arising from imperfect
water saturation the region containing the water resonance was excised from the spectra. Principal components analysis (PCA) was performed with Pareto scaling in MATLAB using scripts
provided by Korrigan Sciences Ltd, UK.
Cross-sectional area measurements
Immunofluorescent stained muscle sections were photographed under a 10X lens on a Zeiss
Axioimager A1 microscope using a Zeiss Axiocam camera. Three different photographs were
taken at random on three different sections per muscle per animal. The interactive measurements tool in the Axiovision Rel 4.8 software was then used to process the images to measure
cross-sectional area. All muscle fibres per fibre type were measured per field of view of the photographs taken (approximately 200 in total).
Statistical analysis
Data are presented as mean ± SD. Significant differences on body weight between groups was
determined using multivariate analysis of variance (MANOVA) followed by Bonferroni’s posthoc test with repeated measurements with time. Wherever applicable, comparisons between
two groups were performed by Student’s t-test for independent variables. Differences among
PLOS ONE | DOI:10.1371/journal.pone.0120524 March 25, 2015
5 / 22
Mechanisms Limiting of Muscle Growth
groups were analysed by one-way ANOVA followed by Bonferroni’s multiple comparison
tests. Differences were considered statistically significant at p<0.05.
Results
Starvation reduces body mass and skeletal muscle mass
To explore the effect of acute dietary withdrawal on hypertrophic muscled mice, all food was
withheld for a maximum period of 24 hours. As expected at the commencement of the experiment, the Mstn−/− animals were heavier than age and sex matched wild-type mice. Both cohorts
lost the same relative mass at 12 and 24 hours of food-deprivation (Fig 1A–1B and Table 2a in
S1 Dataset). We then examined the contribution of skeletal muscle to body mass loss. To develop a comprehensive picture for the effect of starvation on muscle mass the weights of the Soleus,
Fig 1. Changes in body mass in wild-type (WT) and Mstn−/− (Mstn) at 12 and 24 hours after complete food withdrawal (acute starvation). (A) Wildtype mice showed a significant decrease after 24h starvation. In contrast Mstn−/− lost mass in the first and second 12h of starvation. (B) Changes in body
weight expressed as a % of normal body weight. Weight changes of (C) EDL, (D) soleus, (E) TA and (F) Gastrocnemius at 12 and 24h after acute starvation.
Wild-type animals showed no significant muscle mass reduction in contrast to all muscles examined from Mstn−/−. (Two-way ANOVA; *p<0.05)
doi:10.1371/journal.pone.0120524.g001
PLOS ONE | DOI:10.1371/journal.pone.0120524 March 25, 2015
6 / 22
Mechanisms Limiting of Muscle Growth
Tibialis Anterior (TA), Extensor Digitoum Longus (EDL) and Gastrocnemius were taken which
revealed a clear difference between the genotypes. Wild-type animals displayed a small decrease
in mass after 12h ranging from 1–6% across the muscles examined that failed to reach significance (Fig 1C–1F and Table 2b in S1 Dataset). In contrast the Mstn−/− had lost up to 18% muscle mass. During the second 12h period, wild-type muscle mass decreased by a maximum of 9%.
However, even at this stage the decrease in wild-type muscle weights did not reach significance.
In contrast the degree of muscle mass loss in the Mstn−/− cohort was significantly higher for all
muscles examined. Therefore the Mstn−/− mice lose muscle not only earlier but also for
prolonged periods.
Starvation induced muscle fibre hypotrophy
Having shown genotypes a differential response to starvation in terms of muscle loss we next
investigated the contribution of specific fibre types in this process. It is worth bearing in mind
that Mstn−/− deletion causes a shift from slow myosin to fast isoforms. To that end we profiled
fibre number and fibre type cross sectional area for the EDL, Soleus and TA. There was no
change in total muscle fibre number or change in fibre type proportions after a 24-hour period
of starvation in any of the muscles form either genotype in any muscles examined (data not
shown).
Examination of EDL fibre CSA revealed hypertrophy in all MHC types (IIA, IIX and IIB) in
normal diet fed Mstn−/−. Starvation for a period of 24h resulted in a significant decrease in all
three fibre types irrespective of genotype (Fig 2A–2C and Table 3a in S1 Dataset). However
there was a smaller decrease in the CSA for each specific fibre-type in the wild-types (-10% IIA,
-21% IIX, -11%IIB) compared to Mstn−/− (-22% IIA, -37% IIX, -27%IIB). The most prominent
result from the analysis of the EDL was the change in the size of the IIB fibres in the Mstn−/− following 24h starvation. These fibres decreased in size to such an extent that they were no longer
significantly different in size compared to those from starved wild-type animals.
The soleus displayed an interesting feature not seen in the EDL. Here it is only those fibres
that have undergone hypertrophy as a consequence of myostatin deletion that decreased in size
(-21% I, -27% IIA, -31% IIB see Fig 2D–2G and Table 3b in S1 Dataset). The most prominent
muscle fibre types in the wild-type (I and IIA) did not show any significant decrease in size. Of
note was the finding that the type IIX fibres (which are of the same size in both genotypes) underwent a significant starvation-mediated hypotrophy (-19%) only in the wild-type mice.
Examination of the TA (the muscle with the least difference in the mass decrease after starvation) showed a significant decrease in CSA in both the IIA and IIX fibres in both genotypes
and the IIB of the Mstn−/− (Fig 2H–2J and Table 3c in S1 Dataset). The major difference in
terms of fibre type decrease to explain the mass loss was the 17% change in numerous type IIB
fibres in the Mstn−/− compared to the 8% loss in the wild-types.
Next we examined the muscle for changes in metabolic properties induced by starvation by
quantifying the number of fibres expressing SDH. As expected the fed wild-type EDL contained a significantly greater proportion of SDH expressing fibres than the fed Mstn−/− (46%
vs. 36% respectively, Fig 2K and Table 3d in S1 Dataset). After 24h of starvation there was significant decrease in the number of SDH positive fibres in both groups. However the decrease
was greater in the wild-types compared to the Mstn−/− (-32% v 22% respectively) such that
there was no longer a statistical difference in the number of SDH positive fibres after starvation.
There was no change in the profile of oxidative versus non-oxidative fibres in the soleus (Fig
2N). We next examined if there was a relationship between metabolic activity and atrophy in
the two genotypes. Here we found that in the EDL wild-type, SDH negative fibres decreased in
size after starvation while there was no change in SDH positive fibres. The EDL muscle of the
PLOS ONE | DOI:10.1371/journal.pone.0120524 March 25, 2015
7 / 22
Mechanisms Limiting of Muscle Growth
Fig 2. Fibre type profiling after acute starvation. MHC fibre cross sectional area of Wild-type and Mstn−/− EDL (A-C), Soleus (D-G) and Tibialis Anterior
(TA) (H-J) before and 24h after starvation of wild-type and Mstn−/− mice. (K) Percentage of SDH positive (oxidative) and SDH negative fibres from the EDL of
wild-type and Mstn−/− mice. (L) Changes in fibre diameter of SDH negative fibres of the EDL in wild-type and Mstn−/− mice before and after starvation. (M)
Changes in fibre diameter of SDH positive fibres of the EDL in wild-type and Mstn mice before and after starvation. (N) Percentage of SDH positive
(oxidative) and SDH negative fibres from the Soleus of wild-type and Mstn−/− mice. (O) Changes in fibre diameter of SDH negative fibres of the soleus in wildtype and Mstn−/− mice before and after starvation. (P) Changes in fibre diameter of SDH positive fibres of the soleus in wild-type and Mstn mice before and
after starvation. (Two-way ANOVA; *p<0.05).
doi:10.1371/journal.pone.0120524.g002
Mstn−/− however showed a significant decrease in both populations but with a greater reduction in CSA of the SDH negative fibres (Fig 2L–2M). In the soleus, there was no change in the
CSA of SDH+ or SDH− fibres in wild-type after starvation, whereas we found a decrease only in
the SDH− fibres of Mstn−/− (Fig 2O and 2P). This suggests that glycolytic (i.e. non-oxidative) fibres were more susceptible in losing CSA after acute starvation.
PLOS ONE | DOI:10.1371/journal.pone.0120524 March 25, 2015
8 / 22
Mechanisms Limiting of Muscle Growth
Molecular profiling of key determinants of proteolysis and autophagy
after starvation
Muscle mass is regulated by mechanisms that control protein breakdown and protein synthesis.
To gain an insight into the mechanisms that control muscle loss in our hypertrophic model we
first examined the expression of FoxO1 a master regulator that activates catabolism through
proteolysis and autophagy. We found that starvation induced FoxO1 in both genotypes. However there was a profound difference in the nature of the increase both in terms of degree and time
(Fig 3A). Firstly, FoxO1 was more robustly increased in the Mstn−/− after 12h compared to wildtype. Secondly whereas there was no subsequent increase in the level of FoxO1 in the second
12h of starvation in wild-type mice, there was a significant increase in the Mstn−/− mice.
We next investigated the expression of key regulators of proteolysis by quantifying the expression of MuRF1 and Atrogin, which encode for E3 ubiquitin ligases [19]. Their expression
was significantly increased in both genotypes after the first 12h of starvation (Fig 3B–3C).
However in the next 12h, the levels of both genes remained stable in the wild-type but increased significantly in the Mstn−/−. Therefore there is a more robust and prolonged induction
of genes that regulate protein breakdown through the proteosome in the Mstn−/− animals.
Next we examined the expression of genes that control protein breakdown through autophagy. To that end we quantified the levels of Bnip3 (inducer of autophagy), Beclin (which promotes the development of the autophagosome, the double membrane vacuole that develops
around structures targeted for breakdown), LC3b (a protein that controls the development of
the membrane component of the autophagosome through its ability to undergo lipidation with
Phosphatidylethanolamine), ATF4 (a cysteine protease responsible for cleaving LC3 at its Cterminal arginine residue facilitating the exposed C-terminal glycine to be conjugated to
Phosphatidylethanolamine), cathepsin L (a key lyosomal cysteine endopepdidase required for
the degradation of autophagosomal content), Vsp34 (a class III phosphoinositide-3-kinase
(PI3K), assembles into multi-protein complexes that include Beclin1), p62 (a receptor for cargo
destined to be degraded by autophagy) Gadd34 (a protein phosphatase 1 regulatory subunit
that induces autophagy by supressing the mTOR pathway [20]. In wild-type animals, starvation for 12h resulted in an induction of 6 of the 8 autophagy genes (all except Beclin and
Vsp34) (Fig 3D–3K). During the same period all genes except Beclin were induced in the muscle from Mstn−/− animals. During the second 12 hours of starvation there was an increase in
the expression of only 4 of the 8 genes (p62, Bnip, Cathepsin L and Vsp34) in the wild-type
muscle compared to increases in all but two of eight in the muscle from Mstn−/− animals. In
terms of quantity, at 12h there was greater expression of only Gadd34 in the Mstn−/− muscle
compared to wild-type muscle. However by 24h the situation had changed markedly with 5
genes being more highly expressed in Mstn−/− muscle compared to wild-type (Gadd34, Lc3b,
p62, ATF4 and Vps34).Therefore in a manner similar to the proteolysis regulators, the expression of autophagy mediators is both enhanced and sustained longer in muscle from Mstn−/−
animals compared to wild-type after starvation.
We extended these studies by investigating the expression of key markers of autophagy at
the protein level since post-translational modification plays a major role in this catabolic process. One of the key indicators of autophagy is the lipidation of LC3 which is generated during
the formation of the autophagosome and is a read-out of autophagic activity. Although LC3
was present in the non-starved muscle of both genotypes, there was a major difference in the
abundance of the lipidated form; it was scarce in wild-type muscle but present in significant
amounts in Mstn−/− muscle (Fig 3M and 3O). These results show that basal levels of autophagy
are higher in the Mstn−/− compared to wild-type muscle. A similar pattern was detected for
p62 (quantification shown in Table 4a in S1 Dataset). Starvation in the first 12 hours induces
PLOS ONE | DOI:10.1371/journal.pone.0120524 March 25, 2015
9 / 22
Mechanisms Limiting of Muscle Growth
Fig 3. Molecular and protein analysis of the Tibialis Anterior (TA) for catabolic and anabolic markers in response to acute starvation. (A) qPCR
analysis of changes in the expression of master regulator of catabolism, Foxo1. (B-C) E3 class of ubiquitin ligases, MuRF1 and atrogin. Regulators of
autophagy (D) Bnip3, (E) Beclin, ((F) LC3b, (G) ATF4, (H) CathepsinL (I) Vsp34 (J) p62, (K) Gadd34. (L) mRNA expression of Mul1 a mitophagy regulator. All
qPCR levels normalised to levels of G6PDH. (M) Quantification of LC3-II in relation to LC3 at protein level. (N) Quantification of pAkt at residue S473 in
relation total Akt at protein level. (O) Western blot analysis of regulators of autophagy (LC3 and p62), and protein synthesis (Akt-total and phosphorylated
versions at S473 and T308, 4ebp1 and S6) with tubulin serving as loading control. (Two-way ANOVA; *p<0.05).
doi:10.1371/journal.pone.0120524.g003
similar levels of LC3-II in both genotypes. LC3-II levels continued to increase relative to LC3-I
in wild-types during the second 12h period of starvation. Interestingly the ratio does not show
a similar increase in the second 24h in the Mstn−/− even though the LC3-II expression is greatly
PLOS ONE | DOI:10.1371/journal.pone.0120524 March 25, 2015
10 / 22
Mechanisms Limiting of Muscle Growth
increased. This could be due to increased expression of LC3 as shown by RT-PCR (Fig 3F and
Table 4b in S1 Dataset).
We also examined the expression of Mul1, a gene that encodes a master regulator of mitophagy [21]. Here we found an increase in gene expression only wild-type muscle after a period
of 24h and not a significant change in that of Mstn−/− tissue at any time point (Fig 3L and
Table 4c in S1 Dataset).
The effect of starvation on key regulators of protein synthesis
Akt a serine/threonine-specific protein kinase (also known a Protein kinase B) is a nodal molecule in muscle homeostasis as regulates both anabolic and catabolic processes. Akt levels normally suppress both autophagy and ubiquitin mediated protein breakdown by supressing
FoxO1 (Table 5a in S1 Dataset). Our molecular profiling data showed that FoxO1 was robustly
induced in the muscle of Mstn−/− mice with the concomitant increase in key indices of autophagy and ubiquitin proteolysis. We profiled the abundance of the active form of Akt (phosphorylated version at residues S473 or T308) and found that in the wild-type muscle, levels of
pAkt fell in significant incremental stages during the starvation protocol. Surprisingly, there
was no significant change in the levels of pAkt during any stage of starvation in the Mstn−/− animals (Fig 3N and 3O and Table 4b in S1 Dataset).
We next examined the activity of key proteins, ribosomal protein S6 (S6) and eukaryotic
translation-initiation factor 4E-binding protein (4ebp1) that regulate protein synthesis and are
believed to be targets of Akt activity. We found that the activity of both proteins was reduced in
both genotypes in incremental stages during the starvation procedure (Fig 3O, Table 5b-d in
S1 Dataset and Fig A-C in S1 Fig).
These results show that there is an uncoupling of Akt/protein synthesis pathway in the muscle of Mstn−/− mice.
Muscle protein synthesis and starvation
Our data showed seemingly contradicting results in terms of regulators of protein synthesis
(sustained activated Akt levels) but reduced levels of its target protein S6 and 4ebp1) in the TA
from Mstn−/− animals. We therefore investigated the degree of protein synthesis by using SUnSET [22]. This is a nonradioactive method to follow polypeptide production based on the ability of Puromycin, an aminonucleoside antibiotic to become incorporated into nascent proteins.
To monitor protein synthesis in muscle we injected puromycin into the peritoneal cavity exactly 30 minutes before killing the mice for muscle extraction.
We profiled the distribution of the pulsed puromycin in muscle to gauge the relationship
between fibre-type and protein synthesis and found a significant difference in the activity between the genotypes. In wild-type TA muscle less than 20% of the type IIB fibres showed high
levels of protein synthesis in contrast to the 70% in Mstn−/− mice (Fig 4D). This distribution
did not change significantly after 24h starvation in either genotype (Fig 4D and 4E). Western
blot profiling of polypeptides showed incorporation of puromycin into a numerous proteins
that had been synthesised during the 30 minutes after injection (Fig 4C). Most but not all proteins from both genotypes showed a decrease in abundance as a consequence of starvation. We
next quantified the levels of puromycin in a given amount of protein to determine relative levels of protein synthesis in muscle using slot blotting followed by anti-puromycin antibody
binding and scanning densitometry. Our analysis of both the TA and gastrocnemius showed
that protein synthesis decreased in wild-type muscle following starvation but not to significant
levels (-15% and -19% respectively). The levels of puromycin incorporation was significantly
higher in both muscles from fed Mstn−/− animals but that the level fell significantly after
PLOS ONE | DOI:10.1371/journal.pone.0120524 March 25, 2015
11 / 22
Mechanisms Limiting of Muscle Growth
Fig 4. Quantitative and qualitative analysis of protein synthesis in wild-type and Mstn−/− Tibialis anterior and gastrocnemius muscle using
SUnSET. (A-B) Slot-blot western analysis for quantification of protein synthesis in the gastrocnemius and TA muscle. (C) Western blot showing total protein
distribution and puromycin labelled polypeptides from wild-type and Mstn−/− TA muscle. Note that some bands remain of similar intensity whereas others
decrease. (D) Altered profile of high levels of protein synthesis in IIB fibres of Mstn−/− TA muscle. (E) Immunochistochemistry for the expression of MHC IIB
and high levels of protein synthesis determined by puromycin incorporation. (Scale bar = 100μm). (Two-way ANOVA; *p<0.05)
doi:10.1371/journal.pone.0120524.g004
starvation (-44% and -32% respectively Fig 4A and 4B and Table 6a in S1 Dataset). These results show that decreased protein synthesis plays a greater role in the muscle catabolic process
induced by starvation in the Mstn−/− animals compared to wild-types.
Metabonomic analysis of gastrocnemius muscle
Metabolic profiles were acquired from the hydrophilic extracts of the gastrocnemius muscle by
H nuclear magnetic resonance (NMR) spectroscopy. Principal components analysis (PCA)
was applied to these profiles to identify metabolic variation in the muscle tissue associated with
genotype and diet. The scores plot from the pair-wise PCA model comparing wild-type and
Mstn−/− fed muscle revealed basal metabolic differences between the two genotypes (Fig 5A).
This variation was observed in the second principal component and is explained by greater lactate and anserine in the hypertrophic Mstn−/− muscle compared to that of wild-type animals
and lower amounts of creatine/phosphocreatine (Fig 5G). Starvation induced a varied metabolic response in the muscles of wild-type mice (Fig 5B). Minimal metabolic perturbation was observed in the majority of these animals but in a small subset (n = 3) starvation increased the
amount of lactate, creatine/phosphocreatine and taurine in the muscle (Fig A in S2 Fig). In
stark contrast, the metabolic response of Mstn−/− muscle to starvation was highly consistent
across all group animals characterized by reductions in muscular lactate, creatine/phosphocreatine and taurine compared to the Mstn−/− fed mice (Fig 5C and Fig B in S2 Fig). Comparing
the metabolic profiles of wild-type and Mstn−/− muscle following starvation revealed the
Mstn−/− muscle contained lower amounts of lactate, creatine/phosphocreatine and taurine
compared to starved wild-type muscle (Fig 5D and Fig C in S2 Fig). Following starvation, the
1
PLOS ONE | DOI:10.1371/journal.pone.0120524 March 25, 2015
12 / 22
Mechanisms Limiting of Muscle Growth
Fig 5. Pair-wise comparisons of the metabolic profiles obtained from gastrocnemius muscle from
wild-type and Mstn−/− mice under fed and starved states. PCA scores plots (PC1 vs PC2) comparing (A)
wild-type fed vs Mstn−/− fed; (B) wild-type fed vs wild-type starved; (C) Mstn−/− fed vs Mstn−/− starved; (D)
wild-type starved vs Mstn−/− starved; (E) wild-type fed vs Mstn−/− starved; (F) wild-type fed vs Mstn−/− fed vs
Mstn−/− starved (% variance explained in the parenthesis). Colour loadings plots shown for (G) PC2 of the
model comparing wild-type fed vs Mstn−/− fed and (H) PC1 of the model comparing wild-type fed vs Mstn−/−
starved. Product of PC loadings with standard deviation of the entire data set coloured by the square of the
PC loading.
doi:10.1371/journal.pone.0120524.g005
biochemical signature characteristic of Mstn−/− muscle appeared to normalize towards the
wild-type fed muscle profile. Anserine and lactate in the Mstn−/− tissue was partially reduced to
more closely resemble concentrations observed in the wild-type muscle (Fig 5E and 5H). Creatine/phosphocreatine remained lower in the starved Mstn−/− muscle while taurine was observed to decrease in comparison to the fed wild-type muscle.
PLOS ONE | DOI:10.1371/journal.pone.0120524 March 25, 2015
13 / 22
Mechanisms Limiting of Muscle Growth
Serum/glucocorticoid induced kinase 1 (SGK1) a putative regulator of
protein synthesis Mstn−/− muscle
Our findings that Akt1 activity was insufficient to maintain protein synthesis as well as prevent
the activation of the catabolic process in the hypertrophic animals lead to us seeking an alternative pathway responsible for these actions. In a recent elegant study, Andres-Mateos et al.
(2013) have described the action of SGK-1, a molecule closely related to Akt1, as a crucial mediator of muscle mass maintenance during mammalian hibernation [23]. We profiled the distribution of SGK1 in muscle from fed and starved animals. Immunohistology showed a SGK1
distribution profile very similar to that for protein synthesis; very few IIB fibres from fed control animals displayed high levels of SGK1 whereas significantly higher proportions expressed
the epitope in the same fibres in muscles from Mstn−/− animals (Fig 6A–6C). However the
Fig 6. Expression of SGK1 in wild-type and Mstn−/− Tibialis Anterior (TA) before and after acute 24 starvation. (A) Western blot and scanning
densitometry analysis of 54kD band. (B) (D) Altered profile of SGK1 expression in IIB fibres of Mstn−/− TA muscle. (C) Immunochemistry for the expression of
MCH IIB and SGK1 (Scale bar = 100μm). (E) Western blot analysis of phosphorylated FoxO3a at residues T32 and S253 from the TA muscles and the
influence of starvation. Phosphorylation at T32 indicated by arrow marking the upper band. (F) Quantification of pFoxO3a-T32/ FoxO3a (Two-way ANOVA;
*p<0.05).
doi:10.1371/journal.pone.0120524.g006
PLOS ONE | DOI:10.1371/journal.pone.0120524 March 25, 2015
14 / 22
Mechanisms Limiting of Muscle Growth
proportion of fibres expressing SGK1 did not change significantly after starvation. We also
quantified the major 54kD band using Western blotting and densitometry and found higher
levels of SGK1 in fed Mstn−/− muscle compared to similarly treated wild-type muscle. Significantly we found that starvation induced a significant drop of 70% in the Mstn genotype but
only a 9% (non-significant) decrease in wild-types (Fig 6A). An identical profile was discovered
while profiling the abundance of active (phosphorylated SGK (Fig 6B and Table 7a-c in S1
Dataset). We extended this study by examining the activation of FoxO3a, a target of SGK1.
Here we found that relative to the levels of total FoxO3a, the amount of phosphorylated (inactive) protein through modification at residues T32 or S253 in the TA decreased following starvation more prominently in Mstn−/− through starvation than in wild-types (Fig 6E–6F and
Table 7d in S1 Dataset).
Starvation and hypertrophic muscle function
We and others have demonstrated that muscle function in Mstn−/− animals is compromised
possible to the development of protein aggregates in the contractile filaments that generate tension [14]. Our results here show that autophagic process is activated to a higher degree in
Mstn−/− muscle compared to wild-types. We determined if there was an accumulation of intracellular material that would necessitate continual autophagy. We therefore examined the formation of microscopic granules containing p62 which mark accumulated aberrant protein
material [24]. We found the extensive presence of punctate p62 foci in the enlarged (type IIb)
fibres from Mstn−/− animals (Fig 7A). Importantly small fibres in the same muscle displayed
few if any such foci. Following starvation, there was a significant decrease in the abundance of
the punctate p62 particles in Mstn−/−. Interestingly there was almost the opposing outcome
Fig 7. Intra-muscular bodies and muscle function. (A) Immunohistochemical analysis of p62 expression in the EDL of wild-type and Mstn−/− mice. (AI)
Wild-type mice on normal diet show very few punctate p62 positive bodies in any fibre whereas many appear after starvation (AII). (AIII) Normal diet Mstn−/−
EDL fibres show large number of punctate p62 bodies predominantly in the large fibres which almost all disappear after starvation (IV) (Scale bar 75μm).
Inset images shows high magnification images of p62 staining (scale bar 10μm). (B) Quantification of (B) twitch tension and (C) specific tension of the EDL
from wild-type and Mstn−/− before and after starvation. (Two-way ANOVA; *p<0.05).
doi:10.1371/journal.pone.0120524.g007
PLOS ONE | DOI:10.1371/journal.pone.0120524 March 25, 2015
15 / 22
Mechanisms Limiting of Muscle Growth
following starvation of normal mice. Here there were very few punctate p62 positive events in
the fed mice which increased after 24h of starvation (Fig 7A). Lastly we examined the force
generation profile of muscle from both genotypes before and after 24h of starvation. As previously reported we found that the even though the EDL of the Mstn-/- muscle was enlarged, its
specific tension profile was significantly lower than that of the wild-type counterpart (Fig 7C).
But interestingly starvation had an opposing outcome on the two genotypes. In the wild-types,
acute calorie restriction caused a drop in the specific tension whereas it had the contrary outcome in the Mstn−/−. The level of tension generated by the EDL of the Mstn−/− after starvation
was no different to the wild-type counterpart raised on a normal diet (Fig 7C). Therefore starvation of the hypertrophic muscled mouse acts to normalise the functional deficit seen at the
fed state.
Discussion
Skeletal muscle mass and composition are influenced by numerous factors including exercise,
diet, and age. During the normal adaptive process, muscle undergoes changes while maintaining its functional capability, a concept enshrined in symmorphosis. We suggest that the myostatin null phenotype is a perfect platform to test key elements of symmorphosis since muscle
enlargement occurs to levels that are not permitted through adaptive processes. Here we show
that muscle enlargement beyond the normal physiological range is accompanied by detrimental changes in function as well as altered programme of development and response to environmental stress (starvation).
We show that acute starvation leads to identical levels of weight loss in both the wild-type
and Mstn−/− mice; a decrease of over 20% in 24h. These are far higher levels than detected in humans after a similar time interval and are predicted by the inverse relationship between metabolic rate and body size in mammals [25]. However a major difference in the response to
starvation between the genotypes was in the identity of the tissue undergoing catabolism; in
Mstn−/− mice all muscle groups identified had undergone noteworthy weight loss contrasting
the non-significant mass decrease in wild-types. This could be explained by the decreased adipose content in Mstn−/− mice compared to wild-types [26]. A number of molecules (including
glucagon, epinephrine and adrenocorticotropic hormone) have been shown to increase fatty
acid mobilisation from adipose tissues to fuel the body during starvation. Under normal physiological conditions, adipose tissue produces molecules (including leptin) that support the anabolic processes in skeletal muscle [27]. Therefore the lack of high levels adipose tissue and the
consequential decrease in anabolic signalling in the Mstn−/− could explain why muscle undergoes premature myo-catabolism during acute starvation. Nevertheless, muscle from wild-type
animals does undergo wasting after a prolonged period [28].
Acute starvation showed a profound difference in the rate of muscle loss between the two
genotypes. Mstn−/− lost muscle mass in all groups examined earlier and more rapidly than
wild-types. There was a strong correlation between the degree of muscle enlargement following
myostatin deletion and mass loss due to starvation (Gastrocnemius>Soleus>TA>EDL). It is
worth comparing the rate of muscle loss through differing regimes that induce atrophy. The
TA in wild-types decreased by 9% per day (whereas the Mstn−/− lost twice that amount).
Chronic food restriction results in a decrease of only 0.7%/day in TA from wild-types and 1.2%
in Mstn−/−[28]. Denervation is a powerful inducer of TA catabolism (2.3%/day) but is not
influenced by myostatin [29]. On the other hand immobilisation leads to a similar rate of muscle loss as chronic food restriction (0.8%/day) but can be completely reversed by interfering
with myostatin signalling [29].
PLOS ONE | DOI:10.1371/journal.pone.0120524 March 25, 2015
16 / 22
Mechanisms Limiting of Muscle Growth
Numerous atrophy inducing conditions have shown that fast fibres undergo CSA loss more
rapidly than slow fibres [30, 31]. This relationship was sustained during acute starvation in soleus but not the EDL or the TA of wild-type mice but not in any of the muscles from the
Mstn−/− mice. Therefore the relationship between MHC fibre type and atrophy is guided by
muscle identity and genotype. However we did detect a relationship between fibre-type hypertrophy following myostatin deletion and catabolism; those fibres that had undergone the greatest increase displayed the largest decreases in CSA. Therefore at both macro (whole muscle)
and cellular level there was a relationship between degree of enlargement and mass decrease in
response to starvation. Interestingly there was a relation when fibre atrophy was examined at
the metabolic level. In this context we found oxidative fibres were more resistant compared to
non-oxidative but only in wild-type mice which would concur with results from a number of
laboratories who have shown that oxidative status protects against autophagy [32]. In contrast
both groups of muscle fibres from Mstn−/− were prone to atrophy which again is compatible
with the greater non-oxidative status of muscle in this mutant [14].
Our investigations into starvation induced muscle loss show both qualitative and quantitative difference at the mechanistic level between the two genotypes. The expression of FoxO1, a
regulator of both proteosome mediated protein degradation and autophagy was not only induced to a greater level but also for an extended period in the Mstn−/− compared to wild-types.
A similar pattern was found in the expression of MuRF1 and Atrogin, which encode for key E3
class ubiquitin ligases. The up-regulation of Atrogin reported in this study is interesting in the
context of other wasting models which have reported unchanged expression after chronic starvation [28], as well as limb immobilisation [29] and surprisingly decreased abundance after denervation [29].
Similarly, landscaping the role of autophagy across divergent wasting models reveals differing levels of involvement of this process. We show that at the molecular level increases in the
expression of key genes in both genotypes at 12 hours and a further increase thereafter to 24h.
Therefore autophagy plays a role on acute starvation mediated muscle loss. Again it is worth
contrasting how this differs in other models; no involvement after immobilisation, and a genotype specific involvement (Mstn−/− only) after acute starvation [28, 29]. Interestingly we show
that basal levels of autophagy at the protein level (lipidation of LC3) were significantly higher
in the muscle from Mstn−/− animals indicating the presence of unwanted material in the resting
condition. This is also reflected in the presence of punctate p62 containing bodies in the resting
Type IIB fibres in the muscle of Mstn−/− mice, which form in protein aggregates [24]. Importantly these aggregates were completely cleared from Mstn−/− following acute starvation whereas they appeared for the first time in the muscle of wild-type animals. It is an attractive
proposition to contemplate that the reduced force associated with Mstn−/− mice develops as a
consequence of aberrant protein aggregates in a manner reminiscent to the many myopathies
[33, 34]. Furthermore the restoration of normal muscle function in the Mstn−/− muscle through
starvation induced autophagy is similar to that in the mouse model for Duchenne and Bethlem/Ullrich muscular dystrophy and further exemplifies the necessity to clear aberrant proteins
in order to support muscle contraction [35, 36]. In contrast the wild-type animals showed an
increasing trend in punctate p62 containing bodies together with a decrease in specific tension
(albeit not reaching significant levels).
At the biochemical level, muscle metabolite variation was observed in the gastrocnemius between the two genotypes with greater anserine and lactate in the Mstn−/− muscle and lower creatine/phosphocreatine compared to their wild-type equivalents. Greater lactate and lower
phosphocreatine/creatine abundance in the Mstn−/− muscle reflect differences in the energy capacity of this tissue between the genotypes. Lactate is a product of the anaerobic glycolytic system and is consistent with the known glycolytic muscle phenotype of Mstn−/− animals [12, 37].
PLOS ONE | DOI:10.1371/journal.pone.0120524 March 25, 2015
17 / 22
Mechanisms Limiting of Muscle Growth
Phosphocreatine is an energy store providing short-term replenishment of ATP to support cellular homeostasis. Lower basal phosphocreatine/creatine in the Mstn−/− muscle may contribute
to the reduced functionality of this tissue compared to that of wild-type animals. Importantly
we show the high ratio of lactate to phosphocreatine/creatine in the muscle of the Mstn−/− animals, which is conducive for channelling of carbon into anabolic programmes rather than for
the generation of energy to support tissue function. This would be compatible with the phenotype of the Mstn−/− mice that use carbon to generate skeletal muscle mass. We invite parallels
to be drawn between the metabolic profile displayed by the Mstn−/− muscle and that often
found in cancer known as the ‘Warburg Effect’ in which cells adopt metabolic strategies that
rely on glycolysis to ensure biomass production even in aerobic conditions [38]. As expected
the Mstn−/− animals respond to starvation by withdrawing from metabolic programmes that
support anabolism by decreasing lactate content with concomitant decreases in anserine.
These starvation-associated changes result in a biomolecular phenotype that more closely resembles that of WT muscle. This is consistent with the restoration of muscle function in terms
of force following starvation in these animals.
Mstn−/− muscle contains greater amounts of anserine, an aminoacyl-imadazole dipeptide.
Anserine is formed in skeletal muscle, it activates myosin ATPases [39] and can regulate muscle phosphorylase activity [40]. Anserine has a H+ buffering capacity [41, 42] and the higher
concentration may have a role in regulating lower intracellular pH, as a result of lactate production, in glycolytic Mstn−/− muscle. Our results are in accordance with previous studies showing
that anserine is found is higher concentrations in glycolytic muscles [43], [44]. Anserine also
possesses antioxidant activity and greater amounts in the Mstn−/− muscle may reflect lower levels of oxidative stress [45]. In agreement, Mstn−/− muscle contain a lower abundance of oxidative fibres and therefore has potential to generate fewer reactive oxygen species. This may
imply that highly glycolytic muscles are more stable than oxidative ones.
From the metabolic profiles, the wild-type mice appear better adapted than the Mstn−/−
mice to buffer the metabolic consequences of starvation and exhibit a markedly varied response
to this challenge. The enhanced metabolic flexibility of the wild-type mice most likely explains
this observation. The animals with altered muscle metabolism following starvation had increased lactate, phosphocreatine/creatine and taurine. These represent three strategies for
maintaining energy levels with increased consumption of glycogen (lactate), phosphocreatine,
and protein (taurine). It has been previously reported that taurine content increases with the
oxidative capacity of muscle [46] which is in accordance with the oxidative phenotype of wildtype starved mice breaking down muscle protein for energy.
One of the most intriguing aspects of our data is that related to the canonical Akt pathway
and its role during acute starvation. We show that in wild-type mice, starvation leads to a complete loss of activated Akt and commensurate with an increase in the autophagic and proteosome programme [47]. However from studying Mstn−/− muscle two surprising discoveries
were made: Firstly that basal levels of active Akt were lower in the hypertrophic animal than in
wild-types either at S473 or T308 (Fig 3) and secondly that starvation had no effect on this protein even through activity of its targets (S6 and 4EBP1) as well as the rate of protein synthesis
as judged by using the SUnSET protocol were decreased. We suggest that Akt plays only a
minor role in hypertrophic muscle development. Indeed our finding resonant with studies investigating muscle growth induced by IGF-1 which also results in muscle hypertrophy but no
change in Akt activation [48]. The lower levels of resting Akt in Mstn−/− is surprising since it
has been demonstrated that Smad2/3, downstream components in myostain signalling, directly
interacts and inhibits the activity of Akt [49]. We suggest these differences reconciled by taking
into account that our studies were performed in adult muscle fibres whereas the work of Trendelenberg was performed on myoblasts [49]. Nevertheless we show here that Akt does not
PLOS ONE | DOI:10.1371/journal.pone.0120524 March 25, 2015
18 / 22
Mechanisms Limiting of Muscle Growth
influence autophagy, proteosome regulators or protein synthesis in adult muscle in the absence
of myostatin when challenged by starvation.
We suggest that SGK-1 a molecule related to Akt not only in terms of structure but also
specificity is an important regulator of hypertrophic muscle development in the absence of
myostatin. Elegant work from the Cohn group have provided a wealth of data backing a central
role for SGK-1 rather than Akt in muscle homeostasis and atrophy through its ability to promote protein synthesis and inhibiting the catabolic activity of FoxO proteins [23, 29]. Our
work furthers the notion that SGK-1 plays a significant role in muscle hypertrophy. We show
that levels and activity of this protein are elevated in the muscle of Mstn−/− mice. Moreover,
there is an increase in the number of hypertrophic fibres that express the protein. Lastly, SGK1 expression drops as does its activity (identified through increased levels of un-modified
FoxO3a) significantly after starvation, providing additional evidence for the involvement of
this protein during starvation.
Conclusions
In summary our work shows that the hypertrophic muscle that develops following the genetic
ablation of myostatin is prone to catabolism. We suggest that it has a number of mechanisms
primed for this outcome including active autophagy. However the consequence of catabolism
in the Mstn−/− is beneficial in that muscle function is restored. We suggest that starvation reinstates the function of muscle back to its normal symmorphosis range. We provide evidence
that this takes places through a coordinated combination among decreased protein synthesis,
augmented autophagy and accelerated proteolysis in hypertrophic muscles from Mstn−/− mice.
In contrast starvation is not beneficial to wild-type animals. Importantly our work shows a
major role for SGK1 in muscle hypertrophy therefore identifies it rather than Akt as a regulator
of muscle mass. Therefore the future development of SGK1 mimetics could represent a novel
class of molecules used to prevent muscle wasting in clinical setting such as cancer and after appetite loss as well as to attenuate the effects of sacropenia.
Supporting Information
S1 Dataset. Primer sequence, quantitative measures and statistical evaluations.
(DOCX)
S1 Fig. Quantification of p62, 4ebp6 and S6 protein levels.
(TIF)
S2 Fig. Pair-wise comparisons of the metabolic profiles obtained from gastrocnemius muscle from wild-type and Mstn−/− mice under fed and starved states. Colour loadings plots
shown for (A) PC1 of the model comparing wild-type fed vs wild-type starved; (B) PC1 of the
model comparing Mstn−/− fed vs Mstn−/− starved and (C) PC1 of the model comparing wildtype starved vs Mstn−/− starved. Product of PC loadings with standard deviation of the entire
data set, coloured by the square of the PC loading.
(TIF)
Acknowledgments
We thank the two anonymous reviewers for making suggestions that greatly improved the
quality of the study.
PLOS ONE | DOI:10.1371/journal.pone.0120524 March 25, 2015
19 / 22
Mechanisms Limiting of Muscle Growth
Author Contributions
Conceived and designed the experiments: HM JRS MS KP. Performed the experiments: HCH
RS NG AM HF R. Macharia R. Mitchell. Analyzed the data: HCH RS NG AM SR JRS MS KP.
Contributed reagents/materials/analysis tools: MS. Wrote the paper: NG RS AM HM JRS KP.
References
1.
Smil V. China's great famine: 40 years later. BMJ. 1999 Dec 18–25; 319(7225):1619–21. PMID:
10600969
2.
Elia M, Stratton RJ. How much undernutrition is there in hospitals? Br J Nutr. 2000 Sep; 84(3):257–9.
PMID: 10967603
3.
Krieger M. Ueber die Atrophie der menschlichen Organe bei Inanition. Z. angew. Anat Konstitutional.
1921; 7:87–134.
4.
Collinson DR. Total fasting for up to 249 days. Lancet. 1967; 289:112.
5.
Metabolic mediators of the effects of body-mass index, overweight, and obesity on coronary heart disease and stroke: a pooled analysis of 97 prospective cohorts with 1.8 million participants. Lancet. 2013
Nov 21.
6.
Neel JV. Diabetes mellitus: a "thrifty" genotype rendered detrimental by "progress"? Am J Hum Genet.
1962 Dec; 14:353–62. PMID: 13937884
7.
Taylor CR, Weibel ER. Design of the Mammalian Respiratory System. 1. Problem and Strategy. Resp
Physiol. 1981; 44(1):1–10.
8.
Garland T, Huey RB. Testing Symmorphosis—Does Structure Match Functional Requirements. Evolution. 1987 Nov; 41(6):1404–9.
9.
Cuendet GS, Loten EG, Cameron DP, Renold AE, Marliss EB. Hormone-substrate responses to total
fasting in lean and obese mice. Am J Physiol. 1975 Jan; 228(1):276–83. PMID: 1096642
10.
Runcie J, Thomson TJ. Prolonged starvation—a dangerous procedure? Br Med J. 1970 Aug 22; 3
(5720):432–5. PMID: 5454322
11.
McPherron AC, Lawler AM, Lee SJ. Regulation of skeletal muscle mass in mice by a new TGF-beta superfamily member. Nature. 1997 May 1; 387(6628):83–90. PMID: 9139826
12.
Matsakas A, Otto A, Elashry MI, Brown SC, Patel K. Altered primary and secondary myogenesis in the
myostatin-null mouse. Rejuvenation Res. 2010 Dec; 13(6):717–27. doi: 10.1089/rej.2010.1065 PMID:
21204650
13.
Matsakas A, Macharia R, Otto A, Elashry MI, Mouisel E, Romanello V, et al. Exercise training attenuates the hypermuscular phenotype and restores skeletal muscle function in the myostatin null mouse.
Exp Physiol. 2012 Jan; 97(1):125–40. doi: 10.1113/expphysiol.2011.063008 PMID: 22058168
14.
Amthor H, Macharia R, Navarrete R, Schuelke M, Brown SC, Otto A, et al. Lack of myostatin results in
excessive muscle growth but impaired force generation. Proc Natl Acad Sci U S A. 2007 Feb 6; 104
(6):1835–40. PMID: 17267614
15.
Savage KJ, McPherron AC. Endurance exercise training in myostatin null mice. Muscle Nerve. 2010
Sep; 42(3):355–62. doi: 10.1002/mus.21688 PMID: 20544938
16.
Mendias CL, Marcin JE, Calerdon DR, Faulkner JA. Contractile properties of EDL and soleus muscles
of myostatin-deficient mice. J Appl Physiol (1985). 2006 Sep; 101(3):898–905. PMID: 16709649
17.
Ballak S, Degens H, de Haan A, Jaspers RT. Aging related changes in determinants of muscle force
generating capacity: A comparison of muscle aging in men and male rodents. Ageing Res Rev. 2014
Feb 2.
18.
Beckonert O, Keun HC, Ebbels TMD, Bundy JG, Holmes E, Lindon JC, et al. Metabolic profiling, metabolomic and metabonomic procedures for NMR spectroscopy of urine, plasma, serum and tissue extracts. Nature Protocols. 2007 2007; 2(11):2692–703. PMID: 18007604
19.
Sandri M, Sandri C, Gilbert A, Skurk C, Calabria E, Picard A, et al. Foxo transcription factors induce the
atrophy-related ubiquitin ligase atrogin-1 and cause skeletal muscle atrophy. Cell. 2004 Apr 30; 117
(3):399–412. PMID: 15109499
20.
Uddin MN, Ito S, Nishio N, Suganya T, Isobe K. Gadd34 induces autophagy through the suppression of
the mTOR pathway during starvation. Biochem Biophys Res Commun. 2011 Apr 22; 407(4):692–8. doi:
10.1016/j.bbrc.2011.03.077 PMID: 21439266
21.
Lokireddy S, Wijesoma IW, Teng S, Bonala S, Gluckman PD, McFarlane C, et al. The ubiquitin ligase
Mul1 induces mitophagy in skeletal muscle in response to muscle-wasting stimuli. Cell Metab. 2012
Nov 7; 16(5):613–24. doi: 10.1016/j.cmet.2012.10.005 PMID: 23140641
PLOS ONE | DOI:10.1371/journal.pone.0120524 March 25, 2015
20 / 22
Mechanisms Limiting of Muscle Growth
22.
Schmidt EK, Clavarino G, Ceppi M, Pierre P. SUnSET, a nonradioactive method to monitor protein synthesis. Nat Methods. 2009 Apr; 6(4):275–7. doi: 10.1038/nmeth.1314 PMID: 19305406
23.
Andres-Mateos E, Brinkmeier H, Burks TN, Mejias R, Files DC, Steinberger M, et al. Activation of
serum/glucocorticoid-induced kinase 1 (SGK1) is important to maintain skeletal muscle homeostasis
and prevent atrophy. EMBO Mol Med. 2013 Jan; 5(1):80–91. doi: 10.1002/emmm.201201443 PMID:
23161797
24.
Nemazanyy I, Blaauw B, Paolini C, Caillaud C, Protasi F, Mueller A, et al. Defects of Vps15 in skeletal
muscles lead to autophagic vacuolar myopathy and lysosomal disease. EMBO Mol Med. 2013 Jun; 5
(6):870–90. doi: 10.1002/emmm.201202057 PMID: 23630012
25.
Clarke A, Rothery P, Isaac NJ. Scaling of basal metabolic rate with body mass and temperature in
mammals. J Anim Ecol. 2010 May; 79(3):610–9. doi: 10.1111/j.1365-2656.2010.01672.x PMID:
20180875
26.
Guo T, Jou W, Chanturiya T, Portas J, Gavrilova O, McPherron AC. Myostatin inhibition in muscle, but
not adipose tissue, decreases fat mass and improves insulin sensitivity. PLoS One. 2009; 4(3):e4937.
doi: 10.1371/journal.pone.0004937 PMID: 19295913
27.
Bartell SM, Rayalam S, Ambati S, Gaddam DR, Hartzell DL, Hamrick M, et al. Central (ICV) leptin injection increases bone formation, bone mineral density, muscle mass, serum IGF-1, and the expression of
osteogenic genes in leptin-deficient ob/ob mice. J Bone Miner Res. 2011 Aug; 26(8):1710–20. doi: 10.
1002/jbmr.406 PMID: 21520275
28.
Matsakas A, Romanello V, Sartori R, Masiero E, Macharia R, Otto A, et al. Food restriction reverses the
hyper-muscular phenotype and force generation capacity deficit of the myostatin null mouse. Int J
Sports Med. 2013 Mar; 34(3):223–31. doi: 10.1055/s-0032-1312605 PMID: 23143700
29.
Macdonald EM, Andres-Mateos E, Mejias R, Simmers JL, Mi R, Park JS, et al. Denervation atrophy is
independent from Akt and mTOR activation and is not rescued by myostatin inhibition. Dis Model
Mech. 2014 Feb 6.
30.
Goldspink G, Ward PS. Changes in rodent muscle fibre types during post-natal growth, undernutrition
and exercise. J Physiol. 1979 Nov; 296:453–69. PMID: 160929
31.
Wang Y, Pessin JE. Mechanisms for fiber-type specificity of skeletal muscle atrophy. Curr Opin Clin
Nutr Metab Care. 2013 May; 16(3):243–50. doi: 10.1097/MCO.0b013e328360272d PMID: 23493017
32.
Mofarrahi M, Guo Y, Haspel JA, Choi AM, Davis EC, Gouspillou G, et al. Autophagic flux and oxidative
capacity of skeletal muscles during acute starvation. Autophagy. 2013 Aug 15; 9(10).
33.
Kurapati R, McKenna C, Lindqvist J, Williams D, Simon M, LeProust E, et al. Myofibrillar myopathy
caused by a mutation in the motor domain of mouse MyHC IIb. Hum Mol Genet. 2012 Apr 15; 21
(8):1706–24. doi: 10.1093/hmg/ddr605 PMID: 22199023
34.
Garvey SM, Miller SE, Claflin DR, Faulkner JA, Hauser MA. Transgenic mice expressing the myotilin
T57I mutation unite the pathology associated with LGMD1A and MFM. Hum Mol Genet. 2006 Aug 1; 15
(15):2348–62. PMID: 16801328
35.
Grumati P, Coletto L, Sabatelli P, Cescon M, Angelin A, Bertaggia E, et al. Autophagy is defective in collagen VI muscular dystrophies, and its reactivation rescues myofiber degeneration. Nat Med. 2010
Nov; 16(11):1313–20. doi: 10.1038/nm.2247 PMID: 21037586
36.
De Palma C, Morisi F, Cheli S, Pambianco S, Cappello V, Vezzoli M, et al. Autophagy as a new therapeutic target in Duchenne muscular dystrophy. Cell Death Dis. 2012; 3:e418. doi: 10.1038/cddis.2012.
159 PMID: 23152054
37.
Girgenrath S, Song K, Whittemore LA. Loss of myostatin expression alters fiber-type distribution and
expression of myosin heavy chain isoforms in slow- and fast-type skeletal muscle. Muscle Nerve. 2005
Jan; 31(1):34–40. PMID: 15468312
38.
Vander Heiden MG, Cantley LC, Thompson CB. Understanding the Warburg effect: the metabolic requirements of cell proliferation. Science. 2009 May 22; 324(5930):1029–33. doi: 10.1126/science.
1160809 PMID: 19460998
39.
Avena RM, Bowen WJ. Effects of carnosine and anserine on muscle adenosine triphosphatases. J Biol
Chem. 1969 Mar 25; 244(6):1600–4. PMID: 4237519
40.
Johnson P, Fedyna JS, Schindzielorz A, Smith CM, Kasvinsky PJ. Regulation of muscle phosphorylase
activity by carnosine and anserine. Biochem Biophys Res Commun. 1982 Dec 15; 109(3):769–75.
PMID: 6818967
41.
Davey CL. The significance of carnosine and anserine in striated skeletal muscle. Arch Biochem Biophys. 1960 Aug; 89:303–8. PMID: 13814256
42.
Abe H. Role of histidine-related compounds as intracellular proton buffering constituents in vertebrate
muscle. Biochemistry (Mosc). 2000 Jul; 65(7):757–65. PMID: 10951092
PLOS ONE | DOI:10.1371/journal.pone.0120524 March 25, 2015
21 / 22
Mechanisms Limiting of Muscle Growth
43.
Yoshioka Y, Masuda T, Nakano H, Miura H, Nakaya S, Itazawa S, et al. In vitro 1H-NMR spectroscopic
analysis of metabolites in fast- and slow-twitch muscles of young rats. Magn Reson Med Sci. 2002; 1
(1):7–13. PMID: 16037662
44.
Aristoy MC, Toldra F. Concentration of free amino acids and dipeptides in porcine skeletal muscles with
different oxidative patterns. Meat Sci. 1998 Nov; 50(3):327–32. PMID: 22061151
45.
Kohen R, Yamamoto Y, Cundy KC, Ames BN. Antioxidant activity of carnosine, homocarnosine, and
anserine present in muscle and brain. Proc Natl Acad Sci U S A. 1988 May; 85(9):3175–9. PMID:
3362866
46.
Dunnett M, Harris RC, Soliman MZ, Suwar AA. Carnosine, anserine and taurine contents in individual fibres from the middle gluteal muscle of the camel. Res Vet Sci. 1997 May-Jun; 62(3):213–6. PMID:
9300536
47.
Zhao J, Brault JJ, Schild A, Cao P, Sandri M, Schiaffino S, et al. FoxO3 coordinately activates protein
degradation by the autophagic/lysosomal and proteasomal pathways in atrophying muscle cells. Cell
Metab. 2007 Dec; 6(6):472–83. PMID: 18054316
48.
Song YH, Godard M, Li Y, Richmond SR, Rosenthal N, Delafontaine P. Insulin-like growth factor I-mediated skeletal muscle hypertrophy is characterized by increased mTOR-p70S6K signaling without increased Akt phosphorylation. J Investig Med. 2005 Apr; 53(3):135–42. PMID: 15921033
49.
Trendelenburg AU, Meyer A, Rohner D, Boyle J, Hatakeyama S, Glass DJ. Myostatin reduces Akt/
TORC1/p70S6K signaling, inhibiting myoblast differentiation and myotube size. Am J Physiol Cell Physiol. 2009 Jun; 296(6):C1258–70. doi: 10.1152/ajpcell.00105.2009 PMID: 19357233
PLOS ONE | DOI:10.1371/journal.pone.0120524 March 25, 2015
22 / 22


© Copyright 2026