
the working paper - Center for Education Policy Research
!
Effective Teaching in Elementary Mathematics:
Identifying Classroom Practices that Support Student Achievement
David Blazar
Harvard Graduate School of Education
Center for Education Policy Research
50 Church Street, 4th Floor
Cambridge, MA 02138
[email protected]
617 549 8909
April 2015
Draft Document: Do not circulate or cite without permission of the author
Abstract
Recent investigations into the education production function have moved beyond
traditional teacher inputs, such as education, certification, and salary, focusing instead on
observational measures of teaching practice. However, challenges to identification mean that this
work has yet to coalesce around specific instructional dimensions that increase student
achievement. I build on this discussion by exploiting within-school, between-grade, and crosscohort variation in scores from two observation instruments; further, I condition on a uniquely
rich set of teacher characteristics, practices, and skills. Findings indicate that inquiry-oriented
instruction positively predicts student achievement. Content errors and imprecisions are
negatively related, though these estimates are sensitive to the set of covariates included in the
model. Two other dimensions of instruction, classroom emotional support and classroom
organization, are not related to this outcome. Findings can inform recruitment and development
efforts aimed at improving the quality of the teacher workforce.
JEL Classifications: Analysis of Education (I21), Human Capital (J24), Econometrics (C01)
Highlights
•
This paper examines the relationship between high-quality instruction and students’
mathematics achievement.
•
Identification relies on variation in teaching quality within schools, across grades and years,
conditioning on a unique set of teacher characteristics.
•
Inquiry-oriented mathematics instruction is positively related to student outcomes with an
effect size of 0.10 standard deviations.
•
!
Findings generalize to teachers and classrooms across three urban school districts.
1!
Draft Document: Do not circulate or cite without permission of the author
1.
Introduction
Over the past decade, research has confirmed that teachers have substantial impacts on
their students’ academic and life-long success (e.g., Nye, Konstantopoulos, & Hedges, 2004;
Chetty, Friedman, & Rockoff, 2014). Despite concerted efforts to identify characteristics such as
experience, education, and certification that might be correlated with effectiveness (for a review,
see Wayne & Youngs, 2003), however, the nature of effective teaching still largely remains a
black box. Given that the effect of teachers on achievement must occur at least in part through
instruction, it is critical that researchers identify the types of classroom practices that matter most
to student outcomes. This is especially true as schools and districts work to meet the more
rigorous goals for student achievement set by the Common Core State Standards (Porter,
McMaken, Hwang, & Yang, 2011), particularly in mathematics (Duncan, 2010; Johnson, 2012;
U.S Department of Education, 2010).
Our limited progress toward understanding the impact of teaching practice on student
outcomes stems from two main research challenges. The first barrier is developing appropriate
tools to measure the quality of teachers’ instruction. Much of the work in this area tends to
examine instruction either in laboratory settings or in classrooms over short periods of time (e.g.,
Anderson, Everston, & Brophy, 1979; Star & Rittle-Johnson, 2009), neither of which is likely to
capture the most important kinds of variation in teachers’ practices that occur over the course of
a school year. The second is a persistent issue in economics of education research of designing
studies that support causal inferences (Murnane & Willett, 2011). Non-random sorting of
students to teachers (Clotfelter, Ladd, & Vigdor, 2006; Rothstein, 2010) and omitted measures of
teachers’ skills and practices limit the success of prior research.
!
2!
Draft Document: Do not circulate or cite without permission of the author
I address these challenges through use of a unique dataset on fourth- and fifth-grade
teachers and their students from three anonymous school districts on the East Coast of the United
States. Over the course of two school years, the project captured observed measures of teachers’
classroom practices on the Mathematical Quality of Instruction (MQI) and Classroom
Assessment Scoring System (CLASS) instruments, focusing on mathematics-specific and
general teaching practices, respectively. The project also collected data on a range of other
teacher characteristics, as well as student outcomes on a low-stakes achievement test that was
common across participants.
My identification strategy has two key features that distinguish it from prior work on this
topic. First, to account for sorting of students to schools and teachers, I exploit variation in
observation scores within schools, across adjacent grades and years. Specifically, I specify
models that include school fixed effects and instructional quality scores averaged to the schoolgrade-year level. This approach assumes that student and teacher assignments are random within
schools and across grades or years, which I explore in detail below. Second, to isolate the
independent contribution of instructional practices to student achievement, I condition on a
uniquely rich set of teacher characteristics, skills, and practices. I expect that there likely are
additional factors that are difficult to observe and, thus, are excluded from my data. Therefore, to
explore the possible degree of bias in my estimates, I test the sensitivity of results to models that
include different sets of covariates. Further, I interpret findings in light of limitations associated
with this approach.
Results point to a positive relationship between ambitious or inquiry-oriented
mathematics instruction and performance on a low-stakes test of students’ math knowledge of
roughly 0.10 standard deviations. I also find suggestive evidence for a negative relationship
!
3!
Draft Document: Do not circulate or cite without permission of the author
between mathematical errors and student achievement, though estimates are sensitive to the
specific set of teacher characteristics included in the model. I find no relationships between two
other dimensions of teaching practice – classroom emotional support and classroom organization
– and student achievement. Teachers included in this study have value-added scores calculated
from state assessment data similar to those of other fourth- and fifth-grade teachers in their
respective districts, leading me to conclude that findings likely generalize to these populations
beyond my identification sample. I argue that results can inform recruitment and development
efforts aimed at improving the quality of the teacher workforce
The remainder of this paper is organized as follows. In the second section, I discuss
previous research on the relationship between observational measures of teacher quality and
student achievement. In the third section, I describe the research design, including the sample
and data. In the fourth section, I present my identification strategy and tests of assumptions. In
the fifth section, I provide main results and threats to internal and external validity. I conclude by
discussing the implications of my findings for ongoing research and policy on teacher and
teaching quality.
2.
Background and Context
Although improving the quality of the teacher workforce is seen as an economic
imperative (Hanushek, 2009), long-standing traditions that reward education and training or offer
financial incentives based on student achievement have been met with limited success (Boyd,
Grossman, Lankford, Loeb, & Wyckoff, 2006; Fryer, 2013; Harris & Sass, 2011; Springer et al.,
2010). One reason for this posed by Murnane and Cohen (1986) almost three decades ago is the
“nature of teachers’ work” (p. 3). They argued that the “imprecise nature of the activity” makes it
difficult to describe why some teachers are good and what other teachers can do to improve (p. 7).
!
4!
Draft Document: Do not circulate or cite without permission of the author
Recent investigations have sought to test this theory by comparing subjective and
objective (i.e., “value-added”) measures of teacher performance. In one such study, Jacob and
Lefgren (2008) found that principals were able to distinguish between teachers in the tails of the
achievement distribution but not in the middle. Correlations between principal ratings of teacher
effectiveness and value added were weak to moderate: 0.25 and 0.18 in math and reading,
respectively (0.32 and 0.29 when adjusted for measurement error). Further, while subjective
ratings were a statistically significantly predictor of future student achievement, they performed
worse than objective measures. Including both in the same regression model, estimates for
principal ratings were 0.08 standard deviations (sd) in math and 0.05 sd in reading;
comparatively, estimates for value-added scores were 0.18 sd in math and 0.10 sd in reading.
This evidence led the authors to conclude that “good teaching is, at least to some extent,
observable by those close to the education process even though it may not be easily captured in
those variables commonly available to the econometrician” (p. 103).
Two other studies found similar results. Using data from New York City, Rockoff,
Staiger, Kane, and Taylor (2012) estimated correlations of roughly 0.21 between principal
evaluations of teacher effectiveness and value-added scores averaged across math and reading.
These relationships corresponded to effect sizes of 0.07 sd in math and 0.08 sd in reading when
predicting future student achievement. Extending this work to mentor evaluations of teacher
effectiveness, Rockoff and Speroni (2010) found smaller relationships to future student
achievement in math between 0.02 sd and 0.05 sd. Together, these studies suggest that principals
and other outside observers understand some but not all of the production function that converts
classroom teaching and professional expertise into student outcomes.
!
5!
Draft Document: Do not circulate or cite without permission of the author
In more recent years, there has been a growing interest amongst educators and
economists alike in exploring teaching practice more directly. This now is possible through the
use of observation instruments that quantitatively capture the nature and quality of teachers’
instruction. In one of the first econometric analyses of this kind, Kane, Taylor, Tyler, and
Wooten (2011) examined teaching quality scores captured on the Framework for Teaching
instrument as a predictor of math and reading test scores. Data came from Cincinnati and
widespread use of this instrument in a peer evaluation system. Relationships to student
achievement of 0.11 sd in math and 0.14 sd in reading provided suggestive evidence of the
importance of general classroom practices captured on this instrument (e.g., classroom climate,
organization, routines) in explaining teacher productivity.
At the same time, this work highlighted a central challenge associated with looking at
relationships between scores from observation instruments and student test scores. Non-random
sorting of students to teachers and non-random variation in classroom practices across teachers
means that there likely are unobserved characteristics related both to instructional quality and
student achievement. As one way to address this concern, the authors’ preferred model included
school fixed effects to account for factors at the school level, apart from instructional quality,
that could lead to differences in achievement gains. In addition, they relied on out-of-year
observation scores that, by design, could not be correlated with the error term predicting current
student achievement. This approach is similar to those taken by Jacob and Lefgren (2008),
Rockoff, Staiger, Kane, and Taylor (2012), and Rockoff and Speroni (2010), who use
principal/mentor ratings of teacher effectiveness to predict future student achievement. Finally,
as a robustness test, the authors fit models with teacher fixed effects to account for time-invariant
!
6!
Draft Document: Do not circulate or cite without permission of the author
teacher characteristics that might be related to observation scores and student outcomes; however,
they noted that these estimates were much noisier because of small samples of teachers.
The largest and most ambitious study to date to conduct these sorts of analyses is the
Measures of Effective Teaching (MET) project, which collected data from teachers across six
urban school districts on multiple observation instruments. By randomly assigning teachers to
class rosters within schools and using out-of-year observation scores, Kane, McCaffrey, Miller,
and Staiger (2013) were able to limit some of the sources of bias described above. In math,
relationships between scores from the Framework for Teaching and prior student achievement
fell between 0.09 sd and 0.11 sd. In the non-random assignment portion of the study, Kane and
Staiger (2012) found correlations between scores from other observation instruments and prioryear achievement gains in math from 0.09 (for the Mathematical Quality of Instruction) to 0.27
(for the UTeach Teacher Observation Protocol). The authors did not report these as effect size
estimates. As a point of comparison, the correlation for the Framework for Teaching and prioryear gains was 0.13.
Notably, these relationships between observation scores and student achievement from
both the Cincinnati and MET studies are equal to or larger in magnitude than those that focus on
principal or mentor ratings of teacher quality. This is somewhat surprising given that principal
ratings of teacher effectiveness – often worded specifically as teachers’ ability to raise student
achievement – and actual student achievement are meant to measure the same underlying
construct. Comparatively, dimensions of teaching quality included on these instruments are
thought to be important contributors to student outcomes but are not meant to capture every
aspect of the classroom environment that influence learning (Pianta & Hamre, 2009). Therefore,
using findings from Jacob and Lefgren (2008), Rockoff, Staiger, Kane, and Taylor (2012), and
!
7!
Draft Document: Do not circulate or cite without permission of the author
Rockoff and Speroni (2010) as a benchmark, estimates describing the relationship between
observed classroom practices and student achievement are, at a minimum, substantively
meaningful; at a maximum, they may be viewed as large. Following Murnane and Cohen’s
intuition, then, continued exploration into the “nature of teachers’ work” (1986, p. 3), the
practices that comprise high-quality teaching, and their role in the education production function
will be a central component of efforts aimed at raising teacher quality and student achievement.
At the same time that work by Kane and his co-authors (2011, 2012, 2013) has greatly
expanded conversation in the economics of education literature to include teaching quality when
considering teacher quality, this work has yet to coalesce around specific instructional
dimensions that increase student outcomes. Random assignment of teachers to students – and
other econometric methods such as use of school fixed effects, teacher fixed effects, and out-ofyear observation ratings – likely provide internally valid estimates of the effect of having a
teacher who provides high-quality instruction on student outcomes. This approach is useful
when validating different measures of teacher quality, as was the stated goal of many of the
studies described above including MET. However, these approaches are insufficient to produce
internally valid estimates of the effect of high-quality instruction itself on student outcomes. This
is because teachers whose measured instructional practices are high quality might have a true,
positive effect on student achievement even though other practices and skills – e.g., spending
more time with students, knowledge of students – are responsible for the higher achievement.
Kane et al. (2011) fit models with teacher fixed effects in order to “control for all time-invariant
teacher characteristics that might be correlated with both student achievement growth and
observed classroom practices” (p. 549). However, it is likely that there are other time-variant
skills related both to instructional quality and student achievement.
!
8!
Draft Document: Do not circulate or cite without permission of the author
I address this challenge to identification in two ways. First, my analyses explore an
additional approach to account for the non-random sorting of students to teachers. Second, I
attempt to isolate the unique contribution of specific teaching dimensions to student outcomes by
conditioning on a broad set of teacher characteristics, practices, and skills. Specifically, I include
observation scores captured on two instruments (both content-specific and general dimensions of
instruction), background characteristics (education, certification, and teaching experience),
knowledge (mathematical content knowledge and knowledge of student performance), and noninstructional classroom behaviors (preparation for class and formative assessment) that are
thought to relate both to instructional quality and student achievement. Comparatively, in their
preferred model, Kane et al. (2011) included scores from one observation instrument, controlling
for teaching experience. While I am not able to capture every possible characteristic, I argue that
these analyses are an important advance beyond what currently exists in the field.
3.
Sample and Data
3.1
Sample
Data come from the National Center for Teacher Effectiveness (NCTE), which focused
on collection of instructional quality scores and other teacher characteristics in three anonymous
districts (henceforth Districts 1 through 3).1 Districts 1 and 2 are located in the same state. Data
was collected from participating fourth- and fifth-grade math teachers in the 2010-2011 and
2011-2012 school years. Due to the nature of the study and the requirement for teachers to be
videotaped over the course of a school year, participants consist of a non-random sample of
!!!!!!!!!!!!!!!!!!!!!!!!!!!!!!!!!!!!!!!!!!!!!!!!!!!!!!!!
1
This project also includes a fourth district that I exclude here due to data and sample limitations.
In the first year of the study, students did not take the baseline achievement test. In the second
year, there were only three schools in which all teachers in the relevant grades participated in
data collection, which is an important requirement of my identification strategy. At the same
time, when I include these few observations in my analyses, patterns of results are the same.
!
9!
Draft Document: Do not circulate or cite without permission of the author
schools and teachers who agreed to participate. During recruitment, study information was
presented to schools based on district referrals and size; the study required a minimum of two
teachers at each of the sampled grades. Of eligible teachers, 143 (roughly 55%) agreed to
participate. My identification strategy focuses on school-grade-years in which I have the full
sample of teachers who work in non-specialized classrooms (i.e., not self-contained special
education or limited English proficient classes) in that school-grade-year. I further restrict the
sample to schools that have at least two complete grade-year cells. This includes 111 teachers in
26 schools and 76 school-grade-years; 45 of these teachers, 17 of these schools, and 27 of these
school-grade-years are in the sample for both school years.
In Table 1, I present descriptive statistics on the students and teachers in this sample.
Students in District 1 are predominantly African American or Hispanic, with over 80% eligible
for free- or reduced-price lunch (FRPL), 15% designated as in need of special education (SPED)
services, and roughly 24% designated as limited English proficient (LEP). In District 2, there is a
greater percentage of white students (29%) and fewer FRPL (71%), SPED (10%), and LEP
students (18%). In District 3, there is a greater percentage of African-American students (67%)
and fewer FRPL (58%), SPED (8%), and LEP students (7%). Across all districts, teachers have
roughly nine years of experience. Teachers in Districts 1 and 2 were certified predominantly
through traditional programs (74% and 93%, respectively), while more teachers in District 3
entered the profession through alternative programs or were not certified at all (55%). Relative to
all study participants, teachers in Districts 1 through 3 have above average, average, and below
average mathematical content knowledge, respectively.
!
10!
Draft Document: Do not circulate or cite without permission of the author
Table 1
Sample Descriptive Statistics
All Districts
District 1
District 2
District 3
49.7
53.1
4.2
17.2
21.7
71.0
10.6
16.4
3203
48.8
42.8
7.2
37.7
6.6
84.1
14.5
23.6
724
51.1
51.0
3.7
12.4
29.0
71.3
10.2
17.8
1692
47.6
67.2
2.4
8.8
19.8
58.3
7.9
6.6
787
45.4
2.3
75.0
70.3
9.0
-0.07
0.05
3.4
3.6
111
33.3
2.4
83.3
74.2
8.9
0.15
0.32
3.4
3.6
31
57.5
2.4
77.5
92.5
9.1
0.00
0.16
3.3
3.6
40
42.1
2.2
65.8
45.0
9.0
-0.35
-0.28
3.4
3.6
40
Students
Male (%)
African American (%)
Asian (%)
Hispanic (%)
White (%)
FRPL (%)
SPED (%)
LEP (%)
Students
Teachers
Bachelor’s Degree in Education (%)
Math Coursework (Likert Scale from 1 to 4)
Master’s Degree (%)
Traditional Certification (%)
Experience (In Years)
Mathematical Content Knowledge (Standardized)
Knowledge of Student Performance (Standardized)
Preparation for Class (Likert Scale from 1 to 5)
Formative Assessment (Likert Scale from 1 to 5)
Teachers
!
3.2
Main Predictor and Outcome Measures
3.2.1
Video-Recorded Lesson of Instruction
Mathematics lessons were captured over a two-year period, with a maximum of three
lessons per teacher per year. Capture occurred with a three-camera, unmanned unit and lasted
between 45 and 80 minutes. Teachers were allowed to choose the dates for capture in advance,
and were directed to select typical lessons and exclude days on which students were taking a test.
Although it is possible that these lessons are unique from teachers’ general instruction, teachers
did not have any incentive to select lessons strategically as no rewards or sanctions were
involved with data collection. In addition, analyses from the MET project indicate that teachers
are ranked almost identically when they choose lessons themselves compared to when lessons
are chosen for them (Ho & Kane, 2013).
!
11!
Draft Document: Do not circulate or cite without permission of the author
Trained raters scored these lessons on two established observational instruments: the
Mathematical Quality of Instruction (MQI), focused on mathematics-specific practices, and the
Classroom Assessment Scoring System (CLASS), focused on general teaching practices. For the
MQI, two certified and trained raters watched each lesson and scored teachers’ instruction on 17
items for each seven-and-a-half minute segment on a scale from Low (1) to High (3) (see Table 2
for a full list of items). Lessons have different numbers of segments, depending on their length.
Analyses of these data (Blazar, Braslow, Charalambous, & Hill, 2015) show that items cluster
into two main factors: Ambitious Mathematics Instruction, which corresponds to many elements
contained within the mathematics reforms of the 1990s (National Council of Teachers of
Mathematics, 1989, 1991, 2000) and the Common Core State Standards for Mathematics
(National Governors Association for Best Practices, 2010); and Mathematical Errors and
Imprecisions, which captures any mathematical errors the teacher introduces into the lesson. For
Ambitious Mathematics Instruction, higher scores indicate better performance. For Mathematical
Errors and Imprecisions, higher scores indicate that teachers make more errors in their
instruction and, therefore, worse performance. I estimate reliability for these metrics by
calculating the amount of variance in teacher scores that is attributable to the teacher (i.e., the
intraclass correlation), adjusted for the modal number of lessons. These estimates are 0.69 and
0.52 for Ambitious Mathematics Instruction and Mathematical Errors and Imprecisions,
respectively. Though this latter estimate is lower than conventionally acceptable levels (0.7), it is
consistent with those generated from similar studies (Bell, Gitomer, McCaffrey, Hamre, &
Pianta, 2012; Kane & Staiger, 2012).2
!!!!!!!!!!!!!!!!!!!!!!!!!!!!!!!!!!!!!!!!!!!!!!!!!!!!!!!!
2
Reliability estimates for the MQI from the MET study were lower. One reason for this may be
that MET used the MQI Lite and not the full MQI instrument used in this study. The MQI Lite
has raters provide only overarching dimension scores, while the full instrument asks raters to
!
12!
Draft Document: Do not circulate or cite without permission of the author
The CLASS instrument captures more general classroom quality. By design, the
instrument is split into three dimensions. Based on factor analyses described above, I utilize two:
Classroom Emotional Support, which focuses on the classroom climate and teachers’
interactions with students; and Classroom Organization, including behavior management and
productivity of the lesson. Following the protocol provided by instrument developers, one
certified and trained rater watched and scored each lesson on 11 items for each fifteen-minute
segment on a scale from Low (1) to High (7). I reverse code one item from the Classroom
Organization dimension, “Negative Climate,” to align with the valence of the other items.
Therefore, in all cases, higher scores indicate better performance. Using the same method as
above, I estimate reliabilities of 0.55 for Classroom Emotional Support and 0.65 for Classroom
Organization.
In Table 2, I present summary statistics of teacher-level scores that are averaged across
raters (for the MQI), segments, and lessons. For the MQI, mean scores are slightly lower than the
middle of the scale itself: 1.26 for Ambitious Mathematics Instruction (out of 3; sd = 0.12) and
1.12 for Mathematical Errors and Imprecisions (out of 3; sd = 0.12). For the CLASS, mean
scores are centered above the middle of the scale: 4.26 for Classroom Emotional Support (out of
7; sd = 0.55) and 6.52 for Classroom Organization (out of 7; sd = 0.44). Pairwise correlations
between these teacher-level scores range from roughly zero (between Mathematical Errors and
!!!!!!!!!!!!!!!!!!!!!!!!!!!!!!!!!!!!!!!!!!!!!!!!!!!!!!!!!!!!!!!!!!!!!!!!!!!!!!!!!!!!!!!!!!!!!!!!!!!!!!!!!!!!!!!!!!!!!!!!!!!!!!!!!!!!!!!!!!!!!!!!!!!!!!!!!!!!!!!!!!!!!!!!!!!!!!!!!!!
score teachers on up to five items before assessing an overall score. Another reason likely is
related to differences in scoring designs. MET had raters score 30 minutes of instruction from
each lesson. Comparatively, in this study, raters provided scores for the whole lesson, which is in
line with recommendations made by Hill, Charalambous, and Kraft (2012) in a formal
generalizability study. Finally, given MET’s intent to validate observation instruments for the
purpose of new teacher evaluation systems, they utilized a set of raters similar to the school
leaders and staff who will conduct these evaluations in practice. In contrast, other research shows
that raters who are selectively recruited due to a background in mathematics or mathematics
education and who complete initial training and ongoing calibration score more accurately on the
MQI than those who are not selectively recruited (Hill, Charalambous, Blazar, et al., 2012).
!
13!
Draft Document: Do not circulate or cite without permission of the author
Imprecisions and the two dimensions on the CLASS instrument) to 0.44 between Classroom
Emotional Support and Classroom Organization. Ambitious Mathematics Instruction is more
consistently related to the other instructional quality dimensions, with correlations between 0.19
and 0.34. These correlations are high enough to suggest that high-quality teachers who engage in
one type of instructional practice may also engage in others, but not too high to indicate that
dimensions measure the same construct.
!
14!
Draft Document: Do not circulate or cite without permission of the author
Table 2
Univariate and Bivariate Descriptive Statistics of Instructional Quality Dimensions
Univariate Statistics
School-Grade-Year
Level
Mean
SD
Mean
SD
Adjusted
Intraclass
Correlation
1.26
0.12
1.27
0.10
0.69
1
1.12
0.12
1.12
0.08
0.52
-0.33***
1
4.26
0.55
4.24
0.34
0.55
0.34***
-0.01
1
6.32
0.44
6.33
0.31
0.65
0.19***
0.05
0.44***
Teacher Level
Ambitious Mathematics Instruction
Linking and Connections
Explanations
Multiple Methods
Generalizations
Math Language
Remediation of Student Difficulty
Use of Student Productions
Student Explanations
Student Mathematical Questioning and Reasoning
Enacted Task Cognitive Activation
Mathematical Errors and Imprecisions
Major Mathematical Errors
Language Imprecisions
Lack of Clarity
Classroom Emotional Support
Positive Climate
Teacher Sensitivity
Respect for Student Perspectives
Classroom Organization
Negative Climate
Behavior Management
Productivity
Pairwise Correlations
Ambitious
Mathematics
Instruction
Mathematical
Errors and
Imprecisions
Classroom
Emotional
Support
Classroom
Organization
Notes: Statistics generated from all available data. MQI items (from Ambitious Mathematics Instruction and Mathematical Errors and Imprecisions) on a scale from 1 to 3.
CLASS items (from Classroom Emotional Support and Classroom Organization) on a scale from 1 to 7.
1
Draft Document: Do not circulate or cite without permission of the author
As I discuss below, my identification strategy relies on instructional quality scores at the
school-grade-year level. While this strategy loses between-teacher variation, which likely is the
majority of the variation in instructional quality scores, I still find substantive variation in
instructional quality scores within schools, across grades and years. In Table 3, I decompose the
variation in school-grade-year scores into two components: the school-level component, which
describes the percent of variation that lies across schools, and the residual component, which
describes the rest of the variation that lies within schools. For all four instructional quality
dimensions, I find that at least 40% of the variation in school-grade-year scores lies within
schools. This leads me to conclude that there is substantive variation within schools at the
school-grade-year level to exploit in this analysis.
Table 3
Variance Decomposition of School-Grade-Year Instructional
Quality Scores
School
Ambitious Mathematics Instruction
0.59
Mathematical Errors and Imprecisions
0.46
Classroom Emotional Support
0.45
Classroom Organization
0.52
Notes: Sample includes 76 school-grade-years.
Residual
0.41
0.54
0.55
0.48
In order to minimize noise in these observational measures, I use all available lessons for
each teacher (Hill, Charalambous, & Kraft, 2012). Teachers who participated in the study for one
year had three lessons, on average, while those who participated in the study for two years
generally had six lessons. A second benefit of this approach is that reduces the possibility for
bias due to unobserved classroom characteristics that affect both instructional quality and student
outcomes (Kane, Taylor, Tyler, & Wooten, 2011).3 This is because, in roughly half of cases,
!!!!!!!!!!!!!!!!!!!!!!!!!!!!!!!!!!!!!!!!!!!!!!!!!!!!!!!!
3!Kane et al. (2011) argue that cotemporaneous measurement of teacher observation scores and
student outcomes may bias estimates due to class characteristics that affect both the predictor and
!
16!
Draft Document: Do not circulate or cite without permission of the author
scores represent elements of teachers’ instruction from the prior year or future year, in addition
to the current year. Specifically, I utilize empirical Bayes estimation to shrink scores back toward
the mean based on their precision (see Raudenbush & Bryk, 2002). To do so, I specify the
following hierarchical linear model using all available data, including teachers beyond my
identification sample:
(1)
!"#$%!"#$%&!" = !! + !!"
where the outcome is the observation score for lesson l and teacher j, !! is a random effect for
each teacher j, and !!" is the error term. I utilize standardized estimates of the teacher-level
random effect as each teacher’s observation score. Most distributions of these variables are
roughly normal. For identification, I average these scores within each school-grade-year. I do not
re-standardize these school-grade-year scores in order to interpret estimates in teacher-level
standard deviation units, which are more meaningful than school-grade-year units.
3.2.2
Student Demographic and Test-Score Data
One source of student-level data is district administrative records. Demographic data
include gender, race/ethnicity, special education (SPED) status, limited English proficiency
(LEP) status, and free- or reduced-price lunch (FRPL) eligibility. I also utilize prior-year test
!!!!!!!!!!!!!!!!!!!!!!!!!!!!!!!!!!!!!!!!!!!!!!!!!!!!!!!!!!!!!!!!!!!!!!!!!!!!!!!!!!!!!!!!!!!!!!!!!!!!!!!!!!!!!!!!!!!!!!!!!!!!!!!!!!!!!!!!!!!!!!!!!!!!!!!!!!!!!!!!!!!!!!!!!!!!!!!!!!!
the outcome. I do not do so here for both practical and substantive reasons. The sample of
school-grade-years in which all teachers have out-of-year observation scores is too limited to
conduct the same sort of analysis. In addition, as this study is interested in the effect of
instruction on student outcomes, I want to utilize scores that capture the types of practices and
activities in which students themselves are engaged.
At the same time, I am able to examine the extent to which Kane et al.’s hypothesis plays
out in my own data. To do so, I explore whether changes in classroom composition predict
changes in instructional quality for those 45 teachers for whom I have two years of observation
data. In Appendix Table A1, I present estimates from models that regress each instructional
quality dimension on a vector of observable class characteristics and teacher fixed effects. Here,
I observe that classroom composition only predicts within-teacher, cross-year differences in
Classroom Emotional Support (F = 2.219, p = 0.035). This suggests that attention to omitted
variables related both to Classroom Emotional Support and student achievement may be
important.
!
17!
Draft Document: Do not circulate or cite without permission of the author
scores on state assessments in both math and reading, which are standardized within district by
grade, subject, and year using the entire sample of students in each district, grade, subject, and
year.
Student outcomes were measured in both fall and spring on a new assessment developed
by researchers who created the MQI in conjunction with the Educational Testing Service (see
Hickman, Fu, & Hill, 2012). Validity evidence indicates internal consistency reliability of 0.82
or higher for each form across the relevant grade levels and school years. Three key features of
this test make it ideal for this study. First, the test is common across all districts and students in
the sample, which is important given evidence on the sensitivity of statistical models of teacher
effectiveness to different achievement tests (Lockwood, McCaffrey, Hamilton, Stecher, Le, &
Martinez, 2007; Papay, 2011). Second, the test is vertically aligned, allowing me to compare
achievement scores for students in fourth versus fifth grade. Third, the assessment is a relatively
cognitively demanding test, thereby well aligned to many of the teacher-level practices assessed
in this study, particularly those captured on the MQI instrument. It likely also is similar to new
mathematics assessments administered under the Common Core (National Governors
Association for Best Practices, 2010). Lynch, Chin, and Blazar (2015) coded items from this
assessment for format and cognitive demand using the Surveys of Enacted Curriculum
framework (Porter, 2002). They found that the assessment often asked students to solve nonroutine problems, including looking for patterns and explaining their reasoning. Roughly 20% of
items required short responses.
3.2.3
Teacher Survey
Information on teachers’ background, knowledge, and skills were captured on a teacher
questionnaire administered in the fall of each year. Survey items about teachers’ background
!
18!
Draft Document: Do not circulate or cite without permission of the author
include whether or not the teacher earned a bachelor’s degree in education, amount of
undergraduate or graduate coursework in math and math courses for teaching (2 items scored
from 1 [No Classes] to 4 [Six or More Classes], internal consistency reliability (!) = 0.66), route
to certification, and whether or not the teacher had a master’s degree (in any subject). Relatedly,
the survey also asked about the number of years of teaching experience in math.
Next, I capture teachers’ knowledge of content and of their students. Teachers’ content
knowledge was assessed on items from both the Mathematical Knowledge for Teaching
assessment (Hill, Schilling, & Ball, 2004) and the Massachusetts Test for Educator Licensure.
Teacher scores were generated by IRTPro software and were standardized in these models using
all available teachers, with a reliability of 0.92. Second are scores from a test of teachers’
knowledge of student performance. These scores were generated by providing teachers with
student test items, asking them to predict the percent of students who would answer each item
correctly, then calculating the distance between each teacher’s estimate and the actual percent of
students in their class who got each item correct. Similar to instructional quality scores, I report
reliability as adjusted intraclass correlations, which are 0.71 and 0.74 for grades four and five,
respectively. To arrive at a final scale, I averaged across items and standardized.
Finally, two items refer to additional classroom behaviors that aim to increase student
achievement. The first is teachers’ preparation for class, which asks about the amount of time
each week that teachers devoted to out-of-class activities such as grading, preparing lesson
materials, reviewing the content of the lesson, and talking with parents (4 items scored from 1
[No Time] to 5 [More than Six Hours], ! = 0.84). The second construct is formative assessment,
!
19!
Draft Document: Do not circulate or cite without permission of the author
which asks how often teachers evaluated student work and provided feedback (5 items scored
from 1 [Never] to 5 [Daily or Almost Daily], ! = 0.74).4
In Table 4, I present correlations between these characteristics and the four instructional
quality dimensions. The strongest correlation is between Mathematical Errors and Imprecisions
and mathematical content knowledge (r = -0.46). This suggests that teachers’ knowledge of the
content area is moderately to strongly related to their ability to present correct material in class.
The sign of this relationship is correct, in that higher scores on Mathematical Errors and
Imprecisions means that more errors are made in instruction, while higher scores on the content
knowledge test indicate stronger understanding of math. Content knowledge also is related to
Ambitious Mathematics Instruction (r = 0.26). Interestingly, math coursework is related to
Classroom Organization, and Mathematical Errors and Imprecisions is related to formative
assessment (r = 0.24), even though these constructs are not theoretically related. Together, this
suggests that the dimensions of instructional quality generally are distinct from other measures
often used as a proxy for teacher or teaching quality.
Table 4
Correlations Between Teacher Practices, Skills, and Background Characteristics
Ambitious
Mathematical
Classroom
Mathematics
Errors and
Emotional
Instruction
Imprecisions
Support
Bachelor's Degree in Education
-0.14
-0.03
-0.07
Math Coursework
0.08
0.08
0.15
Master's Degree
0.10
-0.05
0.00
Traditional Certification
0.09
-0.17~
0.12
Experience
-0.07
0.15
-0.04
Mathematical Content Knowledge
0.26**
-0.46***
0.03
Knowledge of Student Performance
0.18~
-0.16
0.00
Preparation for Class
0.02
0.07
-0.04
Formative Assessment
-0.01
0.24**
0.14
Notes: ~ p<0.10, * p<0.05, ** p<0.01, ***p<0.001
Classroom
Organization
0.13
0.30***
-0.12
0.12
0.05
0.01
0.09
0.10
0.17~
!!!!!!!!!!!!!!!!!!!!!!!!!!!!!!!!!!!!!!!!!!!!!!!!!!!!!!!!
4
Between three and six teachers are missing data for each of these constructs. Given that these
data are used for descriptive purposes and as controls, in these instances I impute the mean value
for the district. For more information on these scales, see Hill, Blazar, and Lynch (2015).
!
20!
Draft Document: Do not circulate or cite without permission of the author
4.
Identification Strategy and Tests of Assumptions
In order to estimate the relationship between high-quality instruction and students’
mathematics achievement, my identification strategy must address two main challenges: nonrandom sorting of students to teachers and omitted measures of teachers’ skills and practices. I
focus on each in turn.
4.1
Non-Random Sorting of Students to Teachers
Non-random sorting of students to teachers consists of two possible components: the
sorting of students to schools and of students to classes or teachers within schools. In Table 5, I
explore the extent to which these types of sorting might bias results by regressing baseline test
scores on all four dimensions of instructional quality (see Kane et al., 2011). Comparing teachers
within districts, Ambitious Mathematics Instruction is positively related to baseline achievement.
This suggests, unsurprisingly, that teachers with higher-quality math instruction tend to be
assigned to higher-achieving students. Interestingly, though, only part of this relationship is
explained by differences in instructional quality and student achievement across schools.
Comparing teachers within schools, the magnitude of the relationship between Ambitious
Mathematics Instruction and baseline achievement is substantively smaller but still statistically
significant. Further, I now observe a positive relationship between Classroom Organization and
baseline test scores. This indicates that within-school sorting and the matching of students to
teachers may occur differently than across-school sorting but that it likely serves as an additional
source of bias.
!
21!
Draft Document: Do not circulate or cite without permission of the author
Table 5
Relationships Between Assigned Students' Incoming Achievement and
Instructional Quality
Ambitious Mathematics Instruction
Mathematical Errors and Imprecisions
Classroom Emotional Support
Classroom Organization
Within
Districts
Within
Schools
0.180***
(0.026)
-0.022
(0.021)
-0.013
(0.018)
-0.003
(0.024)
0.060*
(0.028)
-0.034
(0.022)
-0.018
(0.023)
0.087**
(0.029)
Notes: ~ p< .10, * p<.05, ** p<.01, ***p<.001. Columns contain
estimates from separate regressions. Robust standard errors in
parentheses. All models control for district-by-grade-by-year fixed
effects. Sample includes 3,203 students, 111 teachers, and 76 schoolgrade-years.
In light of non-random sorting, I begin by specifying models that control for a host of
observable student and class characteristics, including prior achievement. Further, following
Kane, Taylor, Tyler, and Wooten (2011), I include school fixed effects to account for unobserved
differences across schools, other than instructional quality, that also affect student achievement.
Finally, to address sorting of students to classes or teachers within schools, I exploit an important
logistical and structural constraint of schools – that students may be sorted within but not across
grades and years. This is because, in most cases, students advance with a given cohort from one
grade to the next. Therefore, similar to Rivkin, Hanushek, and Kain (2005), I exploit betweencohort differences by aggregating teachers’ observation scores to the school-grade-year level.
They argue that “aggregation to the grade level circumvents any problems resulting from
classroom assignment” (p. 426). Doing so restricts identifying variation to that observed across
grades – e.g., between fourth-grade teachers in one year and fifth-grade teachers in the same,
following, or former school year. In a few instances where grade-level composition changes
!
22!
Draft Document: Do not circulate or cite without permission of the author
from one year to the next, there also is identifying variation between the set of fourth-grade
teachers in one year and the set of fourth-grade teachers in the following or former school year,
and similarly for fifth-grade teachers in one year and fifth-grade teachers in another year
The hypothesized model that describes this relationship is outlined in equation 2:
!!"#$%&' = !!"#$%&'()!*!"# +
!(!!"!! ) + !!! + !!!"# + !!"# + !! + !!"#$%&' (2)
where !!"#$%&' is the end-of-year test score for student i in district d, school s, grade g, and class c
with teacher j at time t; !"#$%&'()!*!"# is a vector of instructional quality scores that are
averaged across teachers within each school-grade-year; !(!!"!! ) is a cubic function of prior
achievement on the fall baseline assessment, as well as on the prior-year state assessments in
both math and reading; !! is a vector of observable student-level characteristics; !!"# aggregates
these and prior achievement measures to the class level. I include district-by-grade-by-year fixed
effects, !!"# , to account for differences in the scaling of state standardized test scores. As
discussed above, I also include fixed effects for schools, !! , as part of my identification strategy.
I calculate standard errors that are clustered at the school-grade-year level to account for
heteroskedasticity in the student-level errors, !!"#$%&' , and non-zero covariance among those
students attending the same school in the same grade and year (Kane, Rockoff, & Staiger, 2008).
The key identifying assumption of this model is that within-school, between-grade, and
cross-cohort differences in average instructional quality scores are exogenous (see Woessmann
& West, 2006 for a discussion of this assumption and strategy as it pertains to class size). While
the validity of this assumption is difficult to test directly, I can examine ways that it may play out
in practice. In particular, this assumption would be violated by strategic grade assignments in
which teachers are shifted across grades due to a particularly strong or weak incoming class, or
!
23!
Draft Document: Do not circulate or cite without permission of the author
where students are held back or advanced an additional grade in order to be matched to a specific
teacher.
Although these practices are possible in theory, I present evidence that such behavior
does not threaten inferences about variation in instructional quality scores. I do observe that 30
teachers were newly assigned to their grade, either because they switched from a different grade
in the prior year (before joining the study) or because they moved into the district. In Table 6, I
examine differences between switchers and non-switchers on observable characteristics within
school-year cells. In addition to comparing teachers on the characteristics listed in Tables 1 and 2,
I include average scores on all three baseline achievement tests; I also include state value-added
scores in math.5 Here, I find that switchers have students with lower prior-year achievement on
state math and reading exams (p = 0.037 and 0.002, respectively). Importantly, though, there are
no differences between switchers and non-switchers on any of the observational rubric
dimensions, any of the teacher survey constructs, or state value-added scores. Nor can I detect
differences between these two groups when all observable traits are tested jointly (F = 1.159, p =
0.315).6 This suggests that, even though switchers tend to have lower-achieving students, they
are unlikely to be matched to these classes based on observed quality. With regard to sorting of
students to grade, fewer than 20 were retained from the previous year or skipped a grade. I drop
these from the analytic sample.
!!!!!!!!!!!!!!!!!!!!!!!!!!!!!!!!!!!!!!!!!!!!!!!!!!!!!!!!
5
Value-added scores are calculated from a model similar to equation (2). Here, I regress end-ofyear student mathematics test scores on state assessments on a vector of prior achievement;
student-, class-, and school-level covariates; and district-by-grade-by-year fixed effects. I predict
a teacher-level random effect as the value-added score. I utilize all years of data and all teachers
in the sample districts and grades to increase the precision of my estimates (Goldhaber & Hansen,
2012; Koedel & Betts 2011; Schochet & Chiang, 2013).!
6
In some instances, mean scores for both switchers and non-switchers on standardized variables
fall below or above zero (e.g., Classroom Emotional Support). This is possible given that
variables were standardized across all teachers in the study, not just those in the identification
sample.
!
24!
Draft Document: Do not circulate or cite without permission of the author
Table 6
Differences Between Teachers Who Switch Grade Assignments and Those Who Do Not
Instructional Quality Dimensions
Ambitious Mathematics Instruction
Mathematical Errors and Imprecisions
Classroom Emotional Support
Classroom Organization
Other Measures of Teacher Quality
Bachelor's Degree in Education
Math Coursework
Master's Degree
Traditional Certification
Experience
Mathematical Content Knowledge
Knowledge of Student Performance
Preparation for Class
Formative Assessment
Student Achievement Measures
Fall Project-Administered Math Test
Prior-Year State Math Test
Prior-Year State Reading Test
State Value-Added in Math
Join Test
Switchers
NonSwitchers
p-value on
Difference
-0.05
-0.07
-0.18
-0.22
0.03
-0.20
-0.25
-0.11
0.660
0.463
0.752
0.596
63.0
2.2
74.4
69.7
7.8
-0.19
0.20
3.3
3.5
42.7
2.4
77.4
74.7
10.1
-0.01
0.06
3.3
3.7
0.169
0.259
0.781
0.613
0.208
0.558
0.519
0.981
0.318
-0.35
-0.05
-0.09
-0.03
-0.12
0.318
0.08
0.037
0.10
0.002
-0.01
0.646
F-statistic
1.098
p-value
0.367
Teacher-Year Observations
30
126
Notes: Means and p-values estimated from individual regressions that control for schoolyear, which is absorbed in the model. See Table 1 for scale of teacher quality measures.
All other items are standardized.
A second assumption underlying the logic of this strategy is that identification holds only
when all teachers at a given school-grade-year are in the study. If only a portion of the teachers
participate, then there may be bias due to the selection of students assigned to these teachers. To
address this concern, I limit my final analytic sample to school-grade-years in which I have full
participation of teachers. I am able to identify these teachers as I have access to class rosters for
all teachers who work in the sample districts. I exclude from these school-grade-year teams
teachers who teach self-contained special education or bilingual classes, as the general
population of students would not be sorted to these teachers’ classes.7
!!!!!!!!!!!!!!!!!!!!!!!!!!!!!!!!!!!!!!!!!!!!!!!!!!!!!!!!
7
I identify these specialized classes in cases where more than 50% of students have this
designation.
!
25!
Draft Document: Do not circulate or cite without permission of the author
By dropping certain school-grade-year observations, I limit the sample from which I am
able to generalize results. In this sense, I compromise external validity for internal validity.
However, below I discuss the comparability of teachers and school-grade-years included in my
identification sample to those that I exclude either because they did not participate in data
collection through the NCTE project or because they did not meet the sample conditions I
describe above.
4.2
Omitted Variables Bias
Given non-random sorting of instructional quality to teachers, estimating the effect of
these practices on mathematics achievement also requires isolating them from other
characteristics that are related both to observation rubric scores and to student test scores. I focus
on characteristics that prior research suggests may fit the definition of omitted variables bias in
this type of analysis.
Review of prior research indicates that several observable characteristics are related both
to student achievement and instructional quality. Studies indicate that students experience larger
test score gains in math from teachers with prior education and coursework in this content area
(Boyd, Grossman, Lankford, Loeb, & Wyckoff, 2009; Wayne & Youngs, 2003), some forms of
alternative certification such as Teach for America relative to traditional certification (Clark et al,
2013; Decker, Mayer, & Glazerman, 2004), more experience in the classroom (Chetty et al.,
2011; Papay & Kraft, forthcoming; Rockoff, 2004), and stronger content knowledge (Metzler &
Woessmann, 2012). Emerging work also highlights the possible role of additional professional
competencies, such as knowledge of student performance, in raising student achievement
(Kunter, Klusmann, Baumert, Richter, Voss, & Hachfeld, 2013; Sadler, Sonnert, Coyle, CookSmith, & Miller, 2013). These factors also appear to predict some dimensions of instructional
!
26!
Draft Document: Do not circulate or cite without permission of the author
quality in this or other datasets (see Table 3 and Hill, Blazar, & Lynch, 2015 for further
discussion).
Because it is possible that I am missing other important characteristics – namely
unobservable ones – I test the sensitivity of results to models that include different sets of
teacher-level covariates. I also interpret results cautiously. Despite this limitation, I believe that
my ability to isolate instructional practices from a range of other teacher traits and skills is an
advance beyond similar studies.
5.
Results
5.1
Main Results
In Table 7a, I present models examining the relationship between instructional quality
and student achievement. This first set of models examines the robustness of estimates to
specifications that attempt to account for the non-random sorting of students to schools and
teachers. I begin with a basic model (Model A) that regresses students’ spring test score on
teacher-level observation scores. I include a cubic function of fall/prior achievement on the
project-administered test and state standardized tests in math and reading; utilizing all three tests
of prior achievement allows me to compare students with similar scores on low- and high-stakes
tests across both subjects, increasing the precision of my estimates. I also include district-bygrade-by-year dummy variables to account for differences in scaling of tests; and vectors of
student-, class-, and school-level covariates. Next, I replace school-level covariates with school
fixed effects (Model B). In Model C, I retain the school fixed effects and replace observation
scores at the teacher level with those at the school-grade-year level. This model matches
equation (2) above. Finally, in order to ensure that school-specific year effects do not drive
results, I replace school fixed effects with school-by-year fixed effects in Models D. For all
!
27!
Draft Document: Do not circulate or cite without permission of the author
models, I limit the sample to those school-grade-years where all teachers from participating
school-grades-years are in the study. Robust standard errors clustered at the school-grade-year
level are reported in parentheses.8
Table 7a
Relationships Between Students' Mathematics Achievement and Instructional Quality, Accounting for
Non-Random Sorting
Model A
Model B
Model C
Model D
Ambitious Mathematics Instruction
0.061
0.095*
0.097*
0.109*
(0.038)
(0.037)
(0.042)
(0.052)
Mathematical Errors and Imprecisions
-0.033
-0.040~
-0.050~
-0.053~
(0.022)
(0.023)
(0.026)
(0.029)
Classroom Emotional Support
-0.028
-0.001
-0.032
-0.026
(0.021)
(0.023)
(0.035)
(0.037)
Classroom Organization
0.026
-0.002
-0.003
-0.015
(0.025)
(0.024)
(0.034)
(0.037)
Student Covariates
X
X
X
X
Class Covariates
X
X
X
X
District-by-Grade-by-Year Fixed Effects
X
X
X
X
School Covariates
X
School Fixed Effects
X
X
Instructional Quality at School-Grade-Year Level
X
X
School-by-Year Fixed Effects
X
Notes: ~ p<0.10, * p<0.05, ** p<0.01, ***p<0.001. Columns contain estimates from separate
regressions. Robust standard errors clustered at the school-grade-year level in parentheses. Sample
includes 3,203 students, 111 teachers, and 76 school-grade-years.
In Model C, intended to account for non-random sorting of students to schools and
teachers, I find that instructional quality dimensions focused on the mathematics presented in the
classroom are related to students’ math achievement. Specifically, I find a statistically significant
and positive coefficient for Ambitious Mathematics Instruction of 0.10 sd; the coefficient for
Mathematical Errors and Imprecisions of -0.05 sd is marginally significant.
Interestingly, these estimates are larger in magnitude than those from Models A and B.
Comparison of estimates to Model A implies that schools and/or classrooms where instruction is
higher quality tend to have below-average test-score growth. The fact that estimates in Model C
!!!!!!!!!!!!!!!!!!!!!!!!!!!!!!!!!!!!!!!!!!!!!!!!!!!!!!!!
8
I also test the robustness of results to clustering of standard errors at the school-year level, and
find that standard errors and significance levels presented below do not change substantively.
!
28!
Draft Document: Do not circulate or cite without permission of the author
are larger than those in Model B is surprising. By limiting variation to school-grade-years, I
expected to calculate lower-bound estimates of the relationship between instructional quality and
student achievement (see Rivkin, Hanushek, & Kain, 2005). One possible explanation for my
findings may be that school-grade-year scores are picking up the quality of teaching teams,
which also is related to student achievement. At the same time, these differences are not large.
Further, standard errors are larger in Model C than in Model B, as I would expect given more
limited variation in my main predictor variables. Finally, I find that estimates in Model D, which
replace school fixed effects with school-by-year fixed effects, are similar in magnitude to those
in Model C. This indicates that year effects do not drive results. As before, standard errors are
larger than those in Model C given more limited identifying variation. I find no statistically
significant relationships for the two other dimensions of instruction.
In Table 7b, I re-estimate results from Model C controlling for different sets of teacher
characteristics. I focus on four categories of covariates: education and certification (Model E),
teaching experience (Model F), knowledge (Model G), and non-instructional classroom
behaviors (Model H). In Model I, I include all four sets of predictors. Similar to instructional
quality dimensions, these covariates are averaged to the school-grade-year level. Here, I find that
estimates for Ambitious Mathematics Instruction are fairly robust to inclusion of these control
variables. In Model G, which controls for two measures of teacher knowledge, I find a
marginally significant estimate of 0.08 sd. This slight attenuation makes sense given the positive
relationship between mathematical content knowledge and Ambitious Mathematics Instruction
noted earlier. Interestingly, coefficients from models that include other sets of covariates are
slightly larger than my estimate of 0.10 sd from Model C; in Model I, which controls for all
teacher characteristics, the resulting estimate is roughly 0.11 sd. One reason for this may be that
!
29!
Draft Document: Do not circulate or cite without permission of the author
be these additional predictors are negatively related either to instructional quality or to student
achievement. Earlier, I showed a negative, though not statistically significant, correlation
between Ambitious Mathematics Instruction and bachelor’s degree in education; here, I observe
small but negative relationships to student achievement for bachelor’s degree in education, math
coursework, traditional certification, and preparation for class. I am cautious in placing too much
emphasis on these differences, as they are not large. However, these patterns suggest that some
omitted variables may lead to upward bias while others lead to downward bias.
Table 7b
Relationships Between Students' Mathematics Achievement and Instructional Quality, Accounting for
Possible “Omitted” Variables
Model E
Model F
Model G
Model H
Model I
Ambitious Mathematics Instruction
0.124**
0.096*
0.083~
0.121**
0.114*
(0.042)
(0.039)
(0.045)
(0.041)
(0.044)
Mathematical Errors and Imprecisions
-0.049~
-0.049~
-0.035
-0.038
-0.028
(0.027)
(0.029)
(0.026)
(0.027)
(0.035)
Classroom Emotional Support
-0.038
-0.031
-0.025
-0.044
-0.041
(0.031)
(0.036)
(0.036)
(0.034)
(0.036)
Classroom Organization
0.010
-0.002
-0.009
-0.002
-0.002
(0.035)
(0.033)
(0.034)
(0.035)
(0.039)
Bachelor's Degree in Education
0.010
-0.004
(0.065)
(0.072)
Math Coursework
-0.027
-0.019
(0.021)
(0.028)
Master's Degree
0.086
0.022
(0.070)
(0.075)
Traditional Certification
-0.013
-0.019
(0.068)
(0.077)
Experience
-0.001
-0.000
(0.004)
(0.005)
Mathematical Content Knowledge
0.017
0.008
(0.020)
(0.031)
Knowledge of Student Performance
0.035
0.038
(0.041)
(0.044)
Preparation for Class
-0.054~
-0.044
(0.030)
(0.038)
Formative Assessment
0.028
0.027
(0.032)
(0.037)
Notes: ~ p< .10, * p<.05, ** p<.01, ***p<.001. Columns contain estimates from separate regressions.
Robust standard errors clustered at the school-grade-year level in parentheses. All models control for
student and class covariates, as well as district-by-grade-by-year and school fixed effects. Instructional
quality and background characteristics are averaged at the school-grade-year level. Sample includes 3,203
students, 111 teachers, and 76 school-grade-years.
!
30!
Draft Document: Do not circulate or cite without permission of the author
The relationship between Mathematical Errors and Imprecisions and student
achievement is more sensitive to inclusion of control variables. Original estimates from Model C
are attenuated most significantly when controlling for teachers’ mathematical content
knowledge; the resulting estimate of roughly -0.04 sd in Model G is no longer marginally
statistically significant. This attenuation is unsurprising given a moderate to strong relationship
between Mathematical Errors and Imprecisions and mathematical content knowledge noted
earlier (r = -0.46). Therefore, it is difficult to tell whether student achievement is negatively
impacted by teachers’ lack of content knowledge, the way that this lack of knowledge leads to
errors and imprecisions in the presentation of material, or a related construct. When I include all
sets of predictors in the same model (Model I), the estimate for Mathematical Errors and
Imprecisions is -0.03 sd and not statistically significant.
5.2
Generalizability of Results Beyond Identification Sample
Finally, in Table 8, I examine whether teachers and schools included in my identification
sample are representative of those in their respective districts. Because I do not have
instructional quality scores for all district teachers, for this analysis I draw on mathematics valueadded scores using state assessment data. I also compare observable characteristics of schoolgrade-years from my identification sample to those across the rest of the sample districts, looking
for differences on each characteristic individually and as a group. P-values testing the difference
between sample means are calculated through a regression framework that controls for district,
as recruitment of schools and teachers occurred at this level. In both cases of teachers and
school-grade-years, I cannot reject the null hypothesis that my identification sample is the same
as the rest of the district populations (for differences in teachers’ value-added scores: p = 0.123;
!
31!
Draft Document: Do not circulate or cite without permission of the author
for joint differences in observable characteristics of school-grade-years: F = 0.902, p = 0.531).
Therefore, I conclude that results likely generalizable to these populations. !!
Table 8
Differences Between Identification Sample and District Populations
Teacher Characteristic
State Value-Added
Teacher-Year Observations
School-Grade-Year Characteristics
Male
African-American
Asian
Hispanic
White
FRPL
SPED
LEP
Prior-Year State Math Test
Prior-Year State Reading Test
Joint Test
In
Identification
Sample
Out of
Identification
Sample
-0.02
156
0.00
1,334
p-value on
Difference
0.123
50.1
0.361
55.3
0.659
3.9
0.404
26.0
0.833
11.6
0.996
76.3
0.504
15.7
0.240
20.8
0.810
0.04
0.299
0.05
0.409
F-statistic
0.902
p-value
0.531
School-Grade-Year Observations
76
511
Notes: Means and p-values calculated from individual regressions that control for district.
School-grade-year demographic characteristics are percents; test scores are standardized.
6.
49.1
53.7
4.6
26.6
11.6
74.2
17.1
21.3
-0.02
0.00
Discussion and Conclusion
This study provides some of the strongest evidence to date on the relationship between
specific instructional dimensions and students’ mathematics achievement. Like others (e.g., Kane
et al., 2013; Kane & Staiger, 2012; Kane et al., 2011), I utilize observation instruments that
capture instructional quality within teachers’ own classrooms. I also draw on established
econometric methods to account for the non-random sorting of students to teachers (e.g., Rivkin,
Hanushek, & Kain, 2005). Importantly, I build on past work by examining multiple dimensions
of teaching practice, including content-specific elements of instruction and more general
pedagogical strategies. Further, I examine the sensitivity of results to models that control for
different sets of teacher characteristics. This allows me to isolate dimensions of instructional
!
32!
Draft Document: Do not circulate or cite without permission of the author
quality from the most likely observable characteristics that might threaten the internal validity of
my results. To my knowledge, no other studies are able to control for this broad set of teaching
practices and teacher characteristics. While it is possible that estimates are sensitive to other
observed or unobserved characteristics not included in these data, my findings provide strong
suggestive evidence of teaching dimensions that support student achievement.
Results indicate that inquiry-oriented instruction is positively related to student outcomes
on a low-stakes math test, with an effect size of roughly 0.10 sd. This finding lends support to
decades worth of reform to refocus mathematics instruction toward inquiry and concept-based
teaching (National Council of Teachers of Mathematics, 1989, 1991, 2000), as well as positive
results of some of these types of activities in laboratory settings (e.g., Star & Rittle-Johnson,
2009). In some analyses, I also find smaller effect sizes for incorrect presentation of content,
though estimates are sensitive to the set of covariates included in the model, particularly teachers’
content knowledge. At the same time, even the smallest estimate of roughly 0.03 sd (see Model I
in Table 7b) is similar in magnitude to estimates of the relationship between mentor evaluations
and student achievement (Rockoff & Speroni, 2010), suggesting that this finding may still be
substantively significant.
Finally, I find no relationship between classroom climate or classroom management and
student achievement. These results diverge from recent research highlighting the importance of
classroom organization and interactions with students, often above other classroom features
(Grossman, Loeb, Cohen, & Wyckoff, 2013; Stronge, Ward, & Grant, 2011). In particular, Kane
and co-authors (2011, 2012, 2013) found positive relationships between these sorts of classroom
practices, as captured on the Framework for Teaching observation instrument, and student
achievement; estimates were similar in magnitude to the relationship I find between Ambitious
!
33!
Draft Document: Do not circulate or cite without permission of the author
Mathematics Instruction and student outcomes. One reason for these differences may be that
these other studies did not account for additional dimensions of teacher and teaching quality.
Therefore, the observed relationship between classroom organization and student achievement
may be driven by other practices and skills that are related to this type of instruction. Another
reason may be that the outcome used to measure math achievement in this study is a low-stakes
test that emphasizes cognitively demanding mathematics practices. Classroom organization and
interactions with students may in fact be important contributors to high-stakes achievement tests
or non-cognitive outcomes. This is an important topic for future research.
Evidence on the relationship between specific types of teaching and student achievement
raises the question of how to get more teachers who engage in these practices into classrooms.
Following Murnane and Cohen (1986), I argue that incentives are unlikely to prove effective
here, as teachers may not know how to improve their instruction. Therefore, I propose two
possible pathways. First, an array of recent literature highlights the potential use of observation
instruments themselves to remediate teacher practice. Despite mixed results on the effect of
standard professional development programs on teachers’ content knowledge, instructional
practices, or student achievement (Garet et al., 2011; Yoon, Duncan, Lee, Scarloss, & Shapley,
2007), new experimental studies highlight positive effects of more intensive coaching programs
that utilize observation instruments to improve teacher behaviors and, in some cases, student
outcomes (Allen et al., 2011; Blazar & Kraft, forthcoming; McCollum, Hemmeter, & Hsieh,
2011; Taylor & Tyler, 2012). Thus far, this sort of work has focused on use of observation
instruments to capture general teaching practices and those specific to literacy instruction.
However, it is possible that findings also extend to inquiry-oriented practices in mathematics.
!
34!
Draft Document: Do not circulate or cite without permission of the author
A second pathway to increase the quality of classroom teaching may also focus on
selective recruitment of teachers with content-area expertise. My findings show a moderate to
strong relationship between teachers’ knowledge of math and the way that this content is enacted
in the classroom. Further, I find suggestive evidence of a relationship between incorrect
presentation of content and student outcomes. While more research is needed to confirm these
relationships, these patterns may inform processes by which education preparation programs and
state licensing agencies screen prospective elementary math teachers. A survey of degree
pathways indicates minimal requirements for entry and a high degree of variability in the type of
training pre-service teachers receive in mathematics. In addition, in all but a few states,
elementary teachers can pass their licensing exam without passing the math sub-section (Epstein
& Miller, 2011). It is possible that creating more stringent requirements into the workforce
related to math knowledge could lead to more accurate and precise presentation of content and to
better student outcomes.
Filling elementary classrooms with teachers who engage in effective mathematics
teaching practices will take time. Doing so likely will entail a variety of efforts, including
improvements in professional development offerings that engage teachers substantively around
their own teaching practices and stronger efforts to hire teachers with deep knowledge of
mathematics. Importantly, though, the education community is beginning to gain an
understanding of the types of teaching that contribute to student achievement.
!
35!
Draft Document: Do not circulate or cite without permission of the author
Acknowledgements
The research reported here was supported in part by the Institute of Education Sciences,
U.S. Department of Education (Grant R305C090023) to the President and Fellows of Harvard
College to support the National Center for Teacher Effectiveness. Additional support comes
from the National Science Foundation (Grant 0918383). The opinions expressed are those of the
authors and do not represent views of the Institute or the U.S. Department of Education. I thank
Mark Chin, Heather Hill, Tom Kane, Dick Murnane, Marty West, and John Willett for their
guidance and feedback throughout the study.
!
36!
Draft Document: Do not circulate or cite without permission of the author
Works Cited
Allen, J. P., Pianta, R. C., Gregory, A., Mikami, A. Y., & Lun, J. (2011). An interaction-based
approach to enhancing secondary school instruction and student achievement. Science,
333, 1034-1037.
Anderson, L. M., Evertson, C. M., & Brophy, J. E. (1979). An experimental study of effective
teaching in first-grade reading groups. The Elementary School Journal, 79(4), 193-223.
Bell, C. A., Gitomer, D. H., McCaffrey, D. F., Hamre, B. K., Pianta, R. C., & Qi, Y. (2012). An
argument approach to observation protocol validity. Educational Assessment, 17(2-3),
62-87.
Blazar, D., Braslow, D., Charalambous, C. Y., & Hill, H. C. (2015). Attending to general and
content-specific dimensions of teaching: Exploring factors across two observation
instruments. Working Paper. Cambridge, MA: National Center for Teacher Effectiveness,
Harvard University.
Blazar, D., & Kraft, M. A. (Forthcoming). Exploring mechanisms of effective teacher coaching:
A tale of two cohorts from a randomized experiment. Educational Evaluation and Policy
Analysis.
Boyd, D., Grossman, P., Lankford, H., Loeb, S., & Wyckoff, J. (2006). How changes in entry
requirements alter the teacher workforce and affect student achievement. Education
Finance and Policy, 1(2), 176-216.
Boyd, D. J., Grossman, P. L., Lankford, H., Loeb, S., & Wyckoff, J. (2009). Teacher preparation
and student achievement. Educational Evaluation and Policy Analysis, 31(4), 416-440.
!
37!
Draft Document: Do not circulate or cite without permission of the author
Chetty, R., Friedman, J. N., Hilger, N., Saez, E., Schazenbach, D. W., & Yagan, D. (2011). How
does your kindergarten classroom affect your earnings? Evidence from Project Star.
Quarterly Journal of Economics, 126(4), 1593-1660.
Chetty, R., Friedman, J. N., & Rockoff, J. E. (2014). Measuring the impacts of teachers II:
Teacher value-added and student outcomes in adulthood. American Economic Review,
104(9), 2633-79.
Clark, M.A., Chiang, H.S., Silva, T., McConnell, S., Sonnenfeld, K., Erbe, A., & Puma, M.
(2013). The effectiveness of secondary math teachers from Teach For America and the
Teaching Fellows programs. Washington, DC: U.S. Department of Education.
Clotfelter, C. T., Ladd, H. F., & Vigdor, J. L. (2006). Teacher-student matching and the
assessment of teacher effectiveness. Journal of Human Resources, 41(4), 778-820.
Decker, P. T., Mayer, D. P., & Glazerman, S. (2004). The effects of Teach for America on
students: Findings from a national evaluation. Princeton, NJ: Mathematica Policy
Research, Inc.
Duncan, A. (2010). Back to school: Enhancing U.S. education and competitiveness. Foreign
Affairs, 89(6), 65-74.
Epstein, D., & Miller, R. T. (2011). Slow off the Mark: Elementary School Teachers and the
Crisis in STEM Education. Education Digest: Essential Readings Condensed for Quick
Review, 77(1), 4-10.
Fryer, R. (2013). Teacher incentives and student achievement. Evidence from New York City
public schools. Journal of Labor Economics, 31(2), 373-427.
Garet, M. S., Wayne, A. J., Stancavage, F., Taylor, J., Eaton, M., Walters, K., Song, M., Brown,
S., Hurlburt, S., Zhu, P., Sepanik, S., & Doolittle, F. (2011). Middle school mathematics
!
38!
Draft Document: Do not circulate or cite without permission of the author
professional development impact study: Findings after the second year of implementation.
Washington, DC: U.S. Department of Education.
Goldhaber, D., & Hansen, M. (2012). Is it just a bad class? Assessing the long‐term stability of
estimated teacher performance. Economica, 80(319), 589-612.
Grossman, P., Loeb, S., Cohen, J., & Wyckoff, J. (2013). Measure for measure: The relationship
between measures of instructional practice in middle school English language arts and
teachers’ value-added. American Journal of Education, 119(3), 445-470.
Hanushek, E. A. (2009). Teacher deselection. In D. Goldhaber & J. Hannaway (Eds.), Creating a
new teaching profession (p. 165-180). Washington, D C: Urban Institute Press.
Harris, D. N., & Sass, T. R. (2011). Teacher training, teacher quality and student
achievement. Journal of Public Economics, 95(7), 798-812.
Hickman, J. J., Fu, J., & Hill, H. C. (2012). Technical report: Creation and dissemination of
upper-elementary mathematics assessment modules. Princeton, NJ: Educational Testing
Service.
Hill, H. C., Blazar, D., Lynch, K. (2015). Predicting teachers’ instructional practices: Elements
that support strong instruction. Working Paper. Cambridge, MA: National Center for
Teacher Effectiveness, Harvard University.
Hill, H. C., Charalambous, C. Y., Blazar, D., McGinn, D., Kraft, M. A., Beisiegel, M., Humez,
A., Litke, E., & Lynch, K. (2012). Validating arguments for observational instruments:
Attending to multiple sources of variation. Educational Assessment, 17(2-3), 88-106.
Hill, H. C., Charalambous, C. Y., & Kraft, M. A. (2012). When rater reliability is not enough:
Teacher observation systems and a case for the generalizability study. Educational
Researchers, 41(2), 56-64.
!
39!
Draft Document: Do not circulate or cite without permission of the author
Hill, H.C., Schilling, S.G., & Ball, D.L. (2004). Developing measures of teachers’ mathematics
knowledge for teaching. Elementary School Journal, 105, 11-30.
Ho, A. D., & Kane, T. J. (2013). The reliability of classroom observations by school personnel.
Seattle, WA: Measures of Effective Teaching Project, Bill and Melinda Gates Foundation.
Jacob B. A., & Lefgren L. (2008). Can principals identify effective teachers? Evidence on
subjective performance evaluation in education. Journal of Labor Economics, 20(1), 101136.
Johnson, C. (2012). Implementation of STEM education policy: Challenges, progress, and
lessons learned. School Science and Mathematics, 112(1), 45-55.
Kane, T. J., McCaffrey, D. F., Miller, T., & Staiger, D. O. (2013). Have we identified effective
teachers? Validating measures of effective teaching using random assignment. Seattle:
The Bill and Melinda Gates Foundation.
Kane, T. J., Rockoff, J. E., & Staiger, D. O. (2008). What does certification tell us about teacher
effectiveness? Evidence from New York City. Economics of Education Review, 27(6),
615-631.
Kane, T. J., & Staiger, D. O. (2012). Gathering feedback for teaching: Combining high-quality
observations student surveys and achievement gains. Seattle: The Bill and Melinda Gates
Foundation.
Kane, T. J., Taylor, E. S., Tyler, J. H., & Wooten, A. L. (2011). Identifying effective classroom
practices using student achievement data. Journal of Human Resources, 46(3), 587-613.
Koedel, C., & Betts, J. R. (2011). Does student sorting invalidate value-added models of teacher
effectiveness? An extended analysis of the Rothstein critique. Education Finance and
Policy, 6(1), 18-42.
!
40!
Draft Document: Do not circulate or cite without permission of the author
Kunter, M., Klusmann, U., Baumert, J., Richter, D., Voss, T., & Hachfeld, A. (2013).
Professional competence of teachers: Effects on instructional quality and student
development. Journal of Educational Psychology, 105(3), 805-820.
Lockwood, J. R., McCaffrey, D. F., Hamilton, L. S., Stecher, B., Le V., & Martinez, J. F. (2007).
The sensitivity of value-added teacher effect estimates to different mathematics
achievement measures. Journal of Educational Measurement, 44(1), 47-67.
Lynch, K., Chin, M., & Blazar, D. (2015). How well do teacher observations of elementary
mathematics instruction predict value-added? Exploring variability across districts. Working
Paper. Cambridge, MA: National Center for Teacher Effectiveness, Harvard University.
McCollum, J. A., Hemmeter, M. L., & Hsieh, W. (2011). Coaching teachers for emergent
literacy instruction using performance-based feedback. Topics in Early Childhood
Education, 20(10), 1-10.
Metzler, J., & Woessmann, L. (2012). The impact of teacher subject knowledge on student
achievement: Evidence from within-teacher within-student variation. Journal of
Development Economics, 99(2), 486-496.
Murnane, R. J., & Cohen, D. K. (1986). Merit pay and the evaluation problem: Why most merit
pay plans fail and a few survive. Harvard Educational Review, 56(1), 1-18.
Murnane, R. J., & Willett, J. B. (2011). Methods matter: Improving causal inference in
educational and social science research. New York: Oxford University Press.
National Council of Teachers of Mathematics. (1989). Curriculum and evaluation standards for
school mathematics. Reston, VA: Author.
National Council of Teachers of Mathematics. (1991). Professional standards for teaching
mathematics. Reston, VA: NCTM.
!
41!
Draft Document: Do not circulate or cite without permission of the author
National Council of Teachers of Mathematics. (2000). Principles and standards for school
mathematics. Reston, VA: Author.
National Governors Association Center for Best Practices, Council of Chief State School
Officers. (2010). Common core state standards for mathematics. Washington, DC:
Author.
Nye, B., Konstantopoulos, S., & Hedges, L. V. (2004). How large are teacher effects?
Educational Evaluation and Policy Analysis, 26(3), 237–257. !
Papay, J. P. (2011). Different tests, different answers: The stability of teacher value-added
estimates across outcome measures. American Educational Research Journal, 48(1),
163-193.
Papay, J. P., & Kraft, M. A. (Forthcoming). Productivity returns to experience in the teacher
labor market: Methodological challenges and new evidence on long-term career
improvement. Journal of Public Economics.
Pianta, R. C., & Hamre, B. K. (2009). Conceptualization, measurement, and improvement of
classroom processes: Standardized observation can leverage capacity. Educational
Researcher, 38(2), 109-119.
Porter, A. C. (2002). Measuring the content of instruction: Uses in research and practice.
Educational Researcher, 31(7), 3-14.
Porter, A., McMaken, J., Hwang, J., & Yang, R. (2011). Common core standards: The new U.S.
intended curriculum. Educational Researcher, 40(3), 103-116.
Raudenbush, S. W., & Bryk, A. S. (2002). Hierarchical linear models: Applications and data
analysis methods. Second Edition. Thousand Oaks, CA: Sage Publications.
!
42!
Draft Document: Do not circulate or cite without permission of the author
Rivkin, S. G., Hanushek, E. A., & Kain, J. F. (2005). Teachers, schools, and academic
achievement. Econometrica, 73(2), 417-458.
Rockoff, J. E. (2004). The impact of individual teachers on student achievement:
Evidence from panel data. American Economic Review, 94(2), 247–252.
Rockoff, J. E., & Speroni, C. (2010). Subjective and objective evaluations of teacher
effectiveness. American Economic Review, 261-266.
Rockoff, J. E., Staiger, D. O., Kane, T.J., & Taylor, E. S. (2012). Information and employee
evaluation: Evidence from a randomized intervention in public schools. American
Economic Review, 102(7), 3184-3213.
Rothstein, J. (2010). Teacher quality in educational production: Tracking, decay, and student
achievement. Quarterly Journal of Economics, 125(1), 175-214.
Sadler, P. M., Sonnert, G., Coyle, H. P., Cook-Smith, N., & Miller, J. L (2013). The influence of
teachers’ knowledge on student learning in middle school physical science
classrooms. American Educational Research Journal, 50(5), 1020-1049.
Schochet, P. Z., & Chiang, H. S. (2013). What are error rates for classifying teacher and school
performance using value-added models? Journal of Educational and Behavioral
Statistics, 38(2), 142-171.
Springer, M. G., Ballou, D., Hamilton, L., Le, V., Lockwood, J. R., McCaffrey, D. F., Pepper,
M., & Stecher, B. M. (2010). Teacher pay for performance: Experimental evidence from
the project on incentives in teaching. RAND Corporation.
Star, J. R., & Rittle-Johnson, B. (2009). It pays to compare: An experimental study on
computational estimation. Journal of Experimental Child Psychology, 102(4), 408-426.
!
43!
Draft Document: Do not circulate or cite without permission of the author
Stronge, J. H., Ward, T. J., & Grant, L. W. (2011). What makes good teachers good? A crosscase analysis of the connection between teacher effectiveness and student achievement.
Journal of Teacher Education, 62(4), 339-355.
Taylor, E. S., & Tyler, J. H. (2012). The effect of evaluation on teacher performance. The
American Economic Review, 102(7), 3628-3651.
U.S. Department of Education (2010). A blueprint for reform: Reauthorization of the Elementary
and Secondary Education Act. Washington, DC: U.S. Department of Education, Office of
Planning, Evaluation and Policy Development.
Wayne, A. J., & Youngs, P. (2003). Teacher characteristics and student achievement gains: A
review. Review of Educational Research, 73(1), 89-122.
Woessmann, L., & West, M. (2006). Class-size effects in school systems around the world:
Evidence from between-grade variation in TIMSS. European Economic Review, 50, 695736.
Yoon, K. S., Duncan, T., Lee, S. W. Y., Scarloss, B., & Shapley, K. (2007). Reviewing the
evidence on how teacher professional development affects student achievement.
Washington, DC: U.S. Department of Education.
!
44!
Draft Document: Do not circulate or cite without permission of the author
Appendix
!
Table A1
Relationships Between Instructional Quality and Class Composition
Class Size
Male
African American
Asian
Hispanic
White
FRPL
SPED
LEP
Fall Project-Administered Math Test
Prior-Year State Math Test
Prior-Year State Reading Test
Ambitious
Mathematics
Instruction
Mathematical
Errors and
Imprecisions
Classroom
Emotional
Support
Classroom
Organization
-0.069
(0.069)
0.016
(0.012)
0.005
(0.023)
-0.015
(0.037)
0.002
(0.022)
-0.017
(0.035)
-0.014
(0.011)
-0.009
(0.010)
-0.003
(0.010)
0.439
(0.666)
-0.005
(0.630)
0.475*
(0.224)
0.020
(0.059)
-0.013
(0.013)
0.005
(0.026)
-0.016
(0.038)
0.003
(0.024)
0.012
(0.035)
0.000
(0.013)
0.006
(0.012)
0.004
(0.017)
1.739
(1.090)
0.099
(0.834)
-0.401
(0.462)
-0.114
(0.077)
-0.002
(0.014)
-0.038
(0.034)
-0.037
(0.052)
-0.036
(0.034)
0.005
(0.043)
0.012
(0.013)
-0.035*
(0.013)
0.004
(0.018)
-2.384*
(0.880)
-0.984
(0.877)
1.186**
(0.368)
-0.029
(0.061)
-0.021
(0.016)
0.022
(0.029)
0.060
(0.039)
0.030
(0.026)
0.035
(0.036)
0.016
(0.011)
-0.018
(0.012)
0.014
(0.019)
0.085
(0.859)
-0.523
(1.028)
-0.366
(0.421)
Joint Test
F-statistic
1.652
0.580
2.219
1.624
p-value
0.125
0.842
0.035
0.133
Notes: ~ p<0.10, * p<0.05, ** p<0.01, ***p<0.001. Columns contain estimates from separate
regressions. Robust standard errors clustered at the school-grade-year level in parentheses. All models
include teacher fixed effects. Sample includes 45 teachers who were in the study for two years.
!!
!
45!

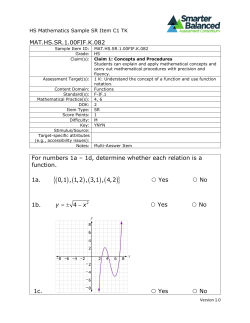


© Copyright 2026