
. - The Center for Health and Social Policy
The Potential Effects of Federal Health Insurance Reforms on Employment Arrangements and Compensation Marcus Dillender, Upjohn Institute Carolyn Heinrich University of Texas at Austin Susan Houseman Upjohn Institute July 2014 Revised, April 2015 Abstract The Affordable Care Act (ACA) presents an opportunity to significantly improve compensation for American workers. A potential concern, though, is that employers will circumvent the employer mandate by increasing their use of workers in staffing arrangements that are not covered by the mandate: workers averaging less than 30 hours per week, working on a temporary basis, or working in organizations with fewer than 50 full-time employees. In this paper, we seek to shed light on the likely effects that the ACA will have on employment arrangements. We first consider how part-time employment in Massachusetts changed after its health insurance reform, which is similar to the ACA in many ways. We find that the Massachusetts reform resulted in modest increases in part-time employment among low-educated workers. We then examine the characteristics of employers and employees most affected by the ACA’s employer mandate. For the period 2010 to 2012, we estimate that workers who were not offered health insurance at their workplace but whose employers would be required to offer health insurance under the ACA comprised about 5 percent of the workforce. We argue that reducing average weekly hours worked may be relatively straightforward for employers in industries with the largest concentrations of these workers (e.g., retail trade and accommodation and food services).Though more time is needed to determine any effects of the employer mandate on staffing arrangements, we point to recent industry patterns of involuntary part-time employment and temporary help use that are consistent with some effect. Key Words: Affordable Care Act, temporary help, part-time JEL Codes: I13, J3 This paper was prepared for the conference on Building Human Capital and Economic Potential, Madison, Wisconsin, July 16, 2014. We are grateful to the Smith Richardson Foundation for support. We thank William Wiatrowski for assistance with data from the National Compensation Survey and Lillian Vesic-Petrovic for research assistance. 1. Introduction Even before the Great Recession, the U.S. labor market showed signs of weakness, as evidenced by declining labor force participation and employment rates and stagnant or deteriorating real wages and benefits. Although the unemployment rate in 2015 is now nearly half that of its peak in 2009, job creation during the long recovery has been slow in comparison to past post-recessionary periods, contributing to further deterioration of labor market conditions for middle and low-skilled workers and growing income inequality. Traditional policies to address these problems—such as fiscal stimulus and minimum wage increases—have lacked the bipartisan support necessary for federal policy action. In contrast, the implementation of the Patient Protection and Affordable Care Act (ACA) presents an opportunity to significantly improve compensation, particularly for low-wage workers. Employer-sponsored health insurance represents an important component of compensation, though its incidence was declining sharply prior to ACA, both because fewer employers were offering this benefit and because employers have passed along higher premium costs to employees, leading fewer to take health insurance when offered (Vistnes et al. 2010). Under the ACA’s provisions, employers with at least 50 full-time workers are required to offer health insurance coverage to those who work at least 30 hours per week, or otherwise pay a penalty of $2,000 per worker after the first 30 workers. Additionally, employers offering coverage will have to pay $3,000 per employee for each employee who signs up for subsidized coverage on the exchanges. While the employer mandate in the ACA is intended to increase employer-sponsored health insurance and thereby improve workers’ compensation and the quality of jobs, some are concerned it could backfire. In theory, to the degree that employees value the health insurance benefit offered, employers may pass along the premium costs to workers in the form of lower real wages or other benefits. Particularly for low-wage workers, however, employers’ ability to lower wages may be constrained by the minimum wage. Moreover, employers may avoid cutting nominal wages because of adverse effects on morale and productivity, and inflation may not be a viable mechanism to reduce real wages if the relatively low rates of price growth of the recent past persist. Alternatively, large employers may increase their use of workers in staffing arrangements that are not covered by the employer mandate: workers averaging less than 30 hours per week or working in organizations with fewer than 50 full-time employees. Federal rules stipulate that to determine work hours for a particular employee, an employer may use up to a 12-month “look back” period to establish whether an employee works an annual average of 30 hours per week. As a result, employers will not be required to offer insurance to many, if not most, on-call and temporary 1 workers. To circumvent the mandate, therefore, employers may choose to reduce standard weekly hours below 30 or shift their mix of staffing toward greater use of on-call, direct-hire temporaries, or agency temporaries. Additionally, employers may choose to outsource certain tasks to firms with fewer than 50 full-time employees. Ironically, the employer mandate could reduce the quality of jobs for many low and middle skilled workers by increasing the share of low-hours part-time, temporary, and contract employment, which often are associated with relatively low compensation and job instability. Reflecting such concerns, a July 2013 letter from three of the largest labor unions to Congressional leaders argued that the law will “shatter not only our hard-earned health benefits, but destroy the foundation of the 40-hour work week that is the backbone of the American middle class.”1 The union leaders argued, and some public accounts confirm, that employers would be incentivized to keep or cut workers’ hours to below 30 hours per week to avoid the obligation to provide insurance. Similarly, industry analysts predict a boost to temporary help firms from the ACA (Hancock 2013a). We seek to shed light on the likely effects the ACA employer mandate will have on employment arrangements. The employer mandate, which was originally expected to take effect on January 1, 2014, was delayed until January 1, 2015 for employers with 100 or more full-time employees and until 2016 for those with 50 to 99 full-time employees (Kennedy 2014), and thus, any evidence on its actual effects is limited. Prior research on similar employer mandates in Hawaii and Massachusetts, however, have reported mixed results on the effects of such mandates on part-time and agency temporary employment. We anticipate that any effects of the ACA employer mandate are likely to be concentrated among low-wage, low-skilled workers. We present new evidence that suggests there were modest increases in part-time employment among low-educated workers following health care reform in Massachusetts, and we in turn assess the potential effects of the ACA employer mandate. Comparing the Massachusetts and ACA reforms, we argue that incentives for employers to shift their mix of staffing arrangements may be greater under the ACA reform. Relative to Massachusetts prior to health care reform, employer penalties for noncompliance under the ACA are generally higher and public support for the reform is far lower. While we estimate about 16 percent of workers who are not offered employer-based health insurance will be covered by the http://www.forbes.com/sites/theapothecary/2013/07/15/labor-leaders-obamacare-will-shatter-their-healthbenefits-cause-nightmare-scenarios/ 1 2 mandate, they represent around 5 percent of the workforce, or 7 million workers. These workers— whose employers will be required to offer them an affordable health insurance option in 2015 or 2016—are the most vulnerable to changes in their employment arrangement. Over half of them report working less than 40 hours per week and almost half report working in retail, accommodations or food services. Given that many of these workers are close to the 30 hour threshold or are working in industries that make extensive use of short-hours part-time workers— that is, workers who are guaranteed relatively few weekly hours but are expected to “flex up” to a 40-hour work week on demand—cutting worker hours may be a particularly attractive option to many employers wishing to sidestep the mandate. Involuntary part-time employment, which spiked during the recession, has been slow to fall, especially in these sectors. This finding is consistent with greater use of part-time employment in response to the employer mandate, though more time is needed to determine any effects of the mandate on part-time employment and other staffing arrangements. The remainder of the paper is organized as follows. In section 2 we review the theory on employee compensation and the effects of employer mandates, and in section 3 we provide background on the magnitude of and trends in part-time, temporary, and contract employment and on employers’ use of these arrangements to lower benefits costs. We then provide a detailed comparison of the Massachusetts health insurance reform with the ACA in section 4. We review prior research on the effects of the employer mandates in Hawaii and Massachusetts on employment arrangements, and present new evidence of the effects of the Massachusetts mandate on part-time employment in section 5. In section 6, we examine the possible effects the ACA will have on employment arrangements, and we conclude in section 7 with a discussion of policy implications of our findings. 2. Theory on Benefits Compensation and Employer Mandates Background on benefits compensation Regarding the effects of health care reform on wages and employment arrangements, one theoretical perspective suggests that employers should be indifferent as to how total compensation for workers (wages or salaries and benefits) is apportioned between wages and other forms of compensation (Lettau and Buchmueller 1999). In fact, Lee and Warren (1999) suggest that employer provision of non-wage benefits may initially appear illogical, in the sense that firms could convert cost savings from eliminating benefits into increases in wages that employees could then use 3 to purchase the forms of non-wage compensation that they value most. Nonetheless, some nonwage benefits may be provided more cheaply by employers, and if they are valued by employees, there may be potential gains to both from arranging a total compensation package that includes some combination of wage and non-wage benefits (Summers 1989). For example, Gruber and McKnight (2003) point to the 1940s ruling by the IRS that allowed health insurance costs to be deductible for employers while not treating them as taxable income for employees as a major incentive to employer provision of group health insurance. In addition, some benefits such as sick leave, paid vacation, and flexible work hours that may be attractive to workers can only be provided through the employer. Employers that are in competition with other firms for workers will attempt to develop compensation packages that balance the goals of keeping labor costs low and increasing the value of compensation to workers they desire to attract. The costs of non-wage benefits have risen dramatically over time, however, from just 3 percent of total compensation in 1929 to 30 percent in 2013, with rising health insurance costs contributing substantially to the total (Schultz and Doorn 2009; BLS 2014).2 The coverage and generosity of employer-sponsored health insurance benefits accordingly has fallen considerably, both due to declines in offer rates in small firms and in take-up rates of offered coverage in both large and small firms (Vistnes et al. 2010). One of the primary factors contributing to the decline in take-up rates is increased employee premium contributions (Farber and Levy 2000; Cutler 2003), which Vistnes et al. show have recently risen faster for family and employee-plus-one coverage. Raising employee contributions toward the cost of these benefits is one way that firms might reduce labor costs, as firms can then ostensibly provide health insurance only to those with greater tastes for it and possibly return some of the cost savings to employees in the form of higher wages. IRS non-discrimination rules limit employers’ ability to selectively offer health insurance benefits, and dropping coverage for all workers would make a firm less competitive in hiring (Schultz and Doorn 2009). Lettau and Buchmueller (1999) analyze the extent to which different types of non-wage benefits offered by employers might constitute “quasi-fixed costs,” that is, where the costs vary by the number of workers rather than by hours worked, which has potential implications for how employers structure their labor force in order to manage labor costs while maintaining a productive workforce. Their empirical analysis supports the supposition that the costs of most benefits are proportional to the number of hours worked, with the exception of health insurance. They find that 2 http://www.bls.gov/news.release/pdf/ecec.pdf. 4 health insurance is the only benefit for which the average per-hour cost is significantly greater for part-time workers (by 18 percent); the cost for other legally required benefits (e.g., Social Security, Medicare) is just 2 percent higher on average. Theory on employer mandates Although under the ACA large employers will be required to provide health insurance benefits to employees working more than 30 hours per week, employers will not necessarily pay the cost of this benefit. Employers may be able to shift some or all of the health insurance costs onto workers. In a theoretical work on mandated benefits, Summers (1989) argues that any mandated benefit will function like a tax at a rate equal to the difference between the employer’s cost of providing the benefit and the employee’s valuation of it. That is, a mandated benefit only functions like a tax on employers to the extent that the employer’s costs of providing the benefit are not equal to the employee’s willingness to pay for it. If employees fully value the new benefit, theory predicts that employees will bear its costs through lower wages or other forms of compensation. In practice, even if employees fully value the benefit, however, employers’ ability to shift its costs onto workers in the form of lower wages may be constrained by minimum wages or union contracts. In addition, in a period of low inflation such as currently exists, employers may need to cut nominal wages in order to reduce real wages to cover the benefit cost; nominal wage cuts can have significant adverse consequences on worker morale and productivity. Moreover, recent empirical evidence suggests that at the premium rates that employers have recently been charging for health insurance benefits, take up of those benefits has been declining in both small and larger firms. In other words, there appears to be a growing gap between employer costs and employees’ willingness to pay for these benefits. If employers are unable to fully shift the cost of the mandated benefit onto workers, they may pass along the costs to consumers in the form of higher prices, potentially reducing demand for their products and resulting in lower employment levels. Alternatively, employers may seek to reduce the number of workers subject to the mandate by implementing changes in the way they staff. Employers may increase hours of some full-time employees and reduce hours worked below the 30-hour threshold for others. They also may hire temporary workers or outsource tasks to small contract companies. Workers in organizations with fewer than 50 employees are not covered by the mandate, and as discussed further below, although temporary workers with sufficiently long hours and prolonged assignments may be subject to the mandate, typically they will be exempted. Theory provides no clean predictions of the employment effects of the mandated health insurance benefit. 5 How employers respond, therefore, is an empirical question. Schultz and Doorn (2009) review the existing literature on how employers respond to increases in health insurance costs or health insurance mandates and find some shifting of the costs of health benefit coverage to workers through lower wages. Gruber (1994), for example, finds evidence that mandated maternity benefits lowered the wages of demographic groups likely to use the benefit. Kolstad and Kowalski (2012a) study the effects of the Massachusetts’ mandate for employer-sponsored health insurance and find that employers complying with the law lowered wages by an average of $6,058 annually, and that this compensating differential was only slightly smaller in magnitude than the average cost to employers of providing the insurance, suggesting that employees valued the benefits and thus were willing to accept lower wages. Other research finds evidence that increases in health insurance costs or mandated health insurance benefits lead to increases in hours worked (and overtime labor) among those with health insurance coverage and increases in the percent of workers that do not qualify for benefits.3 3. Background on Part-time, Temporary Help and Contract Employment Evidence on use of alternative arrangements to lower benefits costs As noted, a central question posed in this paper is whether the ACA may be expected to significantly increase employers’ use of alternative staffing arrangements in order to circumvent the health insurance mandate. Large employers could evade the mandate for some workers by reducing the hours regular staff work, by contracting out certain tasks to smaller firms, or by using a greater mix of temporary and on-call staffing. A large research literature has examined the many and diverse reasons organizations use part-time, temporary, and contract employment arrangements. Staffing needs in many organizations lend themselves to part-time schedules. For example, in retail, a store may wish to bring in additional staff during peak hours, or given opening hours, it may be unable to staff exclusively with employees on 40-hour per week schedules. In the same way, organizations typically use direct-hire or agency temporaries to meet increased staffing needs during temporary periods of higher demand or to fill in for absent employees. Contractors are often used for their specialized expertise.4 We are particularly interested in organizations’ use of part-time, temporary, and contract employment to save on benefits, in particular health insurance, costs. The federal government seeks 3 4 See Schultz and Doorn (2009) for a review of the literature. See Cappelli and Keller (2013) for a recent review of the literature. 6 to encourage companies to offer employees health and retirement benefits through the tax code. However, in order to ensure that such tax breaks are not used simply to grant highly compensated individuals tax deferred in-kind income in the form of generous health and retirement benefits, the Employment Retirement Security Income Act (ERISA) and non-discrimination clauses in the IRS tax code require that such benefits broadly benefit an organization’s employees. While these rules exempt employees who work less than what is deemed as regular or full-time hours in the organization, if an organization provides these benefits to some full-time employees, it is legally difficult for the organization to avoid providing benefits to other full-time employees. Therefore, if an organization wishes to avoid paying benefits to certain groups of workers, it may hire them on a part-time or temporary basis. Alternatively, it may hire them through an intermediary such as a temporary help agency or other contract company; under such arrangements the temporary agency or contract company, not the client organization using the workers’ services, is legally the employer. It is widely believed that savings on health insurance and retirement benefits is one factor affecting certain organizations’ decisions to use or expand their use of part-time, temporary, contract workers. Analyses based on cross-sectional data that examine associations between an organization’s use of part-time, temporary agency, or other contract staffing, on the one hand, and the level of benefits offered to regular, full-time employees on the other have yielded mixed results. (See, for example, Cappelli and Keller 2013; Houseman 2001.) Because these analyses likely do not fully control for other factors that affect an organization’s staffing patterns, it is difficult to tease out the effects of benefits costs or to interpret significant findings as causal. One study examines an organization’s change in staffing in response to an increase in health insurance costs. In an analysis of the Medical Expenditure Panel Survey-Insurance Component (MEPS-IC) data (1996-2004), Schultz and Doorn (2009) find that a one percent increase in spending on health insurance benefits was associated with 3.7 percent increase in part-time workers (when health insurance coverage was not offered to part-time employees). In addition, they find that a 1 percent increase in employer health insurance contributions was associated with a 1.44 percent increase in the demand for low-wage workers and a 5.75 percent decrease in the demand for highwage workers. Case studies provide many examples in which organizations are motivated to use alternative staffing arrangements, in part, by savings on wage and benefits. For instance, recent trends among public school systems to hire substitute teachers through temporary help agencies enable them to shed retirement benefit costs for these workers (Heinrich and Houseman 2013). The hiring of 7 production workers through temporary help agencies and bus drivers, janitors, and cafeteria workers through contract companies are other examples where public and private organizations have realized substantial savings on wages and benefits costs through the use of these alternative staffing arrangements (Erickcek, Houseman, and Kalleberg 2003). Magnitude and trends in staffing arrangements Data on hours worked are regularly collected as part of the Current Population Survey (CPS). The rate of part-time employment (officially defined as less than 35 hours per week) is highly cyclical, rising during downturns as employers cut not only employment levels but also average hours, and falling during recoveries, but part-time employment has evidenced little sign of trend growth over the last several decades. Reflecting the especially weak labor markets of the Great Recession, part-time employment jumped to nearly 20 percent of all employment in 2010, its highest level in three decades. All of the increase in part-time employment during the recession was accounted for by the increase in involuntary part-time employment for economic reasons. Although the unemployment rate has dropped by nearly half during the recovery, the rate of part-time employment has been slow to decline, and it is unclear whether the persistently high rates reflect continued weakness in the labor market or a structural change. During the high growth period of the 1990s, the temporary help services industry doubled its share of aggregate employment from 1 to 2 percent. The dramatic growth in temporary help employment was driven in large part by manufacturers, who made agency temp workers a permanent part of their staffing strategy. Stagnation of the temporary industry in early 2000s, in turn, reflected problems associated with manufacturing and the offshoring of production (Dey, Houseman, and Polivka 2012). Especially in the last two recessions, the temporary help industry has borne a disproportionate share of the job losses, reflecting manufacturers’ greater use of agency workers. The temporary help industry, however, has experienced a strong jobs recovery since 2010—much stronger than that of the aggregate economy—and employment in the temporary help industry is at record levels both in numbers and as a share of aggregate employment. Data on other types of contracting out are not systematically collected in government statistics. The Contingent Worker Supplement to the CPS, which was conducted five times between 1995 and 2005, collected information on instances in which individuals worked for a company that contracted out his or her services to another organization or worked on an on-call basis or day laborer basis. Data from the CWS suggest that about 1 percent of workers were employed with 8 contract companies and another 2 percent worked on an on-call or day laborer basis during this period. Having set out some of the theoretical arguments and empirical evidence concerning how employers adjust their compensation and staffing arrangements in response to health insurance cost increases and benefit mandates, we turn our focus to the implementation and implications of health care reforms in Massachusetts and under the ACA. 4. Background on Health Reforms The Massachusetts health insurance reform In April 2006, Governor Romney signed the Massachusetts health insurance reform into law. The goal of the reform was to attain nearly universal coverage by expanding Medicaid, subsidizing insurance purchased through the individual market, and mandating that individuals purchase coverage and employers provide it. Implementation of the reform was staggered. Beginning in July of 2006, Medicaid was expanded to cover children with family incomes up to 300 percent of the federal poverty level. Enrollment caps for certain Medicaid programs were raised, and outreach programs were initiated to encourage eligible people to sign up for coverage. As of April 2007, individuals without employer-sponsored health insurance or Medicaid can purchase coverage through the Connector, an online marketplace created by the reform that allows individuals and small businesses to compare and purchase private insurance that meets coverage and cost standards. With few exceptions, the Massachusetts law required individuals to have health insurance as of July 1, 2007 or pay a penalty. Beginning in 2007, employers with more than ten employees were required to provide coverage to all employees who worked at least 35 hours per week (McDonough et al. 2006). Employers who did not offer affordable coverage by July of 2007 had to pay a penalty of $295 per employee in October 2007. Insurance was considered affordable if the employer offered to pay at least 33 percent of the premium cost or at least 25 percent of full-time employees were enrolled in the plan. The vast majority of employers complied with the law. In 2010, 4.6 percent of employers who were required to provide coverage were penalized for noncompliance (Goodnough 2012). 5 Various studies find that the reform reduced the uninsured population in Massachusetts. Long (2008) uses data from the 2006 and 2007 Massachusetts Health Reform Surveys to estimate 5 mandate. Massachusetts’s employer mandate was repealed in 2013 in response to the upcoming federal employer 9 the increase in coverage during the first year after the reform and finds that Massachusetts experienced a 5.6 percentage-point drop in the uninsured rate. Long finds that roughly half of this change came from employer-sponsored insurance and half came from other coverage. For adults with family income less than 300 percent of the poverty level, she finds the uninsured rate fell by 10.5 percentage points. Using CPS data on insurance coverage through 2008, Kolstad and Kowalski (2012b) document an increase in employer-sponsored coverage of 3.5 percentage points, an increase in Medicaid of 3.5 percentage points, and an increase in insurance coverage of 5.7 percentage points. Gabel et al. (2008) find that a majority of firms agreed that employers should bear at least some responsibility for providing health insurance to employees. However, around 25 percent of small firms said that it was at least somewhat likely that they would limit salary increases so that employees could maintain eligibility for the subsidies.6 The Affordable Care Act In March 2010, President Obama signed the ACA into law. Like the Massachusetts reform, the ACA features employer and individual mandates, an expansion of Medicaid, and subsidies for those purchasing coverage in the individual market. The ACA is also being implemented in stages. The individual marketplace, which allows people to compare plans on a single website, opened in 2013. The Medicaid expansion to households below 133 percent of the federal poverty level went into effect in 2014 as did the individual mandate.7 The ACA’s employer mandate requires that companies with 50 or more full-time employees offer affordable coverage to their employees or face a penalty. The definition of full-time under the ACA is working 30 hours or more per week. The ACA’s definition of affordable coverage is that the insurance plan must pay for at least 60 percent of covered health care expenses and employees must pay no more than 9.5 percent of family income for the coverage. The penalty for non-compliance is $2,000 per employee after the first 30 employees. Even if employers offer health insurance, they will still be subject to a $3,000 fine for each employee who signs up for subsidized coverage through the exchanges. Although originally scheduled to be effective January 1, 2014, the employer mandate has been delayed in various ways. In July of 2013, the employer mandate was delayed until 2015, and in 6 Other studies find that these coverage changes led to increases in health (Courtemanche and Zapata 2014; Long et al. 2012), decreases in emergency room visits (Kolstad and Kowalski 2012b; Miller 2012), decreases in nongroup premiums (Graves and Gruber 2012), and increases in preventative services (Kolstad and Kowalski 2012b). 7 Due to a 2012 Supreme Court ruling, states will not lose federal funding if they refuse to extend Medicaid, which was originally part of the law (Liptak 2012). As such, many states have elected not to expand Medicaid coverage. 10 February of 2014, the requirement for employers with 50 to 99 full-time employees was delayed again until 2016 (Kennedy 2014). While the Massachusetts health insurance reform enjoyed wide support in the state, the nation as a whole is more divided on health care reform. The constitutionality of the ACA has been challenged in federal courts, and Republicans in Congress made many attempts to repeal the legislation (Liptak 2012). While a majority of Massachusetts businesses were supportive of health insurance reform, many national businesses have voiced complaints about the ACA. According to a 2013 survey of employers, 88 percent of the employers surveyed thought the ACA would increase their costs, 4.7 percent reported already having adjusted hours so that fewer employees qualify for insurance, and 11.1 percent have reported that they will adjust hours in the future (International Foundation of Employee Benefit Plans 2013).8 Comparison of Massachusetts and Affordable Care Act reforms Table 1 provides a comparison of the Massachusetts health insurance reform and the ACA. The reforms have very similar structures; however, various policy parameters differ. The ACA’s definition of small employers is larger than the definition under the Massachusetts reform, while the weekly threshold for full-time status under the ACA is lower than under the Massachusetts reform (30 hours vs. 35 hours). Even with exempting the first 30 employees, the penalty to employers for not offering insurance will be higher under the ACA than under the Massachusetts law. The ACA’s definition of affordable coverage is based on health care expenses and family income, while the Massachusetts reform’s definition is based on the premium the employee pays or the percentage of employees who sign up for coverage. Unlike with the Massachusetts reform, however, observers have expressed concern that the ACA may contain loopholes that allow employers to avoid offering generous coverage to low-wage employees (Hancock 2013b; Weaver and Mathews 2013). Under the ACA, employers are required to pay for 60 percent of covered health care expenses; however, large employers are exempt from the essential minimum benefits and can exclude many services from being covered. Although employers will still be subject to the $3,000 fine for each employee who signs up for subsidized insurance 8 As many aspects of the ACA are still in the process of being implemented, most of the research on the ACA thus far has been on its potential effects. Researchers expect that the ACA will increase insurance and lower underinsurance rates (Schoen et al. 2011), reduce out-of-pocket spending (Hill 2012), and result in doctor shortages in some areas (Hofer et al. 2011; Huang and Finegold 2013). One of the first components of the ACA to go into effect was an extension of dependent coverage until the age of 26, which has been studied extensively. This research finds that extending dependent coverage was successful in raising coverage for young adults (Antwi et al. 2013; O’Hara and Brault 2013; Sommers et al. 2013). 11 through the exchanges, offering bare-bones plans and paying fines for individual workers may allow them to avoid the $2,000 fine for all employees without drastically increasing their health insurance costs. Comparing the size of the individual penalties is also difficult because Massachusetts ties the penalty amount to the plan with the lowest premium, while the ACA ties the penalty to people’s income. Wealthier individuals will face a higher penalty under the ACA, while this is not true under the Massachusetts reform. Both reforms created online marketplaces to facilitate purchases directly from insurance companies for people without employer-sponsored coverage. The ACA subsidizes a greater share of people purchasing coverage through the exchanges than the Massachusetts reform did and exempts a smaller share for poverty reasons. The ACA expanded Medicaid by expanding eligibility, while the Massachusetts reform expanded Medicaid by increasing enrollment caps for various Medicaid programs. The ACA added new regulations for the individual market, such as making it guaranteed issue and restricting the factors that insurance companies could use in pricing. Massachusetts, meanwhile, had similar provisions in place since 1996. Employee coverage under the ACA employer mandate There are many exemptions to the employer mandate in the ACA. As noted, the ACA only requires employers with more than 50 full-time staff to provide employees working more than 30 hours per week with affordable health insurance or potentially pay a penalty. In addition, many employees work variable hours or work on a temporary basis. Although these employees may work more than 30 hours in a particular week, it was deemed unreasonable to require an employer to provide health insurance for employees who averaged less than 30 hours per week or who were expected to be employed for a short time period. To address this concern, the final rules under the ACA specify a look-back period of up to 12 months for variable-hour employees and provide additional guidance to staffing firms for making variable-hour determinations by indicating the factors that should be considered in making those decisions (i.e., recognizing the wide variability in types of assignments and unknowns at the start of assignments). The final ACA rules also allow employees with a break in service of 13 weeks or more to be treated as new employees. As a result, while a staffing agency or employer directly hiring workers on a short-term basis may be required to offer their temporary employees health insurance under the ACA, most temporary workers will fall outside the mandate. Using data from a large national staffing firm, Heinrich and Houseman (2013) find that only a small minority of temporary help workers averaged more than 30 hours per week over the course of the year. Consistent with this finding, staffing 12 firms report that the employer mandate is expected to have little impact on their costs (Hancock 2013a). 5. Empirical Evidence of the Effects of Health Reform in Massachusetts on Staffing Patterns Given the similarities between the two pieces of legislation, the recent experience in Massachusetts may provide insights into how part-time work changes after firms are required to provide health insurance to full-time workers.9 To examine changes in part-time work after the Massachusetts health insurance reform, we draw on data from the monthly CPS data files. We include everyone in the sample between the ages of 18 to 64 from 2000 to 2013. Part-time employment is coded to follow the definition set by the Massachusetts health insurance reform— people working less than 35 hours. We exclude from the sample anyone with imputed hours and anyone who is self-employed and weight all analyses using the CPS weights.10 Table 2 compares characteristics of our sample of Massachusetts residents to the rest of the nation. A notable difference is that Massachusetts residents have a higher average education than the rest of the nation. Nearly 40 percent of Massachusetts residents have a college degree, while less than 30 percent of the rest of the nation does. A challenge in studying the Massachusetts reform is that the Great Recession began soon after it was passed. Figure 1 shows unemployment for Massachusetts compared to the rest of the nation and suggests that the recession’s effects were less severe in Massachusetts than in the country as a whole. A failure to account for economic conditions in the estimation strategy would result in attributing the effects of a less severe Great Recession to health insurance reform. For this reason, in addition to accounting for the Great Recession by including time fixed effects, we control for the 9 Although similar, the Massachusetts and ACA health reforms differ in several respects. The penalties are larger under the ACA, and Massachusetts employers tended to be more supportive of insurance reform. For these reasons, one might suppose that any increase in part-time employment would be larger in response to the ACA employer mandate than occurred in response to the Massachusetts health reform. On the other hand, the part-time threshold was higher in Massachusetts than in the ACA, arguably making it somewhat easier for Massachusetts firms to cut hours below the threshold. Additionally, if employers can offer bare-bones coverage and expect that their employees will not sign up for subsidized coverage, the ACA may have smaller effects on part-time work than the Massachusetts legislation had on part-time employment in that state. 10 We obtain similar results if we do not use the CPS weights and if we keep observations with imputed values and the self-employed. 13 monthly state unemployment rate in all regressions.11 Because the unemployment rate is endogenous with the employment rate, we also restrict the sample to employed individuals. To calculate changes in part-time and full-time work after Massachusetts’s health insurance reform, we estimate the following equation: 𝑦𝑖𝑠𝑡 = 𝛾𝑡 + 𝜙𝑠 + 𝛼𝑋𝑖𝑠𝑡 + 𝑢𝑛𝑒𝑚𝑝𝑙𝑜𝑦𝑚𝑒𝑛𝑡𝑠𝑡 𝜆 + 𝑖𝑚𝑝𝑙𝑒𝑚𝑒𝑛𝑡𝑎𝑡𝑖𝑜𝑛𝑠𝑡 𝜃 + 𝑟𝑒𝑓𝑜𝑟𝑚𝑠𝑡 𝛽, (1) where t indexes the year and month of the observation, s indexes the state, i indexes the individual, y is an indicator for the individual working part-time, γ is a vector of time fixed effects, ф is a vector of state fixed effects, X is a vector of individual controls that includes education, age, sex, and race, unemployment is the unemployment rate in state s and month t, implementation is an indicator for the individual being observed in Massachusetts from July of 2006 to June of 2007, and reform is an indicator for the individual being observed in Massachusetts in July of 2007 or later. The β coefficient captures how, conditional on being employed, the likelihood of working part-time changed for Massachusetts after the reform compared to the how it changed for the control group. In other words, we estimate the effect of the Massachusetts reform on the mix of full-time and parttime employees. To adjust for the fact that the basic monthly CPS interviews the same person up to eight times, we cluster standard errors at the individual level.12 We choose this level of clustering to be conservative.13 But as there are concerns about understating standard errors when there are few treated states, we also assess statistical significance based on a series of placebo estimates, following Buchmueller, DiNardo, and Valletta (2011), who assess the statistical significance of their estimates of the effects of Hawaii’s 1974 health insurance reform by comparing the Hawaii estimate to the distribution of a series of placebo estimates. To generate the placebo estimates, we re-estimate Equation (1) but set the implementation and reform variables equal to 1 for each state and Washington, DC separately. This procedure gives us 50 placebo estimates of β. We would be concerned about 11 We have tested the robustness of the results to controlling for unemployment in a variety of ways, such has including unemployment squared and controlling for separate unemployment rates by educational attainment. Results are similar in these alternate specifications. 12 Statistical inference is not straightforward when applying a difference-in-differences strategy to study the policy change of only one state. Bertrand, Duflo, and Mullainathan (2004) demonstrate how serial correlation can lead to drastically understated standard errors of the difference-in-differences estimator if not taken into account. They suggest accounting for serial correlation by clustering standard errors, but other research shows that clustering standard errors when there are few treated clusters can exacerbate the downward bias in estimates of the standard errors (Conley and Taber 2013 and Buchmueller, DiNardo, and Valletta 2011). 13 Other research on the Massachusetts reform has often clustered standard errors at the state or state-year level. When we calculate standard errors in either of these ways, our standard errors become much smaller but the null hypothesis of no effect is rejected for a greater share of placebo laws as well. 14 our ability to estimate an effect of the Massachusetts reform if many of the placebo estimates were similar in magnitude to the Massachusetts estimates. For each positive estimate of the effect of the Massachusetts reform, we report the percentage of placebo estimates larger than the Massachusetts estimate. For each negative estimate, we report the percentage of placebo estimates smaller than the Massachusetts estimate. There are reasons to believe employers may have more of an incentive to adjust hours for lower educated workers than they do for higher educated workers. As explained above, because of the minimum wage, employers may be constrained in their ability to reduce wages of low-paid workers. Employers may also have more of an incentive to change the part-time status of low-paid workers because providing lower-wage workers with health insurance would represent a larger percentage change in their overall compensation than it would for higher wage workers. Finally, higher wage workers are more likely to have health insurance even before the reforms, since overall compensation is correlated with health insurance. In the year before Massachusetts underwent reform, 68 percent of people working 35 hours or more per week with college degrees had insurance through their own employers, while only 51 percent without college degrees had insurance through their own employers. These numbers suggest the potential for a larger effect on the hours of lower educated workers. Thus, we show results for different education levels separately in addition to showing estimates of Equation (1) for the full sample. The main estimates are shown in the top panel of Table 3. Workers without a college degree are 1.9 percentage points more likely to work part-time hours in Massachusetts after the reform, which represents a 9.8 percent increase in part-time work for those without a college degree. The estimate for Massachusetts is larger than all of the placebo estimates. Employees with a college degree experience no effect of health insurance reform on the likelihood that they work part-time hours. In the middle and bottom panels of Table 3, we present two sets of estimates to examine the sensitivity of the main results. First, we restrict the sample to only New England states. With this alternative control group, the coefficient on the Massachusetts reform rises in absolute value for employees without a college degree but is similar to the original estimate. Next, we construct a synthetic control group for Massachusetts using the method described in Abadie, Diamond, and Hainmueller (2010). With the synthetic control method, we aggregate the data to the state-by-year level and then select the combination of states that most closely matches Massachusetts based on part-time status and the control variables from January 2000 to June 2006. Following Fitzpatrick 15 (2008) and Courtemanche and Zapata (2014), we then multiply the CPS weights by the shares obtained from the synthetic control method.14 The results from implementing the synthetic control method are shown in the third panel of Table 3 and provide corroborating evidence that workers without a college degree were more likely to work part-time hours after the Massachusetts health insurance reform. The estimated effect of the Massachusetts reform on the incidence of part-time employment among workers without a college education is 1.9 percentage points in this specification, which is the same as the original specification. All estimates of the effect of the reform on those without a college degree are statistically significant at conventional levels. A possible concern with these results is that controlling for unemployment and only focusing on the employed may not be sufficient to fully account for the Great Recession if lowskilled Massachusetts workers were differentially affected by the recession. A related concern is that there may have been a pre-existing trend towards more part-time employment among low-skilled Massachusetts workers. To consider these possibilities, we estimate the following equation: 𝑦𝑖𝑠𝑡 = 𝛾𝑡 + 𝜙𝑠 + 𝛼𝑋𝑖𝑠𝑡 + 𝑢𝑛𝑒𝑚𝑝𝑙𝑜𝑦𝑚𝑒𝑛𝑡𝑠𝑡 𝜆 + ∑𝑘∈𝐾 𝑚𝑎𝑠𝑠𝑠𝑘 𝛽𝑘 , where masssk is an indicator variable equal to one in Massachusetts in year k, K is the set of all years in the data other than 2005, and all other variables are defined as in Equation (1). βk can be interpreted as the difference in the incidence of part-time work between Massachusetts and the rest of the nation for year k, relative to the difference in the 2005 base year, which is zero by construction.15 Figure 2 displays coefficients from a regression that uses the rest of the nation as the control group and coefficients from a separate regression that uses the rest of New England as the control group. The difference between part-time work in Massachusetts and both control groups remains steady until 2006. Coincident with the law being passed in 2006, part-time work began to increase in Massachusetts relative to the rest of the nation and to the rest of New England. The coefficients fall during 2008 and 2009 as all states experienced an increase in part-time work during the Great Recession and then increase again after the trough of the Great Recession. Although disentangling the Great Recession from the Massachusetts reform is difficult, Figure 2 suggests the Great Recession is not the cause of the increase in low-skilled part-time work for Massachusetts relative to the rest of the nation. 14 The synthetic control group for Massachusetts for the full sample consists of Connecticut, Vermont, and Washington, DC. The control group for people with a college degree consists of Alaska, Connecticut, Minnesota, Rhode Island, and Washington. The control group for only people without a college degree consists of Connecticut, Minnesota, and Rhode Island. 15 The difference in the incidence of part-time employment in Massachusetts relative to the rest of the country in 2005 is captured by the state dummy variables. 16 Although analysis in Dubay, Long, and Lawton (2012) comparing trends in part-time employment in Massachusetts with that in several comparison states did not show sizable differences in growth, that study did not examine trends among low-educated or low-wage workers, where we believe any impacts would be concentrated. Our estimates are consistent with those of Buchmueller, DiNardo, and Valletta (2011), who find a modest shift by employers toward (exempt) part-time work (approximately 1.4 percentage points) in the two decades following Hawaii’s introduction of an employer health-care mandate. The effect, if any, of the Massachusetts health reform on employers’ use of temporary staffing is particularly hard to disentangle because the industry is highly cyclical, and the Massachusetts reform was implemented on the eve of the Great Recession. Silber and Condra (2013) show that from 2005 to 2007 temporary help employment increased by 13.9 percent in Massachusetts compared to just 2.2 percent for the country overall, in spite of the fact that overall growth in Massachusetts was weaker than in the aggregate economy. The authors point out that this pattern suggests a secular factor contributed to the growth of temporary help employment in the state during the period, which coincided with the implementation of health care reform. 6. Predicting the Effects of the ACA on Employment Arrangements The evidence from Massachusetts suggests that health insurance reform in that state may have been associated with modest increases in part-time and temporary help employment. The ACA reforms were modeled on those in Massachusetts, although, as noted, differences between the two could affect the share of employers and employees affected by the mandates and, if employers are covered by the mandate, the incentives they have to comply, pay the penalty, or evade the mandate by shifting work to alternative staffing arrangements. For those employers not in compliance with the health insurance mandate, the ACA assesses much stiffer penalties. This fact coupled with the lower support among employers nationally for the reform suggests that there could be greater shifting of work to short-hours part-time or alternative staffing arrangements than occurred in Massachusetts. In this section, we examine the characteristics of employers and employees most affected by the ACA mandate. In view of these characteristics, we then consider possible responses of employers to the ACA mandate, along with limited and preliminary evidence of their responses. 17 Who is affected by the ACA employer mandate? The National Compensation Survey (NCS), administered by the Bureau of Labor Statistics, and the Medical Expenditure Panel Survey, administered by the U.S. Bureau of Census in cooperation with the U.S. Department of Health and Human Services, collect data on the characteristics of employers, whether employers offer certain groups of workers health insurance benefits, and the take-up rate among employees offered health insurance coverage. Published statistics from these surveys, however, do not permit estimates of the gap between the number of employees who are currently offered employer-sponsored health insurance and the number who should be offered employer-sponsored health insurance if the ACA were in effect. To generate such estimates, we use data from the March Supplements to the Current Population Survey (CPS), which among other things collect information for the preceding year on whether a worker has health insurance through their employer, the size and industry of the employer, and the average weekly hours worked. To estimate the number of workers offered health insurance by industry, we divide the number of employees in a particular industry reporting that they obtain health insurance through their employer, as reported in the March CPS, by the industryspecific health insurance take-up rate (the ratio of the number of employees with health insurance through their employer to the number offered the health insurance option), as reported in the National Compensation Survey. To increase the sample size on which these estimates are based, we pool data from the 2010, 2011 and 2012 March CPS.16 From the March CPS, we estimate that on average about 43 million, or a third of the employed, were not offered health insurance through their place of employment from 2010 to 2012. Under the ACA, however, only employers with at least 50 full-time employees will be required to offer health insurance and only to employees averaging 30 or more hours per week. Using data on employer size and weekly work hours, we estimate that only about 16 percent of those not offered employer-sponsored health insurance would be covered by the ACA mandate, or 7 million workers. These workers represent about 5 percent of the workforce and arguably are the most vulnerable to some change in their employment status. We should note several caveats to these estimates. The CPS asks household respondents to report the total number of employees in the organization, not the number of full-time employees. 16We use March 2013 industry-level estimates of health insurance take-up rates from the National Compensation Survey, http://www.bls.gov/ncs/ebs/benefits/2013/ownership/private/table05a.pdf. The estimates are for non-farm, private-sector establishments. We assume average take-up rates of non-farm private sector establishments for workers in agriculture and public administration. 18 As a result, a small percentage of the workers whom we consider covered by the ACA employer mandate may work in organizations with fewer than 50 full-time employees. In addition, an estimated 2 to 3 percent of workers are in direct-hire temporary positions and another 2 percent work for temporary help agencies. Most of these workers will not average at least 30 hours per week on the job over the year, and thus employers will not be required to offer health insurance to them. Together, these factors would result in an overestimate of the number of workers covered by the ACA employer mandate who are not currently offered health insurance. On the other hand, our industry level take-up rates include firms of all sizes. Take-up rates are likely somewhat higher in the large firms subject to the ACA mandate, which in turn would result in an understatement of the number covered by the ACA mandate but not currently offered health insurance. With these caveats in mind, Table 4 displays estimates of the distribution of these workers by weekly hours worked and firm size. First, it is notable that almost three-quarters of the individuals not offered employer-sponsored insurance but covered by the ACA employer mandate work in organizations with 100 or more employees. Although smaller firms are less likely to offer their employees health insurance, many more workers are employed in large organizations. In addition, although 85 percent of those exceeding the 30 hours-per-week threshold report weekly hours of forty or more, about half of those who would be covered by the ACA employer mandate but who are not offered employer-sponsored health insurance work between 30 and 39 hours per week. This finding reflects the fact that the offer of health insurance drops sharply with hours worked, and suggests that, in order to be compliant with the new law, many employers will have to extend health insurance coverage to employees previously classified as part time. Alternatively, because these workers are already close to the weekly hours threshold, employers may choose to reorganize work so as to reduce workers’ average annual weekly hours, either by cutting hours worked each week or by hiring workers on a temporary or on-call basis directly or through an intermediary. The industry distribution of workers who should be covered by the employer mandate but who are not currently offered employer-sponsored health insurance also provides insights into potential employer responses to the mandate. We estimate that almost a quarter of the affected workers are in retail trade, while another 18 percent are in accommodation and food services. These industries are characterized by extensive part-time and on-call work; in firms with 50 or more employees, the share working fewer than 30 hours per week is 22 percent and 28 percent in retail and in accommodation and food services, respectively. It may be relatively straightforward for many 19 employers in these industries to circumvent the ACA mandate by reorganizing work to reduce average weekly hours worked by staff. We break out Employment Services, which is mainly composed of the Temporary Help Services industry, from the Professional and Business Services sector in Table 4. Interestingly, although in the CPS the number of workers in Employment Services is only about 8 percent of the number in the rest of Professional and Business Services, the estimated number of workers not receiving an offer of health insurance from their employer but averaging 30 or more hours per week is roughly the same in the two—about 460,000.17 As noted, however, to the extent that Employment Services workers are in temporary assignments, their employers may not be required to offer them insurance. In sum, we estimate that the number of workers who currently are not offered a health insurance option at their workplace but whose employers will be required to offer such an option under the ACA represents about 5 percent of workforce. Theory suggests that employers who comply with the ACA will pass along much of the cost to workers by reducing wages or other benefits. Yet, cutting nominal wages and benefits can be difficult, with adverse effects on worker morale and productivity, and, if the low inflation of recent years persists, employers’ ability to reduce real wages by granting small or no nominal wage increases will be limited. 18 Additionally, in contrast to Massachusetts where health care reform enjoyed broad support, the ACA has been divisive, with many employers appearing philosophically opposed to complying with the law, as evidenced by the July 1, 2014 Supreme Court decision allowing owners of closely-held, private companies to exclude contraceptive care in their company health insurance plans. Preliminary evidence on ACA’s likely effects on staffing arrangements These factors coupled with the relatively high penalties for noncompliance may push some employers to alter their staffing patterns to circumvent the mandate. The majority of workers affected by the mandate but not currently offered health insurance work less than 40 hours per week, and in sectors like retail, accommodations and food services employers may find it relatively easy to adopt modest changes in staffing patterns to reduce workers’ average weekly hours below The number of workers reporting employment in Employment Services in the CPS is roughly half that in the BLS payroll survey, the Current Employment Statistics program. It is generally believed that most of the difference reflects underreporting in the CPS, because although workers are legally the employees of the temporary or other staffing agencies, they frequently report the client company as their employer. 18 Using CPS data, Graham-Squire and Jacobs (2013) identify 2.2 million workers they deem most vulnerable to reduction in hours as those who are currently working 30–36 hours per week, who do not receive health insurance through their employer, and who fall below 400 percent of the federal poverty level. 17 20 the 30 hour-per-week threshold. Additionally, because employers with fewer than 50 full-time employees are exempt from the mandate, larger employers may find it attractive to subcontract certain tasks to smaller employers. Finally, employers may side-step the mandate by increasing their use of temporary workers either by hiring workers on a temporary basis directly or by working through an agency. Early reports and anecdotal evidence on employer responses to the anticipated ACA health insurance benefit mandate suggest some employer substitution of part-time (benefits ineligible) workers for full-time workers among new hires or of reductions in worker hours to below 30 hours per week. Until July 2013 when the delay in the employer mandate was announced, the first half of 2013 was a look-back or measurement period for employers, which would determine the number of full-time equivalent employees that an employer would be obligated to offer coverage. As this date shifted to January 1, 2015 for employers with at least 100 full-time equivalent employees, 2014 became the look-back period for those employers, during which we would expect them to continue to make workforce adjustments in expectation of higher health insurance benefit costs. (The effective date of the mandate for employers with 50-99 full-time workers is January 1, 2016). As of January 31, 2014, one organization, Investor’s Business Daily, had compiled a list of more than 400 public and private employers for which it claims there is “strong proof” (i.e., official documents or accounts) that these employers have cut work hours from full- to part-time or reduced hours of new hires to be less than 30 in order to circumvent the health insurance benefit requirement. 19 And in an article describing actions by cities, counties, public schools and community colleges to reduce the work hours of part-time employees to avoid paying for their health insurance under ACA, a school superintendent commented: “Are we supposed to lay off full-time teachers so that we can provide insurance coverage to part-time employees?” (Pear 2014). Typical responses among some of these public sector employers have been to reduce part-time work hours from 32–35 to 29 hours, just below the 30-hour cutoff established by the law. Other indirect, evidence comes from recent trends in part-time employment. Although the unemployment rate has dropped sharply during the recovery period, the rate of part-time employment has remained stubbornly high (see Roberson and Terry 2015). In its assessment of the likely labor market effects of the ACA, the Congressional Budget Office predicts an increase in parttime employment, but “almost entirely because workers will choose to supply less labor,” owing to 19 See a list of the employers and the changes made and/or number of workers affected with dates of the reports at: http://news.investors.com/politics-obamacare/020314-669013-obamacare-employer-mandate-a-list-of-cutsto-work-hours-jobs.htm. 21 the availability of affordable health insurance on the exchanges and other incentives they will face (Congressional Budget Office 2014). If workers are choosing to work fewer hours, then the persistently high rate of part-time employment during the recovery could be the product of two countervailing trends: the fall of involuntary part-time employment for economic reasons and the rise of voluntary part-time employment. In fact, however, the current high rate of part-time employment stems from the fact that involuntary unemployment has fallen very slowly during the recovery, particularly in industries with historically high rates of part-time employment. We examine these patterns in greater detail in Figure 3, which uses monthly data from the Current Population Survey to depict the rates of voluntary part-time and involuntary part-time employment for economic reasons in selected sectors: accommodation and food services, retail trade, education and healthcare, professional and business services, and manufacturing.20 These sectors account for over three-quarters of the workers identified in Table 4 as not being offered employment-based health insurance, but subject to the employer mandate and so vulnerable to a change in employment status. Voluntary part-time employment in all sectors is seasonal, but displays no cyclicality or trend growth. In contrast, involuntary part-time employment for economic reasons spiked in all sectors in 2008 and, except in manufacturing, remains well above pre-recession levels. Figure A1 confirms that most of the increase in involuntary part-time employment was among those working fewer than 30 hours per week.21 The growth in and persistently high levels of involuntary unemployment are especially striking in accommodation and food services and in retail trade. From Table 4, prior to the implementation of the ACA employer mandate, particularly large numbers of employees in these sectors were employed in large firms, were working between 30-39 hours, and were not offered employer-sponsored health insurance. Above, we argue that employers in these sectors might find it relatively easy to adjust usual hours below the 30 hour per week threshold, and the patterns of 20 If respondents work less than 35 hours per week, the survey asks if they prefer full-time work. If they respond that they do, then respondents are asked why they are working part-time. In the data reported in Figure 3, we only classify workers as involuntarily part-time if they are working part-time for economic reasons, e.g., because their employer cut their hours or because they can only find part-time work. We count those who state that they would prefer full-time employment but are working part-time for personal reasons (e.g., because of school or family responsibilities) as voluntary part-time. 21 Figure A1 shows the rates of involuntary part-time employment broken out two ways: 1) involuntary parttime rates among those with fewer than 30 weekly hours and with 30 or more weekly hours, and 2) involuntary part-time rates among those with 30 or fewer weekly hours and with more than 30 hours. Respondent answers on weekly work hours tend to bunch at even intervals, and it is likely that some with weekly hours slightly less than 30 report working 30 hours. The first comparison shows that a substantial majority of the increase in involuntary part-time employment occurred among those who reported working fewer than 30 hours. The second comparison shows that virtually all of the increase in involuntary part-time employment occurred among those reporting 30 or fewer weekly hours of work. 22 involuntary part-time employment in Figure 3 are consistent with such a response. In contrast, such a response is less likely in manufacturing where work is less amenable to part-time hours and, prior to implementation of the employer mandate, the majority of employees for whom the mandate would be binding were working 40 or more hours per week. The fact that by 2014 involuntary parttime employment was only slightly above pre-recession levels is consistent with a prediction that manufacturing employers seeking to evade the ACA employer mandate will likely turn to other staffing arrangements. With respect to use of temporary help workers, some industry analysts predict that staffing agencies will receive a boost from the ACA mandate (Hancock 2013a; Silber and Condra 2013). The temporary help industry absorbed disproportionate job losses during the Great Recession; employment declined by more than 30 percent compared to the 6 percent employment decline in the economy overall. During the recovery, however, temporary help employment has expanded at a considerably faster pace than overall employment, and today the number and share of workers in temporary help employment is at record levels (Figure 4). Further analysis using data from the Occupational Employment Statistics (OES) program shows that employment growth in the Employment Services industry (which is composed largely of temporary help services) has been driven by employment in production occupations. Between 2007 and 2013 (the most recent year for which OES data are available), the share of production workers employed in the Employment Services industry rose from 6.9 to 8.0 percent.22 Production workers in the Employment Services sector are primarily utilized by manufacturers (Dey, Houseman, and Polivka 2012). While various factors could account for the large relative increase in the number of production workers hired through staffing agencies, the passage of the ACA in 2010 may be a contributing factor. Definitive evidence on the effects of the ACA on temporary help and other staffing arrangements, however, can be found only once employers have fully adjusted to the mandate, and in conclusion, we consider issues for future research. 7. Conclusion We set out to provide an initial understanding—and a framework for thinking about—how many and which employers and employees are likely to be directly affected by the provisions of the ACA Data for the more disaggregated temporary help industry are not publicly available. We employ procedures in Dey, Houseman, and Polivka (2012) to estimate the share of production employment in the Employment Services industry, which involves benchmarking overall industry employment to the CES and using the OES to estimate the occupational distribution of employment within an industry. It should be noted that published OES figures are based on data collected in that year and in the two prior years; 2013 figures, for example, utilize data collected in the 2011, 2012 and 2013 surveys, and estimates reflect an average of employment conditions over the three-year period. 22 23 employer mandate to offer health insurance coverage. The employer mandate in the ACA has prompted much concern that employers will side-step the mandate by reducing work hours below the 30 hour per week threshold, by hiring more temporary workers directly or through agencies, and by contracting out work to firms with fewer than 50 employees. The mandate, which is intended to benefit workers, could instead result in the degradation of jobs, particularly those of the loweducated. To address that concern, legislation has been introduced in Congress to modify the ACA by re-defining full-time work as 40 hours per week. (Howell 2014). Other proposals for reform would eliminate the mandate altogether or establish other incentives for employers to help cover uninsured employees.23 Our paper sheds light on the magnitude of the potential effects of the ACA’s employer mandate on staffing arrangements in organizations, and also whether concerns about changes in staffing patterns are warranted. We find that the Massachusetts health reform modestly increased part-time employment among low-educated workers, and arguably the structure of incentives under the ACA, along with the current economic and political environment, could induce relatively greater shifting of workers into arrangements not covered by the mandate. Although subject to caveats discussed above, our estimates of the number of workers who should be covered by the employer mandate but who currently are not offered employer-sponsored health insurance provide evidence on the hours and industry distribution of workers most vulnerable to reduction in hours or other changes in their staffing arrangements. The number of such vulnerable workers—about 7 million or 5 percent of the workforce—is modest but significant; under the ACA, as was the case in the Massachusetts reform, the large majority of workers subject to the employer mandate already are offered employer-sponsored health insurance. The number whose employment arrangements will ultimately be affected by the mandate may be considerably lower than the number of potentially vulnerable identified in our analysis and will depend, in part, on future macroeconomic conditions. Continued improvement in the economy and tightening of labor markets would make it harder for employers to hire workers in short hours part-time or less desirable employment arrangements. And an increase in the rate of inflation would make it easier for employers to pass along the costs of health insurance to workers through lower real wages, obviating the need from their perspective to side-step the mandate. Nevertheless, our 23 Blumberg et al. (2014) argue for eliminating the ACA employer mandate, citing among other factors the perverse incentives the ACA gives firms to hire more short-hours part-time workers or to keep employment levels below the 50-worker threshold. Jost (2014) suggests a policy requiring that minimum spending on by employers on health insurance benefits be set as a fixed percentage of wages. 24 findings indicate that the impact of the employer mandate on staffing arrangements among certain groups—especially low-educated, low-wage workers—and in certain industries—including retail, accommodations, and food services—could be sizable, and careful monitoring of the law’s effects is needed to inform future policy decisions. 25 References Abadie, Alberto, Alexis Diamond, and Jens Hainmueller. 2010. “Synthetic control methods for comparative case studies: Estimating the effect of California’s tobacco control program.” Journal of the American Statistical Association 105(490): 493–505. doi: 10.1198/jasa.2009.ap08746. Antwi, Yaa Akosa, Asako S. Moriya, and Kosali Simon. 2013. “Effects of Federal Policy to Insure Young Adults: Evidence from the 2010 Affordable Care Act’s Dependent-Coverage Mandate.” American Economic Journal: Economic Policy 5(4): 1–28. Bertrand, Marianne, Esther Duflo, and Sendhil Mullainathan. 2004. “How Much Should We Trust Differences-In-Differences Estimates?” The Quarterly Journal of Economics 119(1): 249–275. Blumberg, Linda J., John Holahan and Matthew Buettgens. 2014. “Why Not Just Eliminate the Employer Mandate?” The Urban Institute In-Brief, May. Buchmueller, Thomas C., John DiNardo, and Robert G. Valletta. 2011. “The Effect of an Employer Health Insurance Mandate on Health Insurance Coverage and the Demand for Labor: Evidence from Hawaii.” American Economic Journal: Economic Policy 3(November): 25–51. Bureau of Labor Statistics. 2014. Employer Costs for Employee Compensation – December 2013. News Release USDL-14-0390, March 12. Cappelli, Peter, and J.R. Keller. 2013 “A Study of the Extent and Potential Causes of Alternative Staffing Arrangements.” ILR Review 66(4): 874–901. doi: 10.1177/001979391306600406. Congressional Budget Office. 2014. Labor Market Effects of the Affordable Care Act: Updated Estimates. http://www.cbo.gov/sites/default/files/cbofiles/attachments/45010-breakoutAppendixC.pdf Conley, Timothy G., and Christopher R. Taber. 2013. “Inference with ‘difference in differences’ with a small number of policy changes.” The Review of Economics and Statistics 93(1): 113–125. Courtemanche, Charles J., and Daniela Zapata. 2014. “Does Universal Coverage Improve Health? The Massachusetts Experience.” Journal of Policy Analysis and Management 33(1): 36–69. Coventry Health Care. 2012. “The Affordable Care Act and Essential Benefits.” http://www.ahipcoverage.com/wp-content/uploads/2012/03/Updated-MillimanReport.pdf (accessed February 17, 2014). Cutler, D. M. 2003. “Employee Costs and the Decline in Health Insurance Coverage.” In Frontiers in Health Policy Research: Volume 6, David M. Cutler and Alan M. Garber, eds. Cambridge MA: The MIT Press, for the National Bureau of Economic Research, pp. Dey, Matthew, Susan N. Houseman and Anne E. Polivka. 2012. “Manufacturers’ Outsourcing to Staffing Services.” Industrial and Labor Relations Review 65(3): 533–559. 26 Dubay, Lisa, Sharon K. Long and Emily Lawton. 2012. “Will Health Reform Lead to Job Loss? Evidence from Massachusetts Says No.” Urban Institute. Retrieved from: http://www.urban.org/UploadedPDF/412582-Will-Health-Reform-Lead-to-Job-LossEvidence-from-Massachusetts-Says-No.pdf Erickcek, George, Susan Houseman, and Arne Kalleberg. 2003. “The Effects of Temporary Staffing Services and Contracting Out on Low-Skilled Workers: Evidence from Auto Suppliers, Hospitals and Public Schools.” In Low-Wage America: How Employers Are Reshaping Opportunity in the Workplace, Eileen Appelbaum, Annette Bernhardt, and Richard J. Murnane, eds. New York: Russell Sage Foundation, pp. 368–403. Executive Office of the President. 2014. Statement of Administration Policy. Office of Management and Budget, Washington, DC, April 1. Retrieved from: http://www.whitehouse.gov/sites/default/files/omb/legislative/sap/113/saphr2575r_2014 0401.pdf Farber, H., and Levy, H. 2000. “Recent Trends in Employer-Sponsored Health Insurance Coverage: Are Bad Jobs Getting Worse?” Journal of Health Economics 19(1): 93–119. Fitzpatrick, Maria D. 2008. “Starting school at four: The effect of universal pre-kindergarten on children's academic achievement.” The BE Journal of Economic Analysis & Policy 8(1). doi: 10.2202/1935-1682.1897. Gabel, Jon R., Heidi Whitmore, and Jeremy Pickreign. 2008. “Report from Massachusetts: Employers Largely Support Health Care Reform, and Few Signs of Crowd-Out Appear.” Health Affairs 27(1): w13–w23. Goodnough, Abby. 2012. “In Massachusetts, Insurance Mandate Stirs Some Dissent.” New York Times, March 27. Graham-Squire, Dave, and Ken Jacobs. 2013. “Which Workers Are Most at Risk of Reduced Hours under the Affordable Care Act?” UC Berkeley Labor Center Data Brief (February). http://laborcenter.berkeley.edu/healthcare/reduced_work_hours13.pdf. Graves, John A., and Jonathan Gruber. 2012. “How Did Health Care Reform in Massachusetts Impact Insurance Premiums?” The American Economic Review 102(3): 508–513. Gruber, J., and R. McKnight. 2003. “Why Did Employee Health Insurance Contributions Rise?” Journal of Health Economics 22: 1085–1104. Gruber, Jonathan. 1994. “The Incidence of Mandated Maternity Benefits.” The American Economic Review 84(3): 622–641. Hancock, Jay. 2013a. “Health Law Could Boost Use of Temp Workers.” Washington Post, March 25. Hancock, Jay. 2013b. “Why Health Law’s ‘Essential’ Coverage Might Mean ‘Bare Bones’.” Kaiser Health News, August 25. 27 Health and Human Services. nd. “Key Features of the Affordable Care Act by Year.” http://www.hhs.gov/healthcare/facts/timeline/timeline-text.html (accessed February 17, 2014). Heinrich, Carolyn, and Susan Houseman. 2013. “Temporary Help Employment in Recession and Recovery.” Working paper, Upjohn Institute. Hill, Steven C. 2012. “Individual Insurance Benefits To Be Available Under Health Reform Would Have Cut Out-Of-Pocket Spending In 2001–08.” Health Affairs 31(6): 1349–1356. Hofer, Adam N., Jean Abraham, and Ira Moscovice. 2011. “Expansion of Coverage Under the Patient Protection and Affordable Care Act and Primary Care Utilization.” Milbank Quarterly 89(1): 69–89. Houseman, Susan N. 2001. "Why Employers Use Flexible Staffing Arrangements: Evidence from an Establishment Survey." Industrial and Labor Relations Review 55(1) (October): 149-170. Howell, Tom. 2014. “House passes bill to change Obamacare’s workweek from 30 hours to 40.” Washington Times, April 3. Retrieved from: http://www.washingtontimes.com/news/2014/apr/3/house-passes-bill-change-obamacareworkweek-hours/. Huang, Elbert S., and Kenneth Finegold. 2013. “Seven Million Americans Live in Areas Where Demand for Primary Care May Exceed Supply by More Than 10 Percent.” Health Affairs 32(3): 614–621. International Foundation of Employee Benefit Plans (Bonner, Patricia, Ed.). “2013 EmployerSponsored Health Care: ACA’s Impact.” (2013). Jost, Timothy. 2014. “Repeal, and Replace, the Employer Mandate.” Health Affairs, June 4, 2014. Kaiser Family Foundation. 2007. “Massachusetts Health Care Reform Plan: An Update.” June 2007. http://kaiserfamilyfoundation.files.wordpress.com/2013/01/7494-02.pdf (accessed February 17, 2014). Kaiser Family Foundation. 2013. “Summary of the Affordable Care Act.” Last modified April 23, 2013. http://kaiserfamilyfoundation.files.wordpress.com/2011/04/8061-021.pdf (accessed February 17, 2014). Kennedy, Kelly. 2014. “Another Part of the Affordable Care Act Delayed for a Year.” USA Today, February 10. Kolstad, Jonathan T., and Amanda E. Kowalski. 2012a. Mandate-Based Health Reform and the Labor Market: Evidence from the Massachusetts Reform. NBER Working Paper No. w17933. Cambridge, MA: National Bureau of Economic Research. Kolstad, Jonathan T., and Amanda E. Kowalski. 2012b. “The Impact of Health Care Reform on Hospital and Preventive Care: Evidence from Massachusetts.” Journal of Public Economics 96(11): 909–929. 28 Lee, D.R., and Warren, R.S. 1999. “Mandated Health Insurance and the Low-Wage Labor Market.” Journal of Labor Research 20(4): 505–515. Lettau, M.K., and Buchmueller, T.C. 1999. “Comparing Benefit Costs for Full- and Part-Time Workers.” Monthly Labor Review 122(3): 30–35. Liptak, Adam. 2012. “Supreme Court Upholds Health Care Law, 5-4, in Victory for Obama.” New York Times, June 28. Long, Sharon K. 2008. “On the Road to Universal Coverage: Impacts of Reform in Massachusetts at One Year.” Health Affairs 27(4): w270–w284. Long, Sharon K., Karen Stockley, and Heather Dahlen. 2012. “Massachusetts Health Reforms: Uninsurance Remains Low, Self-Reported Health Status Improves as State Prepares to Tackle Costs.” Health Affairs 31(2): 444–451. MassResources.org. 2014. “Massachusetts Health Insurance Requirements.” http://www.massresources.org/health-reform.html (accessed February 17, 2014). McDonough, John E., Brian Rosman, Fawn Phelps, and Melissa Shannon. 2006. “The Third Wave of Massachusetts Health Care Access Reform.” Health Affairs 25(6): w420–w431. Miller, Sarah. 2012. “The Effect of Insurance on Emergency Room Visits: An Analysis of the 2006 Massachusetts Health Reform.” Journal of Public Economics 96(11): 893–908. O’Hara, Brett, and Matthew W. Brault. 2013. “The Disparate Impact of the ACA‐Dependent Expansion across Population Subgroups.” Health Services Research 48(5): 1581–1592. Pear, Robert. 2014. Public Sector Cuts Part-Time Shifts to Bypass Insurance Law. New York Times, February 20. Raymond, Alan G. 2007. The 2006 Massachusetts Health Care Reform Law: Progress and Challenges After One Year of Implementation. Boston and Waltham, MA: BCBSMA Foundation, Massachusetts Medicaid. Robertson, John and Ellie Perry. 2015. “Are We Becoming a Part-time Economy?” Federal Reserve Bank of Atlanta. http://macroblog.typepad.com/macroblog/2015/02/are-we-becoming-apart-time-economy.html Schoen, Cathy, Michelle M. Doty, Ruth H. Robertson, and Sara R. Collins. 2011. “Affordable Care Act Reforms Could Reduce the Number of Underinsured U.S. Adults by 70 Percent.” Health Affairs 30(9): 1762–1771. Schultz, J.F., and Doorn, D. 2009. “Employer Health Benefit Costs and Demand for Part Time Labor.” Working Paper CES 09-08: Center for Economic Studies, U.S. Census Bureau. Silber, Jeffrey M., and Paul Condra. 2013. “Thoughts from 2013 Staffing Industry Executive Forum.” BMO Capital Markets, March 1. 29 Sommers, Benjamin D., Thomas Buchmueller, Sandra L. Decker, Colleen Carey, and Richard Kronick. 2013. “The Affordable Care Act Has Led To Significant Gains in Health Insurance and Access to Care for Young Adults.” Health Affairs 32(1): 165–174. Summers, Lawerence. 1989. “Some Simple Economics of Mandated Benefits.” The American Economic Review 79(2): 177–183. Vistnes, J., Zawacki, A., Simon, K., and Taylor, A. 2010. “Declines in Employer Sponsored Coverage Between 2000 and 2008: Officers, Take-up, Premium Contributions and Dependent Options.” Working Paper 10-23, Center for Economic Studies, U.S. Census Bureau. Wachenheim, Leigh, and Hans Leida. 2012. “The Impact of Guaranteed Issue and Community Rating Reforms on States’ Individual Insurance Markets.” Seattle, WA: Milliman, Inc. http://www.ahipcoverage.com/wp-content/uploads/2012/03/Updated-MillimanReport.pdf (accessed February 17, 2014). Weaver, Christopher, and Anna Mathews. 2013. “Employers Eye Bare-Bones Plans under New Law.” Wall Street Journal. May 20. 30 12.0 10.0 8.0 6.0 4.0 2.0 Jan May Sep Jan May Sep Jan May Sep Jan May Sep Jan May Sep Jan May Sep Jan May Sep Jan May Sep Jan May Sep Jan May Sep Jan May Sep 0.0 2003 2004 2005 2006 2007 2008 MA 2009 2010 US SOURCE: Current Population Survey and the Local Area Unemployment Statistics. Figure 1 Unemployment in Massachusetts Compared to the Rest of the Nation. 31 2011 2012 2013 0.06 0.05 0.04 0.03 0.02 0.01 0 2000 2001 2002 2003 2004 2005 2006 2007 2008 2009 2010 2011 2012 2013 -0.01 Rest of U.S. as Control Group Rest of New England as Control Group NOTE: The graph displays β estimates from two separate regressions of Equation (2) that control for state, sex, race, education, age, the unemployment rate, and the month of the observation. The data come from the monthly CPS. The sample includes wage and salried employees ages 18-64, excluding those with inputed hours of work. Figure 2 Part-Time Work in Massachusetts Compared to the Rest of the Nation. 32 Voluntary Part-time Employment Involuntary Part-Time Employment 30 25 Accomodation and food services 25 Accomodation and food services 20 Retail trade 20 Retail trade 15 Percent Percent 30 Educational and health services 15 10 Educational and health services 5 Professional and business services 5 Professional and business services 0 Manufacturing 0 Manufacturing 10 Figure 3 Voluntary and Involuntary Rates of Part-time Employment, Selected Sectors. SOURCE: Bureau of Labor Statistics, Current Population Survey. 33 15 Temp-help employment Total employment 10 5 0 -5 -10 -15 -20 -25 -30 -35 2007 2008 2009 2010 2011 2012 2013 NOTE: Figure shows percent difference in employment relative to employment in December 2007 for employment in the temporary help industry and total nonfarm payroll employment. SOURCE: Authors' calculations based on data from the BLS Current Employment Statistics. Figure 4 Employment Growth since Last Cyclical Peak, December 2007. 34 Table 1. Comparison of Massachusetts Reform and the Affordable Care Act Massachusetts Health Care Reform Patient Protection and Affordable Care Act Dates Date of passage April 12, 2006 Effective date July 1, 2007 March 23, 2010; Specific provisions phased b in through 2020 Preventative care Co-pay, but must be covered without a deductiblec Freed Pre-existing conditions Insurers required to cover Maximum deductible $2,000 Out-of-pocket maximum a b March 23, 2010 a Minimum Care e Insurers required to coverd a $2,000 in small group marketf $5,000 a $6,350 (as of 2014)a Essential benefits Ambulatory patient services; emergency services; hospitalization; mental health; prescription drug coverage; preventive and primary carec Ambulatory patient services; emergency services; hospitalization; maternity and newborn care; mental health and substance use disorder services, including behavioral health treatment; prescription drugs; rehabilitative and habilitative services and devices; laboratory services; preventive and wellness services and chronic disease management; and pediatric services, including oral and vision caref Annual limits Insurers cannot set annual limitsc Insurers cannot set annual limitsd Lifetime limits No lifetime limit ban Insurers cannot set lifetime limitse Employer mandate Yesa Yesb Provisions Employers must offer a health Employers must offer a health insurance insurance plan to full-time plan or pay an annual penalty per employees or pay an annual employeeb,g penalty per employeee,g Penalties Employers must pay a Must pay $2,000 per full-time employee penalty of $295 per (after first 30 employees) for not offering employee per year if the any insurance options employer does not offer Must pay $3,000 for not offering health insurance or meet the affordable coverage, for each employee contribution requirement. receiving a tax credit for insurance Must also pay a penalty if purchased on exchangeb,g employees use the uncompensated care poola Full-time definition 35 or more hours per weekc Employers 35 30 or more hours per weekg Table 1 (Continued) Massachusetts Health Care Reform Patient Protection and Affordable Care Act Contribution requirement At least 25 percent of full-time employees must be enrolled in the employer's plan or the employer must offer to pay at least 33 percent of the premium costc Insurance plan must pay for at least 60 percent of covered health care expenses for a typical population and employees must pay no more than 9.5 percent of family income for employer coverageb Exemptions Companies with fewer than 11 Companies with fewer than 50 full-time full-time employeesa employeesb Provisions for exempt employers Employers with 10 or fewer employees may purchase coverage for employees through the Commonwealth Health Insurance Connectora,g Employers with fewer than 25 employees may be eligible for a tax credit for offering health insurance if average wages are under $50,000b,g Individual mandate Yesa Yesb Marketplaces created The Connector, which allows individuals and small businesses to compare and purchase private insurance that meets coverage and cost standardsa State Exchanges, which allow individuals and small businesses to compare and purchase private insurance that meets coverage standardsb Penalty for not buying Individuals who go three or more months without purchasing affordable coverage face penalties: Initially, $219 per individual Starting in 2008, up to 50 percent of the cost of the least expensive coverageg The penalty is the greater of: For 2014, $95 per uninsured person or 1 percent of household income over the filing threshold For 2015, $325 per uninsured person or 2 percent of household income over the filing threshold For 2016 and beyond, $695 per uninsured person or 2.5 percent of household income over the filing thresholdbg Subsidized insurance: Yes; for anyone earning up to 300 percent of poverty level; Free for anyone earning up to 150 percent of poverty levela Yes; for anyone earning up to 400 percent of poverty level whose employer does not offer health insurance, covers less than 60 percent of the actuarial value, or whose employee share exceeds 9.5 percent of incomeb Exemptions Income at or below 150 Income below 100 percent of the federal percent of the federal poverty poverty level; not being required to file level; cannot find an affordable income taxes; having religious objections; plan based on income and having a coverage gap shorter than three family size; religious beliefs months; or being an American Indian, against health insurance; undocumented immigrant, or incarcerated financial hardship during a yeare personb Individuals 36 Table 1 (Continued) Massachusetts Health Care Reform Patient Protection and Affordable Care Act Medicaid To qualify Expanded to cover children Expanded so that people with a household with family incomes up to 300 income below 133 percent of the poverty percent of the federal poverty level will qualifyb level. Eligibility levels for adults remains the same, though enrollment caps for certain Medicaid programs for adults were raiseda Individual Market Factors insurers can price use in pricing Family structure, geography, Family structure, geography, age, and and age as of 1996 (before 2006 tobacco useb reform)h Guaranteed issue Yes, as of 1996 (before 2006 reform)h Yesb Young Adults Expanding dependent coverage Children can stay on parents’ Children stay on parents’ plan until age 26b plan until age 26 or until they have not been a dependent for 2 years – whichever is soonerc SOURCES: a Kaiser Family Foundation (2007) b Kaiser Family Foundation (2013) c Raymond (2007) d Health and Human Services (n.d.) e MassResources.org (2014) f Coventry Health Care (2012) g Kolstad and Kowalski (2012b) h Wachenheim and Leida (2012) 37 Table 2 Descriptive Statistics Massachusetts Male Black White Hispanic Age College High School Working Part-Time Full-Time Mean 0.46 0.06 0.88 0.08 40.66 0.38 0.90 0.73 0.13 0.60 Rest of US St. Dev 0.50 0.24 0.33 0.27 12.89 0.29 0.50 0.44 0.34 0.49 Mean 0.47 0.11 0.82 0.12 40.45 0.27 0.88 0.71 0.10 0.60 St. Dev 0.50 0.31 0.38 0.33 13.09 0.33 0.49 0.45 0.30 0.49 NOTE: The sample includes all individuals ages 18-64 except individuals with imputed hours of work and the self-employed. All tabulations are weighted using CPS weights. The sample has 215,245 individuals from Massachusetts and 12,307,752 individuals from the rest of the United States. SOURCE: Authors’ tabulations using the 2000 to 2013 basic monthly CPS. 38 Table 3 The Effect of the Massachusetts Reform on Employment Status Full Sample Bachelor's Degree Holders No Bachelor's Degree Holders Full Sample Massachusetts Insurance Reform S. E. Percent of Placebo Estimates Larger/Smaller than Massachusetts Estimate n 0.006 0.000 0.019*** (0.004) (0.005) (0.005) 0.18 0.40 0.00 8,872,040 2,799,222 6,072,818 New England Only Massachusetts Insurance Reform 0.009** 0.000 0.022*** S. E. (0.005) (0.007) (0.007) n 964,311 352,999 611,312 Synthetic Control Massachusetts Insurance Reform 0.006 0.011* 0.019*** S. E. (0.006) (0.006) (0.006) n 674,671 407,447 496,684 NOTE: *, **, and *** indicate significance at 10%, 5%, and 1% respectively. Each cell is the β coefficient from a separate regression of Equation (1) that controls for state, sex, race, education, age, the unemployment rate, and the month of the observation. The data come from the monthly CPS. The sample includes wage and salaried employees ages 18-64, excluding those with imputed hours of work. 39 Table 4 Distribution of Workers Who Are Not Offered Employment-based Health Insurance, Working 30+ Hours Per Week in Firms With 50+ Employees (percent) 50–99 employees 100+ employees Total by Industry 30–35 35–40 40+ 30–35 35–40 40+ Agriculture 0.1 0.1 1.4 0.1 0.2 2.0 3.9 Mining 0.0 0.0 0.0 0.0 0.0 0.0 0.1 Construction 0.2 0.3 2.4 0.3 0.3 1.6 5.1 Manufacturing 0.4 0.3 3.4 0.9 1.0 1.0 7.0 Wholesale Trade 0.1 0.1 1.0 0.4 0.2 1.7 3.6 Retail Trade 0.7 0.3 1.4 9.2 5.7 6.3 23.5 Transportation & Utilities 0.2 0.1 1.4 1.0 1.0 0.5 4.3 Information 0.0 0.1 0.0 0.3 0.3 0.0 0.7 Financial Activities 0.1 0.2 0.7 0.9 0.5 0.0 2.4 Employment Services 0.1 0.1 0.8 0.8 0.8 4.2 6.6 Professional & Business Services* 0.5 0.3 1.9 1.3 1.0 1.7 6.6 Education Services 0.3 0.3 0.0 3.1 1.5 0.0 5.2 Health Care and Social Assistance 0.9 0.9 3.0 3.7 1.1 0.0 9.6 Accommodation and Food Services 0.7 0.6 1.6 6.6 4.8 4.0 18.3 Other Services 0.3 0.2 0.0 1.4 0.8 0.0 2.7 Public Administration 0.0 0.0 0.0 0.5 0.0 0.0 0.5 Total by firm size and weekly hours 4.8 3.7 19.0 30.5 19.1 22.9 100.0 NOTE: * Figures for Professional and Business Services exclude Employment Services, which is primarily made up of the Temporary Help Services industry. SOURCE: Authors’ estimates using data from the March Current Population Survey and National Compensation Survey. 40 Part-Time Involuntary ≥30 hours 9 8 7 6 5 4 3 2 1 0 Accomodation and food services Retail trade Percent Percent Part-Time Involuntary <30 hours Educational and health services Professional and business services Manufacturing Part-Time Involuntary ≤ 30 hours 12 10 Retail trade Educational and health services Professional and business services Manufacturing 12 Accomodation and food services 10 8 8 6 Educational and health services 4 Professional and business services Percent Percent Accomodation and food services Part-Time Involuntary >30 hours Retail trade 2 9 8 7 6 5 4 3 2 1 0 6 4 2 Manufacturing 0 0 Figure A1. Involuntary Part-time Employment by Hours Worked, Selected Sectors. SOURCE: Bureau of Labor Statistics, Current Population Survey. 41 Accomodation and food services Retail trade Educational and health services Professional and business services Manufacturing


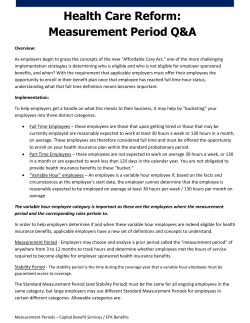


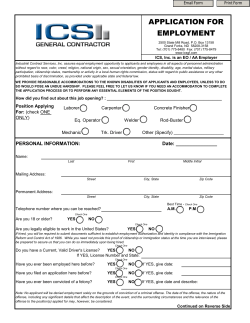
© Copyright 2026