
Pacific Environment and Climate Change Outlook 2012 Report
SPREP Library/IRC Cataloguing-in-Publication Data Secretariat of the Pacific Regional Environment Programme (SPREP) Pacific Environment and Climate Change Outlook – Apia, Samoa : SPREP, 2012. 266p. cm. ISBN: 978-982-04-0465-6 (print) 978-982-04-0466-3 (online) 1. Conservation of natural resources - Oceania. 2. Environmental protection – Oceania. 3. Climatic changes – Environmental aspects – Oceania. I. Pacific Regional Environment Programme. (SPREP) II. Title. 333.7 © Copyright Secretariat of the Pacific Regional Environment Programme 2012. All rights for commercial / for profit reproduction or translation, in any form, reserved. SPREP authorises the partial reproduction or translation of this material for scientific, educational or research purposes, provided that SPREP and the source document are properly acknowledged. Permission to reproduce the document and/or translate in whole, in any form, whether for commercial / for profit or non-profit purposes, must be requested in writing. Original SPREP artwork may not be altered or separately published without permission. Secretariat of the Pacific Regional Environment Programme PO Box 240 Apia, Samoa Tel: + 685 21929 Fax: +685 20231 Email: [email protected] Pacific Environment a and Clim mate Ch hange O Outlook k A colla aboration be etween Secreta ariat of the Pacific Reg gional Environment Pro ogramme (S SPREP) Secretariat of th he Pacific Community (SPC) Pa acific Island ds Applied G Geoscience es Commiss sion (SOPA AC) The United Nations E Environmen nt Programm me (UNEP) e University of the Soutth Pacific (U USP) The e The IUCN Regional Pacific Office ACKNOWLEDGEMENTS This review and report of the state of the Pacific environment was made possible through the highly capable work and commitment by teams of professionals in the fields of environmental management and the progress of social and economic developments in the region from the University of the South Pacific, the Secretariat of the Pacific Community, the IUCN Regional Oceania Office and SSC Invasive Specialists Group, the Secretariat of the Pacific Environment Programme and the United Nations Environment Programme. Their contribution and sacrifices of time and resources to the drafting, revision, and finalization of the report are deeply appreciated. The teams are gratefully acknowledged as follows: University of the South Pacific: Prof. Murari Lal, Prof. Biman Chan, Prof. Ranolph Thaman, Dr. Atul Raturi, Dr. Joeli Veitayaki, Dr. Matakiet Maata, Dr Ropate Qalo, Mr. Feue Tipu & Mr. Viliamu Iese Secretariat of the Pacific Community: Dr. David Duncan, Ms Caroline Tupoulahi-Fusimalohi, Mr. Mike Batty & Dr. Johann Bell IUCN Oceania Regional Office & IUCN SSC Invasive Specialists Group: Ms Helen Pippard, Ms Shyama Pagad & Sally Wong Secretariat of the Pacific Regional Environment Programme: Dr. Netatua Pelesikoti, Mr. Espen Ronneberg, Mr. Dean Solofa, Mr. Stuart Chape, Dr. Alan Tye, Dr. David Haynes, Ms Esther Richards, Mr. Anthony Talouli, Mr. Jeffrey Kinch, Mr. Sefanaia Nawadra, Dr. Gillian Key, Mr. Clark Peteru, Mr. Paul Anderson & Mr. Tepa Suaesi United Nations Environment Programme: Ms Joana Akrofi, Mr Mozaharul Alam, Ms Raji Dhital (Consultant), Mr Salif Diop, Ms Beth Ingraham, Ms Janet Kabeberi-Macharia, Ms Charuvan Kalyangkura, Mr Peter Kouwenhoven (Consultant), Mr Christian Marx, Mr Patrick Mmayi, Ms Ruth Mukundi, Ms Neeyati Patel, Ms Audrey Ringler, Ms Pinya Sarasas, Ms Tunnie Srisakulchairak, Ms Anna Stabrawa, Ms Panvirush Vittayapraphakul, Mr Jinhua Zhang Details of the team members and their contributions to the preparation of the report are provided in Appendix 3. FOREW WORD The United Nationss Environment Program mme (UNEP P) has the mandate m to keep under review obal environ nment. As h ighlighted in n the Rio+2 20 outcome document The the statte of the glo Future We Want, this calls forr the provisiion of scientific informa ation and buuilding natio onal and al capacity to o support in nformed deccision-making. The ma andate is im mplemented by regiona working g with partne ers through h scientific a assessmentts, identifyin ng emergingg issues, monitorring and earrth observation. hange Outlo ook 2012 as ssessment rreport has been b The Pacific Environment and Climate Ch ped in partn nership with the Secreta ariat of the Pacific Reg gional Envirronment develop Program mme (SPRE EP) and oth her regional institutions s. It uses an n integrated environmental assessm ment metho odology dev veloped for UNEP’s Global Environment Outllook proces ss to analyze e and prese ent data and d informatio n on the sta ate, trends and a outlookk of the environment in Paccific island countries. c The rep port presentts concrete evidence th hat food, fre eshwater an nd the livelihhoods of the e Pacific islanders are under thrreat due to climate cha ange, and concludes thhat the Paciific is at ntline in hum manity’s effo orts to comb bat and ada apt to climatte change. A As the Pres sident of the fron Kiribati,, H.E. Anote e Tong note es, “The pro oblem is mu uch more im mmediate thaan we perceived.” port reveals that while PICTs P are p particularly vulnerable to climate cchange, the The rep sustaina able manag gement of th heir 33 milli on hectares s of forests contributess to climate change mitigatio on as well as a to improv ving the live elihoods of local l communities. Thee report ana alyses the exp perience of 500 5 commu unities using g indigenous knowledg ge for more than 12,000 0 km2 of ii locally-m managed marine m areas s. It highlig ghts the wide replicability of this appproach for coastal and ma arine manag gement in addressing cchallenges ranging r from m sea level rise, to pollution and min ning, food security s and sustainable e livelihood ds in all Pacific island sstates. on this expe erience, I would w like to recognize the t recent SPREP S Minnisterial mee eting for Based o its endo orsement off a framewo ork for state of environm ment reporting by mem mber countries, and its plan to develop a project to o enhance tthe region’s s capacity fo or integratedd environme ental assessm ment work, not only to support na tional development strrategies, bu t to also incorpo orate the rep porting need ds of selectted Multilate eral Environ nmental Agrreements. This T is a positive e step towarrds the impllementation n of relevant Rio+20 ou utcomes, inccluding an inclusivve Green Ecconomy, and for realisi ng sustaina able develop pment in thee Pacific. Achim m Steiner Unite ed Nations Under-Sec cretary-Gen neral and E Executive Director D Un nited Nations Environ nment Prog gramme Novemb ber 2012 iii PREFA ACE The Pacific Environment and Climate Ch hange Outlo ook (PECCO O) 2012 is thhe fourth in na of regional State S of the Environme ent Reports for the Pac cific. Previouus reports were w series o publishe ed in 1982, 1991 and 2005. 2 PECC CO was pre epared by th he Secretarriat of the Pa acific Regiona al Environm ment Progra amme (SPR REP) in partnership with h a numberr of regionall organizzations inclu uding the Un niversity of the South Pacific, P the Secretariat of the Pacific Commu unity and IU UCN, with fin nancial and d technical support s from m the Unitedd Nations Environ nment Progrramme and the Europe ean Union funded f Asia a-Carribean--Pacific Multilateral Environ nmental Agrreement Pro oject. SPREP P’s mandate e and strategic plan req quires it to regularly r pro oduce regioonal State of o the Environ nment reporrts. These re eports are e essential to assess the e effectiveneess of plans s and actions implemente ed for conservation an nd the susta ainable management off the region’s articular its vast v oceanicc resources s and fragile e island ecoosystems. environment, in pa This is tthe first Paccific regiona al assessme ent report to o use the In ntegrated Ennvironmenta al Asessm ment (IEA) framework process p devveloped by UNEP. The e IEA providdes an impo ortant framew work for asse essing the state s of the environmen nt and for exploring poolicy options s for environmentally su ustainable developmen d nt. The PEC CCO reviews the progreess of environmental man nagement in n the Pacificc since the first Earth Summit S in 11992, examines options for advanccing sustaina able develo opment in th he context of o increasingg climate ch hange obal econom mic development, and a assesses im mpacts on th he well-beinng of the and glo populattions and so ocieties of th he Pacific. The rep port notes th he many challenges fa ced by the Pacific region includingg: the increase in large sccale development proje ects, often a associated with w biodive ersity loss aand fragmen ntation of ecosystems; inccreasing pop pulations; in ncreased de ependence of island coommunities on iiii importe ed food and commoditie es; increasiing waste and pollution n challengess; and invas sives speciess. These pre essures are e exacerbate ed by clima ate change, noted by P Pacific leade ers as the major issue forr our region, and more frequent ex xtreme weather eventss. The rep port also hig ghlights a nu umber of su uccesful leg gal, policy and planningg initiatives that have ha ad a significcant positive e impact on n the environ nment. These include tthe develop pment of community conserrvation areas, in particu ular network ks of locally y managed m marine area as; the ste reduction n and recyc cling measu ures; the connservation of o establisshment of national was energy and water resources; r the t develop pment of ren newable energy sourcees; the prom motion planting and d reforestattion program ms; and the mainstream ming of envvironmental of tree p conside erations into o developme ent plans. dings of the e report emp phasise mo re than eve er the need to "raise thee bar" throu ugh The find collectivve actions that t address s the region n’s environm mental need ds at all leveels. The rep port underlin nes the critical role of strengthene s ed environm mental institu utions and tthe importance of effective e communitty involvement. I am ve ery pleased to express my sincere thanks to all a who conttributed to thhe PECCO report. In particcular, I than nk the Unive ersity of the South Pac cific, the Sec cretariat of tthe Pacific Commu unity and the IUCN Reg gional Officce for Ocean nia. I am als so very gratteful of the continuing supportt provided by b the Unite d Nations Environmen E t Programm me, in partic cular the al team of itss Division of o Early Warrning and Assessment A in Bangkokk who have worked regiona with the closely with us on this report. Last and no ot least this s work was carried c out w ur member countries who w have en ndorsed its publication in this participation and support of ou SPREP Mee eting. year’s S David Sheppard Director General G Secretariat S of the Pac cific Region nal Environ nment Prog gramme Novemb ber 2012 ivv TABLE OF CONTENTS ACKNOWLEDGEMENTS ............................................................................................................ iv FOREWORD .................................................................................................................................. i PREFACE .................................................................................................................................... iii LIST OF TABLES........................................................................................................................ viii LIST OF FIGURES ....................................................................................................................... x LIST OF MAPS ............................................................................................................................ xi ABBREVIATIONS and ACRONYMS ........................................................................................... xi EXECUTIVE SUMMARY .............................................................................................................. 1 INTRODUCTION .......................................................................................................................... 7 1 DRIVERS OF ENVIRONMENTAL CHANGE IN THE PACIFIC ........................................ 12 1.1 PACIFIC ISLAND SOCIETIES AND GOVERNANCE ................................................................................................ 12 1.1.1 Demographics ................................................................................................................................................... 14 1.1.2 Social and Community Structures (Governmental & Traditional) .................................................................... 15 1.1.3 Access to Resources and Land Tenure System ................................................................................................. 17 1.1.4 Governance ...................................................................................................................................................... 18 1.2 ECONOMY ........................................................................................................................................................ 19 1.2.1 Gross Domestic Product ................................................................................................................................... 22 1.2.2 Tourism ............................................................................................................................................................. 23 1.2.3 Fisheries............................................................................................................................................................ 26 1.2.4 Agriculture and Forestry ................................................................................................................................... 28 1.2.5 Mining .............................................................................................................................................................. 31 1.2.6 Energy ............................................................................................................................................................... 32 2 ENVIRONMENTAL CHALLENGES AND PICTs’ RESPONSES ....................................... 35 2.1 STATUS OF INVASIVE SPECIES ........................................................................................................................... 35 2.1.1 Invasive Species Issues ..................................................................................................................................... 36 2.1.2 Response to Invasive Species: Policy ................................................................................................................ 39 2.1.3 Response to Invasive Species: Management ................................................................................................... 42 2.1.4 Key Actions for Invasive Species Issues ............................................................................................................ 43 2.2 WASTE AND TERRESTRIAL AND MARINE POLLUTION ....................................................................................... 44 2.2.1 Waste and Pollution Issues .............................................................................................................................. 44 2.2.2 Response to Waste and Pollution: Mitigation .................................................................................................. 46 2.2.3 Regional Waste and Pollution Partnerships ..................................................................................................... 47 v 2.3 ATMOSPHERIC POLLUTION AND GREENHOUSE GASES .................................................................................... 48 2.3.1 Atmospheric Pollution ...................................................................................................................................... 48 2.3.2 Ozone ............................................................................................................................................................... 49 2.3.3 Greenhouse Gases (GHGs) ............................................................................................................................... 51 2.3.4 Response: Reducing Atmospheric Pollution and GHG ..................................................................................... 57 2.4 EXTREME EVENTS, CLIMATE VARIABILITY AND CLIMATE CHANGE ................................................................... 58 2.4.1 Extreme Events ................................................................................................................................................. 58 2.4.2 Temperature and Precipitation ........................................................................................................................ 59 2.4.3 Sea‐level Rise .................................................................................................................................................... 62 2.4.4 Risk, Uncertainty and Impacts of Climate Change ........................................................................................... 65 2.4.5 Response: Adaptation to Climate Change Impacts .......................................................................................... 73 2.4.6 Response: Mitigation of Climate Change by Carbon Sequestration and GHG Reduction ................................ 86 3 STATE AND TRENDS OF THE ENVIRONMENT ............................................................. 91 3.1 LAND ................................................................................................................................................................. 91 3.2 FRESH WATER ................................................................................................................................................... 92 3.2.1 Response: Reducing Pressures on Freshwater Resources and Improving Sanitation .................................... 100 3.3 ECOSYSTEMS .................................................................................................................................................. 103 3.3.1 The Ocean....................................................................................................................................................... 106 3.3.2 The Coastline, Reefs and Mangroves ............................................................................................................. 107 3.3.3 Fisheries.......................................................................................................................................................... 111 3.3.4 Response: Protecting Coastal and Marine Ecosystems .................................................................................. 117 3.3.5 Forests ............................................................................................................................................................ 118 3.4 BIOLOGICAL DIVERSITY ................................................................................................................................... 121 3.4.1 Indicators of the State of the Pacific’s Biodiversity ........................................................................................ 123 3.4.2 State of Knowledge of the Threat Status of Pacific Species ........................................................................... 123 3.4.3 Pressures on Pacific Biodiversity .................................................................................................................... 129 3.4.4 Response: Conservation and Sustainable Use of Pacific Biodiversity ............................................................ 132 4 POLICY RESPONSE AND PRIORITIES ......................................................................... 138 4.1 INTERNATIONAL ENVIRONMENTAL POLICY INSTRUMENTS AND INITIATIVES ................................................ 138 4.2 REGIONAL AND NATIONAL POLICY RESPONSES ................................................................................................. 142 4.2.1 Regional Environmental Agreements ............................................................................................................. 142 4.2.2 Regional Development Policies ...................................................................................................................... 145 4.2.3 Regional Ocean Policy .................................................................................................................................... 147 4.2.4 Water and Sanitation Policy and Governance ................................................................................................ 151 4.2.5 Land Policy Reform ......................................................................................................................................... 153 4.2.6 Regional Energy Policy ................................................................................................................................... 154 4.2.7 Regional Agency Support ............................................................................................................................... 158 vi 4.2.8 National Environmental Policies and Legislation ........................................................................................... 162 4.3 GOVERNANCE ................................................................................................................................................. 163 4.3.1 Environmental Governance ............................................................................................................................ 164 4.3.2 Climate Governance ....................................................................................................................................... 166 4.4 ENVIRONMENTAL KNOWLEDGE, AWARENESS AND DISSEMINATION ............................................................ 168 4.5 ENVIRONMENTAL CAPACITY .......................................................................................................................... 171 CONCLUSION .......................................................................................................................... 174 REFERENCES ......................................................................................................................... 176 APPENDIX 1 ............................................................................................................................. 191 APPENDIX 2 ............................................................................................................................. 205 APPENDIX 3 ............................................................................................................................. 210 vii LIST OF TABLES Table 1.1: Distribution of land by tenure system in some islands of Melanesia and Polynesia ........................... 18 Table 1.2: Main Economic Activities of some PICTs (The available data at the time). ......................................... 20 Table 1.3: ESCAP economic crisis vulnerability index for 6 Pacific Island Countries. ........................................... 22 Table 1.4: Remittances inflows as a percentage of GDP in selected Pacific Island economies, 2000 to 2008. .... 23 Table 1.5: Total tourist arrivals in selected Pacific Island economies, in thousands of people, 2004 to 2009. .... 24 Table 1.6: Land and ocean coverage for PICTs. .................................................................................................... 26 Table 1.7: Household income and food expenditure in some PICTs. ................................................................... 30 Table 2.1: Numbers of alien species recorded in the 21 PICTs (without Pitcairn Islands), classified into three categories: introduced (no impacts or spread recorded), invasive and potentially invasive. .............................. 38 Table 2.2: Legislation in place relating to invasive species concerns from 1961 to 2010, by decade, for 21 PICTs (Pitcairn Islands is excluded because of no data). ................................................................................................ 41 Table 2.3: Numbers of management interventions in 21 PICTs analyzed and recorded by major regional agencies in the activities matrix developed by the Pacific Invasives Partnership. ............................................... 43 Table 2.4: Emissions of CO, NOx, NMVOC and SO2 in PICTs in 2000 (in Gg). ....................................................... 48 Table 2.5: Surface ozone levels in Fiji, Samoa, Tahiti and Galapagos. .................................................................. 49 Table 2.6: Tropospheric Ozone in Fiji, Samoa Tahiti and Galapagos. ................................................................... 50 Table 2.7: Consumption of ODS in some PICTs ..................................................................................................... 51 Table 2.8: Summary of Samoa’s GHG emission for 1994, 2000 and 2007............................................................ 52 Table 2.9: CO2 emission per capita for PICTs (Units: Metric tons of CO2 per person). ........................................ 52 Table 2.10: CO2 emissions from liquid fuels in PICTs. Unit: Thousand metric tons of CO2. .................................. 53 Table 2.11: Greenhouse gas emissions for some PICTs. **Carbon dioxide emissions ......................................... 54 Table 2.12: Scenarios of Temperature Change (°C) for Selected Regions in South Pacific. .................................. 61 Table 2.13: Projected range of increases in annual mean surface air temperature (°C) and annual mean changes in Rainfall (%) by region at three future time scales relative to the 1961‐1990 period depending upon the A1FI, A2, B1 and B2 emissions scenarios........................................................................................................ 62 Table 2.14: Effects of climatic changes projections as reported in the IPCC AR4, on water availability, accessibility and use. ............................................................................................................................................ 67 Table 2.15: Projected energy demand for some PICTs, GHG reduction potential through RE and EE. ................ 88 viii Table 3.1: Land‐use in some of the Pacific Island Countries and Territories with available data......................... 92 Table 3.2: Water resources of Pacific Island Countries and Territories. ............................................................... 93 Table 3.3: Terrestrial, freshwater and marine ecosystems of the Pacific Islands (*mangroves are listed as both terrestrial and marine ecosystems). ................................................................................................................... 103 Table 3.4: Coastline of PICTs. .............................................................................................................................. 108 Table 3.5: Marine fisheries production (tonnes) for PICTs in the year 2007. ..................................................... 114 Table 3.6: Forest Cover 2000 and Changes in Forest Cover 1990‐2000 for PICs. Note: n.s. = not significant, n.a.= not available. ...................................................................................................................................................... 119 Table 3.7: Fiji’s forest types and the change in forest cover. ............................................................................. 120 Table 3.8: Reported trends in FRA categories in Fiji. .......................................................................................... 121 Table 3.9: Some examples of species conservation projects in the Pacific. ....................................................... 133 Table 3.10: Protected Areas in 20 PICTs (Nauru and Pitcairn Islands are not included due to insufficient data). Note:LMMA – Locally Managed Marine Areas. .................................................................................................. 135 Table 3.11: Areas listed under international conventions. ................................................................................. 136 Table 4.1: Membership of biodiversity‐related MEAs. ....................................................................................... 140 Table 4.2: Membership of pollution‐related Multilateral Environmental Agreements (MEAs) as at 2008. ...... 141 Table 4.3: Membership of selected Regional Agreements by PICTs as at 2008. ................................................ 143 Table 4.4: State of water resources management of Pacific countries (updated from SOPAC 2007d). ............. 153 ix LIST OF FIGURES Figure 1.1: Total recorded and projected populations of PICTs ........................................................................... 14 Figure 1.2: Economic Growth Rates of some PICTs, 2007, 2008, 2009 and 2010. p: Projections. ....................... 21 Figure 1.3: Growth rate in tourist arrivals in SIDS during 1990‐2009. .................................................................. 24 Figure 1.4: Catch by species of the four most important tunas in the Western and Central Pacific Ocean from 1960 – 2009. (Source: Williams and Terawasi 2010) ............................................................................................ 27 Figure 1.5: Percentage GDP input of Agricultural sector for selected PICTs. ....................................................... 28 Figure 1.6: Percentage of the population having access to electricity access in the PICTs. ................................. 33 Figure 2.1: Frequency distribution of alien species across the 21 PICTs, classified into three categories: introduced (no impacts or spread recorded), invasive and potentially invasive. ................................................. 39 Figure 2.2: National legislation in place relating to invasive species concerns from 1901 to 2010, by decade, for the 21 PICTs analysed. .......................................................................................................................................... 40 Figure 2.3: Regional average waste generation statistics..................................................................................... 45 Figure 2.4: CO2 concentration trends in some Pacific sites. (Source: Keeling and Whorf 2004) .......................... 55 Figure 2.5: Methane mixing ratio at USP (Fiji) and Baring Head (New Zealand). ................................................. 56 Figure 2.6: Maxima and minima values of methane concentrations (ppmv) obtained for the sources monitored for the period Jul 2001 to Jun 2002. ..................................................................................................................... 57 Figure 2.7: Projections of global mean sea level rise during the 21st century. The red bar corresponds to additional rise due to instabilities of ice sheets. .................................................................................................. 64 Figure 3.1: Sanitation Access in PICTs. .................................................................................................................. 99 Figure 3.2: Drinking Water Accessibility and Diarrheal DALYs in PICTs. ............................................................... 99 Figure 3.3: Fishery Production Trend for PICTs. ................................................................................................. 115 Figure 3.4: Assessed mammals (left), birds (centre) and amphibians (right) by Red List category. ................... 127 Figure 4.1: Progress on the ratification of major multilateral environmental agreements (MEAs). .................. 139 x LIST OF MAPS Map 1.1: Pacific Island Countries and Territories ................................................................................................. 12 Map 2.1: Geographical pattern of 1993 –2008 sea level trends. ......................................................................... 63 Map 3.1: Catch in tons by tuna species in the PICTs. ......................................................................................... 116 Map 3.2: The ratio of Red‐listed species in the Pacific, by country and taxonomic group. ............................... 124 Map 3.3: Map showing the ratio of species assessed as threatened in each taxonomic group by country. ..... 128 ABBREVIATIONS and ACRONYMS ADB - Asian Development Bank ADF - French Development Agency AOSIS - Alliance of Small Island States APLMMA - Asia- Pacific Locally Managed Marine Areas BOM - Bureau of Meteorology (Australia) BPoA - Barbados Plan of Action (1994) CBD - Convention on Biological Diversity CDM - Clean Development Mechanism CFCs - Chlorofluorocarbons CITES - United Nations Conference on International Trade in Endangered Species of Wild Flora and Fauna CSIRO - Commonwealth Scientific and Industrial Research Organisation (Australia) CROP - Council of Regional Organizations of the Pacific DPSIR - Drivers – Pressures – State – Impacts – Response model of SOE reporting DU - Dobson Units EEZ - Exclusive Economic Zone EIA - Environmental Impact Assessment ENSO - El Niño Southern Oscillation EpiNET - Regional Exposure Prevention Information Network ESCAP - Economic and Social Commission for Asia and the Pacific EU - European Union FACT - Eu – SPC Facilitating Agricultural Commodity Trade project FAO - Food and Agriculture Organisation FFA - Forum Fisheries Agency FLMMA - Fiji Locally Managed Marine Area FRA - Forest Resources Assessment xi FSM - Federated States of Micronesia GDP - Gross Domestic Product GEF - Global Environment Facility GEF- PAS - Global Environment Facility Pacific Alliance for Sustainability GEO 4 - Global Environment Outlook (Report No 4) GEO 5 - Global Environment Outlook (Report No 5) GHGs - Green House Gases HOAFS - Head of Agricultural and Forestry Services IBAs - Birdlife International’s Important Birdlife Areas ICT - Information and Communication Technology IEA - Integrated Environmental Assessment IPCC - Intergovernmental Panel on Climate Change ISSG - Invasive Species Specialist Group IUCN - International Union for the Conservation of Nature IUCN SSC - International Union for the Conservation of Nature Species Survival Commission IWP - International Waters Project IWRM - Integrated Water Resources Management J-PRISM - Japan’s Project for Promotion of Regional Initiative on Solid Waste Management JCS - Joint Country Strategies Process (of the SPC) JICA - Japan International Cooperation Agency J-PRISM - Japan-Pacific Regional Islands Solid Waste Management LMMA - Locally Managed Marine Areas MARPOL - International Convention for the Prevention of Pollution from Ships MDG - Millennium Development Goal MEAs - Multilateral Environmental Agreements MCT - Micronesia Conservation Trust MIC - Micronesians in Island Conservation MOUs - Memorandums of Understanding MSWG - Marine Sector Working Group MTI - Marine Trophic Index NBSAPs - National Biodiversity Strategies and Action Plans NEMS - National Environmental Management Strategy NGOs - Non- Government Organisations NFI - National Forest Inventory xii NOAA-NASA - National Oceania and Atmospheric Administration- National Aeronautics and Space Administration ODA - Official Development Assistance ODS - Ozone Depleting Substance OPRC - Oil Pollution Preparedness Response and Co-operation OPVI - Oil Price Vulnerability Index PABITRA - Pacific-Asia Biodiversity Transect Network PACC - Pacific Adaptation to Climate Change PACLII - Pacific Islands Legal Information Institute PBIF - Pacific Biodiversity Information Forum PCCSP - Pacific Climate Change Science Programme PEIN - Pacific Environment Information Network PICCAP - Pacific Islands Climate Change Assistance Program PICTs - Pacific Island Countries and Territories PIFACC - Pacific Islands Framework for Action on Climate Change PIFL - Pacific Islands Forum Leaders PIFS - Pacific Islands Forum Secretariat PIGGAREP - Pacific Islands Green Gas Abatement Renewable Energy Project PIP - Pacific Invasive Partnership PIREP - Pacific Islands Renewable Energy Programme PIROP - Pacific Islands Regional Ocean Policy PIRT - Threatened Species Working Group of the Pacific Islands Round Table for Nature Conservation PNG - Papua New Guinea POP - Persistent Organic Pollutants PPAC - Pacific Partnership for Adaptation to Climate Change PPHSN - Pacific Public Health Surveillance Network PPBV (ppbv) - Parts Per Billion By Volume PPTV (pptv) - Parts Per Trillion By Volume RDAs - Regional Development Agencies RE - Renewable Energy REDD - Reduced Emissions From Deforestation and Degradation SCCF - Special Climate Change Fund SHADOZ - Southern Hemisphere Additional Ozone-Sondes SIDS - Small Islands Developing States SOE - State of the Environment xiii SOPAC - Pacific Islands Applied Geo-science Commission SPC - Secretariat of the Pacific Community SPFF - South Pacific Forum Fisheries Convention SPREP - Secretariat of the Pacific Regional Environmental Programme SPRIG - South Pacific Regional Initiative on Forest Genetic Resources SWMPOR - Solid Waste Management Project in Oceania Region UNCBD - United Nations Convention on Biological Diversity UNCCD - United Nations Convention to Combat Desertification UNCLOS - United Nations Convention on the Law of Sea UNDESA - United Nations Department of Economic and Social Affairs UNDP - United Nations Development Programme UNEP - United Nations Environment Programme UNESCAP - United Nations Economic and Social commission for Asia and the Pacific UNESCO - United Nations Educational, Scientific and Cultural Organization UNFCCC - United Nations Framework Convention on Climate Change UNU-IAS - United Nations University- Institute of Applied Sciences UNWTO - United Nations World Tourism Organisation USP - University of the South Pacific WCPFC - Western and Central Pacific Fisheries Commission WDPA - World Database on Protected Areas WHC - World Heritage Centre WHO - World Health Organisation WWF - World Wide Fund for Nature xiv EXECUTIVE SUMMARY Using the Drivers-Pressures-State-Impacts-Responses framework for State of the Environment reporting, this Pacific Environment and Climate Change Outlook report aims to summarise the current state of the natural environment within the Pacific Region, analyse and where possible quantify the pressures placed on the environment, and investigate current responses to environmental challenges. The report covers the Pacific Island Countries and Territories (PICTs) of: American Samoa, Cook Islands, Federated States of Micronesia, Fiji, French Polynesia, Guam, Kiribati, Marshall islands, Nauru, New Caledonia, Niue, Northern Mariana Islands, Palau, Papua New Guinea, Pitcairn Islands, Samoa, Solomon Islands, Tokelau, Tonga, Tuvalu, Vanuatu and Wallis and Futuna. The term environment to the peoples of the PICTs has much broader connotations than just ‘nature’. The natural environment is an integral part of their culture, tradition, history and way of life. Monitoring the state of, and changes in, the natural environment presents significant challenges within PICTs ranging from data collection issues (data collection and data consistency), data management and dissemination, data analysis and interpretation, and the use of data to inform and direct policy responses. Future PECCO reports will build on the works to date (by this report and others) to establish a consistent monitoring evaluation and reporting framework to guide environmental management decisions into the future. 1. Drivers of Environmental Change As a collective, PICTs are small land masses surrounded and linked by large ocean masses. The natural variability in the Countries and Regions within the Pacific creates a natural environment that spans ecosystem types between montane rainforests and cloud forests, closed rainforests and open woodlands to open grass savannahs, mangrove and littoral forests, salt marshes and mudflats, freshwater lakes and streams, coastal marine ecosystems as well as fringing and barrier reefs to deep ocean areas. While there is some overlap in the nature of pressures and drivers of some environmental changes (such as human induced climate changed and population growth) other drivers can have more specific and narrow effects (such as targeted fisheries operations). The main drivers of negative change in environmental conditions have been identified in the report and summarised below. 1 Increasing Population: Population of the Pacific Region grew from 6 Million people in 1990 to approximately 10 Million people in 2011, equating to an average annual growth rate of 3.3%. Many urban areas are growing at twice the national growth rates, both increasing the scale and concentrating the effects of population growth within urban areas. Increasing urbanisation also leads to a reduction in historical and cultural connections to the environment and subsistence, traditional (low impact) practices. Economic Vulnerability: Subsistence lifestyles common in the Pacific region are highly vulnerable to the impact of seasonal and climate variability. Agricultural activities have continued to move towards export focus crops (and income generation) rather than local subsistence, however commercial export production is more highly exposed to global economic fluctuations. Similarly, the Global Financial Crisis also impacted on income generated from Tourism and remittances sent to the Pacific from expatriate family members. Exploitation of Natural Resources: The most commonly exploited natural resources within the Pacific include deep sea fisheries, coastal fisheries, timber and natural gas. Increased interest in mining activities both onshore and offshore in many PICTs has the potential to cause additional land use conflicts as does the continued move away from subsistence lifestyles and farming towards commercial crops, including palm oil production and the development of new infrastructure such as roads and wharves. Energy Consumption: PICTs rely heavily on imported liquid fossil fuels for energy to supply electricity and transport needs, leading to relatively high outputs of Green House Gases from PICTs. Climate Variability and Change: PICTs are particularly susceptible to the variety of anticipated impacts from human induced climate change due to the low elevation of much of their small land masses, the large coastal areas of most islands where the population is concentrated and the isolation and lower capacity for response and recovery after severe events and natural disasters. Impacts from Climate Change will be highly variable across the region, with climate change also acting as a threat amplifier and exacerbating the impacts of other environmental changes (such as invasive species and water shortages). The available data on regional climate change projections highlights the substantial uncertainty in the magnitude, distribution and timeliness of likely impacts it the region. 2 2. Responses to Environmental Challenges To date many of the responses to the environmental challenges have been bureaucratic and focussed on adopting a range of International, Regional, National and Local legislation and policies. More attention will need to be paid to the effective delivery of these commitments and to monitoring their effectiveness at delivering the desired level and type of environmental change and progress. Several key environmental issues were analysed in depth to understand the nature of the responses made by PICT governments and are summarised below. Invasive Species: All twenty-one PICTs have adopted national policies and strategies to address the impacts of invasive flora and fauna species. This is considered an admirable achievement given the significant lack of data on the quantum and type of threat posed by invasive species to the region. Many PICTs implement targeted action to address invasive species as broader programs to manage biodiversity. Waste: The small land masses of PICTs combined with high population growth and increasing competition for land resources has lead to significant conflicts in current waste management practices. Some waste types now produced in the region (heavy metals and plastics) are completely beyond the treatment and disposal capabilities of many countries and management capacity is reliant on knowledge and skills transfer from Developed Nations. The high proportion of the general waste stream made up of organic material (such as vegetative material) is increasingly been seen as a wasted resource that could be recycled and re-used. This would not only reduce the volumes of waste generated and requiring disposal but also provide a source of natural organic inputs available for agriculture which can reduce the reliance on expensive artificial (chemical) inputs. Pollution: Many PICTs have access to data on the concentrations of various air pollutants such as Carbon Monoxide, Nitrogen Oxides and Sulphur Dioxide. Emissions of Green House Gases and Ozone Depleting Substances are also monitored by each nation and are increasing over time. While emissions of each are currently low compared to global totals and national averages, this has not precluded most PICT national governments from taking action to manage and reduce these emissions. Data on chemical pollution of the land and water resources of most PICTs is severely lacking and needs to be addressed in the immediate future. 3 Climate Change and Variability: The greater exposure and lower resilience recovery ability of PICTS makes Climate Change adaptation a vitally important task for PICTs which is currently being addressed through a range of legislative and policy responses. Adequate and effective adaptation programmes have been hampered by the lack of available, reliable and appropriate-scale data on which individual countries can base decisions about the most effective responses to climate change. Identifying the priorities for action is a key challenge in the face of inadequate data. 3. State and Trends in the Environment The lack of a consistent monitoring framework within and across the PICTs limits the ability to gain an accurate and up to date ‘snapshot’ of the current state of the natural environment as well the ability to monitor both positive and negative change over longer periods of time. The limited data available has highlighted several main trends in environmental conditions across the region which are summarised below. Land: Land mass accounts for only 2% of the entire Pacific region of 30, 000,000km2. This leads to intense pressures on the limited land mass to accommodate the needs of Pacific Islanders for housing, food, waste disposal, freshwater and other resources and also creates the high burden on coastal marine resources to also supply a significant proportion of food resources. The pacific region appears to have seen a net overall gain in the extent of fore4st cover between 2000 -2009, however high rates of fragmentation have continued. The rate of loss of mangrove forests has been particularly severe. Based on the IUCN Red List of threatened species, 21% of assessed mammal species, 13% of assessed birds, 5% of assessed amphibians, 60% of assessed reptiles and 25% of assess invertebrates are currently considered threatened. Freshwater: Availability of freshwater resources is highly variable across PICTs reflecting the reliance on different sources of freshwater from rainfall capture, to aquifer and groundwater extraction and limited use of desalination and stored water supplies like dams and reservoirs. Leakage in water supply systems has been estimated to account for up to 50% of water supply, a substantial source of waste and inefficiency. Water conservation practices and water efficient appliances and fittings have not been taken up in large numbers by the population due to the perceived (but often inaccurate) abundance of freshwater resources. Reefs: The extensive areas of barrier and fringing reefs surrounding many PICTs provides an important coastal food resources and income source (from both tourism 4 and sale of fish resources) as well as providing buffering protection from storm surges and erosion. Living coral cover had declined by 20% between 1980 to 1989, however the rate of decline appears to have slowed between 1994 and 2000 but reflect a change in weather patterns (such as the frequency and severity of El Nino events) rather than a recovery of these ecosystems. Concern is growing about the impacts of ocean acidification and impacts on corals and all shellfish, likely to be exacerbated by human induced climate change. Hard corals were added to the IUCN Red List for the first time in 2008 and 22% of the described fish species are considered threatened. Fisheries: The total value of all fisheries (including aquaculture) production across the region is valued at US$4 – 5 Billion. Annual catches of the four main tuna species have increased steadily since the 1950s, with offshore foreign based fishing accounting for 50%of the total catch. This industry brings valuable income to national governments bust the need for better regulation of activities is becoming apparent as the main commercially exploited species are reaching the limits of sustainable harvest. In order to ensure local communities have continued and improved levels of food security from fisheries resources, the use of Locally Managed Marine Areas (with customary access and management principles such as ‘taboo’ areas and species) is growing in popularity and now involves more than 500 communities in 15 different PICTs. This ‘managed area’ approach is also being extended to land based areas. 4. Policy Response and Priorities Although the willingness and commitment of Pacific Islanders and their governments to environmental management and sustainable utilisation of natural resources is evident, current efforts to meet global targets and commitments are insufficient to meet the level and extent of environmental challenges faced by the region. This is due to a lack of resources (money, time and skills), lack of accurate and reliable data, lack of institutional capacity and in some cases a lack of institutional support. Endorsement of International, Regional, National and Local agreements is commendable and has increased dramatically in recent times. However the challenge for PICTs remains in implementing the commitments made and effectively delivering these obligations. The continuing decline in environmental conditions is evidence that more needs to be done. 5 Not only do these commitments need to be implemented and delivered through an appropriate system of National and local strategies and frameworks, their effectiveness in dealing with the environmental pressures and challenges and delivering an improved environmental outcome needs to be monitored and evaluated to ensure that actions and responses have been targeted appropriately. Successful implementation of initiatives will require extensive engagement with, and involvement of, the local communities. As the main beneficiaries of an improvement in environmental conditions, the level of interest and involvement of local communities in environmental management can be intricately tied to these better outcomes. The growing awareness of the potential impacts of human induced climate change as an amplifier of existing environmental threats will aid in the raising of environmental awareness and increasing the participation of governments and communities in determining the shape of their environmental futures. Programs implemented need to be informed by sound science and data, which at present is severely lacking in many PICTs and will be a major hurdle to be overcome. Increasing the environmental capacity of governments through improved sharing and transfer of knowledge and skills will better enable the development and delivery of locally tailored environmental management programmes, securing the sustainable future of the people of the Pacific. 6 INTRODUCTION 1. This report covers the following Pacific Island Countries and Territories (PICTs): American Samoa, Cook Islands, Federated States of Micronesia (FSM), Fiji, French Polynesia, Guam, Kiribati, Marshall Islands, Nauru, New Caledonia, Niue, Northern Mariana Islands, Palau, Papua New Guinea (PNG), Pitcairn Islands, Samoa, Solomon Islands, Tokelau, Tonga, Tuvalu, Vanuatu, Wallis & Futuna. Methodology 2. The Integrated Environmental Assessment (IEA) process is applied in this State of the Environment (SOE) Review to assist with creating an understanding of the causes and effects of changes in the region’s environment during the assessment period (1992-2012). The IEA process is a stakeholder participation and consultative process whereby those involved and / or affected by the development and maintenance of the environment take part in a stepwise procedure of planning and reviewing the current state of their environment. It is an iterative learning process aimed at improving the application of science to environmental policy and delivering action in a more credible, legitimate, integrated and relevant manner. 3. The IEA process attempts to answer the following five fundamental questions that explore in a logical and sequential manner the causes and effects of changes of the state of the natural and built environments, and their implications on human wellbeing and the environment: 1. What is happening to the environment and why? 2. What are the consequences for the environment and human well-being? 3. What is being done and how effective is it? 4. Where are we heading? 5. What actions could be taken for a more sustainable future? 4. The IEA process uses the drivers-pressures-state-impacts-responses (DPSIR) analytical framework (UNEP IEA Resource Book, 2007) to analyse information and data to provide answers to the above mentioned fundamental questions, clarifying the nature and extent of interactions between environmental change and human development and demonstrating possible future scenarios of policy options with the most potential to achieve environmentally sound and sustainable development goals. 7 The main components of this analytical framework and how they are being organized in the review are explained below: 5. Drivers: Drivers refer to the underlying driving forces in society which influence human activities that produce pressures. Key drivers include: demographics; consumption and production patterns; scientific and technological innovation; economic demand, markets and trade; distribution patterns; institutional and socialpolitical frameworks and value systems. In the Pacific, growing populations and increasing economic development are among the key drivers of pressures and impacts on their environments and societies. 6. Pressures: Pressures are the direct stresses of human activities and natural phenomena on the environment, which result in trends. Natural pressures include varying solar radiation, extreme natural events and erosion. Key human-induced pressures include climate change, land degradation, extraction and alteration of natural resources, biodiversity loss, and air and water pollution. Natural and humaninduced changes may interact: for example, climate change will lead to ecosystem change, which may result in biodiversity loss and land degradation. 7. State and Trends: Environmental State is the current condition of the environment as measured by representative indicators. Trends refers to patterns of environmental change, which may be natural, human-induced or both and are measured by monitoring changes through the use of indicators. 8. Impacts on Society and the Environment: Impacts on societal and environmental conditions are generally the effects caused by environmental changes on human well-being, social and economic factors and ecological services and functioning. Impacts are measured against policy objectives, targets and standards. Changes in the condition of an environmental feature may have positive or negative impacts on human well-being, ecological services and environmental stresses. 9. Responses: Responses refer to actions or interventions that are taken to mitigate or adapt to predicted and known impacts. Forcing factors under human control trigger management responses when target values are not met or acceptable thresholds are exceeded. Natural drivers may require adaptation, or a response to minimize risk. For example, changes in climate conditions may cause a system to cross a threshold 8 requiring ad daptation ra ather than m mitigation. The T diagram m in Figure i below demonstrattes the linka ages betwe en the diffe erent compo onents of thee DPSIR framework.. e Drivers-Prressures-Sta ate-Impact--Response Figure ii: Schematicc representtation of the (DPSIR R) model. (Source: S Adap pted from the e UNEP GEO O-4 2007 Rep port) The En nvironmenttal Monitoring and Infformation Challenges C s of SOE Reeviews in the t Pacific 10. Environmental monitoring and infformation management m t are key chhallenges fo or all PICTs whicch have bee en repeated dly raised in n past and re ecent enviroonmental assessmen nts and repo orts. In the llast twenty years several regional efforts werre made to develop environmen ntal indicato ors and data asets and th heir associaated assess sment and reporting processe es. These in nclude the SPREP-UN NEP environnmental statistics project and d the UNEP--SOPAC en nvironment vulnerability y index proggram. Thes se efforts have e not endured as they lacked the level of reso ources and commitment to sustain them. In gene eral there is still no esta ablished sys stem in placce in any off the 99 PICTs for regular monitoring, collection and management of information and data on the state of the environment. 11. As mentioned in the Foreword an important objective of this review is the development of a standard set of core indicators for the regular state of the environment assessment in the future. A draft matrix of indicators for collecting and analysing data and information was provided and reviewed during the planning meeting to guide the work of the contributing and leading authors of the report. This is provided in Appendix 1. This matrix is drawn from a generic indicator matrix used in the reviews of the state of the global environment or Global Environment Outlook reports, with amendments as developed during the process of producing this report. 12. The selection of actual indicators to use for the collection of relevant and available data and information for assessing the state and trends of each key environmental component was determined by the section authors, who developed appropriate indicators for their respective subjects. The reporting team agreed that no new data would be generated and that the report would be based on information readily available in relevant and reliable reports and data sources. Most of the data were therefore gathered from relevant program reports and data and information holdings of the members of the reporting team – IUCN, USP, SOPAC, SPC and SPREP –or were obtained from their collaborating international and national partners in the region. 13. The major challenges faced during the compilation of this report were: difficulties in accessing and verifying national/regional data from various sources; time limitations: authors of sections, compiling team and authors had limited time available to compile, comment and attend review meetings; difficulties in identification of universal indicators – since the type of data collected nationally and regionally varied in quantity and quality, and in many cases information was available for only a few countries, unification of data and methodology of collection are significant issues; disagreement on format and unification of writing styles – different contributors interpreted the requirements differently and therefore compiling contributions into a unified report was a challenge. 10 The PECCO Structure 14. Following the DPSIR analytical framework and the fundamental questions on the state of the environment, this report is arranged in four main parts: Part 1 provides an overview of the key drivers of environmental change in the region, in particular the population and economic drivers; Part 2 focuses on key environmental challenges of the region with brief discussions of coping responses; Part 3 discusses in details the state and trends of environmental changes on key components of the region's environment in particular land, freshwater, ecosystems and biological diversity; Part 4 reviews the trends in the development and effectiveness of the region's policy responses to its environmental needs and requirements and looking at future scenarios of the most potential policy options that should be prioritized for the achievement of sustainable goals in the region, in the context of adapting to and mitigating the impacts of climate change. 11 1 DR RIVERS OF ENVIRONM MENTAL C CHANGE IN N THE PACIFIC 1.1 PACIFIC IS SLAND SOCIETIES A AND GOVER RNANCE 15. Pacific Island Countrie es and Terriitories (PICT Ts) are sma all nations liinked by a large l ocean and common cu ultural elem ments referre ed to generally as the P Pacific Way y (Crocombe e 1976, 2001; Ratu Marra 1997). PICTs are ch haracterizedd by their sm mall sizes, limite ed resource e bases and d fragile eco osystems, and remotenness not only within a country but b also from m neighbourring countries and regions of tradee and socia al interest (Ma ap 1.1). The ese physica al limitations s are exacerbated by hhigh populattion growth and d density in urban areass and vulne erability to natural n disassters such as a cyclones an nd tsunamis s. In additio on, most PIC CTs have lim mited scopee for economic developme ent (Stuart, 2006). 2 Map 1.1 1: Pacific Issland Countries and Te erritories (Source: S SPC, 2011) 122 16. While PICTs share several characteristics, they are not homogeneous. Their distinctions are vital for consideration when environment-related policies are formulated. The Melanesian countries (Papua New Guinea (PNG), Fiji, Solomon Islands, New Caledonia and Vanuatu) have larger land masses with larger populations, more natural resources and greater ethnic-cultural diversity. The Polynesian countries and territories (Samoa, Cook Islands, Niue, Tonga, Tuvalu, Easter Island, French Polynesia, Wallis & Futuna, Pitcairn, American Samoa, and Tokelau) have much smaller land masses with relatively homogenous cultures. The Micronesian countries (Republic of Marshall Islands, Federated States of Micronesia (FSM), Republic of Kiribati, Republic of Palau, Territory of Guam, Nauru, The Commonwealth of the Northern Mariana Islands) are generally very small, low-lying and geographically scattered, with few resources (Fairbairn 2004). 17. Although, many of these characteristics are similar to those of other Small Islands Developing States (SIDS), the nature of many of them presents a special case for PICTs. The geographical isolation and scattered nature of many PICTs contribute directly to transport and communication costs. PICTs face significant development and governance challenges because of declining levels of economic balance despite increasing inflow of development aid, limited resource capacity (institutional, human resources, technical) and poor infrastructure (Stuart, 2006). 18. The environment for PICTs encompasses their way of life and cultural heritage, which is increasingly being influenced and modified by globalization (Crocombe, 2002; Firth, 2001; Lockwood, 2004). Since the early 1990s progress has been made in setting a Pacific environmental agenda and gaining recognition of the special case of the PICTs internationally. Today, environmental issues take centre stage in PICT public policies and planning documents and are a core component of international diplomacy. Most PICTs (excepting a few – Nauru, Niue and Tuvalu) have formal policies and regulations for the administration of EIA studies and their implementation. But a lack of capacity in enforcement agencies, and of public knowledge and positive action also contribute to ineffectual responses to a range of environmental problems including deforestation, soil erosion, mining, sedimentation, solid waste disposal, and cutting of mangroves. Stronger participation of the public and key sectors could substantially strengthen EIA processes (Tipu, 2010). 13 19. For this to happen, h forrmal govern nment structtures, includ ding Local G Governmen nts (Larmour & Qalo, 1985 5) must be reviewed and re-engin neered for im mproved implementa ation of resp ponse meassures to pro otect and co onserve thee environme ent. Without effe ective policy and local regimes, environmental legislatioon will be ineffective. 1.1.1 20. Demograp phics The key characteristics of human n population ns (size, growth, densityy, distributio on) and s in PICTs provvide the bas sis on which h social facttors can be related other vital statistics to the envirronment and d sustainab ble developm ment. The past p and preedicted grow wth of the Pacific Population is illustrate d in Figure 1.1 1.1: Total re ecorded and d projected populations of PICTs Figure 1 (Source: S SPC data base, 2011 - [www.sp pc.org]) 21. As shown in Figure 1.1 1, the popu lation of PIC CTs has been increasi ng steadily over the past 40 0 years. Pop pulation den nsity varies depending on country and specific area. Approximattely 2.3 million people live in Paciffic cities and towns. Annnual urban n population growth rate es of over 3--4% in som me Micronesian and Meelanesian co ountries would double e in 15-25 years y (PUA,, 2010). Ma any means thatt current populations w urban popu ulations are growing at twice the ra ate of national populatiions. Urban n growth is expected d to persist because off high rural-tto-urban migration andd high levels s of fertility. As urban popu ulations grow w and rural-urban migrration continnues poverty 144 continues to urbanize (UN Habitat 2010). PNG has an urban population of 13% while Kiribati and Tuvalu have more than 50% of their population living in urban centres. At the extreme, Ebeye in Marshall Islands had a population density of 38,600/km2 in 2007 (Haberkorn 2008). The population trend is also different between rural and urban areas (World Bank 2010). For example, in 2008, Palau (-5%) and Fiji (-0.5%) had negative rural population growth while Tonga had a positive trend (0.2%). These three countries have more than 1% annual population growth in the urban areas (World Bank, 2010). 22. The rise in total population during the years covered by this report (1992-2012) has meant increased consumption of resources and demands on the environment in the Pacific. Policy implementation has focused on participation by islanders and training to foster their ownership and engagement, including traditional management sharpened by appropriate modern techniques, such as the involvement of local communities in Fiji in planning, monitoring and managing the conservation of their marine protected areas (WCS South Pacific Program, 2009). Further, Kiribati and Tuvalu have successful models of trust funds that help with development. 1.1.2 23. Social and Community Structures (Governmental & Traditional) Understanding social and community structures and functions is important when implementing policies and activities in PICTs. Polynesian and Melanesian cultures and inheritance patterns are predominantly patriarchal whereas Micronesian societies are matriarchal. This has gradually changed since colonialism. Patriarchal dominance is now being challenged by University-educated women in their traditional settings. This empowerment of women (addressing Millennium Development Goal 3) is important in dealing with natural resources, environmental and climate change issues in the communities, because the most vulnerable groups to environmental, social and cultural change are women and children. Women have proved to be effective leaders and their inclusion in decision making for development is critical to build the resilience of communities to socio-economic, environmental and climate change (ADB, 2003). 24. Traditionally, PICT clans, tribes and extended families have responsibilities and roles within their communities, such as priests, warriors, builders, tattooists, orators, fishermen, traditional healers and managers of resources. These functions maintained peace, respect and coherence within communities in an organized and 15 effective local governance system. Breakdown of these social-cultural structures has led to chaos, tension and warfare (Wilson, 2006). With modern, centralized systems of government and the influence of Christianity, traditional roles and responsibilities have been ignored, extinguished, diminished or not properly practiced. Furthermore, local community governance has been ignored or modified by central government rules, priorities and developments (Wilson, 2006). The most effective approach to engage more Pacific Islanders in their social/community structures is by blending or hybridizing modern governance systems with traditional governance (Larmour & Qalo, 1985; Qalo, 2005 & 2006; Hassall & Tipu, 2008) as expressed in Hassall & Tipu’s conclusion: “Local government in the South Pacific is a complex blend of modern democratic principles and government systems with traditional institutions and practices, and often extremely small-scale. Its current status reflects both a history of robust traditional governance in all of the island states under investigation, and also the failure of central government to provide or support effective service delivery at the local level. In a way, one could argue that local governments in the South Pacific are still in a transitional stage to more effective and autonomous entities, but this argument should be set against the backdrop of the social and economic realities of the island countries.” 25. The traditional structure of PICT communities is well organized with local sittings of elders that rule the affairs of tribes, villages, provinces and islands. Local authority is usually invested in titled or chiefly men (sometimes women), elders, nobles and landowners. This local authority (group of decision makers) is referred to as the Fono in Tonga and Samoa; Maneaba in Kiribati, Falekaupule in Tuvalu, District Councils of PNG coastal people, Solomon Islands, Vanuatu, and Fiji; Island Councils of Cook Islands, Marshall Islands and the FSM. Some cultures have separate sittings of women and youth to strengthen traditional bonds and fulfil their traditional roles. These traditional groups frequently meet to address conflicts/issues, discuss progress of developments and other important matters in the communities. The local authorities formulate their own by-laws and rules. They are also responsible for enforcement and monitoring those rules and maintaining peace and harmony. 26. Pacific Central governments work through these local structures to different degrees, in order to implement government projects and activities. Communities often provide labour force, in kind support, logistics and other services to their governments. 16 However, despite their important roles, they are often ignored or not well represented during decision-making processes and policy formulation, while capacity-building is sometimes only focused on central government employees (Tipu 2010). Revitalizing and broadening the basis of government and grassroots social and community structures needs to be a priority (Hassall & Tipu 2008). 27. For the smaller and low-lying islands the marine good practices (Veitayaki 2006) should be implemented and lessons learnt dispersed to local practitioners to avoid unnecessary duplication and effort. In terms of administration in local government we could heed Professor David Murray (1981: 255) – “Instead of scaling from the big to small there is a chance to inquire into the inventiveness in the smaller of the microstates and territories and maybe scale up from there.” 1.1.3 28. Access to Resources and Land Tenure System Land is among the most important resources for Pacific people. It is essential for survival and defines identity. In Pacific languages, the land is intimately related to the being, belonging and life. Land is crucial for food security, shelter, community development and economic wealth. It is central to the growing regional challenges of urbanisation, migration, resource-related conflicts and - in some cases - political instability and state fragility. 29. Land tenure is a sensitive issue and is embedded in Pacific Islanders’ culture. The traditional system of access and land tenure in PICTs was mainly based on inheritance (through bloodline or adoption) and the outcome of warfare. However, the arrival of Europeans and colonialism altered land tenure systems and access to resources. Since then, land owners may sell their lands as freehold and governments own lands (Table 1.1). Now all land ownership is governed by legislation that not only can be challenged in court but may be subject to change based on who is in power. Difficulties in access to resources and inconsistent land tenure lead to conflicts that have cost not only money but also lives of Pacific people (Wilson 2006). 30. Land tenure systems in the Pacific play a crucial role in land use both traditionally and now. Improper and unsustainable land use is often practiced in the region because of the lack of knowledge of alternatives. Land users often utilize traditional modes suited to much smaller populations and lower production requirements. With greater populations motivated by short term gain, regeneration or fallowing may not 17 be practised. There is a lack of awareness in local communities on their roles in maintaining the quality of their land for future generations. Table 1.1: Distribution of land by tenure system in some islands of Melanesia and Polynesia Country Public* Freehold** Customary Some Little 95% 4% 8% 88% Niue 1.5% 0% 98.5% Papua New Guinea 2.5% 0.5% 97% Samoa 15% 4% 81% Solomon Islands 8% 5% 87% Tokelau 1% 1% 98% Tonga 100% 0% 0% Tuvalu 5% <0.1% 95% Vanuatu 2% 0% 98% Cook Islands Fiji *Includes Crown land and land owned by provincial and local governments, ** Includes land that is not strictly freehold but similar in characteristics, such as the ‘perpetual estates’ found in the Solomon Islands. (Source: AusAID 2008) 31. In most Pacific societies, resources like the land, forests and sea are owned communally (matrilineal or patrilineal), and certain communities farm and build schools, churches and health centres communally. The land tenure system is evolving in ways that replaces communal ownership with individual land use, sometimes by paying homage to the head of the landowning unit with the first fruits or by offering gifts inclusive of money. The communal ownership of lands is also an important remedy for loss of land due to erosion, landslides and other disasters (Chambers 2010): a person who lost his/her land can be resettled to other lands owned by the clan or extended family. 1.1.4 32. Governance Many Pacific Island legislatures and governments are still grappling to formulate relevant sustainable resource management policies and legislation. This process is constrained by lack of staff capacity (Siddiqui et al., 2010). Lack of corporate computer literacy, research and policy analysis in government institutions generally, and in Pacific parliaments especially, is among the pressing issues facing PICTs. This is apparent in the handling of environmental issues, where environmental 18 protection and conservation continue to be a shared responsibility between local, national, regional and international agencies. 33. In PICTs, there is an apparent lack of public participation in environmental decisionmaking processes, which has been, who attributed this to the lack of planning, technical expertise, financial and human resources(Jefferey 2005). The direct consequence of this is that relevant technical and procedural information does not filter down to the grass roots and community level. There has been considerable interest, amongst policy-makers, researchers, and academics to improve public participation and deliberative democracy through formal and informal training and capacity-building as well as public awareness programs (Newman et al, 2004). However, many PICT groups and communities especially in rural settings do not have the knowledge of or the interest to become acquainted with government policies and projects mainly because of micro-politics tied to their national one (Ferrier, 2003). For example, some communities in PNG and Vanuatu developed their own local traditional governments with laws, currencies, securities and infrastructures due to disconnection and discontent with the central government. A number of global NGOs (e.g. Green Peace, WWF and Habitat) have, however, stepped in during the past few years to engage with the PICT communities to promote environmental awareness, training and capacity building. 1.2 ECONOMY 34. PICTs continue to exhibit highly dissimilar levels of economic development, yet face relatively similar challenges in terms of trade and finance. They are inherently economically vulnerable due to their remoteness and insularity, susceptibility to natural disasters, fragile ecology, limited institutional capacity, limited ability to diversify, strong dependence on a narrow range of exports, and high import content, particularly of strategic goods such as food and fuel, whose prices have exhibited high volatility. In addition, in recent years many PICTs have experienced a rapid rise in their debt burden which, coupled with rising logistics costs and decreasing workers’ remittances, has exacerbated the negative impact that the financial crisis has had on their economies (UN-DESA Report, 2010). 35. The inter-relatedness of economic and ecological characteristics for islands is manifested in several areas and is not restricted to the Pacific. Abundance and distribution of natural resources such as water, vegetation, soil, air, near-shore 19 systems, and wildlife, ultimately dictate the capacity of islands to accept and sustain development. 36. The capacity of Pacific Islands to engage on a range of trade issues has been hampered by the challenges of developing national positions on issues as well as translating regional commitment into supporting national legislation (The World Bank: World Development Indicators, 2009). The public sector remains a dominant feature of the economic landscape although its capacity is often stretched in terms of human and financial resources. Pressures are building on farmers to intensify land use for economic returns to balance increasing costs. There is a high reliance on expensive diesel fuel to generate energy, which is essential for development activities (See Table 1.2). 37. These factors limit a Government’s opportunity to participate fully in international events and agreements that might profoundly affect their economies or to allocate significant resources to environmental management, and result in their dependence on aid to support this. Table 1.2: Main Economic Activities of some PICTs (The available data at the time). Country Industries Cook Islands Fruit‐processing, Tourism, Finance, Copra, Citrus fruits, Clothing, Coffee, Fish, Pearls and pearl shells, Mining, Handicrafts FSM Tourism, Construction, Fish processing, Craft items (shell, wood, pearls), Garments, Bananas, Black pepper Fiji Sugar, Tourism, Copra, Gold, Silver, Clothing, Timber, Fish processing, Cottage industries Kiribati Fishing, Handicrafts, Copra Marshall Islands Copra, Fish, Tourism, Craft items (shell, wood, pearls), Offshore banking (embryonic), Coconut oil, Trochus shells Nauru Phosphate mining, Financial services, Coconut products Palau Tourism, Craft items (shell, wood, pearl), Commercial fishing, Agriculture PNG Copra crushing, Palm oil processing, Plywood production, Wood chip production, Mining of gold, silver, and copper, Crude oil production, Construction, Tourism, Timber, Coffee, Cocoa, Seafood Samoa Fishing, Tourism, Timber, Food processing, Coconut oil and cream, Copra, Beer Solomon Islands Timber, Fish, Palm oil, Cocoa, Copra Tonga Tourism, Fishing, Squash, Fish, Vanilla, Root crops, Coconut oil Tuvalu Fishing, Tourism, Copra; Stamps/coins Vanuatu Fishing, Offshore financial services, Tourism, Food and fish freezing, Wood processing, Meat canning; Coconuts, Cocoa, Coffee (Sources: ADB Annual Reports; ABC World Fact Finder and SPC Pocket Statistical Summary, 2010) 20 38. Average ecconomic gro owth rates in n the PICTs s have gene erally been below 2% in i the last decade e (Figure 1.2 2). PICT ecconomic gro owth rates vary v from sloower in Kiribati and Federated States of Micronesia M a and Tuvalu to t increasin ng in Cook I slands, Sam moa, T had tthe lowest GDP G growth h rates in 20007 which could c be PNG. Naurru, Fiji and Tonga correlated with w govern nment instab bility and pu ublic riots. Nauru N recorrded a nega ative due to poorr investmen nts made du uring the ph hosphate mining years (Figure 1.2). Factors like e natural dis sasters (floo ods, tropica al cyclones, droughts, eearthquakes s, tsunamis) pest p and dis seases as w well as political instability contributted to the fluctuationss and decrease in econ nomic growtth rates in PICTs. P Figure 1 1.2: Econom mic Growth Rates of so ome PICTs, 2007, 2008, 2009 andd 2010. p: Projectiions. (Source: A Adopted from AD DB, 2009 and ESCAP, E 2008) 39. Furthermorre, the proje ections for 2 2009 and 20 010 show th he overall vuulnerability of PICTS to th he global ec conomic crissis, influenc ced heavily by the vulnnerability lev vel of each PICT (Table 1.3)). For exam ple, Tonga and Solomon Islands w were more than onomic crisi s followed by b Vanuatu and Samoaa (about 70 0%) 80% vulnerrable to eco while Fiji an nd PNG were more ressilient (abou ut 50%). This means T Tonga and Solomon S 211 Islands financial systems could be highly affected by any fluctuations of the global economy. Table 1.3: ESCAP economic crisis vulnerability index for 6 Pacific Island Countries. Country Economic Crisis Vulnerability Index Solomon Islands 0.85 Vanuatu 0.75 Samoa 0.65 Tonga 0.9 Fiji 0.55 PNG 0.5 (Source: ESCAP and DESA, based on ESCAP research and methodologies in the ESCAP/ADB/UNDP (2010) Asia-Pacific Regional Report 2009/10) 40. Economic development, quality of life, and alleviation of poverty presently constitute the most pressing concerns of many PICTs. With limited resources and low adaptive capacity, these islands are facing the considerable challenge of charting development paths that are sustainable but which permit economic development and improvements in human welfare, under the additional pressures caused by climate change and sea level rise. 1.2.1 41. Gross Domestic Product Gross Domestic Product (GDP) per capita of PICTs varies enormously between higher elevation islands with greater resources and low lying islands with limited exports. Countries with more resources and high population densities/growth also recorded less GDP per capita. For example, PNG with many natural resources has GDP figures of only US$897 per capita due to its high population. Atolls and low-lying countries (Kiribati, Tuvalu and Nauru) along with Solomon Islands have GDP rates of less than US$2,000 per capita. FSM, RMI, Samoa, Tonga and Vanuatu have GDP rates of between US$2,000 - US$3,000 per capita. Fiji had GDP rates of more than US$3,000 per capita in 2008. Cook Islands, American Samoa, Palau, Niue have high GDP rates per capita. The United States and French Territories and Protectorates have more than US$ 20,000 GDP per capita respectively. Countries with less resources and very low populations will have most of its GDP as contribution of the state government. 22 42. Remittances are a significant source of foreign exchange for many PICTs. Samoa and Tonga have historically relied on remittance flows as a significant contribution to their GDPs (Table 1.4). Between 2006 and 2008 this contribution to GDP in Tonga and Samoa has increased. Fiji and Kiribati also show an increasing dependence on remittances. Table 1.4: Remittances inflows as a percentage of GDP in selected Pacific Island economies, 2000 to 2008. Country 2000 2001 2002 2003 2004 2005 2006 2007 2008 Fiji 1.4 1.4 1.3 5.3 6.3 6.2 5.2 4.9 5.0 Kiribati 15.0 15.5 14.5 12.0 7.0 6.6 6.5 5.1 6.9 PNG 0.2 0.2 0.4 0.4 0.4 0.3 0.2 0.2 0.2 Samoa 19.4 18.8 17.0 14.0 22.8 25.2 24.0 22.0 25.8 Solomon Islands 0.5 0.5 0.6 1.2 2.3 1.7 4.5 3.8 3.2 Tonga 30.1 39.0 44.3 32.6 34.0 30.6 30.5 39.4 37.7 Vanuatu 14.3 22.6 3.5 3.2 1.5 1.4 1.2 1.1 1.2 (Source: Based on data from World Bank Migration and Remittances data) 1.2.2 43. Tourism Many PICTs depend on tourism as a key contributor to employment, revenue generation and economic growth. In many PICTs, the numbers of visitors substantially exceed the number of permanent residents. However, this dependence is a significant source of economic vulnerability for PICTs, particularly due to the high volatility of tourism revenue, as this sector remains vulnerable to extreme climatic events, global economic crises and social and political conditions in source and destination countries. The Pacific tourism industry is heavily reliant on the environment with nature-based or eco-tourism forming a key component. 44. The tourism sector in the Pacific grew slower than in other SIDS from 1990 to 2009 however it appears to have continued its growth while tourism in other regions has slowed (Figure 1.3). Fiji remains the top destination in the Pacific, while the Cook Islands, Samoa, Vanuatu, PNG and Tonga are becoming increasingly popular. The Cook Islands currently receives nearly seven tourists for every local resident per year (UN-DESA, 2010). The Solomon Islands have huge potential for tourism development. 23 Figure 1 1.3: Growth h rate in tourist arrivals in SIDS du uring 1990-2 2009. AIMS = Small Islan nds Develop ping Statess from Atlantic, the India an Ocean aand the Mediterrranean and d South China Sea) (Source: U UNWTO, 2010) The arrival of tourists in i selected PICTs is de etailed in Ta able 1.5. Thhe global fin nancial 45. educed the number of visitors arriiving in the majority co untries. crisis has re s in selecte ed Pacific Island economies, in thoousands of people, Table 1.5: Total tourist arrivals o 2009. 2004 to Country 200 04 20005 200 06 20 007 20008 2009 Fiji 504.1 545 .2 548 8.6 539.9 5585 538.5 5 Papua N New Guinea 58.0 68. 0 77 7.7 104.1 1220.1 125.9 1 Samoa 98.2 101 .8 115 5.9 122.3 1221.5 128.8 1 Solomon n Islands 5.6 6 9.44 11.5 15 5.2 222.0 18.3 Tonga 51.9 53. 3 52.8 67 7.1 661.5 50.7 Vanuatu u 98.5 125 .6 154 4.1 167.1 1996.7 100.7 1 (Source: S South Pacific To ourism Organiza ation, SPTO) 244 46. The development of infrastructure (water, electricity, roads and airports) to support tourism investment is critical for the region, and appropriate mitigation and adaptation measures to respond to climatic events will be crucial to sustain this industry. 47. Tourism contributes to greenhouse gas emissions as a result of domestic transport activities and use of fossil fuels in accommodation and cruise ships. International tourists travel significant distances— typically by plane—to visit the remote islands, resulting in large emissions of greenhouse gases. Many resorts are typically connected to the main grid and most have a back-up generator. Smaller islands rely mostly on electricity generated from diesel and use gas for cooking or operating the laundry. Only a few businesses use renewable energy, mostly for hotwater or solar lights. Air-conditioning is a major component of electricity consumption by tourism. 48. Some stakeholders feel that the tourism industry is not contributing its “fair share” towards maintaining and preserving natural resources and the environment. Specific examples include the need for water conservation and the intensive water use requirements of swimming pools and gold courses. Sewage management is also important to maintain good water quality and healthy coral reefs, so control of pollution is an important adaptation measure to protect reefs around tourist resorts. 49. Adaptation measures by accommodation providers include those that require some form of construction or technology and those that entail changes in management practices or behaviour, either by staff or tourists. Adaptation that can be addressed by building structures appears to be the more commonly adopted measure. Such measures involve building facilities designed to protect against cyclones (including strong winds, floods and storm surge),plantations as windbreaks, seawalls to protect against erosion, building materials and design for coolness, trees to provide shade, water tanks and rainwater collectors, and water management and conservation. Tourist accommodation is increasingly built so that facilities are protected against extreme weather events, and older buildings are being re-engineered to make them more cyclone-resistant. To prevent damage from storm surge and sea level rise, some buildings are now built at least 2.6m above mean sea level. Some resorts adapt to increased levels of erosion and storm surge risk by constructing seawalls or planting trees, mainly coconut palms or mangroves. Seawalls — as well as other marine constructions- have the disadvantage that they cause erosion elsewhere, and further erosion protection measures are necessary as a result. 25 1.2.3 50. Fisheries Total land area in the region covered by this report is just over 550,000 km², of which PNG accounts for 84 % of the total, and also makes up approximately 64 % of the total population. On the opposite end of the spectrum, eight of the smallest PICTs; the Cook Islands, Palau, Wallis and Futuna, Nauru, Tuvalu, Niue, Kiribati and Tokelau, together account for less than 1 % of the total population for the region but have the biggest Exclusive Economic Zone (EEZ) in the world (Table 1.6). Table 1.6: Land and ocean coverage for PICTs. Country ~ Land Area ~ EEZ Area ~ Territorial Waters (km²) (km²) (km²) American Samoa 197 390,000 9,910 CNMI 475 1,823,000 27,220 Cook Islands 180 1,830,000 31,310 Fiji 18,376 1,290,000 114,460 French Polynesia 3,521 5,030,000 243,890 FSM 702 2,978,000 49,990 Guam 549 218,000 4,580 Kiribati 726 3,550,000 75,300 Marshall Islands 720 2,131,000 107,00 New Caledonia 19,103 1,740,000 68,870 Nauru 21 320,000 1,900 Niue 258 390,000 2,980 Palau 500 629,000 14,010 5 800,000 8,100 461,690 3,120,000 355,700 Samoa 2,934 120,000 10,000 Solomon Islands 29,785 1,340,000 140,040 Tokelau 12 290,000 7,000 Tonga 696 700,000 37,530 Tuvalu 26 900,000 18,980 12,189 680,000 69,170 124 300,000 5,690 552,789 28,928,300 1,296,630 Pitcairn Islands PNG Vanuatu Wallis and Futuna Total *Values for EEZs (200 nm) and Territorial Waters (12 nm) should be regarded as estimates only as some PICTs have not formalized their EEZs (and some wish to extend their Continental Shelf margins) or accurately determine their Territorial Waters. (Source: Gillett, 2010; the Secretariat of the Pacific Community, and the Secretariat of the Pacific Regional Environment Program). 26 51. PICTs are highly depe endent on th heir coastal and marine e resourcess, particularly fish s and food security. s In the Pacific,, the stocks, for their economic growth , livelihoods es up to 40% % of govern nment reven nue and 20% % of GDP (G Gillett, tuna fisheryy contribute 2009) and hence tuna fisheries a re the corne erstone upo on which maany PICTs depend d e and incom me generatio on. For the region as a whole, tun a fisheries have for revenue expanded substantially s y, whilst the ere has bee en no real production inncrease from m coastal fish heries over the t last deccade (Gillettt, 2009). The tuna from m Western and a Central Paccific Ocean has an est imated annual market value of US S$6-8 billion n, about half of whicch is taken from f the Exxclusive Eco onomic Zones (EEZ) off PICTs. Th he substantial economic benefits b derrived from this resource include goovernment on in licensing fees from m predominnantly foreig gn revenue of about US$60-70 millio g in the regiion. fishing fleetts operating 52. port commo Apart from being an im mportant exp odity, fisheries are alsoo important for local hes supply 50–90% 5 of the t animal pprotein diet of food security – subsisttence catch ural areas (SPC, 2008 ; Bell et al., 2009) (see e Figure 1.44. Most of th he people in ru benefits fro om fisheries that directlly affect Pac cific Islande ers – such aas nutrition and jjobs – come from coas stal resourcces. Howeve er, the poorr state of cooastal fisherries gnores this point p or makes it difficuult to demon nstrate. statistics in the region normally ig al fisheries are a under th hreat in som me PICTs ow wing to oveer-exploitatio on; loss The coasta of coral ree ef, mangrove and sea g grass habita ats; destruc ctive practicees; increase ed sedimentattion and nuttrient loadin ng from land d use practices (includiing mining);; solid waste and liquid efflue ents and oth her sources of land and d marine poollution (Kinch et al., 2010). Figure 1 1.4: Catch by b species of o the four m most importtant tunas in n the Westeern and Cen ntral Pacific Ocean from m 1960 – 20 009. (Source: W Williams and Te erawasi 2010) 277 1.2.4 53. Agriculture e and Fore estry Agriculture remains the single larg gest sector in many PICTs, somettimes accou unting % of foreign n exchange e earnings, contributing c g substantiaally to emplo oyment for over 85% (40 to 80%), representting 20 to 4 0% of gross s domestic product (GD DP) and ov ver 50% ce agriculturre plays a significant s part in mainttaining food of exports. Subsistenc security and improving g livelihood and health standards and agricultture is still the t e and the m main insuran nce against poverty forr the majoritty of main sourcce of income rural, and many m urban, communitties in PICT Ts. Despite its i importannce, agriculttural productivityy has declin ned in recen nt years as a share of total nationaal income, principally because b of low producctivity and vagaries of weather. w Evven though the agricultural sector’s sh hare of GDP P has declin ned in most PICTs oveer the last tw wo his sector co ontinues to be very important (Fig gure 1.5). Alll PICTs exc cept decades, th PNG record ded a loss in agriculturral GDP con ntribution in the early 1 990s howe ever the Solomon Isslands, Kirib bati, Tonga and Cook Islands laterr stabilized.. PNG’s agrricultural contribution n has decre eased since 2003. Sam moa, Fiji, Vanuatu and T Tuvalu conttinued to decrease e through to o 2008 (Figu ure 1.5). Figure 1 1.5: Percen ntage GDP input i of Agrricultural sector for sele ected PICTss. (Source: A Asian Developm ment Bank, 2009 9). 288 54. As showed by the Pacific Heads of Agriculture and Forestry Services report (HOAFS2010) some of the contributing factors to the decline in agricultural productivity are: 55. pest and diseases loss of markets and high production costs change of diets/life styles loss of arable lands due to land developments and customary conflicts unsustainable land use poor technology and low levels of technology transfer However, large numbers of people are still based in rural areas and depend on agriculture and forestry directly or indirectly for employment and income. Agriculture has a realistic potential to be a lead sector in growth and employment generation in the coming decades, through value added processing, adoption of appropriate better crop management systems and research to develop high yielding, disease resistance, low input varieties and improved cultural practices. 56. Some PICTs, in particular the larger islands, have embraced commercial crop and livestock production since the late 1970s. Some countries engaged in large-scale deforestation due to monoculture crop production solely aimed at earning foreign exchange. As a result, prices of locally produced crops are higher compared to imported goods such as rice and flour and this has led many urban populations in the Pacific to be dependent on cheap foreign imports. However, according to a recent study by the University of Copenhagen (2007), in the Solomon Islands, most rural people still depend on subsistence food production and fisheries. A multitude of cultivated plants such as yams (Dioscorea spp.), taro (Colocasia esculenta), sweet potatoes (Ipomoea batata), bananas (Musa spp.) and watermelon (Citrullus lanatus) are still part of people’s staple diet. 57. The current trend is for the demand for food being increasingly serviced by imports, including basic staples such as rice and wheat flour. These are substitutes of traditional diets that are now part and parcel of a Pacific Islander’s daily diet. This threatens food security, given the volatility of international commodity prices. Table 1.7 shows household incomes and food expenditure for some Pacific countries. On average, 39% of all Pacific household expenditure is on food with Nauru, Samoa and the Solomon Islands exceeding 50%.In 1998, the cost of rice in Palau almost 29 doubled from US$9.00 to US$16.00 for a 25kg bag (Aitaro, 2008). Deteriorating terms of trade, rising external debts and inflation plague the capacity of Pacific Islanders to meet their nutritional requirements from imported food. Dependency on imports would increase poverty and reduce the ability to deliver on MDG obligations. Moreover, cheap food imports have contributed to the rise in heart diseases, obesity and other health complications in the Pacific (UNICEF, 2011). Table 1.7: Household income and food expenditure in some PICTs. Country Cook Islands Fiji Year Income Food Expenditure US$ (%) 2004 27.7 2002‐03 6,288 40.3 Kiribati 2006 6,559 46.0 Mariana Islands 2005 25,172 Micronesia 2005 13,421 39.4 Nauru 2006 7,166 52.0 Niue 2002 15,094 21.1 Palau 2006 19,771 Samoa 2002 6,768 50.8 Solomon Islands 2005‐06 3,105 53.5 Tonga 2000‐01 8,428 30.2 Tuvalu 2004‐05 11,360 48.0 2006 5,855 22.6 2005‐06 38,090 Vanuatu Wallis et Futuna (Source: Hughes, 2010) 58. The forests in PICTs continue to provide enormous ecosystem and societal services and benefits, including climate change mitigation, biodiversity protection, food security, sustainable livelihoods and cultural enrichment. In addition to sheltering and supporting much of the land-based biodiversity, forests provide homes and livelihoods for indigenous people and forest dwellers, such as food, timber, nontimber forest products, energy, medicines and pharmaceuticals, cultural, spiritual and recreational benefits (UNU-IAS 2008). Forest degradation is therefore a serious concern in PICTs, and occurs through fires, pruning for firewood, clearing for land development, clearing for agricultural expansion and many other human activities (FAO 2005). 30 1.2.5 59. Mining The mining sector is vital to some PICTs because of its contribution to export earnings and government revenue. Mining production has generally risen over the past two decades. PNG is a leading mining country in the region with seven major active mining operations and other petroleum and gas mining projects in initial stages (Mining and Petroleum in PNG, 2009). Mining represents one of the biggest investments in PNG. Gas companies have invested US$15 billion and over the next 30 years are projected to produce 9 trillion cubic feet of gas, which is estimated will bring US$32 billion dollars to land owners and PNG government. There is also a planned copper-gold mining at the Frieda River, while Sea Bed mining (Nautilus Minerals’ Solwara 1 deep sea) at Bismarck Sea is expected to start in 2012. There are also important mining activities in Solomon Islands and Fiji, including two new potential projects for Fiji with an estimated value of US$ 1 billion. 60. Mining exploration in Cook Islands recently discovered huge deposits of Manganese nodules with cobalt in Cook Islands’ EEZ in a depth of about 4000-5000m. Cook Islands have appointed a Mining Authority that will investigate the pros and cons of mining in the country. Mining companies are exploring deep sea and sea bed mining as it avoids land disputes and land-based waste production. In addition, the re-mining of Nauru’s phosphate resumed in 2010. 61. There are enormous economic advantages of mining in PICTs. However the first environmental resettlement of Banabans to Rabi Island in Fiji and the phosphate mining in Nauru and PNG have shown the negative impacts of mining not only on the environment but also on health and social development. Mining related deforestation leads to a loss of habitat for many endangered species while increased sedimentation deposits can destroy forests, water sources, freshwater and marine water ecosystems. Mining also leads to loss of lands and culture and can lead to social problems like teenage pregnancy, child labour, crime, violence and communicable diseases (Javia and Siop, 2010). 62. Blasting and dredging of coral reefs and mining of coral aggregate causes serious impacts in the coasts and seas of PICTs. Coastal mining provides the only sources of sand for construction in FSM, Kiribati, Marshall Islands, Tonga, Tuvalu, and Samoa. Dredging is done in rivers, beaches and shallow coastal waters while individuals mine beaches for sand and aggregates for domestic use. In Fiji, an extensive 31 dredging programme has been undertaken to deepen the river channels and reduce flooding in river mouths. The dredging has been blamed for the loss of wetlands and the destruction of marine fisheries that some of the villagers rely on (Qalo, 2010). 63. The key to sustainable and viable mining lies in allocating mineral revenues equitably and effectively, developing robust governance frameworks for the extractive industries and strengthening government administration (Regan, 1998). Countries need to undertake and enforce better environmental impact assessments before large projects are undertaken. Change is also required through increasing engagement between government, industry and aid agencies (Commonwealth of Australia, 2006). 1.2.6 64. Energy Energy is fundamental to economic and social activities and a prerequisite for sustainable development in the Pacific region. While economic growth has been slow or negative in PICTs of late, energy consumption has been increasing. The Energy Intensity (energy unit per $ of GDP) of the region has thus become higher; and energy efficiency is getting lower. PICTs face the triple challenge of lack of access to modern energy services, high dependence on imported fuel and impacts of (and contribution to) climate change. 65. On average, a Pacific islander is responsible for producing approximately one quarter of the Carbon Dioxide (CO2) emissions attributable to the average person worldwide. However, in common with most other countries, the energy sector is the largest source of greenhouse gas emissions in PICTs. 66. The PICTs rely heavily on fossil fuels to meet their energy demands, with fossil fuels accounting for an estimated 85% of total supply in 2006. For the period 1990–2006, total energy supply (fossil fuels and local sources such as hydropower and biomass) grew at a rate of 3.8% per year (ADB 2009). However, the regional data are dominated by PNG and Fiji, with PNG accounting for 80% and Fiji 20% of energy supply for both total energy and petroleum only. Excluding these two PICTs, the average energy consumption grew at 1.2% per year, and petroleum fuels accounted for almost 99% of commercial energy use. These fuel dependency rates are extremely high compared with the Asia/Pacific region (45%) and globally (34%) (SPC 2010). 32 67. ude of the eenergy challenge The following summarry of statisticcs indicate the magnitu Ts (SPC 2010): facing PICT transpo ort accounts s for the larrgest percen ntage of pettroleum usee in PICTs – about 42% in n PNG, 54% % in Fiji and 75% avera age for others; electriccity generation typicallyy accounts for f 20% or more of PIC CTs petroleum consum mption; about 30% 3 of Pac cific Islanderrs have acc cess to electricity, rang ing from les ss than 25% in n some coun ntries (PNG G, Solomon Islands and d Vanuatu) tto over 95% % in others (Cook Islan nds, Guam, Nauru, Niu ue, Northern n Mariana Isslands, Sam moa, au and Tuva alu); Tokela the increase in the e price of pe etroleum fro om 2002 to early 2008 cost PICTs s about 10% off their gross s national in ncome. 68. Figure 1.6 shows s electricity accesss by counttry in the PIC CTs. Aboutt 70% of the e PICT population does not ha ave any acccess to elec ctricity supply. Some P PICTs (Cook k Islands, Na auru, New Caledonia, C P Palau, Samoa, Tokelau u and Tuvallu) have mo ore than 90% accesss to electric city. Howeve er, PNG, So olomon Isla ands and Vaanuatu have e less than 20% of o their popu ulation conn nected to an ny kind of electricity syystem. Mostt of the electricity production p (except in F iji, PNG, an nd Samoa) is i by diesel generators s. Figure 1 1.6: Percen ntage of the population having acc cess to electricity accesss in the PICTs. (Source: P Pacific Regionall Information Sy ystem, PRISM, h http://www.spc.iint/prism) 333 69. The UNDP has developed an Oil Price Vulnerability Index (OPVI) for the oil-importing developing countries based on variables including GDP growth rate, oil intensity, share of oil in primary energy consumption and oil import dependence (UNDP, 2007). This index ranks countries according to their susceptibility to imported oil price increases. From this analysis PICTs like Fiji, Samoa, Solomon Islands and Vanuatu emerge as highly vulnerable to oil price fluctuations. 70. A very large portion of PICT population uses fuel-based lamps for their lighting needs. Kerosene lamps are one of the most inefficient sources of light, at about 0.1 lumen per watt (lumen/W) (an incandescent bulb, itself very inefficient, produces ~ 17 lumen/W). In PNG alone, about US$100 million annually is used for buying kerosene for lighting. 34 2 71. ENVIRONMENTAL CHALLENGES AND PICTs’ RESPONSES The Pacific islands are now challenged by a range of environmental pressures resulting from the drivers discussed in the previous section. Pressures on their financial and natural resources include coastal erosion, salt water intrusion, land degradation and habitat destruction, invasive species, pollution, waste and many others, many of which will be exacerbated by climate change. Other pressures were important in the recent past, such as nuclear testing. Some of these pressures lead to population relocation, for example, islanders were moved from Bikini and Eniwetok atolls in the Republic of the Marshall Islands and Murorua in Tahiti to allow nuclear testing, and from Ocean Island (Banaba) to Fiji (Rabi Island) due to phosphate mining. Recently, Carteret Islanders in PNG were relocated to Bougainville because of extreme coastal erosion and salt water inundation. Pacific island populations also suffer frequent natural disasters like cyclones, earthquakes, tsunamis and droughts. 2.1 STATUS OF INVASIVE SPECIES 72. This section develops a set of invasive species indicators within a ‘state-response’ framework, i.e. with state (the status of alien species invasion) expressed as the number of documented introduced, known invasive and potentially invasive species per country, and ‘response’ demonstrated by measuring progress towards reducing the threat and spread of invasive species (via policy, management and operational interventions). National invasive species policy is measured as a trend in the percentage of countries with national legislation relevant to invasive species concerns and how this has changed through time as countries acknowledge the invasive species problem and commit to responding to this threat. Baseline information on management is measured as management interventions that pertain to the prevention and control of the spread of invasive species in member countries. The geographical coverage includes the 21 island members of the Secretariat of the Pacific Regional Environment Programme (SPREP): American Samoa, Cook Islands, Federated States of Micronesia, Fiji, French Polynesia, Guam, Kiribati, Marshall Islands, Nauru, New Caledonia, Niue, Northern Mariana Islands, Palau, Papua New Guinea, Samoa, Solomon Islands, Tokelau, Tonga, Tuvalu, Vanuatu, and Wallis & Futuna. The taxonomic and habitat coverage includes documented and known introduced, potentially invasive and invasive species of all taxa that inhabit terrestrial and freshwater ecosystems. 35 73. A major limitation of this section is that information obtained was focused on terrestrial invasive species in a conservation context, i.e. invasive species that impact natural ecosystems and native biodiversity. Marine invasive problems are not covered, and nor are invasive species (‘pests, weeds and diseases’) that affect primarily the production sector and other human interests, such as agriculture and forestry. Such species and the interventions directed at managing them are thus under-represented in the present report. 2.1.1 74. Invasive Species Issues Methods: A literature review was conducted with a focus on electronically available databases and primary literature. The two main databases used were the International Union for Conservation of Nature- Species Survival Commission’s (IUCN SSC) Invasive Species Specialist Group’s (ISSG) Global Invasive Species Database (GISD - http://www.issg.org/database/welcome/) and (for plants) the Pacific Island Ecosystems at Risk (PIER - http://www.hear.org/pier/) database. FishBase (http://www.fishbase.org/) was used to obtain information on introduced freshwater fish species in the Pacific. Literature searches were conducted for each country on Google Scholar, Biological Abstracts and BioOne databases for literature and documents related to information on introduced/invasive species in the Pacific region including a special focus on the journal Pacific Science and the reports by Jim Space, Barbara Waterhouse and others on invasive plant species in several countries in the Pacific (see Bibliography). Sources consulted are given in Annex 1. 75. Introduced and invasive species data availability varied amongst the PICTs. Age of data also varied, and efforts were made to use the most recent information available. 76. For the purpose of this evaluation the following definitions were used. Introduced species: A species occurring in an area outside of its known natural range as a result of intentional or accidental dispersal by human activities (also known as an alien, exotic, non-native or non-indigenous species); Invasive species: An introduced species that is an agent of change, and threatens ecosystems and native biodiversity. Evidence of negative impact and any record of dominant or aggressive behaviour have been used as supporting information for this classification; Potentially invasive species: A species that has not demonstrated any evidence of negative impact on ecosystems or native biodiversity or dominant 36 behaviour in a particular country but has been recorded as an invasive species elsewhere in its introduced range. 77. Inconsistency of terminology used by different resources presented a challenge in classifying species into these categories. Examples of inconsistency include use of the term ‘alien’ species to mean introduced or invasive. Some sources listed species as invasive without providing evidence of negative impacts on native biodiversity/natural ecosystems or dominant behaviour while other resources provided annotations to describe invasive behaviour. In future reports, efforts should be made to search for evidence of impacts for the list of species. 78. The method followed to classify a species was therefore as follows: species were listed as simply ‘introduced’ in a country/territory unless annotations stated that the species had some negative impact on natural ecosystems or native biodiversity in that country, or demonstrated any dominant or aggressive behaviour or was widespread; these species were classified as ‘invasive’. However, if an introduced species had a record of invasiveness elsewhere in its introduced range, but not within the PICTs, it was listed as ‘potentially invasive’. 79. Another issue was changing taxonomic nomenclature. Revisions have been made in cases that are well known (e.g. Bufo marinus is now Rhinella marina). Taxonomic databases like Integrated Taxonomic Information System (IT IS-http://www.itis.gov/) and recommendations by species experts have been used as reference. 80. Results: Table 2.1 shows the number of alien species in the three categories across the 21 PICTs, with the frequency distribution illustrated in Figure 2.1. Tokelau and Tuvalu had the lowest documented numbers of alien species (42 and 79 respectively), and Fiji the highest (635). French Polynesia reported the highest number of invasive species (201). 37 Table 2.1: Numbers of alien species recorded in the 21 PICTs (without Pitcairn Islands), classified into three categories: introduced (no impacts or spread recorded), invasive and potentially invasive. Country Invasive Potentially invasive Introduced (no impacts Total species or spread recorded) American Samoa 40 156 1 197 Cook Islands 161 59 3 223 Federated States of Micronesia 22 385 45 452 Fiji 33 497 105 635 French Polynesia 201 253 139 593 Guam 40 447 105 592 Kiribati 42 158 16 216 Marshall Islands 66 238 218 522 Nauru 23 261 200 484 New Caledonia 9 462 159 630 Niue 46 287 16 349 Northern Mariana Islands 26 92 1 119 Palau 61 370 35 466 Papua New Guinea 17 385 112 514 Samoa 56 328 16 400 Solomon Islands 25 316 55 396 Tokelau 3 39 0 42 Tonga 39 378 8 425 Tuvalu 2 73 4 79 Vanuatu 23 172 20 215 Wallis & Futuna 31 225 61 317 38 Figure 2 2.1: Freque ency distribu ution of alie n species across a the 21 2 PICTs, cllassified into three categorries: introdu uced (no imp pacts or sprread record ded), invasiv ve and poteentially invas sive. 2.1.2 81. Response to Invasive e Species: Policy Methods: Policy P respo onse is mea asured as a trend in the percentagge of countrries with national leg gislation rele evant to invvasive species concern ns. Policies and legislation relating to invasive spe ecies for the e 21 PICTs, along with h the year leegislation was w as collected from sourcces including the Pacific Islands Leegal Inform mation passed, wa Institute (htttp://www.pa aclii.org/), th he Bio invas sion & Glob bal Environm mental Governancce Country Profile P Data abase (http:///www.cbd.iint/invasive/ e/legislation//), LegiFrance e (http://www w.legifrance e.gouv.fr/ho ome.jsp) and d websites specific to legislation for f various countries c a nd territorie es. The SPR REP Legal aand Nationa al Convention ns page (htttp://www.sp prep.org/legal/national.h htm) was ussed as an in nitial guide. If no o date was found, f policcies were lis sted as the 2001-2010 2 time period d. Data are presentted as the number n of p policies activ ve in each time t period and so are cumulative as legislation is built. 82. A of the 21 PICTs anallyzed have national policies that re relate to inva asive Results: All species con ncerns. The e following ssections show the trends in legislaation over tiime for these 21 co ountries and d territories . Numbers of national policies relaating to inva asive species con ncerns in efffect in the 2 21 PICTs generally inc creased oveer the past 110 1 399 years (Figu ure 2.2, Tab ble 2.2), with h a gradual increase un ntil the 19600s, followed d by a sharper inccrease there eafter. Figure 2 2.2: Nationa al legislation n in place re elating to in nvasive species concerrns from 1901 to 2010, b by decade, for f the 21 PICTs P analyysed. 83. National leg gislation varies accord ing to the le egal system m on which i t was origin nally built. Fiji, Kiribati, K Nauru, Papua N New Guinea a, Samoa, Solomon S Isl ands, Tong ga, Tuvalu and d Vanuatu were w all prevviously asso ociated with h the Unitedd Kingdom. Kiribati, Nauru, PNG G, Samoa, Solomon Isslands, Tong ga, Tuvalu and a Vanuattu are mem mbers of the Commo onwealth off Nations. 84. The Cook Islands, Niu ue and Toke elau are all associated with New Z Zealand. Tokelau is a territory of o New Zealland, while the Cook Is slands and Niue N are seelf-governing g in free association n with New Zealand. Z Alll show incre eases in rellated policiees over the time period, with h the Cook Islands havving the mos st legislation related too invasive sp pecies concerns. Of O these countries, prio or to the 1970s only To okelau had iinvasive species related policies. 85. h Territories s in the Paccific are Fren nch Polynes sia, New Caaledonia an nd The French Wallis & Fu utuna. Territtorial entitie es to which the t French Governmennt has trans sferred its compete ence on env vironmentall matters ha ave develop ped specific legislation. 400 86. American Samoa, Guam and the Commonwealth of the Northern Mariana Islands are unincorporated territories or insular areas of the United States of America. All have territorial legislation that relates to invasive species and show increases in policy numbers from 1961 – 2010. American Samoa had policies which were operational since the 1960s, while CNMI did not have related legislation until the 1980s but has since shown a sharp increase, now having the most number of policies of all PICTs. Other states associated with the U.S.A. are Palau, the Federated States of Micronesia and the Marshall Islands. Out of these three countries, FSM had the earliest policies related to invasive species concerns, dating back to the 1950s (data not shown). All three countries showed increases in invasive species related policies over the time period. Table 2.2: Legislation in place relating to invasive species concerns from 1961 to 2010, by decade, for 21 PICTs (Pitcairn Islands is excluded because of no data). Country Decade 1961 ‐ 1970 1971 ‐ 1980 1981 ‐ 1990 1991 ‐ 2000 2001 ‐ 2010 Cook Islands 0 3 7 11 15 Niue 0 2 2 7 9 Tokelau 1 2 3 4 5 American Samoa 2 5 7 8 10 Guam 0 2 4 8 12 Northern Mariana Islands 0 0 6 16 24 FSM 2 4 5 14 15 Marshall Islands 0 1 6 5 7 Palau 0 0 1 2 6 Fiji 1 5 6 7 10 Kiribati 0 4 5 7 10 Nauru 1 2 3 5 5 PNG 2 6 12 17 17 Samoa 4 5 8 11 14 Solomon Islands 4 5 6 10 11 Tonga 6 7 9 11 16 Tuvalu 1 4 5 10 11 Vanuatu 1 1 5 10 17 French Polynesia 0 0 0 4 6 New Caledonia 0 0 0 1 4 Wallis and Futuna 0 0 0 1 4 41 2.1.3 87. Response to Invasive Species: Management This section evaluates the response to invasive species via management intervention, measured as management interventions that pertain to the prevention and control of invasive species undertaken between 2009 and 2010 in the 21 PICTs. This time period was chosen to provide a baseline to which future statistics can be compared. 88. Methods: The Pacific Invasives Partnership (PIP) and the Invasive Species Working Group of the Roundtable for Nature Conservation in the Pacific Islands are developing a matrix of invasive species management activities undertaken by major regional organisations involved in invasive species work. The Guidelines for Invasive Species Management in the Pacific (SPREP 2009) provide a framework for these programmes. The PIP activities matrix has been used as the main source of information. Additional information from other Pacific agencies and from the archives of the ISSG has also been included. 89. In addition to management of established invasive species by control, containment and eradication, and actions for preventing the spread of invasive and potentially invasive species, other critical aspects of management considered included species information management, exchange of skills and technical expertise, networking and coordination. This information is incomplete, and many interventions are not recorded. In particular, management of ‘pests’ that do not impact natural ecosystems and native biodiversity is not included. 90. Interventions were classified by PICT of implementation and as regional if the intervention had a regional focus. Interventions were also classified based on project focus, e.g. habitat or species conservation or quarantine. 91. Results: 116 management interventions were recorded for the 21 PICTs. Table 2.3 shows the number of interventions recorded per country and those that had a regional focus. Higher numbers of interventions were recorded for Fiji, French Polynesia, New Caledonia and Palau while the least number of interventions were recorded for Nauru, Solomon Islands, Tonga, Tokelau, Tuvalu and Wallis & Futuna. 42 Table 2.3: Numbers of management interventions in 21 PICTs analyzed and recorded by major regional agencies in the activities matrix developed by the Pacific Invasives Partnership. Country Number of Country Management Number of Management Interventions Interventions American Samoa 3 Northern Mariana Islands 5 Cook Islands 4 Palau 17 Federated States of Micronesia 4 Papua New Guinea 3 Fiji 16 Samoa 8 French Polynesia 10 Solomon Islands 1 Guam 5 Tokelau 1 Kiribati 4 Tonga 2 Marshall Islands 3 Tuvalu 1 Nauru 1 Vanuatu 5 New Caledonia 10 Wallis & Futuna 2 Niue 3 Regional 8 92. Close to 50% of interventions were actions against invasive species as part of broader projects focused on the conservation of threatened species, 40% were aimed at restoration of degraded habitats through weed control, 7% were of generic and regional focus including outreach and technical assistance and 3% related to biosecurity. 2.1.4 93. Key Actions for Invasive Species Issues The following key actions are recommended as priorities for improving the monitoring and reporting on the state of invasive species in the region in the coming years: the need to improve data coverage to include marine invasive species, and pests, weeds and diseases that affect primarily the agricultural production sector and other human interests, and interventions to manage them; SPREP and regional partners to undertake peer review by country experts of the species lists, to correct gaps or inaccuracies; SPREP to facilitate a study of the coordination, implementation and enforcement of legislation, along with monitoring of implementation and enforcement, to provide useful information on the effectiveness of policy instruments. Enforcement of legislation can vary between countries due to limited capacity and resources; 43 the Pacific Invasives Partnership's matrix of management interventions and actions should be strengthened so as to provide a consistent and more accurate measurement of progress towards reducing the threat, spread and general impact of invasive species. 2.2 WASTE AND TERRESTRIAL AND MARINE POLLUTION 2.2.1 94. Waste and Pollution Issues Wastes of all types - municipal, hazardous and nuclear - have become a major problem in PICTs. Waste includes organic waste (e.g. from food processing), and chemical waste (e.g. from mining processes and wood treatment). Agriculture, tourism, forestry, mining and fisheries industries all generate wastes – some as a byproduct of the activity, some a necessary part of the production stream. By-product wastes are generally the result of poorly managed operations and include siltation (from mining and land clearing of marginal forests for agricultural activities), oil pollution (used oil from machinery and from accidental spills), pesticides and miscellaneous plastic trash (old fishing gear, plastic sheets, drums and bags). 95. Mining activities are a major contributor to the region’s environmental load of heavy metals. Impacts of mining waste are potentially catastrophic. The Ok Tedi mine in the central PNG highlands has severely impacted the Fly River for hundreds of kilometres downstream by discharging over 150,000 tonnes of mine waste and tailings into river systems daily for decades (Markham and Day, 1994). 96. Rapid urbanization and changing consumption patterns, exacerbated by the small land area of many of the islands and combined with limited waste reduction and recycling programmes, have resulted in a proliferation of waste materials. In many cases the predominant waste component is organic materials (kitchen and green wastes), but increasing quantities of plastics, paper, glass and metals are now comprising domestic and industrial waste streams. Plastics are considered to be a priority pollution threat in the region today; the occurrence of plastic bags in the ocean is increasing and it is known that the ingestion of only a few plastic bags can kill turtles and juvenile cetaceans (UNEP 2011). 97. Much of this rubbish slowly breaks down and leaches noxious by-products into the soil and drinking water. Any substance that does not break down takes up valuable space. Foul-smelling organic wastes and wastewaters attract disease-carrying pests 44 such as mosquitoes, rats and flies. Piles of household rubbish are accumulating on beaches and in mangrove swamps. 98. The historical use of hazardous chemicals and other products (e.g. asbestos) by Pacific communities has also led to stockpiling of expired chemicals and waste products, often in unsecure and deteriorating facilities. 99. Up-to-date collated waste generation and management statistics for the region are lacking, mainly due to the limited implementation of programmes to manage waste sustainably and the lack of monitoring components to programmes implemented. From the limited data collected between 1990 - 1994, domestic solid waste generation rate in was estimated to be of the order of 0.3-0.7 kg/capita/day with an average of 0.4 kg/capita/day (Raj, 2000). The typical waste stream composition is shown in Figure 2.3. A more recent waste survey conducted in 1999 in several urban centres estimated the waste generation rate as 0.7 kg/capita/day(Raj, 2000). 100. The aggregated data from 1990-1994 contains a number of deficiencies such as unknown and probably inconsistent methods of data collection and unrepresentative sampling (only six data sets to derive a regional average over 4 years), nonetheless they serve to highlight the problems with data collection in the region, while still providing notions of the waste composition. 100% Construction/Demolition 90% Hazardous Composition 80% Leather/rubber 70% Textile 60% Glass/Ceramic 50% Metal 40% Plastic 30% Paper Miscellaneous 20% Garden Waste 10% Vegetable/putrescible 0% 1990-1994 Average 1999 Average Figure 2.3: Regional average waste generation statistics. (Source: Raj, 2000) 45 101. Increasing waste volumes impose a considerable burden on the environmental (e.g. pollution impacts), economic (e.g. management costs) and social (e.g. public health) aspects of island life. Tourism, a key money-earner for some PICTs, is increasingly affected by the spread of litter. Pacific coastal regions have to compete with other tourist destinations based on the reputed beauty of their lagoons and beaches, but this advantage is shrinking under the impact of solid waste piling up around shorelines and waterways. PICTs now list waste management as one of their major environmental concerns and a major threat to their sustainable development. The increase in waste pollution is threatening efforts to maintain healthy societies, stimulate development and bring new investment and a sustainable future. 102. Land-based polluting sources, deep sea mining activities and oil slicks from ships have continued to cause marine pollution, severely affecting marine life. An increase in chemical nutrients, typically compounds containing nitrogen or phosphorus, can raise an ecosystem's primary productivity (excessive plant growth and decay), and reduce oxygen content and water quality, affecting fish and other animal populations. 2.2.2 103. Response to Waste and Pollution: Mitigation Much progress has been made in recent years in many PICTs to develop national waste management policies and strategies and to implement community-based solutions. However, much work remains to be done to turn policies and strategies into active and successful programmes that can achieve real solutions and to scale up community-based pilot projects to ongoing, national level responses. Recent initiatives include: the integrated coastal watershed management component of the Pacific International Waters Project (IWP) funded by the Global Environment Facility (GEF) and implemented by the United Nations Development Programme (UNDP). This US$8.5 million project was designed to help governments find cost-effective ways to improve the management of waste, freshwater and coastal fisheries resources. The key objective was to strengthen environmental agencies and help communities manage their environments through participation, resource economics and communications; the Solid Waste Management Project in Oceania Region (SWMPOR), a 4-year initiative by the Japan International Cooperation Agency (JICA), ended in 2010. SWMPOR aimed to enhance the semi-aerobic landfill method in Samoa and 46 disseminate it to all countries, develop national waste management strategies and action plans in 8 countries, establish a network for information sharing, and introduce measures for the management of abandoned vehicles and other bulky wastes in Kiribati. 104. To build on the groundwork and successes of such projects, there are several donorfunded initiatives for waste management being launched in the Pacific, to assist with the implementation of national policies and strategies: Japan’s Project for Promotion of Regional Initiative on Solid Waste Management (J-PRISM) is a 5-year initiative which focuses on implementation of national strategies through technical cooperation on waste reduction, recycling and landfill improvement and management; the French Development Agency’s (AFD’s) Regional Solid Waste Management Initiative is a 4-year initiative mainly addressing technical and vocational capacity building for solid waste management and regional management of waste oil; the UNEP/GEF-PAS project POPs Release Reduction Through Improved Management of Solid and Hazardous Wastes, is a 5-year project that aims to achieve reduction of POPs and better waste management mainly through waste management training for key stakeholders, disposal and management of chemicals/POPs stockpiles, a management framework for future chemicals management, and enforcement and promotion of low risk alternatives to pesticides. 105. These projects assist in establishing sustainable systems for waste management. However, there are emerging issues in waste management (such as electrical and electronic wastes and mercury), which will require further investment in PICTs to ensure the waste management systems developed are robust enough to deal with these issues. 2.2.3 106. Regional Waste and Pollution Partnerships Good partnership between stakeholders including Governments, donors and local communities must be established to design systems that are environmentally, economically, and culturally appropriate. The focus at all levels and must be on reduction, reuse, recycling and getting people involved in waste management. In addition, studies should reveal who suffers what impacts as a result of waste problems and why and how much it costs them. Such studies can allow planners to 47 understand how much money ordinary people and governments can save by better managing their waste (SPREP 2010c, SPREP 2010d). 107. Regional solid waste management priorities up to 2015 are detailed in the Pacific Regional Solid Waste Management Strategy 2010-2015. These priorities are sustainable financing, integrated solid waste management, legislation, awareness communication and education, capacity building, environmental monitoring, policy and planning, solid waste industry and medical waste. The development of a regional strategy addressing other solid waste types (e.g. hazardous wastes) is also planned. 2.3 ATMOSPHERIC POLLUTION AND GREENHOUSE GASES 108. Human activities result in pressures on the atmosphere through gaseous pollutants. Particularly important to PICTs are emissions of four principal greenhouse gases: carbon dioxide (CO2), methane (CH4), nitrous oxide (N2O) and the halocarbons (a group of gases containing fluorine, chlorine and bromine). These gases accumulate in the atmosphere and are the principal drivers of climate change since the beginning of the industrial era. 2.3.1 109. Atmospheric Pollution Table 2.4 shows the available data on some atmospheric pollutants in PICTs, which are somewhat outdated. PNG leads PICT emissions of these pollutants, while Fiji and New Caledonia also have significant emissions. In Fiji, a rainwater analysis undertaken in early 2002 suggested an average pH of 5.2 suggesting that there is no serious ‘acidification’ problem. This also implies that there are low levels of acidifying oxides of nitrogen and sulfur (Table 2.4). This is not surprising since there are limited industrial sources for these gases in the PICTs. Suva being a marine site had high sodium and chloride levels (98.2 & 109.6 m, respectively) and relatively low levels of nitrate, sulphate and phosphate (Dutt, 2001; Koshy et al., 1997). Table 2.4: Emissions of CO, NOx, NMVOC and SO2 in PICTs in 2000 (in Gg). Country CO NOx Non Methane SO2 Volatile Organic Carbons American Samoa 3.5 1 0.5 1 Cook Islands 1.5 0.1 0.2 0.1 Fiji 73.6 4.3 10.8 2.8 48 Guam 9.7 5.8 2.3 0.4 Kiribati 5.4 0.2 0.8 0.1 Marshall Islands 0.1 0.3 0 0 FSM 0.2 0.8 0 0.8 Nauru 0.7 0.5 0.2 0.5 New Caledonia 19.8 4.9 4.5 7.3 Niue 0.1 0 0 0 Northern Mariana Islands 0.4 1.5 0.1 0.1 0 0.1 0 0 3191.4 133.4 272.3 32 Solomon Islands 29.9 1.4 5.6 0.7 Tonga 8.1 0.6 1.1 0.4 Vanuatu 16.4 0.8 2.7 0.3 Palau Papua New Guinea (Source: World Resources Institute. http://www.wri.org; The World Factbook: Rainhttp://www.exportinfo.org/worldfactbook/index.html) 2.3.2 110. Ozone Ozone monitoring through balloon-launched ozone-sondes in collaboration with NOAA-NASA began in Fiji (at USP) in February 1997. This site has now become one of the Southern Hemisphere Additional Ozone-sondes (SHADOZ) sites in the region, together with American Samoa, Galapagos and Tahiti, which are just some of the SHADOZ sites. 111. Results of surface level ozone measurements in Fiji, Samoa, Tahiti and Galapagos are shown in Table 2.5. The ranges recorded are similar with Samoa and Galapagos having the lowest minimum and Samoa having the highest maximum. The ground level ozone in Fiji, the country with the highest recorded levels, has seldom exceeded 30 ppbv, with a 7-year average of 17 ppbv. The other three sites (Samoa, Tahiti and Galapagos) have lower averages. Surface ozone trend shows a summer minimum (January to March) and winter maximum (June to August). The summer minimum is due to higher sunshine hours when photochemical breakdown is highest. Table 2.5: Surface ozone levels in Fiji, Samoa, Tahiti and Galapagos. Site Minimum Maximum Average for period 1997‐2003 (ppbv) (ppbv) (ppbv) Fiji 2.0 34.0 16.7 Samoa 0.0 37.0 13.4 Tahiti 2.0 32.0 12.8 Galapagos 0.0 28.0 12.3 49 (Source: Shultz et al., 1999) 112. Tropospheric ozone measured in Fiji, Samoa Tahiti and Galapagos is shown in Table 2.6 below. Tropospheric ozone reflects much wider variations with a 3-year range of 21-250 ppbv and an average of 72 ppbv. Stratospheric levels display smaller range, with a 3-year range of 7.3-12.5 ppmv and an annual average of 9.5 ppmv. A 7-year average for total column ozone for Fiji is 250 Dobson Units (DU), which is within the range of 224-360 DU and the other sampling sites had similar average values except for Galapagos, which was slightly lower. Table 2.6: Tropospheric Ozone in Fiji, Samoa Tahiti and Galapagos. Site Fiji Year 1997 1998 1999 2000 2001 2002 2003 Total Average Range (DU) 16‐53 9‐38 9‐43 8‐45 13‐43 13‐39 10‐35 8‐53 MAM Mean (DU) 24.9 17.4 16.1 16.4 ‐ 16.8 20.7 18.6 SON Mean (DU) 33.1 30.6 26.7 27.9 30.8 25.4 30.4 29.3 Samoa 1997 1998 1999 2000 2001 2002 2003 Total Average 1997 1998 1999 Total Average 1998 1999 2000 2001 2002 2003 Total Average 9‐50 8‐39 7‐31 10‐30 14‐29 11‐30 10‐35 7‐50 11‐36 10‐37 8‐39 8‐39 15‐38 17‐33 12‐31 15‐32 16‐33 14‐29 12‐38 16.1 19.9 13.3 16.9 ‐ 14.9 13.3 15.7 20.2 ‐ 16.5 18.4 19.3 20.7 18.3 18.9 ‐ 18.8 19.2 27.3 24.6 22.8 23.5 24.6 22.5 24.1 24.2 31.8 26.1 30.2 29.4 25.6 26.8 23.9 26.8 26.4 ‐ 25.9 Tahiti Galapagos MAM: March April May SON: September October November. NB: Maximum ozone during spring (SON) and minimum during fall (MAM). DU = Dobson Units (unit for measuring ozone) (Source: Shultz et al., 1999) 2.3.2.1 Ozone Depleting Substance(ODS) Consumption 113. The use of ozone-depleting substances (ODS) in the Pacific region is limited to chlorofluorocarbons (CFCs) and hydro-chlorofluorocarbons (HCFCs) as refrigerants, air propellants and solvents and methyl bromide (a fumigant used in quarantine and pre-shipment applications). The trend of ODS consumption in Oceania between 2000 and 2007 (Table 2.7) shows an overall decrease. The major contributors were PNG, 50 Fiji and Vanuatu. The latter country shows an alarming increase from 3 to 17 metric tons within a year (2006–2007). Solomon Islands and FSM show low consumptions of ODS. Samoa and Palau originally used ODS but due to their commitment to the Montreal Protocol reduced their consumption to 0 metric tons. Table 2.7: Consumption of ODS in some PICTs Region/Country 2000 2001 2002 2003 2004 2005 2006 2007 Oceania 635 486 490 346 254 238 124 144 Cook Islands ‐ ‐ ‐ ‐ ‐ ‐ ‐ ‐ Fiji 3 3 5 2 6 6 5 5 Kiribati ‐ ‐ ‐ ‐ ‐ ‐ ‐ ‐ Marshall Islands 1 ‐ ‐ 1 ‐ ‐ ‐ ‐ Micronesia, Fed States 1 1 2 2 2 1 0 1 Nauru ‐ ‐ ‐ ‐ ‐ ‐ ‐ ‐ Palau 71 71 0 1 1 0 0 0 Papua New Guinea 52 19 40 26 21 19 7 10 Samoa 1 2 3 0 0 0 0 0 Solomon Islands 1 1 6 1 2 1 2 1 Tonga 1 1 1 0 0 0 0 0 Vanuatu 0 0 0 0 0 0 3 17 (Unit: Ozone depletion potential – metric tons). - = no data on ODS consumption. (Source: World Resources Institute. http://www.wri.org) 2.3.3 114. Greenhouse Gases (GHGs) Calculating greenhouse gas emissions (GHGs) for PICTs is a challenge, mainly due to inconsistent data and the lack of expertise and capacity to record such data. Greenhouse gas emissions can be extracted from National Communications to UNFCCC, but the data recorded for PICTs in the First National Communication Reports are different in format and content compared to the Second National Communication Reports and therefore does not allow direct comparison. Only Samoa completed its Second National Communication Report and it shows an increase in CO2 emissions (Table 2.8). 51 Table 2.8: Summary of Samoa’s GHG emission for 1994, 2000 and 2007. Sector Gg CO2‐e 1994 2000 2007 102.83 142.74 174.35 Industrial Processes & Product Use unavailable 4.59 9.51 Agriculture, Forestry & Other Land 37.92 86.06 135.57 Waste 24.88 33.09 32.81 Total Emissions 165.63 266.43 352.03 1994 2000 2007 ‐658.56 ‐1150.04 7785.07 Energy Use (excluding removals) Estimated CO2 Removals Agriculture, Forestry & Other Land Use (Source: Second National Communication to UNFCCC, 2009) 115. Agriculture is a major source of GHGs, contributing 14% of global emissions or about 6.8 Gigatonnes of CO2 equivalents per year. As 74% of agriculture’s GHG mitigation potential lies in developing countries, mitigation actions undertaken can also contribute to increase food security and reduce rural poverty. For the Pacific, the contribution of agriculture to GHG emissions is significant, although there were difficulties in documenting and calculating emission caused by the lack of related data in PICTs First National Communication Reports. An indication of production may be estimated from Samoa’s data, based on their Second National Communication Report (Table 2.8). Samoa’s emissions from livestock and crops were its second highest contribution to GHG but all agricultural activities combined represent 35% of GHG emissions, the highest single contribution (higher than electricity production) (Table 2.9). There are slight increases in the Cook Islands and Fiji emission levels while other PICTs have shown either insignificant increases or slight decreasing trends. Table 2.9: CO2 emission per capita for PICTs (Units: Metric tons of CO2 per person). Region/Country 2000 2001 2002 2003 2004 2005 Cook Islands 1.42 1.6 1.39 1.57 2.59 2.9 Fiji 1.07 1.39 1.12 2.02 2.32 1.99 Kiribati 0.36 0.28 0.27 0.27 0.27 0.26 Nauru 11.48 11.5 11.27 11.38 11.16 10.96 Niue 1.89 1.88 1.87 1.86 1.86 1.85 52 Palau 6.07 5.55 5.46 5.79 5.7 5.67 Papua New Guinea 0.5 0.54 0.56 0.62 0.76 0.73 Samoa 0.78 0.8 0.79 0.83 0.82 0.82 Solomon Islands 0.39 0.4 0.39 0.39 0.38 0.37 Tonga 1.23 1.08 1.08 1.16 1.18 1.18 Vanuatu 0.43 0.43 0.42 0.43 0.42 0.41 (Source: World Resources Institute. http://www.wri.org) 116. A large proportion of the greenhouse gas emissions from PICTs are generated from liquid fossil fuels use (Table 2.10) imported from outside the region. Aviation and marine navigation account for a significant fraction of the CO2 emissions in PICTs. Table 2.9 and Table 2.10 shows slight increases in measures of CO2 levels. Table 2.10: CO2 emissions from liquid fuels in PICTs. Unit: Thousand metric tons of CO2. Region/Country 2000 2001 2002 2003 2004 2005 113119 102870 111507 115379 114665 122444 Cook Islands 29 33 29 33 55 62 Fiji 766 1037 828 1572 1828 1561 French Polynesia 641 542 696 689 671 685 Kiribati 33 26 26 26 26 26 Marshall Islands 77 81 84 84 88 84 Nauru 136 139 139 143 143 143 New Caledonia 1539 1172 1641 1894 1781 1817 Niue 4 4 4 4 4 4 Palau 114 106 106 114 114 114 Papua New Guinea 2462 2667 2895 3331 4305 4192 Samoa 139 143 143 150 150 150 Solomon Islands 161 169 169 176 176 176 Tonga 121 106 106 114 117 117 Vanuatu 81 84 84 88 88 88 Oceania (Source: World Resources Institute. http://www.wri.org) 117. Nitrous Oxide (N2O) levels are generally low in the tropics. The PEM-Tropics A mission found low N2O levels (3-4 pptv) from 0o to 30o S near the surface (Schultz et. al. 1999). The main source of nitrous oxide in PICTs is from the agriculture sector, from burning rather than decay of agricultural materials. PNG leads in terms of N2O emissions, with significant contributions from Samoa, Cook Islands, Fiji, Palau and Tonga. PICTs have much less N2O production compared to global emission levels. 53 118. Methane (CH4) emissions are mainly from agriculture (including land use changes) and primarily consists of enteric fermentation and manure management, from animals (livestock including pigs and poultry), waste and decaying plant materials. Methane emissions also originate from anaerobic decomposition of organic wastes in solid waste disposal sites and sludge. Radiocarbon studies indicate considerable influence of biomass burning in the methane levels (Table 2.11). Table 2.11: Greenhouse gas emissions for some PICTs. **Carbon dioxide emissions http://en.wikipedia.org/wiki/List_of_countries_by_carbon_dioxide_emissions (emissions in 2007). LULUCF – Land Use, Land Use Change and Forestry; n. a. – not available. Country CO2 (Gg )* CO2 % of Global CH4 N2O Total GHGs Excl LULUCF (Gg)** Total** (Gg)* (Gg)* (Gg)* Cook Is 32.56 66 <0.01 10.59 37.14 80.3 FSM n. a. 62 <0.01 n. a. n. a. n. a. Fiji 821 1,459 <0.01 542 27.90 1,391.3 Kiribati 18.56 33 <0.01 9.42 0.00 27.97 Marshall Is n. a. 99 <0.01 n. a. n. a. n. a. Nauru 28.32 143 <0.01 7.27 0.31 35.9 Niue 4.4 4 <0.01 13.99 12.31 4,422 Palau 0.01 n. a. n. a. 30.42 62.04 92.5 PNG 1,141 3,366 0.01 89.67 3,782 5,012 Samoa 20.22 161 <0.01 69.38 389 561 294 198 <0.01 n. a. n. a. 294.4 Tonga 79.98 176 <0.01 106 43.40 229.2 Tuvalu 4.65 n. a. n. a. 0.91 0.00 5.56 Vanuatu 55.15 103 <0.01 235 9.02 299.4 Solomon Is (Sources: UNFCCC Data Interface (all 1994 data except Palau which is 2000 data) at http://unfccc.int/di/DetailedByParty/Event.do?event=go 119. The human-sourced emissions of GHGs in PICTs represent only a small percentage of the world’s total human-sourced release of carbon dioxide, methane, nitrous oxide, and other GHGs into the atmosphere. As indicated in Table 2.11 most PICTs contribute <0.01% of the global total for carbon dioxide. It has been suggested that because of the GHG “sink” capacity of its extensive forest and coral reef systems, the region may well become a net “uptake” of globally emitted GHGs. While PICTs may be making a minimal contribution towards the global generation of GHGs, their emissions are increasing and should be addressed as they are the very islands and 54 populationss that will be e impacted the most by y the conse equences off global warrming and sea-levvel rise. How wever, therre is limited technical capacity in P PICTs to ins stall equipment and regularly monitor air quality and a pollution n. Furtherm more, Pacific c countries are a not curre ently prioritizzing studyin ng the quality of air. 120. evel monitorring in ambiient air was undertaken n for a 10 yeear period in i Fiji Methane le from 1994 to t 2004. Th he data depiicted in Figu ure 2.4 show a close ccorrelation with w Baring Hea ad (New Zea aland) wherre minimum m methane levels are reecorded late e January an nd maximum m levels are e recorded during d the July–Augustt period. This welldefined ann nual cycle is s largely du ue to an incrrease in CH H4 destructioon by the Hy ydroxyl radical during the sum mmer month s. The drift in values obtained for Fiji during 19991 d to a leakage in the e plumbing line. 2000 was due Figure 2 2.4: CO2 co oncentration n trends in ssome Pacific sites. (Source: Keeling andd Whorf 2004) 555 Figure 2 2.5: Methan ne mixing ra atio at USP (Fiji) and Baring B Head d (New Zealland). (Source: M Ma’ata, 2010) 121. It is evidentt from Figurre 2.4 and F Figure 2.5 th hat there is a gradual i ncrease in methane le evels over th he years. Th he average methane concentratio c on for the Fiji data was 1710 parts p per billion by volu ume (ppbv) which is comparable too the world average of 1720 ppbv. This is verry close to the t values obtained o froom the other four Pacific sitess shown in Figure 2.5. 122. es of methan ne, air samp ples were ccollected fro om To determine some off the source selected sittes in Fiji an nd were ana alysed for th heir methan ne content. The results s plotted in Figure 2..6 clearly sh how the maj ajor concenttration of atm mospheric m methane to be the Kinoya dige ester and th he Lami rub bbish dump. This propo ortional breaakdown of emission so ources may y vary in oth her PICTs. 566 80 Cocentration (ppmv) 70 60 Max 50 Min 40 30 20 10 K in oy a D ig es La to m r iD C um at p tle Fa rm B W io m etla as n Bu ds rn in R g ic e f H ot arm S La prin gs uc al a B ay 0 Sites Figure 2.6: Maxima and minima values of methane concentrations (ppmv) obtained for the sources monitored for the period Jul 2001 to Jun 2002. (Source: S. Pac. J. Nat. Sci., 2003, 21, 20-24). 2.3.4 123. Response: Reducing Atmospheric Pollution and GHG In 2001, 12 of the 14 PICTs had ratified the Montreal Protocolon Substances that Deplete the Ozone Layer. Cook Islands and Niue did so in December 2003. SPREP, through its Pacific Ozone Depleting Substances Project, coordinated the efforts of these 14 signatory member countries towards achieving the goal of the Protocol. Of the 14, only Fiji has implemented comprehensive regulations to control the import of ODS. The most important controls, especially for neighbouring countries, are prohibitions on the import and export of all ODS except HCFCs and methyl bromide from (or before in some cases) 1 January 2000.Between July and December 2003, seven train-the-trainer workshops on “Good Practices in Refrigeration” were successfully conducted in Kiribati, FSM, Marshall Islands, Palau, Solomon Islands, Tonga, and Tuvalu. PNG has also conducted similar training workshops in two major cities. By February 2004, ten PICTs were in compliance with data reporting requirements of the Protocol (Fiji, Kiribati, Nauru, Palau, PNG, Samoa, Solomon Islands, Tonga, Tuvalu and Vanuatu). 124. Most PICTs have complied with the treaties and protocols related to GHGs. In spite of PICTs being minor emitters of greenhouse gases on a global scale, it is important that they continue to take measures in mitigation of GHG emissions. In addition to this being an obligation to the UNFCCC, mitigation measures will enable the 57 countries to participate in technology-transfer opportunities. Mitigation measures undertaken by PICTs are discussed below (section 2.4.5). 2.4 EXTREME EVENTS, CLIMATE VARIABILITY AND CLIMATE CHANGE 125. The Pacific is noteworthy for its dynamic climate: extreme events and variability are ubiquitous. Major features of the climate include the El Nino Southern Oscillation (ENSO) cycle, extreme events such as tropical cyclones, floods and drought and persistent features such as the trade winds and convergence zones. Climate change will act as a “threat-amplifier”, with impacts that include rising ocean levels, ocean warming and acidification, changing precipitation patterns, changing cloud cover patterns, altered ocean and atmosphere circulation patterns, and increased intensity and frequency of extreme weather events. The response of hydrological systems, erosion processes and sedimentation due to climate change could be undesirable in some PICTs. 2.4.1 126. Extreme Events One of the major extreme events, tropical cyclones, occur regularly from December to April and an average of four cyclones per year impact in the southwest tropical Pacific (Wauthy, 1986). Some occurrences might be linked to the ENSO cycle, which also has a profound influence on the terrestrial and marine environments of the PICTs (Dalzell et al 1996). Although recent palaeo-climatic analyses of corals indicate that ENSO events were more frequent in the past, the increasing occurrence of cyclones and ENSO events in recent years might indicate an impact of global change on the Pacific region (South et al 2004). 127. The impact of natural disasters in terms of human and economic losses has risen in recent years. Natural disasters are increasing in magnitude, complexity, frequency and economic impact. For example, Samoa, Vanuatu, and Tonga had increasing economic losses on capital stock in relative terms due to natural disasters from 1970 to 2006 (Government of Samoa 2010). In the case of Samoa, the damage from a tropical storm and a forest fire in 1983 as well as three consecutive tropical storms from 1989 to 1990 set its capital stock back almost 35 years. The poor and socially disadvantaged groups in the PICTs are generally the most affected as they are least equipped to cope with and recover from disasters. Economic impacts include 58 devastation of agriculture, damage to tourist beaches, infrastructure and coastal ecosystems, and disruption of communications which affects all sectors but especially the tourism and international and off-shore business sectors that are staples of many island economies. 2.4.2 128. Temperature and Precipitation Due to climate change related global warming, the South Pacific region will likely warm by between 0.99 and 3.11°C by the end of this century (cited from Table 16.1 in Chapter 16 of IPCC WG II 4AR, 2007). The projected temperature increase compares to the temperature difference for the region, of around 3 to 4°C experienced between the middle of the last Ice Age and present day. 129. Weather station records and ship-based observations indicate that most PICTs warmed on average between about 0.3 and 0.8°C during the 20th century. Although the magnitude of warming varies locally, the overall trend is widespread and consistent. Analyses of surface temperature data over a network of stations in the PICTs suggest that the first nine years of the 21st century have recorded higher than normal temperatures and that the number of hot days and nights per year has significantly increased. 130. Compared to historical records, the Southern Pacific experienced a significantly drier (15%) and warmer climate (and 0.8oC) during the late 20th century (Hay et al 2003) compared to the 1951 – 1980 averages. In the Southeast Trades region, from New Caledonia northeast to Fiji and Samoa and southeast to the southern Cook Islands and French Polynesia, mean air temperatures showed little systematic change until the 1970s but since then have followed a steady upward trend, with the overall change between 1911 and 1990 amounting to 0.8°C. Sea surface temperatures for the same period increased by only about 0.4°C. 131. In the Central Equatorial Pacific minimum air temperatures increased at almost twice the rate of maximum air temperatures, at 0.8°C and 0.4°C respectively. Since the 1980s, rainfall has increased by around 30% relative to the 1951-80 average. In the convergence zone that runs north of Fiji through Tuvalu to Tarawa in Kiribati, mean air temperatures increased by around 0.6°C between 1933 and 1998, and have climbed even higher since then. The heat content of the Pacific Ocean has also risen since the 1950s. The Central Equatorial Pacific sea surface temperatures have 59 increased by about 0.4oC, with most of the increase occurring since the 1970s (Hay et al. 2003). 132. Many of these patterns appear linked to systematic changes in ENSO. Since the mid1970s there has been a tendency for more frequent El Niño episodes, without intervening La Niña events. In the Southeast Trades region conditions are cooler and drier during El Niño and warmer and wetter during La Niña. In the regions encompassing the central equatorial Pacific and the convergence zones the opposite relationships prevail: conditions are warmer and wetter during El Niño and cooler and drier during La Niña (Manton et al. 2001; Griffiths et al. 2003). Both mean annual air temperature and precipitation anomalies show marked inter-annual variability, and are closely associated with the ENSO cycle. Consequently, since the mid-1970s, wetter than average conditions have prevailed in western Kiribati, Tuvalu, Tokelau, the northern Cook Islands and northern French Polynesia, but it has been drier in New Caledonia, Fiji, Tonga and Samoa. These changes coincide with a prevalence of El Niño conditions, including an eastward shift of the South Pacific Convergence Zone. Changes related to El Niño in rainfall patterns and the thermohaline circulation, leading to poor fish catches, have been observed in recent years. The duration of the 1990-95 El Niño is unprecedented in the climate record of the past 124 years. 133. Many watersheds in PICTs have undergone substantial changes as a result of extensive land use change (e.g. deforestation, agricultural practices and urbanization) leading to hydrological disasters, increased variability in runoff and extensive reservoir sedimentation over the past few decades. Extreme precipitation events can exacerbate such changes, with geomorphological significance in mountainous terrains where they may cause widespread slope failures and landslides. 134. Tropical cyclones are a major feature of the region, particularly to the north of 10°N and south of 10°S latitude. Cyclones form over warm tropical oceans (water temperatures typically above about 26°C), at least 5° north or south from the equator. In the 1990s the cost of extreme events in the PICTs region is estimated to have exceeded US$1 billion (Bettencourt and Warrick, 2000). This includes the cost of Cyclones Ofa and Val, which hit Samoa in 1990–91, causing losses of US$440 million, larger than the country’s average annual gross domestic product. In Niue, Cyclone Heta is estimated to have caused damage of about US$35 million, 60 approximately 25% of its GDP (McKenzie et al., 2005). In February 2008, Fiji incurred in excess of US$24 million in damage to agriculture (excluding the sugar industry), infrastructure, utilities and properties as a result of Cyclone Gene. In addition, the government had to provide about US$0.8 million worth of food rations (ReliefWeb, 2008). 135. As part of the Pacific Islands Climate Change Assistance Programme (PICCAP), CSIRO Australia prepared regional climate change scenarios for Micronesia, Melanesia, and north and south Polynesia. Six model simulations (five coupled ocean-atmosphere models plus a regional climate model nested in a coupled model) were used to generate regional climate change scenarios (Table 2.12). Table 2.12: Scenarios of Temperature Change (°C) for Selected Regions in South Pacific. Region Local Warming per °C of Warming to 2050 Warming to 2100 Global Warming Low Med High Low Med High Micronesia 0.7 to 1.0 0.4 0.8 1.3 0.6 1.6 3.5 Melanesia 0.7 to 0.9 0.4 0.8 1.2 0.6 1.6 3.2 Polynesia North 0.8 to 1.0 0.4 0.8 1.3 0.7 1.6 3.5 Polynesia South 0.7 0.4 0.7 0.9 0.6 1.4 2.5 (Source: Jones et al., 1999) 136. ENSO is likely to remain a key driver of climatic variability in the region and also of climate change. Recent modelling studies indicate more El Niño-like conditions with global warming, that is, a greater warming of surface temperatures in the eastern tropical Pacific than in the west. This change can be expected to increase the frequency of El Niño conditions and reduce the frequency of La Niña conditions, relative to the current climate. 137. The causal relationship between sea surface temperature and the formation of tropical cyclones suggests that the intensity, frequency and distribution of tropical cyclones may change in the future. The ENSO pattern strongly dictates the development and distribution of cyclones within the Pacific, and will be affected by changing air and ocean temperatures. During El Niño periods, a tropical cyclone has more than a 40% chance of being severe. While there is no direct evidence that tropical cyclone frequency may change with global warming, a general increase in the intensity of cyclone events (expressed as 5–10% higher wind speeds and lower 61 central pressures, and 20–30% higher mean and peak precipitation intensities per CO2 doubling), now appears likely (Walsh, 2004; Meehl et al., 2007). No significant change in formation regions is noted in models, although the area of cyclone formation might extend further eastward, given the increasing sea surface temperatures. The regions of formation may also change in response to long-term changes to ENSO. Some PICTs in the central and eastern Pacific may face more frequent storms and tropical cyclones if El Niño-like conditions begin to dominate. 138. More recent climate projections for the South Pacific suggest surface air warming of 0.8–1.8oC and regional precipitation changes ranging from -8% to +7% by midcentury (Ruosteenoja et al., 2003). By the end of the 21st century, projected warming is likely to range between 1.0 to 3.9oC and precipitation changes range from -14% to +14%; extracted from IPCC WGII AR4, Tables 16.1 and 16.2). Table 2.13: Projected range of increases in annual mean surface air temperature (°C) and annual mean changes in Rainfall (%) by region at three future time scales relative to the 1961-1990 period depending upon the A1FI, A2, B1 and B2 emissions scenarios. Air Temperature 2010‐2039 2040‐2069 2070‐2099 Northern Pacific 0.49 to 1.13 0.81 to 2.48 1.00 to 4.17 Southern Pacific 0.45 to 0.82 0.80 to 1.79 0.99 to 3.99 Rainfall 2010‐2039 2040‐2069 2070‐2099 Northern pacific ‐6.3 to + 9.1 ‐19.2 to +21.3 ‐2.7 to +25.8 Southern Pacific ‐3.9 to +3.4 ‐8.23 to +6.7 ‐14 to +14.6 (Source: IPCC WG II AR4. Tables 16.1 and 16.2) 2.4.3 139. Sea-level Rise During the 20th century, mean sea level rose by 20-30 cm. Sea level is rising because of the melting of glaciers, land-ice, changes in local air-pressure, as well as gravitational shifts as a result of relocation of ice/water mass and the thermal expansion of the ocean as a result of climate change. Substantial rise in sea level in the Western Pacific Ocean has been recorded during the past few decades (Map 2.1). 62 Map 2.1 1: Geographical pattern of 1993 – –2008 sea le evel trends. (Source: W World Meteorolo ogical Organizattion, 2009) 140. The rate off global mea an sea levell rise in the 21st centurry is projectted to increa ase h a central e ecent satelllite measure ements from 1 to 7 mm/yr, with estimate of 4 mm/yr (re evel has risen by 3.4 m mm per year during the e period from m 1993 to show sea le 2008).Glob bally averaged sea leve el rise due to t thermal expansion e oof sea waterr is expected to o range from m 0.18m to 0.58m in 20 090-2099 re elative to 19980-1999 (IPCC AR4 Synthe esis Reportt, 2007). Lo cal and reg gional factorrs (includingg uplift or sinking of the land ass a result of crustal movvements, va ariations in air pressuree, wind stre ength and directio on, river discharge of frreshwater, and strengtth and direcction of ocea an currents, se ea waves and swell) w will continue to influence e sea level, and add to o, or subtract fro om, global sea s level ris e. Altogethe er, sea leve el rise of up to 1 m may y occur during this century (Fig gure 2.7). 141. nt findings suggest s thatt the net ma ass loss of glaciers g andd ice caps now n More recen contributess about 1.2 mm m per yea ar to global sea level ris se, and thee relatively fa ast dynamic re esponse of the t Greenla and and Anttarctic ice sh heets to gloobal warmin ng has been obserrved. The net mass losss from the Greenland ice sheet h as accelera ated since the mid-1990s m and contribu utes up to 0.7 mm per year y to sea level rise. The T total melt area a of the Greenland G icce sheet inc creased by 30% betweeen 1979 - 2008. 2 Some clima ate and glac cial scientissts predict th hat climate change maay be about to push the Greenla and ice she eet over a th hreshold wh here the entire ice sheeet will melt in less 633 than a few hundred ye ears. If the e entire 2,850 0,000 cubic kms of ice w were to melt, it AR, 2001). would lead to a global sea level riise of 7.2 m (IPCC, TA Figure 2 2.7: Projecttions of glob bal mean se ea level rise e during the 21st centu ry. The red bar corresp ponds to add ditional rise e due to insttabilities of ice i sheets. (Source: IP PCC 4AR, 2007 7). 142. Antarctica is i also losin ng ice masss at an acce elerating rate e, mostly froom the Wes st Antarctic icce sheet due e to increassed ice flow, which contributes to ssea level ris se at a rate nearly equal to tha at of Green nland. Loss of ice from the West A Antarctic ice sheet c to o a projecte ed total sea level rise of up to 1.4 m by 2100. is likely to contribute Furthermorre, observattions of Arcctic Ice exten nt in Septem mber 2010 ssuggest tha at the linear rate of o ice melt volume v deccline is 11.5% per deca ade relative to the 1979 9 to 2000 avera age. These new observvations heig ghten the prrobability off accelerated sea level rise in n the decade es to come . 143. Any increasse in sea su urface temp perature is likely to cause an increease in wind d stress on surface waters. Thu us, an incre ease in sea surface tem mperature ddue to clima ate uld lead to amplification a n in storm surge s heights and an eenhanced ris sk of change cou coastal disa asters. Give en that man ny islands la ay no more than a few meters abo ove sea level, the co ombined im mpact of trop pical cyclon nes and sea level rise w will likely be e 644 devastating for some low-lying atoll nations including Kiribati, Republic of the Marshall Islands and Tuvalu. Sea level rise could inundate large areas of many islands, increase storm damage to the remaining land and contaminate fresh water supplies in aquifers thus increasing health risks to local populations. 2.4.4 144. Risk, Uncertainty and Impacts of Climate Change Many PICTs are extremely vulnerable to climate change induced risks (e.g.,large scale inundation due to sea level rise and widespread damages from high intensity tropical cyclones). The extent of the risks and threats of climate change to PICTs is uncertain, given the current knowledge of climate change factors, however at their most extreme could include the relocation of communities living on atolls. 145. The IPCC (2007) highlighted 54 'key uncertainties' that complicate climate science, including gaps in knowledge about Earth's climate system and its components, and the causes of natural variability (particularly in the tropics). The simulations presented by the IPCC (2007) offer wildly diverging pictures. At present, global climate models are not well able to inform decision-making for individual countries and downscaled climate models face particular uncertainty dealing with local complexities. Another source of uncertainty includes future greenhouse-gas emissions, which depend on assumptions about future economic development. 146. However, the uncertainties do not undermine the fundamental conclusion that greenhouse-gas emissions are rising sharply and that the world is on a trajectory that will far surpass 2°C of warming unless global emissions are immediately cut by a substantial amount. While researchers continue to develop tools to accurately forecast climate change scenarios for the 21st century at local and regional levels, PICTs need to contribute to emissions cuts through mitigation and prepare for the likely effects through adaptation. 147. Climate change impacts within the Pacific region will not be uniform. For example, agricultural impacts associated with climate change will differ markedly among PICTs due to their differing geomorphologies and vulnerability to sea-level rise and extreme climate events. The economies of PICTs depend heavily on agricultural production, aquaculture, fisheries and tourism. High islands such as Viti Levu (Fiji) may expect relatively modest decreases in their gross domestic product (GDP) of 2–3% by 2050, whereas low-lying countries such as Kiribati may face reductions equivalent to 18% 65 (IPCC 4AR, Working Group II, Chapter 16). However, these projections are fraught with uncertainty due to lack of robust data creating rainfall projections that cannot predict the magnitude or even direction of change at local level with a high degree of confidence (Van Pelt et al., 2010). This is of great concern when many PICTs rely heavily on rain-fed agriculture systems and on rainfall as a main source of drinking water. Changes in precipitation and cyclones patterns are projected to have devastating effects on availability of fresh water, agricultural yields and loss of arable land. 148. The projected sea-level rise could inundate deltas, estuaries, coastal wetlands and other low lying areas, erode beaches, exacerbate flooding and increase the salinity of rivers, bays and aquifers. Sea-level rise could also disrupt benthic ecosystems, especially sea grass beds, reduce productivity of coastal ecosystems, displace traditional fishing sites, contribute to coral reef deterioration, damage coastal infrastructure, increase vulnerability of human settlements, inundate agricultural land, and damage vital infrastructure (roads, communication facilities, ports etc). The effects of sea-level rise, especially on atolls, are likely to cause disruption to virtually all economic and social sectors. With higher sea level, coastal regions could be subject to increased damages from wind and floods and dislocation of a substantial proportion of the population. The ecological fragility, economic and social vulnerability, and the remoteness of many PICTs make recovery from extreme weather events very difficult. A detailed assessment of the implications of future sea level rise to the coastlines of PICTs, especially on mangroves and fresh water aquifers, needs to be undertaken. 149. Impacts on water resources: Water resources are highly vulnerable to climate change, through increases in rainfall variability, droughts, sea level rise and the frequency of tropical storms (Table 2.14). Challenges may arise from increased flood risks, impeded drainage and the presence of elevated water tables, which may pose engineering problems. The strong reliance of many atolls and coral islands on thin groundwater lenses of freshwater makes them particularly vulnerable to sea level rise (SPREP, 1999). IPCC (2007) identified that under most climate change scenarios, there is a high level of confidence that water resources in small islands will be seriously compromised. In the Pacific, a 10% reduction in average rainfall would reduce the freshwater lens on Tarawa (Kiribati) by 20%, which would be further compounded by sea-level rise potentially reducing the lens a further 29% (IPCC 66 2007). Any shortfall in water supply will increase competition for water between economic, social and environmental applications. Population growth and commercial development could lead to heightened demand for irrigation and industrialization, potentially at the expense of domestic supplies. Forecasts indicate that in most parts of the Pacific region, problems resulting from increasing demand for water and increasing pollution of water may be much more significant than the expected effects of climate change. Table 2.14: Effects of climatic changes projections as reported in the IPCC AR4, on water availability, accessibility and use. Predicted Change Confidence Impact on Water Security More frequent or intense Very likely Damage to water storage infrastructure floods Increased water pollution Potential relief of water scarcity in some areas Higher operating costs for water systems Saltwater intrusion in local areas Increase in area affected by Likely Reduced Water availability droughts and duration of dry Reduced groundwater resources spells Compromised water quality Increased risk of water‐borne disease Increased demand for irrigation More frequent or intense Likely tropical cyclones Damage to water storage / supply system Power outages causing disruption to public water supply Increased water pollution Increased risk of water‐borne disease Relative sea level rise Likely Damage to water storage / supply systems Saltwater intrusion in coastal areas Salinisation of groundwater and estuaries Higher water temperatures High Confidence Increased water pollution Water quality problems such as algal blooms and reduced dissolved oxygen content Higher operating costs for water systems Changes in river flow and Likely discharge Changes in seasonal water availability Increased risk of flash floods Impacts on groundwater recharge Changes in water availability for hydropower generation Increased rainfall variability Very Likely Changes in seasonal water availability Changes in water storage Increased demand for irrigation water (Source: Adapted from IPCC, 2007). 67 150. Impacts on agriculture: Subsistence and commercial agriculture are vital to local food security and export earnings, so measures to build resilience of food systems are critical. In the Pacific, about 70% of the gross cropped area benefits from rains in the summer season. Production is, therefore, heavily dependent on the seasonal rainfall. Climate change predictions for the region suggest prolonged variations from the normal rainfall which could be devastating to agriculture. For example, in the absence of adaptation, the cost of damage in the food sector by 2050 could represent 2–3% of Fiji’s and 17–18% of Kiribati’s 2002 GDP. Fiji’s experience with the 1997–98 ENSO event is a case in point, where losses in the sugarcane industry were around FJ$104 million (~Aus$70 million) while other agriculture losses including livestock death amounted to FJ$15 million (~Aus$10 million) (McKenzie, et al., 2005). In the past, flooding and strong winds associated with tropical depressions and cyclones have curtailed agriculture production (Makati, et al., 2007). In 1990, Tropical Cyclone Ofa turned Niue from a food exporting country into one dependent on imports for the next two years (Adger, et al., 2007). Such disruptions to food production and the economy may intensify in future, given the projections for more intense tropical cyclones and precipitation variations of up to 14% above and below normal rainfall levels associated with extremes by the end of the century (IPCC, 2007). 151. In addition to climate extremes, altered precipitation (including rain event intensity as well as temporal and spatial shifts) and increased evapo-transpiration will also be of concern. The increase in atmospheric carbon dioxide may benefit agriculture through increased plant growth but these positive effects are likely to be negated by thermal and water stress associated with climate change (Lal, 2004) and changes in pest species voracity and growth; loss of soil fertility and soil erosion resulting from climatic variability. Increasing coastal inundation, salinization and erosion as a consequence of sea level rise and human activities may contaminate and reduce the size of productive agricultural lands and, thereby, threaten food security at the household and local levels. 152. In Vanuatu, an archipelago of 80 high islands, some agricultural crops are already showing signs of stress under current climatic conditions. Water-scarce areas and small islands that depend entirely on rainwater and underground water sources are also experiencing severe water shortages. The El Niño-induced drought in Fiji in 1998 and the taro leaf blight that hit Samoa in the early 1990s illustrate the serious 68 impacts of drought and disease on crop yields. The Fiji drought severely impacted an estimated 28 000 households. In the case of the taro leaf blight, Samoan taro exports fell to less than 2% of pre-blight levels within a year of the disease’s establishment in 1993. More than 15 years later, the taro export industry in Samoa has failed to recover fully. 153. Increasing heat stress, soil erosion, salinization and nutrient depletion, pests, diseases, invasive species, drought and flooding, and sea water inundation of lowlying arable soils are expected to cause production losses. Crops in many low latitude PICTs are already close to their maximum heat tolerance and therefore even minimal atmospheric warming and rainfall changes may result in substantive decreases in crop yields. Along with cyclone impacts, droughts, the emergence of new pests (plant diseases, weeds, arthropod and vertebrate pests) and disease vectors pose some of the more acute and serious risks to agricultural production in PICTs. 154. The key impacts of changes in climate and climate variability in the agriculture sector could be identified as: Biophysical impacts physiological effects on crops, pasture, forests and livestock (quantity, quality), changes in land, soil and water resources (quantity, quality), increased weed and pest challenges, shifts in spatial and temporal distribution of impacts, and coastal land inundation. Socio-economic impacts 155. decline in yields and production of agricultural crops and fisheries, reduced marginal GDP from agriculture, fluctuations in world market prices, changes in geographical distribution of trade regimes, increased number of people at risk of hunger and food insecurity, and migration and civil unrest. Impacts on coastline and reefs: Many coral atolls and coastal areas in PICTs are less than 5m above sea level and will be easily inundated, given changes in rainfall 69 and prevailing winds. Moreover, salt water intrusion will affect agriculture, water supply and life in these islands long before they are inundated. The combination of increasing temperatures and sea level rise will result in changes to coastal circulation patterns thereby affecting nutrient supply, lagoon and estuary flushing, coastal erosion and ocean acidity (SPREP and PIFs, 2007). These will affect both the reef building capacity of corals as well as the spawning cycles of reef fishes and invertebrates. Increased incidences of ciguatera fish poisoning may also occur. Coral bleaching caused by rising seawater temperatures and ocean acidification is expected to increase, threatening reef survival, while the health and distribution of mangroves and sea grasses beds will change drastically given their interrelationships. 156. The projected effects of climate change on coral reefs are better understood than for other coastal habitats. Rising sea surface temperatures and more acidic oceans are projected to have increasingly severe impacts on the growth and resilience of hard corals. Combined with a rise in sea surface temperature, this is likely to cause serious physical and biological damage to reefs. Some reefs may also be so impacted by overfishing that they may not be able to recover from bleaching events in the future. For atolls, the disruption could be disastrous. The expected loss of structural and biological complexity on coral reefs will have profound effects on the types of fish and invertebrates associated with them. Species that depend for their survival on live coral for food and on the intricate variety of shelter provided by structurally complex reefs are likely to disappear. 157. Increases in temperature, sea level, storm intensity and turbidity of coastal waters due to higher rainfall, can be expected to affect the growth and survival of mangroves, sea grasses and non-reef algal habitats, and the nature of intertidal and sub-tidal sand and mudflat areas. These areas function as nurseries and feeding habitats for a wide range of coastal fish species. Reductions in coverage and structural complexity of mangroves and sea grass can lead to accelerated coastal erosion and also reduce the recruitment success for many species of fish and invertebrates (SPC, 2008; Gillett, 2009).The projected increase in sea surface temperature and alteration of the mixed layer thickness could also affect plankton productivity, which can be expected to affect fisheries productivity (Lal, 2004). 70 158. Rising sea level, over time scales of 100 years and beyond, will eventually make many of the existing ports and shore-based facilities unusable. 159. The present-day El Niño Southern Oscillation foreshadows some of the projected effects of climate change. During El Niño conditions, which are characterized by weakening of the trade winds and warming of the surface layers in the eastern and central Pacific, warmer waters can extend eastward into the central Pacific by nearly 4000 km. This increases tuna catches in the central Pacific and reduces them further west (Lehodey et al., 1997). Such distributional effects, with concentrations of skipjack and big eye-tuna likely moving further east than in the past, are expected to become more pronounced with projections for a more El Niño-like climate(Ref:?). 160. Given that coastal fisheries provide a significant source of food and income for coastal populations (most Pacific Islanders are coastal dwellers), degradation to coral reefs exacerbated by climate change has the potential to undermine food security in a region strongly reliant on fish as a source of protein and on the income derived from licensing distant water fishing nations to harvest tuna (Bell et al., 2009), thereby posing a serious threat to the livelihoods of Pacific people. They also have serious implications for the long-term viability of industrial fisheries and canneries. 161. Climate change is also anticipated to affect freshwater fisheries in the region. Increases of rainfall are expected to increase the extent and duration of inundation. The effects of increased flooding and higher water temperatures on the fish themselves, and on the vegetated lowland areas that support them, have yet to be determined. Freshwater fisheries throughout the region are based largely on species that migrate between the sea and freshwater. Small changes in rainfall or sea level will have major impacts on the ability of fish to move between estuaries and freshwater, lowering recruitment success. 162. Impacts on human health: Climate change may adversely affect human health. Higher average temperatures combined with increased climatic variability could alter the pattern of exposure to thermal extremes, with resultant health impacts. Cases of heat stroke and heat exhaustion may rise. Exposure to higher temperatures appears to be a significant risk factor for cerebral infarction and cerebral ischemia. Changes in the mean and variance of climate variables such as temperature and precipitation can alter the incidence and geographic range of many climate-sensitive infectious 71 diseases. Higher sea surface temperatures would favour phytoplankton blooms, which are excellent habitats for survival and spread of infectious bacterial diseases such as cholera. Waterborne diseases including cholera and diarrheal diseases caused by organisms such as Giardia, Salmonella and Cryptosporidium could also become common. The distribution of vector-borne diseases such as malaria is influenced by the spread of vectors as well as the climate dependence of the infectious pathogens, and changes in temperature and precipitation could favour malaria and dengue fever. More instances of diseases such as dengue fever, diarrheal disease, leptospirosis, cholera, influenza, fish poisoning (ciguatera), pneumonia and filariasis would be thus expected. While populations in most countries will be exposed to such hazards, the risks will be greater in lower income countries such as PICTs because the burden of climate-sensitive diseases is higher and their public health systems are weaker. Climate change rarely acts in isolation. Climate change may also increase underlying vulnerabilities, including the effectiveness of infectious disease surveillance and control programs, access to healthcare, educational levels, economic resources, equity, and social cohesion. Climate change acts to aggravate these and other stressors that affect population health. 163. Impacts on tourism: Pacific tourism is at risk from climate-change-related hazards such as cyclones, storm surge and flooding, and sea level rise, which can lead to erosion, transport and communication interruption, and reduced water availability. Another major concern for the tourism industry is the degradation of natural systems, such as coral reefs and forest ecosystems by climate change. Major damage is expected to impact coastal ecosystems which are already under pressure from overexploitation, pollution, deforestation, infrastructure development, loss of mangroves, conversion into agricultural land, and coral mining in PICTs (World Bank, 2000). Tourism can be expected to face climate change impacts associated with pressures on major ecological sites, and changes in weather patterns affecting the comfort level in tourist areas. For instance, sea level rise would disrupt the sector through potential loss of beaches, inundation, degradation of coastal ecosystems, saline intrusion, and damage to critical infrastructure. In many small islands, the tourism industry would also be sensitive to loss of coral reefs. Coastal retreat may be in the order of 15–20 m in certain locations by the end of this century (Feresi et al., 2000). Cyclone-related risks for tourism include disrupted transport, cancelled flights, stranded passengers and damage to the image of a safe and attractive destination. The risk of storm 72 surges could increase as a result of higher sea levels and changes in cyclone characteristics. 164. Tourism stakeholders and operators recognize environmental factors, such as healthy reefs and clear water, as essential for tourism. Climate change entails changes in precipitation patterns with wide implications for soil moisture and water availability, and as a result agricultural production and water supply for households and tourism. Water availability is a major concern during droughts, when there is potential for conflict over scarce water resources, as water is often relayed to hotels at the expense of the local population. 2.4.5 165. Response: Adaptation to Climate Change Impacts Building resilience through effective adaptation to climate change, climate variability and extreme weather events has been identified as a priority for PICTs, all of which agree that they are already experiencing adverse effects of climate change. Atoll states believe that their very survival is threatened. Lessons of the past must be taken seriously to avoid costly mistakes and prevent maladaption. For example, the removal of mangroves to ensure that fresh air flows through villages (Nunn et al., 1999) is blamed for the serious coastal erosion now faced in Moturiki in Fiji Island. Developments of infrastructure, farms and settlements have resulted in increased erosion and sedimentation that affect island ecosystems. The blasting and dredging of coral reefs and the mining of coral aggregate cause serious impacts on coral reefs and coastal areas and must be reduced, like the loss of wetlands and the overexploitation of marine fisheries. 166. Through the United Nations Framework Convention on Climate Change (UNFCCC) all Parties to the Convention must formulate and implement measures to facilitate adaptation to climate change (Art. 4.1b). It lists specific geographic domains in particular need of adaptation: coastal zones, water resources, agriculture and areas affected by drought, desertification and floods. 167. Vulnerability is a function of exposure to climate factors, sensitivity to change and capacity to adapt to that change. Systems that are highly exposed, sensitive and less able to adapt are more vulnerable and vice versa. Adaptation strategies therefore involve the identification of sectors, systems and regions vulnerable to change and increasing the capacity of those systems to cope. For over a decade, methods to 73 evaluate impacts of climate change, vulnerability and adaptation have been tested and used in the Pacific. Following the widespread drought in 1998, there was an upsurge in concern about adaptation to climate variability in addition to the concern with future change. Pacific nations are also committed to eradicating poverty and improving the livelihoods of their peoples while adapting. This must be facilitated by a multilateral framework that is responsive to the financial and technical needs of the PICTs. 168. The key ingredients of climate change adaptation in PICTs include: developing information and scientific understanding of climate change, facilitating improvements in decision making, quantifying the risks of climate change, quantifying the costs of mitigation and adaptation, and educating stakeholders of these risks and costs and practical ways to reduce them. 169. Eliminating government policies that suppress adaptation, facilitating recognition that climate change presents a significant and immediate challenge to economic development, and incorporating adaptation measures in development plans are also important. In order to do this, PICTs need to build public awareness of impacts and adaptation strategies, and capacity in negotiation, vulnerability assessment, and research. 170. A systematic approach is needed rather than activities carried out in isolation or in a piece-meal way. For example, by mainstreaming food security issues into budget decisions, strategic land use planning and related policy areas. Designing crosssectoral policies to support domestic food production (for example, incorporating agriculture, fisheries, water, trade-tariff policy, appropriate incentives, legislation and R&D), will facilitate mainstreaming. This must be followed by appropriate action at “grassroots” level. For example, strengthening of partnerships with farmers to provide them the best advice and guidance on issues such as crop varieties, soil and water management under changed environmental conditions, integrated pest management practices etc. 171. PICTs exposure to climate variability and extreme events is an important component of vulnerability. Both natural and social systems typically respond through increased 74 variability and extreme events before changes in the mean (or standard) condition become noticeable or significant. An integrated assessment of the adverse effects of climate change and associated sea level rise is critical for developing adaptation strategies in PICTs. Vulnerability assessments can: identify the extent and location of short term and longer term threats arising from climate changed, 172. illustrate the underlying vulnerability and adaptive capacity, assist in the identification and prioritisation of adaptation needs, guide and support appropriate response measures. Adaptation involves developing the ability to persist and change through a combination of precaution, reduction of vulnerability and maintenance of ecological integrity. Adaptation is warranted whenever either changes in mean conditions or changes in variability extend beyond the acceptable risks. Today, adaptation to the impacts of climate variability and change is one of the most urgent societal issues. It is increasingly clear that current agreements to limit emissions, even if implemented, will not stabilize atmospheric concentrations of GHGs to prevent changes in the short and medium term. Hence, adaptation must be integral part of managing the risks. Adaptation means enhancing resilience with the objective of allowing pre-impact systems, behaviours and activities to continue but introducing measures to minimise exposure to the new/heightened risks. A prudent approach to identifying appropriate adaptation measures begins by recognizing viable options which minimize risks and are cost effective in the face of uncertainties. 173. The central question is how to build adaptive capability (including scientific, technical and institutional) within the context of sustainable development. Regional adaptation planning requires coordination across all levels of government and the involvement of a variety of stakeholders (i.e. industry, scientists and community leaders). It must be informed by a robust analytical approach of the climate threat, accurate current data and viable, cost effective adaptation options. Prudent National Adaptation Strategies in PICTs could focus on: mainstreaming climate change in national and sector development planning; strengthening capacity of national institutions to merge environment and development frameworks; strengthening the capacity of PICTs to collect, interpret, analyse and store relevant data on weather and climate change factors on an ongoing basis; 75 prioritizing adaptation actions which have a direct bearing on the livelihoods of vulnerable communities, such as communication and warning systems; involving the private sector through providing incentives and encouraging corporate social responsibility; and integrating alternative livelihood strategies for extreme climatic events through national disaster management plans. 174. Although regional organizations and national universities are involved in adaptation to climate change in the Pacific, they’re knowledge and resources are not fully utilised, especially regarding linkages between environmental, conservation, agricultural and development sectors (FAO, 2008). 175. Limited access to technology, and institutional weakness, reduce the extent and effectiveness of adaptation. In the PICTs, institutional capacity and resources need strengthening to effectively: understand, and where possible, address uncertainties of climate change projections in impact assessments; promptly start to implement adaptation activities; monitor weather and relevant sectors on which adverse impacts are suspected including diseases and vectors, establish forecasting systems, and improve disease control and prevention; 176. plan, prepare and manage disasters; and provide rapid response to extreme weather events. IPCC established a Data Distribution Centre (DDC) in 1998, to facilitate the timely distribution of up-to-date scenarios of changes in climate and related environmental and socio-economic factors, for use in impact and adaptation assessment. Monthly averaged results from climate change simulations performed by a number of climate modelling centres are available. The available regional climate change projections as inferred from these data sets or those available in IPCC Assessment Reports highlight substantial uncertainty in the magnitude, distribution and timelines of climate change in PICTs. Better information on local climate change and its potential consequences is a key requirement for vulnerability assessment in PICTs as in most SIDS. Improving the local climate prediction skill in PICTs is difficult due to their size, unique geographical location and lack of real time observations over the surrounding Ocean. High resolution climate modelling advances and greater computing power 76 now allow regional climate simulations down to around 8 km resolution (Lal et al., 2008; relevant for some of the PICTs). Under the “Pacific Climate Change Science Program” (PCCSP) launched as part of the Australian Government’s International Climate Change Adaptation Initiative, CSIRO and BoM Australia have recently applied these dynamic modelling and statistical downscaling approaches to generate the future projections in climate and its extremes. In order for PICTs to be able to adequately use the available model ensembles to generate the climate projections at local level and sector specific impact assessment and vulnerability analyses, it is vital that staff and organisational capacity building be prioritise by PICT Governments. This can be achieved through technology (skills, information, knowledge) transfer initiatives in using collecting and using data and tools and understanding and using techniques for the development of climate change projections. 177. Capacity building among stakeholders is equally important as they are affected by climate change and live in areas of high vulnerability. They often have information, resources and expertise required for climate change impact and vulnerability assessment and policy formulation and implementation, and they control or influence key mechanisms for adaptation. They can also identify strategies for microadaptation and facilitate exchange of “best practice guidelines” and lessons learnt at the local level. 178. A flexible or adaptive management approach to formulating and implementing adaptation strategies, policies, and measures needs to be followed until country-level climate change projections and risk profiles are available for PICTs. The goals should primarily be reducing vulnerability and building of adaptive capacity in water use, agriculture, health, disaster risk reduction, use of natural resources and coastal zone management. This involves prioritising issues according to the level of risk they currently present while developing a timeline for addressing issues of lower priority. 179. PICTs view the impacts of climate variability, extreme weather events, climate change and sea level rise as impediments to sustainable development. Recognizing this, a Pacific Islands Framework for Action on Climate Change (PIFACC, 20062015) was adopted by Forum Leaders in 2005, which establishes an integrated approach to addressing climate change impacts in the region. SPREP has been mandated to work in cooperation with other regional and international agencies and bilateral climate change programmes to meet the needs of PICTs through the 77 strengthening of national and regional meteorological and climatological services, consolidating and distributing information on climate change, strengthening adaptation and mitigation measures, increasing PICTs capacity to engage in the UNFCCC, and securing additional financial and technical resources to do this. Subsequently, SPREP developed a PIFACC Action Plan to do this. The main practical benefits from this have been: PIFACC provides a regional mandate that supports implementation at the national level; PIFACC is used by some donors and regional organizations as high level guidance when deciding how they will assist the region; and some countries have used the PIFACC to guide preparation of national policies, plans or projects, in both development and climate change. 180. Other adaptation initiatives in the PICTs include the Pacific Adaptation to Climate Change Project (PACC) administered by SPREP. This is a regional adaptation programme which is now the main mechanism to share adaptation experience, pool expertise and leverage other initiatives. It draws on resources from the Special Climate Change Fund (SCCF) managed by the Global Environment Facility (GEF). The Pacific region lacks practical experience of climate change adaptation, particularly in the context of national development initiatives. Development initiatives have tended to be delivered in isolation and designed to address immediate needs and short-term government and donor imperatives. There is little appreciation of the practical implementation of adaptation measures as an integral component of overall national development. This results in limited adoption of adaptation measures, increases the likelihood of mal-adaptation and promotes inefficient use of development resources through projects that may not be designed to cope with even immediate changes in the climate. The PACC project focused on addressing water security, food security and coastal erosion in 13 PICTs. 181. Climate adaptation will be needed in a variety of ecosystems, including agroecosystems (crops, livestock, and grasslands), forests and woodlands, inland waters and coastal and marine ecosystems. Response options relevant for PICTs are: participatory identification of vulnerabilities and risk reduction measures, and implementation of community-based disaster risk reduction activities (e.g. early warning systems); 78 strengthening capacity of communities (and specifically farmers)to manage their resources (e.g. savings, credit schemes, agricultural inputs, agricultural production or land use); enhancing the use of technological options to manage climate risks (e.g. disaster information management system)building capacities of local institutions in support of national disaster management policy; advocacy by policy makers on natural disaster risk management and climate change; introducing the additional layer of accountability provided by the rights-based approach; and partnerships between regional and national research institutions, extension and outreach systems and “frontline” farmers/fishermen. 182. Adaptation for water resources: The options available to many small island countries in the Pacific for reducing the adverse effects of climate change on water availability are limited due to human and financial resource constraints. This implies that greater emphasis must be placed on improving overall water resource management, including inventory systems of available water resources and developing water allocation frameworks that will deliver rational and equitable allocation, including water for the environment. Implementation of more rainwater harvesting and storage methods, efficient leak detection and repair systems, use of water-saving devices, and water re-use and recycling options are strategies currently being implemented to address this challenge. Some countries may consider applying market-based allocation of water, which could result in less waste and more efficiency. Greater integration of management across sectors, engaging all stakeholders is required to ensure that the most appropriate management decisions are being made. Appropriate laws are essential, with adequate political and financial support for their implementation, to protect national water resources through sustainable consumption practices. Climate change should be factored into all National Water Management Plans developed. Installation of affordable sanitation systems and social programmes focused on behavioural change among coastal communities are needed to improve water quality and human health. 183. Adaptation for agriculture and forestry: Agriculture and forestry are not only vulnerable to climate change but could also be threatened by efforts to adapt to it. 79 The performance of agriculture and forest systems under stress depends on their genetic characteristics and the integrity of the broader ecosystem within which they are managed. Adaptation must combine development of improved crop varieties and animal breeds with the integrated management of natural resources needed to sustain their productivity and ensure they continue to provide the vital services needed by people and the environment. 184. Agricultural systems have shown considerable capacity to adapt to the climate in the past — changes in land management practices, crop and cultivar choice, and selection of animal species and technologies to increase efficiency of water use have all been used to change the geographic and climate spread of our agricultural activities. All of these activities could be deployed by farmers to respond to climate change, although as the degree of climate change increases the limits of this adaptive capacity will be tested. Adaptation measures in any given area need to be considered holistically, including trade-offs among biophysical and socio-political factors. An adaptive strategy could include the adoption of organic agriculture based on careful management of nutrient and energy flows, and integration of plants and husbandry, e.g. through agro-forestry and crop rotations. Climate change variables (e.g., day and night temperature extremes, intensity of rainfall, number of wet days and sea level) must be monitored for planning purposes. Long-term adaptation options could include changes in land-use to maximize yield under new conditions, application of new technologies and improved land and water management. Specific adaptation actions might include: seasonal changes and sowing dates, planting different varieties or species, improved irrigation, improved fertilizer and tillage methods, grain drying, erosion control, improved fire management, improved agro-forestry, and silviculture practices. Such methods have the potential to increase resilience to climatic stress, enhance the soil’s ability to retain or drain water and to sequester carbon, while increasing food production to meet the demands of expanding local and export markets. 80 185. Diversifying production systems and building on traditional practices will be crucial in enhancing community resilience. Some of the main adaptations required include the: collection, evaluation and distribution of crop and tree varieties and livestock breeds that can tolerate climatic extremes (drought, heat-stress, salinity); development and promotion of farming systems better suited to changing environmental conditions, such as traditional agro-forestry systems; and promotion of sustainable land and forestry management and land-use planning to minimize the projected impacts of climate change on agriculture and forestry, such as more regular inundation and soil erosion. 186. Agriculture and forestry policy options (SPC Policy Brief 7/2009) include encouraging diversification by promoting the use of a wider range of crop, tree and livestock species and varieties within different production systems; increasing awareness of the likely effects of climate change on agriculture and forestry, and the adaptations needed to maintain the benefits of these sectors; supporting research and development in the agriculture and forestry sectors and facilitate the sharing of information; implementing flexible land use, agriculture and forestry practices that can respond effectively to climate change; establishing monitoring and evaluation systems to determine the success of adaptation strategies. 187. Adaptation for fisheries: Climate change will force PICT fishing industries to diversify the ways they produce fish. Efforts to manage and reduce existing pressures on coastal and offshore fisheries will be critical to reduce the vulnerability of fisheries and habitats to climate change. PICTs need to address the following questions pertaining to impacts of climate change on fisheries: what are the impacts on key species and their habitats, how important are those impacts to the biology and productivity of the system, how will the fisheries impacts affect local communities and institutions, and what responses are available to resource users, managers and policy makers to deal with the impacts? 188. Responses could include moving towards ecosystem-based management of fisheries resources by incorporating enhanced understanding of climate impacts. Practical responses must be designed to be consistent with local capability, circumstances and best environmental and fisheries management practice. Climate information must be made available in communication products easily understood by workers 81 engaged in the fishing industry. Two potential adaptations to ensure that coastal fisheries continue to provide fish resources for food security include the use of lowcost, inshore fish aggregation devices (FADs) and pond aquaculture. FADs are designed to increase the likelihood of catching fish resources, however in areas where fish stocks are already at or close to maximise sustainable catch levels, their use must be adequately planned and implemented to not increase the fishing burden on overfished stocks. Similarly, the potential negative impacts from aquaculture activities will need to be avoided or mitigated if it is to provide a viable adaptation measure. 189. Integrated coastal management that takes into account future climate change could limit adverse effects and optimize food production opportunities. Strengthening the enabling environment (for example, legislation and policy adjustments, coordination among key stakeholders) and adaptation measures (by increasing investment in food sources) must start now. Immediate measures include improvement of shoreline defence system design, participatory risk assessment, grants to strengthen coastal resilience, redesign and rehabilitation of infrastructure, sea grass bed and mangrove restoration. 190. The challenge is to ensure that growing populations continue to have access to fish for food particularly in rural communities. In urban centres, fish products should be available at affordable prices. These and related issues are now being addressed by SPC through a comprehensive assessment of fisheries and aquaculture in the Pacific in relation to climate change to be finalized in late 2011. Initial recommended policy actions (SPC Policy Brief 5/2008) include: plan to diversify national food security, by installing and maintaining networks of low-cost inshore fish attraction devices for subsistence fishers; developing hatcheries to supply juvenile fish for small-pond aquaculture; and establishing infrastructure to store and distribute tuna landed by industrial fleets in urban centres to supply low-cost fish for rapidly growing populations; strengthen initiatives such as “Coral Reef Management” to reduce existing stresses on coastal fisheries (overfishing and degradation of habitat due to careless land use in adjacent catchments) to maximize the adaptive potential of these resources; 82 raise awareness among industry and communities of the changing environmental conditions and the need to diversify how and where they fish and, in the case of rural communities, how to produce and store other foods; establish monitoring programmes to assess the success of management methods aimed at adapting to climate change. 191. There is a need to understand the effects of ocean acidification on marine organisms, including ecosystem level impacts. Critical or keystone species within ecosystems or food chains that act as food sources should be a priority for research. Impacts from ocean acidification must be understood within the wider context of other real and potential threats such as from climate change and pollution as well as global trends in world fisheries. Ocean acidification is a rapidly emerging issue with likely severe impacts on organisms, ecosystems and food providing marine products in future. Therefore, priority should be placed on measures that reduce or eliminate all other stress-factors (i.e. sedimentation from artificial beaches, dumping of garbage on reefs, reef destruction, removal of mangroves and other coastal vegetation, discharge of polluted waste/sewage water, chemical use on and discharge from the mainland, adverse shipping activities etc.)Based on existing information, the following actions are judged necessary to address the risk of effects of ocean acidification: recognize the food security, economic and cultural importance of marine species and habitats that are being exploited; determine the vulnerability of fish-dependent human communities in terms of exposure, sensitivity and capacity to adapt to changes resulting from ocean acidification; identify species that are more flexible to change and which may encroach on habitats and survive in altered conditions and assess how these may affect ecosystems and food security; reduce other pressures on food fish stocks to provide the best chances of success through, for example, marine spatial planning or re-evaluating available resources and their usage; assess the options for development of environmentally sustainable aquaculture options using species that are resistant to higher acidity or can be kept in conditions of controlled reef structure; consider the positive and negative impacts of a chain of substitute habitats such as artificial reefs to provide the diversity of niches that are found in existing habitats. 83 incorporate the ramifications of ocean acidification and climate change into fisheries management tools; alongside efforts to further investigate the effects and consequences of ocean acidification, foster increased awareness of this issue through the media. 192. Adaptation for human health: Reducing current and projected health risks attributable to climate change is simultaneously a risk assessment and risk management issue. As the context varies with changing climatic conditions, along with changes in demographics, technology, and socioeconomic development, an iterative approach is likely to be most effective. Because climate change is a factor that exacerbates public health issues, policies and measures need to ensure that actions taken to reduce climate-related health risks support current programs to address health burdens and consider key uncertainties. 193. The primary health concerns associated with climate change are often already problems or at least emerging issues currently. Therefore, vulnerability and adaptation assessments should identify potential modifications to current and planned programs to reduce burdens of climate-sensitive diseases (such as by developing early warning systems). Determining where and how populations are affected by climate variability facilitates identification of the additional interventions that are needed. Conducting a national vulnerability, impact and adaptation assessment should focus on: the current state of climate-sensitive infectious diseases and groups, and regions that are particularly vulnerable; how the ‘burden of disease’ could change with climate change; the effectiveness of current programs and activities in addressing climatesensitive health outcomes; how planned programs and activities could address any additional burden of climate-sensitive health outcomes; 194. which additional public health interventions may be needed; and the estimated costs and benefits of action versus inaction. The key objective of the Pacific Umbrella Initiative on Pacific Islands Health for Sustainable Development, launched in July 2002 was improved health surveillance for all Pacific Island Communities. The expected outcomes include improved 84 identification of health threats, improved management of these threats, support to PICTs with health improvement plans, legislation and other initiatives and advocacy for health and for the importance of achieving health improvements. This initiative is likely to lead to improved preparedness to disease outbreaks, improved investigation capacity, improved access to diagnostic facilities, improved public health response to outbreaks, and limited spread of epidemics. Regional coordination of health surveillance components of this initiative is managed through the Pacific Public Health Surveillance Network (PPHSN) and the CROP Health and Population Working Group with implementation, where appropriate, by the Regional Exposure Prevention Information Network (EpiNet) Team and relevant organizations, in particular SPC Public Health Programme. This initiative includes training in public health surveillance and response, strengthening of national EpiNet surveillance and response teams, public health laboratory capacity building (training, equipment), and regional technical support for national EpiNet teams. Locally relevant policies, plans and legislation will be developed and local capacity enhanced to undertake priority environmental health work, to develop a regional approach to priority issues, to coordinate management of environmental health issues in the region, and to assist PICTs to fulfil international commitments. 195. Adaptation for tourism: In order to deal with impacts of climate change including extreme events on tourism, climate change should form part of wider risk management plans. While each resort should have some form of risk management, the governments should ensure a wider risk or disaster management plan is in place. Barriers to implementing such adaptation measures include data gaps on the vulnerability of tourism. Little has been done to raise awareness and understanding of how climate change and tourism interact, and what steps could be undertaken in terms of adaptation. Environmental Management Systems need to be simplified and made available to tourism businesses. There is a particular need for training architects and builders to incorporate climate proofing in the design process. Since the scope and costs for many adaptation measures are largely determined by the design of tourist facilities, the incorporation of these aspects into architectural courses is particularly important. Alongside information and education initiatives, governments can assist businesses in undertaking energy audits, facilitating the implementation of robust Environmental Management Systems, and providing incentives, for example for the uptake of renewable energy sources. To ensure the sustainability of the tourist industry, a strategy of protection of infrastructure 85 combined with planned retreat may be effective and appropriate. One goal could be to maintain a limited beach area to sustain the vital tourist industry, specifically by building and use of artificial nourishment, though the latter measure may require external sources of sand and could have negative environmental impacts. 2.4.6 196. Response: Mitigation of Climate Change by Carbon Sequestration and GHG Reduction Neither adaptation nor mitigation will be successful if implemented independently, but both need to be part of an integrated framework for sustainable development of PICTs (Challenger, 2002). 197. Agriculture and Forestry & REDD+: Forestry and agriculture programmes by PICTs can play an important role in climate change mitigation, either by reducing emissions or by sequestering carbon. Forestry resources in larger PICTs represent important carbon sinks. Many of the technical options are readily available and could be deployed immediately, such as reduction in the rate of deforestation and forest degradation, adoption of improved cropland management practices (reduced tillage, integrated nutrient and water management), reducing emissions of methane and nitrous oxide through improved animal production, management of livestock waste, irrigation water and nutrients, and sequestering carbon through conservation farming practices, improved forest and grassland management (afforestation and reforestation, agroforestry) and restoration of degraded land. 198. Financing mechanisms for afforestation/reforestation under the Clean Development Mechanism (CDM) and the proposed Reduced Emissions from Deforestation and Degradation (REDD) and voluntary markets could assist PICTs to increase and maintain these vital carbon stores. However, there are challenges in accessing carbon financing. Generating sufficient carbon credits to overcome the significant transaction costs is difficult in small countries. Mechanisms also need to be established for resource owners to receive the intended benefits. 199. Three PICTs (Fiji, Vanuatu, Solomon Islands) are leading the implementation of REDD activities. Fiji has developed its Forestry and REDD policy. All forestland in Vanuatu is owned by indigenous landowners with a culture of maintaining forests as a natural resource. With the drivers of deforestation and degradation expected to increase, it is time to take preventative action to maintain Vanuatu’s forest carbon 86 stocks in the long term. Vanuatu sees benefits from this not limited to reduced carbon emissions, but to its standing forest stocks, carbon sink capacities, and more general revenues from moving towards a low-carbon economy. This goal seems achievable in reasonable time given its low emissions profile, political willingness, and manageable land size. Maintaining Vanuatu’s forest resources is important both for climate change mitigation and adaptation. Intact forests act as general buffer to reduce climate change impacts, such as increasing rainfall intensity, droughts (El Niño), and increasing cyclone activity. 200. The Climate-Compatible Development Strategy for PNG (CCDS) was released in March 2010 by the Department of Environment and Conservation (DEC). It was compiled in conjunction with three Government working groups, the REDD+, Adaptation and Low-Carbon Growth Working Groups. The Forestry and Climate Change Framework for Action 2008-2015 (FCCFA) was prepared by the PNG Forest Authority (PNG FA) in 2009 and has now been approved by the National Executive Council. The FCCFA reconfirms the proposed funding structure to REDD+ in PNG whereby donor funding will be used to initiate REDD+ policies and programs until a UNFCCC compliance market is established. The legal process for negotiating rights to forests in PNG is established in the Forestry Act 1991, and involves the Government negotiating timber rights with landowner groups through Forest Management Agreements (FMAs). The FMA process allows the Government to gain ownership of timber rights and to deal with third parties (developers) on behalf of the landowner groups. This policy decision corroborates the National Climate Change Policy Framework in claiming government ownership of REDD+ carbon benefits. 201. The Solomon Islands is a partner in the UNREDD Programme which provides it with observer status at the Policy Board of that programme. The Solomon Islands has also developed a REDD pilot project/demonstration activity on Tetepare Island, to gain carbon finance through the voluntary carbon market to protect the 12,000 ha of indigenous forest of this island in the long term. This project is in the process of preparing the Project Description Documentation (PDD). The goal is to gain certification from both the Voluntary Carbon Standard and the Climate Community and Biodiversity Standard. 202. Energy: While CO2 emissions are expected to increase in the future with the growing transportation and power generation in PICTs, some PICTs have promising potential 87 to reduce GHG emission by switching to renewable electricity generation and implementing energy efficiency measures. 203. Table 2.15 (compiled in 2004) shows the projected savings. Since 2004, fossil fuel consumption in most countries has increased, along with a small increase in renewable production. There is an urgent need for the region to increase the utilization of renewable energy. A concerted effort by public and private enterprises is required to achieve an energy-secure Pacific. Table 2.15: Projected energy demand for some PICTs, GHG reduction potential through RE and EE. GHG Emissions and Potential Savings After a Decade: Adjusted to Projected Energy Demand Country Projected Baseline Emissions in 10 years Potential Annual GHG Savings CO2 (Gg) Year Gross (Gg) Adjusted (Gg) Cook Islands 42.9 2013 13.1 Fiji 1487 2010 FSM ~168 Kiribati Relative Savings from Renewable Energy and Energy Efficiency RE (Gg) % of total EE (Gg) % of total 13.1 Adjusted as % of Baseline 31% 11.0 84% 2.1 16% 966 504 52% 467 93% 37 7% 2012 23.9 23.9 14% 16.8 70% 7.1 30% 72.2 2013 26.5 26.5 37% 24.5 92% 2.0 8% Marshall Is 400 2013 22.3 22.2 6% 8.0 36% 14.3 64% Nauru 46.9 2013 16.6 16.6 35% 2.8 17% 13.8 83% Niue 8.7 2012 1.08 1.08 12% .064 59% 0.44 41% Palau 441 2013 49 49 11% 12 24% 37 76% PNG 2423 2011 1586 1013 42% 1010 >99% 3 <1% Samoa 357.3 2013 96.1 96.1 26% 83.9 87% 12.2 13% Sol. Islands 313 2012 121 121 39% 108.8 90% 12.2 10% Tokelau 1.3 2013 0.22 0.22 17% .015 68% 0.07 32% Tonga 121 2010 34.5 31.6 26% 28.3 90% 3.3 10% Tuvalu 14.0 2013 2.2 2.2 16% 0.8 36% 1.4 64% Vanuatu 155.7 2013 109 93.6 60% 108 99% 1 1% (Source: PIREP, 2004) 204. Renewable-based mini-grid standalone energy generation systems are increasingly being employed in the region. The cost effectiveness of electricity generation 88 systems in the PICTs suggests that renewables could become more attractive as fuel prices escalate. Following are some of the renewable energy resources that are of interest in the region: solar: plentiful throughout the region (stand alone and grid-connected systems), wind: some areas have higher potential than others, but assessment data is scarce, small-scale hydro: great potential in some countries, biomass: abundant, technology available includes bagasse, gasification and improved stoves, biofuel: high potential in larger islands; Coconut oil electrification attractive in some places; supply chain issues, geothermal: large potential in PNG (~60 MW at present), some in Fiji (being explored), ocean thermal energy conversion (OTEC): potential but expensive and not really suitable for small countries, 205. wave and tidal: potential but technology still being developed. In order to make renewable systems sustainable, it is important that a pool of trained personnel is available in the region. Adequately trained staff are required to plan, design, construct, operate and maintain the systems. The University of the South Pacific currently offers a renewable energy training programme. A recently agreed US$ 2 million Korean government grant will allow USP to offer scholarships to member countries and install a 54 kW Grid connected solar system. 206. The Pacific Islands Greenhouse Gas Abatement through Renewable Energy Project (PIGGAREP) is a GEF-funded five-year regional GHG mitigation project that started in 2007, coordinated by SPREP and UNDP. Eleven PICTs are participating in the project whose major aim is to reduce GHG emissions by 33% by 2015, through the removal of barriers to the widespread and cost effective use of renewable energy (SPREP, 2003-2009). The project is expected to bring about an: increased number of commercial renewable energy applications, expanded market for renewable energy, enhanced institutional capacity to design, implement and monitor renewable energy projects, 89 financing for existing and new renewable energy projects, strengthened legal and regulatory structures in the energy and environmental sectors, and 207. increased awareness and knowledge on renewable energy. Tourism: Tourism is not only affected by a changing climate requiring adaptation initiatives, tourism also contributes substantially to climate change by its consumption of fossil fuels and the resulting greenhouse gas emissions. PICTs need to enhance understanding of climate change issues associated with tourism, in particular the range of potential impacts and mitigation measures, including energy efficiency and reduced consumption, raising tourist awareness and encouraging behaviour change, and engaging the tourism sector in assisting with adaptation and mitigation measures. Using appropriate building design along with more environmentally sustainable behaviour of tourists could help to minimize energy use. Potential energy saving initiatives that could be employed include reducing the consumption of hot water (laundry and showers), reducing the hot water temperature settings, use of photovoltaic and wind energy systems for lighting and water heating, energy efficient lighting (efficient globes, motion activated lighting), and room-key operation of electrical appliances in guest rooms. 90 3 STATE AND TRENDS OF THE ENVIRONMENT 3.1 LAND 208. Land accounts for only 2% (550,000 km2) of the region’s total area of approximately 30,000,000 km2. The largest of the PICTs is PNG with 84% of the region’s land area. Seven islands have land areas of over 700 km2 each. Fifteen PICTs are either made up wholly or largely of atolls and coral islands. Others have a combination of high volcanic islands and atolls, or only high islands (e.g. Samoa, Wallis & Futuna) (South et al., 2004). The scarcity of land-based resources in many PICTs, particularly in the atoll PICTs, has placed more pressure on the resources of the oceans to sustain people living in these islands. 209. Loss of land associated with sea level rise and storm surges is a major concern throughout the PICTs. Even in the higher and larger islands, the loss of land in the coastal areas can be serious. In the atolls, where the average height of the landmass is less than 5 m, the loss of land means catastrophic changes. Already the effects of higher sea level, frequent storm surges and unsustainable coastal development are becoming evident in cultural sites such as burial grounds that are along the coastline. Land loss due to coastal erosion and salt water inundation is thus a sensitive issue in PICTs. The loss of territory will impact heavily on their economic and subsistence needs. Existing land legislation does not address the impacts of increased extreme events and climate change on lands (Chamber 2010). 210. The total arable land in the Pacific is 55.88 km2 or about 1% of total land mass. Land tenure in the Pacific plays a crucial role in land use. Improper and unsustainable land uses are often practised, with land users often motivated by short term benefits rather than long term sustainable use. There is a lack of awareness in local communities of their role in maintaining the quality of their lands for future generation. High population growth rates lead to unsustainable intensification of land use. The availability of arable land is also hindered by customary land disputes and urbanisation. Improved land use planning is therefore very important (See Table 3.1). 91 Table 3.1: Land-use in some of the Pacific Island Countries and Territories with available data. Country Cook Islands Fiji Islands Marshall Islands Micronesi a Nauru Niue Palau PNG Samoa Solomon Islands Tonga Tuvalu Vanuatu Total Arable land (sqkm ) 40 Permanen t crops Permanen t Crops (sqkm) Permanen t Pastures Permanen t Pastures (sqkm) Forest& Woodlan d Forests & woodland s (sqkm) Othe r land Other Land (sqkm) 8% 20 0% 0 68% 160 7% 16 2001 20 5% 44% 851 80 10% 22% 1746 40 65% 0% 100 000 0 20% 23% 3674 41 40 46% 320 16% 110 N/A 0 33% 232 2.84 30 40 2247 0% 15% 4% 1% 0 40 20 6500 0% 4% 7% 0% 0 10 30 1754 24% 54% 0% 64% 5 140 0 294370 3% 15% 80% 54% 600 180 24% 2% 690 590 1% 1% 20 400 47% 75% 1344 21720 6% 21% 0.65 40 369 15797 0 177 6006 150 0 200 5588 15% 77% 7% 2% 110 20 850 10440 5% 0% 5% 1% 40 0 420 4571 5% 0% 56% 62.8% 40 0 4400 332194 54% 23% 52% 33% 407 6 6319 17559 0 (Source: Adapted from FAO/UNDP Consultancy Report; Boydell, 2001) 211. Clearing land on steep slopes for growing crops or for commercial forestry continues to result in soil erosion or even land slips. The key causes of land degradation include poor policy and governance, perverse economic incentives, changing weather patterns, increasing human populations and a host of other complex interactions between the socio-economic and bio-physical processes. As a result of rapid population growth, urban drift, weak institutional capacity and political instability an increasing number of Pacific Islanders lack the support of formal land policies, laws and institutions to protect their interests in preserving their land. Uncertainty over land tenure is also proving to be a constraint to economic development and can be a source of tension and conflict. 3.2 FRESH WATER 212. Water availability differs dramatically across the region. Parts of large, high, volcanic islands reliably receiving over 10 m of rainfall annually and annual run-offs in excess of 2000 mm (Hall, 1984), while several atolls have no significant surface or 92 groundwater resources and highly variable rainfall patterns (Table 3.2). While rainfall runoff may be high across several of the larger islands, the infrastructure is generally not in place to capture, store and distribute and the water efficiently. Table 3.2: Water resources of Pacific Island Countries and Territories. Country Cook Islands Federated States of Micronesia Total Renewable Water Resources Mm3.yr‐1 56 2,034 28,600 Fiji 21 Kiribati Marshall Islands Nauru Niue Palau PNG 1.6 ‐ 132 1,160 801,000 Samoa 1,328 Solomon Islands 44,700 401 Tonga 1 Tuvalu Vanuatu 9,970 Average Rainfall mm.yr‐1 (range1) Rainfall Variation2 (%) Water Use Mm3.yr‐1 Total Rainfall Mm3.yr‐1 2,040 (1,574 ‐ 3,063) 4,115 (3,028 – 5,000) 19 4.4 140 SW, GW,RW na 2,900 SW,GW, RW, D 3,040 (2,000 – 10,000) 2,000 (1,000 ‐ 3,200) 3,378 (2,000 – 4,000) 2,167 2,180 3,784 2,375 (1,000 – 8,000) 3,000 (2,500 – 6,000) 3,028 (2,000 – 4,500) 2,062 (1,620 – 2,450) 2,850 (2,737 ‐ 3,498) 2,338 (1,400 – 4,000) 26 70 56,000 SW,GW, RW 49 na 1,600 GW, RW, D 16 1.7 610 RW, GW, D 54 12 15 0.4 0.002 5.5 71 46 570 1,700 1,100,000 D, RW, GW GW, RW SW, GW, RW SW, GW, RW 20 12.4 8,400 SW, GW, RW Na 92,000 SW, GW, RW Na 1,300 GW, RW 22 0.2 74 RW, GW, D 12 29,000 SW, GW, RW 1 Primary Water Resources 2 Notes: The range refers to the variability of averages across a country, rather than year to year variability; Annual rainfall variability (defined as standard deviation divided by the mean annual rainfall). SW = Surface Water; GW = Ground Water; RW = Rain Water; D = Desalinator 213. (Source: UNEP, 2011). Typically, the high rainfall and high runoff on Pacific high volcanic islands leads to rapid flow responses in steep valleys and flash flooding on fringing coastal plains. The limestone and coral islands and atolls generally have limited or no surface water and are communities here are reliant on a combination of rainwater and limited fresh groundwater lenses to meet water needs. Exceptions to these generalizations 93 include the drier Port Moresby area in PNG and the large groundwater lens under Niue. 214. Availability and reliability of water resources limits economic and social development in PICTs, many of which rely almost entirely on a single source of supply, such as groundwater (Kiribati), rainwater (Tuvalu, northern Cook Islands), surface reservoirs, or rivers and other surface flows. Quantities of water use and its long-term sustainability have always been a problem but are predicted to get significantly worse as a result of depleted resources, mismanagement and poor governance. Water supply in the atoll states of the Pacific is most vulnerable to precipitation patterns and changes in storm tracks. Captured rainwater is stored in cisterns; the only backup reserve for these islands is a thin wedge of fresh groundwater that sits on top of the deeper saltwater lens. A decline in rainfall coupled with sea level rise cause not only a decrease in the volume of available potable water but would also reduce the size of the narrow freshwater lens. 215. Owing in part to lack of surface water resources (in countries such as Tonga and Kiribati) or limited to no potable groundwater (Tuvalu and Nauru), much of household water and irrigation in PICTs is reliant on rainfall collection. This dependence on rain collection means that many communities and even entire countries are highly vulnerable to rainfall variability, with many countries currently experiencing frequent droughts (Falkland, 1999). Increased variability in rainfall patterns, particularly increases in frequency and severity of drought periods, significantly increases the freshwater vulnerability of islands relying predominantly on short-term rainfall for the majority of water resources. There is limited water collection and storage infrastructure in the region due in part to abundant rainfall in many countries and low investment in water infrastructure in other areas. Notably, household rainwater collection has been identified as the water supply technology most vulnerable to climate change (Howard et al., 2010). 216. Rainfall across the Pacific is strongly influenced by the El Niño - Southern Oscillation (ENSO) phenomenon, which drives wet–dry cycles. More specifically, ENSO has a strong influence on rainfall patterns in the tropics and low-latitude regions of the southern Pacific. ENSO describes the state of the equatorial Pacific Ocean - the position of warm and cool water, the strength and direction of winds, atmospheric pressure gradients, and the location of convection (cloudiness and associated 94 rainfall). The Southern Oscillation refers to the shifting pattern of air pressure between the Asian and east Pacific regions known as the Walker Circulation. ENSO has three phases; La Niña, El Niño, and neutral and due to the complexities of the land-ocean interactions across the Pacific, no two El Nino or La Nina events are exactly the same. Indicators of the ENSO serve as a guide to the chance of receiving more or less rainfall in a given season. 217. During El Nino events, sea surface temperatures in the central and eastern Pacific Ocean are warmer than normal and trade winds (easterlies) are usually weaker than normal. El Nino events in the Pacific are associated with significantly reduced rainfall patterns. During the 1982–1983, 1988-1989 and 1997-1998 El Nino events, rainfall in many parts of the west Pacific was a mere 10–30% of the long-term mean. ENSOrelated droughts are known to occur in the low-lying atolls of the tropical Pacific. El Niño events have resulted in water shortages and drought in American Samoa, Fiji, Kiribati, Marshall Islands, FSM, PNG, Samoa and Tonga, with corresponding threats to food security and serious impacts on economies in these countries (UNESCAP, 2007). However, ENSO events typically increase rainfall and storm activity for central PICTs including Tuvalu and western Kiribati. 218. A La Niña event is the dry phase in this pattern across the central PICTs but often causes increased rainfall in the southern ones. Sea surface temperatures in the western Pacific are often warmer than normal while sea surface temperatures across the central and eastern tropical Pacific Ocean are cooler than normal and trade winds (easterlies) are usually stronger than normal. 219. There is considerable uncertainty about future changes in the ENSO cycle due to global warming; most models suggest a slight shift towards El Niño type conditions occurring more frequently (IPCC, 2007). Thus, in countries such as FSM and the Marshall Islands, where rainwater is the main source of supply, more frequent and intense ENSO events will impose further stress on already meagre water resources; while other islands in the central and eastern tropical Pacific should experience heavy rains. 220. The amount of water available on atolls and limestone islands in thin fresh groundwater lenses is a complex balance between recharge, exchanges with seawater and extraction for use. Often the limited availability of fresh water will lead 95 to potable use of brackish groundwater, such as the high chloride water used as a potable source in Kiribati (Falkland, 1999). Many of these lenses are very sensitive to rainfall variability, shrinking during low rainfall periods, and are also particularly vulnerable to salinisation as a result of over pumping (Falkland, 1999). 221. Shallow fresh groundwater lenses are also particularly sensitive to overuse. Overextraction of groundwater resources has resulted in rising salinity in Kiribati, Marshall Islands, Cook Islands and Fiji (SOPAC 2001, 2004. 2005). While many of these lenses may recover rapidly with fresh rains and cessation of over-pumping, some resources may be impacted for several years beyond the cessation of over-extraction (Falkland, 2003). 222. The highly porous nature of the sandy, calcareous and volcanic soils commonly found in PICTs leads to high groundwater recharge rates, but also makes many groundwater resources vulnerable to pollution from septic tanks and agriculture. Nationally significant aquifers in Majuro (Marshall Islands) and Tarawa (Kiribati) have been compromised by septic tank seepage from densely populated urban areas over shallow aquifers (Falkland, 2002). As well as compromising shallow aquifers, faecal waste from humans and animals (mostly pigs and cattle) pollutes surface waters and water supplies in nearly all PICTs. Eutrophication of waters from these nutrient sources, along with agricultural chemical pollution, has been identified as the major environmental threats to Pacific aquatic ecosystems. Agricultural chemical use increased significantly from the mid-1990s in the Pacific region and continues to be a threat to water supplies and ecosystem health (McIntyre, 2005). Mining discharges and industrial wastewater are also significant pollution sources. Sediment loads arising from deforestation, mining and agriculture are also a significant threat to ecosystems and water supplies. 223. The very low proportion of rain water use in large island countries such as Fiji and PNG (see Table 3.2above) reflects the difficulty of capturing water in the high yield catchments of these islands. Access is further complicated by challenging geological conditions, such as those that contributed to the Ok Tedi tailings dam collapse in PNG (The World Bank, 2000). This lack of adequate infrastructure such as reservoirs and water distribution networks in most islands has led to water shortages hindering development, and causing water stress during times of drought (UNESCAP, 2008). 96 Increases in demand related to population and economic growth (in particular, tourism) continue to place serious stress on existing water resources. 224. The low water extraction from many of the large island river systems generally means that river flows are not significantly altered. Some exceptions to this include areas of significant land clearance. However, as hydropower and drinking water supplies are being developed regionally, flow regimes are being changed significantly to provide year-round supply. Low flows may suffer as a result, such as in Rarotonga (Cook Islands) where a high proportion of the total flows are being redirected to potable water supplies. Little assessment has been undertaken on the ecological impacts of these altered flow regimes. 225. Efficiency of water use in PICTs varies depending upon the context of the island hydrology and supply system. Typically leakage losses within water supply systems are as high as 50% and potentially limit development in countries with existing supply systems reaching their capacity (Falkland, 1999). Water use efficiency practices are limited in many PICTs due to the perceived abundance of water and the social complexity of introducing efficiency measures (SOPAC, 2005). 226. A challenge for water resource managers is the common practice of using high quality water where lesser quality water may be appropriate, such as toilet flushing using the limited rainwater in Tuvalu and desalinated water in Nauru. This can be compared with Vava’u in Tonga, where rainwater is complemented by piped groundwater, and most houses have dual access to enable use of the most appropriate resources. The use of alternative water sources (sources other than surface water catchments, groundwater and rainwater) is not well developed in many Pacific countries. This is likely to be in part due to traditional high rainfall in many PICTs, and limited water infrastructure. The two main alternative sources, desalination and brackish groundwater, have generally developed due to a lack of traditional sources, or high localized demands that cannot be met by existing infrastructure. 227. Desalination provides significant amounts of water in Kiribati and Nauru, and to a lesser extent in Tuvalu. Brackish groundwater has also been developed in Kiribati and Nauru to supply drinking water and household needs. Desalination on larger, wetter islands tends to have developed in high value commercial sectors (e.g. 97 tourism in Nadi, Fiji) to alleviate local water supply pressures. Access to safe drinking water supply and sanitation are fundamental to reducing disease and improving living conditions. Despite significant efforts to improve sanitation and drinking water access in the Pacific, overall access to sanitation (53% of population) and drinking water (50%) remains low (Joint Monitoring Programme, 2010). Whilst several countries have made good progress, the Pacific as a whole is not on track to achieve the Millennium Development Goals for drinking water and sanitation. Although less populated countries such as the Cook Islands, FSM, Niue, Tonga and Tuvalu had high coverage, the low coverage of PNG, which alone represents three-quarters of the region’s population, pushes the regional average to levels comparable with those of the least developed regions. Adding to this, rapid population growth, increasing urbanization, damage to water catchments resulting from deforestation, poor waste management practices leading to water pollution, and climate change are expected to exacerbate the challenge of providing access to safe water. Groundwater is being depleted by the increasing demand of industries, while increased chemical pollution is threatening its quality. By 2025, at least one third of PICT populations may live under water stress. 228. The low rates of improved sanitation and contamination of water supplies are consistent with elevated rates of waterborne diseases compared with Pacific developed countries such as Australia (SOPAC and WHO, 2008), including outbreaks of diarrhoea, cholera, hepatitis and typhoid in the recent past. Notably, there is a reasonable negative correlation between improved drinking water access and diarrhoeal DALYs (Daily Adjusted Life Years: a WHO measure of the loss of life and quality of life associated with diseases). Figure 3.1 shows the access to sanitation services across several PICTs and Figure 3.2 shows access to drinking water resources. 98 Improved Sanitation Access 100 100 100 100 96 80 84 72 71 67 Percent Coverage 60 51 50 45 40 33 32 25 20 0 Figure 3.1: Sanitation Access in PICTs. (Source: Joint Monitoring Project on Water Supply and Sanitation, 2010) Improved Drinking Water Access MDG On Track not on track Diarrhoea DALYs 1128 100 100 100 100 97 96 94 94 90 1000 88 88 80 769 800 70 65 60 583 600 47 435 40 408 40 400 297 253 192 20 206 227 236 169 200 67 30 0 0 Figure 3.2: Drinking Water Accessibility and Diarrheal DALYs in PICTs. (Source: Joint Monitoring Project on Water Supply and Sanitation, 2010) 99 DALYs per 1 000 population 82 751 Percent Coverage 1200 229. About 90% of diarrhoeal diseases can be attributed to lack of sanitation systems, high levels of unimproved drinking water and poor hygiene practices (WHO, 2008). The overall health impacts may be even higher, with an indirect influence of these risk factors on many other causes of death (Prüss-Üstün A et al., 2008). 230. Land availability and tenure provide a significant challenge in providing access to water for public supply and sanitation as well as agricultural and industrial development (UNESCAP, 2010). In PICTs, the complex land tenure frameworks combined with high population densities and limited land creates particular impediments to systematic water management in the low coral islands and atolls. Even in larger islands, obtaining adequate land access can be a barrier for public infrastructure projects. 3.2.1 231. Response: Reducing Pressures on Freshwater Resources and Improving Sanitation There are significant differences in hydrology and ecology between volcanic (high) and low-lying islands, as well as differences in social, economic and climatic drivers between countries and islands. Therefore, the largest unit that is suited to a consistent approach is a country level, due in part to shared culture and consistent governance framework. It is recommended that a country-based approach be pursued in management of water resources and for addressing water resource development. Whilst programmes and projects may necessarily operate regionally to provide critical mass on resourcing, individual strategies are required for each country, and commonly at an island or island group level, to support development and or redevelopment of water resources which reflects inherent vulnerability. 232. Of the PICTs, only Vanuatu has water resource management legislation and only Samoa has a National Water Policy. Draft legislation and policies are in place in approximately half of the PICTs (SOPAC, 2007), however, many countries have struggled to enact bills or adopt formal policies. This must be supported by high-level engagement to ensure political commitment to developing, formally adopting and implementing sustainable policies and legislation. 233. Consistent technical management of water resources continues to be one of the greatest challenges to addressing regional water resource vulnerability. The isolation of many islands, combined with limited local staff resources means that islands and 100 countries in the region struggle to develop and retain a sustainable level of technical and management capacity. Monitoring of precipitation patterns and developing short, medium and long term forecasts of precipitation is vital to enable effective management of water resources, which are vital in such areas as agriculture, sanitation, urban drinking water supplies etc. Long-term strategies to address this institutional weakness are fundamental to developing the sustainable management capacity in the region. 234. Improving efficiency of water use is crucial to achieving and maintaining basic human needs on the most stressed islands and supporting sustainable development elsewhere. This area would benefit from the application of strategic cost-benefit analyses, to drive efficiency programmes, together with high-level political engagement. 235. Delivery of Integrated Water Resources Management (IWRM) within a model adapted to the Pacific is critical to sustainable water and sanitation management. However, incorporating it within existing legal and community governance structures presents considerable challenges. The challenges include community empowerment and establishing a framework that recognises and works with the existing gender roles in managing water, where women are often responsible at a household level, whilst men are responsible for land and infrastructure decisions (Crennan, 2005). The sustainability of water supplies depends on the community’s sense of ownership, so women and vulnerable stakeholders need to be involved in decisions about water management. Ensuring communication and knowledge exchange across government agencies, the private sector and communities, is critical in delivering strategies that require these stakeholders to work in an integrated manner. Ideally, water management plans should address the inevitability of climate variability so that drought events do not necessarily require emergency response (SOPAC, 1999). This necessitates adequate hydrological data for analysis and design, as well as financial resources. But there is a significant lack of national capability for conducting water resource assessments in the South Pacific countries, and capacity building is needed. 236. The low delivery level of improved drinking water and sanitation into several countries, together with the water resource stress evident in low-lying countries, supports the need for investment in infrastructure. The necessary investment is likely 101 to be at a household or community level in low-lying islands, and probably a combination of household level and centralised infrastructure on larger islands. Utility reform associated with cost-recovery and improved efficiency and aligned with infrastructure investment, mainstreaming IWRM and infrastructure management and maintenance would enable countries to maximise development opportunities associated with water resources, better meet basic human rights and the Millennium development goals. 237. Currently there is minimal feedback nationally and regionally on progress towards addressing major water resource issues. Indicator frameworks are required at national and regional levels to provide critical feedback to decision-makers on the success (or otherwise) of policy decisions and implementation. These frameworks need to be integrated to optimise the value obtained from the information transfer from the local to the global level. 238. Greater networking, information exchange and collaborative approaches at a subregional and regional level would enable progress to be built on the collective work of several countries addressing similar issues, such as sanitation and household drinking water safety planning. Whilst ad hoc initiatives are addressing these on an issue-by-issue and site-by-site basis, utilising regional bodies to coordinate efforts offers a more efficient and cost-effective use of limited resources. 239. Fresh water and sanitation concerns need to be more effectively addressed in many PICTs, especially in atolls. New approaches must be promoted through training and public awareness. For example, composting toilets are appropriate particularly on coral atolls where the soil is porous and in delta or floodplain areas where the groundwater levels are high. They are cheap to purchase and install and have low maintenance costs (Easter, 2010) however there are likely to be significant cultural issues to overcome before being successfully adopted. 240. Several key areas of research may offer opportunities for improving the regional status of water resources and management. These include improvements in rainwater harvesting and storage (considering both traditional and innovative options); management and appropriate technology options for the whole island water cycle; optimising use of rainwater, surface water, groundwater (including brackish resources) and wastewater; assessing the role of desalination in both every day 102 supply and emergency situations; and developing governance and management frameworks that suit the technological solutions and the unique Pacific socioeconomic environment. Among the most widely used coping strategies are measures taken by individual households to conserve freshwater supplies and seek substitutes. 241. Finally, the good initiatives originating in many countries, particularly via the European Union (EU) and Global Environment Facility (GEF) Pacific IWRM Projects, need to be recognised and supported, both to build capacity and to develop the most appropriate solutions to many of the problems facing the region. Examples of these are numerous, but include the integration of rainwater, sanitation and groundwater resource management on Nauru and Fongafale to balance the critical freshwater resources, sanitation needs, alternative water sources and protecting vulnerable ecosystems. 3.3 ECOSYSTEMS 242. Pacific ecosystems include all natural and “cultural” terrestrial, freshwater and marine ecosystems and habitat types found on and around the islands and the ecosystem services they provide. These variety of ecosystems found in PICTs is illustrated Table 3.3 which is a simplified ecosystem classification system. Table 3.3: Terrestrial, freshwater and marine ecosystems of the Pacific Islands (*mangroves are listed as both terrestrial and marine ecosystems). Terrestrial & Freshwater Ecosystems Lowland Native Forest Marine Ecosystems Upland or Montane Rain Forest Mature Fallow Forest Plantation Forest Grassland/Woodland Scrubland/Scrub‐Fern lands Shifting Agricultural Land Permanent/Semi‐permanent Agricultural Land Plantations Pasture House yard/Urban Gardens Intensive Livestock Holdings Ruderal Sites Wetlands/Swamps Rivers/Streams/Lakes/Ponds Fishponds/Aquaculture Mangroves Estuaries Intertidal Zone Lagoons/Bays Fishponds/Maricultural Areas Coral Reefs Island Shelf/Reef Platform/Ocean Floor Open Ocean 103 Mangroves* Coastal Strand Vegetation Beaches and Dunes Bare Rock Caves Built/Urban (Source: Adapted from Thaman, 1994) 243. The extensive areas of tropical moist lowland and montane rainforest and cloud forest on the larger islands of the region, particularly in the west, have extremely high levels of biodiversity. The major threats to these forests are hunting, logging, mining, road construction, shifting cultivation and commercial plantation, such as the expansion of oil palm plantations in Solomon Islands and PNG. In the forests of the smaller islands to the east, tropical cyclones and invasive species are also serious threats. 244. Tropical dry broadleaf forests have high degrees of endemism, including ground nesting birds, and are particularly susceptible to degradation due to fire, logging, deforestation, agricultural clearance, grazing and replacement / competition by invasive species, particularly fire-tolerant invasive grasses. 245. Grasslands, savannahs, woodlands, scrublands and scrub-fernlands appear to be of largely anthropogenic origin, or at least greatly extended by the use of fire, and, in most cases, are now dominated by introduced species (Thaman, 1999). These areas are however important resources that require protection and ecological restoration. 246. Extensive areas of freshwater swamps and wetlands on New Guinea, and river systems in PNG and Fiji with extensive river plains, deltas, estuaries and a number of freshwater lakes, harbour rich finfish and shellfish faunas, with those in PNG and Palau serving as important crocodile habitat. These finfish and shellfish are often the main source of animal protein. Pollution, sedimentation, loss of riparian vegetation, overfishing and invasive species are significant threats to freshwater biodiversity (Jenkins, 2007). 247. Coastal littoral and mangrove vegetation is composed of about 150 widespread salttolerant, woody and herbaceous species, almost all of which have multiple uses throughout the Pacific (Thaman, 1992). In inhabited areas, they are also among the most highly threatened and degraded ecosystems, with many coastal areas and atoll 104 islets having little or no original native vegetation, most having been replaced by the expansion of coconut plantations and settlements (Thaman, 2008a). 248. The larger islands from PNG to Fiji have among the most extensive and species-rich intact areas of mangroves on Earth, with the mangroves of New Guinea being listed as a WWF global eco-region. There are also limited mangrove populations on many of the atolls and raised limestone islands. Throughout the Pacific, mangroves serve as a critical habitat, spawning ground or nursery for a majority of near shore fisheries resources and for a wide range of birds, some mammals and saltwater crocodiles. 249. On most islands, areas below 500m in elevation consist of a matrix of traditional shifting and semi-permanent agricultural holdings, fallow and secondary forests, perennial plantation agriculture and silviculture, pastureland, settlements, and disturbed sites that are increasingly dominated by introduced, often invasive, plants and animals. Agricultural biodiversity is highly threatened (Thaman, 2005a). Increasingly large areas have been converted in recent years to plantation monocultures (sugarcane, coconut, cocoa, rubber and oil palm); pastures (mainly for beef cattle) and plantation forests (pines, eucalyptus, mahogany, teak and other exotic species) (Thaman, 2007/08; 2008c). 250. There are extensive systems of barrier, fringing and patch coral reefs. PNG, New Caledonia, Solomon Islands, Fiji and Palau are the PICTs within the region with greatest coral reef diversity, and the New Caledonia Barrier Reef and Great Sea Reef of Fiji the second and fourth longest barrier reefs in the world respectively. Off PNG’s coast, there are over 600 reef-building coral species, 3000 finfish species, and among the greatest diversity of associated molluscs, crustaceans, echinoderms, and other coral reef-associated species in the world. Seagrass and algal beds, extremely important habitats, food sources and nursery areas, are also found throughout the area (WWF, 2007). 251. PNG, Solomon Islands, Fiji, FSM, the Marshall Islands and Kiribati have among the most extensive exclusive economic zones (EEZs), with substantial areas of seamounts, abyssal areas, and associated deepwater pelagic fish, such as tuna, sharks and billfish, and deepwater demersal species, such as deepwater snappers. There is also a diversity of whale and dolphin species, with the area falling within the 105 migratory routes of the threatened humpback whale. The highly threatened dugong is also found from PNG to Solomon Islands, Vanuatu and Palau. 3.3.1 252. The Ocean Largest of the planet's bodies of water, the Pacific Ocean covers nearly 166 million km2, or about 28% of the Earth's surface, more than the combined area of the world's continents. Its width at the equator is about half the world's circumference. The Pacific Ocean contains about 25,000 islands (more than the total number in the rest of the world's oceans combined), the majority of which are south of the equator. The largest landmass entirely within the Pacific Ocean is the island of Papua New Guinea. 253. The Pacific Ocean is a major contributor to the economy of its island nations. It provides low-cost sea transportation, extensive fishing grounds, offshore oil and gas fields, minerals, sand and gravel. In the late 1990s, more than 60% of the world's fish catch came from the Pacific (Gillett and Cartwright, 2010). 254. Exploitation of offshore oil and gas resources is playing an increasing role in the energy supplies of Pacific Rim countries, although the high cost of recovering offshore oil and gas, combined with the wide swings in world oil prices since 1985, has led to fluctuations in new drilling starts. 255. Oceans are normally a natural carbon sink, absorbing carbon dioxide from the atmosphere through the process of photosynthesis performed by marine plants and algae. However, CO2 is also absorbed by seawater, causing chemical reactions top occur which reduce the ph level of seawater, reduce carbonate ion concentration and the saturation rates of biologically important calcium carbonate minerals. These chemical actions are termed ocean acidification. UNEP (2010) reported that the surface ocean acidity has increased by 30% since pre-industrial times due to the vast amount of man-made CO2 absorbed by the oceans—an estimated 500 Gigatonnes or 25% of the total that is emitted to the atmosphere. This has resulted in a drop in mean pH of ocean waters of approximately 0.1pH unit to about 8.1 on the logarithmic pH scale. If this rate of ocean acidification continues, the ocean pH will decline by a further 0.3 pH units by the end of this century, an unprecedented 150% increase in ocean acidity, which threatens the delicate chemical balance upon which marine life depends. The potential extent of consequences of ocean acidification are not fully 106 understood, but there are concerns that structures made of calcium carbonate may dissolve, affecting corals and the ability of shellfish to form shells. Increased acidity in the oceans is also expected to lead to a shortage of carbonate, a key building block for these organisms. The scant attention this issue has received has focused primarily on corals, which are threatened with extinction within this century. Corals build reefs, by far the most diverse ecosystems of our oceans. However, other animals that use carbonate for their shells may also suffer, including shellfish like clams, oysters, crabs and lobsters (Harrould-Kolieb et al., 2010). 256. Marine life may be affected by acidification in other ways. Within this century, increasing acidity may reduce the ability of certain fish to breathe and increase the growth rates of some sea stars. In addition, it is likely to inhibit some fish from smelling cues that direct them to suitable habitat or away from predators, and to increase energy demands. Indirect effects may occur due to loss of habitat, changes in food availability or the abundance of predator populations. These impacts could all result in population level consequences and cascade effects throughout marine ecosystems. The species that are most vulnerable to ocean acidification are vital to ocean food webs as well as important food and income sources for humans (Harrould-Kolieb et al., 2010). 257. Mining parts of the sea floor disturbs the habitat of benthic organisms. In addition, significant increase in heat content of the ocean has been observed in recent decades, with likely implications for changes in oceanic circulation as well as on the marine productivity (Gillett and Cartwright, 2010). 3.3.2 258. The Coastline, Reefs and Mangroves Small islands have long coastlines relative to their land area (Nunn et al., 1999). As more than 70% of the inhabitants of PICTs live in the coastal zones, enormous pressures are put on coastal and marine ecosystems. In the last 20 years, coastal areas in some PICTs have been heavily modified and intensively developed, significantly increasing their vulnerability to natural climatic variability, extreme events and to global climate change. 107 Table 3.4: Coastline of PICTs. Region/Country/Island Coast line (km) Region/Country/Island Coast line (km) MELANESIA 39,496 POLYNESIA 3,952 Papua New Guinea 20,197 French Polynesia 2,525 Fiji 4,637 Samoa 403 Solomon Islands 9,880 Tonga 419 New Caledonia 2,254 American Samoa 116 Vanuatu 2,524 Wallis and Futuna 129 MICRONESIA 10,782 Cook Islands 120 126 Tuvalu 24 FSM 6,112 Niue 64 Kiribati 1,143 Tokelau 101 Northern Mariana Islands 1,482 Pitcairn islands 51 Guam Marshall Islands 370 Palau 1,519 Nauru 30 Melanesia, Micronesia and Polynesia Total 54, 230km (Source: Govan, 2009) 259. Coasts are diverse and under threat from a combination of human pressures, climate change and extreme events. For instance, the health of coral reefs that provide most of the sand in the beaches around the islands is threatened by years of use and overuse, increasing sea surface temperature and sea level, increased turbidity associated with coastal development and loss of mangroves, heightened nutrients, chemical pollution and damages from extreme natural events. These threats endanger these ecosystems and the ecological goods and services they provide in these islands. Hazardous chemicals and nutrient pollution find their way into the marine environment via effluent, waste dumps, storm runoff, sewage, and windblown dust, and are especially damaging to coastal marine nursery areas like sea grass beds, coral reefs, and mangrove forests. Siltation, oil pollution, poisons and plastic trash also contribute to extensive damage to inshore marine environments. The Pacific has experienced an average rise in relative sea level of 2.0 mm per year over the past few decades. 260. Deforestation has caused heavy runoff and siltation in some places, which has resulted in the partial death of corals. Massive live corals are quarried to manufacture calcium carbonate, causing severe damage to the entire ecosystem. The coral reefs 108 are undergoing rapid loss of habitat richness in some areas due to extreme temperatures and solar irradiance, sub aerial exposure, sedimentation, freshwater dilution, contaminants, and diseases, acting either singly or in combination. For example, coral reefs that are close to their threshold temperature tolerance will suffer irreversible damage if the seawater temperature exceeds 29.5°C. There has been widespread coral bleaching during ENSO episodes when this threshold is crossed. Coral reefs are also at risk due to destructive fishing techniques, reef mining, sedimentation and marine pollution. 261. Coral reefs are important for biodiversity, provide habitat for fish, buffer against waves and erosion, and provide carbonates and for beaches (Burns, 2000;HoeghGuldberget al., 2000). Corals occur within a narrow sea temperature range (25–29oC) and are therefore extremely sensitive to changes in their environment. When corals are under stress, they expel the algae (dinoflagellates) that symbiotically supply them with oxygen or food, resulting in bleaching. Corals are already under stress from factors such as high nutrient runoff, turbidity and sedimentation (reduced light conditions), over-fishing, destructive fishing methods, changed water chemistry, physical damage and an increase in sea level. Some corals can grow at the same rate upwards as sea levels rise, however, these types of corals are not common in the Pacific where coral species are generally characterized by lateral rather than vertical growth (Nunn, 2000). Many coral reefs are in a degraded condition and can therefore not adapt in the same way or at the same rate as healthy corals could. Stress thresholds that result in bleaching events will become very frequent (possibly annual) in the Pacific, and it is likely that in the next 20–50 years corals as dominant organisms on reefs will disappear (Hoegh-Guldberget al.,2000). 262. Although the status of coral reefs in PICTs, where the vast majority of corals occur, is generally better than in other regions, living coral cover fell rapidly from an estimated 47.7% of reef areas in 1980 to 26.5% in 1989, an average loss of 2.3% per year. Between 1990 and 2004 it remained relatively stable on many monitored reefs, averaging 31.4%. An indication of the long-term decline of Pacific reef is a drastic reduction in the proportion of reefs with at least half of their area covered by living coral – it fell from nearly two-thirds in the early 1980s to just 4% in 2004 (Wilkinson, 1998) There is no sign of long-term recovery to earlier levels of coral cover across the region. Also, recovering coral communities appear to produce more simplified 109 reef structures, suggesting a decline in their biodiversity, as more complex structures tend to harbour a greater variety of species. 263. Most Melanesian reefs are under customary tenure and serve as important local sources of food. In Micronesia, reefs are structurally well developed, except on coastlines affected by active volcanism. Palau lies closest to the centre of reef diversity in the Indo-Pacific region. The reefs of New Caledonia and Fiji are the best studied, but vast areas of reefs remain unexplored (Spalding et al.,2001). 264. PICTs are yet to conduct experiments to demonstrate links between ocean acidification and coral destruction or other possible impacts. However, the Great Barrier Reef in Australia showed a decline in calcification by 14.2% since 1990 (De’ath et al., 2009). Researchers estimate that atmospheric CO2 stabilization at less than 450 ppm is essential for the survival of many coral reefs (UNEP, 2010) 265. Over two thirds of mangrove areas are under severe threat by infrastructure development, sedimentation and pollution. Despite knowledge about the importance of mangroves for shoreline protection, large areas of mangrove vegetation are still cut down for tourism development, which then results in sedimentation and pressure on coral reefs in nearby areas. 266. The PICTs contain only 3% of the global mangrove area but support unique mangrove communities and provide valuable services and products. PNG has the highest global mangrove diversity and hosts over 70% of the region’s mangrove area. Mangroves decline in diversity from west to east, reaching their limit at American Samoa (UNEP, 2006). Mangrove forests are prevalent in estuarine areas of the high islands but are poorly developed on atolls. Pacific Islanders utilize mangroves for firewood, timber, dye and medicine and have long recognized the importance of mangroves as sources of food and coastal protection. Increased human population and coastal development contribute to serious problems such as pollution and loss of habitat that further threatens mangroves and other coastal resources. There is little information available on trends in the extent and health of mangroves in PICTs. Mangroves migrate landward as a natural response to a rising sea level. Where this natural landward migration is not possible because of the physiographic restrictions or presence of seawalls and other obstructions, the mangrove area reduces over time. Mangroves could experience serious problems 110 due to rising sea level, and low-island mangroves may already be under stress. By the year 2100, a reduction in area by as much as 13% of the current 524,369 ha of mangroves in the 16 PICTs where mangroves are indigenous is possible. Increased frequency and levels of extreme high water events, expected over the coming decades, could affect coastal ecosystems and pose a hazard to coastal development and human safety. The responses of mangroves, wetlands and other coastal systems to global climate change effects other than sea level rise, such as increased air- and sea-surface temperatures, changes in precipitation and salinity, and changes in storminess, are less certain and not well understood. In addition to climate change effects, mangroves and other coastal ecosystems face numerous other threats, ranging from logging and filling for development to disease outbreaks (UNEP, 2006). 267. The destruction of coral reefs, mangrove forests and sea grass beds is associated with the construction of coastal infrastructure, land and marine pollution, fishing, natural disasters and poor development planning. This environmental deterioration as development proceeds suggests the need for a better strategy with the involvement of local communities in the care of their environmental resources using their traditional knowledge and practices. 3.3.3 268. Fisheries Fish and fishing are fundamental to life and culture in the Pacific. Both subsistence and commercial fishing, particularly of tuna species, are mainstays of many PICT economies but are increasingly threatened by over-exploitation and environmental degradation. Per capita consumption of fish in PICTs is very high by global standards, with an average of more than 60 kg of fish consumed per person per year in seven PICTs. Fisheries are the main sources of protein in the diet of Tuvaluans, with each person eating about 500 g of fish per day; which makes 2 tons per day or 730 tons per year for just the population of Funafuti (ADB, 1994). Fish exports account for as much as 73% of the total exports of some countries (Barnet, 2007). With this level of exploitation, there is little hope of the environment keeping up. 269. Decades of catch records enable trends to be recorded in the average position of caught fish in the food web, the Marine Trophic Index (MTI), and thus to monitor the ecological integrity of marine ecosystems, over time. Despite the intense pressure on fish stocks, the MTI has shown an increase of 3% globally since 1970. However there is substantial regional variation in the MTI, with declines recorded since 1970 in 111 half of the marine areas that have data, including in the Southeast Pacific. The regions with the largest proportional increases include the West Central Pacific and Southwest Pacific. Although these increases may indicate a recovery of higher predator species, they are more likely a consequence of fishing fleets expanding their areas of activity, thus encountering fish stocks in which larger predators have not yet been removed in such numbers (Secretariat of the Convention on Biological Diversity, 2010). 270. The region’s fishery resources can be divided into four categories: offshore (oceanic), coastal (inshore), freshwater (inland) and aquaculture. Offshore resources include tuna, billfish and other pelagic species found in open water habitats. These generally move extensively across economic zones and high seas. A few species form the basis of the region’s industrial tuna fisheries, which are subject to regional, national and international management frameworks. Although oceanic in habit, some of the important species are also found in coastal waters; where in some cases they form more resident populations and contribute to subsistence and small-scale commercial fisheries. Stock assessments show that big-eye tuna (the most valuable of the four main species per kg) is overfished, while yellow-fin tuna is fully exploited. Skipjack (the most abundant, making up the greatest volume of the tuna catch) and albacore are being fished at levels below the maximum sustainable yield. The status of other oceanic stocks is less well researched, but there is growing concern over some species of sharks. There is strong evidence that ENSO events have both positive and negative impacts on the pelagic fishery, with stocks of migratory species such as skipjack and yellow-fin tuna shifting eastwards during ENSO. Coastal resources include a very diverse range of finfish and invertebrates, many species of which are little studied (Dalzell et al., 2009). These include demersal (bottom dwelling) species, those that inhabit shallow water, and those whose individual movements are generally restricted to coastal areas. Management is undertaken on national and community levels. Because of their relative accessibility, these resources form the basis of most of the region’s small-scale fisheries and are targeted by both commercial and subsistence fishers. In general, they are heavily used and often overfished (FFA, 2008). Freshwater resources include both fish and invertebrates (e.g. freshwater prawns and clams) and are poorly understood throughout the region (Gillett, 112 2009). They are most important in the larger islands of Melanesia, but are of some significance on other high islands. The freshwater fisheries in PNG dominate the regional catch totals. In most PICTs where freshwater fisheries occur, a few of the important species are introduced, such as tilapia. Most fishing for freshwater resources is for subsistence. Freshwater fisheries issues are closely linked with catchment management and freshwater quality. Aquaculture in the region centres on a small number of resources: black-lip pearl oyster, penaeid shrimp, tilapia, milkfish, giant clam and seaweed. In the period 1998 to 2007, the cumulative value of aquaculture in the region was US$1.89 Billion. This was overwhelmingly dominated by French Polynesia (US$1.56 Billion, mainly black pearl) and New Caledonia (US$250 Million, mainly shrimp), representing 95.5% of the value of aquaculture in the region’s 22 PICTs. In 2007, the Cook Islands (US$40 Million) was emerging from a slump since its annual peak of US$9 Million in 2000. Over this period, the other main producers were PNG (US$11 Million), and Fiji, Guam and Kiribati with US$6–7 Million each (Ponia, 2010). Kiribati declined to its lowest level of production of US$1 Million in 2002. In 1999, there were only 10 PICTs with production that could be considered commercial and by 2007 that number had increased to 17 (Ponia, 2010). 271. Total fisheries and aquaculture production in the region in 2007 was estimated to be 1,330,345 tons (t), plus 305,336 items (“pieces”) of aquaculture products (which includes pearls and aquarium items not usually sold by weight). The total value of production in 2007 was estimated to be over $2 billion (Gillett, 2009, see Table 3.5). The SPC’s Overview of tuna fisheries (2010) mentioned that the annual catches of the four main species (skipjack, yellow-fin, big-eye and albacore) in the WCPFC-CA have increased continuously since the beginning of commercial exploitation in the early 1950. In 2009, the highest ever catch of 2.46 million tonnes was recorded. The value of the landed catch has also grown and has been US$ 4–5 billion in recent years. 113 Table 3.5: Marine fisheries production (tonnes) for PICTs in the year 2007. Country Coastal Coastal Offshore locally‐ Offshore foreign‐ commercial subsistence based fishing based fishing fishing fishing American Samoa 35 120 6,632 6,787 CNMI 231 220 451 Cook Islands 133 267 3,939 4,339 Fiji 9,500 17,400 13,744 492 41,136 French Polynesia 4,002 2,880 6,308 13.190 FSM 2,800 9,800 16,222 143,315 172,137 Guam 44 70 114 Kiribati 7,000 13,700 163,215 183,915 Marshall Islands 950 2,800 12,727 80,046 Nauru 200 450 69,236 69,886 1,350 3,500 2,122 6,972 Niue 10 140 640 790 1,580 Palau 865 1,250 3,030 1,464 6,609 5 7 12 PNG 5,700 30,000 256,397 327,471 619,568 Samoa 4,129 4,495 3,755 25 12,404 Solomon Islands 3,250 15,000 23,619 98,023 139,892 375 318 693 Tonga 3,700 2,800 7,619 Tuvalu 226 989 35,541 36,756 Vanuatu 538 2,830 12,858 16,226 Wallis and Futuna 121 840 961 New Caledonia Pitcairn Islands Tokelau 63,569 1,119 Total (tonnes) (Source: Gillett, 2009; 2010). 272. Offshore, foreign-registered fishing is responsible for about half of the total value of the region’s catch, offshore locally based fishing for about 25%, with coastal commercial, coastal subsistence, and aquaculture together accounting for the remainder. However, the added value of coastal fisheries exceeded the added value of offshore locally based fishing (Gillett, 2009). PNG, which has three canning and loining plants, 75% of all locally based purse-seine vessels, and vast freshwater and coastal fisheries, was responsible for about 40% of all fishery production in the region (by value) in 2007. The ranking of countries by total fisheries production is strongly influenced by the level of tuna catches, and there is a general pattern of decreasing total national catches from west to east across the region, and from equatorial to higher latitudes. There were also relatively large contributions, in both catch and 114 value, of offfshore foreign-based p production in Kiribati, FSM, F Solom mon Islands,, Nauru, and Tuvalu u; relatively large contriibutions of offshore o loc cally based pproduction in the Marshall Islands and (to ( a lesser extent) Fiji; relatively la arge contribbution of aquaculture and New Caledonia; and a relativvely large e in French Polynesia a contribution n of non-tun na productio on in Fiji. Although the poor state oof coastal fisheries statistics in the region makes it diifficult to demonstrate this t point, tw wo compara able t Asian Developmen D nt Bank sho ow the trend d (Figure 3.33). studies by the 3.3: Fisheryy Production n Trend for PICTs. Figure 3 (Source: G Gillet, 2009) 1155 Map 3.1 1: Catch in tons by tuna species in n the PICTs s. (Source: H Harley et al., 200 09) 273. Pressure has increase ed on fisherries adminis strations to address a thee increasing g level k inverteb brate speciees, and to handle h of overfishing of inshore fisheries , including key e-consumin ng nature off offshore fissheries the increassingly complex and time manageme ent. Nationa al fisheries a agencies face many ma anagementt challenges s that prevent the em from ach hieving fishe ery goals, although a the ese are not uniform acrross the region, the following challenges a are common n: Increassing workloa ads and ressponsibilitie es with shrin nking budgeets and limitted human n capacity, including lacck of approp priately skilled fisheriess managers s; Limited d connections with inad dequate inp put from fish hery stakehoolders, partticularly the privvate sector; 1166 Increasing regional responsibilities for offshore fisheries, which have diverted attention and resources from coastal fisheries; Lack of clear policy direction and poor planning, implementation and monitoring; A weak legislative base in many countries; and Continued mis-placed optimism (or inertia) that somehow the resource ‘will all be fine’. They have been the focus of institutional strengthening projects in recent years, the results of which are yet to be fully realised or understood. 274. The key drivers of change in PICTs fisheries are: population growth and urbanization, economic development, the status of fisheries resources and developments in other oceans, governance and political stability, climate change, limits to domestic production, markets and trade, and also fuel costs, technology innovation and foreign aid (Gillett and Cartwright 2010). 3.3.4 275. Response: Protecting Coastal and Marine Ecosystems Although coastal communities have lived within a complex environment and adapted to continually changing conditions through history, the challenge is to survive the onslaught of climate change and to reduce its impacts. To accomplish sustainable development that will allow this, PICTs need the support of the international community in equitable partnerships while reducing unsustainable production and consumption practices. These goals also require the adoption of appropriate demographic policies. 276. In the past decade, more than 12,000 km2 in the South Pacific have been brought under a community-based system of marine resource management known as Locally-Managed Marine Areas. These involve 500 communities in 15 PICTs and help to achieve livelihood and conservation objectives based on traditional knowledge, customary tenure and governance, combined with local awareness of the need for action and likely benefits (Govan, 2009). These benefits include recovery of natural resources, food security, improved governance, access to information and services, health benefits, improved security of tenure, cultural recovery, and community organization. Govan considers that the main driver to manage coastal marine resources is the need to maintain or improve livelihoods, food security and 117 local economic revenue. As populations and demand grow and marine resources continue to decline elsewhere, coastal marine resources in the PICTs will likely become increasingly attractive and highly valued, thus emphasizing the need for pursuit of national development objectives within the limits of sustainability, using strong national institutions and regulatory frameworks. 277. Results of LMMA implementation on fisheries in Fiji since 1997 have included a 20fold increase in clam density in the ‘taboo’ areas where fishing is banned; an average of 200-300% increase in harvest in adjacent areas; a tripling of fish catches; and 3545% increase in household income (Govan, 2009). 278. The PICTs are served by two regional fisheries institutions: SPC and FFA. These have placed an increasing focus on programmes that are implemented nationally, and on building in-country capacity. The Western and Central Pacific Fisheries Commission (WCPFC) have begun to address problems in managing tuna and related stocks of the western and central Pacific, particularly on the high seas. WCPFC seeks to provide management arrangements for key tuna stocks, while also protecting other species caught in association with those stocks, including by-catch species. This has generated disagreements between FFA members and other fishing nations regarding the jurisdiction of WCPFC over exclusive economic zones and archipelagic waters. Coastal states can drive this process to a greater extent, because they control a greater proportion of resources in the region, and there is generally strong solidarity among PICTs. However, WCPFC’s effectiveness in conserving and managing fish stocks and allowing PICTs to secure what they perceive as appropriate control of the resource, has been increasingly questioned by FFA member countries (Gillett and Cartwright, 2010). 3.3.5 Forests 279. Loss of forest cover is a major global, as well as Pacific, concern. Forest cover is estimated to range from 68% to 96% of the total land area in the Cook Islands, Palau, PNG and the Solomon Islands to under 10% in many of the smaller island states (FAO 2001). From available information for the time period 1990 - 2000, the largest annual change (%) in forest cover has been in FSM and Samoa. Other smaller Islands and atolls such as Vanuatu, Tonga, Niue and Kiribati all have forest cover ranging from 5 to 38% of the total land area. Among the island states with a 118 land area of less than 50,000 km2, the combined forest cover was estimated at 38.4% of the total land area in 2000, whereas the world average was 29.6% (Table 3.6). Table 3.6: Forest Cover 2000 and Changes in Forest Cover 1990-2000 for PICs. Note: n.s. = not significant, n.a.= not available. Country Land Area Total % Total % Change in Forest Cover 1990 ‐ 2000 (ha) Forest Forested Forest Forested Total Annual Annual Area 1990 Land Area 2000 Land Change Change Change (ha) (1990) (ha) (2000) 1990 – (ha) (%) 2000 (ha) Cook 23 000 22 000 95.7% 22 000 95.7% n.s. n.s. n.s. FSM 69 000 24 000 34.8% 15 000 21.7% ‐ 9 000 ‐1 000 ‐4.5% Fiji 1 827 000 832 000 45.5% 815 000 44.6% ‐17 000 ‐ 2 000 ‐0.2% Kiribati 73 000 28 000 38.4% 28 000 38.4% n.s. n.s. n.s. Marshall 18 000 n.s. n.s. n.s. n.s. n.s. n.s. n.s. Nauru 2 000 n.s. n.s. n.s. n.s. n.s. n.s. n.s. Niue 26 000 6 000 23.1% 6 000 23.1% n.s n.s. n.s. Palau 46 000 35 000 76.1% 35 000 76.1% n.s. n.s. n.s PNG 45 239 31 370 69.3% 30 601 67.6% ‐1 129 000 ‐ 3000 ‐ 0.4% 000 000 282 000 130 000 46.4% 105 000 37.2% ‐ 25 000 ‐ 3 000 ‐2.1% 2 856 000 2 580 000 90.3% 2 536 000 88.8% ‐ 44 000 ‐ 4 000 ‐0.2% Tonga 73 000 4 000 5.5% 4 000 5.5% n.s. n.s. n.s. Tuvalu 3 000 n.a. n.a. n.a. n.a. n.a. n.a. n.a. 1 218 000 441 000 36.2% 447 000 36.6% + 6 000 1 000 0% Islands Islands Samoa Solomon 000 Islands Vanuatu (Source: FAO (Forest Resources). Adopted from: http://www.fao.org/forestry/sids/4142/en/) 280. The Pacific region has seen a net overall gain of forests over the period 2000–2009 but high rates of fragmentation and net loss of forests are expected to continue. In particular, the rapid increase in the large-scale plantation of oil palms for bio-fuel in some countries, particularly in areas previously covered by primary tropical forest, is a major factor in biodiversity loss and land degradation. The rate of loss of mangrove 119 forests has not slowed in recent years, and is expected to be an important concern for communities, especially in efforts to attenuate the impacts of coastal erosion. 281. The Solomon Islands, Samoa and Tonga are among countries with high rates of forest degradation due to heavy exploitation of timber. Forest degradation due to natural causes (e.g. cyclones and forest fires) is also common in some PICTs (FAO/FRA, 2010). Statistics on status and trends of the forest area in Fiji, Vanuatu, PNG and the Solomon Islands are based on reasonable available information (FAO 2010, Sue 2010). 282. In Fiji, forests cover approximately 44.6 % of the landmass (FAO/FRA, 2010) and 85.4% of this forest is indigenous lowland and upland rainforest and mountainous cloud forest, while plantations of predominantly mahogany and pine make up the remaining 14.6%. Table 3.7 shows the proportions of the various forest types, with the changes in extant occurring between 1991 and 2007 (Sue, 2010:6). Table 3.7: Fiji’s forest types and the change in forest cover. National class (1000 ha) 1991 2007 2007 (% area) Δ(Area) Δ/year over 16 years Closed Indigenous Forest 704.9 587.8 32.2 ‐117.065 ‐7.3166 Open Indigenous Forest 223.5 362.2 19.8 138.668 8.666 Pine plantations 49.6 98.8 5.4 49.183 3.074 Mahogany plantations 39.2 63.9 3.5 24.64 1.54 Coconut plantations 34.6 28.7 1.6 ‐5.891 ‐0.368 Non‐forests 665.4 36.4 0 Inland water 20.3 1.1 0 Total land area 1,827.0 100.0 Calibration factor: 1.06, ∆ = net change. (Source: FAO/FRA 2010 – Fiji Country Report (In: Sue, 2010:6). 283. Within Fiji, there has been a conversion of closed to open indigenous forest at a rate of 7,300 ha per year over the last 20 years. Table 3.8 shows the proportions of forest management categories and Table 3.7 some trends in these categories. The data for 1991 and 2007 are the most reliable sets of area data, since these were NFI years; 120 from these a linear extrapolation for 1990 and 2010, and interpolation for the 2000 and 2005 forest areas were made (FAO/ FRA, 2010). Table 3.8: Reported trends in FRA categories in Fiji. Variable / Comments related to data or definitions Comments on the reported trend An area of approximately 40 000 hectares of The total increase in open forests of 138,668 mangroves is not included in the total forest area. hectares in 16 years comes from two sources: The reason for exclusion is that the area of the reduced closed forest area of 117,065 hectares mangroves is not included in the total land area. (may have disappeared due to deforestation through category Forest agricultural activities) and the balance of 21,603 from the areas that were defined as non‐forest during the 1991 NFI data. These are now defined as forest under the new Fiji forest definition. The re‐ defined minimum threshold size for forest is down from 4 ha in the 1991 NFI to 0.5 ha in the 2007 NFI. Other land Calculated as total land area less area of Forest and area of Other wooded land. Inland water The total area of Fiji includes approximately Since there was no data available for the years bodies 1000 ha (in 21 different locations) of inland water before 2008, the 2008 value was used for the rest of bodies. the years back to 1990. (Source: FAO/FRA, 2010) 3.4 BIOLOGICAL DIVERSITY 284. Biological diversity (or biodiversity) includes all species and taxonomic groupings found in the region. Genetic diversity includes all subspecies, genetic types, breeds, cultivars or varieties of wild and domesticated plants and animals found in these ecosystems. The islands of Oceania are characterised by high ecosystem, species and genetic diversity. The region is composed of thousands of isolated islands with a great variety of geographic settings, including coral atolls, raised limestone and high volcanic islands. This has led to the high diversity of species. 285. The number of species found nowhere else on earth (endemic species) is extremely high: up to 90% for some groups. Often, these rare, endemic species are adapted to specialised habitats and limited to small areas of just a few islands. The highest level 121 of species richness is in Melanesia (particularly PNG and the Solomon Islands), which also have a high level of endemism. Section 3.3 also highlighted the diverse ecosystems existing in PICTs as well as different ecosystem services that support the livelihood of Pacific Island people. 286. Pacific Islanders have high economic and cultural dependence on the natural environment and its unique biodiversity. Any loss of biodiversity has negative effects on food and energy security, health and material wealth and the adequate functioning of ecosystems. Many Pacific cultures also attach spiritual and religious values to ecosystems and their components such as landscapes, trees, hills, rivers or particular species, so loss of biodiversity also influences social structures and behaviours. A rapidly expanding human population brings increasing demands on the region’s natural resources. Plant and animal species are therefore very vulnerable to extinction due to human impacts such as climate change, competition and predation from introduced (invasive) species, habitat destruction, over-harvesting of species and pollution. 287. According to Conservation International (2010), there are two main biodiversity “Hot Spots” in the Pacific. The East Melanesian Islands Hot Spot covers 1600 islands over approximately about 100,000 km2. Its habitats range from coastal vegetation and mangroves to mountain rainforests and host about 8000 plant species (38% endemism), 86 mammals (45% endemism), 360 bird species (42% endemism), 117 reptiles (46% endemism) and 42 species of amphibian (91% endemism) (Conservation International, 2007). This Hot Spot area is currently threatened by logging, mining and unsustainable farming. 288. The Polynesia–Micronesia Hot Spot covers 4500 islands over an area of 47,239 km2 in 11 countries, 8 territories and Hawaii. It is one of the smallest hot spots in the world in terms of land mass but the largest in ocean cover (40 million km2). It is home to 5,330 plant species (58% endemism), 16 mammal species (75% endemism), 292 birds (56% endemism), 64 reptiles (48% endemism), 3 amphibians (100% endemism) and 96 freshwater fish (21% endemism) (Conservation International, 2007). 289. PICTs also have “cool spots”: areas with less unique genetic diversity but plants and animals useful in sustaining the human population and ecosystems (Thaman, 2010). 122 Many of these species, cultivars, varieties and subspecies are also threatened by human activity. Cool spots are mostly found on atolls, raised limestone and low-lying islands. 290. The following section provides a summary of information on the State of biological diversity in the Pacific, the Pressures impacting on species, and the Response of Pacific island countries and territories in addressing and alleviating these threats. 3.4.1 291. Indicators of the State of the Pacific’s Biodiversity The threat status of animals and plants is one of the most useful measures for assessing the condition of an ecosystem and its biodiversity. The International Union for Nature Conservation’s (IUCN) Red List of Threatened Species is widely recognised as the most comprehensive, apolitical approach for assessing and monitoring the status of biodiversity (IUCN 2010). It provides taxonomic, conservation and distribution data on taxa that have been evaluated using the Red List Categories and Criteria. Volunteer experts of IUCN’s Species Survival Commission (SSC), Birdlife International, the Centre for Applied Biodiversity Science of Conservation International, and NatureServe, supply and collate information on species’ taxonomy, ecology, distribution, conservation status and use, and threat status. 292. The IUCN Red List Categories and Criteria aim to classify species according to their extinction risk. As extinction is a chance process, a listing in a higher extinction risk category implies a higher expectation of extinction. The highest level of risk is the category “Critically Endangered” (CR), followed by “Endangered” (EN), and “Vulnerable” (VU). A listing in any of these three categories means that a species is described as “threatened”. 3.4.2 293. State of Knowledge of the Threat Status of Pacific Species Taxonomic state of knowledge: In the Pacific, knowledge of the threat status of the great majority of species is lacking. Although data exist for certain species, in many cases information has not been collated into a central or useable database. There is a great need for increased research and more threat assessments. 294. By 2008, assessments had been carried out using the IUCN Red List Categories and Criteria for 3,769 species found in the Pacific Islands (Pippard 2009; see Map 3.2). 123 However, this is only a fraction off the known species in the Pacific.. The number of s in each e taxono omic group is generally y much largeer than the number described species assessed so s far and in n some grou ups the tota al number of species iss uncertain because many groups s are under--studied. Th he total prop portion of sppecies asse essed is ewer than 1 10% in mostt taxonomic c groups. Thhere is also a great therefore likkely to be fe difference in state of knowledge k b between the e few groups for which all known species s ( coralss, mammals s, birds, amp phibians annd freshwate er have been assessed (hard crabs) and all other tax xonomic gro oups for wh hich informa ation is lackking. Map 3.2 2: The ratio of Red-liste ed species in the Paciffic, by country and taxoonomic grou up. (Source: P Pippard, 2009) 295. Vertebrate groups for which not a all described d species have been a ssessed inc clude akes, freshw water fish an nd coastal marine m fish.. Reptiles arre under-as ssessed lizards, sna on a global scale and in the Paciffic: of appro oximately 43 30 describeed Pacific Island 1244 species, only 26 appear on the IUCN Red List. Amphibians have been fully described and assessed, but are only found in five countries in the region, with 98% of all Pacific amphibian species found in PNG. Fish assessments have largely focussed on a few groups of marine fishes including sharks, rays and groupers, sea horses and pipefish. 296. Amongst invertebrates, the number of assessed species is a tiny proportion of the number of described species. Aside from hard corals and freshwater crabs, land snails are the best known group. No assessments have been made on several large and important invertebrate groups such as ants, bees, beetles and cicadas. A quarter of assessed invertebrate species in the Pacific have been evaluated as threatened. 297. Hard corals were added to the IUCN Red List for the first time in 2008, with around one quarter of the 591 assessed species now listed as threatened (Pippard, 2009). Only approximately 5% of the 233 described fish species in the PICTs region have been assessed, and of these, 22% are listed as threatened (Pippard, 2009). Other marine species such as seaweeds, mangroves, seagrasses, echinoderms (starfish, sea cucumbers and sea urchins), sponges, worms, and shore fishes (such as damselfish and parrot fish) are not only not-assessed, but many of these groups are largely under-studied, with many undescribed species likely to occur in the Pacific. There are potentially gaps in representation of marine mammals, as these species know no country boundaries and may be present in more PICTs than are currently known. 298. There are huge gaps in the representation of freshwater species. Assessments are needed for freshwater fishes, freshwater molluscs and insects such as dragonflies. 299. Over 60% of assessed reptiles are threatened. Assessments have so far focused on well-known groups such as crocodiles and turtles, while the largest groups, such as skinks, geckos, other lizards and snakes, remain largely unassessed. Initial results indicate that reptiles may be one of the taxa of most concern for the region. 300. The number of assessed plant species is very low across the Pacific islands when compared with the large number of described species, apart from conifers and cycads which have been the subject of a global assessment and with almost a quarter of all species threatened in both these plant groups. The flowering plants, 125 both monocotyledons (Liliopsida) and dicotyledons (Magnoliopsida), contain a large proportion of threatened species, but are mostly not yet assessed. Many plant families include economically important food crops, timber materials, medicinal plants and any loss to these groups will have major implications in the future (Pippard, 2009). 301. Geographical state of knowledge: Among the assessed species on the IUCN Red List that occur in the PICTs are 1,673 species that are endemic to just a single country within the region. This is a very high number of species, equating to approximately 40% of all assessments carried out for Pacific Island species, but to be expected for tropical islands. The Marshall Islands, Tokelau and Tuvalu have no assessed endemic species. 302. The highest numbers of assessed endemics as a proportion of the total number of assessed species in that country are located in: 303. French Polynesia - 45%, New Caledonia - 33%, PNG - 21%, and Fiji 20%. Of the assessed endemics, a large number are threatened. In New Caledonia, 75% of assessed endemics are threatened, in Fiji, half the assessed endemics are threatened and in French Polynesia and PNG 30% are threatened. 304. In addition to single-country endemics, there are also 248 species that are regionally endemic – i.e. they are only found in Oceania (Pacific islands plus Australia and New Zealand). A large proportion (48%) of the assessed regional endemics are birds (119 species). These 248 regional endemics comprise only 6% of all Pacific assessed species. 305. The total of single-country and regional endemics that have been assessed is 1,673 + 248 = 1,921, which represents 46 % of Pacific species assessed so far. Therefore the remainder of species assessed, which account for the majority of Pacific species assessed, are widespread species that have been assessed on a global scale. There is a relative deficiency of assessments of Pacific endemic and rare species, which 126 are precise ely the species that dep pend absolu utely on their conservattion within the t region. 306. Threatened d Pacific sp pecies: In tthe Pacific Islands, the ere are multtiple indications of continuing decline in biodiversity. b According to the IUCN N Red List ccategories and a % of assess sed mamma als and 13% % of assess sed birds aree threatene ed with criteria, 21% extinction (Figure 3.4). This is alm most identic cal to the pro oportions off threatened d species at the t global le evel which sstands at 22% of assessed mamm mals and 14 4% of assessed birds. b However, the num mber of thre eatened am mphibians iss far lower in n the Pacific islan nds than at the global llevel, with only o 5% of assessed a sppecies at ris sk of extinction (Figure 3.4). This is parrtly owing to o lack of data (a large pproportion of o ere assessed as Data D Deficient), but b might als so suggest that amphib bians in species we Melanesia are less sus sceptible to o the threats s that face amphibians a elsewhere, or that e at play, inccluding the possibility of o a lack of uniformity some otherr factors are between asssessors in applying th he criteria (P Pippard, 200 09). Figure 3 3.4: Assesssed mamma als (left), birrds (centre) and amphibians (rightt) by Red List categorry. Key: CR = Critical; EN = Endangered; E VU U = Vulnerable; NT; Near Threa atened; LC = Le east Concern; D DD = Data deficient; EX = Extinct; EW W = Extinct in wild. w . (Source: Pippard, P 2009) 307. Map 3.3 shows the rattio of specie es assessed d as threate ened in eachh country by major g The size of the pie chart re elates to the e number off threatened d taxonomic group. species in each e countrry and the sslices repres sent the pro oportion of tthe total number of threatened species in each taxon omic group p. New Caledonia, PNG G and other n countries have high n numbers of threatened species, w which reflects both Melanesian and describ the numberr of species s assessed a bed in these e countries. 1277 3: Map show wing the rattio of specie es assessed d as threate ened in eacch taxonomic group Map 3.3 by coun ntry. (Source: P Pippard, 2009) 308. New Caledonia has the highest p proportion off threatened d plants in tthe region (80% of mately 50% of plants assessed forr Fiji and PN NG are those Red--Listed), while approxim threatened. Other countries with ffew assessments have e disproporttionately hig gh d plants: e.g g. 100% in the t Cook Islands, Naurru and the numbers off threatened Northern Marianas, M altthough abso olute numbers are sma all becausee so few spe ecies have been assessed. A conclusio on from this is that bota anists doingg Pacific pla ant Rede tended to focus on sp pecies that they t already y know or ssuspect to be b listing have threatened. 1288 309. Extinctions: According to the IUCN Red List Categories and Criteria, a species qualifies as extinct (EX) when there is no reasonable doubt that the last individual has died. The majority of extinctions globally in the past few thousand years have occurred on isolated oceanic islands, following human contact (Baillie et al, 2004), and the Oceania region has one of the largest numbers of documented species extinctions on the planet, largely due to the impacts of introduced, non-native species. The number of known extinctions since 1500 AD (784 globally and 122 in the Pacific islands) almost certainly under-represents the number of species that have actually become extinct in this time, as many species are not yet even described. Extinctions tend to be selective, with species-poor genera more prone to extinctions than species-rich genera (Baillie et al, 2004). Gastropods, and the land snails of French Polynesia in particular, have the highest number of recorded of extinctions. Of the 324 species of gastropods assessed, 28% are classified as EX or EW (Extinct in the Wild). The situation for birds is also well documented, with 26 species, or 2% of assessed species, known to be extinct in the Pacific Islands since AD 1500. For many of these groups, prehistoric extinctions were even higher (Steadman 2006). 3.4.3 310. Pressures on Pacific Biodiversity The Earth is currently losing species at up to 1,000 times the pre-human rate of extinction. The diversity of species and everything they offer to humanity cannot support the pressure that we are placing on them. As well as being irreversible, extinctions pose a significant threat to human health, lifestyle and wellbeing. Loss of biodiversity is increasingly evident across the Pacific region. Many or our unique endemic plants and animals and other culturally and economically important plants and animals are now threatened or increasingly rare. Inland, coastal and mangrove forests are being indiscriminately logged and erosion is accelerating. Streams and coastal areas are clogged with sediments and polluted. Traditional mixed agricultural systems are being replaced by monocultures resulting in a serious loss in agricultural diversity and increasing vulnerability to invasive species (pests, weeds and diseases), which are spreading out of control. Coupled with a rapidly increasing population, these factors place increasing pressure on biodiversity. The provision of food, fibre, medicines and fresh water, pollination of crops, filtration of pollutants, and protection from natural disasters are among the ecosystem services potentially threatened by the decline in biodiversity. Cultural services such as spiritual and 129 religious values, opportunities for knowledge and education, and recreational and aesthetic values, are also threatened. 311. The four principal pressures directly driving biodiversity loss in the Pacific are habitat degradation and loss, invasive species, over-exploitation and climate change. However, we know little in detail about threats to most Pacific island threatened species. The impacts of the most important threat factors are often inferred from landscape scale effects (e.g. land clearance) or studies elsewhere (e.g. impacts of invasive species). Introduced species are widely considered to be the greatest threat, but the actual impacts of most invasive species, especially plants, are largely unstudied in the region. Further, local-scale effects of global climate change are almost entirely unknown, as global climate models do not permit reliable prediction at the scale of individual islands. Evaluations of threats to species on the IUCN Red List are therefore often vague at best. The result of this uncertainty and inference is that conservation action is often based largely on parallels: information on threats and conservation needs collected elsewhere. In some cases this is valid, as inference based on landscape-scale changes such as habitat clearance are often obvious, and at least good enough for immediate conservation planning to be carried out with some confidence of success. In other cases, threat effects are obscure and require on-site study to inform the development of adequate conservation plans. 312. Habitat loss and degradation: On the Red List, habitat loss and degradation are the most common reasons given for species declines. At the global level, over 85% of all threatened birds, mammals and amphibians are directly or indirectly threatened by the removal of their habitat (IUCN, 2010). Of the 3769 assessed species in the Pacific islands, over 65 % are threatened by habitat loss and degradation. Conversion of land for agricultural use is a huge part of this threat, especially in the Melanesian islands of PNG, Solomon Islands and Vanuatu, where native forests are still being logged and cleared to make way for crops such as palm oil and copra, destroying not only species themselves, but habitats that other species are dependent upon for their own survival. 313. Introduction of invasive species: Oceanic islands are especially susceptible to invasive species, due to their isolation, their large proportion of endemic species, often unique habitat requirements, and increasing inter-island transport of people and 130 goods. Over 20% of Pacific Island species assessed are threatened by invasive species. Some of the most damaging invasive species include predators such as cats, rats, the brown tree snake (which caused the extinction or severe decline of almost all the indigenous birds, fruit bat and lizards on Guam), the Indian Mongoose, feral pigs, and herbivores such as goats. Others, such as the Indian Myna, tilapia fish and invasive trees such as rubber species and the African tulip tree, out-compete native species. 314. Over-exploitation of natural resources: People have used, and will continue to use, various species for their survival. Unfortunately, with an increasing human population, some wild species are at risk of local and global extinction due to excessive use by humans. Natural resources are relied upon by modern society for many products and services, often without the correct price or value attached to them. Over a third of the species assessed in the Pacific islands are species that are hunted, harvested, logged, fished and extracted for food, pets, shelter, medicines and luxury items. Species of bird, mammal and amphibian used for food and medicine are on average facing a greater extinction risk than species as a whole. This emphasizes the threat posed by biodiversity loss to the health and well-being of people directly dependent on the availability of wild species. 315. Overfishing, often for export, of shark fin, sea cucumbers, giant clams, large reef fish, tuna, deepwater snapper, aquarium fish and live coral has contributed to the threatened status of many species. 316. Domestic and international trade may drive such over-exploitation. In the Pacific, the islands of Melanesia (PNG, Solomon Islands, Vanuatu, New Caledonia) have the largest diversity of species in trade: crocodiles (skins, meat and other products), snakes, lizards, birds (live animals and feathers), butterflies, orchids, bats, tree ferns are all commonly seen in trade, largely for export to Asian and European markets. Throughout the rest of the Pacific, international trade is largely in aquarium products such as corals, fish and clams, most of which is regulated (UNEP-WCMC, 2010). 317. Human-induced climate change: Climate change is set to be one of the major drivers of species extinctions in the 21st century, with approximately 20 – 30% of plant and animal species likely to be at increasingly high risk as global mean temperatures rise (IPCC, 2007). With higher temperatures due to global warming, 131 increased invasion by non-native species is expected to occur. Other impacts of warming include increased sea surface temperatures, sea level rise, ocean acidification and subsequent impacts to marine and reef species. 318. Species in greatest danger of extinction driven by climate change include those with limited climatic ranges. A variety of environmental changes resulting from climate change will also affect some entire communities. Effects include: Sea temperature fluctuations, which will contribute to coral bleaching and disease, disruption of sea turtle egg incubation, disruption of tuna and whale migratory routes and ocean circulation patterns; Increasing ocean acidification, which will cause coral and shellfish dissolution; Habitat degradation and loss(e.g. turtle nesting beaches being washed away by increasing sea levels; protective reefs being degraded and thus no longer providing other organisms with a home); Changes in air temperature, storm and rainfall patterns, especially those that affect the distribution of major habitat-forming species such as trees; for species with a very limited climatic tolerance range, such changes could completely eliminate their suitable habitat from an island. 319. Preliminary analyses of life history and ecological traits suggest that at the global level, up to 35% of birds, 52% of amphibians and 71% of reef-building corals have traits that are likely to make them particularly susceptible to climate change (IUCN, 2009). In the Pacific, a quarter of species have been assessed as potentially at risk from the effects of climate change such as habitat alteration, droughts, temperature fluctuations and storms. 3.4.4 320. Response: Conservation and Sustainable Use of Pacific Biodiversity There are an increasing number of local, national and international initiatives implementing programmes, particularly community-based programmes, to promote the conservation and sustainable use of biodiversity in PICTs. Many of these initiatives are led by consortia or networks of NGOs, regional organizations, national and local government agencies, the private sector and local landowners and resource users. Some of the more notable initiatives are discussed in Part 4. These include the Fiji and Asia-Pacific Locally Managed Marine Areas Networks (FLMMA and APLMMA), the Pacific-Asia Biodiversity Transect Network (PABITRA), the South 132 Pacific Regional Initiative on Forest Genetic Resources (SPRIG), the EU-SPC Facilitating Agricultural Commodity Trade (FACT) project, the Micronesia Conservation Trust (MCT), the Micronesians in Island Conservation Network (MIC), The Micronesian Challenge, and the Pacific Invasives Partnership (PIP). 321. The Threatened Species Working Group of the Pacific Islands Round Table for Nature Conservation (PIRT) is a regional planning and coordination group which exists to promote technical exchange of knowledge and information on threatened species in the Pacific and to increase collaborative efforts with regards to species conservation. The Working Group is currently compiling a matrix of restoration and species conservation actions in the Pacific and a selection of these can be seen in Table 3.9 below. This is a work in progress, and it is likely that over the course of the next couple of years (prior to the 9th Pacific Islands Conference on Nature Conservation and Protected Areas in 2012), this will be greatly expanded, including projects on invasive species management projects that bear on species conservation. Table 3.9: Some examples of species conservation projects in the Pacific. Project Organisation Restoration of important Pacific seabird islands Birdlife International Restoration of priority Pacific island ecosystems for people and biodiversity Birdlife International Leading the recovery of two of Samoa's most threatened bird species David Butler and Associates, NZ Building community capacity to achieve conservation outcomes for priority bat species in Samoa Ecosure, Australia Traditional landowner protection for endangered Ratak Imperial Pigeon Marshall Islands Conservation Society Species Recovery for the Fijian Crested Iguana National Trust of Fiji Islands Conservation of the endangered Fiji flying fox on Taveuni island, Fiji Nature Fiji Mareqeti Viti Resolving an enigma: Conservation Management of the Fiji Petrel Nature Fiji Mareqeti Viti Capacity building to secure the endemic Samoan swallowtail butterfly NZ Butterfly Enterprises Safeguarding the Endemic Henderson Crake during the restoration of the Henderson Island World Heritage Site Royal Society for the Protection of Birds Saving the Critically Endangered Polynesian Ground‐dove Société d'Ornithologie de Polynésie, Manu Saving the Monarchs of French Polynesia for Future Generations Société d'Ornithologie de Polynésie, Manu Saving the Pacific’s Parrots Société d'Ornithologie de Polynésie, Manu The Sustainable Management of the Rarotonga Flycatcher and its habitat Te Ipukerea Society – Cook Islands Developing model species recovery plans in Tonga Tonga Community Development Trust 133 322. Many organisations are working within the region on projects that aim to reverse the trend of declining species and habitats. Although projects focus on a number of themes, there are common goals. For example, most conservation work on the ground includes the following: Improving the quality of life and livelihoods of people through the restoration and sustainable management of island ecosystems, Eradication of invasive species and the prevention of re-introductions, Supporting sustainable management of restored islands and areas, Developing capacity for local communities to manage and monitor their resources post-eradication of invasive species or following restoration, 323. Restoring degraded habitats and key breeding areas. IUCN’s SSC is a science-based network of volunteer experts, which is organised into Specialist Groups, each focussing on a different taxonomic group or geographical area. The role of the SSC is to provide scientific advice to governments and conservation organisations, to support the implementation of MEAs, and to carry out and support the Red-Listing process. Many of the Specialist Groups have produced technical guidelines for conservation projects and initiatives, provide expertise on how best to conserve and manage species, and carry out conservation projects. Conservation Action Plans have been produced for many species, which help to guide conservation efforts globally and regionally. For the Pacific, the following Action Plans are relevant: Cactus and Succulent Plants; Conifers; Cycads; Mosses, Liverworts and Hornworts; Orchids; Palms; Australasian Marsupials and Monotremes; Dolphins, Whales and Porpoises; Dugong; Microchiropteran Bats; Megapodes; Parrots; Amphibians; Sharks, rays and chimaeras; Dragonflies. 324. Protected areas and areas of conservation importance: IUCN defines a protected area as: "an area of land and/or sea especially dedicated to the protection and maintenance of biological diversity, and of natural and associated cultural resources, and managed through legal or other effective means." 325. The World Database on Protected Areas (WDPA - www.wdpa.org), contains information from governments, non-governmental organizations, academic institutions and international biodiversity convention secretariats. Table 3.10 shows 134 the areas of land and sea that are nationally protected in each of the PICTs, according to information contained in the WDPA. However, this information should be treated with caution, as many protected areas are not listed in the WDPA, and many that are listed are not adequately protected. Table 3.10: Protected Areas in 20 PICTs (Nauru and Pitcairn Islands are not included due to insufficient data). Note:LMMA – Locally Managed Marine Areas. Country Number Total Marine Total Total % of Land and Number LMMA of Area (ha) Terrestrial Protected Area Sea Protected of LMMA coverage protected Area (ha) (ha) Sites (ha) areas Kiribati 15 41,082,000 48,455 41,130,455 20.21 Papua New 52 226,188 1,501,425 1,727,613 1.37 86 5,900 Tonga 16 991,130 19,638 1,010,768 2.53 6 9,300 New Caledonia 59 75,068 558,781 633,849 1.10 Marshall Islands 3 68,974 17,454 86,428 0.62 Fiji 44 24,855 42,837 67,692 0.18 217 1,081,600 Samoa 18 9,022 23,768 32,790 1.18 59 12,000 Solomon Islands 9 8,370 21,952 30,322 0.12 113 94,100 Palau 16 25,501 1,067 26,568 4.80 American Samoa 7 17,000 3,442 20,442 2.03 Vanuatu 34 4,007 15,407 19,414 0.47 44 Guam 16 4,212 14,819 19,032 3.56 French Polynesia 4 12,760 3,330 16,090 0.07 FSM 22 420 9,035 9,455 0.09 Niue 3 28 6,034 6,062 1.86 Cook Islands 13 1,192 3,485 4,677 0.05 23 1,800 Tuvalu 1 3,595 0 3,595 0.19 10 7,600 Northern 10 1,184 2,108 3,292 0.08 Tokelau 3 1,000 1,000 0.15 Wallis and Futuna 1 30 30 0.17 Guinea Mariana Islands Islands (Source: www.wdpa.org, and for the two right-hand columns Govan et al., 2009) 326. One of the challenges for the WDPA is developing the standard that will allow the sharing of protected area data between organizations, countries and industry. At 135 5,800 present, many protected areas are not listed in the database because of difficulties in MOUs and the exchange of data. For instance, in the Pacific there are many LMMAs which are locally controlled, owned and utilized areas. The majority of these sites do not appear in the database, which drastically skews the interpretation of how much terrestrial and marine area is under some kind of protection in the Pacific. Improving and increasing MOUs will ultimately result in a globally complete and accurate dataset for protected areas. 327. The WDPA also lists areas of international importance, such as those listed under international Multilateral Environment Agreements. Table 3.11shows the areas listed under the UNESCO, Ramsar and World Heritage conventions. Table 3.11: Areas listed under international conventions. Convention Country UNESCO‐MAB Site Name Marine or Total Area Terrestrial (ha) French Polynesia Atoll de Taiaro Marine 930 FSM Utwe Terrestrial 1,773 Palau Ngaremeduu Terrestrial 12,950 Wetlands of Fiji Upper Navua Conservation Area Terrestrial 615 International Marshall Islands Jaluit Atoll Conservation Area Both 69,000 Palau Lake Ngardok Terrestrial 493 Papua New Lake Kutubu Terrestrial 4,924 Tonda Wildlife Management Area Both 590,000 Samoa Lake Lanoto'o Terrestrial Kiribati Phoenix Islands Protected Area Both 40,825,000 New Caledonia Lagoons of New Caledonia: Reef Diversity and Terrestrial 2,861,400 Both 37,000 Biosphere Reserve Importance (Ramsar) Guinea Papua New Guinea World Heritage Convention Associated Ecosystems Solomon Islands East Rennell (Source: www.wdpa.org) 328. Birdlife International’s Important Bird Areas (IBAs) are key sites for conservation, which hold significant numbers of one or more threatened species, and that hold restricted-range species, biome-restricted species, or large numbers of migratory species. The IBA Programme aims to identify, monitor and protect a global network of IBAs for the conservation of the world's birds and other biodiversity. 136 329. In the Pacific, Birdlife International completed a project in 2008 that aimed to identify areas of international importance for biodiversity on Pacific Islands using birds as indicators. National IBAs have been identified and documented for four PICTs based on extensive field research: Palau (8 IBAs), Fiji (14IBAs), New Caledonia (32 IBAs) and French Polynesia (32 IBAs). Desk-based IBA inventories have also been conducted for a further 13 PICTs. These constitute some of the Pacific’s most comprehensive and useful data on terrestrial biodiversity priority sites. As well as providing baseline information, the establishment of IBAs will increase community ownership of these identified areas of important natural resources, by promoting sustainable management. 330. An LMMA is different from what is commonly known as a Marine Protected Area (MPA) in that LMMAs are controlled and/or owned locally, instead of being designed and managed by higher levels of government. Subsequently, most LMMAs are subject to continued exploitation. Sometimes the LMMA may be managed with the assistance of the government and other times without. In using an LMMA approach, some coastal communities are reviving methods that have been used traditionally as part of their culture for many generations. 331. Many communities throughout the Pacific have designated LMMAs in order to address threats to species and ecosystems such as overfishing, destructive fishing, sedimentation, pollution, physical damage by fishers and tourists, and resource extraction. LMMAs have the potential to enable marine areas to recover from such pressures. Benefits to communities when implemented well include: increased fish populations and reproduction, improved habitat quality (increases in coral, sea grass health), increased capacity to manage resources, increased community cohesion, increased income from marine sources. LMMAs have been established in Fiji, Indonesia, Palau, FSM (Pohnpei), PNG, Philippines and the Solomon Islands (LMMA, 2010). However, the benefits of LMMAs for conservation have largely not been documented. 137 4 POLICY RESPONSE AND PRIORITIES 332. The state of the Pacific environment, the pressures on it and their underlying drivers, as highlighted in Parts 1–3, demonstrate the challenges faced by PICTs and the urgent need to address pressures in order to achieve sustainable development and build resilience. The vulnerability of PICTs to many of the pressures will be exacerbated by economic difficulties and climate change. The ability of Pacific governments and communities to address such pressures is limited by insufficient capacity, including financial constraints. However, this section reviews the responses at different levels (international, regional, national and community) as well as prioritization of environmental issues. 333. Although the commitment of Pacific Islanders to biodiversity conservation and sustainable utilization in the face of significant environmental, social, economic and political pressures is commendable, efforts to meet global targets are still insufficient, due to factors including insufficient resources, lack of capacity, poor infrastructure, lack of data and poor supporting mechanisms (Sheppard 2010). 4.1 INTERNATIONAL ENVIRONMENTAL POLICY INSTRUMENTS AND INITIATIVES 334. Over the past few decades, international agreements have been developed which address environmental issues and challenges. Pacific governments have endorsed many of these agreements, thereby demonstrating their willingness to cooperate in tackling environmental issues. The challenge is not only to ensure that all governments sign relevant agreements, but that they take the necessary actions to fulfil their commitments under them. 335. The last 30 years has also seen a growth in the number of international assessments, such as the Intergovernmental Panel on Climate Change (IPCC), the Millennium Ecosystem Assessment and the Global Environment Outlook. In 2007, the IPCC released its Fourth Assessment Report. The Millennium Ecosystem Assessment was intended to assess the consequences of ecosystem change for human wellbeing. These scientific assessments reflect the work of thousands of experts worldwide, and have led to greater understanding of environmental problems. As a result, a diversity of multilateral environmental agreements (MEAs) has been adopted by countries across the world, including PICTs (Figure 4.1). The 138 number of non-govern nmental stakkeholders in nvolved in environment e tal governa ance has o global (Ma artino et al.,, 2007). grown conssiderably, at all levels ffrom local to Figure 4 4.1: Progresss on the ra atification off major multtilateral env vironmental agreementts (MEAs)). (Source: G GEO 4 Report, UNEP, U 2007) 336. The fragilityy of island ecosystems e s has been the t basis on n which PIC CTs (as SID DS) were accorded special s statu us by the Un nited Nation ns.The 1994 4 Barbadoss Plan of Ac ction, which resulted from the Global Co onference on o the Susta ainable Devvelopment of o SIDS, d by PICTs as a a milesto one in their efforts to achieve susttainable is regarded developme ent (ESCAP, 2006). Su bsequent agreements, a , declarationns and revie ews have underrscored the serious cha allenges fac cing SIDS. A compreheensive revie ew of the Barbados Plan of Action A (BPo oA) was und dertaken in Mauritius inn January 2005 2 and its outccome was the Mauritiu s Strategy. 337. neral Assem mbly Resolutions 62/1991 and 63/213, In a follow-up meeting to UN Gen nvened in Port P Vila, Va anuatu for th he Pacific High-Level H D Dialogue on n the ESCAP con Mauritius Strategy S for Implementa ation, in Feb bruary 2010 0. The meetting conclud ded that PICTs’ ability to cope and a respon nd adequate ely had been n comprom ised by soc cioa culturall factors, bu ut that some e progress hhad been made m economic, ecological and 1399 towards implementing the Mauritius Strategy. More than 30 regional initiatives have been undertaken during the past five years with successes in the areas of conservation, energy, sub-regional shipping, aviation reforms, and tourism (Tipu, 2010). 338. The transboundary nature of environmental problems has necessitated dealing with them by way of international or multilateral environmental agreements (MEAs). Following the Earth Summit in 1992 and the passage of three cornerstone MEAs (the CBD, UNCCD and UNFCCC) there have been several more similar agreements, many of which have been ratified by PICTs. Most and perhaps all, of the world’s important MEAs have been ratified by at least some PICs, including the UNFCCC, the UNCBD, the UNCCD, the Convention on International Trade in Endangered Fauna and Flora (CITES), the Ramsar Convention on Wetlands, the Montreal and Kyoto Protocols to address the breakdown in the Earth’s protective ozone layer and global warming. 339. Management of these numerous MEAs has become a significant problem as all PICTs face major human resource constraints. Efforts have been made to ease the management burden, for example, by simplifying the reporting requirements for each MEA in the biodiversity cluster of MEAs (see Table 4.1). A consolidated or harmonized reporting template has been designed for the cluster as a whole, which is popular with PICTs, although getting acceptance by the individual Secretariats which administer each MEA is proving difficult. Table 4.1: Membership of biodiversity-related MEAs. Key: = ratified; S = signed, but not ratified; X = not signed; Ramsar1 Country WHC2 CITES3 CMS4 CBD5 CCD6 Cartagena International Protocol on Tropical Biosafety Timber Agreement Cook Is X X X X X Fiji X Kiribati X X X X Marshall Is X X X FSM X X X X X Nauru X X X X X Niue X X X X 140 Palau X PNG X Samoa X Solomon Is X X X Tonga X S X X Tuvalu X X X X X X Vanuatu X X X NB: 1 = Convention on Wetlands of International Importance, 2 = World Heritage Convention, 3 = Convention on International Trade in Endangered Species, 4 = Convention on the Conservation of Migratory Species of Wild Animals, 5 = United Nations Convention on Biological Diversity, 6 = International Convention to Combat Desertification 340. Some of the more well-known and important conventions have only been signed by a minority of Pacific island governments and until further commitment is shown by others, these conventions are unlikely to produce the desired objectives. For example, only three Countries have signed the Convention on Migratory Species (CMS). As this convention is concerned with species that do not recognise boundaries, and move across country borders, it is vital that more countries ratify it, if the Convention is to achieve its objectives. Likewise, international trade involves many more countries than the few in the region that have signed CITES, the Convention on International Trade in Endangered Species of wild fauna and flora. Further cooperation between countries and more responsibility by governments is required to ensure the sustainability of species subject to international trade. 341. In addition to the biodiversity cluster of international statutes, PICTs have also ratified numerous pollution-related MEAs, a number of which are reproduced in Table 4.2. Table 4.2: Membership of pollution-related Multilateral Environmental Agreements (MEAs) as at 2008. Key: = ratified; X = not signed; Country London1 MARPOL2 Ballast Basel4 Water3 Montreal Kyoto Protocol5 Protocol UNFCCC6 Cook Is X X X Fiji X X X X Kiribati X Marshall Is X FSM X X X Nauru X X 141 Niue X X X X Palau X X X X PNG X Samoa X X Solomon Is X X X Tonga X X Tuvalu X X Vanuatu X X NB: 1 = International Convention for the Prevention of Pollution of the Sea by Oil; 2 = International Convention for the Prevention of Pollution from Ships;3 = Global Ballast Water Convention; 4= Convention on the Control of Transboundary Movements of Hazardous Waste (1989;5 = Montreal Protocol on Substances that Deplete the Ozone Layer;6 = United Nations Framework Convention on Climate Change, 342. Although funding is available under almost every MEA for implementing activities, PICTs still face significant challenges in developing administrative measures or policies and in enacting implementing legislation. The challenge is not only to ensure that all governments sign relevant agreements, but that they take the necessary actions to fulfil their commitments under them. 4.2 REGIONAL AND NATIONAL POLICY RESPONSES 343. There are many regional and national initiatives and frameworks to conserve, protect and manage the environment and its resources, however the effectiveness of these are questionable. A matrix should collate all of these initiatives to enable an assessment of their implementation in terms of resources allocated or required, institutional capacity, monitoring and evaluation of success. From this, lessons learnt and best practice can be identified, to assist all PICTs in improving policies and their implementation into the future. 4.2.1 344. Regional Environmental Agreements A number of environmental frameworks, strategies and action plans exist for the Pacific region. A compilation of these is maintained by SPREP, where they are available for download from the Pacific Environment Information Network (PEIN) Regional Frameworks and Strategies Directory: http://www.sprep.org/publication/PEIN_Regional_Frameworks.asp. 345. Some regional environmental agreements mirror global MEAs while others are truly regional initiatives which establish and allow for the development of regional 142 concerns and principles. Some of the key regional instruments are listed below and the status of their ratification by PICTs is given in Table 4.3: 1976Convention on the Conservation of Nature in the South Pacific (Apia Convention) 1986Convention on the Protection of Natural Resources and the Environment of the South Pacific (Noumea Convention) 1986Protocol for the Prevention of Pollution of the South Pacific Region by Dumping (Dumping Protocol) 1986Protocol Concerning Co-operation in Combating Pollution Emergencies in the South Pacific Region (Emergencies Protocol) 1995Convention to ban the Importation into Forum Island Countries of Hazardous and Radioactive Wastes and to Control the Transboundary Movement and management of Hazardous Wastes within the South Pacific Region (Waigani Convention). 1956Plant Protection Agreement for the Asia and Pacific Region (PPA) Table 4.3: Membership of selected Regional Agreements by PICTs as at 2008. Key: = ratified; S = signed but not ratified, X = not signed Country Apia Noumea Dumping Emergencies Waigani Convention Convention Protocol Protocol Convention Cook Is X Fiji Kiribati X X X X X Marshall Is X X X FSM X X Nauru X S X Niue X X X X X Palau X S S S S X PNG S Samoa Solomon Is X Tonga X X X X Tuvalu X S S S X Vanuatu X X X X X 143 PPA 346. Other regional plans and strategies include: Action Strategy for Nature Conservation and Protected Areas in the Pacific Island Region 2008-2012, Micronesia Action Plan 2008 to 2010 [The Nature Conservancy] (2008), Pacific Regional Strategy FY2006-2009 [World Bank], Reducing Vulnerability of Pacific ACP States through Island Systems Management [SOPAC], Secretariat of the Pacific Community [SPC] Joint Country Strategies, 2010 International Year of Biodiversity: a Strategic Framework for the Pacific [SPREP] (2010), Action Plan for the Implementation of the World Heritage - Pacific 2009 [UNESCO] (2004), Bird Conservation Priorities and Draft Avifauna Strategy for the Pacific Islands Region [SPREP] (2001), Fishery Ecosystem Plan for Pacific Pelagic Fisheries of the Western Pacific Ocean [WPRFMC] (2005), Fishery Ecosystem Plan for Pacific Remote Island Areas [WPRFMC] (2005) Forest and Tree Genetic Resource Conservation, Management and Sustainable Use in Pacific Island Countries and Territories: Priorities, Strategies and Actions, 2007-2015 [SPC] (2007) Guidelines for Invasives Species Management in the Pacific: a Pacific Strategy for Managing Pests, Weeds and other Invasive Species [SPREP] (2009), Our Sea of Islands – Our Livelihoods – Our Oceania: Framework for a Pacific Oceanscape [CROPs] draft only - agreed by PPAC in July 2010 and submitted to 2010 Leaders Forum for endorsement (2010), Pacific Biodiversity Information Forum [PBIF] Strategic Plan 2007-2009 (draft), Pacific Islands Action Plan for the Implementation of the Pacific Islands Framework for Action on Climate Change 2006-2015, Pacific Island Marine Protected Area Community (PIMPAC) Strategic Plan 20102012 (2009) , Pacific Islands Regional Marine Species Programme 2008-2012 Includes the Dugong Action Plan 2008–2012; Marine Turtle Action Plan 2008–2012; and the Whale and Dolphin Action Plan 2008–2012. [SPREP], Pacific Islands Regional Plan of Action for Sharks: Guidance for Pacific Island Countries and Territories on the Conservation and Management of Sharks [FFA / SPC / Forum] (2009), 144 Regional Plan of Action: Coral Triangle Initiative on Coral Reefs, Fisheries and Food Security (2009), Regional Strategy for the Ex-Situ Conservation and Use of Crop Genetic Diversity in the Pacific Islands Region [SPC] (2006), Regional Wetlands Action Plan for the Pacific Islands [SPREP] (1999), Shipping-related Introduced Marine Pests in the Pacific Islands: a regional strategy (2006) [SPREP / IMO], Strategic Plan of Actions for the Conservation of Western Pacific Leatherback Turtle Population and their Habitats in the Bismarck Solomon Seas Eco-region (2007). 347. The Action Strategy for Nature Conservation and Protected Areas in the Pacific Islands Region (2008–2012) aims to provide a focus for conservation action by addressing a range of environmental issues from the grassroots level through national to regional levels (SPREP, 2009). It highlights the following objectives: Ensure conservation has a development context that recognizes, respects and supports sustainable livelihoods and community development aspirations; Identify, conserve and sustainably manage priority sites, habitats and ecosystems; Protect and recover threatened species and species of ecological, cultural and economic significance; and Manage threats to biodiversity, especially climate change impacts and invasive species. 4.2.2 348. Regional Development Policies Sustainable development is a major goal for PICTs. The financially weak island nations need to seriously pursue development that will elevate the level of wealth for the majority of their people while protecting the health and integrity of their environment. Poverty alleviation, gender and equity must be emphasized in policies and plans, good governance and local action. Political commitment and funding are important to ensure that economic development and a healthy environment are simultaneously achieved in the Pacific Islands. 349. Each nation in the region has to create a sustainable development framework, through partnerships of Government Offices and Regional Development Agencies 145 (RDAs), as they face common challenges and opportunities. Resource use, energy and travel are the main priority areas for action on sustainable development for most PICTs and policy-makers across the PICTs should be encouraged to act on these areas. A range of actions need to be taken to address them, as well as a set of indicators and targets developed to help monitor progress. The indicators need to be chosen to accommodate all aspects of development and require working closely with NGOs, local governments and community sectors to develop plans for integration of climate change adaptation with sustainable development. 350. Appropriate responses to the climate change challenge in PICTs could include work on community visioning, community indicators, local action planning, local economy projects and community waste minimization projects. This work needs to be linked to local government through sustainability indicator projects, corporate strategy development, climate change adaptation strategies and environmental management systems in a holistic, long term way, looking for mutually reinforcing economic, environmental and social benefits. RDAs need to co-ordinate regional economic development and regeneration and assist individual states to improve their relative competitiveness and reduce the imbalances that exist within and between regions to benefit all the nations of the region. RDAs should be working together to identify overarching development priorities in a climate change adaptation framework for PICTs. 351. Poor economic performance, rapid population growth and urban drift, rising quality of life expectations and growing inequalities have contributed to poverty becoming a significant and growing problem in some PICTs. This has put pressure on traditional mechanisms to support individuals and families in need. As a response, the PICTs formulated the Pacific Plan, which reflects the region’s priorities in line with, and in support of, international frameworks such as the Barbados Plan of Action and The Mauritius Strategy of Implementation. As such, the Pacific Plan provides a solid platform for regional cooperation guiding collective positions through the Commission on Sustainable Development and other international forums that advocate the ‘special case’ of SIDS. The collective position of Pacific Islands Forum members in the international arena is a significant tool in garnering support for PICTs as a group and individually and is recognized and valued by other United Nation members. 146 352. The Pacific Urban Agenda was first developed at an ESCAP sub-regional workshop in 2003 and adopted at the ESCAP 60th session held in 2004. Pacific Islands Forum Leaders endorsed the Pacific Urban Agenda in 2005 and it was included in the Pacific Plan. During the second sub-regional Pacific urban gender workshop in April 2007, the ESCAP Pacific Operations Centre in collaboration with the Commonwealth Local Government Forum Pacific Office and the Pacific Islands Forum Secretariat, noted that urban and rural development issues need to be addressed in tandem since migration from rural areas, especially by youth in search of employment, is driving urbanization within many countries of the Pacific. In recognition of this phenomenon, urban development has been integrated in national sustainable development strategies in some countries. For PICTS, urban planning and management policies must focus on the benefits of urban development on local people and carefully consider the advantages and disadvantages of the proposed solutions to urbanization. The 2007 workshop made a wide range of recommendations to address pressing urban management, planning and development concerns (UN Habitat, 2010). The ‘Regional Action Framework’ also calls for the establishment of a ‘Pacific Urban Management Support Facility’ which would organize and convene regional forums to share information, develop capacity, collect data, develop awareness and provide technical support as required (UN Habitat, 2010). 353. PICTs will require a coordinated approach to poverty, trade, gender, sustainable livelihoods, nutrition, and regional food production and distribution practices. Existing food security initiatives within the region should be assessed and, where necessary, amended to ensure that they address the impacts of climate change. Such an approach provides an opportunity to reduce food insecurity and poverty in the short term while building longer term national and regional resilience to climate change. Improvements to local food production are also pertinent to strengthening resilience, especially in a changing climate regime. 4.2.3 Regional Ocean Policy 354. The Marine Sector Working Group (MSWG) of the Council of Regional Organizations in the Pacific (CROP) was responsible for developing a Pacific Island Regional Ocean Policy (PIROP). The draft policy produced was endorsed by the 33rd Pacific Islands Forum in 2002. In doing so, Forum leaders recalled their 1995 decision 147 urging members to become parties to the 1982 United Nations Convention on the Law of the Sea at the earliest opportunity. Leaders called for follow-up action plans, both for the region and for individual countries. The themes and initiatives under the PIROP are listed below. Improve Governance of the Coasts and Ocean: The governance objectives aim to engage stakeholders and leaders and to establish, strengthen, and implement governance mechanisms that contribute to the implementation of the Policy. For ocean and coastal issues to gain the attention and support of officials, policy makers and politicians, it is vital that advocates be empowered at all levels. This theme also proposes to review, strengthen and establish policy, legal and regulatory mechanisms in accordance with national and regional needs and capacities. It is important to put in place appropriate national legislation and policies that will result in an integrated approach to ocean management. Improve Understanding of the Ocean: Sustainable development and management of marine resources and the broader marine and coastal environment relies on a thorough understanding of the relevant issues and processes, including traditional knowledge. Such understanding can only be developed if information is both available and readily understood by all stakeholders. The objectives of this theme are to improve the availability, management, use and dissemination of information in ways that leads to betterinformed decision-making and increased public support for sound ocean management, and to identify and prioritize information needs and expand information gathering efforts. Ensuring shared access to global and regional developments in science and technology is an important aspect of this challenge. Significant needs include inventorying and gaining access to the results of research activities, identifying and addressing gaps in the knowledge base, and coordinating future research. Sustainably Developing and Managing the Use of Ocean Resources: The concept of sustainable development is central to PIROP. The marine environment represents both a primary development asset and a source of basic food security that remains crucial to many Pacific Islanders. The objective of the initiatives relating to sustainable development and management is to increase adoption of practices, approaches and processes that promote sustainable ocean resource use, development and management. Integrated approaches that consider environmental, social, economic and cultural implications of development and resource use are critical if development and management are 148 to be sustainable. Mechanisms for implementing precautionary and ecosystemsbased management are still under development, but the inclusion of these principles in the PIROP affirms that maintaining the health of the ocean is of primary importance for Pacific Island peoples. Adoption of the principle of precautionary management clearly acknowledges that there remains much that we do not know about the marine environment. The call for an integrated, ecosystem-based management approach instead of species or resource-specific management reflects the fact that the ocean is a very complex environment, one where a multitude of factors must be considered when determining how intensively a resource can be targeted, or whether a development should proceed. Maintaining the Health of the Ocean: The Ocean’s health and productivity are determined by regional-scale ecosystem processes and are dependent upon the integrity of the ocean ecosystem and on minimization of the harmful impacts of human activities. Threats to the health of the ocean stem from both marinebased activities and land-based activities. The objective of the initiatives relating to health of the ocean is to reduce the negative impacts of human activities and implement measures that protect and conserve biodiversity, by assessing and addressing all sources of pollution and contamination impacting on the ocean and coasts, strengthening legal and institutional mechanisms that relate to shipping and fishing-related pollution and national and regional capacity to address monitoring, enforcement and clean-up of marine-source pollution. Promoting Peaceful Use of the Ocean: Agreements, laws, policies and regulations will be effective only if they are complied with by individuals, companies, organizations, and governments from within and outside the region. Monitoring, compliance, and enforcement (MCE) initiatives, including local, regional and national coordination mechanisms, need to be strengthened. Capacity building, education and information dissemination at both the community level and for industry and law enforcement agencies are elements of strengthening MCE. The objective of the initiatives relating to peaceful use is to ensure that the ocean is not used for criminal or other activities that breach local, national or international laws. Creating Partnerships and Promoting Cooperation: Partnerships and cooperation provide an enabling environment and are an essential part of achieving sustainable ocean management. The ocean environment that links PICTs also serves to connect activities that occur on land with ocean processes. 149 In addition, some of the ocean’s most valuable resources are migratory and /or transboundary and subject to exploitation by both PICTs and other nations; this serves to heighten the need for collaboration in management of the ocean environment. The objective of the initiatives relating to partnerships and cooperation is to develop partnerships and foster cooperation, both within and outside the region, which will further implementation of the PIROP and make optimal use of available resources. 355. Another additional instrument to support activities on the ocean is the Pacific Oceanscape Framework (A Framework for a Pacific Oceanscape), first proposed by the government of Kiribati and endorsed by leaders at the Pacific Islands Forum as a catalyst for action for the Pacific Islands Regional Ocean Policy (PIROP). The ‘Pacific Oceanscape’ could be a vehicle to build pride, leadership, learning and cooperation across this ocean environment. The key principles of the Pacific Oceanscape are: Integrated Ocean Management: at all scales to foster sustainable development, management and conservation of island, coastal and ocean services; Adaptation to Environmental and Climate Change: to develop suitable baselines and monitoring strategies that will inform impact prediction and understanding of environmental and climate change stressors; Liaising, Listening, Learning and Leading: to articulate and use appropriate facilitative and collaborative processes, mechanisms and systems and research that result in the achievement of the objectives. 356. PICT governments have demonstrated commitment to a number of regional initiatives established to address threats to marine resources and to protect livelihoods. Examples include the Micronesian Challenge, the Mangrove Ecosystems for Climate Change Adaptation & Livelihoods Pacific Mangrove Initiative and the Coral Triangle Initiative for Coral Reefs, Fisheries and Food Security. At the 2009 World Oceans Conference, six Heads of State (Philippines, Indonesia, Malaysia, Timor Leste, Solomon Islands and Papua New Guinea) launched a Regional Plan of Action as a framework to sustainably manage the marine resources that support the economy, food security and the livelihoods of the people living in the Coral Triangle. This framework provides for collective action by development partners, donors, regional organisations and other stakeholders to support the six countries in addressing priorities. Two other PICTs, Fiji and Vanuatu, have been included under 150 this framework through the Global Environment Facility programme ‘Strengthening Coastal and Marine Resources Management in the Coral Triangle of the Pacific’ which will be implemented by the Asian Development Bank. 4.2.4 Water and Sanitation Policy and Governance 357. At the time of this report, water and sanitation policy was in a state of flux in the Pacific region. It is nearly a decade since the Pacific Action Plan on Sustainable Water Management (SOPAC and ADB 2003) and the Pacific Wastewater Framework for Action (SOPAC 2001) were endorsed by regional leaders. In 2011 regional and national policies have evolved to form a complex tapestry incorporating environment, water resource, sanitation and IWRM, with various policies and legislation being developed in most countries. Water and sanitation management have been embedded as part of environmental, health, climate change and economic development policies to meet the specific needs of countries. 358. In mid-2011, the SOPAC Division of SPC was tasked by regional leaders with leading the revision of the regional action plans, with the view to developing a framework to take water and sanitation management forward in the region under an IWRM framework. This process involves the development of national water outlooks to inform the development of national and regional policies. As part of this process, national projects under the regional EU IWRM and GEF Pacific IWRM projects are currently developing national IWRM plans in 12 countries to complement those already in place in Niue and Kiribati. 359. Against this backdrop of reform, the existing regional action plans for water and wastewater management provide an important starting point in the progress of developing new policies. 360. The regional Ministerial Declaration of the Pacific Action Plan on Sustainable Water Management identified six key themes for targeted strategies: improving water resources management in an integrated manner; reducing island vulnerability; raising awareness; appropriate technology and a sustainable skill base; improving institutional arrangements; and sustainable financial models. 151 361. The Pacific Wastewater Framework for Action advocated six guiding principles to deliver the vision, ‘Protect the health of the people and safeguard our fragile environment through improved, effective and efficient management of wastewater’: National wastewater management policies and regulations will be appropriate and acceptable to the people and cultures of the Pacific islands; Appropriate national institutions, infrastructure and information will support sustainable wastewater management; Community participation in wastewater management and sanitation will ensure equitable benefit with recognition of socio-cultural sensitivities; Better access to funding will improve service delivery, and develop the private sector; Viable and sustainable levels of skilled and knowledgeable people within the wastewater sector and communities will improve wastewater management. 362. Water governance is often centralised, focussed in a few government agencies, with little communication and coordination between agencies, communities, traditional governance and the private sector, and limited policy or legislative framework (SOPAC 2007e). Governance is further complicated by insufficient political and public awareness of the critical role of water in supporting sustainable development and the inadequate financing of water and sanitation provision due to poor cost recovery and a lack of ‘economies of scale’ (SOPAC 2007e). There is inadequate knowledge of water resources to inform decision making in most Pacific countries, and communication across sectors and between communities and government is often disjointed (Falkland 2002). Water management and governance was identified as one of the key vulnerabilities in water resource management (UNEP 2011). 363. Nevertheless, recent initiatives to raise awareness and change governance are starting to alter this position, evidenced by the establishment of national inter-sectoral coordination bodies in most countries and interim bodies in the remainder (Table 4.4). Further evidence is provided by the development and/or review of draft water resources policies and strategies underway in nearly all countries, and draft legislation at various stages of progress in Fiji, Tonga and Cook Islands, supported by the GEF Pacific and EU IWRM Projects, executed by SOPAC-SPC. 152 Table 4.4: State of water resources management of Pacific countries (updated from SOPAC 2007d). Country Inter‐sectoral water coordination body National water resources policy D / I D / I FA NE NE NE NE Fiji D / I D / I D / I D / I NE Kiribati D / I D / I D / I D / I NE FA D / I NE D / I NE Nauru D / I NE NE NE NE Niue D / I D / I D / I NE NE Palau FA NE NE NE NE Papua New Guinea D / I D / I D / I NE NE Samoa D / I FA D / I D / I NE Solomon Islands D / I D / I D / I NE NE Tonga D / I NE D / I NE NE Tuvalu D / I NE NE D / I NE Vanuatu D / I D / I FA D / I NE Cook Islands Federated States of Micronesia Marshall Islands Water resources legislation IWRM Plan/Strategy D / I NE Water Use Efficiency Plan NE Key: NE = Not existing;D / I =Draft/interim; FA = Formally adopted, fully inter-sectoral and active. 4.2.5 Land Policy Reform 364. Land policy reform is getting higher on the agenda in the Pacific region. PNG, Vanuatu, Solomon Islands, Samoa and Tonga are all undertaking or considering ways of strengthening their land use regulation systems. The growing push for reform is not coming from governments alone as Customary landowners in many countries recognise that their present and future livelihoods depend on sensible and sustainable management of traditional lands. 365. Since over 80% of land and marine resources in the Pacific are held in customary tenure arrangements, local communities are critical to any process that aims to 153 address the management and sustainable use of resources. Participatory approaches to conservation and development have been increasingly used with successful results. The SPC policy brief 2/2008 outlines some important policy options to consider. Promote Sustainable Development. All PICTs must work towards sustainable patterns of production and consumption. The development of a sustainable development framework through partnerships of landowners, government and regional development agencies can facilitate good decision-making regarding land use practices. Institutionalize Land Use. The establishment of national land use units can help to coordinate and facilitate land use issues between national and grassroots levels. The mainstreaming of land use planning into national sustainable development strategies can help to address land use issues. Capacity Building. National capacity building of the public sector, NGO and community groups in all aspects of land use and sustainable development is essential. Formulate or amend land legislation to address land erosion or accretion due to climate change and extreme climate events. 4.2.6 Regional Energy Policy 366. Efforts to reduce the dependence of PICTs on fossil fuels and address energy security are in progress. SPC completed the Towards an Energy Secure Pacific framework for action on energy security in 2010 (SPC, 2010). This document was designed to provide guidance to PICTs to enhance their national efforts to reduce their dependence on fossil fuels and achieve energy security and, in line with the principle of the Pacific Plan, to clarify how regional services can assist countries to develop and implement their national plans. The framework outlines seven themes for action: 1 Strong leadership, good governance, effective multi-sectoral coordination and partnerships for an energy secure Pacific; 2 Strengthened capacity, policy, planning and regulatory frameworks to support coordinated development of the energy sector; 3 Increased sustainability of sources of energy and strengthened efforts to explore other sources of clean and affordable energy nationally and regionally; 154 4 Improved production, supply and accessibility of electric power; 5 Optimal use of energy in all sectors, particularly in transport and electricity; 6 Timely, accessible and accurate energy data and information as a basis for effective planning and decision-making in the energy sector; and 7 A financial plan that captures all funds flowing into the region’s energy sector by funding source and implementation arrangements, supported by a comprehensive monitoring and evaluation framework. 367. The Framework highlights eleven guiding principles for PICTs which are summarised below. 1. Leadership, transparency, decision-making and governance: The bulk of energy in the region is provided by the private sector. Leadership is crucial to planning energy security. Transparent decision-making, clear governance mechanisms and linkages to national budget processes will help ensure effective implementation of sustainable energy initiatives. The role of the private sector should be recognised and defined within a clear and transparent regulatory framework. 2. National-led solutions supported by regional initiatives: To be effective and sustainable, energy solutions have to be enacted at the national level. However, strategic regional cooperation and coordination can add value to national solutions. There will be an appropriate balance between regional and in-country work to improve the understanding of issues and delivery of effective energy services at country level. In-country efforts will be tailored to the needs of individual PICTs, with special attention to the smaller states. Where practical, case studies of regional issues will be developed or commissioned and shared with all PICTs. 3. Coordinated whole-of-sector approach: Within countries, ensuring energy security requires a coordinated whole-of-sector approach. High-level policy support and the engagement of government sectors such as energy, finance, planning and environment, transport, infrastructure and communication, are required. Industry stakeholders, including all those involved in the provision of energy and energy services, also need to be engaged. In addition, energy plans should be time bound, realistic, measurable and costed. The starting point for energy planning should be the demand for energy services. Regional 155 cooperation is essential to ensure a harmonised approach to establishing standards and policies and to facilitating trade in petroleum products. PICT energy security can be enhanced through partnerships between island nations, while regional cooperation can address challenges such as energy security policies, trade and investment promotion, research and development, and capacity building. 4. Need for sustainable livelihoods, and recognition of culture, equity and gender issues: Interventions must address inequities in access. They should consider gender and cultural needs, and support efforts to reduce poverty, based on facilitating access to adequate, reliable and affordable energy sources and services at all times by all people. 5. Link between sources of energy (primary and secondary), energy services and uses: An understanding, and delineation of the sources and uses of energy based on a ‘commodity chain pathway’ approach could lead to a more strategic approach to categorizing components of the energy sector and provide greater clarity on challenges and solutions. A major impediment to developing solutions is the way in which various aspects of energy, including petroleum, renewables, power, transport and energy efficiency and conservation are grouped together. Under a commodity chain pathway approach, these aspects of energy can be put into three categories: primary sources and production (petroleum, alternative liquid fuels, renewables) including supply-side and demand-side; secondary source of energy or energy conversion (electric power) including supply-side and demand-side; and end-use energy consumption (efficient and productive uses of energy in the transport sector, in particular, but also including households, agriculture, commercial and industrial sectors). 6. Cost-effective, technically proven and appropriate technological solutions: Energy technologies should be considered when they have been proven in environments similar to those of PICTs. All assessments of proposed investments (whether grant, loan or internally financed) will include assessments of economic and financial viability and social and environmental implications, thus giving PICTs and end users a realistic picture of likely overall benefits and costs. Energy efficiency benefits should be seen as a starting point. Serious efforts will be made to develop practical and effective financial mechanisms for energy. 156 7. Environment friendly energy solutions: While the region’s dependence on fossil fuel will continue, efforts will be made to adopt strategies that minimize harmful effects on the environment through investment in cleaner fuels, renewable energy, energy efficiency and conservation. Support to PICTs will respect and protect the region’s biodiversity and natural ecosystems. Any advice on energy investments should consider climate change issues such as adaptation, greenhouse gas reduction, and where possible, the clean development mechanism or other carbon credit/carbon offset benefits. Where there are likely to be negative impacts on biodiversity or land, water or air quality, remedial action will be incorporated. Mechanisms will be developed to improve the likelihood of long-term sustainable operation, to minimize pollutants and waste, and to reduce GHG emissions per unit of energy produced. 8. Evidence-based planning – the importance of energy statistics: Lack of energy statistics undermines effective planning. Accurate, timely and accessible energy information is essential for effective decision-making. Energy statistics are sometimes guarded for commercial reasons. The emphasis will be on working closely with the private sector to improve the availability of data for mutual benefit. Expertise will be sought in the collation and analysis of data, development of minimum development energy indicators, and reporting of energy statistics and information to enhance evidence-based decision-making, particularly in areas such as the true cost of energy (especially of electricity and fuel, energy imports, resources, production and consumption. 9. Appropriate investment in human capital: Effective planning and strategic management of the energy sector requires state of the art technical expertise, with support from staff with the appropriate skills to deliver services. Investments are needed, both within and outside the energy sector, to build the skills needed for planning, management and implementation of national energy plans. The aim is to strengthen the human capacity of public and private institutions, including academic and training establishments. 10. Many partners, one team: There are many partners in the energy sector. All have objectives that are primarily aligned to national needs. The approach will be collaborative, to address national priority needs and plans based on one implementation plan. All partners will need to work as a team. 11 Financing, monitoring and evaluation: International and regional commitments which seek better alignment of development assistance (e.g. the 157 Cairns Compact and Accra Agenda for Action), provide the platform for a new approach to financing the energy sector. The principle of one implementation plan, coordinated financing (primarily around national plans and initiatives), and one monitoring and evaluation (M&E) framework are the foundation for the ‘many partners – one team’ approach. The M&E framework will be closely linked to relevant implementation and financing plans. 368. Almost all PICTs have an energy policy that envisages a shift to using renewable energy. PICTs have started investing in renewable energy sources, to reduce fossil fuel dependency: for example, the government of Vanuatu uses coconut oil (blended with diesel or kerosene) for vehicles, and Marshall Islands has cars and boats running on coconut oil. Tuvalu and Kiribati are using solar generated electricity and on Fiji, Solomon Islands, Samoa and Vanuatu hydro-electric power is being increasingly used for electricity production (United Nations, 2010). According to Fiji Department of Environment statistics compiled in 2003, there were about 1200 SHS systems in Fiji and the number has since increased considerably. PICTs have also undertaken development of wind energy in recent years. Some notable wind farms are: Butoni wind farm (Fiji), 10 MW (37 x 285 kW turbines): 11.5 GWh/year expected; ENELCO Wind Farm (Vanuatu), 2.75 MW on the island of Efate; Plum in New Caledonia. 369. Recently, a bio-fuel electrification scheme has been started in Koro Island in Fiji where village generators are run on locally produced coconut oil. The villagers used to buy diesel for F$4.70 a litre but now have locally produced bio-fuel available at F$3.80 per litre. The villagers have formed a cooperative to manage the scheme (Village goes nuts over biofuel, Fijitimes, November 2009. http://www.fijitimes.com/story.aspx?id=134648). A new Biodiesel Group (Fiji) has begun selling coconut bio-diesel commercially from a service station in Lami. According to the company, in April, 2010 there were 300 vehicles running on this fuel (Biodiesel brings jobs, Fijitimes, April 2010. http://www.fijitimes.com/story.aspx?id=144317). 4.2.7 370. Regional Agency Support SPREP is the lead regional agency for environmental protection and sustainable development in the Pacific, with 22 PICT members, although there are numerous environment-related initiatives and projects amongst other regional agencies such as 158 SPC and PIFS. The SPREP Strategic priorities for 2011–2015 address many environmental and climate change challenges, in four following key areas. 1. Climate change: By 2015, all Members will have strengthened capacity to respond to climate change through policy improvement, implementation of practical adaptation measures, enhancing ecosystem resilience to the impacts of climate change and implementing initiatives aimed at achieving low carbon development. SPREP will support Members to plan and implement national adaptation strategies and pilot projects, and to integrate climate change into national planning and development processes. SPREP will lead the coordination of regional climate change policies and programmes through the Pacific Climate Change Roundtable, the Pacific Islands Framework for Action on Climate Change (PIFACC) and the CROP Working Group on Climate Change. It will develop partnerships with donors involved in climate changes issues to implement adaptation and mitigation policies and programs in the region. Increased awareness and understanding of the potential impacts on communities and livelihoods is essential. The strategies and targets support education and awareness programmes and regional networks and information portals to improve the availability of climate change information to scientists, policy and decision makers. It will promote activities that strengthen Members’ ability to engage in climate change negotiations, access international funding sources and meet their international responsibilities such as under the United Nations Framework Convention on Climate Change. 2. Biodiversity and ecosystem management: By 2015 all Members have improved their sustainable management of island and ocean ecosystems and biodiversity in support of communities, livelihoods and national sustainable development objectives, through an improved understanding of ecosystem based management and implementation of National Biodiversity Strategic Action Plans. This strategic priority will focus on providing technical and advisory support to Members to design and implement National Biodiversity Strategic Action Plans and their equivalents in territories. Better understanding of how healthy, effectively managed terrestrial and coastal ecosystems contribute to islands’ resilience to impacts will be an essential component of Pacific Island climate change policies and adaptation measures. The cultural dimension of environmental concerns will be addressed by taking into consideration traditional biological knowledge and practices, and regional initiatives to foster natural and cultural heritage. The aim is to improve species conservation and management 159 by encouraging the effective implementation of international agreements and supporting cost effective regional programmes and policies. These include existing regional mechanisms such as the Action Strategy for Nature Conservation, Guidelines for Invasive Species Management in the Pacific, the Whales and Dolphins Action Plan, the Regional Shark Action Plan, and may require additional regional and national mechanisms. 3. Waste Management and Pollution Control: By 2015 all Members have national waste management and pollution control policies, strategies, plans and practices in place for minimization of terrestrial, atmospheric and marine pollution, hazardous waste, solid waste and other land based sources of pollution. This responds to Members’ directive for SPREP to take action on waste management and pollution control. The Secretariat will improve Members’ technical capacity to manage pollution, solid waste and hazardous chemicals through training, technical advice and support. Good examples of effective waste management and pollution control in the region will be used as case studies. SPREP will promote the setting up of national and regional waste management infrastructure. SPREP will promote innovative funding measures in support of waste policies. To achieve behavioural change, SPREP will support renewed efforts to educate communities through targeted awareness campaigns. Monitoring of solid and hazardous waste disposal programmes and pollution incidents also needs to improve. The Secretariat will promote bilateral and multilateral partnerships to support national activities. 4. Environmental Monitoring and Governance: By 2015 Members will have the capacity to develop and implement transparent and robust frameworks and processes for improved environmental governance, planning, monitoring and reporting, and the Secretariat will be producing periodic regional State of the Environment assessments. SPREP will enhance the tools available to enable Members to make sound environmental decisions in the pursuit of sustainable development. Policy and legislation should be integrated, and strong impact assessment and enforcement systems are essential. Strategies and targets address the need for improved monitoring, through national and regional data collection and analysis, and a periodic (but regular) State of the Environment reporting system. 371. The Pacific Island Round Table for Nature Conservation (PIRT) is a growing coalition of conservation organizations and donor agencies which was established in 160 1997 to increase effective conservation action in the region. Its objective is to improve coordination and collaboration in the Pacific, which is largely done by implementing the Action Strategy for Nature Conservation in the Pacific. All parties involved in conservation in the Pacific are called on to adopt the principles of the action strategy and align their current and planned work to contribute to its goals and objectives. The PIRT assists all countries and organisations in the implementation of the Strategy. 372. The Secretariat of the Pacific Community (SPC) is the Pacific region’s largest regional scientific, technical, social, economic, policy and research organisation providing services to the 22 PICTs. SPC’s vision for the region is a secure and prosperous Pacific Community, whose people are educated and healthy and manage their resources in an economically, environmentally and socially sustainable way. 373. SPC implements programmes and activities that cover almost all the key economic, environmental and social sectors, including: the natural resources sector (agriculture, aquaculture, fisheries, forestry, water); the human and social development sector (education, health, sanitation, culture, gender, youth, human rights), the economic development sector (energy, ICT, infrastructure and transport); the oceans and islands sector (coastal zone management, geological assessments, sea-bed mapping, maritime boundary delineation); and cross-cutting areas (disaster risk reduction, statistics and demography, food security and climate change). The overlap of these sectors and environmental management and climate change mitigation and adaptation are evident. 374. The key delivery vehicle for SPC is the Joint Country Strategies (JCS) process, which aims to support the PICTs to develop and strengthen their national enabling environment through “whole of government” and “whole of country” approaches. The JCS is complemented by a range of other national and sector-focussed intervention approaches across the sectors that SPC is engaged in. 375. The SPC Statement on Climate Change identifies key concepts that include: Development of “no regrets” integrated risk management approaches across all sectors, planning and monitoring. 161 Supporting the building of capacity to recognise and bolster resilience to existing needs at the sector level to lay the best possible foundation for more specific future adaptation and mitigation responses. 376. The Pacific Meteorological Services and Pacific Meteorological Council were established to develop and support a network of meteorological services within the Pacific Region. SPREP will continue its support of these organisations in developing the skill base and knowledge transfer between PICTs and to improve the ability and willingness of PICTs to collect, monitor and utilize meteorological data in everyday decision making. 4.2.8 377. National Environmental Policies and Legislation All PICTs except Kiribati and Nauru have adopted National Biodiversity Strategies and Action Plans (NBSAPs), and the NBSAPs of these two countries are in the process of final approval. National Climate Change Adaptation Strategies will be a key mechanism to minimize the damage due to climate change, bring improvements in economic outputs, investment and education, and combat poverty and social exclusion through the generation of employment opportunities. 378. While sustainable development is entrenched in national policies and strategies in PICTs, there is a need to translate these policies into effective environment laws and actions in tandem with multilateral environmental laws. Most PICTs now have “environment framework” laws, sometimes subsuming but frequently supplemented by a number of sector specific laws regulating areas such as waste and pollution, ozone depletion, environmental impacts and biodiversity loss. How effective these laws are can only be tested by enforcement, which is the next significant phase of work. Once a functioning enforcement programme is established, countries can better assess their progress and modify these laws or enforcement processes as needed. National and sub-national programmes need to be established and linked. Grass roots entities such as villages, churches, women’s and youth groups and the like, most of which are usually involved in environmental management and sustainable development practices can be assisted with monitoring and enforcement using customary laws and village by-laws. 379. Environmental laws, where they exist, are in response to development activities and environmental threats as well as commitments under international agreements. 162 Comprehensive environmental legislative reviews were first conducted in the early 1990s and more recent reviews are being conducted, although in an ad hoc manner. Environmental laws can then be drafted to address identified gaps and stakeholder opinion. Key environmental legislation can be found on the PACLII website www.paclii.org/ and a sample is provided at www.sprep.org/legal/national.htm. 380. Many PICTs have enacted over-arching environmental legislation, e.g.: Cook Islands Rarotonga Environment Act 1994-95 Fiji Environmental Management Act 2005 Kiribati Environment Act 1999 Papua New Guinea Environmental Planning Act Samoa Lands, Survey and Environment Act 1989 Solomon Islands Environment Act 1998 Vanuatu Environment Management & Conservation Act 2002 Tuvalu Environment Act 2009 Such Acts are almost always in the form of a framework, establishing institutions and management procedures and bestowing powers and discretions but leaving details to be dealt with by way of regulation. They are intended to be supplemented by specific Acts that deal with each environmental issue. 4.3 GOVERNANCE 381. The term “governance” has been applied to any form of collective human action (Graham, Amos et al., 2003; Olowu, 2007). Governance theory recognizes that the act and practice of governing extend beyond government institutions to citizens, communities and civil society. The complex web of inter-relationships and interdependencies means that Pacific Island communities are in need of government institutions for social and economic development, though this is often ignored by Pacific island governments. Civil society can play a critical role in facilitating societal and national development aspirations. Governance is thus about relationships between and amongst government institutions and civil society; it is about politics and power, how that power is distributed, and accountability and transparency. 163 382. Bringing governments closer to the people is itself a policy for sustainable development: the idea of ‘thinking globally – acting locally’ has long been associated with sustainable development. The devolved administrations in PICTs have the opportunity to deliver sustainable development that reflects their institutions, their land- and ocean-scapes, their culture and way of life. The governance priorities in the Pacific Plan are: Regional support to consolidate commitments to key institutions such as audit and ombudsman offices, leadership codes, anti-corruption institutions and departments of attorneys general; judicial training and education; Regional support to the Forum Principles of Good Leadership and Accountability; Enhancement of governance mechanisms, including in resource management, and in the harmonization of traditional and modern values and structures; Upgrade and extension of country and regional statistical information systems and databases across all sectors; Where appropriate, ratification and implementation of international and regional human rights conventions, covenants and agreements and support for reporting and other requirements; and Development of strategies to support participatory democracy and consultative decision-making (including youth, women and disabled), and electoral processes. 4.3.1 Environmental Governance 383. Environmental governance is generally defined as “encompassing the relations and interplay among government, non-government structures, procedures and conventions, where powers and functions directly or indirectly influence the use, management and control of the environment” (Jefferey, 2005; Olowu, 2007). The concept of governance also emphasizes the importance of how decisions are made and the need for citizens and interest groups, particularly those who are affected by the decisions, to participate in the decision-making process and have their voices heard (Graham, et al. 2003). 384. Social and economic development is closely linked with the environment in PICTs, whose size and location present special environmental challenges to policy-makers. Environmental issues have begun to take centre stage in PICT public policies and planning documents as well as becoming a core component of their international diplomacy and discourses. The vulnerability of PICTs to environmental threats 164 undermines their survival and existence. Climate change impacts including sea-level rise represent the most serious environmental threats to them. Government policies, such as land tenure systems and tax policies all affect the environment and its governance. 385. The literature on environmental governance tends to focus on the top-down approach which seeks solutions by focusing on reforming formal institutions, on the basis that the reason for the crisis of the environment is institutional weakness. More recently, a growing body of literature champions the ‘bottom up approach’ and the role of communities, civil society and NGOs in the governance process. The key role of civil society is recognized as leveraging the power of the people which is easier when working with and through them. 386. In addition, environmental governance denotes the involvement of various levels of government: national, regional, district and local. In PICTs, the majority of the population still resides in rural areas, and there is a very strong bond and sense attachment to village and community, hence the importance of factoring the role of villages and local communities into development. 387. Traditionally Pacific societies were self-contained and self-sufficient. Their world-view was moulded by and confined to their immediate environment. Attempts by more powerful island groups to extend their political influence and control to nearby island groups were also common. Even then, the main focus of socio-political, economic and religious activities was local in nature. This is exemplified by strong and active local community governance in Pacific societies. Whilst the majority of Pacific societies are still rural, they are now linked to national governments in capital cities as well as the wider world. Contemporary politics cross local and national political boundaries. Island communities are enclosed by national boundaries with nationstates belonging to regional and international bodies. 388. Contemporary socio-economic and political arrangements are numerous and complex. A holistic approach is needed to deal with environmental challenges. The international community has taken a number of steps towards resolving these issues. Several regional organizations, notably the Pacific Forum of Leaders, SPC and SPREP have also made important declarations towards improvement in the protection and management of the environment. National governments have made 165 important commitments in their policy and planning documents. Island countries are also at the forefront in international negotiations on Multilateral Environmental Agreements. 4.3.2 389. Climate Governance PICTs are at serious risk of being adversely affected by climate change. It is because of this real threat to their livelihood, security and well-being that PICTs have continued to call for urgent action to reduce greenhouse emissions and further real commitments in the future by major emitters. 390. Climate governance refers to the decision-making systems and processes, decisions and actions by, capacity of, and inter-relationships between the key actors involved at national, regional and international levels related to climate change. The real actions are at regional and international level in particular, since collective efforts are more effective at influencing the attitudes and policies of developed countries than individual attempts. The latest round of negotiations at the Cancún UN Climate Change Conference clearly demonstrated the seriousness of Pacific Nations when it comes to climate concerns: SPREP reported strong representation by PICTs, with Heads of State, Environment Ministers and Ambassadors in attendance. SPREP organized the preparatory meeting for Pacific delegations in Cancún from 21-23 November, 2010. 391. In his address to the General Debate of the 65th UN General Assembly on 25 September 2010, His Excellency, Anote Tong, the President of the Republic of Kiribati, made it very clear that he believes “…climate change remains the greatest moral challenge of our time.” (His Excellency Anote Tong, 2010) He continued that “… while it affects all nations of this planet the irony is, it is the poorest and the smallest countries with the least contribution of greenhouse gases which are paying the ultimate price in order that the lifestyles and development agenda of some countries may be maintained.” He asked, “Where is the justice in that?” 392. The President of Kiribati is not alone in his quest for a real commitment from the international community and a more effective regime for reducing the emissions of greenhouse gases. Leaders from Fiji, Samoa, Tuvalu, Cook Islands and others have also actively participated at international conferences and meetings. At the national level, PICTs are making concerted efforts to implement national adaptation 166 programmes and other climate change activities. However, all these are being coordinated and managed by national governments with relatively little input from local governments and rural communities. This is not to say that national coordinators in Pacific capital cities do not work with local communities and authorities. Capacity building workshops and training are often conducted in rural and outer-island communities. It is unclear however, whether those local authorities and communities are active or passive participants in the efforts to find lasting solutions to the problems relating to climate change impacts. 393. At the regional level, the Leaders of the Pacific Islands Forum at their 2010 meeting made it clear that climate change remains “…the greatest threat to the livelihoods, security and well-being of the peoples of the Pacific” (Pacific Islands Forum Secretariat, 2010). Since 1991, Pacific Forum Leaders have made resolutions on environmental matters such as Law of the Sea, development of oceanic resources and nuclear testing and “have been calling on the international community to take concerted actions to reduce emissions of greenhouse gases into the atmospheres” (SPREP, 2005). Over the years, Forum Leaders consistently reiterated their deep concern over this serious and growing threat to the economic, social and environmental well-being of PICTs, their communities, peoples and cultures (Pacific Islands Forum Secretariat, 2005 & 2007; SPREP 2005). Adaptation to climate change is now an inevitable requirement just as much as mitigation. The need for stronger efforts to support adaptation to climate change in developing countries is clear and undisputed (The World Bank, 2010). 394. Pacific Forum Leaders also want to lead by example on matters concerning climate change. There is potential to integrate climate change and adaptation programmes into mainstream national sustainable development plans and strategies (Pacific Islands Forum Secretariat, 2006). Additionally, Leaders agreed to the designation of climate change as the theme of the 2008 Forum, when they reiterated the great seriousness with which they regard the growing threat posed by climate change and affirmed their commitment to the development and implementation of Pacific approaches to combating climate change (Pacific Islands Forum Secretariat, 2008). The following year, they resolved to have climate change as one of five themes and priorities for the Pacific Plan, which had been endorsed by Forum Leaders in 2005. The Plan embodies and gives effect to the Leaders’ vision for a region “of peace, harmony, security and economic prosperity, so that all of its people can lead free and 167 worthwhile lives” (Pacific Islands Forum Secretariat, 2005). At the 2010 Pacific Islands Forum, the Leaders underscored the urgency for real commitments on climate change. For the first time, they referred to climate change as the greatest threat to the communities and peoples of the Pacific. There was agreement that negotiations must be maintained at the highest level with concerted efforts by Forum members at all levels to address the impacts of climate change on Pacific peoples (Pacific Islands Forum Secretariat, 2010). 395. National efforts are continuing on the mainstreaming of climate change into national plans. At the regional level, a mid-term review of the Pacific Islands Framework for Action on Climate Change (2005) and its accompanying action plan is being undertaken to ensure that national and regional initiatives remain relevant and coherent. At the international level there is support for the assertion and contention that climate change is a real problem and the greatest threat to human existence. 396. There is a strong case that the achievement of Millennium Development Goals (MDGs) is threatened by climate change. PICTs, however, often do not have the resources to adapt effectively to changing climatic conditions and increased risks of extreme weather. They will need international support, as well as stable and predictable funding to formulate policies and to build and establish national capacities. Adaptation efforts in developing countries must be supported by multiple sources, including funds mandated by the United Nations Framework Convention on Climate Change (UNFCCC). The international community contributions to those funds should be complemented by new forms of funding in the form of sharing of proceeds on carbon market transactions, a fee on bunker fuels, or other financing mechanisms. Since market-based mechanisms such as carbon trading are unlikely to support adaptation finance, it will be more difficult to attract private funding and investment for adaptation measures than for mitigation measures. Adaptation therefore needs to become an integrated part of a country’s general development policy, backed by official development assistance (ODA) and by national, multilateral, and dedicated climate funds supporting developing countries’ transition toward climate-resilient economies. 4.4 ENVIRONMENTAL KNOWLEDGE, AWARENESS AND DISSEMINATION 397. Adequate responses to environmental challenges require good scientific, technological and socio-economic data, for formulating and implementing 168 environmental policies. There is lack of commitment from national and regional governments to conduct research and invest in collection of much needed data, which can be time consuming and expensive. There are inconsistencies in data collection methods and consequent difficulty in interpreting information. Similarly there is contradiction in reporting of data that leads to disagreement and lack of confidence in the information and the ability to make sound judgements. 398. Data storage, security and access remain significant issues. Different CROP agencies store various data and information that could be useful for national and regional applications, but timely access is a challenge. Limited communication, collaboration, coordination and networking within and between countries are major hindrances in implementing responses and priorities to build the resilience of communities, leading to unnecessary duplication of activities and a waste of resources and time. 399. Information and Communication Technology (ICT) has been recognized by national governments as an important tool to achieve sustainable development. ICT has boosted knowledge in society on topics such as new forms of solid waste management, the use of renewable energy technology, and use of ‘green development’ technology. However, research and development in environmental science within PICTs is weak or non-existent in tertiary institutions (except for Fiji, Samoa, and PNG), due largely to resource constraints. The programs currently being offered at the University of South Pacific aim to deliver a better understanding of nonrenewable geological and environmental resources and improving knowledge on geological events such as tsunamis, earthquakes and sea level rise would contribute to public policies and practices to deal with them. 400. SPREP and SPC are the main regional, inter-governmental organizations with the mandate to deal with knowledge generation and information dissemination on environment-related matters. The bulk of these agencies’ work programmes are supported by development partners and agencies. They have contributed to the pool of knowledge in sustainable development and the environment and there is a need to continue, and where possible, increase support to such organizations. It is also important to consider and include the documentation and recognition of traditional knowledge to complement modern science in national and regional initiatives to achieve sustainable development. 169 401. The Framework for Action on ICT for Development in the Pacific, 2010 recognized that data on ICT use in the region are not robust and often out of date, but that the following challenges face the region: Most PICTs have less than 10% tele-density, with a far lower percentage for rural areas and remote islands. With the introduction of deregulation to the telecommunication industry in some PICTs, mobile density in some countries has increased progressively with Samoa, Tonga and Fiji having around 90% coverage and Vanuatu approaching 50% mobile density in the past two years. Only 30% of PICTs have national ICT policies even though this has been a priority in the past few years; Despite the growing reliance on ICT and the crucial role it plays in our society, only three PICTs have legislation that address to some extent the misuse of ICT for criminal purposes; None of the PICTs have legislation to enable electronic commerce; Only five countries have e-government plans despite the huge potential benefits of using ICT to deliver government services effectively and efficiently; Broadband penetration in most PICTs is only about 1%; Monthly fees for basic broadband (256 kbps) in PICTs range from US$ 25 to US$ 1000. PICTs with liberalized telecommunication sector and access to submarine fibre optic cable generally have cheaper broadband; National meteorological and climatological services and national disaster management agencies, which rely upon ICT resources to monitor and disseminate environmental hazard warning information, continue to be challenged to ensure delivery to the last kilometre, village and atoll from national and regional warning centres. 402. The themes and outcomes of the Framework are summarised below. Leadership, governance, coordination and partnership: Strong leadership, governance, effective multi-sectoral coordination and partnerships to fully utilize ICT as a tool for development in the Pacific. Develop mechanism to coordinate a multi-partnership holistic approach to ICT development that has an appropriate monitoring and evaluation component. 170 ICT policy, legislation and regulatory frameworks: Strengthened ICT policy, planning capacity, and legislative and regulatory frameworks for ICT to provide an enabling environment for sustainable development. ICT policy, legislation and regulatory frameworks that provide a conducive and enabling environment for social and economic sustainable development. ICT policy, legislation and regulatory frameworks that promote open and non-discriminatory access to ICT. ICT policy, legislation and frameworks to address socially undesirable activities. ICT policy and regulations those are consistent with international and national laws, regulations, technical standards, and obligations. ICT human capacity building: Sustainable ICT workforce and an ICT literate populace. Raise ICT awareness and improve ICT skills and appreciation of policy-and decision-makers. Develop a sustainable ICT workforce. Improve basic skills of citizens. ICT infrastructure and access: Improved domestic connectivity and access to ICT. Encourage private sector investment in ICT infrastructure. Establish the appropriate ICT infrastructure and initiatives to support and facilitate national sustainable development. Ensure that ICT networks and support infrastructure are reliable, secure, fast and cost-effective. International Connectivity: Reliable, higher capacity, and affordable international connectivity. Cost effective regional strategies for provision of international connectivity. Cyber security and ICT applications: A safe and secure ICT environment and improved e-services in priority sectors. Provide a more secure and faster and safer ICT environment. Financing, monitoring and evaluation: A financing plan that captures all funds flowing into the regions’ ICT sector by funding source and implementation arrangements, supported by a comprehensive monitoring and evaluation framework. ICT financing framework to ensure sustainable ICT development. Quality data and guidelines for better policy and effective monitoring and evaluation. 4.5 ENVIRONMENTAL CAPACITY 403. Capacity has been identified as one of the major challenges in the region. Pacific Leaders recognized this, as summarized by the Pacific Islands Development States 171 statement at the Ministers meeting for Sustainable Development in Kazakhstan, 2010, “The vulnerability of SIDS has increased while their capacity to cope has not. The Pacific is one of the most vulnerable of the Asia-Pacific sub- regions. This is one of the reasons why it will be unlikely for any of the PICTs to achieve all of the MDGs by 2015. There was an urgent call to address climate change through national sustainable development strategies or their equivalent which are linked to national budgetary and planning processes. PICTs’ also recognize their commitment to sustainable development is a national responsibility and this cannot be achieved without development partner support. 404. The Pacific Islands Framework for Action on Climate Change 2006–2015 (Approved in 2005) identified in Principle 4: Education, Training and Awareness the expected outcomes for 2015 as follows: Strengthened human capacity to monitor and assess environmental, social and economic risks and effects of climate change. Strengthened human capacity to identify, analyse and implement cost effective adaptation measures as well as greenhouse gas reduction measures and creation of a pool of informed resource persons conversant with development of practical steps in adaptation tools and methods. Strengthened human capacity to identify and integrate economic, scientific and traditional knowledge into adaptation and greenhouse gas reduction practices. Better informed public on climate change issues. Furthermore, the SPREP strategic plan (2011–2015), endorsed by Pacific Island Leaders in 2010, also identified “Improving capacity, knowledge and understanding of climate change risks reduction” as a key area for action. 405. Human resources and level of capacity (technical, institutional) varies based on type of development, size of workforce and capabilities. There is also a high brain drain, especially from atolls and low lying islands. Lack of infrastructure poses a problem in implementing priorities. Failure to formulate strategies, policies, legislations and create enabling mechanisms is a serious challenge. PICTs lack the capacity to utilize financial resources given by donors. Due to this, different countries are at different levels in implementing regional initiatives. There is a need to build capacity for national development. Research and capacity building could provide great benefits, 172 including development of better technologies, but most PICTs do not have good research programmes. 406. Small land masses and isolation of PICTs lead to high costs of transportation, limited trading options, and also ignorance on the part of the rest of the world. The large EEZ, the source of livelihood, economic growth and food security, is difficult to monitor leading to illegal fishing. All this, combined with limited financial access and support to implement, evaluate and monitor priorities and policies, contributes to large parts of budgets being committed to logistics rather than action. Furthermore, aid dependence and lack of a “do it ourselves” mentality delays and slows progress. PICTs rely on foreign finance, some of which could be raised at the local level to implement activities to protect their environment and improve their resilience against environmental changes, economic crisis and climate change. 407. Lastly, societal challenges including unregulated population growth, urbanization, slow economic growth, weak governance and social and ethnic conflicts reduce the adaptive capacity of PICTs. Adapting to climate change is complex, involving highlevel policy decisions, sourcing and allocation of financing, and local and individuallevel implementation. Adaptation may involve difficult “moral” decisions about how best to allocate finite financial resources. Further research on such adaptation issues is required. 173 CONCLUSION 408. This state of the Pacific environment review has demonstrated that the region has experienced in the last twenty years a massive expansion of social and economic development activities that are exerting increasing pressures on its land, coastal and marine and environments through the operation of strong underlying driving forces. The most prominent of these driving forces are population growth, urbanisation, and global climate change. 409. All the states and trends of environmental stresses and change in the region’s environments are seen to be intensifying as its governments continues to implement key development policies to provide for the expanding needs of their people and societies and in which primarily promotes patterns of consumption and adoption of more modernized material benefits, cultures and lifestyles. 410. Among the key trends that are advancing the depletion of the region’s natural resources towards reaching critical irreversible thresholds are the continuing loss of indigenous biodiversity, the erosion and degradation of land, coastal and marine environment, and the extensive pollution and disruptions of ecological services that are essential to long term human well-being and maintenance of viable natural systems. 411. It is also demonstrated that the impacts of long term climate change and short term climate variability patterns are increasing and further exacerbating the degradations of the region’s environments and will continue to compromise the carrying capacities of its natural resources to sustain the needs of their present and future generations. 412. On the other hand the review have identified concrete examples of the region’s potentials for developing and implementing collective regional and national environmental actions for raising awareness, improving education and strengthening capacities for the management of its natural and human resources. It was able to establish and implement a wide range of important regional agreements, institutional arrangements, and action frameworks that are making progress in engaging its peoples and societies in effective environmental management activities. 413. The review has also demonstrated that in spite of the strong impacts and influence of modernity and global development, the region’s diverse mix of modern and 174 indigenous systems of governance have continue to endure and have proven their capacities to acquire further potentials to effectively adapt and maintain their communities and natural systems through the accelerating impacts of environmental and social change. 414. In view of the region’s potentials for effective environmental action this review highly recommends strengthening the implementation of existing frameworks and the consolidation of achievements in the last three decades through an enhanced mainstreaming of environmental considerations into economic and social actions and improving their coordination and balance implementation. A significant increase in implementation will require the commitment to initiatives by populations of the region that are well-informed and well-organized for collective actions; the support of more efficiently functioning and well-coordinated systems of institutional arrangements, and communities that are supportive and accommodating of individual and collective initiatives and challenges. To achieve these ends it is important to systematize actions for increasing the resources and capacities, and strengthening the cooperation of the three key players of environmental action – the individual, the institution and the community – in the coming decades. 175 REFERENCES ADB. (2003). Policy on Gender and Development. June, 2003. ADB. (2009). Pacific Economic Monitor. May, 2009. Asian Development Bank, Suva, Fiji. Adger, W. N., Agrawala, S., Mirza, M. M. Q., Conde, C., O’Brien, K., Pulhin, J., Pulwarty, R., Smit, B. and Takahashi, K. (2007). Assessment Of Adaptation Practices, Options, Constraints And Capacity. Climate Change 2007: Impacts, Adaptation and Vulnerability. Contribution of Working Group II to the Fourth Assessment Report of the Intergovernmental Panel on Climate Change, M.L. Parry, O.F. Canziani, J.P. Palutikof, P.J. van der Linden and C.E. Hanson, Eds., Cambridge University Press, Cambridge, UK, 717-743. Aitaro, J(2008) “High-Level Conference on World Food Security: The Challenges of Climate Change and Bioenergy. Climate Change and Food Security in Pacific Island Countries”. Arms, D. G. (2006). "A Failure of the Alternative Vote System and a Case for Proportional Representation in Fiji." The Journal of Pacific Studies29(1). Barker T., I. Bashmakov, L. Bernstein, J. E. Bogner, P. R. Bosch, R. Dave, O. R. Davidson, B. S. Fisher, S. Gupta, K. Halsnæs, G.J. Heij, S. Kahn Ribeiro, S. Kobayashi, M. D. Levine, D. L. Martino, O. Masera, B. Metz, L. A. Meyer, G.-J. Nabuurs, A. Najam, N. Nakicenovic, H. -H. Rogner, J. Roy, J. Sathaye, R. Schock, P. Shukla, R. E. H. Sims, P. Smith, D. A. Tirpak, D. Urge-Vorsatz, D. Zhou, (2007).Technical Summary. In: Climate Change 2007: Mitigation. Contribution of Working Group III to the Fourth Assessment Report of the Intergovernmental Panel on Climate Change [B. Metz, O. R. Davidson, P. R. Bosch, R. Dave, L. A. Meyer (eds)], Cambridge University Press, Cambridge, United Kingdom and New York, NY, USA. Barnet, J. (2008). Food Security and Climate Change in the South Pacific. Pacific Ecologist 14. Winter 2007. Becken, S. (2004). How Tourists & Tourism Experts Perceive CC & Climate Offsetting Schemes. Journal of Sustainable Tourism. Vol.12 pp332-45 Boydell, S. (2000). Coups, Constitution and Confusion in Fiji. Land Tenure Center Newsletter. 80 (Fall 2000):1-7, 10. Breslin, S. and R. Higgott (2000). "Studying Regions: Learning from the Old, Constructing the New." New Political Economy5(3). CDM (2010). Clean Development Mechanisms. Retrieved from: http://webcache.googleusercontent.com/search?q=cache. 176 Challenger, B. (2002). ClimatechangemitigationinCaribbeanMicroStates:theAntiguaandBarbudaExperience.Presentationat the IPCCOutreachWorkshopon Mitigation, Sept.23-24, 2002. Chambers, K. (2010). Climate change and Land in the PICTs. Climate change and capacity building training. USP. Chandra, A. P. (2004). Atmospheric Ozone Variations: A Southern Hemispheric Perspective. Anand Parbhash Chandra. Thesis (Master of Science).The University of the South Pacific. Clarke, W.C. (1971). People and place: An ecology of a New Guinean community. University of California Press, Berkeley, Los Angeles and London. 275-298. Clarke, P., I. Millar, and K. Solberger. (2008). South Pacific Regional Environmental Law Capacity Building Project - Scoping Report, International Union for the Conservation of Nature and Natural Resources (IUCN). Climate Impacts Group (CIG). (2001). CIG Research Summary. University of Washington. Available at http://www.jisao.washington.edu/PNWimpacts/index.html. Accessed on February 2008. Commonwealth of Australia. (2006). Pacific 2020: Challenges and Opportunitiesfor Growth, retrieved from [http://www.ausaid.gov.au/publications/pdf/pacific2020.pdf] on August 4th, 2010.Cunningham, A. B. P., Shanley and S Laird (2008); Health, Habitats and Medicinal Plant Use, in Colfer, C.J.P. (ed.), Human health and forests: a global overview of issues, practice and policy, Earthscan, London Crocombe, R. G. (1983). Land Tenure and Agricultural Development in the Pacific Islands. Taipei, Taiwan: ASPAC Food and Fertiliser Technology Center. Currathers, P. and Bishop, B. (2004). CBDAMPIC National Report. Prepared as part of the Canadian funded and SPREP implemented Capacity Building for the Development of Adaptation Measures project. Cook Islands Environment Service. Unpublished Report. Daly, M, Poutasi, N, Nelson, F and J Kohlhase (2010); Reducing the climate vulnerability of coastal communities in Samoa, Journal of International Development, 22, 265–281 (2010) Dalzell, P., T.J.H. Adams, and N.V.C. Polulnin, 1996. Coastal Fisheries in the Pacific Islands. Oceanography and Marine Biology: an Annual Review 34: 395-531. De’ath,G.,Lough,J.,Fabricius,K.(2009).Declining coral calcification on the great barrier reef. Science VOL 323. 2nd January. Retrieved from: www.sciencemag.org Dorward, A. and Kydd, J. (2003). ‘Implications of Market and Coordination Failures for Rural Development in Least Developed Countries’ Paper presented at the Development 177 Studies Association Annual Conference, Strathclyde University, Glasgow, 10-12 September 2003. Duncan, R., (2006). “Enhancing the Labour Absorption Capacity of Pacific Agriculture”. Suva: Pacific Institute of Advanced Studies in Development and Governance, USP. Dutt, U. (2001). A Study Of Wet Precipitation And Aerosol Chemistry At Suva, Fiji: A Remote Tropical Island Location In The South Pacific. Upma Dutt.. - iv, 161 p. : col. ill. ; 30 cm. Thesis (M.Sc.)The University of the South Pacific. Easter, E. 2010. Paradise Lost. Retrieved on Jan 11, 2010 from http://www.sprep.org/iwp/index.asp. Pp. 1. East-West Center. (2001). Pacific Island Regional Assessment of the Consequences of Climate Variability and Change. East-West Center, Honolulu, Hawaii. Chapter 2, p. 27. Eckart, R., Herold, M., Sambale, J. and S. Weaver (2008). Monitoring deforestation patterns and processes in the Pacific island state of Vanuatu, Presentation at AGIT/GI-Forum, Salzburg, July 2008. Ellis, F. (2000). Rural Livelihoods and Diversity in Developing Countries, Oxford University Press, Oxford. Elise Huffer & Asofo So’o. (2005). “Beyond Governance in Sāmoa: Understanding Samoan Political Thought”, The Contemporary Pacific 17.2 (2005) 311-333. Elise Huffer & Ropate Qalo, (2004).”Have We Been Thinking Upside-Down? The Contemporary Emergence of Pacific Theoretical Thought”. The Contemporary Pacific 16.1 (2004) 87-116 ESCAP (2006). State of the Environment in Asia and the Pacific 2005: Economic Growth and Sustainability. Bangkok. ESCAP and PIFS. (2008). Concept Note: Addressing Vulnerabilities Issues of Pacific Island Countries: Climate Change, Food Security and Water Management, Consultative Meeting among Executive Heads of Subregional Organizations and ESCAP, Twelfth Session, 12 March 2008 Noumea, New Caledonia. ESCAP / ADB / UNDP 2010 Asia Pacific Regional Report Fairbairn, T.J.(2004). "Pacific island Economies -Structure, Current Developments and Prospects" in Douglas, N. and N. Douglas (17th edition), Pacific Islands Year Book, Suva, Fiji Times. Falkland, A., and E. Custodio. (1991). “Hydrology and water resources of small islands: A practical guide.” UNESCO contribution to the International Hydrological Programme. Falkland, A. (1999). “Tropical Island Hydrology And Water Resources: Current Knowledge And Future Needs.” Second Colloquium on Hydrology and Water Management in the Humid Tropics, March 21–24, Panama. 178 Fan, S., Zhang, X., and Rao, N. (2004). ‘Public Expenditure, Growth and Poverty Reduction in Rural Uganda’ DSGD Discussion Paper No. 4, IFPRI, Washington, DC. FAO (2001). Definitions of Deforestation. Available at: http://www.fao.org/docrep/009/j9345e/j9345e07.htm FAO. (2003). ‘World Agriculture towards 2015/2030: An FAO Perspective’. Rome: Food and Agriculture Organisation of the United Nations. FAO (2004), Global Forest Resources Assessment Update 2005, Terms and Definitions (Final version) <http:// www.fao.org/docrep/007/ae156e/ae156e00.htm>. FAO (2005), Global Forest Resources Assessment 2005: 15 Key Findings <http://www.fao.org/forestry/foris/data/fra2005/kf/common/GlobalForestA4-ENsmall. pdf>. FAO (2006), Countries with Large Net Changes in Forest Area (Map) <http://www.fao.org/forestry/static/data/fra2005/maps/2.7.jpg>. FAO. (2007). "An Assessment Of The Impact Of Climate Change On Agriculture And Food Security In The Pacific: A Case Study In Vanuatu". Prepared For FAO SAPA Apia, Samoa by Muliagatele Joe Reti, Pacific Environment Consultants ltd (PECL). FAO. (2008). "An Assessment Of The Impact Of Climate Change On Agriculture And Food Security In The Pacific: A Case Study In The Republic Of The Marshall Islands". Prepared for FAO SAPA Apia, Samoa by Muliagatele Joe Reti, Pacific Environment Consultants ltd (PECL). FAO (2009), Facts and Figures <http://www.fao. org/forestry/28679/en/ FAO (2008). Climate Change and Food Security inPacific Island Countries. Retrieved from [http://www.fao.org/docrep/011/i0530e/i0530e00.htm] on August 4th, 2010. FAO (2010). Food and Agriculture Organization of the United Nations. Forest Statistics. FAO/FRA (2010). Country Reports: Fiji, Vanuatu, PNG, Solomon Islands. Feresi,J., Kenny,G.,de Wet,N.,Limalevu,L., Bhusan, J. &Ratukalou, I.(eds.) (2000). Climate ChangeVulnerabilityandAdaptationAssessmentfor Fiji.FijiPacific Island Climate Change Assistance Programme,Governmentof Fiji,Suva, Fiji,and InternationalGlobal Change Institute, WaikatoUniversity, Hamilton,NewZealand. Ferrier, D. (2003). "Emerging Patterns in Environmental Legislation in Pacific Island Countries." Journal of South Pacific Law.7(1). Fischer, G., Shah, M., Tubiello, F. N., and van Velhuizen, H. (2005). Socio-Economic And Climate Change Impacts On Agriculture, Philosophical Transactions of the Royal Society. B 360: 2067 – 2083. Fischer, G., Shah, M., and van Velthuizen, H. (2002). Climate Change and Agricultural Vulnerability. A special report prepared by the International Institute for Applied Systems 179 Analysis as a contribution to the World Summit on Sustainable Development, Johannesburg. Forum Fisheries Agency (FFA). (2008). The Value of WCPFC Tuna Fisheries. Unpublished report. Honiara. Gillett, R. D. (2002). Pacific Island Fisheries: Regional And Country Information. Asia-Pacific Fishery Commission, FAO Regional Office for Asia and the Pacific, Bangkok. RAP Publication 2002/13. Gillett, R. (2008). A Study of Tuna Industry Development Aspirations of FFA Member Countries. Honiara: Forum Fisheries Agency. Gillett and Cartwright 2010 Gillett, R. and C. Lightfoot. (2001). The Contribution of Fisheries to the Economies of Pacific Island Countries. Pacific Studies Series. Manila: Asian Development Bank. p. 218. Gilman, E., H. Van Lavieren, J., Ellison, V., Jungblut, L,. Wilson, F., Areki, G., Brighouse, J. Bungitak, E. Dus, M. Henry, I. Sauni Jr., M. Kilman, E. Matthews, N. Teariki-Ruatu, S. Tukia, K. Yuknavage (2006); Pacific Island mangroves in a changing climate and rising sea, UNEP Regional Seas Reports and Studies No. 179, United Nations Environment Program, Regional Seas Program, Nairobi, Kenya Govan, H.,Tawake, A., Tabunakawai, K., Jenkins, A., Lasgorceix, A., Techera, E., Tafea, H., Kinch, J., Feehely, J., Ifopo, P., Hills, R., Alefaio, S., Meo, S., Troniak, S., Malimali, S., George, S., Tauaefa,T., Obed, T.(2009) Community Conserved Areas: A review of status & needs in Melanesia and Polynesia [ICCA regional review for CENESTA/ TILCEPA/ TGER/ IUCN/ GEF-SGP] Government of Samoa. (2010). Mauritius Strategy National Assessment Report. Government of Vanuatu (2008). Vanuatu R-PIN. Forest Carbon Partnership Facility, World Bank, Washington DC. Government PNG (2008) PNG REDD Readiness Roadmap Government PNG (2010) Climate-compatible development approach for Papua New Guinea. In: Building Climate-compatible Development Strategies. An approach to develop Climate Compatible Plans for Developing Countries. Brussels, July 15, 2010. McKinsey and Company. Retrieved from : http://ec.europa.eu/europeaid/infopoint/documents/presentations/presentation_15_07_2 010_en.pdf Graham, J., B. Amos, & T. Plumptre. (2003). Governance Principles for Protected Areas in the 21st Century. The Fifth World Parks Congress. Durban, South Africa, Institute of Governance. Hales, S., Weinstein,P., Souares, Y., and Woodward, A. (1999). El Niño and the Dynamics 180 of Vectorborne Disease Transmission. Environmental Health Perspectives. 107:2 Halseth, G (2002). Communities within Communities: Changing ‘residential’ areas at Cultus Lake, British Columbia. Department of Geography, Queen's University, Kingston, Ontario, Canada K7L 3N6. Journal of rural studies, Volume 9 Issue 2. 175-187. Hampton, J. January 2009. Personal communication. Herold M., Sambale J. Weaver S., Viranamangga, R., and Eckardt R. (2008). A satellitebased deforestation assessment for the pacific island state of Vanuatu, Proceedings of the EARSEL workshop on remote sensing in developing countries, March 2008, Bochum, Germany. Hassall, G. & Tipu, F. (2008). Local Government in the South Pacific Islands. Commonwealth Journal of Local Governance. University of the South Pacific.Issue 1: May. Hay, J.E., Mimura, N., Campbell, J. Fifita, S., Koshy, K., McLean, R.F., Nakalevu, T., Nunn P. and N. de Wet. 2003. Climate Variability and Change and Sea-level Rise in thePacific Islands Region - A Resource Book for Policy and Decision Makers, Educators andOther Stakeholders. South Pacific Regional Environment Programme, Apia, Samoa. 108p. Holt, L., O’Sullivan, and Weaver, S.A. (2007). Land and Forestry Law in Vanuatu: carbon rights and existing law. Vanuatu Carbon Credits Project. School of Geography, Environment and Earth Sciences, Victoria University of Wellington. Hope, G (2008); Palaeoecology and Resilience in Melanesia: How can palaeoecology contribute to climate change response planning? Climate Change and Biodiversity in Melanesia Paper 4, Bishop Museum Technical Report 42(4) IPCC. Climate Change 2007. The Physical Science Basis. Contribution of Working Group I to the Fourth Assessment Report of the IPCC. Solomon S, Qin D, Manning M, Chen Z, Marquis M, Avery KB, Tignor M, Miller HL (eds.). Cambridge University Press, Cambridge, United Kingdom and New York, NY, USA, 2007. 996 pp. IPCC. 2007. Summary for Policymakers. In S. Solomon, D. Qin, M. Manning, Z. Chen, M.C. Marquis, K. Avery, M. Tignor and H.L. Miller (eds), Climate Change 2007: ThePhysical Science Basis. Contribution of Working Group I to the Fourth Assessment Report of the Intergovernmental Panel on Climate Change. Cambridge University Press, Cambridge, UK and New York, USA. IPCC. 2007a. ‘Climate Change 2007: Climate Impacts, Adaptation and Vulnerability’, Working Group II to the Intergovernmental Panel on Climate Change Fourth Assessment Report, DRAFT technical summary 2006, Geneva. Intergovernmental Panel on Climate Change. 181 IPCC. 2007b. ‘Climate Change 2007: The Physical Science Basis: Summary for Policymakers’ Working Group I to the Intergovernmental Panel on Climate Change Fourth Assessment Report, Geneva. Intergovernmental Panel on Climate Change. Jefferey, M. (2005). "Environmental Governance: A Comparative Analysis of Public Participation and Access to Justice." Journal of South Pacific Law.9(2). Kirby, D.S. (2007). Interactions Between Ocean Climate And Tuna Fisheries In The Western And Central Pacific Ocean: Understanding Variability And Predicting Change. IPCC TGICA Expert Meeting: Integrating Analysis of Regional Climate and Response Options, Westin Resort, Nadi, Fiji. June 20-22. Koshy, K., Ayers, G., Gillet, G. and Selleck, S. (1997). Wet Deposition Chemistry Studies At Suva, Fiji: A Remote Tropical Island Site In The South Pacific. Environmental Geochemistry and Health. 19, 39-44. Koshy K. (2005). Small Island Developing States – The Mauritius Declaration and Strategy, Tiempo. Vol:56, Pp 3-7. Koshy. K, Lal. M & Mataki. M. (2005). Sustainable Development and the Pacific Island Countries. Pacific Centre for Environment & Sustainable Development, University of the South Pacific, Suva, Fiji. Lal, M. (2004). Climate Change in Small Island Developing Countries of the South Pacific. Fijian Studies. Vol. 2, 1, pp15-31. Larmour, P. (2005). Foreign Flowers: Institutional Transfer and Good Governance in the Pacific Islands. Honolulu, University of Hawai'i Press. Larmour& Qalo (1985) Laurence, W. F (2007). A New Initiative to Use Carbon Trading for Tropical Forest Conservation. Smithsonian Tropical Research Institute. BioTropica 39(1): 20–24 2007. Lawson, S. (2006). "Democracy, Power and Political Culture in the Pacific." The Journal of Pacific Studies. 29(1): 85-108. Lehodey P., Bertignac, M., Hampton, J., Lewis, A. and Picaut, J. (1997). El Niño Southern Oscillation and tuna in the western Pacific. Nature 389, 715-718. Lehodey, P. (2000). Impacts of climate change on tuna fisheries in the Tropical Pacific Ocean. Draft, Oceanic Fisheries Programme, Secretariat of the Pacific Community, Noumea, New Caledonia. Levett, R. &McNally, (2003). AStrategicEnvironmentalAssessmentofFiji’sTourismDevelopmentPlan.AdvisoryGroupver sion.Astudyundertakenforthe World Wildlife Fund. Fiji. 182 Maragos, J.E. (1997). Coral Reef Health in the Central Pacific. In: Grigg, R.W. and Birkeland, C., ED. 1997. Status of Coral Reefs in the Pacific. University of Hawaii Sea Grant College Program Publication. Martino. D., Zommers, Z., Bowman,K., Brown, D., Comim, F., Kouwenhoven, P., Manders, T., Milimo,P., Katerere, J.M and Thierry De Oliveira. (2007). Environment for Development. (Chapter 1). Section A Overview. In:UNEP/GEO4 Report (2007). Retrieved from: http://www.unep.org/geo/geo4/report/01_Environment_for_Development.pdf Mataki, M; Koshy, K; Nair, V. (2007). Top-down, Bottom-up: mainstreaming adaptation in Pacific island townships. Ed. Leary, N, et al., Climate Change and Adaptation, Earthscan. pp264-278. McKenzie, E. Kaloumaira, A. and Chand, B. (2005). The Economic Impacts of Natural Disasters in the Pacific. Technical Report, University of the South Pacific (USP) and the South Pacific Applied Geoscience Commission (SOPAC), Suva. A Binger, A. and Duncan, C.F.N. 2007 reported that the cost of Cyclone Heta was over NZ$50 m, or about 200 years of Niue’s annual export value. Mellor, T. and J. Jabes (2004). Governance in the Pacific: focus for action 2005-2009. Manila, Asian Development Bank. Mercer, J (2010). Disaster risk reduction or climate change adaptation: are we reinventing the wheel? Journal of International Development, 22, 247–264 Mele, E. I. Rakai, C. Ezigbalike and I. P. Williamson (1995). Traditional Land Tenure Issues for LIS in Fiji Survey Review 33( 258): 247-262. Ministry of Forests (PNG) (2009) Forestry and Climate Change Framework for Action 20082015 Newman, J., M. Barnes, et al. (2004). "Public participation and collaborative governance." Journal of Social Policy. 33(3): 203-223. Niles, J. O. (2002). Tropical forests and climate change, in Schneider, S. H. et al, Climate Change Policy. A Survey. Island Press, Washington. Niue. (2007). PACC National Report. Nunn, P (1998). Landscape Change the Initial Settlement of Pacific islands. (Chapter 9) In: Pacific Island landscapes. Institute of Pacific studies. University of the South Pacific. Nunn, D, P. (2007). Responding to the Challenges of Climate Change in the Pacific Islands: Management and Technological Imperatives. IPCC TGICA Expert Meeting, Integrating Analysis of Regional Climate and Response Options, July 20-24, Westin Resort Denarau Island, Nadi, Fiji. 183 Office of Climate Change and Environmental Sustainability (pre-2009) National Climate Change Policy Framework for Papua New Guinea. Olowu, D. (2007). "Environmental Governance Challenges in Kiribati: An Agenda for Legal and Policy Responses." Law, Environment and Development Journal. 3(3). Pacific Islands Forum Secretariat (2002) Pacific Islands Energy Policy and Plan. Retrieved from [http://www.forumsec.org.fj/resources/uploads/attachments/documents/Pacific%20Islan ds%20Energy%20Policy%20and%20Plan%20(PIEPP)%20October%202002.pdf] on August 4th, 2010. Pacific Islands Forum Secretariat (2005) Pacific Islands Forum Secretariat (2006) Pacific Islands Forum Secretariat (2007) Pacific Islands Forum Secretariat (2008) Pacific Islands Forum Secretariat (2010) Pagad, S., Wong, S. (2010). Pacific Environment Outlook: Indicators of Trends in Invasive Species in the Pacific Region. Parker, C., Mitchell, A., Trivedi, M., Mardas, N. (2009). The Little REDD+ Book. Global Canopy Programme. Available at: http://www.globalcanopy.org/main.php?m=117&sm=176&t=1 Pelt et al 2010 Phillips, B., Weaver, S.A., Herold, M., and Ward, M., (2008). Vanuatu Carbon Credits Project: Linking REDD, A/R and Energy in Strategic Sustainable Development. Side event presentation to the 28th meeting of Subsidiary Bodies for Scientific and Technological Advice (SBSTA) to the UNFCCC, Bonn, June 2008. Pippard, H., Tye, A. (2010). State of the Environment Report on Biodiversity Indicators: Threatened Species in the Pacific Prasad, B.C. (2009). Sustaining Development in Small States in a Turbulent Global Economy: Opportunities and Threats for the Pacific Island States. Paper presented at the conference on Sustaining Development in Small States in a Turbulent Global Economy, Commonwealth Secretariat, Marlborough House, London, 6-7 July, 2009. Qalo, R. R. (2005). ‘Devolved Governance as a Tool in Accelerating Village Development in Fiji.’ Regional Development Dialogue. Vol. 26. No.2, Autumn, United Nation Centre for Regional Development, Nagoya, Japan. Qalo, R. R. (2006). A Blend of Good Governance in Pacific Culture. Fijian Studies: A Journal of Contemporary Fiji. Vol.4 No.1May. 184 Raj, S.C. (2000). Solid waste education and awareness in Pacific Island Countries. Paper presented at WASTECON 2000, Cape Town, South Africa, 4-9 September 2000. Regan, A. J. (1998). "Causes and course of the Bougainville conflict." The Journal of Pacific History. 33(3): 269 – 285. Regional Co-ordination Centre for Research and Development of Coarse Grains, Pulses, Roots and Tuber Crops in the Humid Tropics of Asia and the Pacific (CGPRT Centre). (2000). Integrated Report: Food Security Strategies for selected Pacific Island Countries. Proceedings of the Workshop on Food security in the South West Pacific December 12-13, 2000. Relief Web. (2008). Press Release on Tropical cyclone Gene rehabilitation, Accessed from [http://www.reliefweb.int/rw/RWB.NSF/db900SID/MUMA-7BT93K?OpenDocument] on 14th February 2008. Ruosteenoja, K., Carter, T.R., Jylha, K. and Tuomenvirta, H. (2003). Future climate in world regions: an intercomparison of model-based projections for the new IPCC emissions scenarios. The Finnish Environment 644. Finnish Environment Institute, Finland. Salinger, M.J., Basher, R.E., Fitzharris, B.B., Hay, J.E., Jones, P.D., MacVeigh, J.P. and Schmidely-Leleu, I. (1995). Climate trends in the South-West Pacific. International Journal of Climatology, Vol. 15, p. 285. Shah, J. J., and Nagpal, T. (1997). Urban air quality management strategy in Asia: Jakarta report. Technology & Engineering. P149. Sheppard, D. (2010). Opening Speech, Biodiversity Roundtable, Samoa. Siddiqui, K., V. Naidu, et al. (2010). Towards Pro-Active Legislatures and Inclusive Development in PICs. Conference on the Human Face of the Global Economic Crisis, 10-12 February, 2010. Port Vila, Vanuatu. Singh, U., D.C. Godwin, and R.J. Morrison. (1990) ‘Modelling the impact of climate change on agricultural production in the South Pacific’. Slater, R. (2007). Climate Change: Implications for DFID’s Agriculture Policy. Paper prepared for DFID Renewable Natural Resources and Agriculture Team. London: ODI Slater, R. and Peskett, L. 2007 Climate Change, Agricultural Growth and Poverty Reduction. Paper prepared for DFID Renewable Natural Resources and Agriculture Team. London: ODI. Slater, R., Peskett, L., Ludi, E. and Brown, D. (2007). Climate change, agricultural policy and poverty reduction – how much do we know? Stolton, S., N. Dudley and J. Randall (2008); Natural Security: Protected areas and hazard mitigation, WWF, Gland, Switzerland 185 Small, G. (1997). A Comparative Analysis of Contemporary Native and Ancient Western Cultural Attitudes to Land. Paper read at Pacific Rim Real Estate Society (PRRES) Annual Conference, at Massey University, Palmerston, North, New Zealand. Smith, A. (2007). Colonialism and the Bomb in the Pacific. Pp. 55-72 in J. Schofield and W. Cocroft (eds) A Fearsome Heritage. Diverse Legacies of the Cold War. California: Left Coast Press. South, G.R., P.A. Skelton, J. Veitayaki, A. Resture, C. Carpenter. (2004). The Global International Waters Assessment for the Pacific Islands: aspects of trans boundary, water and coastal fisheries issues. Ambio. 33 (1): 703 - 711 Spalding, M.D., C. Ravilious, and E. P. Green, (2001). World Atlas of Coral Reefs. Prepared at the UNEP World Conservation Monitoring Centre. Berkeley: University of California Press. 302 pp. SPC. (2004). Pacific Islands regional millennium development goals report / prepared by the Secretariat of the Pacific Community in cooperation with the United Nations and the UN/CROP MDG Working Group, Noumea. Accessed from [www.spc.int/mdgs/MDGReport/Reg_report.htm] SPC 2008 SPC Policy Brief 5 / 2008 SPC Policy Brief 7 / 2009 SPC. (2010). Pocket Summary. [URL: http://www.spc.int/sdp/index.php?option=com_docman&Itemid=42] SPC (2010). Total Recorded and Projected Population of Pacific Island Countries and Territories. Retrieved from: http://www.spc.int SPC (2010). Fiji Finalising National REDD-Plus Policy. Retrieved from: http://www.spc.int/lrd/index.php?option=com_content&view=article&id=548:fiji-finalisingnational-redd-plus-policy SPREP (2003-2009). Warming the Atmosphere - The Greenhouse Effect; Pacific Regional Environment Programme. SPREP. (2004). Wade, Herbert, Pacific Regional Energy Assessment, Regional Overview report, Vol. 1. Pacific Islands Renewable Energy Project (PIREP) SPREP and PIFs, (2007). Joint paper on climate change presented at the Secretariat of the Pacific Community 5th Meeting of the Conference of the Parties of the Community. Apia. 12- 13th November, 2007. SPREP, (2010a). The International Waters Project 2000-2006. Strengthening the management of coastal fisheries, freshwater and waste in the Pacific Islands. Retrieved on Jan 11, 2010 from http://www.sprep.org/iwp/index.asp. Pp. 1-8. SPREP, (2010b). Promoting the adoption of Safe Toilet Systems in Tuvalu. Retrieved on Jan 11, 2010 from http://www.sprep.org/iwp/index.asp. Pp. 1. 186 SPREP, (2010c). The True Cost of Tonga’s Waste. Retrieved on Jan 11, 2010 from http://www.sprep.org/iwp/index.asp. Pp. 1.Stewart, F. (2000). SPREP, (2010d). How much is poor waste management costing the Pacific. Retrieved on Jan 11, 2010 from http://www.sprep.org/iwp/index.asp. Pp. 1. SPREP, (2010e). Solid Waste Management Strategy for the Pacific Region. Retrieved on Jan 11, 2010 from http://www.sprep.org/iwp/index.asp. Pp. 1. Stuart, R. (2006). An economic survey of Developing countries in the Pacific Region. Pacific and Assistance Division, the Australian Treasury Sue, D (2010). Financing Sustainable Forest Management Case Study FIJI. UNFF – United Nations Forum on Forests. The United Nations. R2R Management (Fiji). Takesy, A. 2010. Communities Helping Themselves.. Retrieved on Jan 11, 2010 from http://www.sprep.org/iwp/index.asp. Pp. 1. ThePacific Islands and the Globalization Agenda. The Contemporary Pacific. 12(1): 178192. Tetepare Island REDD Project (2009). Available at: http://resources.cbc.amnh.org/tetepare/index.html Thaman, R.R. (1989a). Agro deforestation and agricultural development: The role of modern agricultural development in deforestation and the neglect of trees. In Haynes, R.J. and Naidu, R. (Eds.). Agricultural development in the Pacific Islands in the 90,s: Proceedings of an International Conference and Workshop held in Suva Fiji, March 31 to April 1, 1989. Fiji Institute of Agricultural Science, Chemical Society of the South Pacific and The University of the South Pacific, Suva. Pg. 124-134. Thaman, R.R. (1989b). Agro deforestation and the neglect of trees: Threat to the well-being of Pacific societies. SPREP Occasional Paper No. 5. South Pacific Regional Environment Programme, South Pacific Commission, Noumea. Thaman, R.R. (1990). Kiribati agroforestry: Trees, people and the atoll environment. Atoll Research Bulletin (In press).29pp. Thaman, R.R. (1992). Agro deforestation as a major threat to sustainable development. Box 19.4 in Thistlethwaite, R. and Votaw, G., Environment and development: A Pacific Island perspective. Asian Development Bank, Manila and South Pacific Regional Environment Programme, Apia. Pp. 194-195. Thaman, R. R. (2002). Trees outside forests as a foundation for sustainable development in the Small Island Developing States of the Pacific Ocean. The International Forestry Review 4(4)(December): 268- 276. Thaman, R.R. (2004). Sustaining culture and biodiversity in Pacific Islands with local and indigenous knowledge. Pacific Ecologist Autumn-Winter (7 & 8): 43-48. Thaman 2005 187 Thaman, R.R. (2007/2008). Restoring Pacific Islands’ rich agricultural traditions: An urgent priority. Pacific Ecologist 15 (Summer 2007/2008): 51-57. Thaman, R.R. (2008). Pacific Island agrobiodiversity and ethnobiodiversity: A foundation for sustainable Pacific Island life. Biodiversity V9:102-110. Thaman 2010 Thaman, R.R. and W.C. Clarke. (1993a). Introduction. Chapter 1 in Clarke, W.C. and Thaman, R.R. (Eds.). Pacific Island agroforestry: Systems for sustainability. United Nations University Press, Tokyo. Pp. 1-16. Thaman, R.R. and W.C. Clarke. (1993b). Pacific island agroforestry: Functional and utilitarian diversity. Chapter 2 in Clarke, W.C. and Thaman, R.R. (Eds.), Pacific Island agroforestry: Systems for Sustainability. United Nations University Press, Tokyo. Pp. 17-33. Thrupp, L.A. (1998). Cultivating diversity: Agrobiodiversity and Food Security. World Resources Institute, Washington, D.C. Tinsley, D. (2010). Growth and poverty mailing list archives. New Directions for Reducing Agriculture and Poverty. DFID. Retrieved from: [http://dfid-agricultureconsultation.nri.org/maillists/growth-and-poverty/msg00140.html] Tutangata, T. I., (1996). Vanishing Islands, Our Planet. Available at www.ourplanet.com/imgversn/103/06_van.htm. UN Economic and Social Development (2010). Core Publications Agenda 21. Section1. Social and economic dimensions. Chapter 7: Promoting Sustainable Human Settlement Development. Retrieved from: [www.un.org/DSD/agenda 21]. UNESCO (2010). Cultural Landscapes. Retrieved from: http://whc.unesco.org/uploads/activities/documents/activity-5-2.pdf, July 12,2010. UNFCCC (2001). Decision 11/CP.7. UNFCCC, 2007. Bali Action Plan. Decision -/CP.13. UNFCCC UN Economic and Social Development (2010). Core Publications Agenda 21. Section1. Social and economic dimensions. Chapter 7: Promoting Sustainable Human Settlement Development. Retrieved from: www.un.org/DSD/agenda 21. UNN-IAS (2002). Reducing Emissions from Deforestation and Degradation and Forest Degradation in Developing Countries (REDD): A Guide for Indigenous People. United Nations University. Institute of Advance. UN Habitat (2010). Pacific Urban Agenda. Focus areas of the Pacific Operations Centre. Retrieved from: [http://www.unescap.org/epoc/R3_PacificUrbanAgenda.asp. July 12,2010]. UNWTO 2010 188 University of Copenhagen. (2007). Danish Meteorological Institute, University of the South Pacific and the Solomon Islands Meteorological Service Centre. SustainableResource Use or Imminent Collapse? Climate Livelihood and Production in the SouthwestPacific, CLIP Research Project Final Report, Funded by the Bikubenfonden through Danish Expedition Foundation; Knud Hojgaards Fond, COWlfonden, Brodrene Hartmann’s Fond, Danish Social Science Research Council. Van Royen, P and Davis, S D (1995); Regional overview: Pacific Ocean islands. Pp. 519568 in Davis, S D Heywood, V H and Hamilton. A C (eds.) Centres of plant diversity: a guide and strategy for their conservation. Volume 2. Asia, Australasia and the Pacific. WWF and IUCN, IUCN Publications Unit, Cambridge, UK Wauthy, B. (1986). Physical Ocean Environment in the South Pacific Commission area. UNEP Regional Seas Report Studies 83: UNEP. Weaver, S. A. (2009a). Adaptation to Climate Change in the Pacific Island Region. Fiji REDD Policy & Scoping Consultation. Pacific-German Regional Programme. Suva, 2009. Weaver, S. A. (2009b). Forests Climate and REDD. Pacific Heads of Forestry Meeting Report. South Pacific Commission, GTZ, Suva, 2009. Weaver, S. A. (2009c.) Reducing Emissions from Deforestation and Degradation. Fiji Forest Sector Briefing Document. South Pacific Commission, GTZ, Suva, 2009. Weaver, S.A. (2009d). REDD Briefing. Pacific Heads of Forestry Meeting Report. South Pacific Commission, GTZ, Suva, 2009. Weaver, S.A. Herold, M., and Payton, I. (2009). Fiji REDD Policy & Scoping Consultation. Pacific-German Regional Programme, Adaptation to Climate Change in the Pacific Island Region, Suva, September 2009. Weaver, S.A., O’Sullivan, B., Ward, M., Herold, M., and Napat, J. (2007). Vanuatu. Country Submission on Reducing Emissions from Deforestation in Developing Countries, Subsidiary Bodies for Technological and Scientific Advice, UNFCCC, February 2007. Williams, P. Terawasi, P. (2010). Overview of Tuna Fisheries in the Western and Central Pacific Ocean, Including Economic Conditions – 2009. WCPFC Scientific Committee 6 Working Paper 1. Wilkinson, C. R. (1998). (ed.). Status of Coral Reefs of the World: 1998. Australian Institute of Marine Science. Wilson, C. (2006). Land and Conflicts in the Pacific Region. Report for Pacific Islands Forum. WMO: World Climate Research Programme Global Sea-Level Rise Update (2009) 189 World Bank. (2000). Cities, Seas, and Storms. Papua New Guinea and Pacific Island County Unit. The World Bank, Washington, D.C., Vol. 4, p. 25. World Bank Migration & Remittances Report 2000 - 2008 World Bank (2009) Development Indicators Report 190 APPENDIX 1 Issue-Data-Indicator Matrix for Pacific ECCO Database Development THEME ISSUE POTENTIAL DATA VARIABLES PROPOSED KEY (LEAD) UNITS INDICATORS PRIMARY (LEAD) DATA SOURCES 1 2 3 4 5 6 Land Soil erosion Water erosion (000 ton/ha) Average annual soil erosion rate 000 ton/ha UNEP/FAO/ISRIC: GLASOD, SPC, SPREP, USP, National Wind erosion (000 ton/ha) Government Departments Desertificatio n Area affected by desertification (000 ha and %) of rain fed croplands, irrigated land, forest and Total land affected by desertification 000 ha, % UNEP/FAO/ISRIC: GLASOD Population living below poverty line in million, % SPC, SPREP, USP, GIZ National Government dryland areas Departments woodlands Livestock levels per km2 in dryland area Population living below poverty line in dryland areas Land salinization Areas affected by salinization and water logging (000 ha and & change) Total area affected by salinization 000 ha, % UNEP/FAO/ ISRIC: GLASOD p/y SPC, USP, GIZ, SPREP National Governments 191 Forests Forest loss, Forest resources management Forest management fractions (% protected) Forest change / domestication by sector (to agric, urban) Forest area change (open, closed, natural forests) FAO: FAOSTAT, FRA/SOFO Intensity of forest use (harvest / growth) % p/y Area of forest and woodland total, per Annual average change in forest area cap, % SPC, SPREP, GIZ, USP. Exports of forestry products (%) % p/y National Governments Protected forest area % p/y Regeneration/afforestation area 000 ha, % p/y Deforestation rate (open, closed, natural forests) Reforestation, natural and total, % success Production & trade of forestry products (wood, paper) Degradation Volume distribution by major tree of forest species group within each biome quality (ha per each biome) Share of affected forests % of total forest area Share of disturbed/deteriorated forests in total forest area Biodiversit Loss of No. of species known (number) and y species threatened species (%) for % IUCN/WCMC: Red List % SPREP, USP, WWF known plant species Vascular plants, Mammals, Birds, Threatened animal species as % of Amphibians, Reptiles, Fresh water total known animal species fishes 192 Threatened plant species as % of total Loss of habitat Recorded wildlife habitat by ecosystem, Total areas of wetlands/marshes 000 ha for Forests (dry, moist, all forest), Total mangrove area 000 ha Wetlands, Mangroves, Change in arable land area 000 ha IUCN/WCMC: Protected Areas Database USGS/EDC: Olson World Ecosys. Grassland/savannah, WWF: Ecoregions Deserts/scrubland FAO: FAOSTAT SPREP, SPC, USP, Wildlife Trade in flora & fauna (birds, reptiles, Trade plants, mammals, butterflies, Net trade in wildlife and captive-bred Million US$ CITES Secretariat Total & per cap marine fish catch 000 FAO: FAOSTAT, FishStat, Total fish catch in inland waters (incl tons/year species ornamental fish) Over fishing Total inland, fresh water and marine fish catch, production, consumption and trade aquaculture) 000 tons/year Protected areas National, international and local parks & protected areas: Biosphere reserves (terr. and marine), Wetlands of international importance, World heritage sites 193 Total protected areas (number, size) and % of total land Number, Km2, % State of World Fisheries SPC, FFA, National Governments IUCN/WCMC: Protected Areas Database UNESCO World Heritage List SPREP, LMMA, USP, WCS, SPC Freshwater Freshwater Annual internal renewable water resources Annual internal renewable water resources per cap resources Annual river flows from/to other Annual freshwater consumption per cap countries, by basin Annual consumption by sector Population with water stress (domestic, industry, agric) Km3/year, FAO: AquaStat m3/cap/ye WRI: World Resources Database ar UNESCO: World Water Km3/year, Resources m3/cap/ye UNH/GRDC: Runoff Fields ar Univ. of Kassel: WaterGap • Annual groundwater recharge IGRAC (Int Groundwater Annual groundwater withdrawals by Resources Ass. sector Centre) GGIS SPC/SOPAC, WHO, SPREP, USP Water quality River pH, concentrations of oxygen NP), phosphor (PO4), metals Coliform count per 100 ml) µg/l, Pesticides concentrations in most chlorides, sulphates Waste Water Treatment: % served, public expenditures 194 rivers no/100 ml, Fish biodiversity (reserves, specie of nitrates, TDS (salinity), iron, Nitrate level of most important Ground water pH, concentrations important rivers GEMS/Water: Atlas of Global Water Quality, mg/l (HMs), pesticides no.) mg/l rivers (DO, BOD), coliforms, particulates (TSS, TDS), nitrates (NO3, NH4, BOD level of most important US$/capita others WRI: World Resource Database WHO, SPC/SOPAC, SPREP, USP Atmospher Developmen e t Anthropogenic emission of GHG (CO2, CH4, N2O, also HFCs, ton/cap, CDIAC: Trends On-line cap and per $US ton/US$ UNFCCC: National PFCs, SF6), total and by sector Global mean temperature rise oC (transport, industry, agric, livestock, Global mean concentration of CO2, ppm fossil fuels) CO2, NOx, SO2 emissions per Communications IEA: Energy Statistics and Balances SO2, NOx, PM10 Emissions of precursors (NOx, CO, Fossil fuel consumption share NMVOC, CH4), total and by sector Renewables consumption share % IGBP/GEIA/RIVM: EDGAR Database Emissions of acidifying gases (NH3, NOx, SO2), total and by IPCC/CRU: Mean Monthly Climatologies sector WMO: Climate Anomalies Atmospheric concentration of GHG, USP, SPREP CO, SO2, NOx, NH3, PM, Pb, VOC, O3 Annual change of temp., precip. Fossil fuel supply (% and intensity) Rain water pH for selected areas Expenditures on air pollution abatement and control Stratospheri Production, consumption, import & c Ozone export of CFCs, Halons, HCFCs, Depletion Methyls, CCl4 Atmospheric ODS concentration over selected cities (parts per trillion) Ozone levels/Total Ozone column over selected cities (Dobson units) Ground level UV-B radiation over selected cities 195 Total ODS production by compound ODP tons, UNEP Ozone Secretariat Total ODS consumption per capita kg/cap World Ozone & Ultrav. Rad.Data Centre AFEAS Production, Sales and Emissions Coastal Coastal & Average annual sediment load and Marine Marine Average annual untreated waste Average annual untreated waste areas pollution Average annual sediment load disposal by sector (dom. Ind. and disposal by sector (dom/ind/agric, agric – fertilizers, fertilizers, pesticides/insecticides.) pesticides/insecticides) Discharge of oil into coastal waters (000 ton) Concentrations of HMs (Hg, Pb, Cd, Cu, Fe, Mn, Ni, Co) % of urban population living in ton/year % Programme of Action (GPA) % km2 WCMC: Protected Areas Database IMO: Global Waste Survey UNSTAT: UN Common (EEZ) Database ICLARM: ReefBase, Concentration of PCBs Industrial activities in coastal region WRI: Reefs at Risk Share of pollution caused by sector G3OS (GOOS, GTOS, FishBase ( domestic, industrial, urban, coastal, transport, refineries) Coastal population (growth, urban share) 1. GCOS) SPC, National Governments, SPREP, USP, FSPI Tourist arrival in coastal marine areas (million/year) Number of hotels/resorts in coastal areas (000) 196 UNEP Regional Seas Programme and Global coastal areas Area of Exclusive Economic Zone ton/year, Disasters Natural disasters Occurrences, financial damage and casualties (people affected, Total number of natural disasters p/y 000, OFDA/CRED: EM-DAT Total number of people affected by million US$ Munich Re: Annual review of Floods, Droughts, Cyclones, nat. dis. natural disasters homeless, injured, killed) related to UN-OCHA: ReliefWeb Economic loss due to natural disasters Earthquakes, Landslides, Volcanic UN-ISDR eruptions, Forest fires SPC, Asia Foundation, USP, SPREP, FSPI Human- Occurrences, financial damage and induced casualties (people affected, disasters homeless, injured, killed) related to 1. 2. Total number of techn. 000, OFDA/CRED: EM-DAT accidents p/y million US$ UN-ISDR % Total number of people affected by technological transport and industrial accidents accidents 3. Economic loss due to techn. Accidents Urban Urbanization Areas Urban population, total, growth rate, Number of cities with over 750,000 Average annual urban population growth rate Prospects population Waste management Waste generation and disposal methods by sector: municipal, industrial, agricultural, hazardous Municipal waste production per cap (solids+water) 197 kg/capita SPC, ESCAP UNSTAT: UN Common kg/000 Industrial waste generated per $US US$ Hazardous waste production per $US kg/000 Waste management fractions US$ Exposure to HMs, toxic chemicals % Share of recycled waste UNPD: World Urbanization Database WRI :World Resources Database UNEP Chemicals, Basel Conv. Secr. SPREP Socio- Population Economic and social Total fertility rate (incl. Adult literacy (%) by sex health) Education enrolment, net and gross Population, total and growth rate (primary, secondary, tertiary), by sex Education expenditures (prim., sec., tert.) Labour force total (% population), by sector (agric., ind., serv. and by sex Telephones (main lines and cellular per 100 people) Daily newspapers (copies per 100 people) Radios (number per 100 people) Televisions (number per 100 people) Computers (number per 100 people) Internet connections (number per 10000 people) 198 Average annual population growth rate Population density change %, inh/km2 UNPD: World Population Prospects UNESCO: World Education Statistics UNDP: Human Development Indicators UNSTAT: UN Common Database ILO: Laborsta Database, KILM indicators World Bank: World Development Indicators SPC, UNDP, ADB, National Governments Economy Real GDP, total and per cap, annual Power Purchasing Parity (PPP) Number of people in absolute Const PPP per cap 1995 US$ Value added as % of GDP by Intern. $ Univ. of Purdue: GTAP poverty, rural and urban sector: agriculture, industry, % UNCTADWTO(ITC): Merchandise exports (value), total services and by sector: manufactures, fuels/minerals/metals, services Development Indicators COMTRADE UNSTAT: UN Common Database Merchandise imports (value), total, food, fuels SPC, PIFS, USP, ESCAP, Trade (% of GDP) UNDP, FAO, National Terms of trade (1995=100) Governments Inflation, consumer prices (annual %) Unemployment rate (%) Total external debt total and % of GNP Total debt service (as % of exports of goods and services) Foreign direct investment, net inflows (% of GDP) Official Development Assistance & Aid (ODA) 199 World Bank: World GDP per capita Total commercial energy n and production, by sector: fossil fuels, Production hydro, nuclear, geothermal, Consumptio biomass, solar, wind Balances World Bank: World Development Indicators USP Energy imports, net (% of energy Total electricity generation by sector: thermal, hydro, nuclear, nonhydro renewables Total electricity consumption % population with access to electricity Value added by sector :agric., ind. manuf., services Distribution of GDP by demand sector: government consumption, private consumption, gross domestic investment, gross domestic saving 200 IEA: Energy Statistics and Traditional fuel use (% of total Renewable energy use (%) SPC, National Governments, Commercial energy consumption per capita equivalent and per cap consumption) Tons of oil Total commercial energy use, total energy consumption) Total commercial energy production Defence expenditures (% of GDP) Agriculture Agricultural production index • Use of nitrogen on agric. land tons/km2 • FAO: FAOSTAT and Food production index • Use of phosphate on agric. land tons/km2 • IFA: Fertilizers & their use Livestock Pesticide consumption • Use of pesticides on agric. land active kg / • SPC, USP (Alafua), (tonnes) Agricultural production value added Fertilizer use (000 kg) a) Livestock units (000 heads) 201 km2 National Governments, % of GDP SPREP Human • Health and Well-being Population below poverty line, % of total population access to safe • % pop with access to safe drinking % of total population access to • • % UNICEF: Childinfo.org No. of people per physician, per Caloric intake per cap cal/day/pp WHO/UNICEF Joint Monitoring hospital bed % of GDP spent for health services % No. of people with access to health Mortality caused by respiratory no. per Government expenditures on Calories supply, total and from Available calories as % of Malnutrition in children under five years Average life expectancy, by sex • Crude death rate • Infant mortality rate • Mortality incidence, by disease (malaria, respiratory infections, AIDS) Burden of disease (DALYs) % population affected by noise • % population in noise prone areas Level of noise in urbanized cities 202 Disease no. per 100 • • • Report, Global Burden of Infant mortality rate (per 1000 births) requirement • WHO: WHOSIS, World Health No. of people per physician (000) animal food • % % pop with access to sanitation infections 1000 Mortality caused by communicable health services • Prospects services, urban and rural services • UNPD: World Population sanitation services water, urban and rural • % drinking water urban and rural, by sex • diseases no. per Disability-Adjusted Life Years 1000 (DALYs) yrs Program (JMP) • SPC, National Governments, Governance • UNEP/IUCN/FAO Ecolex in place • CIESIN: ENTRI • Environmental conventions signed • CIDCM SFTF Database • No. of conflicts, state failures • Worldbank Governance • Environmental institutions, policies Signatories to major Env. Conventions indicators Transparency International: Corruption Index PIFS, SPC, USP, FSPI Support data • Admin boundaries (incl. EEZ) • ESRI :ArcWorld, ArcAtlas sets • Infrastructure (roads, rivers, lakes) • WHO: UN EIP admin • Watershed boundaries • Cities (location, area) • CIESIN: GPW • Population density (time series) • WRI: River basins • Landcover & vegetation (time • UNH/GRDC: Run-off boundaries Fields series) • Soil units and characteristics • Elevation & slopes • GEMS-Water: Atlas of Global Water Quality • USGS/EDC: GLCC, HYDRO1k • FAO: Soil Map of the World • UN-Habitat: Urban Observatory 203 Geography • SPC (SOPAC), USP (Land Support • Admin boundaries (incl EEZ) Datasets • Infrastructure (roads, rivers, lakes) Management Division), • Watershed boundaries SPREP, FFA (Fisheries) • Cities (location, area) • Population density (time series • Landcover and vegetation (time series) 204 • Soil unit and characteristics • Elevation and slopes APPENDIX 2 Table 1. Sources consulted for information on invasive species in the 21 target PICTs Abbott, K. L. , Sarty, M. and Lester, P. J., 2006. The ants of Tokelau. New Zealand Journal of Zoology, 33: 2, 157 — 164 American Samoa Bar Association (ASBA) 2007. American Samoa Code Annotated. Retrieved 14 September 2010 from http://www.asbar.org APFISN 2008. APFISN members. Retrieved 10 September 2010 from http://apfisn.net ASBA 2004. American Samoa Administrative Code. Retrieved 14 September 2010 from http://www.asbar.org ASEAN – Australia – New Zealand Free Trade Area (AANZFTA) 2010. Key Outcomes: Agreement Establishing the ASEAN – Australia – New Zealand Free Trade Area. Retrieved 9 September 2010 from http://www.asean.fta.govt.nz Basel Convention 2010. Parties to the Basel Convention. Retrieved 9 September 2010 from http://www.basel.int Boseto, David & Aaron P. Jenkins, N.D. A checklist of freshwater and brackish water fishes of the Fiji Islands British Antarctic Survey (BAS) 2010a. The Antarctic Treaty - Background Information. Retrieved 10 September 2010 from http://www.antarctica.ac.uk British Antarctic Survey (BAS) 2010b. Environmental Protocol. Retrieved 10 September 2010 from http://www.antarctica.ac.uk Buden, D., Donald; W. Brian Lynch and George R. Zug, 2001. Recent Records of Exotic Reptiles on Pohnpei, Eastern Caroline Islands, Micronesia. Buden, Donald W., 2007. Reptiles of Satawan Atoll and the Mortlock Islands, Chunk State, Federated States of Micronesia. Pacific Science 61.3 (July 2007): p 415(14). Buden, Donald W., 2009. Calia ailanpalai (Reptilia: Scincidae): an invasive species of lizard in the Federated States of Micronesia.(Report). Pacific Science 63.2 (April 2009): p243 Buden, W. Donald, 2008. The Reptiles of Nauru. Pacific Science 62(4):499-507. 2008 Christy, Michelle T., Craig S. Clark, David E. Gee II, Diane Vice, Daniel S. Vice, Mitchell P. Warner, Claudine L. Tyrrell, Gordon H. Rodda and Julie A. Savidge., 2008. Recent records of alien anurans on the Pacific Island of Guam. Pacific Science 61.4 (Oct 2007) CIA World Factbook 2010. Appendix C: Selected international environmental agreements. Retrieved 10 September 2010 from http://www.cia.gov Convention on Biological Diversity (CBD) 2009. Bioinvasion and Global Environmental Governance Country Profile Database. Retrieved 8 September 2010 from http://www.cbd.int Convention on Biological Diversity (CBD) 2010. List of Parties. Retrieved 8 September 2010 from http://www.cbd.int Convention on International Trade in Endangered Species of Wild Fauna and Flora (CITES) 2010. List of Contracting Parties. Retrieved 9 September 2010 from http://www.cites.org 205 Convention on Migratory Species (CMS) 2010a. Parties to the Convention on the Conservation of Migratory Species of Wild Animals and its agreements. Retrieved 9 September 2010 from http://www.cms.int Convention on Migratory Species (CMS) 2010b. Application of CMS to overseas territories/autonomous regions of parties and species reservations. Retrieved 9 September 2010 from http://www.cms.int Convention on the Conservation of Antarctic Marine Living Resources (CCAMLR) 2010. Official Member Contacts. Retrieved 10 September 2010 from http://www.ccamlr.org Environmental Treaties and Resource Indicators (ENTRI) undated. UNEP Summary File: Convention on the Protection of Natural Resources and Environment of South Pacific. Retrieved 10 September 2010 from http://sedac.ciesin.org Food and Agriculture Organization of the United Nations (FAO) 2010a. International Plant Protection Convention. Retrieved 9 September 2010 from http://www.fao.org Food and Agriculture Organization of the United Nations (FAO) 2010b. The International Treaty on Plant Genetic Resources for Food and Agriculture. Retrieved 13 September 2010 from http://www.fao.org Fritts, S. Thomas & Gordon H. Rodda, 1998. The role of introduced species in the degradation of island ecosystems: A case history of Guam. Annu. Rev. Ecol. Syst 29:113–40 Froese R., Pauly D. (Eds) 2010. FishBase. Gargominy O. (ed) 2003. Biodiversité et conservation dans les collectivités françaises d'outre-mer. Collection Planète Nature. Comité français pour l'UICN, Paris, France. x et 246 pp. Ghazanfar, Shahina A.; Gunnar Keppel; Shafiya Khan, 2001. Coastal vegetation of small islands near Viti Levu and Ovalau, Fiji. New Zealand Journal of Botany 39: 4, 587 — 600 Global Invasive Species Database (GISD). 2010 Grandgirard, Julie; Mark S. Hoddle; George K. Roderick; Jerome N. Petit; Diana Percy; Rudolph Putoa; Charles Garnier and Neil Davies, 2006. Invasion of French Polynesia by the Glassy-winged sharpshooter, Homalodisca coagulata (Hemiptera: Cicadellidae): a new threat to the South Pacific. Pacific Science 60.4 (Oct 2006): p429(10). Great Lakes Fishery Commission (GLFC) 2010. Convention on Great Lakes Fisheries between The United States of America and Canada. Retrieved 9 September 2010 from http://www.glfc.org International Maritime Organisation (IMO) 2008. Status of the London Convention and Protocol. Retrieved 9 September 2010 from http://www.imo.org International Maritime Organisation (IMO) 2010. Parties to the London Protocol 1996 to the London Convention 1972. Retrieved 9 September 2010 from http://www.imo.org International Plant Protection Convention (IPPC) 2010. Countries Overview - Southwest Pacific. Retrieved 8 September 2010 from http://www.ippc.int 206 International Tropical Timber Organisation (ITTO) 1994. International Tropical Timber Agreement, 1994. Retrieved 9 September 2010 from http://www.itto.int International Whaling Commission (IWC) 2008. Convention for the Regulation of Whaling. Retrieved 9 September 2010 from http://www.iwcoffice.org ITTO 2006. International Tropical Timber Agreement, 2006. Retrieved 9 September 2010 from http://www.itto.int Jenkins A. P., Stacy D. Jupiter, Ingrid Qauqau and James Atherton, 2010. The importance of ecosystem-based management for conserving aquatic migratory pathways on tropical high islands: a case study from Fiji. Aquatic Conserv: Mar. Freshw. Ecosyst. 20: 224–238 (2010) Lambert, Gretchen, 2002. Nonindigenous ascidians in tropical waters. Pacific Science 56.3 (July 2002): p291(8) Meyer, Jean-Yves, 2004. Threat of invasive alien plants to native flora and forest vegetation of eastern Polynesia. Pacific Science 58.3 : p357(19) Meyer, Jean-Yves. 2007. Rapport de mission sur l'Ile d'Uvea (Wallis & Futuna) du 6 au 17 Novembre 2007: Inventaire preliminaire de la flore vasculaire secondaire [unpublished report]. Délégation à la Recherche, Ministère de l'Education, l'Enseignement Supérieur et la Recherche, B.P. 20981 Papeete, Tahiti, Polynésie française. 39 pp. Meyer, Jean-Yves/Jourdan, Hervé/Malau, Atoloto. 2008. Recent incursions of invasive animal and plant species in the small and remote archipelago of Wallis and Futuna (South Pacific): "La maison brûle mais nous regardons ailleurs". In: Aliens 27: 8-9. New Zealand Ministry of Foreign Affairs & Trade (MFAT NZ) 2009. New Zealand – Malaysia Agreement on Environmental Cooperation. Retrieved 9 September 2010 from http://www.mfat.govt.nz New Zealand Ministry of Foreign Affairs & Trade (MFAT NZ) 2010. New Zealand – Hong Kong, China Environment Cooperation Agreement. Retrieved 9 September 2010 from http://www.mfat.govt.nz Paulay, Gustav, 2007. Metopograpsus oceanicus (d: Brachyura) in Hawai'i and Guam: another recent invasive? Pacific Science 61.2: p295(6). Pernetta, John C. and Dick Watling, 1978. The Introduced and Native Terrestrial Vertebrates of Fiji. Pacific Science 32: 3 Ramsar Convention on Wetlands (Ramsar) 2010. Contracting parties to the Ramsar Convention on Wetlands. Retrieved 9 September 2010 from http://www.ramsar.org Secretariat of the Convention on Biological Diversity 2010. Cartagena Protocol on Biosafety Ratification List. Retrieved 8 September 2010 from http://www.cbd.int Secretariat of the Pacific Regional Environment Programme (SPREP) 1995. The Apia Convention. Retrieved 9 September 2010 from http://www.sprep.org Shine, C., J.K. Reaser, and A.T. Gutierrez. (eds.). 2003. Invasive alien species in the Austral Pacific Region: National Reports & Directory of Resources. Global Invasive Species Programme, Cape Town, South Africa. Soubeyran Y. 2008. Espèces exotiques envahissantes dans les collectivités françaises d’outre-mer. Etat des lieux et recommandations. Collection Planète Nature. Comité français de l’UICN, Paris, France. South Pacific Biodiversity Conservation Programme (SPREP) 2010. SPREP Members. Retrieved 10 September 2010 from http://www.sprep.org Space James C. and Tim Flynn, 2001. Report to the Kingdom of Tonga on Invasive Plant Species of Environmental Concern. U.S.D.A. Forest Service Pacific Southwest Research Station Institute of Pacific Islands Forestry Honolulu, Hawai‘i, USA 207 Space James C. and Tim Flynn, 2002. Report to the Government of the Cook Islands on Invasive Plant Species of Environmental Concern. U.S.D.A. Forest Service Pacific Southwest Research Station Institute of Pacific Islands Forestry Honolulu, Hawai‘i, USA Space James C., Barbara Waterhouse,Julie S. Denslow, Duane Nelson and Thomas R. Mazawa, 2000b. Invasive plant species in Chuuk, Federated States of Micronesia. U.S.D.A. Forest Service Pacific Southwest Research Station Institute of Pacific Islands Forestry Honolulu, Hawai'i, USA Space, James C. and Tim Flynn, 2000. Observations on invasive plant species in American Samoa. U.S.D.A. Forest Service Pacific Southwest Research Station Institute of Pacific Islands Forestry. Honolulu, Hawai‘i, USA Space, James C., Barbara Waterhouse, Julie S. Denslow and Duane Nelson, 2000. Invasive Plant Species on Rota, Commonwealth of the Northern Mariana Islands. U.S.D.A. Forest Service Pacific Southwest Research Station Institute of Pacific Islands Forestry Honolulu, Hawai'i, USA Space, James C., Barbara Waterhouse, Julie S. Denslow, Duane Nelson and Erick E. Waguk, 2000. Invasive plant species on Kosrae, Federated States of Micronesia. U.S.D.A. Forest Service Pacific Southwest Research Station Institute of Pacific Islands Forestry Honolulu, Hawai'i, USA Space, James C.. David H. Lorence and Anne Marie LaRosa, 2009. Report to the Republic of Palau: 2008 update on Invasive Plant Species. U.S.D.A. Forest Service Pacific Southwest Research Station Institute of Pacific Islands Forestry Hilo, Hawai‘i, USA Thaman, R. R., F. R. Fosberg, H. I. Manner & D. C. Hassall, 1994. The Flora of Nauru. Atoll Research Bulletin No. 392. Issued by the National Museum of Natural History. Smithsonian Institution. Washington D. C. USA Theuerkauf, Jorn; Herve Jourdan; Sophie Rouys; Roman Gula; Marta Gajewska; Katarzyna Unrug; Ralph Kuehn, 2010. Inventory of alien birds and mammals in the Wallis and Futuna Archipelago. Biol Invasions DOI 10.1007/s10530-010-9706-y United Nations (UN) 2010a. Convention on Fishing and Conservation of the Living Resources of the High Seas. Retrieved 9 September 2010 from http://treaties.un.org United Nations (UN) 2010b. Status of the United Nations Convention on the Law of the Sea. Retrieved 10 September 2010 from http://www.un.org United Nations Convention to Combat Desertification (UNCCD) 2008. Signatory States and Parties to the Convention. Retrieved 10 September 2010 from http://www.unccd.int United Nations Department of Economic and Social Affairs (UNDESA) 2000. Report on the Global Conference on the Sustainable Development of Small Island Developing States. Retrieved 13 September 2010 from http://www.un.org United Nations Education, Scientific and Cultural Organisation (UNESCO) 2010. States to the Convention as of Jun 10, 2010: 187. Retrieved 10 September 2010 from http://whc.unesco.org United Nations Framework Convention on Climate Change (UNFCCC) 2010a. Status of ratification of the Kyoto Protocol. Retrieved 9 September 2010 from http://unfccc.int United Nations Framework Convention on Climate Change (UNFCCC) 2010b. Status of ratification of the Convention. Retrieved 10 September 2010 from http://unfccc.int 208 United States of America Department of State (DoS USA) 2009. Status of International Convention for the Regulation of Whaling. Retrieved 9 September 2010 from http://www.iwcoffice.org US Forest Service, Pacific Island Ecosystems at Risk (PIER). 2009 Vanuatu National Assessment Report: 5 Year Review of the Mauritius Strategy for Further Implementation of the Barbados Programme of Action for Sustainable Development Ward, Darren F. & James K. Wetterer, 2006. Fiji Arthropods III. Edited by Neal L. Evenhuis & Daniel J. Bickel. Bishop Museum Occasional Papers 85: 23–47 (2006). Checklist of the Ants of Fiji (Hymenoptera: Formicidae) Ward, Darren, 2009. Ecological partitioning and invasive ants (Hymenoptera: Formicidae) in a tropical rain forest ant community from Fiji. (Report) Pacific Science. 62.4 (Oct 2008): p473(10) Waterhouse, B.M. (AQIS, PO Box 1054, Mareeba, Qld 4880, Australia) 2003. Know your enemy: recent records of potentially serious weeds in northern Australia, Papua New Guinea and Papua (Indonesia). Telopea 10(1): 477–485. Wetterer, James K. & Vargo, Donald L., 2003. Ants (Hymenoptera: Formicidae) of Samoa. Pacific Science, 57(4), pp. 409-419\ Wetterer, James K., 2002. Ants of Tonga. Pacific Science, 56, Number 2, pp. 125-135 Wetterer, James K., 2006. Ants (Hymenoptera: Formicidae) of Niue, Polynesia. Pacific Science 60(3): 413-416. Wiewel, Andrew S., Amy, A. Yackel Adams and Gordon H. Rodda, 2009. Distribution, density, and biomass of introduced small mammals in the Southern Mariana Islands. Pacific Science 63 2: pp. 205-222 World Trade Organisation (WTO) 2008. Understanding the WTO - members and observers. Retrieved 13 September 2010 from http://www.wto.org 209 APPENDIX 3 Pacific Environment and Climate Change Outlook Report: List of Authors / Contributors to Report Writing and Reviews CONTRIBUTING AUTHORS Prof Murari Lal ORGANISATION POSITION Director Pacific Centre for the Environment and USP Sustainable Development 2010‐2012 Prof Biman Chand Professor & Dean of the Faculty of Business and Prasad Economics REPORT SECTION / CONTRIBUTION TO THE REPORT First & Final Drafting + Part III & IV + Climate Change Sections USP Economy Overview Draft & Revisions Dr Matakite Maata Senior Lecturer of the School of Chemical Sciences USP Part II: Atmosphere Draft & Revisions Dr Atul Raturi Senior Lecturer of the School of Engineering USP Part II: Atmosphere Draft & Revisions Dr Joeli Veitayaki Associate Professor of the Division of Marine Studies USP Part II: Coastal and Ocean Draft & Revisions Prof Professor of the Division of Geography USP Part III Ecosystem & Biodiversity Draft & RandolphThaman Dr Ropate Qalo Revision Associate Professor of the School of Social Sciences USP Part I Pacific Island Societies and Governance Mr Feue Tipu Fellow at the School of Governance and Development USP Part I Governance & Part IV Policy Response Studies Mr Viliamu Iese Research Fellow at the Pacific Centre for the Environment USP Frst Draft Revisions and Sustainable Development Dr David Duncan 210 Regional Engineer GEF Pacific Integrated Water Resources Management Project SOPAC/SPC ‐ GeoScience Division Part II: Freshwater Draft & Final Revisions Ms Caroline Tupoulahi‐ Fusimalohi Mr Mike Batty Planning Adviser SPC Director Fisheries, Acquaculture and Marine Ecosystems SPC Dr Johann Bell Principal Fisheries Scientist SPC Ms Helen Pippard Consultant ‐ Invasive & Threatened Species Ms Shyama Pagad Consultant ‐ Invasive & Threatened Species Ms Sally Wong Consultant ‐ Invasive & Threatened Species Dr Netatua Pelesikoti Mr Espen Ronneberg Mr Dean Solofa Director of the Division of Climate Change IUCN / Auckland University IUCN /Auckland University IUCN /Auckland University SPREP Report for Invasive & Threatened Species Sections Report for Invasive & Threatened Species Sections Part III: Climate Change Draft & Revisions Climate Change Adviser SPREP Part III: Climate Change Draft & Revisions SPREP Part III: Climate Change Draft & Revisions Mr Stuart Chape Dr Alan Tye Pacific Gobal Climate Change Observation Systems Officer Director Biodiversity and Ecosystem Management Invasive Species Adviser (2010‐2012) SPREP SPREP Dr David Haynes Director Waste Management & Pollution Control SPREP First Draft Revisions First & Final Report Drafting + Threatened & Invasive Species Draft & Revisions Overview: Waste Management & Pollution Draft Overview Waste Management & Pollution + Pacific Marine Biodiversity Outlook Report 2010 Overview Waste Management & Pollution + Pacific Marine Biodiversity Outlook Report 2010 Ms Esther Richards Solid Waste Management Adviser SPREP Mr Anthony Talouli Marine Pollution Adviser SPREP 211 Coordinate contribution from other Divisions of SPC to the PECCO Exercise & Report PartII: Coastal & Ocean (Fisheries) First Draft Revisions Part II: Coastal & Ocean (Fisheries) First Draft Revisions Report for Invasive & Threatened Species Sections Mr Jeffrey Kinch Coastal Management Adviser (2009‐2010) SPREP Mr Sefanaia Nawadra Dr Gillian Key Mr Clark Peteru Director Environmental Monitoring and Governance SPREP ‐ Capacity Building Adviser Environment Legislative Adviser SPREP SPREP Mr Paul Anderson Environmental Monitoring Analyst SPREP Mr Tepa Suaesi Environmental Planning Officer SPREP First & Final Report Draft & Revisions Governance Overview + Legislation Drafts & Revisions Pacific Marine Biodiversity Outlook Report 2010 PECCO Project Coordinator Ms Joana Akrofi Programme Officer UNEP Reviewer, coastal and marine Mr Mozaharul Alam Ms Raji Dhital Programme Officer UNEP Reviewer, climate change Mr Salif Diop Senior Programme Officer UNEP Reviewer, coastal and marine Ms Beth Ingraham Information Officer UNEP Reviewer Ms Janet Kabeberi‐ Macharia Ms Charuvan Kalyangkura Mr Peter Kouwenhoven Mr Christian Marx Senior Programme Officer UNEP Reviewer, Gender UNEP Administrative support Administrative Officer UNEP Financial and adminstrative support Mr Patrick Mmayi Programme Officer UNEP Reviewer, coastal and marine Ms Ruth Mukundi Programme Assistant UNEP Administrative support Ms Neeyati Patel Programme Officer UNEP Launch support 212 Consultant Programme Assistant ‐ Consultant ‐ Pacific Marine Biodiversity Outlook Report 2010 PECCO Project Manager 2012 Reviewer Reviewer, entire report Ms Audrey Ringler Designer UNEP Cover design Ms Pinya Sarasas Programme Officer UNEP Reviewer Ms Tunnie Programme Officer UNEP Technical support and Reviewer UNEP Coordinated technical support UNEP Administrative support Srisakulchairak Ms Anna Stabrawa Regional Coordinator Ms Panvirush Programme Assistant Vittayapraphakul Mr Jinhua Zhang Programme Officer UNEP Manged UNEP's support and contributions Ms Sally Perry Senior Environment Consultant Finalized the report & prepared print layout Ms Louise Upton Consultant Support Officer Eco Logical Australia Eco Logical Australia 213 Finalized the report & prepared print layout 214

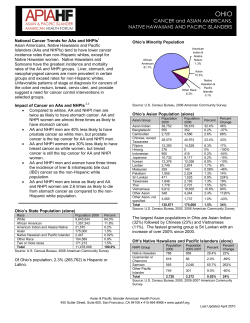


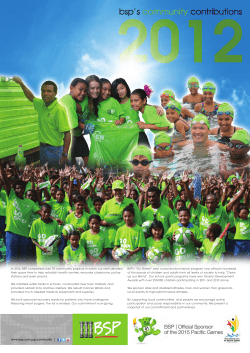


© Copyright 2026