
III-V Material Integration in 1-Transistor Capacitor
III-V MATERIAL INTEGRATION IN 1-TRANSISTOR CAPACITOR-LESS DRAM A DISSERTATION SUBMITTED TO THE DEPARTMENT OF ELECTRICAL ENGINEERING AND THE COMMITTEE ON GRADUATE STUDIES OF STANFORD UNIVERSITY IN PARTIAL FULFILLMENT OF THE REQUIREMENTS FOR THE DEGREE OF DOCTOR OF PHILOSOPHY Ashish Pal March 2015 Abstract Scaling of the capacitor in present 1-transistor 1-capacitor dynamic random access memory (1T-1C DRAM) technology has become increasingly challenging. The fabrication of this capacitor itself costs about 25% of the total cell cost and also decreases yield and reliability. Recently the embedded DRAM technology has become mainstream. In this technology, the logic transistor and the DRAM cell fabrication processes are integrated together. From this point of view, the 1-transistor capacitor-less DRAM (1T-DRAM) technology is quite attractive. It attempts to stores charge inside the transistor body instead of a capacitor to distinguish between logic state ‘0’ and ‘1’. Thus this technology eliminates the need for a capacitor. However the retention time has always been an issue with silicon based capacitor-less DRAM technology and hence this technology has not been adopted in current CMOS industry. In this work we identify the inadequate charge storage capability as the main culprit for short retention time in silicon-based 1T-DRAM. We propose to use gallium phosphide (GaP) at source and drain (GaP-SD). GaP has a large valence band-offset (0.8-1 eV) and close lattice constant (0.37% mismatch) to silicon. This band-offset increases the hole storage capability and retention time of the transistor but does not affect its speed of operation to a great extent. Using TCAD simulations, we evaluate different GaP-SD 1T-DRAM structures suitable for commodity and embedded DRAM (for bulk and SOI) technology and show their superiority to pure silicon based 1TDRAM in terms of scalability and the retention time performance. Our simulations show iv that the performance can be further enhanced by inserting a germanium layer in the silicon channel. To fabricate GaP source-drain transistors, we first optimize the growth of a thin and strained GaP film on bulk Si substrate using metal-organic chemical vapor deposition (MOCVD) technique. We evaluate the GaP film and Si-GaP p-n heterojunction interface using different physical characterization techniques (SEM, XRD, AFM, TEM) and also by electrically characterizing the GaP-Si heterojunction diode. Next, long channel transistors on bulk silicon substrate with GaP source-drain and silicon channel are fabricated to show the proper functioning of GaP as source and drain material. Finally, using optical excitation as a method of hole generation, we confirm the enhanced hole storage capability of the GaP-SD transistor, thus validating the efficiency of the GaP-Si valence band offset. v Acknowledgements I would like to express my gratitude to my advisor, Prof. Krishna Saraswat for accepting me in his group and for giving the chance to work on this great research topic. His encouragement has motivated me even in worst of my days and his kindness has influenced me in building my personality. His vast knowledge worked as a backbone of this research. I sincerely thank him for giving me the freedom and independence in conducting my research which gave me an opportunity to roam around unknown territory of semiconductor and helped me to learn and grow. I would like to thank Prof. Yoshio Nishi for being my co-advisor. He provided me a great opportunity to present my research in Non-volatile Memory Technology Research Initiative (NMTRI) meetings in front of the representatives from different semiconductor companies. This gave me a platform to discuss and learn various issues that semiconductor memory industry face. I would also like to thank to Prof. Plummer for his course EE 212: Integrated Circuit Fabrication Processes, his extra-ordinary book “Silicon VLSI Technology: Fundamentals, Practice and Modeling”. I also had the great opportunity to have him as a reader of this thesis. I would specially like to acknowledge Dr. Aneesh Nainani to help me in all aspects my research – starting right from designing experiments to all the way to writing papers. I cannot thank him enough for his time, advices, encouragements and for sharing his perspective, knowledge and information. Throughout my student life in Stanford, he has been an unofficial mentor, and some time even a “co-advisor” in a lot of ways vi I would like to thank Dr. Errol Sanchez, Dr. Xinyu Bao and Dr. Zhiyuan Ye for providing me an opportunity to learn about MOCVD of III-V materials and also to use the Applied Materials’ MOCVD tool to optimize the GaP growth on silicon. Everything that I have learnt about MOCVD and GaP growth are mostly from them and without their help, this work would not been possible. The device fabrication part of this work was done in Stanford Nanofabrication Facility (SNF) in Center of Integrated Systems (C.I.S), also known as Allen building in Stanford. The material characterization part was mostly carried out in Stanford Nanocharacterization Lab (SNL), which has now merged with Stanford Nano Center (SNC). I would like to really appreciate the effort of all these lab-staffs for maintaining all the tools and also for spending their time to train me. I would like to thank our group’s administrative associate – Gail Chun-Creech and Crystle Palafox for taking care of the financial side of my research. During my graduate life, I met a lot of talented, hard-working and intelligent students, who have really helped me in my research and in building my skill-set. Their encouragement and friendliness kept me motivated throughout my time in Stanford. I would specially like to thank the students of Prof. Saraswat – Jason Lin, Ze Yuan, Suyog Gupta, Arunanshu Roy, Archana Kumar, Wooshik Jung, Ju Hyung Nam, Donguk Nam, Yeul Na, Shashank Gupta, Raisul Islam, Pranav Ramesh, Dave Sukhdeo and Gautam Shine for sharing their research and for their time during various discussion. I would also like to thank the students of Prof. Philip Wong’s group and Prof. Nishi’s group for their support during various levels of my research. I would like to thank Sri Lakshmi, vii Marshnil and Nishit for being my friends and to provide all the mental support through various stages of my time in Stanford. Words cannot express the contribution of my family – my mother, my elder brother and my sister-in-law. Their love, sacrifice and acceptance have paved the way for all my successes. Finally I convey my sincere thanks to Stanford University for providing me this opportunity to spend some time here. The memories made here will be with me throughout my life. “Once you have traveled, the voyage never ends, but is played out over and over again in the quietest chambers. The mind can never break off from the journey.” - viii Pat Conroy Table of Contents Abstract …………………………………………………………... iv Acknowledgements ………………………………………………. vi Table of Contents ………………………………………………... ix List of Tables …………………………………………………… xiii List of Figures …………………………………………………... xiv Chapter 1: Introduction ..………………………………………… 1 1.1 Semiconductor Memory Architecture ...…………………… 1 1.2 Challenges in Modern DRAM Technology ..………………. 4 1.2.1 Capacitors in 1T-1C DRAM ………………………….. 5 1.2.2 Leakages in 1T-1C DRAM …………………………… 8 1.3 1-Transistor Capacitor-less Floating Body DRAM as an Alternative ………………………………………………….. 11 1.4 Programing of 1T-DRAM Cells …………………………… 14 1.5 1.4.1 Impact Ionization ……………………………………. 14 1.4.2 Single Transistor BJT Latch-up ……………………... 16 1.4.3 Band-to-band Tunneling …………………………….. 19 1.4.4 Thyristor Based Programing ………………………… 20 Erasing of 1T-DRAM Cells ………………………………... 21 ix 1.6 Reading of 1T-DRAM Cells ………………………………... 22 1.7 Development in 1T-DRAM Cell …………………………… 23 1.8 Organization of Thesis ……………………………………... 28 1.9 References …………………………………………………... 29 Chapter 2: III-V Material Integration in 1-Transistor Capacitor-less DRAM …………………………….. 33 2.1 Charge storage in a silicon transistor …………………….. 33 2.2 SOI-based GaP Source-Drain Transistor ………………... 40 2.3 Bulk-Si Substrate Based GaP Source-Drain Transistor ... 47 2.4 Vertical GaP Source Drain 1-Transistor DRAM Cell …... 53 2.4.1 Variability in Vertical GaP Source Drain DRAM Cell …………………………………………. 59 2.5 GaP-SD 1-Transistor DRAM - Technological Challenges .. 63 2.6 Conclusion ………………………………………………….. 64 2.7 References …………………………………………………... 65 Chapter 3: Optimization of Gallium Phosphide Growth on Silicon …………………………………. 66 3.1 Growth Technique …………………………………………. 66 3.2 Procedure of GaP Growth on Silicon ……………………… 67 3.3 Physical Characterization of GaP Film on Silicon ………... 69 3.4 Conclusion ………………………………………………….. 75 3.5 References …………………………………………………... 75 x Chapter 4: Electrical Characterization of Gallium Phosphide – Silicon Heterojunction Interface …………………. 77 4.1 P-N Junction Diode ………………………………………… 77 4.2 Fabrication of Gallium Phosphide – Silicon Heterojunction Diode ……………………………………… 80 4.3 GaP Source Drain Heterojunction Transistor …………… 85 4.4 Nickel Alloying of GaP ……………………………………... 91 4.5 Conclusion ………………………………………………….. 96 4.6 References …………………………………………………... 96 Chapter 5: Demonstration of Enhanced Hole Storage Capability in GaP Source-Drain Transistor …………………. 98 5.1 Use of Bulk-Si Substrate Based Transistors ……………... 98 5.2 TCAD simulation of Hole Storage Capability for Bulk-Si Substrate Based Transistors ……………………. 101 5.3 Experimental Comparison of Hole Storage Capability ... 104 5.4 Conclusion ………………………………………………… 108 Chapter 6: Conclusion and Future Work .....………………... 110 6.1 Review of overall work …………………………………... 110 xi 6.2 6.3 Future Work ……………………………………………… 113 6.2.1 Doping of GaP …………………………………….. 113 6.2.2 Integration of GaP source-drain transistor with the logic silicon transistor ……………………. 115 GaP on Silicon Growth for Future Applications ……….. 119 6.3.1 III-V transistor integration on silicon …………….... 119 6.3.2 Realization of LASER on silicon ………………….. 120 6.4 Contributions ……………………………………………... 120 6.5 References ………………………………………………… 121 xii List of Tables Table 2.1 List of various combinations of source-drain and channel materials satisfying the lattice constant and band offset criteria for 1T-DRAM application 40 Table 2.2 Various parameters used for GaP-SD and Si-SD SOI device design 41 Table 2.3 Various parameters for both SOI-based and bulk-Si substrate based GaP source-drain 1-transistor capacitorless DRAM Cell 52 Table 2.4 Device parameters for vertical GaP source-drain memory cell for 55nm gate length device for commodity DRAM application 54 Table 2.5 Optimized device parameters for vertical GaP sourcedrain memory cell for TSi=30nm and TSi=20nm devices for commodity DRAM application 62 xiii List of Figures Figure 1.1 Memory architecture of a computer system 1 Figure 1.2 The conventional 1transistor-1capacitor DRAM cell 3 Figure 1.3 The trench capacitor 1T-DRAM cell 6 Figure 1.4 The evolution of depth of the trench capacitor in embedded DRAM 7 Figure 1.5 The stacked capacitor DRAM 8 Figure 1.6 Evolution of bit cost for DRAM over the years 10 Figure 1.7 Variation of average DRAM density in a system shipped over the years 10 Figure 1.8 Kink effect in SOI-based transistor due to storage of holes which increases the body potential and reduces the threshold voltage 11 Figure 1.9 Working principle of the 1-transistor capacitor-less DRAM showing the 2 different states depending on the storage transistor body of holes inside the transistor body 12 Figure 1.10 1T DRAM cells arranged in the form of an array 13 Figure 1.11 Impact ionization based programing method for 1transistor capacitor-less DRAM 15 Figure 1.12 Single transistor BJT latchup programing method for 1transistor capacitor-less DRAM 17 Figure 1.13 Optimization strategy of the transistor for 1-transistor capacitor-less DRAM application 17 Figure 1.14 Thyristor DRAM cell structure 20 Figure 2.1 SOI-based 1-transistor capacitor-less DRAM cell. The charge can be stored in the channel region 34 xiv Figure 2.2 Band diagram of the n-channel 1T-DRAM cell from source to drain through channel showing the potential well to store holes Lattice constant versus conduction and valence band alignment plot for the popular semiconductor materials Bandgap and conduction and valence band lineup for gallium phosphide and silicon. The valence band offset is about 1eV and the conduction band offset is about 0.1eV 34 Figure 2.5 Proposed SOI-based 1-transistor DRAM structure with raised gallium phosphide source and drain 38 Figure 2.6 Transfer characteristics for GaP source-drain and silicon source-drain transistors for the device parameters mentioned in table 2.2 42 Figure 2.7 (a) Single transistor latch-up programing for GaP-SD and Si-SD transistors showing the threshold voltage shift obtained from each device as calculated from the (b) transfer characteristics at the same 1.5V drain voltage 42 Figure 2.8 Distribution of holes after programing in SOI-based (a) GaP-SD transistor (b) Si-SD transistor. The transistors are biased at VDS = 1.5 V, VGS = -2 V 43 Figure 2.9 Comparison of hole density after programing in GaP-SD and Si-SD transistors from the source-body to box-body interface as shown in (a) 44 Figure 2.10 (a) Timing diagram of current and voltage for read, program and read operations at 25°C showing the readcurrent difference after programing in GaP-SD device and Si-SD devices. (b) Evolution of read-current over time after programing showing a retention time of at least 1 second at 85°C for GaP-SD device 45 Figure 2.11 Proposed bulk-Si substrate based 1-transistor DRAM structure with raised gallium phosphide source and drain and a buried GaP layer 47 Figure 2.12 Transfer characteristics of a 54nm gate length SOI-based GaP-SD cell and an optimized bulk-Si substrate based GaP-SD cell with a buried GaP layer 48 Figure 2.3 Figure 2.4 xv 37 38 Figure 2.13 Comparison of hole density in the SOI-based cell and bulk-Si based cell after programing. The hole density is plotted at the middle of the device from the gate oxide interface to buried GaP/oxide interface as shown by the arrow in the structure 49 Figure 2.14 Evolution of threshold voltage shift with time in (a) SOIbased GaP-SD memory cell (b) bulk-Si substrate based GaP-SD memory cell 51 Figure 2.15 Transfer characteristics of 20nm gate length SOI-based GaP-SD cell and an optimized bulk-Si substrate based GaP-SD cell with a buried GaP layer 53 Figure 2.16 Proposed GaP source-drain vertical DRAM cell for commodity DRAM applications – (a) the 3D structure (b) 2D device used for TCAD simulation 54 Figure 2.17 Single transistor latch-up programing characteristics for vertical GaP-SD and Si-SD transistors optimized for commodity DRAM application 55 Figure 2.18 Evolution of read-current and threshold voltage shift at room temperature in GaP-SD and Si-SD vertical memory cells 56 Figure 2.19 Evolution of read-current and threshold voltage shift at elevated (T=85°C) temperature in GaP-SD and Si-SD vertical memory cells 57 Figure 2.20 Trend of single transistor latch-up programing with scaling of the GaP-SD and Si-SD transistor 58 Figure 2.21 Retention times at room (T=25°C) and elevated (T=85°C) temperature for GaP-SD vertical 1T-DRAM cells at TSi = 30 nm and TSi = 20 nm device footprint 59 Figure 2.22 Retention time distribution for TSi variability in (a) Si-SD cell (b) GaP-SD cell at T = 85°C for mean TSi = 54 nm device 61 Figure 2.23 Retention time distribution for TSi variability in GaP-SD cell at T=85°C for mean TSi = 30nm and TSi = 20nm device 62 xvi Figure 2.24 Technological challenges for realizing the GaP raised source-drain 1-transistor DRAM cell 63 Figure 3.1 SEM image of the starting recipe of GaP growth without any growth optimization, clearly indicating the presence of non-aligned antiphase boundaries 70 Figure 3.2 TEM cross section image of about 55nm GaP grown on silicon using MOCVD without proper recipe optimization 70 Figure 3.3 SEM image of the GaP surface after the addition of hydrogen annealing step 71 Figure 3.4 SEM image of GaP grown on silicon after proper growth temperature optimization 71 Figure 3.5 SEM image of 55nm GaP grown on silicon using MOCVD with proper growth optimization 72 Figure 3.6 TEM cross section image of GaP grown on Si with proper optimized recipe 72 Figure 3.7 X-ray diffraction characterization result for MOCVD grown GaP film on silicon with optimized and not optimized recipe in (a) <004> and (b) <002> direction 73 Figure 3.8 Secondary ion mass spectroscopy of GaP film showing inter-diffusion of Ga, P and Si into GaP film and bulk Si substrate 74 Figure 4.1 Current-voltage characteristics in both forward and reverse directions for ideal and non-ideal diode. The traps and defects near the junction interface or in the depletion region can lead to an ideality factor between 1 and 2 at low forward voltage regime and also can lead a reverse current strongly dependent on reverse voltage 79 Figure 4.2 Process flow for GaP – silicon p-n heterojunction fabrication 81 Figure 4.3 Current-voltage characteristics of GaP-Silicon p-n heterojunction diode at room temperature 83 xvii Figure 4.4 Temperature dependence of GaP-Si heterojunction diode currents for forward bias, moderate reverse bias and high reverse bias 84 Figure 4.5 Process flow for fabrication of GaP source-drain heterojunction transistor on bulk silicon substrate 85 Figure 4.6 Transfer characteristics of GaP-Si heterojunction transistor with and without silicon etching prior to gate oxide deposition 87 Figure 4.7 Characteristics of GaP-Si heterojunction transistor for a 100µm gate length transistors – (a) transfer characteristics (b) output characteristics 88 Figure 4.8 Transfer characteristics of GaP source-drain heterojunction transistors for different channel lengths ranging from 2µm to 100µm. 89 Figure 4.9 Process flow for fabrication of transmission line measurement structure to study effect of nickel alloying on GaP sheet and contact resistance 91 Figure 4.10 Measurement of GaP sheet and contact resistance with and without nickel alloying using transmission line measurement (TLM) structure 93 Figure 4.11 Transfer characteristics of GaP-Si heterojunction transistor for different gate lengths – (a) without nickel alloying, (b) with incorporation of nickel alloying in GaP source and drain region 95 Figure 4.12 Scaling of on-current with gate length scaling for GaP-Si heterojunction transistor with and without incorporation of nickel alloying of GaP at source and drain 95 Figure 5.1 Difference in hole storage in (a) SOI-based and (b) bulkSi substrate based transistor. The buried oxide layer confines the holes in the thin active device layer in SOIbased transistor whereas the holes diffuse away into the bulk for bulk-Si substrate based transistor. 99 Figure 5.2 TCAD simulation of transfer characteristics of silicon source-drain transistor with and without optical excitation 102 xviii Figure 5.3 TCAD simulation of hole storage characteristics of longchannel (a) silicon source-drain and (b) GaP source-drain transistor 103 Figure 5.4 Gate last process flow for silicon source drain transistor without a substrate contact Transfer characteristics of fabricated (a) silicon sourcedrain and (b) GaP source-drain transistor at VDS=1V 105 Figure 5.6 Transfer characteristics of silicon source-drain transistor for (a) 50µm and (b) 10 µm channel length with and without the presence of optical excitation. Both channel length devices show a threshold voltage reduction of about 75-80mV 106 Figure 5.7 Transfer characteristics of GaP source-drain transistor for (a) 100µm and (b) 50 µm channel length with and without the presence of optical excitation. Both channel length devices show a threshold voltage reduction of about 450mV. 107 Figure 5.8 Transfer characteristics of GaP source-drain transistor for (a) 25µm and (b) 10 µm channel length with and without the presence of optical excitation. Both channel length devices show a threshold voltage reduction of about 450490mV. 108 Figure 6.1 Process flow to integrate GaP source-drain transistor with GaP growth taking place at the start of the transistor fabrication 116 Figure 6.2 Process flow to integrate GaP source-drain transistor with GaP growth taking place after the silicon source-drain epi for silicon transistor 118 Figure 5.5 xix 106 Chapter 1 Introduction This chapter gives an overview about the importance of DRAM as a semiconductor memory and also discusses about the challenges faced by the current DRAM industry. We also introduce the concept of capacitor-less DRAM and discuss its potential as an alternative to the conventional 1 transistor-1 capacitor DRAM cell. Finally we describe the historical development of capacitor-less DRAM technology and identify the major roadblocks for this technology to be useful. These serve as a motivation for this research. 1.1 Semiconductor Memory Architecture Figure 1.1 Memory architecture of a computer system 1 A computer system mainly consists of two parts – 1) memory – where the data are stored and 2) CPU or logic – which executes different operations on the data after fetching them from the appropriate memory locations. The memory is further subdivided in different categories as shown in figure 1.1. Most of the data are stored in hard disk drive (HDD) or in solid state drive (SSD), also known as flash memory. The SSD - being faster and less energy-demanding of the two – has become more popular in recently. The basic unit of memory – which stores a bit of data - is called a memory cell. However these days, the SSD cells are also designed to store two or more bits. The cell size of the SSD is about 4F2, where F is the half of the uncontacted polysilicon pitch in a given technology. Having the smallest cell size among all memories, the SSD is the densest and cheapest of all. In the current computer systems, the SSD storage size ranges from 128 to 512GB. However in comparison to the logic/CPU, the SSD is much slower in operation. The access time of an SSD cell is in the range of 10µs-1ms, whereas the logic transistors can respond in about 10ps-1ns. Tto bridge the speed/bandwidth gap between the SSD and logic, two more levels of memory have been created. The first one is called the static random access memory (SRAM) or cache memory – which is the fastest in the memory architecture, with access speed of less than a nanosecond. Depending upon the speed and proximity to the CPU, the cache is further subdivided into level 1, 2 and 3 (L1, L2 and L3) cache. However an SRAM cell is too large (~100F2) and too costly (generally consists of 6-transistors), compared to an SSD. Thus the SRAM size in a computer system is generally limited to only 4-8MB. Most of the data which are being used at a particular time (such as the operating system) are stored in a different type or memory – called dynamic random access memory (DRAM). The 2 DRAM cell is both small (~6F2) and quite fast (~10-100ns of access time). The DRAM bit cost is quite reasonable too (8-10$/GB). Systems with 4-48GB DRAM are quite popular these days. These days DRAM is being used in the level 3 cache memory as well instead of the traditional SRAM. The DRAM in level 3 cache is called the embedded DRAM. The embedded DRAM cells generally have a slightly larger cell size (30-50F2), but still they give an area advantage over SRAM cells. At the 14nm node, the SRAM to DRAM cell size ratio is 3 to 1 [1-2]. With the rising leakage power dissipation of SRAM cells, the embedded DRAM technology has become increasingly attractive for the semiconductor industry over the last few years. Figure 1.2 The conventional 1transistor-1capacitor DRAM cell The conventional DRAM cell generally consists of a transistor and a capacitor (1T1C) connected in series as shown in figure 1.2. The gate and drain of the transistor are connected to a wordline and a bitline, respectively. The logic states ‘1’ and ‘0’ indicate whether charge is stored in the capacitor or not. To write a data ‘1’, that is, to store charge in the capacitor, first the bitline capacitance is charged and then a positive voltage is applied to the gate to turn on the transistor. This transfers part of the charge 3 from the bitline to the capacitor. Once the capacitor is charged, wordline voltage is reduced to zero to turn the transistor off. To read the state of the cell, the bitline is first charged to an intermediate voltage and then the transistor is turned on. If the capacitor is charged, then it transfers part of its charge to the bitline, which increases the bitline’s potential slightly. This potential increase is sensed by a sense amplifier which then gives an output of logic state ‘1’. In the other case, when there is no charge present in the capacitor, the bitline transfers part of its charge to the capacitor, which reduces the potential of the bitline. This is sensed by the sense amplifier to give an output of logic state ‘0’. Finally to erase the cell, the bitline is discharged and the access transistor is turned on, which leads to a transfer of charge from the capacitor to the bitline. 1.2 Challenges in Modern DRAM technology Fabrication of a memory cell such as DRAM which is fast, small and cheap has been a problem for the semiconductor industry, especially in recent times – with the technology node approaching a single digit number. As we discussed in the last section, the capacitor plays an important role in the proper operation of DRAM. Unfortunately, this storage capacitor is not ideal. Once the charge is stored in the capacitor, it starts to leak through various paths. The amount of time upto which enough charge can be retained in the capacitor to distinguish between logic states ‘0’ and ‘1’ is termed as retention time. The retention time is one of the most important performance specifications for DRAM cells. According to the International Technology Roadmap for Semiconductors (ITRS), the retention time of the DRAM cells should be at least 64ms at 85°C [3]. This performance specification is constant throughout different 4 technology nodes – which means that as we scale down the transistor and capacitor dimensions, the retention time should not degrade. To achieve 64ms retention time and also enough signal to noise ratio during operation, the storage capacitance needs to be around 20-30fF. As we scale down the cell dimensions, a smaller footprint or area is available to realize the same capacitance. Scaling of the transistor also leads to higher leakage current. This affects the cell retention time. The simplest capacitor structure is a planer structure where a thin dielectric layer is sandwiched between two metal plates. For simple calculations, let us assume the effective oxide thickness (E.O.T) of the dielectric is 0.5nm (according to ITRS 2013 edition, year 2014 prediction). With a planer structure, the area (A) required to realize 20fF capacitance is given as, 20 × 10−15 = 8.85 × 10−12 × 3.9 × 𝐴 0.5 × 10⁻⁹ Or, 𝐴 = 283𝐹 2 for 𝐹 = 32𝑛𝑚 This is much larger than the 6F2 size requirement for DRAM cell. This calls for special processing techniques for DRAM capacitors which increase challenges and the cost for DRAM cells. 1.2.1 Capacitors in 1T-1C DRAM One way to realize the storage capacitor of the DRAM within its small footprint is to increase the surface area by etching a deep trench into silicon followed by deposition of a thin dielectric and a conducting plane. This is called the trench capacitor DRAM [4] and is shown in figure 1.3. The trench capacitor has been used by IBM for 5 embedded DRAMs in their power generation server CPU. Figure 1.4 shows the depth of these trench capacitors for different technology nodes in power processors. For 32nm technology node, the etching depth is about 3.4µm [5]. The advantage of using trench capacitor based DRAM is that once the capacitor is formed, the surface is planer again, and the DRAM and logic transistors can be fabricated on this planer surface – just like on a bulk silicon. The constraint is that the capacitor dielectric has to go through the thermal budget of remaining process steps. The high-k gate dielectric used these days in the DRAM capacitor, generally cannot sustain too high temperature (700-800°C) and this limits the maximum temperature which can be used for the transistor and rest of the fabrication steps. Figure 1.3 The trench capacitor 1T-DRAM cell [6] 6 Figure 1.4 The evolution of depth of the trench capacitor in the embedded DRAM [5] As the technology node progresses, the trench needs to be deeper, which clearly poses a tremendous process challenge. The other problem of the trench capacitor DRAM is the defects and traps which get generated in the process of silicon etching during formation of the trench. These defects and cracks generally travel laterally perpendicular to the sidewall of the trench and act as leakage paths for the charge stored in the capacitor. This defect/trap assisted leakage degrades the retention time of the trench capacitor DRAM and also widens the retention time distribution of the cells. The other way to form the capacitor is to fabricate a tall metal structure – known as the stacked capacitor as shown in figure 1.5 [6]. The stacked capacitor DRAM is used for all commodity DRAM applications and also has been used in Intel’s 22nm Haswell chip. The aspect ratio of these tall structures can be as high as 60. The problem with 7 these tall structures is that once fabricated, they can collapse on each other during subsequent process steps. This results in shorting of the metal lines. The aspect ratio needs to be higher as the technology node progresses which would clearly be a problem due to yield and reliability issues for the stacked capacitor DRAM. Figure 1.5 The stacked capacitor DRAM [6] 1.2.2 Leakages in the 1T-1C DRAM Other than the inadequate storage capacitance, charge leakage is also a major problem in current DRAM technology. The different leakage components in a DRAM chip are – 1) junction leakages at storage node, 2) subthreshold leakage of the access transistor, 3) capacitor dielectric leakage, 4) gate induced drain leakage (GIDL) at 8 storage node, 5) gate dielectric leakage and 6) leakage current between adjacent cells. The DRAM scaling demands the scaling of the access transistor, which always leads to higher subthreshold leakage because of degraded electrostatics, especially if the supply voltage is not scaled. The increased subthreshold leakage has been alleviated to some extent by designing new 3-D access transistor structures such as Recess-Channel-Array Transistor (R-CAT) [7] and Vertical-Channel-Array Transistor (V-CAT) [8]. These increase the channel length of the transistor keeping the footprint same. The scaled access transistor demands a thinner gate oxide. This leads to an increase in gate leakage. The use of halo doping (required to limit the subthreshold leakage and to improve electrostatics) in access transistors increases the GIDL current. The increased GIDL and subthreshold leakage have become the main reasons for the charge loss from DRAM cells. DRAM chips these days are wire bonded to the CPU chip. The CPU chip generally functions around 70-80°C because of its high power dissipation. The hot CPU chip increases the operating temperature of the DRAM chip and the associated leakages. Because of the challenges in the fabrication of the capacitor and in the design of the transistor at sub-50nm nodes, the cost reduction rate of the DRAM bits has decreased from 33% to 20% as shown in figure 1.6. The increased process cost has heavily reduced the profit margin for the DRAM industry and many DRAM companies have left the market – thus consolidating the business in the hands of a few players such as Samsung, Hynix, Micron, Nanya etc. Because of the complex fabrication process, and the slow bit cost reduction rate, the average DRAM density in the systems has not increased as per Moore’s law as shown in figure 1.7. New markets of smartphones and tablets have prolonged the DRAM industry for a few years now. But a suitable alternative needs to 9 be adopted soon by semiconductor industry. This suitable alternative should reduce the process complexity and cell cost and should help to recover the profit margin associated with DRAM industry. Figure 1.6 Evolution of bit cost for DRAM over the years [9]. Figure 1.7 Variation of average DRAM density in a system shipped over the years [10] 10 1.3 1-Transistor Capacitor-less floating body DRAM as an Alternative Figure 1.8 Kink effect in SOI-based transistor due to storage of holes which increases the body potential and reduces the threshold voltage [11] With the rising challenges in DRAM cell such as increased process cost, nonscalability of the capacitor and higher leakage, researchers started to look for an alternative to the conventional 1T-1C DRAM cell. With increasing interest in integration of DRAM with the CPU, the suitable alternative also needs to follow a similar process flow as of logic transistors. With these requirements in mind, a new concept of storing charge came along. Around this time, the kink effect in PDSOI transistors was well known. Due to kink effect, the drain current suddenly increases at sufficient drain voltages as shown in figure 1.8. This indicates a change in the threshold voltage. At these drain voltages, impact ionization generates holes which start to accumulate at the source end. This accumulation of holes reduces the source-channel electron injection barrier and hence the threshold voltage. The new DRAM concept uses this mechanism behind the kink effect and optimizes the transistor to further amplify 11 this effect. Instead of storing charge inside a capacitor, it attempts to store it inside the transistor body. The minority carriers have a very small lifetime. Thus only the majority carriers can be stored inside the transistor body for sufficient time to meet the retention time criteria. This means for an N-channel transistor with p-type silicon body, holes will be stored to distinguish between logic state ‘0’ and ‘1’. The basic capacitor-less DRAM cell and its working principle are shown in figure 1.9. The excess holes inside the transistor body of the SOI-based capacitor-less DRAM cell change the body potential and the threshold voltage of the transistor. The threshold voltage for an SOIbased transistor is given by, VTH = VFB + 2ϕB √2εSi qNA √2ϕB − VB COx where VFB is the flat band voltage, COx (= εOx/tOx) the oxide capacitance, NA is the ptype doping of silicon body and ϕB is the built in potential given by ϕB = k B T ln NA ni The body voltage VB1 in logic state ‘1’is higher (because of hole storage) than logic state ‘0’ body voltage VB0. The threshold voltage shift ΔVTH is given by, Gate Source n+ pBody Drain n+ Program (injection of holes) (reduction of VT) Gate Source n+ OOOOOO OOOOOO OOOOOO OOOOOO Drain n+ BOX BOX Erase State ‘1’ (removal of holes) State ‘0’ (increase in VT) Figure 1.9 Working principle of the 1-transistor capacitor-less DRAM showing the 2 different states depending on the storage of holes inside the transistor body. 12 ∆VTH = 2ϕB √2εSi qNA (√2ϕB − VB0 − √2ϕB − VB1 ) COx This shows that for same VB1, the threshold voltage shift would be higher if COx is lower (i.e, tOx is higher) and if NA is higher. Unfortunately higher NA also leads to higher recombination rate for the stored excess holes and thus is not a very useful way to optimize the memory cell performance. This change in threshold voltage can be sensed by applying a small drain voltage and by measuring the drain current. Comparing this drain current with a standard cell will help to make a decision whether the measured cell has holes stored in it – that is whether the cell is in logic state ‘1’ or ‘0’. Figure 1.10 1T DRAM cells arranged in the form of an array [6] Figure 1.10 shows 1-transistor capacitor-less DRAM cells arranged to form an array. The metal bitlines and the sourcelines are connected to the source and drain of the transistors. The metal wordlines are connected to the gate of the transistors. The bitlines and wordlines can be shared between two columns of cells. The individual source and drain of a transistor can also be shared between two transistors. In a DRAM 13 process technology with self-aligned contacts with polysilicon gates, the size of the 1TDRAM cell can be 6F2 where F is the half the distance between two metal wordlines or bitlines. However, if integrated with logic process technology, then the cell size can be further reduced to 4F2 by using the mask alignment technique to open contact holes for source and drain. Thus the capacitor-less 1T-DRAM can be as area efficient as the commodity DRAM technology, even when integrated as embedded DRAM. Moreover, it gets rid of a costly and unreliable capacitor fabrication technique and thus has the capability of improving the scalability and profit margin for the DRAM industry. 1.4 Programing of 1T-DRAM Cells The basic 1T-DRAM cell stores excess carriers inside the transistor body to modulate the threshold voltage of the channel. The excess carriers are stored inside the channel by programing the cell. The programing can be done in different ways, such as: 1.4.1 Impact Ionization In this method [12], the transistor channel is inverted by applying a positive gate voltage (assuming an N-channel transistor). At the same time, a high positive voltage is also applied to the drain. If the drain voltage is high enough, the electrons (injected by source at source-channel junction) get accelerated by the high electric field near the drain-channel junction. Once the electrons acquire sufficient kinetic energy, they can generate new electron and hole pairs by impinging on the atoms as shown in figure 1.11. The newly generated electrons mostly traverse along the direction of the drain electric field and finally get collected by the drain. On the other hand, the holes travel toward the source and get accumulated where the hole potential energy is lowest. These 14 generated holes change the body potential of the transistor and the channel threshold voltage, which can be sensed by applying a small drain voltage and measuring the current. 0V 1V, biased Gate 2V, biased at in inversion oxide relatively high voltage Source N+ Drain N+ Box Figure 1.11 Impact ionization based programing method for 1-transistor capacitor-less DRAM The major drawback of the impact ionization method is the degradation of the gate oxide over time due to hot carrier injection (HCI). Due to high drain electric field, electrons can acquire very high energy and some of them might go towards the gate terminal rather than drain. If these electrons can reach the gate oxide, they might end up creating defects in the oxide and also at the semiconductor-oxide interface. These electrons are called lucky electrons – because only these electrons have enough energy to jump over the oxide potential barrier. Also the generated electrons and holes also can have enough energy to contribute to the gate oxide degradation, if they are generated near the inversion layer which is so close to the gate oxide – semiconductor interface. This is a serious problem for the cells because if the gate oxides in these cells degrade 15 over time, then the transistor itself might not work properly and the cell might not be able to endure the required lifetime. Thus the hot carrier injection presents a huge reliability challenge for the impact ionization based programing method. 1.4.2 Single Transistor BJT Latch-up In this method [13-14], the channel of the transistor is biased in accumulation at the start of the programing by applying a negative gate voltage (for N-channel transistor). Simultaneously a high positive voltage is applied to the drain terminal as shown in figure 1.12. Initially since the gate is biased in accumulation, only the leakage current flows from source-to-drain. However the drain field is high and these electrons start impact ionization at the drain end and generate new electron-hole pairs. The electrons get swept by the drain electric field into the drain contact, but the holes traverse to the opposite direction and accumulate near the source-body junction. This results in lowering the electron injection barrier at the source-end. As a result, the source starts to inject more electrons, which in turn generate more holes. Thus this is a positive feedback system. If we denote the impact ionization factor M as forward gain and source electron injection efficiency β as the feedback factor, then the latch-up condition satisfies when Mβ approaches 1. At the start of the programing, β is quite small, and thus Mβ is much less than 1. The time required for the transistor to go into latch-up mode depends on the transistor’s parameters and the operating voltages. As an example, if the gate oxide thickness is too small, then the gate will have a good control overall the transistor body, which will prevent the source to inject any electron in the channel. This will increase the latch-up time for the transistor. Similarly having a thicker body also helps in 16 reducing the latch-up time. The impact ionization factor can be enhanced by increasing the drain programing voltage, which will lead to a faster latch-up. -1V Gate 0V Accumulation layer High voltage n+ Source Drain Source n+ β pBody M n+ Drain BOX Positive feedback system Latch up condition: Mβ =1 Figure 1.12 Single transistor BJT latchup programing method for 1-transistor capacitorless DRAM TOx Gate oxide Source n+ TBody Drain n+ BOX Increase Hole storage area Higher TBody Reduce gate leakage Thicker Tox than logic (4-5nm) Bad electrostatics Higher –ve gate voltage (-2V) to reduce ILogic ‘0’ Bad sense margin (ILogic ‘1’ – ILogic ‘0’) Figure 1.13 Optimization strategy of the transistor for 1-transistor capacitor-less DRAM application. 17 Because of its effectiveness, we have used this single transistor latch-up as the programing mechanism throughout the rest of this dissertation. In this technique, the transistor is used mostly in a BJT mode with its base open, rather than as a MOSFET. For this reason, this programing method is also called the BJT latch-up method. Biasing the gate into accumulation helps the impact ionization to occur in sub-surface region, thus protecting the integrity of the gate oxide to some extent. As a result, the endurance and reliability of the 1T-DRAM improves when the BJT latch-up method is used over the pure impact ionization method of programing. Let us discuss the optimization of the transistor parameters (figure 1.13) from a memory cell point of view. Generally the logic transistor is designed to achieve a good a electrostatics – which in turn dictates the transistor off-current. Good electrostatics is achieved by having a thin (~1 nm) gate oxide and thin body thickness (~10nm). However this design strategy is not suitable from a 1T-DRAM point of view. In the last section, we discussed that to have a better body effect coefficient (defined by the sensitivity of the threshold voltage to the stored excess holes), the oxide thickness has to be higher. The logic transistor can allow gate leakage to some extent. But the gate leakage in DRAM has to be minimal to prevent the leakage of the charge stored in the transistor body (or in the capacitor for conventional 1T-1C DRAM). These criteria lead to the design constraint of a relatively thicker gate oxide. This constraint of thicker t Ox in the DRAM transistor is similar to the conventional DRAM technology as per the ITRS guidelines. Again in 1T-DRAM, the excess charge is stored inside the transistor body. Thus scaling of the body thickness also seriously impacts its charge storage capability. Hence the capacitor-less DRAM transistor should be optimized to have the 18 maximum body thickness possible. These design guidelines make the capacitor-less DRAM transistor susceptible to poor electrostatics. With these design guidelines, the transistor in 1T-DRAM technology shows a very poor subthreshold swing (~ 500mV/dec). Fortunately, the DRAM cell only conducts when read, write or erase operations are done on it. This is quite different from a digital circuit where the supply voltage VDD is always on and thus bad electrostatics in transistors might lead to constant large leakage current and huge standby power dissipation. However, the bad electrostatics in 1T-DRAM transistors might degrade the sense margin. The sense margin is defined as the read current difference between logic state ‘1’ and ‘0’. Since the logic ‘0’ read current is actually the off-state current of the transistor, the sense margin and retention time can drastically degrade if the device operating voltages are not properly chosen. In this dissertation, we have designed the transistors mostly to have a logic ‘0’ read current around 1µA/µm. With thicker tOx (~5nm) and TSi, this logic ‘0’ read current can only be achieved by using a high negative voltage to the gate (-2V) to turn the transistor off. Thicker tOx helps the gate oxide to withstand this high gate voltage. These design specifications also work in favor of the BJT latch-up programing method to achieve a low program time and to satisfy the ITRS criterion of program speed around 2-10ns. 1.4.3 Band-to-band Tunneling This method uses the so-called GIDL (gate-induced drain leakage) to inject holes into the transistor body [15]. A high positive voltage is applied to the drain and simultaneously a negative voltage is applied to the gate. This reduces the tunneling 19 distance at drain-channel p-n junction. As a result, the drain starts to inject holes into the transistor body. In this programing technique, no current flows from source-to-drain and the entire current flow is actually used to store holes inside the transistor body. Thus this is a lower power programing technique compared to the impact ionization or BJT latch-up. However, for the same voltage range, the programing speed is comparatively slower in the GIDL-based programing. The programing speed can be improved by boosting the drain and gate voltages, but that might lead to severe gate oxide reliability issues. Figure 1.14 Thyristor DRAM cell structure 1.4.4 Thyristor Based Programing In this case, the transistor structure is modified by adding another p-doped region to it. The final structure is a p-n-p-n device (shown in figure 1.14) – which works as a thyristor [16-17]. Instead of using impact ionization as a method of generating 20 holes, the added p-n junction is forward biased to inject holes into the n-p-n region of the device. The thyristor can be biased in a similar way to that of BJT latch-up technique to store the holes in a very short time. The thyristor has the advantage of achieving higher programing speed at an operating voltage lower than other programing techniques. It also gets rid of unreliable impact ionization and band-to-band tunneling which can degrade the gate oxide with cycling. However, the added p-type region occupies extra footprint for the memory cell. Since cell size is a big constraint for the DRAM cell, more research efforts are needed to fabricate the thyristor structure in a 6F2 space for a given technology. 1.5 Erasing of 1T-DRAM Cells In the previous section, we discussed about different methods to store excess holes inside the transistor body – which take the cell from logic state ‘0’ to ‘1’. To bring the cell back to logic state ‘0’, the excess holes need to be removed, which is called “erasing of the cell”. The simplest and most effective way to remove the holes is to forward bias the p-n junctions in the transistor so that the p-type region can inject all excess holes into the n-type region as forward bias current. In this technique, both the drain and source (n-type) are biased with negative voltage while a positive voltage is applied to the gate to transfer a positive bias to the transistor p-type body. This way, the excess holes get removed from the transistor body. 21 1.6 Reading of 1T-DRAM Cells Previously we mentioned that the state of a memory cell is sensed by applying a drain voltage and measuring the current. Because of the excess holes stored in the transistor body, the threshold voltage of the channel reduces in logic state ‘1’. This reduction of the threshold voltage depends on the amount of the excess holes stored in the transistor body and also on the transistor parameters. The drain read bias has to be low enough not to cause impact ionization. The reading of a1T-DRAM cell is different from the conventional 1T-1C cells in one aspect as explained below. In the conventional 1T-1C cells, the charge is stored in the capacitor in logic state ‘1’. To read the cell, the transistor is turned on by applying a positive gate voltage. If the capacitor is charged, then it transfers part of its charge to the bitline capacitance. The transferred charge increases the bitline voltage slightly which is read by the sense amplifier. Thus after one successful reading, the cell (which was in logic state ‘1’) loses parts of its charge. In other words, in this reading scheme, the same charge which define the logic state ‘1’ of the cell, are used to read the cell. Thus the reading operation destroys the state of the cell. For proper operation, the cell needs to be written again according to the data read from the cell. This writing operation consumes extra energy which increases the overall power dissipation for the DRAM cell. On the other hand, the excess holes stored in an N-channel 1T-DRAM cell do not take part in the reading operation. The excess holes only reduce the threshold voltage. The electron injection ability of the source is enhanced by this reduced threshold voltage, which translates to an increased read current. However, the excess 22 holes do not take part in the read current conduction, which keeps the density of the excess holes almost the same as before the read operation. As a result, the state of the cell is not destroyed. Thus the cell does not need to be programmed each time it is read. Also the cell can be read multiple times once it is programed. This multiple-read capability saves a lot of power for the DRAM cell and also helps its endurance by reducing the program cycle number. 1.7 Development in 1T-DRAM Cell The concept of capacitor-less DRAM is now well-known for a long time. In 1993 IEDM, Chenming Hu et al. from UC Berkeley published a paper [18] establishing the idea of storing charge inside a transistor. The capacitor-less DRAM also finds its mentioning in the following year’s IEDM in J. P. Collinge’s publication [19] describing the advancements in SOI technology. However the research in this field started to grow rapidly only after 2001 – when S. Okhonin et al. demonstrated [12, 20-21] a 4F2 cell on SOI substrate with 0.25 µm and 0.13 µm technologies. This was a tremendous success, as the cell size in the 1T-1C conventional DRAM was around 8F2 then – two times higher than that was achieved by S. Okhonin. The programing of the cell was achieved within 3 ns using the impact ionization scheme as discussed in section 1.4.1. The fabricated devices showed very little device variability and good endurance property. Interestingly, the devices showed a reduction of retention time with scaling of gate length, which is more relevant in today’s technology. The next big step was taken in 2002 when Toshiba fabricated [22 - 24] a 512 Kb memory chip with the capacitor-less DRAM cells using a 0.18 µm technology. The cell 23 sizes were still 7F2, however, a 4F2 cell could have also been realized using an aligned bitline and sourceline contacts to wordlines. The SOI device thickness for these cells was 150nm and the box thickness was 200 nm. 6 nm SiO2 was used as gate oxide. 1 s and 50 ms retention times were achieved at room temperature (30° C) and elevated temperature (85° C), respectively. However, it was predicted that using a thinner silicon device layer, the retention time can be nearly doubled. Though the concern over small retention time was expressed for fabricating larger memory array, the reduced process complexity and non-destructive readout of the capacitor-less DRAM were certainly proven. The claim of improved retention time with thinner silicon layer was proven later in 2006 by Toshiba in separate publications [25 – 26] where a 128 Mb 1T-DRAM chip was fabricated using 90nm process technology with 6nm TOx, 25 nm BOX and 145 nm gate length. The cell size attained an impressive 6.2F2 mark. Two different sets of cells with body thickness (TSi) of 150 nm and 55 nm were fabricated. The cells with 150 nm TSi showed a retention time of about 160 ms whereas the cells with 55 nm TSi had a retention time of around 250 ms. With the initial encouraging results proving the concept and prospects of 1T capacitor-less DRAM, research efforts poured in to improve the shortcomings of 1TDRAM. Double-gate SOI-based and FinFET based structure were proposed [27 - 29] to go away from channel doping in SOI-based devices. Intel came up with a novel independent double gate structure fabricated with 65 nm technology [30]. Transistors with gate length as small as 70nm were fabricated with a body thickness in the range of 24 30-60 nm. Excellent transistor characteristics such as 66 mV/dec subthreshold swing and 42 mV/V DIBL were obtained. Devices with 4 nm gate oxide showed a retention time of 100 ms. Lower well doping was suggested to improve the retention time performance further. The retention time degradation with scaling of the transistor dimensions was explicitly pointed out and reduced charge storage volume was stated as the main reason of the performance degradation. This claim was further supported by Prof. Alam’s group in Purdue University which showed the systematic degradation of charge storage capability with channel length scaling [31 - 32]. In 2004, a 75 nm gate length 1T memory cell was fabricated on 16 nm active SOI substrate by a liaison of ST, LETI and Philips semiconductors [33]. With 1.6 nm gate oxide and 145 nm BOX thickness and by application of a negative back gate bias, holes were successfully generated within 10 ns programing time and stored in these cells. These cells had a retention time of 100 ms at 25° C and 10 ms at 85° C which is about the same as the results published by Intel. The non-destructive read operation was also verified. Following their SOI-based 1T-DRAM cells, the ST-LETI liaison also developed a new bulk-Si substrate based 1T-DRAM cell architecture [34]. Although the cell size was around 10F2, this was an important step to integrate the 1T-DRAM technology with the logic CPU technology. For the embedded DRAM technology, the 10F2 cell size is still a ~2 to 3 times improvement from the prevalent one. Well-doping was used to confine generated excess holes in the channel. Using only one additional non-critical mask and 3 extra process steps, an 8 Mb 1T-DRAM chip was integrated successfully using a 0.13 µm technology. The cell transistors had gate lengths of about 0.35 µm and gate oxide thicknesses of about 6.5 nm. The static characteristics showed a presence of 25 the kink effect – which showed the initial sign of capability of charge storage. Assuming a sensing margin of 5 µA for state determination, a retention time of over 1 s at 25°C and about 100 ms at 85° C was obtained. Together with the non-destructive cell reading, this technology showed much promise as an alternative to conventional 1T-1C DRAM cell for future technology nodes. With the impressive results establishing the prospect of 1T-DRAM, efforts were spent to further scale down the cell size for bulk 1T-DRAM. Next year in 2005 [35 36], the ST-LETI liaison published another article with the news of integrating of 1TDRAM in 90nm technology node, having a cell gate length as low as 80nm. The developed process flow for these cells had the capability of improving the cost by more than 10% over the conventional 1T-1C cells. However with the gate length scaling, the retention times were degraded by almost one order. Retention times of 100ms and 10ms were obtained at 25° and 85° C, clearly showing the degradation of charge storage capability with scaling of transistor dimensions. Another innovative approach to integrate the 1T-DRAM technology on bulk silicon substrate was called “surrounding gate MOSFET with vertical channel” [37 39] - which is basically a vertical transistor working as a memory cell. Besides the advantage of integration on bulk substrate, this structure have true potential to implement a 4F2 cell. However the vertical transistor structure makes this cell interesting only for commodity DRAM application. Devices with 100 nm gate length were fabricated and a 4 ms of retention time was achieved. 26 Since SOI wafers are too costly and may not be as profitable for commodity DRAM application, Samsung came up with integrating 1T-DRAM on silicon-on-ONO (SOONO) layer [40]. In this process a SiGe-Si layer was grown on a bulk Si substrate by CVD and then the underlying SiGe layer was etched selectively. Finally the void created by etching of SiGe was filled up by silicon nitride and oxide. Thus this technique realizes an SOI-type substrate locally. The SOONO structure can be used to integrate high performance logic transistors, flash memory and 1T-DRAM cell all together. Using a 33.5 nm active device layer, 50nm buried insulator SOONO substrate, 1T-DRAM cells with 47 nm gate length were fabricated. The retention time performance was not too impressive. However proper programing, read and erase mechanisms were successfully carried out. Around this time, it became evident that the retention time would be a major problem for both SOI- and bulk-Si based 1T-DRAM cells, especially for smaller gate length transistors. Thus efforts were redirected to improve the retention time of the 1TDRAM cells. In 2007, S. Okhonin (with Innovative Silicon) came out with the second generation of zero capacitor DRAM (Z-RAM) cells [13 -14], which used the BJT-based single transistor latch-up programing for both writing and reading the cell. This new reading and writing method improved the retention time. 100 ms of retention time at 85° C was obtained in a cell with 290 nm gate length using this BJT-based read-write methods. The BJT-based read-write methods improved the cell retention time by a factor of about 25X, compared to the case where the cell was operated with impact ionization based programing. The retention time was reduced to about 30 ms at 85°C 27 when the gate length was scaled to 110 nm. With a 55 nm gate length FinFET transistor, the retention time further reduced to 1 ms at 125° C. In an attempt to increase the hole storage capability and the retention time of the cell, an inclusion of potential well for holes inside the channel was proposed by Ertosun et al. at Stanford [41 - 43]. Using SiGe-Si valence band offset, an alternative Si-SiGeSi body was proposed rather than Si only body. This is quite feasible to integrate with modern CMOS industry as the CVD growth of SiGe has already been perfected and has been introduced in source/drain junctions of a PMOS to provide compressive stress. Simulation results showed that using a 5nm thick Si0.5Ge0.5 potential well with total 60nm body thickness, the retention time can be improved by an order of magnitude at 85° C. Though this technique can improve the retention time to some extent, but the improvement factor is just not good enough for 1T-DRAM to replace the conventional 1T-1C cell. 1.8 Organization of Thesis In the previous section, we discussed how research efforts have been spent to develop the capacitor-less 1T-DRAM cell. It is quite clear that the basic operations such as program, erase, read are quite straightforward and well understood. However, the limited retention time is the fundamental barrier for 1T-DRAM cell, which prevents it from being adopted by modern semiconductor industry. From this viewpoint, the second chapter will investigate the reasons of this limited retention time in silicon 1T-DRAM and will propose a solution to solve this issue and also to improve the cell’s scalability. The proposed solution will be extensively studied through TCAD simulation. From 28 chapters three to five, we will attempt to realize our proposed solution and to judge its feasibility by proper characterization techniques. 1.9 References [1] S. Natarajan et al, “A 14nm Logic Technology Featuring 2nd-Generation FinFET Transistors, Air-Gapped Interconnects, Self-Aligned Double Patterning and a 0.0588 m2 SRAM Cell Size,” International IEEE Electron Device Meeting, 2014 [2] C-H. Lin et al, “High Performance 14nm SOI FinFET CMOS Technology with 0.0174μm2 embedded DRAM and 15 Levels of Cu Metallization,” International IEEE Electron Device Meeting, 2014. [3] International Technology Roadmap for Semiconductors, 2013 edition, available at www.itrs.net [4] K.V. Rao, M. Elahy, D.M. Bordelon, S.K. Banerjee, H.L. Tsai, W.F. Richardson, R.H. Womack, “Trench capacitor design issues in VLSI DRAM cells,” International IEEE Electron Devices Meeting, vol.32, pages 140-143, 1986. [5] Subramanian S. Iyer, “The Evolution of embedded Memory in High Performance Systems - A case of Orthogonal Scaling,” presented at IEEE SOI-3D-Subthreshold (s3s) conference, 2013. [6] Takashi Ohsawa and Takeshi Hamamoto, “A Novel Capacitor-less DRAM Cell: FLOATING BODY CELL,” version date 20111205, pages 6-22. [7] J.Y. Kim et al, “The breakthrough in data retention time of DRAM using RecessChannel-Array Transistor (RCAT) for 88 nm feature size and beyond,” Symposium on VLSI Technology, pages 11-12, 2003. [8] M. Kito et al, "Vertex channel array transistor (VCAT) featuring sub-60nm high performance and highly manufacturable trench capacitor DRAM," Symposium on VLSI Technology, pages 32-33, 2005. [9] S. W. Park, “Prospect for New Memory Technology,” presented at Flash Memory summit 2012, available at http://regmedia.co.uk/2012/10/11/park_nand_trap_presentation.pdf [10] “HyperCloud HCDIMM: Scaling the High Density Memory Cliff”, available at http://www.netlist.com/media/blog/hypercloud-memory-scaling-the-high-densitymemory-cliff 29 [11] A. Siligaris, G. Dambrine, D. Schreurs and F. Danneville, "130-nm partially depleted SOI MOSFET nonlinear model including the kink effect for linearity properties investigation," IEEE Transactions on Electron Devices, vol.52, no.12, pages 2809 - 2812, 2005 [12] S. Okhonin, M. Nagoga, J.-M. Sallese and P. Fazan, "A SOI capacitor-less 1TDRAM concept," IEEE International SOI Conference, pages 153 - 154, 2001 [13] S. Okhonin, M. Nagoga, E. Carman, R. Beffa and E. Faraoni, "New Generation of Z-RAM," IEEE International Electron Devices Meeting (IEDM), pages 925 - 928, 2007 [14] S. Okhonin, M. Nagoga, C.-W. Lee, J-P Colinge, A. Afzalian, R. Yan, N. D. Akhavan, W. Xiong, V. Sverdlov, S. Selberherr and C. Mazure, "Ultra-scaled Z-RAM cell," IEEE International SOI Conference, pages 157 - 158, 2008 [15] E. Yoshida and T. Tanaka, "A capacitorless 1T-DRAM technology using gateinduced drain-leakage (GIDL) current for low-power and high-speed embedded memory," IEEE Transactions on Electron Devices, vol.53, no.4, pages 692 - 697, 2006 [16] H-J. Cho, F. Nemati, R. Roy, R. Gupta, K. Yang, M. Ershov, S. Banna, M. Tarabbia, C. Sailing, D. Hayes, A. Mittal, S. Robins, “A novel capacitor-less DRAM cell using thin capacitively-coupled thyristor (TCCT)," IEEE International Electron Devices Meeting, pages 311 - 314, 2005 [17] K.J. Yang, R.N. Gupta, S. Banna, F. Nemati, H.-J. Cho, M. Ershov, M. Tarabbia, D. Hayes, and S.T. Robins, “Optimization of Nanoscale Thyristors on SOI for HighPerformance High Density Memories”, IEEE International SOI Conference, pages 113 – 114, 2006 [18] H-j. Wann and Chenming Hu “A Capacitorless DRAM Cell on SO1 Substrate”, IEEE International Electron Devices Meeting, pages 635-638, 1993 [19] Jean-Pierre Colinge, “Recent Advances in SOI Technology”, IEEE International Electron Devices Meeting, pages 817-820, 1994 [20] S. Okhonin, M. Nagoga, J. M. Sallese, and P. Fazan, “A Capacitor-Less 1T-DRAM Cell”, IEEE Electron Device Letters, vol. 23, no. 2, 85 – 87, 2002 [21] P. C. Fazan, S. Okhonin, M. Nagoga and Jean-Michel Sallese “A Simple 1Transistor Capacitor-Less Memory Cell for High Performance Embedded DRAMS”, IEEE Custom Integrated Circuits Conference, pages 99-102, 2002 [22] T. Ohsawa, K. Fujita, T. Higashi, Y. Iwata, T. Kajiyama, Y. Asao and K. Sunouchi, “Memory Design Using a One-Transistor Gain Cell on SOI”, IEEE Journal of Solid State Circuits, vol. 37, no. 11, pages 1510-1522, 2002 [23] T. Ohsawa, T. Higashi, K. Fujita, T. Ikehashi, T. Kajiyama, Y. Fukuzumi, Tomoaki Shino, H. Yamada, H. Nakajima, Y. Minami, T. Yamada, K. Inoh and T. Hamamoto, 30 “A Memory Using One-Transistor Gain Cell on SOI (FBC) with Performance Suitable for Embedded DRAM’S”, Symposium on VLSI Circuits, pages 93 – 96, 2003 [24] K. Inoh, T. Shino, H. Yamada, H. Nakajima, Y. Minami, T. Yamada, T. Ohsawa, T. Higashit, K. Fujila, T. Ikehashi, T. Kajiyama, Y. Fukuzumi, T. Hamamoto and H. Ishiuchi, “FBC (Floating Body Cell) for Embedded DRAM on SOI”, Symposium on VLSl Technology, pages 63-64, 2003 [25] A. Nitayama, T. Ohsawa and T. Hamamoto, “Overview and Future Challenge of Floating Body Cell (FBC) Technology for Embedded Applications”, International Symposium on VLSI Technology, Systems, and Applications, pages 1-3, 2006 [26] T. Hamamoto, Y. Minami, T. Shino, N. Kusunoki, H. Nakajima, M. Morikado, T. Yamada, K. Inoh, A. Sakamoto, T. Higashi, K. Fujita, K. Hatsuda, T. Ohsawa, and A. Nitayama, “A Floating-Body Cell Fully Compatible With 90-nm CMOS Technology Node for a 128-Mb SOI DRAM and Its Scalability”, IEEE Transactions on Electron Devices, vol. 54, no. 3, pages 563 - 571, 2007 [27] T. Tanaka, E. Yoshida, and T. Miyashita, “Scalability Study on a Capacitorless 1TDRAM: From Single-gate PD-SO1 to Double-gate FinDRAM”, IEEE International Electron Devices Meeting, pages 919 - 922, 2004 [28] C. Kuo, T-J. King, and C. Hu, “A Capacitorless Double-Gate DRAM Cell”, IEEE Electron Device Letters, vol 23, no 6, pages 345-347, 2002 [29] C. Kuo, T-J. King, and C. Hu,” A Capacitorless Double Gate DRAM Technology for Sub-100-nm Embedded and Stand-Alone Memory Applications” IEEE Transactions on Electron Devices, vol. 50, no. 12, pages 2408-2416, 2003 [30] I. Ban, U. E. Avci, U. Shah, C. E. Barns, D. L. Kencke and P. Chang, “Floating Body Cell with Independently-Controlled Double Gates for High Density Memory”, IEEE International Electron Devices Meeting, pages 1-4, 2006 [31] N.Z. Butt, M. A. Alam, “Scaling Limits of Capacitorless”, International Conference on Simulation of Semiconductor Processes and Devices, pages 302 – 305, 2006 [32] N.Z. Butt, M. A. Alam, “Scaling Limits of Double-Gate and Surround-Gate ZRAM Cells”, IEEE Transactions on Electron Devices, vol. 54, no. 9, pages 2255-2262, 2007 [33] R. Ranica, A. Villaret, C. F. Beranger, P. Malingel, P. Mazoyerl, P. Masson, D. Delille, C. Charbuillet , P. Candelierl and T. Skotnicki, “A capacitor-less DRAM cell on 75nm gate length, 16nm thin Fully Depleted SOI device for high density embedded memories”, IEEE International Electron Devices Meeting, pages 277 - 280, 2004 [34] R. Ranica, A. Villaret, P. Malinge. P. Mazoyer, D. Lenoble, P. Candelier, F. Jacquet, P. Masson, R. Bouchakour, R. Foumel, J. P. Schoellkopf and T. Skotnicki, “A One Transistor Cell on Bulk Substrate (1T-Bulk) for Low-Cost and High Density eDRAM”, Symposium On VLSl Technology, pages 128-129, 2004 31 [35] R. Ranica, A. Villaret, P. Malinge, G. Gasiot, P. Mazoyer, P. Roche, P. Candelier, F. Jacquet, P. Masson, R. Bouchakour, R. Fournel, J. P. Schoellkopf, T. Skotnicki, “Scaled 1T-Bulk devices built with CMOS 90nm technology for low-cost eDRAM applications”, Symposium On VLSl Technology, pages 38 - 39, 2005 [36] P. Malinge, P. Candelier, F. Jacquet, S. Martin, R. Ranica, A. Villaret, P. Mazoyer, R. Fournel and B. Allard, “An 8Mbit DRAM Design Using a 1T Bulk Cell”, Symposium on VLSI Circuits, pages 358 – 361, 2005 [37] H. Jeong, Y. S. Lee, S. Kang, I. H. Park, W. Y. Choi, H. Shin, J. D. Lee and B-G. Park, “Capacitorless DRAM Cell with Highly Scalable Surrounding Gate Structure”, International Conference on Solid State Devices and Materials, pages 574 – 575, 2006 [38] H. Jeong, K-W. Song, I. H. Park, T-H. Kim, Y. S. Lee, S-G Kim, J. Seo, K. Cho, K. Lee, H. Shin, J. D. Lee, and B-G. Park, “A New Capacitorless 1T DRAM Cell: Surrounding Gate MOSFET With Vertical Channel (SGVC Cell)”, IEEE Transactions on Nanotechnology, vol 6, no 3, pages 352 – 357, 2007 [39] H. Jeong, Y. S. LEE, S. Kang, I. H. Park, W. Y. Choi, H. Shin, J. D. Lee, and B-G Park, “Capacitorless Dynamic Random Access Memory Cell with Highly Scalable Surrounding Gate Structure”, Japanese Journal of Applied Physics, vol. 46, no. 4B, pages 2143–2147, 2007 [40] E. J. Yun, H. J. Song, S. I. Hong, S. H. Kim, Y. L. Choi, H. J. Bae, N. Y. Kim, C. W. Oh, D-W. Kim and D. Park, “Analysis of Sensing margin in Silicon-On-ONO (SOONO) Device for the Capacitor-less RAM Applications”, IEEE International SOI Conference, pages 103 – 104, 2007 [41] M. G. Ertosun, P. Kapur, and K. C. Saraswat, “A Highly Scalable Capacitorless Double Gate Quantum Well Single Transistor DRAM: 1T-QW DRAM”, IEEE Electron Device Letters, vol 29, no. 12, pages 1405 – 1407, 2008. [42] M. G. Ertosun, and K. C. Saraswat, “Characteristics of the Capacitorless Double Gate Quantum Well Single Transistor DRAM”, International Conference on Simulation of Semiconductor Processes and Devices, pages 1 – 4, 2009 [43] M. G. Ertosun, and K. C. Saraswat, “Investigation of Capacitorless Double-Gate Single-Transistor DRAM: With and Without Quantum Well”, IEEE Transactions on Electron Devices, vol. 57, no. 3, pages 608 - 613, 2010 32 Chapter 2 III-V Material Integration in 1Transistor Capacitor-less DRAM In this chapter, we will study the reasons for limited retention time in silicon based 1-transistor capacitor-less DRAMs. To alleviate the shortcomings of silicon based 1-transistor DRAMs, we will propose to incorporate a different material in the transistor. We will also carry out TCAD simulations to study the performance improvement of the modified transistor and its scaling characteristics. Finally we will discuss the possible technological challenges in realizing this idea which will form the backbone for the rest of this work. 2.1 Charge storage in a silicon transistor In the last chapter, we mentioned that the SOI-based n-channel transistor stores holes which reduces the threshold voltage of the transistor. Figure 2.1 shows the basic transistor structure and hole storage area. The holes cannot leak out to the silicon handle substrate because of the band-offset presented by the oxide in the buried oxide layer. Generally the transistor is isolated by shallow trench isolation (STI), so the holes cannot leak out laterally. For similar reasons, the holes have very low probability of going through the gate oxide, especially if designed with a thick gate oxide. Thus the only way for the holes to leak is through the source and drain terminals. 33 Figure 2.1 SOI-based 1-transistor capacitor-less DRAM cell. The charge can be stored in the channel region Figure 2.2 Band diagram of the n-channel 1T-DRAM cell from source to drain through channel showing the potential well to store holes To investigate this issue, the band diagram of the transistor from its source to drain through the channel is plotted in figure 2.2. A potential well for storing the holes, formed by the source-channel and drain-channel p-n junctions, can be easily identified. The potential barriers of this potential well are the p-n junction barriers at the source- 34 channel and drain-channel junctions. If we assume that the drain and source are doped at ND = 1020 cm-3 n-type and the channel is left almost undoped (NA = 1015 cm-3 p-type), then by Boltzmann statistics, the p-n junction barrier height Vbi at room temperature is given by Vbi = k B T ln NA ND n2i ≈ 0.9V which is the major limitation for storing enough holes for sufficient time. Unfortunately since this depends on the intrinsic parameters of silicon and there is not enough margin to play with doping, there is not much hope of increasing this barrier height. The channel doping cannot be increased to a much higher value because of enhanced recombination, degraded mobility and enhanced gate-induced-drain-leakage which will finally affect the charge storage and the cell’s retention time. The low barrier heights at the source-channel and drain-channel junctions do not only prevent the storage of enough holes, but the stored holes can also leak away very easily. The holes can jump over the barrier to the source and drain regions during their random motion, if they have enough thermal energy. Since the source and drain regions are n-type doped, the holes become minority carriers there and recombine very quickly. As a result, the density of excess holes in the transistor body reduces greatly over time. The other method by which the stored excess holes can disappear from the transistor body is through excess carrier recombination. In silicon, recombination is normally dominated by Shockley-Read-Hall (SRH) or trap-assisted recombination. The logic ‘1’ state in which excess holes are stored inside the body of a transistor is a non- 35 equilibrium state. This results in lowering the equilibrium electron injection barrier at the source-channel and drain-channel junction. As a result, the n-type source and drain inject excess electrons into the transistor body. These injected excess electrons recombine with the already stored excess holes through SRH recombination. This also results in a gradual decrease in the density of excess holes stored in the transistor body. Because of the over-the-barrier leakage and excess carrier recombination mechanisms, the stored excess holes disappear too soon from a silicon transistor body. The density of excess holes that can be stored in the transistor body is also limited. Thus to meet the retention time specifications from ITRS and industry standard point of view, the only option is to increase the number of holes in the first place. However, as we discussed earlier, the low barrier heights at source-channel and drain-channel junctions prevent us from doing so. This means, that the only way to store more holes inside the transistor body is to increase the barrier heights for the holes at the source-channel and drain-channel junctions. Since we cannot play with the doping of source, drain (because of solid solubility limits) and channel (because of increased recombination and GIDL) in a silicon-based transistor, it is difficult to achieve a major boost in the barrier heights with silicon. However the barrier heights can be changed by changing the material of the channel region or source-drain regions, such that the alternative material has a valence band offset to silicon. Also since we are proposing to integrate the new material selectively on silicon, this material should have a good lattice constant matching to silicon. 36 Figure 2.3 Lattice constant versus conduction and valence band alignment plot for the popular semiconductor materials Let us discuss the implications of changing the material in the channel region first. Different materials such as germanium and III-V semiconductors have already been proposed for the channel region because of their high mobility compared to silicon. Some of these materials have a valence band offset to silicon also, which will result in an increase in the hole barrier height, if a p-n junction is formed with silicon. Unfortunately none of these qualify for 1T-DRAM applications. Firstly, most of these materials have much lower bandgaps compared to silicon. This increases the recombination rate due to higher capture and emission rate of both type of carriers. Thus the advantage of the valence band offset is counteracted largely by the enhanced recombination. Secondly, the lattice constants of all these materials are markedly different from silicon. This means that if a heterojunction is fabricated between silicon 37 and these materials, the interface will be too defective. This will lead to leakage of holes due to trap assisted SRH recombination. Finally, the gate dielectrics generally formed on these materials are of much worse quality than those formed on silicon. These inferior gate dielectrics and their interfaces can lead to increased surface recombination. This will increase the disappearance rate of excess holes stored inside the transistor body. Figure 2.4 Bandgap and conduction and valence band lineup for gallium phosphide and silicon. The valence band offset is about 1eV and the conduction band offset is about 0.1eV [1]. Figure 2.5 Proposed SOI-based 1-transistor DRAM structure with raised gallium phosphide source and drain 38 Thus it is clear that because of lower carrier recombination rates and a better gate oxide interface, silicon is probably the best channel material for 1T-DRAM applications. Thus the only option to achieve a higher barrier height for hole storage is to change the material in the source and drain. From the lattice constants versus band alignments diagram in figure 2.3, the only materials that have lattice constants close to silicon are gallium phosphide (GaP) and aluminum phosphide (AlP). GaP has a lattice constant mismatch of only 0.37% to silicon at room temperature. As a result, it might be possible to grow thin GaP films on silicon at the source and drain regions without any defects at the interface. Fortunately, GaP also has a good valence band offset to silicon, about 1eV [1], as shown in figure 2.4. The other option is AlP which has a valence band offset of about 1.5eV. However the high reactivity of Al based compounds to oxygen might be a problem in achieving good AlP crystal quality along with a defectfree AlP-Si interface. Also higher band-offset will lead to a significantly higher erase time once the cell is programmed, as the potential well to store the holes is much deeper. Thus we conclude that GaP is the ideal material for source and drain in 1-transistor DRAM. The proposed raised GaP source-drain SOI based transistor structure is shown in figure 2.5. In this discussion, we attempted to keep silicon either at the source-drain or at the channel region of the transistor with the hope that the majority of the processes to fabricate this transistor can be integrated with dominant silicon logic on silicon wafers. This can cut the initial inertia and introduction cost of this newly proposed technology, which is critical especially for DRAM industry. However, if this constraint does not exist for some applications, such as special military, space or some other niche 39 applications, different III-V materials both at source-drain and at channel can be chosen to satisfy the lattice constant and band-offset constraints. Table 2.1 shows the possible material combinations that can be used in different regions of the transistor. Table 2.1 List of various combinations of source-drain and channel materials satisfying the lattice constant and band offset criteria for 1T-DRAM application 2.2 SOI-based GaP Source-Drain Transistor Figure 2.5 shows the proposed GaP source-drain transistor (GaP-SD) on an SOI substrate with a raised source-drain architecture. In this section, we would like to evaluate and compare the performance of this transistor structure with a similar transistor structure with silicon source-drain using Sentaurus TCAD simulation tool [2]. To understand the potential and limitation of this structure, we assume that the GaPSi interface is perfect, that is, there are no defects at the GaP-Si interface. Recombination at the Si-SiO2 surface is also ignored in both Si-SD and GaP-SD transistor. The band-to-band tunneling phenomenon is also neglected. SRH and Auger recombination are assumed to be the main charge loss mechanisms. The electric field and doping dependence of these models are also included. The doping in all regions are assumed to be abrupt. Table 2.2 shows the parameters used for the transistor. The 40 transistor body thickness is optimized to achieve the maximum retention time. At a lower body thickness, the transistor hole storage capability becomes worse, which leads to a lower retention time for the memory cell. As the body thickness is increased, the hole storage capability and the retention time for the memory cell increases. However if the body thickness is increased too much, the electrostatics of the transistor degrades. This results in a higher off-current which is also the logic state ‘0’ current of the transistor. This leads to degradation of sensing margin (defined as the difference of logic state ‘1’ and ‘0’ current) and retention time. Thus the body thickness of the transistor cannot be increased indefinitely. For a 30nm channel length transistor, the thickness of the transistor body is optimized at 45nm. The gate oxide thickness is chosen to be 5nm, as specified by ITRS for DRAM access transistors. The thickness of the BOX is 25nm. The gate workfunction is chosen to have a read current (at VDS=1.0V, VGS=-2.0V) of ~1.5µA/µm at 85°C for both silicon-SD and GaP-SD transistors. Figure 2.6 shows the transfer characteristics of both the transistors at VDS=1.0V and VDS=2.0V at room temperature. Both devices show very similar transfer characteristics as the electrostatics in both devices are same. Table 2.2 Various parameters used for GaP-SD and Si-SD SOI device design 41 -3 Drain Current (A/m) 10 10-4 LG=30nm TSi=45nm TOX=5nm VDS=1.0V 10-5 GaP-SD Si-SD 10-6 10-7-2 Temperature 25C 85C -1 0 1 Gate Voltage (V) Figure 2.6 Transfer characteristics for GaP source-drain and silicon source-drain transistors for the device parameters mentioned in table 2.2 (a) (b) Figure 2.7 (a) Single transistor latch-up programing for GaP-SD and Si-SD transistors showing the threshold voltage shift obtained from each device as calculated from the (b) transfer characteristics at the same 1.5V drain voltage 42 (a) (b) Figure 2.8 Distribution of holes after programing in SOI-based (a) GaP-SD transistor (b) Si-SD transistor. The transistors are biased at VDS = 1.5 V, VGS = -2 V Figure 2.7 shows the simulation results of BJT single transistor latch-up based programming characteristics of both silicon-SD and GaP-SD based devices at room temperature where a programing condition of VDS = 1.5V, VGS = -2.0V is used. Initially the transistors are biased at these voltages and the evolution of drain currents with time are plotted with the drain and gate bias held constant. Though both devices have same current level at the starting of the programing, the final current after the completion of programing is much higher for GaP-SD device. Thus Si-SD device shows a threshold voltage shift of 0.7 V (as calculated from figure 2.7(b)), whereas the GaP-SD device shows a threshold voltage shift of 1.8V. Since the shift in the threshold voltage is proportional to the amount of the holes stored in the transistor body, it can be concluded that the GaP-SD transistor can store more holes because of the valence band offset at GaP-Si interface at source-channel and drain-channel junctions. Figure 2.8 shows the 43 hole distribution after completion of the programing. Indeed, the stored hole density is more than 2 orders of magnitude higher in GaP-SD device (6×1018 cm-3) than Si-SD device (4×1016 cm-3) as can be seen from the 1-D plot in figure 2.9. (a) (b) Figure 2.9 Comparison of hole density after programing in GaP-SD and Si-SD transistors from the source-body to box-body interface as shown in (a) Figure 2.10 (a) plots the timing diagram of applied voltage and measured current during program and read operations of Si-SD and GaP-SD cells. To complete the programing of the cell within 10ns (as specified in ITRS for embedded DRAM [3]), the drain programing voltage is increased to 2V. For GaP-SD device, the read current before programing (i.e., in logic state ‘0’) is 0.4µA/µm, whereas right after programing (i.e., in logic state ‘1’) the read current is 800µA/µm. This shows the effectiveness of the programing method and also the charge storing capability of GaP-SD cell. For Si-SD cell, the read current in logic state ‘0’ is very similar to the GaP-SD one. But even after 44 programing, the read current is quite small for Si-SD cell Due to this, Si-SD cell does not meet the retention time specification at these small device dimensions. (a) (b) Figure 2.10 (a) Timing diagram of current and voltage for read, program and read operations at 25°C showing the read-current difference after programing in GaP-SD device and Si-SD devices. (b) Evolution of read-current over time after programing showing a retention time of at least 1 second at 85°C for GaP-SD device Figure 2.10(b) plots the variation of read currents at different instants after programing for the GaP-SD cell operating at room (25ºC) and elevated temperatures (85ºC). Because of SRH recombination and limited over-the-barrier leakage, the amount of holes initially stored in the transistor body start to disappear. The high valence band offset at GaP-Si interface increases the hole barrier height at the source-channel and drain-channel junctions and limits the over-the-barrier hole leakage. 45 Thus the SRH recombination method becomes the dominated mechanism for hole leakage. Because of the reduced electron injection height at source-channel and drainchannel junctions, the source and drain starts to inject electron in the channel. Based on their lifetimes, these injected electrons recombine with the excess holes and reduce their density. Sentaurus models the electron lifetime in silicon τ using the following equation: 𝜏 = 𝜏𝑑𝑜𝑝 𝑓(𝑇) 1 + 𝑔𝑐 (𝐹) Where 𝜏𝑑𝑜𝑝 depends on the doping density of silicon and given as: 𝜏𝑑𝑜𝑝 = 𝜏𝑚𝑖𝑛 + 𝜏𝑚𝑎𝑥 − 𝜏𝑚𝑖𝑛 𝑁 +𝑁 𝛾 (1 + 𝐴𝑁 𝐷 ) 𝑟𝑒𝑓 𝜏𝑚𝑎𝑥 , 𝜏𝑚𝑖𝑛 and 𝑁𝑟𝑒𝑓 are assumed to be 10µs, 0 and 1016 cm-3. The temperature dependence of τ is modeled as, 𝑇 𝑇𝛼 𝑓(𝑇) = ( ) 300 with 𝑇𝛼 = −1.5. Since we have assumed ideal GaP-Si and Si-SiO2 interface without any traps, the electric field dependent term 1 + 𝑔𝑐 (𝐹) is taken to be unity. Due to the disappearance of excess holes from the channel, the threshold voltage shift and read current decreases as time progresses. However at 85ºC even after 1s, the read current is still much larger than the ‘0’ state read current and thus the logic state ‘1’ can be easily sensed and distinguished from logic state ‘0’. Thus the GaP-SD cell shows at least 1 second of retention time at 85ºC for these device dimensions, comfortably meeting the ITRS retention time specification of 64ms [3]. 46 2.3 Bulk-Si Substrate Based GaP Source-Drain Transistor In the previous section, we discussed about the SOI-based DRAM. This device structure is suitable for embedded DRAM applications in SOI-based logic technologies perfected by companies such as IBM and ST Microelectronics. However, a bigger part of today’s logic technology is based on bulk silicon substrate (such as Intel’s processors). The SOI-based 1T-DRAM solution is hard to implement on bulk silicon substrate. Figure 2.11 Proposed bulk-Si substrate based 1-transistor DRAM structure with raised gallium phosphide source and drain and a buried GaP layer For bulk Si substrate-based logic applications, a new structure is proposed as shown in figure 2.11. Instead of using the barrier offset of the buried oxide layer, a buried GaP layer can be used. This structure can be fabricated by using a GaPSi-GaP layers growth. After this growth, the rest of the transistor fabrication – such as 47 STI isolation, gate formation and source-drain contact formation steps are similar to the one on SOI substrate. Here the diffusion of excess holes from the transistor body into the silicon substrate is prevented by the buried GaP layer by using its valence band offset to silicon. In other words, the usefulness of GaP is no longer limited to source and drain region, and it can be extended to minimize the starting substrate cost also. Figure 2.12 Transfer characteristics of a 54nm gate length SOI-based GaP-SD cell and an optimized bulk-Si substrate based GaP-SD cell with a buried GaP layer 48 Figure 2.13 Comparison of hole density in the SOI-based cell and bulk-Si based cell after programing. The hole density is plotted at the middle of the device from the gate oxide interface to buried GaP/oxide interface as shown by the arrow in the structure To compare the performance of the SOI-based GaP-SD and bulk-Si based GaPSD cell, first the body thicknesses of these devices were optimized to achieve a maximum retention time for cells with 54nm gate length. The optimized devices have a logic ‘0’ state read current of ~1µA/µm at 85°C for a read bias of VDS=0.5V and VGS=2V. Figure 2.12 shows the transfer characteristics of both transistors. The optimized body thickness for the SOI-based GaP-SD device is 55nm. 5nm thick SiO2 is used as gate dielectric. The doping of the buried GaP layer in bulk-Si based GaP-SD device is optimized to achieve similar transfer characteristics to the SOI-based device. With a lower buried GaP layer doping, the interaction of the electric field from the drain to the source increases – thus increasing the off-current compared to an SOI-based device. If the buried GaP layer doping is increased too much, then the depletion width between 49 buried GaP (n-type) and Si channel layer (p-type) will be more into silicon and this will limit the width of the charge storage region. During this optimization, the thickness of buried GaP doping is kept fixed at 40nm, which is below the critical thickness of GaP for this GaP-on-Si system. For the optimized device, the GaP doping concentration is 3×1016 cm-3. After proper optimization, both devices have a similar on- and off-current and subthreshold swing. As before, because of the higher body thickness and higher gate oxide thickness chosen to enhance the hole storage capability, the subthreshold swings in these transistors are worse when compared to a conventional logic transistor. The subthreshold swings for both SOI and bulk-Si substrate based devices are about 500mV/dec. The single transistor latch-up based programing is carried out at VDS=1.75V and VGS=-1V for 10ns for both the devices. Figure 2.13 shows the hole density of both devices after completion of the programing. It shows that if the bulk-Si substrate based GaP-SD device is optimized properly, its hole storage capability would be very similar to the SOI-based device. The retention time in a GaP-SD based 1T-DRAM is a function of the amount of the holes stored inside the transistor body and the recombination rate. The amount of the holes stored is mainly governed by the band-offset between GaP and Si. Thus both the devices behave quite similarly in this aspect. The recombination rate of holes depends on the channel material and mainly on the doping density of the channel. Again both devices have silicon as the channel material. Also similar transfer characteristics ensure that the electrostatics in the both devices are also pretty much the same. These lead to similar hole confinement ability and electric field distribution in both devices. Thus it is expected that both devices will have comparable retention time. 50 Figure 2.14 shows the evolution of the threshold voltage shits with time for both devices at room temperature (T=25°C) and elevated temperature (T=85°C). Initially right after programming, a lot of holes are stored in the transistor body, which results in a high threshold voltage shift. However, as the holes start to leak away or start to recombine, the threshold voltage shift reduces over time. If we assume that a threshold voltage shift of 50mV is good enough for the sensing amplifier to differentiate between logic state ‘1’ and ‘0’, then both devices show a similar 1 second of retention time at elevated temperature for a 55nm gate length transistor. Thus it is shown that the bulk-Si based GaP-SD cell also has similar capability as of the SOI-based GaP-SD 1T-DRAM cell to improve the retention time over a silicon only 1T-DRAM cell. Figure 2.14 Evolution of threshold voltage shift with time in (a) SOI-based GaP-SD memory cell (b) bulk-Si substrate based GaP-SD memory cell 51 To compare the scalability of the bulk-Si based GaP-SD device with the SOIbased one, transistors with 20nm gate length are designed for both structures. The transistor body thickness is again optimized to achieve the maximum retention time possible with these structures. The transistor body thickness is scaled to 25nm and the gate oxide thickness is also slightly reduced (4nm) to achieve a similar off-current. For the bulk-Si based GaP-SD device, the silicon doping beneath the buried GaP layer is also increased to 1017 cm-3 to achieve similar electrostatics as of the SOI-based device. However the thickness of buried GaP layer is still kept fixed at 40nm. The read drain bias is also scaled to 0.4 V. The device parameters are mentioned in table 2.3. Figure 2.15 shows the evolution of threshold voltage shift with time for both devices. Assuming a 50 mV threshold voltage shift is required to differentiate between logic state ‘1’ and ‘0’, both devices show a retention time of about 0.5 second at 85°C. This confirms that the bulk-Si based GaP-SD cell has scalability similar to that of the SOI-based GaP-SD cell. Table 2.3 Various parameters for both SOI-based and bulk-Si substrate based GaP source-drain 1-transistor capacitor-less DRAM Cell 52 Figure 2.15 Transfer characteristics of 20nm gate length SOI-based GaP-SD cell and an optimized bulk-Si substrate based GaP-SD cell with a buried GaP layer 2.4 Vertical GaP Source Drain 1-Transistor DRAM Cell In the previous two sections, we discussed different transistor based device structures for embedded DRAM applications. However, for standalone commodity DRAM applications, the size of the basic cell is a big constraint. For modern DRAM industry, the cell size is 6F2 [3], where F is half the distance between two metal lines. Looking into the future, a planer transistor may not be the ideal cell for commodity DRAM applications. Since the footprint of the cell is of major importance here, we 53 propose to use a vertical 1-transistor cell for commodity DRAM. The proposed cell structure is shown in figure 2.16(a). This cell again uses GaP at source and drain and silicon in its channel. The cell can be optimized having a single gate all around its channel – thus realizing a 4F2 cell. n-GaP (a) (b) Figure 2.16 Proposed GaP source-drain vertical DRAM cell for commodity DRAM applications – (a) the 3D structure (b) 2D device used for TCAD simulation Table 2.4 Device parameters for vertical GaP source-drain memory cell for 55nm gate length device for commodity DRAM application 54 Figure 2.17 Single transistor latch-up programing characteristics for vertical GaP-SD and Si-SD transistors optimized for commodity DRAM application The 2D structure shown in figure 2.16(b) is used for TCAD simulations and compared with a similar silicon source-drain based structure. The device parameters used in the simulations are shown in table 2.4. The transistor body thickness defines the cell footprint and is the main device parameter here. The devices with TSi = 54nm are optimized to have a logic state ‘0’ current of 2µA/µm at elevated (85°C) temperature and at read bias of VDS=1.2V, VGS=-2.0V. The minimum sense margin requirement to distinguish between logic state ‘1’ and ‘0’ is also relaxed to 10µA to facilitate the speed and design of the sensing amplifier. From the transistors’ transfer characteristics, this minimum sensing margin translates to a threshold voltage shift of 275mV. The single transistor latch-up based programming characteristics for both devices are shown in figure 2.17. Both devices show similar latch-up times which are determined by the 55 initial electron injection efficiency (β), impact ionization factor (M) and device electrostatics. However, the threshold voltage shift for the GaP-SD cell (ΔVT = 1.45V) is much higher than the Si-SD cell (ΔVT = 0.76V), thanks to the valence band offset at the GaP-Si interface. This again shows the effectiveness of GaP-SD device over Si-SD device in storing sufficient number of holes. (a) (b) Figure 2.18 Evolution of read-current and threshold voltage shift at room temperature in GaP-SD and Si-SD vertical memory cells Figure 2.18 (a) and (b) show the read current and threshold voltage shift at different time instants after programing for both GaP-SD and Si-SD cell at room temperature. Because of recombination and leakage of holes, both the threshold voltage shift and read current gradually reduce over time. However assuming a 10 µA sensing current margin is required to distinguish between logic state ‘1’ and ‘0’, the GaP-SD device shows a retention time of 10 s, compared to 100 ms in Si-SD cell. Thus the 56 valence band offset at GaP-Si interface has the capability of improving the retention time by 100X. Figure 2.19 (a) and (b) show the read current and threshold voltage shift evolution at elevated (85°C) temperature for both devices. Because of enhanced excess carrier recombination and enhanced over-the-barrier leakage, the retention time in SiSD cell reduces by 10X from its room temperature value. However in GaP-SD cell, the over-the-barrier leakage is minimized due to the valence band offset, and thus the retention time degrades only by a factor of 6.5X. The GaP-SD cell shows a retention time of 1.5 s at elevated (85°C) temperature, compared to only 10ms in Si-SD cell. The retention time at higher temperature is more important for DRAM applications, as in many cases the DRAM chips are bonded over the processor chips, which generally have a temperature around 70-80°C. Thus the GaP-SD cell exhibits a 150x improvement of retention time over Si-SD cell and also meet the ITRS criteria comfortably. (a) (b) Figure 2.19 Evolution of read-current and threshold voltage shift at elevated (T=85°C) temperature in GaP-SD and Si-SD vertical memory cells 57 Figure 2.20 Trend of single transistor latch-up programing with scaling of the GaP-SD and Si-SD transistor To understand the effect of scaling on the cell performance, GaP-SD and Si-SD cells with TSi = 30 nm and TSi = 20 nm are optimized to achieve the maximum retention time. The gate lengths of these transistors are chosen to have a logic state ‘0’ current around ~ 2 µA/µm at elevated (85°C) temperature. First, the programing characteristics are investigated in figure 2.20. With TSi scaling, the highest threshold voltage shifts that can be obtained from Si-SD devices reduce drastically. For TSi=30nm, Si-SD cell show a maximum ΔVTH of 0.57V whereas for TSi = 20nm, the maximum ΔVTH is only 0.24 V. These ΔVTH from Si-SD devices are not good enough to meet the ITRS retention time criteria. The GaP-SD devices also show lower ΔVTH with TSi scaling. But even at TSi=30nm and TSi=20nm, GaP-SD cells show ΔVTH of 1.64 V and 1.36 V respectively. Thus GaP-SD vertical 1T-DRAM cell is much more suitable for scaled technology nodes. Figure 2.21 shows the effect of scaling on retention time for GaP-SD cell. At 58 elevated temperature, GaP-SD cells show a retention time of 0.5 s and 0.2 s for TSi = 30nm and TSi = 20nm respectively. Thus the GaP-SD cell can satisfy the ITRS criteria of retention time specification up to at least TSi = 20nm cell. 25C Retention Time (s) 2.0 1.5 1.0 25C 85C 0.5 85C 0.0 20nm TSi 30nm Figure 2.21 Retention times at room (T=25°C) and elevated (T=85°C) temperature for GaP-SD vertical 1T-DRAM cells at TSi = 30 nm and TSi = 20 nm device footprint 2.4.1 Variability in Vertical GaP Source Drain DRAM Cell A major concern for memory technologies is the performance variation between different memory cells on the same wafer and even in the same die. The fabrication process steps are not ideal and after fabrication of billions of cells using these process steps, it cannot be expected from all cells to show exactly the same behavior. The contributions of different parameters (such as random dopant fluctuations (RDF), gate oxide thickness, body thickness) leading to the variation in the performance for 1T- 59 DRAM cells are analyzed in reference [4]. Other important sources of the variability are gate workfunction and line edge roughness, especially for the vertical device. In case of a doped channel, RDF is the main variability contributor. However, in the absence of any channel doping, the fluctuation in the body thickness affects the retention time of a 1T-DRAM cell most. Because of the variation, the ITRS specified 64 ms retention time at 85° C is not good enough. To make sure that most of the fabricated cells are usable even in the presence of variations, a retention time of at least one order higher than 64 ms needs to be achieved in the median cell. To understand the impact of variability in TSi on the vertical memory cells, we assumed that the TSi values follow a Gaussian distribution with the designed value as mean and 5% of the mean TSi value as its sigma. The retention time distributions at T = 85°C for this TSi distribution are plotted in figure 2.22 (a) and (b) for the Si-SD and GaP-SD cell optimized for TSi = 54nm respectively. We assume that the sensing amplifier needs a 275 mV of threshold voltage shift to distinguish between logic state ‘1’ and ‘0. Figure 2.22 (a) shows that at time instant of 10 ms, only 50% of the cells have a threshold voltage shift higher than 275mV. Thus if we claim to have a retention time of 10 ms, at least 50% of the cells are defective, which cannot be tolerated from an industry point of view. However at time instant of 0.1 ms, 99% cells have a threshold voltage shift higher than 275 mV. Thus a system designed with a retention time specification of 0.1 ms is more suitable. Thus the actual usable retention time with Si-SD cells is 0.1 ms, rather than 10 ms obtained from the median cell. For GaP-SD cells in figure 2.22 (b), the median cell shows a retention time of 1 second. However the retention time distribution at time instant of 64 ms shows that, at least 99% of the cells have a threshold voltage shift over 275 mV. Thus even after 60 considering the variability, the GaP-SD cells can meet a retention time specification of 64 ms. Thus the GaP-SD vertical 1T-DRAM cell is ideal for commodity DRAM applications also. (a) (b) Figure 2.22 Retention time distribution for TSi variability in (a) Si-SD cell (b) GaP-SD cell at T = 85°C for mean TSi = 54 nm device Figure 2.23 shows the retention time distribution for the GaP-SD devices optimized for TSi=30nm and TSi=20nm. Table 2.5 summarizes the results obtained from the TSi variability simulations. For the GaP-SD device with TSi=30nm, we find that even after considering the TSi variability, 99% cells have a threshold voltage shift higher than 275mV. However for the GaP-SD cell with TSi=20nm, only 73% cells meet this criteria. Thus to qualify 99% of the cells as working cells, the body thickness needs to be increased to 22nm. Thus it shows that further device improvements, such as use of SiGe in the transistor body [5] or use of AlGaP in the source-drain region are required to further boost the valence band offset and to continue scaling below 20 nm TSi. 61 Figure 2.23 Retention time distribution for TSi variability in GaP-SD cell at T=85°C for mean TSi = 30nm and TSi = 20nm device Table 2.5 Optimized device parameters for vertical GaP source-drain memory cell for TSi=30nm and TSi=20nm devices for commodity DRAM application 62 2.5 GaP-SD 1-Transistor DRAM - Technological Challenges Figure 2.24 Technological challenges for realizing the GaP raised source-drain 1transistor DRAM cell Before concluding this chapter, we will discuss about the possible technological challenges in realizing the proposed GaP-SD 1-T DRAM cell. Figure 2.24 shows the most basic SOI-based GaP-SD cell, already discussed previously in this chapter, along with the technological demands. In these simulations, we assumed that the GaP can be grown perfectly on silicon substrate. We did not consider the presence of the defects at the GaP-Si interface. In reality, if the GaP growth on silicon is not optimized properly, these interface defects can lead to enhanced recombination and enhanced trap-assisted leakage. Thus it needs to ensure that GaP-Si interface is defect-free. Or even if there are defects, their density should be minimal, so that the SRH recombination can still be the dominating recombination mechanism rather than trap assisted recombination. We also assumed perfect ohmic contacts on GaP source and drain and did not incorporate any contact resistance. In reality, if the contact resistance on GaP is too high, the programing 63 speed might reduce considerably. However, since the ON-current of the transistors is not a major issue here, the demand of the contact resistance for these transistors is much more flexible than logic transistors. Finally we also assumed that the source-channel and drain-channel n-p junctions are right at the GaP-Si interface. If the top silicon layer becomes n-type due to phosphorus diffusion during the GaP growth, then the p-n junction will shift into silicon which will make the GaP layer completely ineffective. Thus the GaP growth also needs to be optimized to limit this phosphorus diffusion into silicon. 2.6 Conclusion In this chapter, we investigated about the limited retention time achievable from Si-based 1T-DRAM cells. We understood that the barrier heights at the source-channel and drain-channel p-n junctions in a silicon transistor are not good enough to store enough number of holes to meet the ITRS retention time criteria. To increase these barrier heights, we proposed to integrate GaP at source and drain regions. GaP was chosen because of its valence band offset to silicon and also because of its good lattice matching property. Using this proposed modification, different GaP source-drain (GaPSD) based transistor structures were suggested for both embedded and commodity DRAM applications. TCAD simulations were used to evaluate and compare these structures against similar silicon source-drain (Si-SD) transistors. It was found that GaPSD cells can out-perform the Si-SD cells from retention time and scalability point of view. It was also found that GaP-SD cells can meet the ITRS retention time criteria, even when variability in device dimensions are considered. Thus it was established that 64 GaP-SD based 1-transistor DRAM cells are promising as possible alternatives to the conventional 1-transistor 1-capacitor based DRAM cell. From this point of view, the different technological challenges in realizing this concept were also mentioned. 2.7 References [1] I. Sakata and H. Kawanami, “Band discontinuities in gallium phosphide/crystalline silicon heterojunctions studied by internal photoemission,” Applied Physics Express, vol. 1, no. 9, 091201, 2008. [2] Sentaurus Device User Guide, Synopsys TCAD Suite, Mountain View, California [3] International Technology Roadmap for Semiconductors 2013 Edition, available at www.itrs.net [4] M. H. Cho and T.-J. K. Liu, “Variation study and implications for BJT based thinbody capacitorless DRAM,” IEEE Electron Device Letters, vol. 33, no. 3, pages 312– 314, 2012 [5] M. Ertosun and K. Saraswat, “Investigation of capacitorless double-gate singletransistor DRAM: With and without quantum well,” IEEE Trans. Electron Devices, vol. 57, no. 3, pages 608–613, Mar. 2010. 65 Chapter 3 Optimization of Gallium Phosphide Growth on Silicon As discussed in the previous chapter, growth of good quality gallium phosphide on silicon is the most important challenge in realizing the GaP source-drain capacitorless DRAM technology. Being a III-V compound semiconductor material, the growth of GaP on silicon comes with its own challenges, such as formation of antiphase domains and boundaries, diffusion of phosphorus and gallium into silicon and diffusion of silicon into GaP, various interface defects and stacking faults due to lattice constant mismatch and thermal expansion/compression issues. In this chapter, we will discuss some of the growth optimization strategies and their impact on the GaP film quality using different characterization techniques. 3.1 Growth Technique Metal-organic chemical vapor deposition (MOCVD), also known as metalorganic vapor phase epitaxy (MOVPE) is chosen as the growth technique to optimize GaP growth on silicon for various reasons. Other growth techniques such as molecular beam epitaxy (MBE) [1] or liquid phase epitaxy (LPE) [2] have also been used previously in other studies for this material system. Being very slow, MBE is not very industry friendly and thus mainly limited to academic researches. LPE as a film growth 66 option is also not very popular for industrial applications. Different CVD techniques, on the other hand, have been widely accepted in industry for both semiconductor and metal-based applications. For logic transistor applications, CVD-growth of SiGe at source and drain of the PMOS have already established for mass production [3]. For many years, different gate, source and drain metal deposition steps have also used CVD of tungsten, tantalum or other such metals [4]. Metal-organic CVD is very similar to silicon or metal CVD systems, except the precursors used for different sources are carbon-based. Unfortunately thus MOCVD has the drawback of incorporating some amount of carbon (depending on the growth temperature) inside the film. However with the advantages such as easier deposition system design, better handling and chamber cleaning, higher deposition rate and familiarity with general CVD techniques, MOCVD is a better choice for III-V material growth for future applications in semiconductor industry. 3.2 Procedure of GaP Growth on Silicon Unlike other III-V materials, GaP has a lattice constant quite similar to silicon. GaP has a lattice constant of 5.45Å at room temperature. Silicon’s lattice constant is 5.43Å, which is about only 0.37% off from the lattice constant of GaP. However at higher temperature, due to different thermal expansion coefficients, this lattice constant mismatch increases and thus the growth temperature plays a very important role in optimizing the film quality. The small lattice constant mismatch theoretically allows to grow about 40-90nm GaP on silicon without any defects [5]. However due to two different atom sites in III-V semiconductors, various other kind of defects can arise – 67 such as antiphase domain (APD) and antiphase boundary (APB) [6]. Ideally in GaP or any other III-V material, the group III element (Ga in GaP) should only bond to group V element (P in GaP) and vice-versa. However due to improper material growth, a Ga atom might bond with another Ga atom or a P atom might bond with another P atom. These can reverse the order of the lattice system locally. The region where the lattice order is reversed is called the antiphase domain (APD) and the boundary of this region is called the antiphase boundary (APB). It has been shown that the (100) silicon surface consists of consecutive planes with monoatomic step height [7], which promotes the generation of APDs and APBs. To resolve this issue, two approaches have been studied. One of the approaches uses a silicon wafer with (100) orientation and 4º or 6º offcut wafer towards <110>. This particular surface has mostly a double atomic step height [8]. This helps in reducing the densities of APDs and APBs. However these off-axis wafers are generally very costly. All the processes in silicon technology are generally optimized for (100) silicon due to lower interface states between gate oxide and silicon and also because of higher mobility. Thus choosing an off-axis wafer is not the appropriate way to optimize the GaP growth on silicon, especially for DRAM applications where cost is one of the stringent constraints. Though the (100) silicon has only monoatomic steps on its surface, it has been shown that by annealing at a high temperature (e.g., 975ºC) in high hydrogen pressure (950mtorr), a double atomic stepped surface can be formed [6, 9-10]. This enables the opportunity to grow good quality GaP on (100) silicon and also enables the monolithic 68 integration of this technology with conventional logic technology based on exact (100) silicon. It might also be better to grow a silicon layer before the high temperature hydrogen annealing step [9]. This initial silicon growth buries all carbon and metal contaminants that can be present on the surface even after thorough RCA cleaning. Since the interface quality dictates the overall film quality to a large extent, the silicon epi-grown layer, being pristine in nature, should serve as a good starting surface. For Ga- and P- precursors, trimethyl gallium (TMGa) or triethyl gallium (TEGa) and phosphine (PH3) or tertiary butyl phosphine (TBP) are widely used. Because of lower decomposition temperature and lesser toxicity, usage of TBP is more dominant than PH3 these days. In most GaP growth studies, a thin nucleation layer is formed at lower temperature and then the temperature is raised to increase the growth rate [6]. 3.3 Physical Characterization of GaP Film on Silicon In this section, we describe the characterization results of the GaP films that were grown using Applied Materials MOCVD chamber. Using a recipe similar to as described in the previous section, 40-60 nm GaP thin films were grown on exact (100) silicon surface. However, the epi-silicon growth step was skipped. Figure 3.1 shows the scanning electron microscopy (SEM) image of GaP surface grown without proper recipe optimization. The antiphase boundaries are clearly visible on the surface. The zig-zag nature of the antiphase boundaries indicates the single monoatomic step nature of the silicon surface. The TEM cross section image of this sample is shown in figure 3.2. The 69 presence of the antiphase domain appearing from the GaP-Si interface and going all the way to the surface is clearly visible. Stacking faults are also present in this sample. 200nm Figure 3.1 SEM image of the starting recipe of GaP growth without any growth optimization, clearly indicating the presence of non-aligned antiphase boundaries. GaP Stacking fault Antiphase boundary Si 10nm Figure 3.2 TEM cross section image of about 55nm GaP grown on silicon using MOCVD without proper recipe optimization 70 With the addition of the hydrogen annealing at high temperature and high pressure step, all the antiphase domains line up in a specific direction as shown in the SEM image in figure 3.3. This indicates the occurrence of double atomic step generation on silicon surface. With proper growth temperature optimization, these antiphase domains can be reduced in size as shown in the SEM images in figure 3.4. Figure 3.3 SEM image of the GaP surface after the addition of hydrogen annealing step Figure 3.4 SEM image of GaP grown on silicon after proper growth temperature optimization. 71 200nm Figure 3.5 SEM image of 55nm GaP grown on silicon using MOCVD with proper growth optimization. TEM GaP 10 nm Si Figure 3.6 TEM cross section image of GaP grown on Si with proper optimized recipe Finally with proper optimization of precursor gas flows and growth pressures, it is possible to get rid of the antiphase domains and boundaries and a perfectly smooth surface can be obtained as shown in figure 3.5. The sample in figure 3.5 has a surface roughness of about 0.46nm as measured by atomic force microscopy technique. Figure 72 3.6 shows the TEM cross section of this optimized sample. No antiphase domain can be observed in this GaP film. However, a few stacking faults can still be found. Since these stacking faults do not extend up to the GaP-Si interface, it can be concluded that the GaP-Si interface is almost defect free. (a) (b) Figure 3.7 X-ray diffraction characterization result for MOCVD grown GaP film on silicon with optimized and not optimized recipe in (a) <004> and (b) <002> direction Figure 3.7 compares the x-ray diffraction characterization results of 3 samples. Figure 3.7 (a) shows the ω-2θ plot in the <004> direction. GaP has a slightly higher lattice constant than silicon. Thus ideally the pseudomorphic GaP film should be under compressive stress. By Poisson effect, its lattice constant gets elongated in the vertical direction. This results in a shift of its XRD peak position away from the silicon peak, i.e. at a lower 2θ value. This shift depends on the strain level in the film. As we can see, the optimized GaP film has its peak at the lowest value of 2θ, thus indicating highest 73 level of strain. So the optimized recipe also results in the most strained film. Figure 3.7 (b) shows the ω-2θ plot in <002> direction. The full width half maximum (FWHM) of the GaP peak in <002> direction indicates the density of the APDs/APBs in the GaP film. Again the optimized film shows minimum FWHM amongst the 3 films indicating that the optimized GaP film has minimum APD/APB density. Figure 3.8 Secondary ion mass spectroscopy of GaP film showing inter-diffusion of Ga, P and Si into GaP film and bulk Si substrate. Figure 3.8 shows the secondary ion mass spectroscopy (SIMS) characterization result of the optimized film. This shows that Si has diffused inside GaP. Fortunately Si acts as an n-type dopant in GaP, which will help in realizing n-type GaP source and drain. The major concerns are the diffusion of Ga and P atoms inside silicon substrate. If the P-diffusion dominates, then this will make the top silicon layer n-type and will shift the p-n junction inside silicon, defeating the purpose of using GaP at source and 74 drain. From the SIMS characterization, it seems that both Ga and P atoms have diffused equally inside silicon and Ga diffusion dominates the P diffusion. However it needs to keep in mind that SIMS characterization results only represent the total number of atoms rather than the activated atoms which are responsible to modify the substrate doping. Thus further characterization is necessary to ensure that the top Si surface is still p-type after GaP growth. This will be described in the next chapter. 3.4 Conclusion In this chapter, we discussed different options to grow gallium phosphide on silicon. We argued that the metal-organic chemical vapor deposition (MOCVD) is the proper technique for future industrial production. We also mentioned different key parameters to optimize the GaP growth recipe. The GaP film were characterized using scanning electron microscopy, atomic force microscopy, transmission electron microscopy and x-ray diffraction techniques and useful information about the film quality, strain levels and anti-phase domain and boundary density were obtained. 3.5 References [1] A. C. Lin, M. Fejer, J. S. Harris, “Antiphase domain annihilation during growth of GaP on Si by molecular beam epitaxy”, Journal of Crystal Growth, volume 363, pages 258-263, 2013. [2] S.R. Huang, L. Xuesong, A. Barnett and R.L. Opila, "GaP films grown on Si by liquid phase epitaxy," 34th IEEE Photovoltaic Specialists Conference, pages 241-243, 2009. [3] S. Thompson et al, “A 90 nm logic technology featuring 50 nm strained silicon channel transistors, 7 layers of Cu interconnects, low k ILD, and 1µm 2 SRAM cell,” International Electron Devices Meeting, pages 61-64, 2002. 75 [4] V. Narayanan et al, “Dual work function metal gate CMOS using CVD metal electrodes,” Symposium on VLSI Technology, pages192-193, 2006. [5] T. Soga, T. Jimbo, and M. Umeno, “Effects of thickness on dislocations in GaP on Si grown by metalorganic chemical vapor deposition,” Japanese Journal of Applied Physics, vol. 32, no. 6A, pages L767–L769, 1993. [6] K. Volz, A. Beyer, W. Witte, J. Ohlmann, I. Nemeth, B. Kunert, and W. Stolz, “GaPnucleation on exact Si (0 0 1) substrates for III/V device integration,” Journal of Crystal Growth, vol. 315, no. 1, pages 37–47, 2011. [7] D.K. Biegelsen, F.A. Ponce, A.J. Smith and J.C. Tramontana, “Initial stages of epitaxial growth of GaAs on (100) silicon,” Journal of Applied Physics, vol. 61, pages 1856-1859, 1987. [8] R. Bringans, D. Biegelsen, and L.-E. Swartz, “Atomic-step rearrangement on Si(100) by interaction with arsenic and the implication for GaAs-on-Si epitaxy”, Physical Review B, vol. 44, no. 7, pages 3054-3063, 1991. [9] I. Németh, B. Kunert, W. Stolz and K. Volz, “Heteroepitaxy of GaP on Si: Correlation of morphology, anti-phase-domain structure and MOVPE growth conditions”, Journal of Crystal Growth, vol. 310, Issues 7–9, Pages 1595-1601, 2008. [10] B. Kunert, I. Németh, S. Reinhard, K. Volz and W. Stolz, “Si (001) surface preparation for the antiphase domain free heteroepitaxial growth of GaP on Si substrate,” Thin Solid Films, Volume 517, Issue 1, pages 140-143, 2008 76 Chapter 4 Electrical Characterization of Gallium Phosphide - Silicon Heterojunction Interface In this chapter, we will further look into the characterizations of gallium phosphide (GaP) – silicon (Si) heterojunction interface. After examining the results of different physical characterization techniques (SEM, AFM, TEM and XRD) in the last chapter, we will try to explore the electrical performance of the GaP thin film and the GaP - Si heterojunction interface. We will describe the characteristics of fabricated semiconductor test structures such as heterojunction diode and transistors to evaluate the applicability of the GaP thin film and the GaP – Si interface for source and drain in 1-transistor capacitor-less DRAM cell. 4.1 P-N Junction Diode A p-n junction diode can serve as a perfect test structure to understand the quality of the junction. Figure 4.1 describes the output characteristics of an ideal diode for both forward and reverse voltages. The same figure also shows the characteristics of a p-n junction dominated by defects or traps. At low forward voltages, ideally the diode current is limited by diffusion of carriers over the barrier. For an ideal junction with no 77 defects near the interface, this over-the-barrier diffusion translates to a 60mV/dec slope as described below. The current (I) – voltage (V) equation of a diode can be written as I = I0 qV ηk (e BT − 1) where I0 is the reverse saturation current and for an ideal diode η =1. Now for I2=10I1, 10I1 ≈ I1 qV2 ηk e BT qV1 ηk e BT where V1 and V2 are the diode forward voltages to obtain forward current I1 and I2. Or, V2 − V1 = ηkB T q ln 10 = η × 60mV at room temperature Thus to increase the forward current by an order, the forward voltage needs to be increased by 60mV for an ideal diode (η=1). In other words, the forward current should have a slope of 60mV/dec. On the other hand, if the p-n junction is not ideal, such as if there are traps at or near the junction interface, then the forward current is mostly dominated by the enhanced recombination rate at these traps and defects and the ideality factor can increase up to 2 at low forward biases. In most cases, the ideality factor would be between 1 and 2, depending on the recombination current component. The diode reverse current is also a great indication of the junction quality. In the absence of the traps, the reverse current in the silicon based diode is dominated by Shockley-Read-Hall (SRH) generation of electrons and holes. The depletion region width Wdep for a one-sided junction depends on the reverse voltage VR as 78 Wdep = √ 2εs VR qNA and the corresponding reverse saturation current IR is given by, IR ≈ qni Wdep 2τ where τ is the recombination lifetime of the carriers. Figure 4.1 Current-voltage characteristics in both forward and reverse directions for ideal and non-ideal diode. The traps and defects in the depletion region can lead to an ideality factor between 1 and 2 at low forward voltage regime and also can lead a reverse current strongly dependent on reverse voltage. Thus the reverse current has a very weak square root dependence on the reverse voltage for an ideal diode. However, if there are traps and defects near the p-n junction 79 or in the depletion region, the reverse current can substantially increase with reverse voltage as shown in figure 4.1. 4.2 Fabrication of Heterojunction Diode Gallium Phosphide – Silicon The process flow for fabrication of GaP-Si heterojunction diode is shown in figure 4.2. First the silicon wafer is dry cleaned using Siconi chamber [1-2] and then about 45nm GaP is grown using MOCVD. The grown GaP film has an n-type doping level of about 1018 cm-3 as measured by Hall measurement technique. Then the sample is cleaned in 2% hydrofluoric acid for 7 minutes. After surface clean, the sample surface is mostly hydrophobic [3]. Using contact printing lithography, circular patterns of 40, 60 and 80 µm diameter are defined on GaP surface. Then GaP is etched using a mixture 37 % hydrochloric acid, 70% nitric acid and 100% acetic acid with a 1:1:1 volume fraction, respectively [4]. The etch rate of GaP with this wet etchant is about 100 nm/min. After GaP etching, the resist is etched with acetone and the sample is again cleaned with 2% hydrofluoric acid for 7 minutes. After this surface clean, the sample is introduced in an atomic layer deposition (ALD) chamber to deposit aluminum oxide (Al2O3) at 250°C. Tri-methyl aluminum (TMA) as aluminum source and de-ionized water as oxygen source are used as precursors. About 15 nm Al2O3 is deposited to passivate the surface of GaP and silicon. The aluminum oxide deposition rate is about 1 Å/cycle. Next another lithography is carried out to define the anode and cathode metal contacts on silicon and GaP respectively using metal lift off technique. Double layer contacts - silicon (40nm) and gold (100nm) are deposited using e-beam evaporation after etching the aluminum oxide from the contact holes using 2% hydrofluoric acid. 80 Finally the sample is annealed in nitrogen environment in 250°C to 325°C range for 2 minutes using a rapid thermal annealing system. This forms a Schottky contact on GaP with silicon acting as dopant. The contact resistance on GaP is found to be comparatively lower when annealed at these temperature than the as-fabricated sample. MOCVD growth of GaP on silicon, followed by surface cleaning of GaP Silicon 1st lithography step to define pattern on GaP, followed by wet etching of GaP Silicon Surface cleaning of GaP and silicon and passivation oxide deposition by ALD Silicon 2nd lithography to define contact holes, passivation oxide etching, contact metal deposition and lift-off Silicon Figure 4.2 Process flow for the GaP – silicon p-n heterojunction fabrication Figure 4.3 shows the current-voltage characteristics of the fabricated GaP-Si hetero p-n junction. The ideal TCAD-simulated GaP-Si heterojunction characteristics 81 are also plotted in the same voltage range. The ideal GaP-Si heterojunction has an ideality factor of 1 and almost constant reverse current, as expected from theoretical background. Without any annealing, the contact resistance of both anode and cathode are quite high and thus the diode current is mostly dominated by the contact resistance rather than over-the-barrier diffusion current. Thus the ideality factor (calculated in the voltage range 0 to 200mV) is too high (2.5), but it does not represent the characteristics of the GaP-Si interface. The reverse current of the as-fabricated sample is in the similar range as predicted by simulation. The value of the diode reverse current depends on depletion width as we mentioned before. Now the depletion width depends on the doping levels on the both sides of the junction. The GaP film might be doped higher near the GaP-Si interface than the value obtained from the hall measurements, which gives an average doping density of the whole film. Also due to Ga diffusion, the silicon at GaP-Si interface might become more p-type. Thus the doping values we have used in our simulations might not be very similar to the doping concentrations in the actual film. With nitrogen annealing at 250°C, 300°C and 325°C, the diode ON current increases because of the reduction in contact resistance. The ideality factor also improves and becomes 1 right after annealing at 250°C. The reverse current also reduces slightly due to an improvement in surface passivation quality after temperature treatments of aluminum oxide [5]. Thus the fabricated GaP-Si diode shows almost ideal interface characteristics up to ±3V range. However, as the reverse voltage is increased beyond 3V, the reverse current level starts to increase. This shows the operating voltage should be limited to less than ±3V for this heterojunction. With further annealing of the sample over 350°C, gold and silicon react with each other and spike through the junction. Thus 82 the anneal temperature must be limited to 325°C or less when gold is used as contact metals. Figure 4.3 Current-voltage characteristics of GaP-Silicon p-n heterojunction diode at room temperature To further investigate the junction behavior, the diode current-voltage characteristics are measured at different temperatures, ranging from 77K to 350K. Figure 4.4 shows the reverse and forward currents as functions of the temperature. The reverse current measured at -2V has an activation energy of about 0.48V, which is very close to the silicon half band-gap. This shows that the reverse current at low reverse voltage is dominated mostly by SRH generation, since this generation also has a signature activation energy of half the band gap of silicon. However, the reverse current at -8V has a very weak temperature coefficient. This confirms that the reverse current 83 at higher reverse voltage is mainly dominated by defects or traps, having energy levels close to the band edges. Figure 4.4 Temperature dependence of GaP-Si heterojunction diode currents for forward bias, moderate reverse bias and high reverse bias. Thus the characterizations of GaP-Si diode convey several pieces of important information. Though it was found that the GaP-Si interface is of good quality, but it was also learnt that the conventional gold-based contacts for III-V materials limits the contact annealing temperature. The device operating voltage also should not exceed ±3V, which is fine since in the TCAD simulations described in chapter 2, a higher voltage than ±2V was never applied to the DRAM cell transistors. 84 4.3 GaP Source Drain Heterojunction Transistor GaP MOCVD growth of GaP on silicon, followed by surface cleaning of GaP, 1st lithography for alignment mark, dry etching of GaP and Si, resist ashing Silicon GaP GaP 2nd lithography, GaP wet etching, resist wet etching, surface cleaning of GaP and Si Silicon GaP Gate GaP Gate oxide ALD, gate metal deposition, 3rd lithography for gate metal patterning, gate metal etching, and resist wet etching Silicon M M GaP Source Gate Silicon GaP Drain 4th lithography to define source-drain contact, gate oxide wet etching from contact holes, metal deposition, metal lift off, resist etching and forming gas anneal Figure 4.5 Process flow for fabrication of GaP source-drain heterojunction transistor on bulk silicon substrate After ensuring the quality of GaP-Si interface through electrical characterizations, the next step is to fabricate heterojunction transistors with GaP at source and drain and with silicon channel. For transistor fabrication, a similar process flow is established as of heterojunction diode. The process flow is described in figure 4.5. First GaP is grown on <100> silicon using MOCVD. Then the first lithography step 85 is carried out to pattern alignment marks. To define the alignment mark, a remote plasma assisted chlorine (Cl2) and boron trichloride (BCl3) based dry etching step is used to etch both GaP and silicon. After defining the alignment marks, the resist ashing is carried out using an oxygen plasma at 180°C. Next the sample is again patterned using lithography to protect GaP in source and drain region and to etch everywhere else. This etching also exposes silicon for channel definition. This etching is carried out using wet etching technique in an acid mixture of 37 % hydrochloric acid, 70% nitric acid and 100% acetic acid with a 1:1:1 volume fraction respectively. For some samples, silicon is also etched in 25% potassium hydroxide solution heated at 40°C for 30 seconds after completion of GaP etching. The etch rate in potassium hydroxide at this concentration and temperature is found to be about 100nm/min. Next, the sample surface is cleaned in 2% hydrofluoric acid for 7 minutes and 10-12 nm aluminum oxide (Al2O3) (gate oxide) is deposited using atomic layer deposition technique at 250°C. Right after the gate oxide deposition, 150nm aluminum is deposited using sputtering technique on top of gate oxide. The sputtering of aluminum is carried out in two steps – first a relatively low power (50W) is used for 10 minutes to deposit first 50 nm of aluminum. This is carried out to minimize the sputtering damage of the thin gate oxide and the gate oxide-silicon interface. Then a relatively higher sputtering power is used (100W) for another 10 minutes to deposit the rest of 100nm aluminum. The 3rd lithography step is used to pattern the deposited aluminum to define the gate contact. A heated (40°C) aluminum wet etchant, a mixture of phosphoric acid (72%), acetic acid (3%), nitric acid (3%) and water (22%) is used to etch aluminum. The last lithography step is used to pattern the source and drain contact holes for metal lift-off technique. A dual layer of silicon 86 (40nm) and gold (100nm) are deposited using e-beam evaporation technique after etching the aluminum oxide from the contact hole. Finally the metal lift-off is carried out and a forming gas anneal is performed on the sample for 30 minutes at 325°C to improve the gate oxide quality. Figure 4.6 Transfer characteristics of GaP-Si heterojunction transistor with and without silicon etching prior to gate oxide deposition Figure 4.6 shows the transfer characteristics of two transistor samples with 100µm gate length where in one of them the top silicon etching step is skipped. For the sample which has not gone through the etching of the silicon near the GaP-Si interface, the transistor exhibits worse subthreshold swing (120 mV/dec) and higher leakage. Also there is a 150mV threshold voltage difference between the two transistors. Without etching, the silicon surface might have a higher number of Ga and P atoms which can degrade the gate oxide to silicon interface and the subthreshold swing. The etching of a thin silicon layer from the surface helps to expose the good pristine quality silicon and 87 thus also helps to form a better gate oxide with lower interface states. This results in a better subthreshold swing. Using C-V measurements, we find that the top silicon surface is still p-type for both these samples. This ensures that the p-n junction is at the GaP-Si interface. Thus all the remaining measurements are carried out for the samples which 10 -6 10 -7 10 -8 10 -9 10 -10 10 -11 10 -12 10 -13 VDS from 0.2 to 1V 100 LG=100m SS = 120mV/dec TOX=10nm of Al2O3 (K=6.5) Drain Current (nA/m) Drain Current (A/m) are exposed to the silicon etch before the gate oxide deposition. 0 1 2 Gate Voltage(V) VGS from 0.2 to 1 V in steps of 0.2V 80 Series Resistance 60 limited 40 20 0 0.0 0.5 1.0 1.5 2.0 Drain Voltage (V) (a) (b) Figure 4.7 Characteristics of GaP-Si heterojunction transistor for a 100µm gate length transistors – (a) transfer characteristics (b) output characteristics Figure 4.7(a) shows the transfer characteristics of the transistor with 100µm gate length for different drain voltages ranging from 0.2 to 1V. Proper transistor on and off operations are achieved with GaP source drain. Thus the applicability of GaP as source and drain material is ensured. Due to its weak temperature dependence, the leakage current in the transistor is believed to be dominated by band-to-band tunneling current or trap assisted SRH generation at negative gate voltage. This is due to the large gateto-source and gate-to-drain (2µm) overlap, which enhances the electric field at gate 88 drain and gate-source corners. By intelligent process design, this overlap can be minimized and this leakage current can be reduced. Figure 4.7(b) shows the output characteristics of the GaP source-drain transistor for different gate voltages. It can be observed that at lower drain voltages, the currents at different gate voltages are almost indistinguishable. This is the signature of high series and contact resistance in the transistors. The GaP is only auto-in-situ doped by silicon diffusion during its growth and thus the doping concentration in GaP is limited to only 1018 cm-3 level. As a result, both the series and contact resistances of the GaP film are quite high. Thus at low drain voltages, drain currents are limited by series and contact resistance on GaP, rather than the silicon channel resistance. Since the gate voltage only modulates the channel resistance, the drain current is almost independent of gate voltage at low drain voltages. Reasonable saturation in drain currents can be observed at high drain voltages – which bears the signature of a good MOSFET characteristics. VDS=1V TOX=10nm Al2O3(K=6.5) -7 10 -8 10 -9 Series Resistance limited ON-current 10 -10 SS ~ 70-80mV/dec 10 -11 10 -12 LG=100m LG=10m LG=5m LG=2m 10 -13 Drain Current (A/m) 10 -0.5 0.0 0.5 Gate Voltage (V) 1.0 Figure 4.8 Transfer characteristics of GaP source-drain heterojunction transistors for different channel lengths ranging from 2µm to 100µm. 89 Figure 4.8 shows the transfer characteristics of the GaP source-drain transistors for different channel lengths ranging from 100µm to 2µm. All the transistors show proper MOSFET gate voltage dependent turn on and turn off characteristics. All the transistors exhibit band-to-band tunneling (BTBT) or trap assisted recombination limited leakage as described above. This leakage mostly depends on the electric field near the gate-drain overlap region. It can also depend on the channel lengths as in modern smaller channel lengths transistors, the electric field will also be much higher. However, the leakage currents in the transistors do not show a continuous trend with the transistor channel lengths. The overlaps in different transistors might be different due to the slight misalignment of the gate metal pattern. In these transistors, we have achieved subthreshold swings of 70-80mV/dec which are quite close to the ideal 60mV/dec. The 60mV/dec subthreshold swing cannot be achieved due to the absence of interfacial silicon dioxide layer and due to higher interface states at the Al2O3 - silicon interface. However, we also observe, that the ON-currents of these transistors do not increase with channel length scaling. This is exactly opposite to the general MOSFET theory. As mentioned before, the currents in these transistors are limited by series and contact resistance. For the smaller channel length devices, the source and drain contact area are also smaller. Thus for smaller channel length devices, the contact resistance values are even higher, which results in a reduction of ON-current. Thus we conclude that the GaP source-drain transistors exhibit proper transistor behavior. However their performance can be further improved by reducing the GaP sheet and contact resistance which must be carried out to scale down the transistor gate length further. 90 4.4 Nickel Alloying of GaP GaP MOCVD growth of GaP followed by GaP surface cleaning in 2% HF for 7 minutes Silicon Nickel GaP Deposition of 7nm nickel by e-beam evaporation Silicon GaP-nickel alloy GaP Alloying nickel with GaP in nitrogen environment in 250°-400°C range, etching of extra nickel in diluted HCl Silicon Ta Ta GaP Silicon Lithography to pattern contact metal, deposition of tantalum and lift off Figure 4.9 Process flow for fabrication of transmission line measurement structure to study effect of nickel alloying on GaP sheet and contact resistance To reduce the sheet resistance of the GaP film, a similar technique like silicidation is incorporated in the transistor process flow. Silicidation has been used in CMOS industry for a while now, and it is considered as one of the major techniques to 91 reduce source and drain sheet resistances. To study the impact of nickel alloying of GaP on its sheet resistance, a circular transmission line measurement (TLM) structure [6-8] is fabricated. The process flow is described in figure 4.9. First, 7nm nickel is deposited on MOCVD grown GaP which has an initial doping level of ~1018 cm-3. Then the nickel is alloyed with GaP at different temperatures ranging from 250°C to 400°C for 2 minutes in nitrogen environment in a rapid thermal annealing tool. Only part of the deposited nickel reacts with GaP and this nickel alloyed GaP layer acts as a barrier for the rest of the nickel to diffuse through and to react with GaP. After alloying, the extra un-reacted nickel is etched with diluted hydrochloric acid (1:4 HCl : H2O). Next a lithography step is carried out to pattern the circular TLM structure. 35 nm of tantalum is deposited as the contact metal using e-beam evaporation and lift-off technique. Tantalum is chosen as the contact metal (rather than gold as used before) since it does not react with nickel and can handle fairly high temperature. This allows us to do a high temperature (> 325° C) process later (such as forming gas anneal or contact anneal for transistors). A control sample is also fabricated with previously described silicon-gold contact metal and without any nickel deposition and is annealed at 325°C in the nitrogen environment for 2 minutes. Figure 4.10 shows the transmission line measurement results and extracted sheet resistance. For the control sample, without any nickel alloying, the GaP film shows a sheet resistivity of 5600 ohm/square. However with nickel alloying, the sample shows a much lower sheet resistance (about 430 ohm/square). Thus the nickel alloying technique can improve the sheet resistance of GaP by more than one order. If the doping 92 of the starting GaP film is increased, a much lower sheet resistance can be achieved, suitable for GaP source-drain transistor at modern technology nodes. Resistance (k Contact Radius 0.6 = 50m 5600 0.4 0.2 GaP-Ni Alloy GaP 430 0.0 0 10 20 30 TLM distance (m) Figure 4.10 Measurement of GaP sheet and contact resistance with and without nickel alloying using transmission line measurement (TLM) structure Next a process flow is developed to integrate the nickel alloying at GaP source and drain of the transistor. This process flow is very similar to the earlier one developed without the nickel alloying process. First GaP is grown on <100> silicon using MOCVD. Then the first lithography step is carried out to create alignment marks with remote plasma assisted chlorine (Cl2) and boron trichloride (BCl3) based dry etching step. Next the sample is again patterned to etch GaP using the HCl, HNO3 and CH3COOH acids mixture from everywhere except in source and drain regions, thereby exposing silicon for channel definition. After silicon etching in 25% potassium hydroxide solution heated at 40°C for 30 seconds, the sample surface is cleaned in 2% hydrofluoric acid for 7 minutes. Next 10-12 nm aluminum oxide (Al2O3) as gate dielectric is deposited using atomic layer deposition technique at 250°C. Right after the 93 gate oxide deposition, 30nm tantalum is deposited using e-beam evaporation. The 3rd lithography step is used next to pattern the deposited tantalum to define the gate contact. Tantalum is etched using a charge coupled plasma assisted dry etching technique with 100 sccm flow of sulfur hexafluoride (SF6) gas at 500W power and 150mtorr pressure. Without etching the resist after gate metal tantalum patterning, 7nm nickel is deposited using e-beam evaporation. The resist is then etched with acetone, which lifts off the nickel from the gate metal region. Then the nickel is alloyed with GaP in nitrogen environment at 400°C for 2 minutes inside a rapid thermal annealing tool. The extra nickel is etched using diluted hydrochloric acid (1:4 HCl : H2O) for half an hour. The diluted hydrochloric acid does not etch the tantalum gate metal or the gate oxide. The last lithography step is used to pattern the source and drain contact hole for metal liftoff technique. Nickel (10nm) and tantalum (35nm) are deposited using e-beam evaporation technique after etching the aluminum oxide from the contact hole. Finally the metal lift-off is carried out and a forming gas anneal is performed on the sample for 15 minutes at 350°C to improve the gate oxide quality. A control sample is also fabricated without nickel alloying and with aluminum as gate metal as discussed in section 4.3. Figure 4.11(a) and (b) show the transfer characteristics of the fabricated transistors without and with nickel alloying incorporated. As we described in the previous section, for the control sample without nickel alloying, the on-currents of the transistors do not increase with the reduction of gate lengths due to high series and contact resistances. However as figure 4.11 (b) shows, with integration of nickel alloying, the on-currents properly increase with gate length scaling since the 94 source/drain resistance and the contact resistances no longer play a role at least for these channel lengths. Figure 4.12 shows the trends of on-currents with gate length reductions. The ideal scaling trend has also been plotted within the same gate length range. This shows that with integration of nickel alloying technique, the on-current scaling of Drain Current (A/m) 10 -7 Al-Gate -8 10 VDS=1V 10 -9 10 -10 10 -11 10 -12 -13 10 -1.0 Drain C urrent (A/m) transistors is very close to the ideal one. LG 100m 25m 10m E.O.T=6.25 (a) -0.5 0.0 0.5 Gate Voltage (V) 10 -6 E.O.T=6.25nm 10 -7 VDS=1V Ta-Gate 10 -8 10 -9 10 -10 10 -11 Ni-alloyed GaP-SD (b) 0.0 LG 100m 25m 10m 0.5 1.0 Gate Voltage (V) 1.5 Normalized ON-Current (a) (b) Figure 4.11 Transfer characteristics of GaP-Si heterojunction transistor for different gate lengths – (a) without nickel alloying, (b) with incorporation of nickel alloying in GaP source and drain region. IOFF=30pA/m Ideal No nickel Alloy With Nickel Alloy 6 5 4 3 Ideal 2 1 0 0 25 50 VDD=1V 75 Channel Length (m) 100 Figure 4.12 Scaling of on-current with gate length scaling for GaP-Si heterojunction transistor with and without incorporation of nickel alloying of GaP at source and drain 95 4.5 Conclusion In this chapter, we investigated about the GaP-Si interface by fabricating a heterojunction p-n diode. After detailed measurements, we concluded that the electrical performance of this heterojunction is quite promising and suitable for semiconductor device application. To examine the applicability of GaP as source/drain material, a transistor process flow was developed to fabricate GaP source-drain heterojunction transistors with silicon channel. Well-behaved transistor operation was demonstrated with excellent subthreshold swing. However GaP film sheet and contact resistances were found to be too high to achieve proper transistor scaling. To alleviate this issue, a nickel alloying method of GaP was developed to reduce GaP sheet resistance. This nickel alloying process was integrated in the GaP source-drain heterojunction transistor process flow and proper scaling of transistor ON-currents was obtained with transistor gate lengths scaling. 4.6 References [1] J. Lei, S.-E. Phan, X. Lu, C.-T. Kao, K. Lavu, K. Moraes, K. Tanaka, B. Wood, B. Ninan, and S. Gandikota, “Advantage of siconi preclean over wet clean for pre salicide applications beyond 65nm node,” in IEEE International Symposium of Semiconductor Manufacturing, pages 393–396, 2006 [2] R. Yang, N. Su, P. Bonfanti, J. Nie, J. Ning, and T. T. Li, “Advanced in situ pre-Ni silicide (siconi) cleaning at 65 nm to resolve defects in NiSix modules,” Journal of Vacuum Science and Technology B, vol. 28, no. 1, pages 56–61, 2010 [3] H. Morota and S. Adachi, “Properties of GaP (001) surfaces treated in aqueous HF solutions,” Journal of Applied Physics, vol. 101, no. 11, pages 113518-1–113518–6, 2007. [4] E. Kaminska, A. Piotrowska, A. Kaminska, and M. Klimkiewicz, “Etching procedures for GaP surfaces,” Surface Technology, vol. 12, no. 2, pages 205–215, 1981 96 [5] R. Kotipalli, R. Delamare, O. Poncelet, X. Tang, L. A. Francis and D. Flandre, “Passivation effects of atomic-layer-deposited aluminum oxide”, EPJ Photovoltaics, vol. 4, no. 45107, 2013 [6] H. Munmann and D. Widmann, “Measurement of the Contact Resistance Between Metal and Diffused Layer in Planar Devices”, Solid-state Electronics, 12, pages 879886, 1969. [7] D.K. Schroder, “Semiconductor Material and Device Characterization”, J. Wiley & Sons, 2006. [8] G.K. Reeves, H.B. Harrison, “Obtaining the Specific Contact Resistance from Transmission Line Model Measurements”, IEEE Electron Device Letters, Vol. 3, No. 5, pages 111-113, 1982. 97 Chapter 5 Demonstration of Enhanced Hole Storage Capability in GaP Source-Drain Transistor In this chapter, we will demonstrate the improved charge storage capability in long channel GaP source-drain (GaP-SD) transistors on bulk silicon substrates, which we have fabricated and optimized (described in the last chapter) so far. We will also compare GaP-SD transistors with Si-SD transistors from charge storage point of view. We will first describe the methodology of this technique and will also prove the concept by means of TCAD simulation. Then we will describe the hole storage characterization results for long channel GaP-SD and Si-SD transistors and discuss the outcomes. 5.1 Use of Bulk-Si Substrate Based Transistors In chapter 2, we described the SOI-based 1T-DRAM cell. The buried oxide layer in SOI wafer prevents the stored holes from leaking and diffusing into the handle silicon substrate. However this is not the case with the bulk silicon substrate, which we have used to grow the GaP layer and also to fabricate the transistors. For the measurements of these transistors, we have used the backside of the sample as substrate contact. If we attempt to store holes in these transistors with this configuration, because of the electric 98 field, the bottom substrate contact will collect all the generated holes and there won’t be any threshold voltage shift in the transfer characteristics of the transistor. There are two methods to prevent the collection of the holes by the bottom substrate contact. The substrate contact may be positively biased to repel the holes from it, which will help to keep the holes near the channel region. However, this will forward bias the source-body junction of the transistor and will cause extra source current, which might make the threshold voltage extraction slightly problematic. The easier way is to keep the substrate contact floating, thus emulating the floating body behavior of the silicon body in SOI substrate. (a) (b) Figure 5.1 Difference in hole storage in (a) SOI-based and (b) bulk-Si substrate based transistor. The buried oxide layer confines the holes in the thin active device layer in SOI-based transistor whereas the holes diffuse away into the bulk for bulk-Si substrate based transistor. 99 There is one more problem with bulk silicon substrate for these experiments. Even in the absence of any electric field, the holes generated near the channel region will diffuse according to the Fick’s law from high density to low density regions as shown in figure 5.1. As the holes traverse further away from the channel, their impact on the channel threshold voltage will be lowered. This is quite contradictory from the SOI-based transistors where the holes are confined in the small active silicon thickness by the buried oxide layer. Because of the diffusion in bulk silicon substrate based transistors, the amount of the threshold voltage shift would not be as much as in SOIbased transistors. Thankfully, the diffusion rates of carriers in silicon are not too high, and with enough hole generation rate, a threshold voltage shift can still be observed. With enough hole generation rate, this threshold voltage shift will still depend on the source-channel and drain-channel p-n junction barrier heights. Since GaP increases this barrier height at source-channel and drain-channel junctions, theoretically the GaP-SD transistor on bulk Si substrate should be able to show a higher threshold voltage shift than the Si-SD transistor. Previously in simulation in chapter 2, we have used single transistor latch-up programing method to generate holes in sub-100nm channel length transistors. The impact ionization plays a very important role in this programing method. However for long channel transistors as we have experimentally demonstrated in chapter 4, the impact ionization process won’t be effective since the electric field at channel-drain junction is comparatively much lower. To generate holes in long channel transistors, we 100 can use optical excitation. If we shine light of wavelengths below 1.1µm, electron and hole pairs will be generated inside silicon channel. The electrons will flow towards drain due to its electric field and finally will be collected there. In the absence of a substrate contact, holes will accumulate near the channel region and thus will reduce the threshold voltage. 5.2 TCAD simulation of Hole Storage Capability for Bulk-Si Substrate Based Transistors To properly evaluate the usefulness of the bulk-Si substrate based transistor for charge storage capability, we first conduct TCAD simulation of these transistors. 10µm n-channel length transistors are used for both silicon and GaP source-drain (Si-SD and GaP-SD) structure. The AM1.5G solar spectrum is used as the optical source – though any other optical source with suitable intensity and wavelength would work. A 5nm thick gate oxide is used for these transistors. No substrate contact is used for these transistors. Since both Si-SD and GaP-SD transistors have similar channel length and gate oxide thickness, both devices show similar electrostatics and thus their transfer characteristics are also similar. Figure 5.2 shows the transfer characteristics of Si-SD transistor with and without the optical excitation in semi-logarithmic scale. With optical excitation, new electronhole pairs get generated inside silicon. The drain current increases because of the collection of newly generated electrons at drain and also because of threshold voltage reduction due to storage of holes. To properly identify and separate these two components, different gate voltage ranges can be used. When the gate voltage is much 101 lower than the threshold voltage, the electron injection barrier from source to channel is too high and slight reduction in threshold voltage does not make any significant change in drain current. Thus the increase in drain current at high negative gate voltage is mostly due to collection of newly generated electrons by optical excitation. Since this generation does not really depend upon the gate voltage, the drain current is relatively constant in this region. However, at higher positive gate voltage, the electron injection barrier is lowered sufficiently and thus the electron injection current dominates. This electron injection is increased due to threshold voltage reduction which is due to storage of optically generated holes. Thus the drain current is increased by both collection of optically excited electrons and reduction of threshold voltage. So in the presence of optical excitation, if we subtract the drain current at high gate voltages by the constant drain current at lower gate voltages, we will get only the drain current component which has increased only due to the storage of optically generated holes. -6 Drain Current (A/m) 10 Si Source-Drain Transistor increase in current due to optically generated electron and hole storage -8 10 increase in current due to optically generated electron -10 10 collection Optical Excitation without with -12 10 0.0 0.5 1.0 Gate Voltage (V) 1.5 Figure 5.2 TCAD simulation of transfer characteristics of silicon source-drain transistor with and without optical excitation 102 15 Si Source-Drain Transistor Drain Current (A/m) Drain Current (A/m) 15 10 5 0 0.0 GaP Source-Drain Transistor 10 VTH= 0.079V 0.5 1.0 1.5 Gate Voltage (V) VTH= 5 0 0.0 0.525V 0.5 1.0 1.5 Gate Voltage (V) (a) (b) Figure 5.3 TCAD simulation of hole storage characteristics of long-channel (a) silicon source-drain and (b) GaP source-drain transistor Figure 5.3 shows the transfer characteristics of the simulated Si-SD and GaPSD transistors in linear scale with and without optical excitation. The increase in drain current due to collection of optically generated electrons is minimal and does not change the transfer characteristics for the above threshold voltage region appreciably. For SiSD transistors in figure 5.3 (a), the threshold voltage reduction is about 80mV due to the hole storage. As we mentioned earlier, this low threshold voltage shift is due to low barrier heights at the source-channel and drain-channel junctions and also because of the fact that majority of the holes are stored slightly away from the channel. However with GaP-SD devices as shown in figure 5.3 (b), the threshold voltage shift is about 525mV – more than 6 times higher than that obtained from Si-SD devices. Thus it shows 103 that even in bulk-Si substrate based devices, the valence band offset of GaP can play a major role in enhancing the hole storage capability by increasing the barrier heights at source-channel and drain-channel junctions. Thus the bulk Si substrate based transistors can be properly used to compare the hole storage capability of Si-SD and GaP-SD cells. 5.3 Experimental Comparison of Hole Storage Capability To compare the hole storage capability, both silicon source-drain and GaP source-drain transistors are fabricated. GaP-SD transistors are fabricated without the nickel alloying technique and with tantalum gate, using the same process flow as described in chapter 4. A gate last process is also used to fabricate the Si-SD transistors. The process flow to fabricate silicon source-drain transistor is shown in figure 5.4. First the source and drain implantation is carried out with a 1015 cm-2 dose of phosphorus at an energy of 40keV on a silicon (100) sample with 15nm sacrificial silicon oxide on it. Then the sample is annealed at 1000°C for 10s in argon environment to activate the dopant and also to cure the implant damage. After creating the source and drain, 10nm alumina as gate dielectric is deposited by atomic layer deposition at 250°C. Next, tungsten as gate metal is deposited using sputtering technique and patterned using dry etching technique to form the gate contact. Finally the source and drain contact holes are patterned and another tungsten metallization step and lift-off are carried out to form the source and drain contacts. After finishing the fabrication process, the sample is subjected to a forming gas anneal at 350°C for 15 minutes in a rapid thermal annealing tool. Figure 5.5 shows the transfer characteristics of both fabricated Si-SD and GaP-SD devices in semi-logarithmic scale for 10µm and 100µm channel length transistors. The 104 GaP-SD transistors show slightly lower current level because of the higher series and contact resistance at source and drain. Figure 5.4. Gate last process flow for silicon source drain transistor without a substrate contact 105 -6 10 -7 10 -8 10 -9 10 -10 10 -11 10 -12 0.0 LG 100m 10m Drain Current (A/m) Drain Current (A/m) 10 Si-SD Transistor 0.5 Gate Voltage (V) 1.0 10 -6 10 -7 10 -8 10 -9 10 -10 10 -11 10 -12 LG 100m 10m GaP-SD Transistor 0.0 0.5 Gate Voltage (V) 1.0 (a) (b) Figure 5.5 Transfer characteristics of fabricated (a) silicon source-drain and (b) GaP source-drain transistor at VDS=1V No optical excitation With optical excitation 0.15 0.8 Si-SD Transistor Drain Current (A/m) Drain Current (A/m) 0.20 LG=50µm 0.10 0.05 VTH= 0.08V 0.00 0.0 0.5 Gate Voltage (V) 1.0 Si-SD 0.6 Transistor LG=10µm 0.4 VTH= 0.075V 0.2 0.0 0.0 0.5 Gate Voltage (V) 1.0 Figure 5.6. Transfer characteristics of silicon source-drain transistor for (a) 50µm and (b) 10 µm channel length with and without the presence of optical excitation. Both channel length devices show a threshold voltage reduction of about 75-80mV 106 0.20 LG=100m Drain Current (A/m) Drain Current (A/m) VDS=1V 0.30 0.25 E.O.T = 5nm 0.20 0.15 VTH= 0.45V 0.10 0.05 LG=50m E.O.T = 5nm 0.15 0.10 VTH= 0.45V 0.05 VDS=1V 0.00 0.0 0.5 1.0 1.5 Gate Voltage (V) 0.0 0.5 1.0 Gate Voltage (V) 1.5 Figure 5.7. Transfer characteristics of GaP source-drain transistor for (a) 100µm and (b) 50 µm channel length with and without the presence of optical excitation. Both channel length devices show a threshold voltage reduction of about 450mV. Figure 5.6 plots the transfer characteristics of fabricated Si-SD transistors respectively with and without optical excitation. The microscope light (mercury arc lamp) of the measurement instrument is used as optical excitation. Figure 5.6 shows the results for 10µm and 50µm channel length Si-SD devices. These Si-SD transistors show threshold voltage shifts of about 75-80mV due to optical excitation which are about the same as obtained from TCAD simulations. For GaP-SD transistors, figures 5.7 and 5.8 show the results of 100µm, 50µm, 25µm and 10µm channel length devices. For all these channel length transistors, the optical excitation results in threshold voltage shifts of about 0.45-0.49V which are again in line with the prediction of our TCAD simulation results. Thus the fabricated GaP source-drain transistors show about a 5 to 6 times higher threshold voltage shift than fabricated Si-SD transistors because of enhanced 107 hole storage capability. This proves that the MOCVD grown GaP on silicon can be used to fabricate 1-transistor DRAM cells, which will improve its charge storage performance by storing more holes using its valence band offset at GaP-Si interface and higher p-n junction barrier heights at source/drain-channel junctions. 0.4 LG=25m 0.6 EOT = 5nm VDS=1V Drain Current (A/m) Drain Current (A/m) 0.5 No optical excitation With optical excitation 0.3 VTH= 0.2 0.49V 0.1 0.0 0.0 0.5 1.0 1.5 Gate Voltage (V) LG=10m EOT = 5nm 0.5 0.4 VTH= 0.45V 0.3 0.2 0.1 0.0 0.0 VDS=1V 0.5 1.0 1.5 Gate Voltage (V) Figure 5.8. Transfer characteristics of GaP source-drain transistor for (a) 25µm and (b) 10 µm channel length with and without the presence of optical excitation. Both channel length devices show a threshold voltage reduction of about 450-490mV. 5.4 Conclusion In this chapter, we proposed a technique to use the bulk-Si substrate based long channel transistors to examine and compare the hole storage capability, which determines the retention time of an 1T-DRAM cell. Using optical excitation as the hole generation method for long channel transistors, we substantiated our proposed technique 108 using TCAD simulation. Our TCAD simulation showed that even in bulk-Si substrate based transistors, GaP source-drain structure can exhibit 5 to 6 times threshold voltage shift due to enhanced hole storage capability than similar Si source-drain structures. Using this characterization technique, we experimentally achieved about 450-490mV threshold voltage shift in fabricated GaP source-drain devices, compared to 75-80mV threshold voltage shift in fabricated Si source-drain transistors. This proves the usefulness of GaP valence band offset in increasing the transistor’s hole storage capability and thus the potential of GaP source-drain silicon channel transistor structure in 1-transistor DRAM technology for improving its retention time and progressing its scalability. 109 Chapter 6 Conclusion and Future Work In this chapter, we will review the work that has been discussed so far in this dissertation. We will also outline the different challenges that are still needed to be solved and hence the scope of the further research that can follow this work. Finally we will also discuss about a few other research directions where the work of this thesis can be extended. 6.1 Review of overall work We started this thesis with reviewing the present DRAM technology prevalent in the industry. In chapter 1, we discussed about the trench capacitor and stacked capacitor technologies and how the challenges in formation of the capacitor in a small footprint have led to increased amount of defects, leakage, reliability and yield problems. The reliability and yield problems have stopped the DRAM scaling altogether. We also discussed about the commodity and embedded DRAM technology and how embedded DRAM technology gained momentum in recent years replacing SRAM in some portions of the cache memory. Though the performance and density specifications of embedded DRAM are less strict than standalone commodity DRAM, we understood how the integration of DRAM process with the logic is the major concern for embedded DRAM technology. The concept of capacitor-less floating body 1- 110 transistor DRAM (1T-DRAM) was proposed with the idea of making this integration easier. We discussed about different programing mechanisms for 1T-DRAM and understood how most of the research efforts have been focused on these aspects. Finally we pointed out that the shortcoming of the retention time specification is the major limitation for this concept and planned to dedicate rest of this thesis to propose a solution and also to realize it, if possible. In chapter 2, we spent some time in understanding how the charge is stored in a silicon transistor, and what affects the storage of the charge and its leakage and hence the retention time. The small p-n junction barrier heights at the source-channel and drain-channel junctions were pinpointed as the main culprit for the limited retention time. To improve the barrier height, we proposed to use gallium phosphide (GaP) at source and drain because of its valence band offset with silicon and close lattice constant matching property with silicon. The valence band offset helps to store more holes in an n-channel transistor with p-type substrate. With this concept, we proposed different structures for SOI-based and bulk-Si substrate based process for embedded DRAM application and also for commodity DRAM technology. We performed extensive TCAD simulations to study the programing, retention time and scalability of the proposed structures and also to compare with Si-based 1T-DRAM technology. We understood that the proposed structures with GaP source-drain have the capability to meet the ITRS and industry standard DRAM specifications and thus worth spending effort in realizing. 111 In chapter 3, we took a step forward in realizing the GaP source-drain transistor. We concentrated our efforts to optimize the GaP growth on silicon substrate using MOCVD technique. Much of our efforts were spent to understand the impacts of different factors – such as starting surface preparation, temperature and precursor gas flows. We applied different physical characterization technique such as SEM, TEM, AFM and XRD to evaluate the GaP film and the GaP-Si interface quality. Using all these characterization techniques, we developed a detailed understanding and were able to achieve a smooth surface and defect free GaP-Si interface. In chapter 4, we started to evaluate the performance of our MOCVD grown GaP films electrically and also focused on building the basic blocks for realizing the GaP-Si transistor. We developed a process flow for fabricating a GaP-Si heterojunction diode to evaluate the GaP-Si interface quality. By extensive electrical characterization, we concluded that the SRH recombination in depletion region still dominates the leakage rather than leakage associated with the traps at GaP-Si interface (if there is any) in the DRAM operating voltage region. We also perfected the fabrication of long channel transistors with GaP at source-drain. We achieved 70-80 mV/dec subthreshold swing and an on- to off- current ratio of about 106 at 1V VDD with these transistors. To improve the series and contact resistances of the as-grown GaP film, we also developed a nickel alloying method of GaP thin film and successfully incorporated this nickel alloying technique in the GaP source-drain transistor process flow. Chapter 5 makes an attempt to compare the charge storage capability in GaP source-drain and silicon source-drain transistors on bulk-Si substrate. Though the 112 diffusion of generated holes in the bulk substrate dominates the charge storage capability in these transistors, we came up with an ingenious method of keeping the substrate contact floating such that the barrier heights at source-channel and drainchannel junctions can determine the amount of the charge that can be stored. We used optical excitation to generate holes in the channel for these long channel transistors. Using TCAD simulations, we first ensured the validity of this technique. We characterized both GaP and Si source-drain transistors, fabricated using the process flow developed in the chapter 4. Because of the valence band offset in GaP, we achieved a 5 times higher threshold voltage shift in GaP source-drain transistors than Si source-drain transistors as predicted by our TCAD simulations. This completes the discussion of the work that has been carried out in this thesis. Next, we shall discuss the different aspects that still need to be looked upon to realize and to mature this concept further. The following section also attempts to provide a pathway for further research that can follow this work discussed in this thesis. 6.2 Future Work 6.2.1 Doping of GaP In our optimized GaP MOCVD growth recipe, we did not incorporate any external atoms to dope the GaP film. During growth, silicon atoms from substrate diffused in GaP. These silicon atoms worked as n-type dopant in GaP. The doping level thus achieved in GaP was about 1018cm-3 which was good enough for the long channel length transistor we fabricated. Since we were able to develop and integrate the nickel 113 alloying of GaP in our transistor fabrication, the low doping level in GaP did not impact the transistor performance that much. However, going forward this might be a problem for shorter channel length transistors, where the source-drain and contact resistance might dominate the channel resistance. Thus efforts are needed to increase the doping level in GaP either by incorporating in-situ doping during growth or by ion implantation later. Both processes have their advantages and drawbacks. Adding the in-situ doping precursor in an already complicated process involving two precursors might not be straightforward, especially at the earlier part of the growth which determines the GaPSi interface property, critical for the DRAM cell. However in spite of increased growth complexity, the in-situ doping might work in favor of cost and thermal budget from the industry point of view. On the other hand, using implantation and subsequent annealing is easy to carry out but the film and GaP-Si interface quality might take a hit in this process, especially if the implant dose and energy required are too high to dope GaP sufficiently. Also in the ideal case, GaP grown on Si would be perfectly critically strained, and thus any subsequent high temperature annealing step to activate the dopants and to repair the implant damage might also deteriorate the interface quality. The thermal budget of annealing may also cause difficulty in process integration point of view in the industry. Different atoms such as silicon, tin, tellurium and lithium have been used to dope GaP by implantation and the dose, energy, annealing temperature and activated dopant levels are already available in literature to some extent. These might also be a good starting point for this aspect. 114 6.2.2 Integration of GaP source-drain transistor with the logic silicon transistor One of the major motivations of research efforts in 1-transistor DRAM concept is easy integration with logic transistors. In our work, we concentrated on maintaining this advantage. However integrating III-V materials with silicon logic transistors is not very straight forward. Below we discuss two possible process flows to integrate GaP source-drain in conventional process technology: 1) GaP growth first: In this case, MOCVD of GaP growth on silicon in selected areas is done in the early part of the process flow of the silicon transistor. The rough outline of this process is shown in figure 6.1. First the entire wafer is covered with silicon oxide or nitride and only part of it is opened via lithography. Then the GaP MOCVD growth is carried out next and buried under another protective nitride or oxide layer. Then major part of the logic transistor (planar or FinFET) process is carried out. The 1T-DRAM transistors and the logic transistors can share some of the process steps such as ALD of gate oxide or source-drain metallization. The advantage of this process is that the logic transistors do not see the thermal budget of the GaP growth. However the equipment to be used for fabricating the logic transistor is exposed to the III-V material which might cause cross contamination. Possibly burying GaP under a protective oxide or nitride layer will reduce the level of contamination. 115 Figure 6.1 Process flow to integrate GaP source-drain transistor with GaP growth taking place at the start of the transistor fabrication 116 The process flow described above works if there is no other high temperature (> 600°C) process to follow. This is because generally the III-V materials (including GaP) growth temperatures are limited to 600-700°C. If the strained GaP film is exposed to higher temperatures, there may be severe out-diffusion of P or Ga atoms. This restriction of thermal budget on the latter steps can work for SOI-based logic process. However for bulk-Si substrate based process, a number of implantation and high temperature anneals for well implantation need to be carried out in the initial part of the transistor process flow. The GaP growth may be carried out after the well-implants and annealing for the bulk-Si based technologies. However in this case, the thermal budget for the wellimplants needs to be designed keeping the thermal budget of MOCVD process in mind. 2) GaP growth last: In this process flow as shown in figure 6.2, the GaP growth is done around the same time when the SiGe source-drain is grown for PMOS applications. As a result, fewer equipments in the process line are exposed to the III-V material. However, the high temperature high pressure hydrogen anneal step (required to promote the double atomic step on the silicon surface) may alter the patterns on the wafer – such as rounding of edges. It needs to be investigated if there is another way to promote the double atomic step on the surface so that the integrity of the patterns on the surface can be protected. As we pointed out, both these processes have their advantages and disadvantages. Thus more research effort is needed to be spent either or both these process flows or to come up with some other process flow to integrate the GaP sourcedrain structure. 117 Figure 6.2 Process flow to integrate GaP source-drain transistor with GaP growth taking place after the silicon source-drain epi for silicon transistor 118 6.3 GaP on Silicon Growth for Future Applications In this thesis, we mainly focused on using the valence band offset property of GaP to store more holes in the transistor body. But another useful feature of GaP is its close lattice constant to silicon. Silicon has been the constant in semiconductor industry now for over 60 years, and any new technology will have immense advantage to prosper in semiconductor industry, if it can be easily integrated on silicon. From this aspect, we mention two possible applications which can take advantage of the GaP-Si lattice matching system: 6.3.1 III-V transistor integration on silicon III-V high mobility materials (such as InGaAs, InAs, GaSb) have always been attractive as next generation transistor materials to semiconductor industry. One major hurdle to overcome for these new materials based transistors is the integration on silicon – mainly because of the cost of the III-V wafers. Also not all the transistors in a chip need to operate at such high speed, such as I/O transistors have a superior need to have a higher breakdown voltage rather than very high speed. From this point of view, GaP can act as the most promising buffer layer. In most cases, the III-V buffer layers grown on silicon have both lattice constant mismatch with silicon and polar-on-nonpolar growth issues (discussed in chapter 3). Using GaP as a buffer layer helps to eliminate the lattice mismatch problem in the early stage of the growth. Once the defects (antiphase domains and boundaries) at GaP-Si interface are all suppressed within GaP, new precursors to add In, As or Sb can be introduced. Thus by varying the composition of these elements, the final desired material can be grown. Utilizing this idea, reference 119 [1] attempts to fabricate complicated heterostructure stack on silicon with GaP as buffer layer. High electron mobilities (27800 cm2 V-1 s-1 at room temperature, 111000 cm2 V-1 s-1 at 300K and 77k) were obtained in an AlSb/InAs heterostructure integrated on (100) silicon using GaP-GaSb buffer layer. 6.3.2 Realization of LASER on silicon One major limitation of silicon is its indirect bandgap which disables it from being an effective laser source material. Traditionally III-V materials have been used to realize strong laser sources. However because of process integration issues, it is hard to integrate an on-chip laser with III-V material on silicon substrate. This is a major drawback for optical communications, since all the other components of optical communication such as detector and modulator can be easily fabricated on silicon. GaP growth on silicon can also contribute in realizing a monolithic laser on silicon. Incorporating small amount of N in GaP, a light emitting material GaPN can be realized [2-3]. It has been shown that GaAsPN has a direct bandgap and very close lattice constant to GaP and silicon [4-5]. Thus a laser can be realized on silicon by growing a thin buffer layer of GaP and then incorporating As and N in the film resulting in this complicated ternary material. Thus GaP and its associated material systems have great future in monolithic integration of laser and optical communication system on silicon. 6.4 Contributions In this dissertation, we identified the reason of short retention time with silicon 1-transistor DRAM and proposed to integrate gallium phosphide (GaP) at source and drain of a silicon channel transistor to solve this issue. Using extensive TCAD 120 simulations we showcased the retention time improvement and scalability of the GaP source-drain in different structures suitable for embedded and commodity DRAM applications. Using MOCVD as the film growth technique and different physical characterization techniques, we optimized the GaP growth on silicon to achieve a nearperfect interface. We fabricated GaP-Si p-n heterojunction diode and GaP source-drain transistor to study the electrical performance of this interface. Using these transistors, we also showed the enhanced charge storage capability in these GaP source-drain transistors – which is responsible for achieving higher retention time in GaP sourcedrain based 1-transistor capacitor-less DRAM cell. 6.5 References [1] L. Desplanque, S. El Kazzi, C. Coinon, S. Ziegler, B. Kunert, A. Beyer, K. Volz, W. Stolz, Y. Wang, P. Ruterana and X. Wallart, “Monolithic integration of high electron mobility InAs-based heterostructure on exact (001) Silicon using a GaSb/GaP accommodation layer,” Applied Physics Letters, vol. 101, 142111, 2012. [2] B. Kunert, K. Volz, W. Stolz, “Dilute nitride Ga(NAsP)/GaP-heterostructures: toward a material development for novel optoelectronic functionality on Si-substrate”, Physica Status solidi (b), vol. 224. 2730, 2007 [3] B. Kunert, S. Reinhard, J. Koch, M. Lampalzer, K. Volz, and W. Stolz, “First demonstration of electrical injection lasing in the novel dilute nitride Ga(NAsP)/GaPmaterial system”, Physica Status Solidi (c), vol. 3, no. 3, pages 614-618, 2006 [4] B. Kunert, K. Volz, J. Koch, W. Stolz, “Direct-band-gap Ga(NAsP)-material system pseudomorphically grown on GaP substrate”, Applied Physics Letters, vol. 88, 18210, 2006. [5] B. Kunert, S. Zinnkann, K.Volz, W. Stolz, “Monolithic integration of Ga(NAsP)/(BGa)P multi-quantum well structures on (0 01) silicon substrate by MOVPE”, Journal of Crystal Growth, vol vol. 310, 4776, 2008. 121


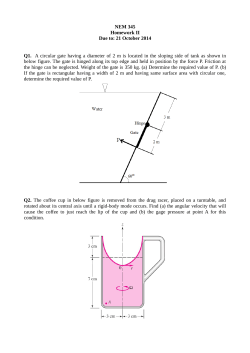


© Copyright 2026