
Standardised Indicators guidelines
STANDARDISED INDICATORS AND CATEGORIES
FOR BETTER CMAM REPORTING
APRIL 2015 EDITION
Adapted from MRP User guidelines April 2012
Complies with CMAM Report software April 2015
Authors (in alphabetical order)
Carlos Navarro-Colorado (CDC)
Christoph Andert (Save the Children UK)
Emily Mates (Save the Children UK)
Lourdes Vazquez (Save the Children UK)
Jennifer Martin (Save the Children UK)
Jeremy Shoham (ENN)
Rachel Evans (Save the Children UK)
Sarah Style (Independent consultant)
Victoria Sibson (Save the Children UK)
This edition was updated by
Christoph Andert (Save the Children UK)
Susan Fuller (Save the Children UK)
Acknowledgments
The authors would like to express their gratitude to all agencies that contributed to the development of
these guidelines (formerly known as MRP): CDC, Concern Worldwide, FANTA2, International Rescue
Committee (IRC), Nutrition Information in Crisis Situations (NICS), Save the Children UK, United Nations High
Commissioner for Refugees (UNHCR), UNICEF, Valid International, World Food Programme (WFP), World
Health Organisation (WHO), and World Vision - as well as the Global Nutrition Cluster for providing a
platform for wider discussions.
On behalf of Save the Children UK the authors would like to thank the Humanitarian Innovation Fund (HIF)
that provided generous funding for the MRP/CMAM Report project from April 2013 to March 2015.
Previous donors
2008 – 2011
The MRP Project was made possible through the generous support of the American
people through OFDA of the United States Agency for International Development
(USAID) under the Agreement No. DFD-G-00-07-00226-00 to the ENN as part of a
project entitled Strengthening Capacity to Respond to Emergencies in the Food
Security and Nutrition Sectors (2008 - 2011). The content does not necessarily reflect
the views of USAID or the United States.
2011 - 2012
The European Commission’s Humanitarian Aid department funds relief operations
for victims of natural disasters and conflicts outside the European Union. Aid is
channelled impartially, straight to people in need, regardless of their race, ethnic
group, religion, gender, age, nationality or political affiliation.
This document has been produced with the financial assistance of the European
Commission. The views expressed herein should not be taken, in any way, to reflect
the official opinion of the European Commission.
2
Content
ACRONYMS....................................................................................................................................................................4
INTRODUCTION .............................................................................................................................................................5
1.1
1.2
HISTORY ................................................................................................................................................................. 5
PROGRAMMES AND TREATMENT GROUPS ...................................................................................................................... 5
PROGRAMME ENTRIES, EXITS AND PERFORMANCE INDICATORS ...................................................................................7
2.1
2.2
2.3
2.4
2.5
OVERVIEW .............................................................................................................................................................. 7
STABILISATION CENTRE ENTRIES, EXITS AND PERFORMANCE INDICATORS............................................................................... 8
OUTPATIENT THERAPEUTIC PROGRAMME ENTRIES, EXITS AND PERFORMANCE INDICATORS .................................................... 12
TARGETED SUPPLEMENTARY FEEDING PROGRAMME ENTRIES, EXITS AND PERFORMANCE INDICATORS ...................................... 17
OTP DISCHARGES IN TSFP ENTRIES, EXITS AND PERFORMANCE INDICATORS ....................................................................... 21
SUGGESTIONS ON NARRATIVE REPORTS ......................................................................................................................23
GUIDANCE ON INTERPRETING PROGRAMME PERFORMANCE INDICATORS .................................................................25
4.1
4.2
4.3
4.4
4.5
GENERAL RULES WHEN INTERPRETING INDICATORS ........................................................................................................ 25
SPHERE MINIMUM STANDARDS................................................................................................................................. 25
ACTING ON SUBSTANDARD SPHERE MINIMUM STANDARDS............................................................................................. 26
SINGLE INDICATOR GUIDANCE – PERFORMANCE INDICATORS ........................................................................................... 26
SINGLE INDICATOR GUIDANCE - ADDITIONAL INDICATORS ................................................................................................ 29
ANNEXES .....................................................................................................................................................................32
ANNEX 1 TOOLS FOR DATA COLLECTION AND REPORTING ............................................................................................................. 32
ANNEX 2 BENEFICIARY CARD TARGETED SFP, FANTA 2008 ......................................................................................................... 34
ANNEX 3 MONTHLY SITE REPORT TEMPLATE – SC ...................................................................................................................... 35
ANNEX 4 MONTHLY SITE REPORT TEMPLATE – OTP .................................................................................................................... 35
ANNEX 5 MONTHLY SITE REPORT TEMPLATE – TARGETED SFP ...................................................................................................... 36
ANNEX 6 MONTHLY SITE REPORT TEMPLATE – OTP DISCHARGES IN TSFP ....................................................................................... 36
ANNEX 7 REGISTRATION BOOK - INPATIENT MANAGEMENT OF ACUTE MALNUTRITION (SC) ............................................................... 37
ANNEX 8 REGISTRATION BOOK - OUTPATIENT MANAGEMENT OF ACUTE MALNUTRITION (OTP).......................................................... 37
ANNEX 9 REGISTRATION BOOK - TARGETED SUPPLEMENTARY FEEDING PROGRAMME (TSFP) ............................................................. 38
ANNEX 10 REGISTRATION BOOK – OTP DISCHARGES IN TSFP ...................................................................................................... 38
ANNEX 11 TALLY SHEET – OTP .............................................................................................................................................. 39
ANNEX 12 TALLY SHEET – TARGETED SFP ................................................................................................................................. 40
ANNEX 13 TALLY SHEET – OTP DISCHARGES IN TSFP ................................................................................................................. 41
ANNEX 14 INSTRUCTIONS FOR COMPLETING A TALLY SHEET ......................................................................................................... 42
ANNEX 15 CALCULATION AND REPORTING OF OVERALL PROGRAMME OUTCOMES FOR SC AND OTP TOGETHER ...................................... 43
ANNEX 16 RESOURCES ......................................................................................................................................................... 44
3
Acronyms
BMI
BSFP
CDC
CMAM
CTC
CSAS
FANTA
FSL
GAM
GFD
HIV
IYCF
MAM
M&E
MRP
MUAC
NCHS
NGO
SC
SFP
OTP
PLW
SAM
sd
SQUEAC
TSFP
RUSF
RUTF
WASH
WFH
WHO
UNHCR
4
Body Mass Index
Blanket Supplementary Feeding Programme
Centers for Disease Control and Prevention (USA)
Community-based Management of Acute Malnutrition (also see CTC)
Community Therapeutic Care (also see CMAM)
Centric Systematic Area Sampling
Food and Nutrition Technical Assistance
Food Security and Livelihoods
Global Acute Malnutrition
General Food Distribution
Human Immunodeficiency Virus
Infant and Young Child Feeding
Moderate Acute Malnutrition
Monitoring and Evaluation
Minimum Reporting Package
Mid-Upper Arm Circumference
National Centre for Health Statistics (USA)
Non-Governmental Organisation
Stabilisation Centre (term for inpatient management of acute malnutrition)
Supplementary Feeding Programme (see TSFP)
Outpatient Therapeutic Programme
Pregnant and Lactating Women
Severe Acute Malnutrition
Standard deviation (score)
Semi-Quantitative Evaluation of Access and Coverage
Targeted Supplementary Feeding Programme (see SFP)
Ready-to-use Supplementary Food
Ready-to-use Therapeutic Food
Water, Sanitation and Hygiene
Weight-for-height
World Health Organisation
United Nations High Commissioner for Refugees
INTRODUCTION
This paper outlines standardised reporting categories and definitions as well as indicators for monitoring and
reporting on all CMAM components, namely Stabilisation Centres (SCs), Outpatient Therapeutic Programmes
(OTPs) and targeted Supplementary Feeding Programmes (TSFPs).
Reporting categories and indicators have been developed through a consensus building process with a large
number of humanitarian agencies and can be seen as best practice in CMAM reporting to date. These
guidelines can be used by nutrition programme and M&E staff of NGOs as well as government staff to set up
comprehensive monitoring and reporting systems for their CMAM programming or adapt their current
systems to fit best practice.
CMAM reporting standards presented in this paper have been developed to meet latest Sphere standards
and additionally to:
•
•
•
1.1
Calculate unbiased performance for all CMAM components : OTP discharges are reported separately
from regular SFP entries 2 ; movements between CMAM components are not included in the
denominator for calculation of performance
Avoid double or multiple counting of beneficiaries when they move from one to the next CMAM
component or backtrack and start the treatment process again
Account for any beneficiaries that have been admitted by mistake through an “Other” reporting
category in entries and exits
History
A retrospective analysis of the performance of emergency SFPs published in 20083 uncovered inadequate
reporting standards, raising concerns over the quality of the interventions as well as the capacity of agencies
to learn from experience. Based on the study’s recommendations, the Emergency Nutrition Network (ENN)
together with Save the Children UK and guided by a steering group of interested agencies led the
development of a standardised monitoring and reporting package. This comprised of these overarching
guidelines and informed an optional MS Access based software. The software has since been developed into
a comprehensive online software. The process of developing this software involved reviewing the indicators
and categories used and these guidelines have been updated to reflect this process.
1.2
Programmes and treatment groups
This paper presents monitoring and reporting standards for SC, OTP and targeted SFP given that these
programmes are often delivered together as a single Community Management of Acute Malnutrition (CMAM)
programme that facilitates movement of beneficiaries between programmes as their nutritional needs and
status changes (see Figure 1). These standards can be used to report for one programme or for all
programmes in CMAM, according to the interest and needs of the MoH and the NGO implementing agency.
It should be noted that beneficiaries that have been discharged from OTP and are admitted to targeted SFP
for treatment consolidation (OTP discharges) are separately reported from regular TSFP entries. OTP
discharges receiving the same nutritional care as MAM case admitted, however, reporting on these
beneficiaries separately prevents distortion of TSFP recovery rate (by excluding beneficiaries leaving the
programme and meeting the ‘recovered’ criteria if they were not necessarily malnourished when admitted to
2
3
a recommendation by Sphere which is hardly recognised by implementers to date
Measuring the Effectiveness of Supplementary Feeding Programmes in Emergencies, Carlos Navarro-Colorado, Frances
Mason and Jeremy Shoham, Humanitarian Practice Network Paper 63, September 2008. ODI
the programme). These guidelines will refer to such beneficiaries as “OTP discharges” throughout.
Figure 1: Beneficiary flow between programmes
Each programme has treatment groups that are monitored and reported on. Typically for targeted SFPs there
are two treatment groups: 6-59 months and Pregnant and lactating women (PLW). However other treatment
groups might include: <6 months, 6-23 months, 24-59 months, older children (5-10 years), adolescents (1117 years), adults (+18 years) and elderly (+60 years).
6
PROGRAMME ENTRIES, EXITS AND PERFORMANCE INDICATORS
2.1
Overview
The following section outlines the procedure for reporting entries and exits for each programme: SC, OTP,
TSFP/OTP discharges. Each programme has slightly different entry and exit categories and programme
performance indicators and each is explained in detail in the following sections. Calculation of performance
indicators is also explained.
Annexes provide information on tools necessary for data collection and reporting (Annex 1), Monthly site
report templates for each programme (Annexes 3-6), registration books (Annex 7-10) and tally sheets based
on the these guidelines (Annex 11-13).
Entries
Entries include new admissions, re-admissions (optional), beneficiaries moved in from another programme
and ‘other’, a category required to capture small numbers who do not fit in any given category. See an
example for targeted SFP in Table 1. Cells in white and blue are completed manually by the user when
entering the data. Cells in blue are optional categories and do not have an effect on performance indicator
calculations if unused in data entry. The cells in yellow are those automatically calculated.
Table 1: Example of entry categories
WFH/ BMI
New Admissions
MUAC
Relapse
Re- admission
Total
Admissions
Other Entries
Moved in from
Other
other tSFP sites
Total In
Exits
Exits include discharges corresponding to the Sphere minimum standards (recovered, death, defaulter and
non-recovery), beneficiaries moved out to another site of the same programme and as for admissions, an
‘other’ category. Defaulters can be reported as confirmed or unconfirmed (optional), and non-recovery can
be recorded as medical referral, non-response and transfer to therapeutic programme (optional). See an
example for targeted SFP in Table 2.
Table 2: Example of exit categories
Recovered Death
Discharges
Defaulter
Unconfirmed Confirmed
Non-recovery
NonMedical
Transfer
referral
response
to TFP
Total
Discharges
Movedout to
other
tSFP
Other
Total
Out
Entry and exit information is found as usual on beneficiary cards and in registration books. These are
recorded on site tally sheets at the end of each service day and can be summarised on monthly site reports
before entered into a data base, e.g. CMAM Report.
Section 5 of these guidelines provides advice on interpretation of performance indicators.
7
2.2
Stabilisation Centre entries, exits and performance indicators
2.2.1
Stabilisation Centre entries
Table 3: SC entries
WFH/BMI
a
New Admissions
MUAC
Oedema
b
c
Relapse
Readmission
Total
Admissions
d
e
W=a+b+c+d+e
Other Entries
Moved in
Other
from OTP
f
g
Total In
Y=W+f+g
1. New admission (a, b, c): Beneficiary with SAM directly admitted to the programme because s/he meets
the admission criteria and has not been under treatment elsewhere for this episode of SAM.
• New admissions are separated by criteria of admission: WFH/BMI, MUAC and nutritional oedema (with
cut offs for anthropometric measures according to programme protocol). The user can decide to use
some or all of these categories depending on the criteria used in the programme, this will not affect the
final calculations.
• Convention dictates that when a beneficiary is admitted fulfilling both WFH and MUAC criteria he/she is
reported under WFH. When a beneficiary has nutritional oedema s/he should be recorded only in the
oedema category column whether or not s/he fulfils other criteria for admission.
Users wishing to simplify reporting: For those wishing to report new admissions more generally it is recommended
4
that at least marasmus (identified by WFH and/or MUAC) and kwashiorkor cases (cases with nutritional oedema)
should be kept separate. If all new admissions are reported without disaggregation a decision should be made on
which column should always be filled in (a, b or c).
2. Relapse (d): Beneficiary re-admitted to the programme after having been successfully discharged as
recovered within the last two months (this is a new episode of SAM). Relapse is considered as ’new
admission’ in calculations. Optional category
3. Re-admission (e): Beneficiary re-admitted to the programme within two months after having left it for a
reason that does not include recovery (e.g. after defaulting or non-response or medical referral). Optional
category
Total Admissions (W): Total number of cases starting treatment in a SC site (sum of new admissions and
relapses and re-admissions).
4. Moved-in from OTP (f): Beneficiary who has been transferred from OTP to SC - due to deterioration of
his/her nutritional status and/or medical complications - to continue treatment for SAM.
• These beneficiaries are not counted as admissions to the programme as they were already under
treatment in the OTP.
5. Other (g): Beneficiary who is admitted to the SC for reasons unrelated to their nutritional status (not
meeting SC admission criteria). Reporting principles are similar to OTP (see section 2.3.1)
Total In (Y): Total number of beneficiaries entering SC: Total admissions + Other entries (Moved in from OTP +
Other).
4
Marasmic kwashiorkor is included under the oedema criteria.
8
2.2.2
Stabilisation Centre exits
Table 4: SC exits
Promoted to
OTP
(moved-out
to OTP)
h
Discharges
Defaulter
Non-recovery
Recovered
Death
Unconfirmed
Confirmed
Medical
referral
Nonresponse
i
j
k
l
m
n
Total Discharges
Other
Total
Out
X=h+i+j+k+l+m+n
o
Z=X+o
1. Promoted to OTP5(h): Beneficiary who has been discharged from the SC and promoted to OTP after having
successfully completed the treatment of medical complications in the SC6.
• This is an internal movement between programmes; however from the point of view of the SC, it
also corresponds to a discharge and permits performance of the SC to be monitored.
2. Recovered (i): Beneficiary who has reached the recovered criteria defined for the programme i.e. complete
recovery from SAM
7
• The majority of beneficiaries reaching the discharge criteria in SC are not recovered . The recovered
category in SC can be used only for:
• The very few beneficiaries who remain in SC until full recovery; these cases are exceptional
• Infants <6 months successfully discharged as recovered (see reference guidelines in Annex 16)
3. Death (j): Beneficiary who died from any cause while registered in the programme.
4. Defaulter (k+l): Beneficiary who is absent for two consecutive weighings, i.e. on day 3.
• As for OTP, active absentee tracing should be organised as soon as the absence of a beneficiary is
noticed, not waiting until the beneficiary becomes a defaulter. A home visit should be made to
confirm the outcome (and facilitate re-entry into the programme if possible).
• There are two defaulter categories for advanced users: confirmed and unconfirmed (if outcome is
unknown).
4.1. Defaulter unconfirmed (k): Beneficiary who is absent for two consecutive weighings, i.e. on day 3,
and whose final outcome is not known (since no defaulter tracing was done).
4.2. Defaulter confirmed (l): Beneficiary who is absent for two consecutive weighings (i.e. on day 3) for
whom a home visit has confirmed that the beneficiary is alive and is a ‘true’ defaulter.
• Optional category: Programmes that do not implement home visits for defaulter tracing should not
use this category (and should report defaulters as ‘defaulters unconfirmed’).
If during the home visit:
• The beneficiary decides to re-enter the programme, s/he is re-admitted and the re-admission
classified as above. This beneficiary still counts as a ‘true’ defaulter in the reporting of the
corresponding week/month.
• The beneficiary is found to be dead, to be a ‘true’ defaulter or to have been transferred; the
outcome needs to be corrected in the report.
• The beneficiary is found to be dead, it is important to determine the date of the death: it will be
considered a death in the SC if s/he died within the window period until being considered a
defaulter (3 days). If the beneficiary died outside of these 3 days s/he is considered a defaulter
(confirmed).
5
This term reflects successful completion of treatment in SC but the requirement for ongoing treatment for SAM in OTP.
Child is clinically well and alert, and has appetite to continue treatment based on RUTF.
7
Stabilisation centres typically provide only inpatient treatment for ‘phase 1’ and the ‘transition phase’, i.e. for metabolic
restoration, prevention and treatment of life-threatening conditions and appetite recovery.
6
9
Users wishing to simplify reporting: For those wishing to report defaulters more generally the total number of
defaulters should be reported under column (i) ‘defaulter unconfirmed’.
5. Medical referral (m): Beneficiary who has a serious illness that requires diagnosis and/or treatment
beyond the scope of available nutrition programmes (i.e. SC , OTP, targeted SFP) and is therefore referred to a
higher level health facility / hospital requiring interruption of nutritional treatment by the programme and
continuation by the health facility / hospital. If the nutritional treatment is continued while the beneficiary is
in the higher level health facility / hospital, the beneficiary is not discharged from the programme, and
should not be included in the exit reporting. Optional category
6. Non-response (n): Beneficiary who has not reached discharge criteria after a pre-defined length of time
despite all investigations and transfer options. See chapter 4 and relevant guidelines (see Annex 16) for the
appropriate investigations that should be carried out in these situations (e.g. medical problems, sharing of
rations, etc.).
Users wishing to simplify reporting: For those wishing to report Non-recovery more generally all cases of Medical
referral and Non-response can be added up and filled in the Non-response category (n).
Total Discharges (X): Total number of beneficiaries who were discharged from the SC. This is calculated by
adding together the above exit categories of h, i, j, k, l, m and n.
7. Other (o): This category is included in order to allow reporting of beneficiaries for whom the outcome is
unclear (e.g. because the card was lost), or when it is discovered that a beneficiary was admitted by mistake.
• The number of beneficiaries in this category should always be kept at a minimum and should ideally
equal 0. If ‘other’> 0 then a reason should be given; if no reason has been provided, the situation
should be further explored by the supervisor and appropriate actions taken.
Total Out (Z): Total number of beneficiaries exiting SC: Total discharges + other.
2.2.3 Stabilisation Centre performance indicators
As for OTP, there are two levels of analysis, depending on user priorities, needs and capacities:
Basic level analysis
•
•
•
•
•
•
Promoted to OTP rate
Recovery rate
Defaulter rate
Death rate
Non-recovery rate
Advanced level analysis
Promoted to OTP rate, recovery rate, defaulter rate, death rate
AND
•
•
•
•
•
Medical referral rate
Non-response rate
% defaulters for which actual outcome is unconfirmed
% relapse, % re-admission
Average length of stay
Basic level analysis indicators:
The following indicators correspond to recommended Sphere Minimum Standards:
10
Performance
Indicator
Calculation
Formula
9
Number of beneficiaries promoted to OTP + number of recovered,
[h+i] / X *100
divided by total discharges multiplied by 100
Number of successfully discharged as recovered, divided by total
Recovery rate
i /X *100
discharges multiplied by 100
Number of beneficiaries who died whilst registered in programme,
Death rate
j / X *100
divided by total discharges multiplied by 100
Number of defaulters unconfirmed + number of defaulters confirmed,
Defaulter rate
[k+l] / X *100
divided by total discharges multiplied by 100
Number of medical referrals + number of non-response, divided by total
10
Non-recovery rate
[m+n] / X *100
discharges multiplied by 100
The sum of the five above rates should always be 100% (thus, the denominator ‘total discharges’(X) for the calculation
is the number of promoted to OTP + recovered + death + defaulter unconfirmed + defaulter confirmed + non-response +
medical referral).
Promoted to OTP rate
8
Advance level analysis indicators:
Permits analysis of non-recovery in more detail as follows:
Performance indicator
Medical referral rate
Calculation
Number of SC beneficiaries who are referred outside of the nutrition
programme for medical care and cannot continue nutritional treatment,
divided by total discharges multiplied by 100
Non-response rate
Number of beneficiaries who that are discharged as non-response, divided
by total discharges multiplied by 100
Formula
m / X *100
n / X *100
The sum of the two above rates + promoted to OTP, recovered, death and defaulter rate should always be 100% (thus
the denominator ‘total discharges’(X) for the calculation is the number of promoted to OTP + recovered + death +
defaulter unconfirmed + defaulter confirmed + non-response + medical referral).
And additional indicators:
Indicator
Percentage of
Defaulters for which
actual outcome is
unconfirmed
Percentage of Relapse
Percentage of Readmission
Average Length of
stay (ALS)
Percentage of male
(or female) Total
admissions
How calculated
Formula
Number of defaulters unconfirmed, divided by total defaulters (defaulter
unconfirmed + defaulters confirmed) multiplied by 100
k / [k+l] *100
Number of relapses divided by total admissions multiplied by 100
d / W *100
Number of re-admissions divided by total admissions multiplied by 100
e / W *100
ALS should be calculated for all beneficiaries of same age group (e.g.
children 6-59 months) who are discharged as ‘promoted to OTP’.
Number of Total admissions male (or female) divided by Total admissions
multiplied by 100. This indicator is only calculated for children 6-59
months.
See below
-
Formula of Average Length of Stay (ALS)
8
Used as a measure of those successfully discharged from SC and moved-in to OTP to continue treatment for SAM
Equivalent to Moved-out to OTP; also known as Transfer-out to OTP
10
The rate includes beneficiaries in two categories (non-response and medical referrals), both representing beneficiaries
that did not have a positive nutritional outcome under the treatment received in SC.
9
11
Length of stay is the number of days elapsed between admission and discharge. It is calculated for all beneficiaries
11
‘promoted to OTP’ one by one. Subsequently, the average out of these individual length of stay will be calculated:
Average Length of Stay = Sum of Individual Length of stay (promoted to OTP beneficiaries) – in days / Number of
promoted to OTP beneficiaries
2.3
Outpatient Therapeutic Programme entries, exits and performance indicators
2.3.1
Outpatient Therapeutic Programme entries
Table 5: OTP entries
WFH/BMI
a
New Admissions
MUAC
Oedema
b
c
Relapse
Readmission
Total
Admissions
d
e
W=a+b+c+d+e
Other Entries
Moved in
Other
From SC/OTP
f
g
Total In
Y=W+f+g
1. New admission (a, b, c): Person with Severe Acute Malnutrition (SAM) directly admitted to the programme
because s/he meets the admission criteria and has not been under treatment elsewhere for this episode of
SAM.
• New admissions are separated by criteria of admission: WFH/BMI, MUAC and nutritional oedema (with
cut offs for anthropometric measures according to programme protocol). The user can decide to use
some or all of these categories depending on the criteria used in the programme, this will not affect the
final calculations.
• Convention dictates that when a beneficiary is admitted fulfilling both WFH and MUAC criteria he/she is
reported under WFH. When a beneficiary has nutritional oedema s/he should be recorded only in the
oedema category column whether or not s/he fulfils other criteria for admission.
Users wishing to simplify reporting: For those wishing to report new admissions more generally it is recommended
12
that at least marasmus (identified by WFH and/or MUAC) and kwashiorkor cases (cases with nutritional oedema)
should be kept separate. If all new admissions are reported without disaggregation a decision should be made on
which column should always be filled in (a, b or c).
2. Relapse (d): Beneficiary re-admitted to the programme after having been successfully discharged as
recovered within the last two months (this is a new episode of SAM). Optional category
3. Re-admission (e): Beneficiary re-admitted to the programme within two months after having left it for a
reason that does not include recovery (e.g. after defaulting or non-response or medical referral). Optional
category
Total Admissions (W): Total number of cases starting treatment in an OTP site (sum of new admissions and
relapses and re-admissions).
4. Moved-in from SC/OTP (f): Beneficiary who has been transferred from SC or other OTP to continue
treatment in OTP.
11
The average length of stay for other beneficiaries may be useful: thus the average time dead beneficiaries were in the
programme before death can give an indication of where efforts need to be focused to lower the rates. Here it is also
useful to record the time during the day (night?, early in the morning?).
12
Marasmic kwashiorkor is included under the oedema criteria.
12
•
These beneficiaries are not counted as admissions to the programme as they were already under
treatment (either in SC or other OTP).
5. Other (g): Beneficiary who is admitted to the OTP for reasons unrelated to their nutrition status (not
meeting OTP admission criteria).
• The number of beneficiaries in this category should always be kept to a minimum and should ideally equal
0. If ‘other’> 0 then a reason should be given; if no reason has been provided, the situation should be
explored further by the supervisor and appropriate action taken.
• The ‘other’ category is not counted in Total admissions (because it is not a SAM admission)
Reminder: The ‘other’ category does not relate to beneficiaries who fall outside of the specified treatment group. For
example: the OTP targets children 6-59 months, but older children with SAM are identified at the OTP and the
programme manager permits their entry. In this instance a new treatment group needs to be defined.
Total In (Y): Total number of beneficiaries entering OTP: Total admissions + Other entries (Moved in from
SC/OTP + Other).
2.3.2
Outpatient Therapeutic Programme exits
Table 6: OTP exits
Recovered
Death
h
i
Discharges
Defaulter
Unconfirmed Confirmed
j
k
Non-recovery
Medical
Nonreferral
response
l
m
Total
Discharges
X=h+i+j+k+l+m
Moved-out
OTP
OTP
to SC
to
OTP
n
o
Other
Total Out
p
Z=X+n+o+p
1. Recovered (h): Beneficiary who has reached the discharge criteria of success defined for the programme.
Note that beneficiaries that are discharges from OTP as recovered should be referred to TSFP (if available) for follow up
and admitted in “OTP discharges” (not as a new admission in TSFP).
2. Death (i): Beneficiary who died from any cause while registered in the programme.
• Where a beneficiary dies during transit from OTP to SC, the death should be recorded as death
within the programme and reported as death in OTP.
• Deaths do not usually occur at the feeding site. Possible sources of information for the death will
usually be a relative or neighbour. Death should be confirmed by a home visit. Until the death is
confirmed, the beneficiary may be classified as ‘defaulter unconfirmed’.
3. Defaulter (j+k): Beneficiary who is absent for two consecutive weighings e.g. absent at service round three.
• As for TSFP, active absentee tracing should be organised as soon as the absence of a beneficiary is
noticed, not waiting until the beneficiary becomes a defaulter. A home visit should be made to
confirm the outcome (and facilitate re-entry into the programme if possible).
• There are two defaulter categories for advanced users: confirmed and unconfirmed (if outcome is
unknown).
3.1. Defaulter unconfirmed (j): Beneficiary who is absent for two consecutive weighings, and whose
final outcome is not known (since no defaulter tracing was done).
3.2. Defaulter confirmed (k): Beneficiary who is absent for two consecutive weighings, and for whom a
home visit has confirmed that the beneficiary is alive and is a ‘true’ defaulter.
• Optional category: Programmes that do not implement home visits for defaulter tracing should not
use this category and should report defaulters as ‘defaulters unconfirmed’.
13
If during the home visit:
• The beneficiary decides to re-enter the programme, s/he is re-admitted and the re-admission
classified as above. This beneficiary still counts as a ‘true’ defaulter in the reporting of the
corresponding week/month.
• The beneficiary is found to be dead, to be a ‘true’ defaulter or to have been transferred; the
outcome needs to be corrected in the report.
• The beneficiary is found to be dead, it is important to determine the date of the death: it will be
considered a death in the OTP if s/he died within the window period until being considered a
defaulter (3 service rounds). If the beneficiary died outside of these 3 service rounds s/he is
considered a defaulter (confirmed).
Users wishing to simplify reporting: For those wishing to report defaulters more generally the total number of
defaulters should be reported under column (i) ‘defaulter unconfirmed’.
4. Medical referral (l): Beneficiary who has a serious illness that requires diagnosis and/or treatment beyond
the scope of available nutrition programmes (i.e. in targeted SFP or in OTP or SC) and is therefore referred to
a health facility / hospital requiring interruption of nutritional treatment by the programme and continuation
by the health facility / hospital. If the nutritional treatment is continued while the beneficiary is in the health
facility / hospital, the beneficiary is not discharged from the programme, and should not be included in the
exit reporting. Optional category
5. Non-response (m): Beneficiary who has not reached discharge criteria after a pre-defined length of time
(usually 3 or 4 months) despite all investigations and transfer options. See chapter 4 and relevant guidelines
(see Annex 16) for the appropriate investigations that should be carried out in these situations (e.g. medical
problems, sharing of rations, etc.).
Users wishing to simplify reporting: For those wishing to report Non-recovery more generally all cases of Medical
referral and Non-response can be added up and filled in the Non-response category (m).
Total Discharges (X): Total number of beneficiaries who were discharged from the programme. This is
calculated by adding up the above exit categories of h, i, j, k, l and m.
6. Moved-out from OTP to SC (n): Beneficiary who has started treatment in OTP and is moved-out to SC to
continue treatment due to deterioration of his/her nutrition status and/or development of medical
complications.
7. Moved-out from OTP to other OTP (o): Beneficiary who requests transfer to another OTP site to continue
treatment.
13
Moved-out beneficiaries should not be counted as discharges out of the programme as they will continue treatment in
another OTP site or in an SC within the same programme.
8. Other (p): This category is included in order to allow reporting of beneficiaries for whom the outcome is
unclear (e.g. because the card was lost), or when it is discovered that a beneficiary was admitted by mistake.
13
This category is split in two due to the different information they provide and are required in order to improve
performance understanding in the OTP site.
14
•
The number of beneficiaries in this category should always be kept at a minimum and should ideally
equal 0. If ‘other’ > 0 then a reason should be given; if no reason has been provided, the situation
should be further explored by the supervisor and appropriate actions taken.
Total Out (Z): Total number of beneficiaries exiting OTP: Total discharges + moved out + other.
2.3.3 Outpatient Therapeutic Programme performance indicators
As for targeted SFP, there are two levels of analysis, depending on user priorities, needs and capacities:
•
•
•
•
Basic level analysis
Recovery rate
Defaulter rate
Death rate
Non recovery rate
Advanced level analysis
• Recovery rate, defaulter rate, death rate
AND
•
•
•
•
•
•
Medical referral rate
Non-response rate
% defaulters for which actual outcome is not confirmed.
% relapse, % re-admission
% OTP beneficiaries requiring inpatient care
Average weight gain and Average length of stay
Basic level analysis indicators:
The following indicators correspond to recommended Sphere Minimum Standards:
Performance indicator
Calculation
Formula
Number of beneficiaries successfully discharged as recovered, divided by
Recovery rate
h / X *100
total discharges multiplied by 100
Number of beneficiaries who died whilst registered in programme,
Death rate
i / X *100
divided by total discharges multiplied by 100
Number of defaulters unconfirmed + number of defaulters confirmed
Defaulter rate
[j+k] / X *100
divided by total discharges multiplied by 100
Number of medical referrals + number of non-response, divided by total
14
Non-recovery rate
[l+m] / X *100
discharges multiplied by 100
The sum of the four above rates should always be 100% (thus the denominator ‘total discharges’(X) for calculation is
the number of recovered + death + defaulter unconfirmed + defaulter confirmed + non-response + medical referral).
Advance level analysis indicators:
Permits analysis of non-recovery in more detail as follows:
Performance indicator
Calculation
Formula
Number of OTP beneficiaries who are referred outside of the nutrition
Medical referral rate
programme for medical care and cannot continue nutritional treatment,
l / X *100
divided by total discharges multiplied by 100
Total number of beneficiaries who are discharged as non-response,
Non-response rate
m / X *100
divided by total discharges multiplied by 100
The sum of the two above rates + recovered, death and defaulter rate should always be 100% (thus the denominator
14
This rate includes two groups: ‘non-response’ and ‘medical referral’. Together they represent beneficiaries who have
not sufficiently responded to treatment to be cured/ recovered.
15
‘total discharges’ (X) for calculation is the number of recovered + death + defaulter unconfirmed + defaulter
confirmed + non-response + medical referral).
And additional indicators:
Performance indicator
Percentage of
Defaulters for which
actual outcome is
unconfirmed
Percentage of Relapse
Percentage of Readmission
Percentage OTP
beneficiaries requiring
inpatient care
Average weight gain
(AWG) and Average
length of stay (ALS)
Percentage of male
(or female) Total
admissions
Calculation
Formula
Number of defaulters unconfirmed divided by total defaulters
(defaulter unconfirmed + defaulters confirmed) multiplied by 100
k / [j+k] *100
Number of relapses, divided by total admissions multiplied by 100
d / W *100
Number of re-admissions divided by total admissions multiplied by 100
e / W *100
Number of children moved-out to SC, divided by total number of
discharges, plus all moved-outs, multiplied by 100
n / [X+n+o] *100
These indicators can be calculated for all beneficiaries of the same age
group (e.g. children 6-59 months) who are discharged as recovered,
although calculations made on a random sample of at least 40
beneficiaries may provide a good estimate. These indicators are
calculated for marasmus and kwashiorkor separately.
Number of Total admissions male (or female) divided by Total
admissions multiplied by 100. This indicator is only calculated for
children 6-59 months.
See below
-
Formula of Individual and Average Weight Gain (AWG)
Weight gain is calculated as the difference in weight on day of entry to the programme
programme for recovered beneficiaries one by one (in gram/kg/day):
15
until discharge from the
Individual weight gain = [W 2 - W1 / W] / T (in gram/kg/day)
W = Weight in kg on the day of entry to the programme (for Kwashiorkor cases day of minimum weight)
W1 = Weight in grams on day of entry to the programme (for Kwashiorkor cases day of minimum weight)
W2 = Weight in grams the day of discharge from the programme
T = Number of days elapsed between W1 and W2
Subsequently, the average out of these individual weight gains will be calculated:
Average weight gain = Sum of individual weight gains (gram/kg/day) / Total number of beneficiaries
Formula of Average Length of Stay (ALS)
Length of stay is the number of days elapsed between admission and discharge. It is calculated for recovered
16
beneficiaries one by one. Subsequently, the average out of these individual length of stay will be calculated:
Average Length of Stay = Sum of Individual Length of stay (recovered beneficiaries) – in days / Number of recovered
beneficiaries
15
For Kwashiorkor cases use the day of minimum weight; that means after oedema has subsided.
The average length of stay for other beneficiaries may be useful: thus the average time dead beneficiaries were in the
programme before death can give an indication of where efforts need to be focused to lower the rates. Here it is also
useful to record the time during the day (night? early in the morning?).
16
16
2.4
Targeted Supplementary Feeding Programme entries, exits and performance indicators
2.4.1
Targeted Supplementary Feeding Programme entries
Table 7: Targeted SFP entries
New Admissions
WFH/ BMI
MUAC
Relapse
a
b
c
Re- admission
Total
Admissions
d
W=a+b+c+d
Other Entries
Moved in from
Other
other tSFP sites
e
f
Total In
Y=W+e+f
1. New admission (a, b): Beneficiary with Moderate Acute Malnutrition (MAM) directly admitted to the
programme because he/she meets the admission criteria and is not under treatment elsewhere for this
episode of MAM
• New admissions are separated by criteria of admission: WFH/BMI and MUAC (with cut offs according to
programme protocol). The user can decide to use one or all of these categories depending on the criteria
used in the programme, this will not affect the final calculations.
• Convention dictates that when a beneficiary is admitted fulfilling both for WFH and MUAC criteria he/she
is reported under WFH only.
WFH/BMI and MUAC categories can also be joint to one category in case the programme does not want to
distinguish between WFH/BMI and MUAC admissions.
2. Relapse (c): Beneficiary re-admitted to the programme after having been successfully discharged as
recovered within the last two months (this is a new episode of MAM). Optional category
3. Re-admission (d): Beneficiary re-admitted to the programme within two months after having left it for a
reason that does not include recovery (e.g. after defaulting, medical referral, non-response, transfer to
therapeutic programme). Optional category
Total Admissions (W): Total number of cases starting treatment in a targeted SFP site (sum of new
admissions and re-admissions).
4. Moved-in from other targeted SFP sites (e): Beneficiary that has been moved from one targeted SFP site
to another to continue treatment.
• These beneficiaries are not counted as admissions to the programme as they were already under
treatment in another targeted SFP site. They are counted in order to capture the total programme
caseload, which is necessary for ordering rations and for other programme planning purposes.
5. Other (f): Beneficiary that is admitted to the targeted SFP for reasons unrelated to their nutrition status
(not meeting targeted SFP admission criteria).
• The number of beneficiaries in this category should always be kept to a minimum and should ideally equal
0. If ‘other’> 0 then a reason should be given; if no reason has been provided, the situation should be
explored further by the supervisor and appropriate action taken.
• The ‘other’ category is not counted in Total admissions (because it is not a MAM admission)
Reminder: The ‘other’ category does not relate to beneficiaries who fall outside of the specified treatment group. For
example: the targeted SFP targets children 6-59 months, but older children with MAM are identified at the SFP and the
programme manager permits their entry. In this instance a new treatment group needs to be defined.
Total In (Y): Total number of beneficiaries entering targeted SFP: Total admissions + Other entries (Moved in
from other tSFP sites + Other).
17
2.4.2
Targeted Supplementary Feeding Programme exits
Table 8: Targeted SFP exits
Recovered Death
g
h
Discharges
Defaulter
Unconfirmed Confirmed
i
J
Total
Discharges
Non-recovery
Medical
Non- Transfer
referral response to TFP
X=g+h+i+j+k+l+m
k
l
m
Moved-out
to other
tSFP
Other
o
p
Total
Out
Z=X+o+p
1. Recovered (g): Beneficiary who has reached the discharge criteria of success defined for the programme17.
2. Death (h): Beneficiary who died from any cause while registered in the programme.
• Deaths do not usually occur at the feeding site. Possible sources of information for the death will
usually be a relative or neighbour. Death should be confirmed by a home visit. Until the death is
confirmed, some programmes may classify the beneficiary as ‘defaulter unconfirmed’.
3. Defaulter (i+j): Beneficiary who is absent for two consecutive weighings, e.g. absent at service round three.
• Active absentee tracing should be organised as soon as the absence of a beneficiary is noticed, not
waiting until the beneficiary becomes a defaulter. A home visit should be made to confirm the
outcome (and facilitate re-entry into the programme if possible).
• There are two defaulter categories for advanced users: confirmed and unconfirmed (if outcome is
unknown).
3.1. Defaulter unconfirmed (i): Beneficiary who is absent for two consecutive weighings, and whose
final outcome is not known (since no defaulter tracing was done).
3.2. Defaulter confirmed (j): Beneficiary who is absent for two consecutive weighings, and for whom
a home visit has confirmed that the beneficiary is alive and is a ‘true’ defaulter.
• Optional category: Programmes that do not implement home visits for defaulter tracing should
not use this category and should report defaulters as ‘defaulters unconfirmed’.
If during the home visit:
• The beneficiary decides to re-enter the programme, s/he is re-admitted and the re-admission
classified as above. This beneficiary still counts as a ‘true’ defaulter in the reporting of the
corresponding week/month.
• The beneficiary is found to be dead, to be a ‘true’ defaulter or to have been transferred; the
outcome needs to be corrected in the report.
• The beneficiary is found to be dead, it is important to determine the date of the death: it will be
considered a death in the targeted SFP if s/he died within the window period until being
considered a defaulter (3 service rounds). If the beneficiary died outside of these 3 service
rounds s/he is considered a defaulter (confirmed).
Users wishing to simplify reporting: For those wishing to report defaulters more generally the total number of defaulters
should be reported under column (i) ‘defaulter unconfirmed’.
4. Medical referral (k): Beneficiary who has a serious illness that requires diagnosis and/or treatment beyond
the scope of available nutrition programmes (i.e. in targeted SFP or in OTP or SC) and is therefore referred to
a health facility / hospital requiring interruption of nutritional treatment by the programme and continuation
by the health facility / hospital. If the nutritional treatment is continued while the beneficiary is in the health
facility / hospital, the beneficiary is not discharged from the programme, and should not be included in the
exit reporting. Optional category
17
This is referred to as “cured”, “nutritionally recovered” or “discharged successfully” in different guidelines.
18
5. Non-response (l): Beneficiary who has not reached discharge criteria after a pre-defined length of time
(usually 3 or 4 months) despite all investigations and transfer options. See chapter 4 and relevant guidelines
(see Annex 16) for the appropriate investigations that should be carried out in these situations (e.g. medical
problems, sharing of rations, etc.).
6. Transfer to therapeutic programme (m): Beneficiary who is referred to a therapeutic feeding programme
(OTP or SC) after deterioration of his/her nutritional status and development of severe acute malnutrition
(SAM). Optional category
Users wishing to simplify reporting: For those wishing to report Non-recovery more generally, all cases of Medical
referral, Non-response and Transfer to therapeutic programme can be added up and filled in the Non-response
category (l).
Total Discharges (X): Total number of beneficiaries who were discharged from the programme. This is
calculated by adding up the above exit categories of g, h, i, j, k, l and m.
7. Moved-out to other tSFP site (o): Beneficiary who requests transfer to another targeted SFP site to
continue treatment.
• These beneficiaries are not counted as discharged as they continue treatment in the programme. They are
counted to capture the total programme caseload, which is necessary for ordering rations and for other
programme planning purposes.
8. Other (p): This category is included in order to allow reporting of beneficiaries for whom the outcome is
unclear (e.g. because the card was lost), or when it is discovered that a beneficiary was admitted by mistake.
• The number of beneficiaries in this category should always be kept at a minimum and should ideally
equal 0. If ‘other’> 0 then a reason should be given; if no reason has been provided, the situation
should be further explored by the supervisor and appropriate actions taken.
Total Out (Z): Total number of beneficiaries exiting targeted SFP: Total discharges + moved-out + other.
2.4.3
Targeted Supplementary Feeding Programme performance indicators
There are two levels of analysis, depending on user priorities, needs and capacities:
Basic level analysis
•
•
•
•
19
•
Recovery rate
Defaulter rate
Death rate
Non-recovery rate
Advanced level analysis
Recovery rate, defaulter rate, death rate
AND
•
•
•
•
•
•
•
Medical referral rate
Non-response rate
Transfer to therapeutic programme rate
% relapse, % re-admissions
% Defaulter for which actual outcome is unconfirmed
% Beneficiaries requiring TFP treatment
Average weight gain and Average length of stay
Basic level analysis indicators:
The following indicators correspond to recommended Sphere Minimum Standards:
Performance indicator
Calculation
Formula
Number of beneficiaries successfully discharged as recovered, divided by
Recovery rate
g / X *100
total discharges, multiplied by 100
Number of beneficiaries who died whilst registered in programme,
Death rate
h / X *100
divided by total discharges, multiplied by 100
Number of defaulters unconfirmed + number of defaulters confirmed
18
Defaulter rate
[i+j] / X *100
divided by total discharges multiplied by 100
Number of medical referrals + number of non-response + number of
19
Non-recovery rate
transfers to therapeutic programme, divided by total discharges
[k+l+m] / X *100
multiplied by 100
The sum of the four above rates should always be 100 % (thus the denominator ‘total discharges’ (X) for calculation is
the number of recovered + death + defaulter unconfirmed + defaulter confirmed + non-response + medical referral +
transfer to therapeutic programme).
Advanced level analysis indicators:
Permits analysis of non-recovery in more detail as follows:
Performance indicator
Medical referral rate
Non-response rate
Calculation
Number of targeted SFP beneficiaries who are referred outside of the
nutrition programme for medical care and cannot continue nutritional
treatment, divided by total discharges multiplied by 100
Number of beneficiaries who are discharged for non-response divided by
total discharges multiplied by 100
Formula
k / X *100
m / X *100
Transfer to
Number of transfers to therapeutic programme (OTP or SC) divided by
therapeutic
l / X *100
total discharges multiplied by 100
programme rate
The sum of the three above rates + recovered, death and defaulter rates should always be 100 % (thus the
denominator ‘total discharges’(X) for calculation is the number of recovered + death + defaulter unconfirmed +
defaulter confirmed + non-response + medical referral + transfer to therapeutic programme.
And additional indicators:
Performance indicator
Percentage of
defaulters for which
actual outcome is
unconfirmed
Percentage of relapse
Percentage of readmissions
Percentage of
beneficiaries requiring
TFP treatment
18
Calculation
Formula
Number of defaulters unconfirmed divided by total defaulters (defaulters
unconfirmed + defaulters confirmed) multiplied by 100
i / [i+j] *100
Number of relapse divided by total admissions multiplied by 100
c /X *100
Number of re-admissions divided by total admissions multiplied by 100
d /X *100
Number of Transfer to TFP divided by total number of discharges
multiplied by 100
m / X *100
This rate includes two groups: ‘defaulters confirmed’ and ‘defaulters non-confirmed’. It corresponds to the ‘defaulter
rate’ in the Sphere Minimum Standards. This rate is complemented by the ‘percentage of defaulters for which actual
outcome is non-confirmed’ where this can be calculated.
19
This rate includes three groups: ‘non-response’, ‘medical referral’, ‘transfer to therapeutic feeding programme’.
Together they represent beneficiaries who did not have sufficiently responded to treatment to be cured/ recovered.
20
Average Weight Gain
(AWG) and Average
Length of stay (ALS)
These can be calculated for all beneficiaries of same age group (e.g.
children 6-59 months) who are discharged as recovered, though
calculations made on a random sample of at least 40 beneficiaries may
provide a good estimate.
See below
Formula of Individual and Average Weight Gain (AWG)
Weight gain is calculated as the difference in weight on day of entry to the programme until discharge from the
programme for recovered beneficiaries one by one (in gram/kg/day):
Individual weight gain = [W 2 - W1 / W] / T (in gram/kg/day)
W = Weight in kg on the day of entry to the programme
W1 = Weight in grams on day of entry to the programme
W2 = Weight in grams the day of discharge from the programme
T = Number of days elapsed between W1 and W2
Subsequently, the average out of these individual weight gains will be calculated:
Average weight gain = Sum of individual weight gains (gram/kg/day) / Total number of beneficiaries
Formula of Average Length of Stay (ALS)
Length of stay is the number of days elapsed between admission and discharge. It is calculated for recovered
20
beneficiaries one by one. Subsequently, the average out of these individual length of stay will be calculated:
Average Length of Stay = Sum of Individual Length of stay (recovered beneficiaries) – in days / Number of recovered
beneficiaries
2.5
OTP discharges in TSFP entries, exits and performance indicators
Beneficiaries that have been discharged from OTP and are admitted to targeted SFP for treatment
consolidation (OTP discharges) are separately reported from regular TSFP entries. OTP discharges receiving
the same nutritional care as MAM case admitted, however, reporting on these beneficiaries separately
prevents distortion of TSFP recovery rate (by excluding beneficiaries leaving the programme and meeting the
‘recovered’ criteria if they were not necessarily malnourished when admitted to the programme).
The separation of OTP discharges from other TSFP admissions improves the analysis of targeted SFP
performance indicators, as recommended by Sphere 2011.
2.5.1
OTP discharges in TSFP entries and exits
Table 9: OTP discharges in TSFP entries and exits
New
beneficiaries
a
20
Completed
programme
b
Dropouts
c
Referral to
TFP
d
Death
Other
Total Out
e
f
X=b+c+d+e+f
The average length of stay for other beneficiaries may be useful: thus the average time dead beneficiaries were in the
programme before death can give an indication of where efforts need to be focused to lower the rates. Here it is also
useful to record the time during the day (night? early in the morning?).
21
1. New beneficiaries (a): The number of beneficiaries entering the programme for fulfilling the programme
admission criteria.
2. Completed the programme (b): The number of beneficiaries who completed the treatment, as determined
in the programme protocol, and that were instructed not to return again.
3. Dropouts (c): The number of beneficiaries who were expected during the reporting period who did not
show up to the distribution for 2 consecutive service days.
4. Referrals to TFP (d): The number of beneficiaries who were referred for treatment to OTP or SC21.
5. Death (e): Beneficiary who died from any cause while registered in the INS.
6. Other (f): This category is included in order to allow reporting of beneficiaries for whom the outcome is
unclear (e.g. because the card was lost), or when it is discovered that a beneficiary was admitted by mistake.
• The number of beneficiaries in this category should always be kept at a minimum and should ideally
equal 0. If ‘other’> 0 then a reason should be given; if no reason has been provided, the situation
should be further explored by the supervisor and appropriate actions taken.
Total Out (X): Total number of beneficiaries exiting INS: Completed the programme + drop outs + deaths +
other.
2.5.2 OTP discharges in TSFP performance indicators
There are no standard performance indicators as there are for targeted SFP. However, the indicators
presented below might help in monitoring the treatment outcomes of the beneficiaries followed up in this
part of targeted SFP.
Performance indicator
Completed rate
Calculation
Number of beneficiaries who completed the programme divided by Total
Out multiplied by 100
Formula
b / X *100
Drop out rate
Number of drop outs divided by Total Out multiplied by 100
c / X *100
Referral to TFP rate
Number of referrals to TFP divided by Total Out multiplied by 100
d / X *100
21
Note that no referrals from OTP discharges to tSFP are necessary as OTP discharges is a reporting category under tSFP
and beneficiaries already receive the same treatment. The use of action protocols is recommended for any case
loosing weight in OTP discharges.
22
SUGGESTIONS ON NARRATIVE REPORTS
Each organisation has its own narrative reporting requirements. The information and level of detail required
will also be different depending on the period of the report (e.g. monthly or final report) and its audience
and purpose (e.g. for internal programme management, for the donor, etc.).
The following general rules apply when writing reports and quoting statistics from programmes:
•
Present the summary site report for the current reporting period in the main text or as an appendix
(example below, is from the CMAM Report software).
•
Present a graph showing the monthly evolution of entries/exits over time from the beginning of the
intervention (or at least the previous year if it is a long term programme) and current caseload (see
example below).
23
•
Present a graph showing the monthly evolution of performance indicators over time from the beginning
of the intervention (or at least the previous year if it is a long term programme). This will allow visual
representation of statistical trends (see example below).
•
State the objectives of the programme for the reporting period (Sphere indicators) and give reasons in
case they were not achieved. Describe the activities performed during the period and the main incidents
that may have affected programme performance, both positive and negative.
•
Define objectives for the subsequent period and define activities to achieve them.
•
Always include context information to describe the programme and aid interpretation of the programme
performance indicators. Include the summary table showing programme and context characteristics as
an appendix. In more comprehensive reports this can be developed in the text.
Additional recommendations:
1. Never mix treatment groups in the calculation of programme performance indicators. When
reporting information on any indicator, always specify the treatment group to which it refers.
2. When reporting percentages in the text (e.g. recovery rates), always quote the numerator and
the denominator, e.g. recovery rate of 86.4% (133/154).
3. When reporting population based data (e.g. SAM rates from a survey), always quote confidence
intervals. The survey/coverage summary table (from the MRP software) can be inserted as an
appendix to the report including more details about the survey.
4. When reporting population based malnutrition rates, always explain which measure of
malnutrition was used (e.g. weight-for-height against the WHO standards, MUAC, etc.), and if
possible, the source (e.g. a survey, a surveillance system, a rapid assessment, etc.).
24
GUIDANCE ON INTERPRETING PROGRAMME PERFORMANCE INDICATORS
Timely and correct interpretation of indicators is essential to highlight problems and allow appropriate and
timely decision making and action. The following are general rules when interpreting indicators:
4.1
•
•
•
•
•
4.2
General rules when interpreting indicators
In general, emergency feeding programmes should demonstrate high coverage and recovery rates
combined with low default and death rates in order to be called effective.
Programme performance indicators should always be interpreted in relation to each other and with
other programme characteristic and contextual information.
Trends of performance indicators should be followed through graphs plotting change over time
In situations where targets are not met an explanation must be sought and reported. When offering a
potential ‘explanation’ it is important that this information has been validated (not just simply based
on perceptions of the staff or a single informant). Explanations should always be supported by
evidence. If possible, it is important to explain what other potential explanations were considered and
why they were rejected.
The need for special investigations to better understand the programme and how it could be improved
should always be considered e.g. surveys, re-analysis of data, focus group discussions with caretakers,
special supervision of activities, adhoc data collection, etc.
Sphere Minimum Standards
Sphere Minimum Standards include performance indicator targets for supplementary and therapeutic
feeding programmes. These standards specify the “minimum levels to be attained in humanitarian response”
for nutrition interventions and act as benchmark for their performance. Apart from the Sphere Minimum
Standards indicators (recovered, died, defaulted, non-recovered), other indicators exist that give useful
information to judge how well a programme is implemented and whether action should be taken to improve
the programme quality. The indicators suggested in Section 2 are labelled as ‘optional’ and ‘additional’
indicators. Guidance is provided here on how to interpret Sphere Minimum Standards and these extra
indicators, along with suggestions for action in cases where indicator targets are not met.
Table 10 below summarises the Sphere Minimum Standard indicators defined in section 2.
Table 10: Sphere minimum standards for performance indicators
Indicator
Indicator of…
Performance indicators
• Recovered %
• Quality of care
• Death %
• Quality of care
• Defaulter %
• Accessibility, acceptability
• Non-recovered %
• Average length of stay (ALS) • Quality of care (medical and diet)
Average weight gain (AWG)
• SC until full recovery
• Quality of care (medical and diet)
• Outpatient (SC and/or OTP)
Coverage
• Camp
• Acceptability, accessibility
• Urban
• Rural
22
SC and OTP
> 75%
22
< 10%
< 15%
-
Targeted SFP
> 75%
< 3%
< 15%
-
45 – 60 days
60 days
8 g/kg/d
>4 g/kg/d
>3g/kg/d
> 90%
> 70%
> 50%
> 90%
> 70%
> 50%
Experience has shown that death rate in OTP is much less than then Sphere target of 10%, therefore the MRP
software will flag any rate more than 3%.
25
Entries and exits
• Total number of
beneficiaries registered
• Admissions and exits
• Re-admissions
• Readmission after recovery
4.3
• Nutrition situation evolution
• Trends in food security
• Workload and size of programme
< 5%
< 5%
Acting on substandard Sphere Minimum Standards
When indicators do not meet standards and signal a need for action, the following questions might be asked
to seek for quality improvement of the programme:
Table 11: Questions to ask when indicators do not meet standards
Indicator of… (Refer to Table 11 above)
Quality of care
• Staff: Is there enough staff, also at night in SC? Well trained? High workload? Sufficiently
(medical and
qualified? Staff attitude with beneficiaries and caregivers?
nutritional)
• Nutrition protocols: Are they correct? Do staff follow protocols adequately (phases and
timing, recipes and amounts, day/night, food intake monitored,
• Environment: Is it overcrowded/poor (exposure to cross infection medical treatment
etc.)?
• Shortage of food products and/or drugs, accurate measurement/equipment?
• Failure to monitor clinical status, to diagnose associated or complicated conditions?
• Inappropriate selection of beneficiaries to go directly to OTP? Appetite test carried out?
Access and
• Active case finding and referral done by MUAC but admission through WFH (caretakers
acceptability
de-motivated when child not admitted)? Inadequate explanations/encouragement
given?
• Long stay in SC leading to high opportunity cost for the family?
• Do caretakers properly understand programme objectives and treatment (duration,
number of meals or sachets and amounts per day, no sharing of foods etc.)?
• Referral system not adapted/non existing/not enough time devoted for adapted
explanations to caregivers?
• Long distances to site, long waiting time at the site: programme not decentralized
enough?
• SC: overcrowding, high cross infection risk?
• Weak community mobilization, no outreach programme (active case finding)?
Nutrition situation
• Household food insecurity: ration sharing, stealing, selling etc?
evolution and related
• Major events affecting the programme e.g. Drought, failure of harvest?
factors affecting
• Displacement, movements, security etc.?
nutrition
• Outbreak of diseases?
4.4
Single indicator guidance – Performance indicators
Performance indicators defined by Sphere are the percentages of recovered, death, defaulter and nonrecovered.
They:
• Provide information on the proportion of beneficiaries completing the treatment successfully or unsuccessfully.
• Are interdependent (all four add up to 100%) and should be interpreted in relation to each other and
with other information
• Are difficult to interpret during the first 2 months after the opening of the programmes as there are no
recovered beneficiaries yet and therefore the percentage of deaths and defaulters are usually high.
26
The following lists performance indicators and guides on their interpretation:
A. Recovery rate
Any recovery rate below 75% needs to be investigated. As this rate is interlinked with the other performance
indicators, reasons for low recovery rate might be found in high defaulter and/or death and/or non-recovery
rates. Please refer to sections below for actions to be taken.
B. Death rate
Any high death rate needs to be investigated. It is important to look at the day (after admission) and hour
(day or night) of death as well as the causes. Be aware that the proportion of death tends to be underestimated as death often occurs amongst defaulters, especially in rural areas where defaulter tracing is
difficult.
Possible reasons for high death rate (see also Table 12):
• Late identification of malnutrition and/or late presentation at treatment site
• Low quality of care in SC - unqualified staff, inadequate night care, inadequate treatment /action
protocols
• Limited capacity of staff – unable to identify medical complications in OTP/targeted SFP
• Lack of referral options, slow referral, refusal of referral to SC
Routine compilation of information on reasons for death can help to identify problems with treatment and
protocols and can highlight where training and supervision are needed.
C. Defaulter rate
Defaulters are beneficiaries that leave the programme before they have fully recovered from malnutrition,
thus they are still at high risk of mortality. A high defaulter rate shows the inability of the programme to
retain beneficiaries, therefore, it is extremely important to assess why beneficiaries leave the programme
and if they return, why.
Possible reasons for high defaulter rate:
• Access problems - programme not decentralised enough, poor staff behaviour with caretakers, high
household opportunity costs at certain times of the year.
• Misunderstanding of programme goals and the nutritional treatment provided - caretaker does not
understand the length and aim of treatment or was not told by staff.
• Absentee tracing is not implemented by the programme – beneficiaries that miss a service day are not
followed up and might become a defaulter.
• Perception of inadequate quality of care.
• Displacement/movement to other areas.
• Staff admits beneficiaries from areas beyond the feeding site’s catchment area.
Suggested action: Reasons for default should be collected either by outreach workers/volunteers and/or
through focus group discussions in the community. This will help to identify trends in defaulting and
adjustments to the programme that should be considered (e.g. the need to open new sites to facilitate
access23) and to promote malnourished beneficiaries to continue nutritional treatment.
Due to the high mortality risk associated with OTP beneficiaries, active absentee tracing should be
implemented (it’s important not to wait until the beneficiary becomes a defaulter).
C.1 Percentage of Defaulters for which outcome is unconfirmed
This indicator shows how effectively defaulter tracing is implemented by the programme. A high percentage
23
Sphere Minimum Standard: more than 90% of the target population is within less than one day´s return walk
(including time for treatment) of the programme site.
27
shows that few defaulters are visited at their home, thus, it is an indicator of the quality of home visiting.
When this percentage is high, the defaulter rate should be questioned24, and further investigations are
needed. Tracing of defaulters is important in order to understand reasons for defaulting (e.g. family
moved/displaced), verify true outcomes (child died, child admitted in other health facility) and possibly
convince beneficiaries to return to the programme to continue treatment.
Suggested action: Among other actions, implement active absentee and defaulter tracing and report
accordingly: this will enable reporting on defaulter confirmed and defaulter unconfirmed indicators
D. Non-recovery rate
This rate is an indicator of the underlying causes of malnutrition. It could point out problems such as TB/HIV,
sharing of food in the household or general household food insecurity. For example, a high rate can indicate
the need for advocacy for Food Assistance (GFD, cash or vouchers), referral programme gaps, as well as the
need for stronger links with other sectors (TB programmes, Food security and livelihood programmes, WASH
initiatives).
However, non-recovery rate is a composite indicator 25 and thus provides limited information on the
underlying reasons for high non-recovery rates. It is therefore recommended that each component of the
non-recovery rate be analysed separately to understand why beneficiaries do not recover from malnutrition
whilst in the programme:
C.1 Non-response rate
When the number of cases in this
category is high it may indicate
underlying problems related to the
beneficiary (e.g. chronic disease,
sharing of rations, beneficiary refuses
to eat ration) or to the programme
(see Table 12 Quality of care), that
results in the beneficiary not gaining
weight or stagnant weight, e.g. due to
the lack of individual monitoring.
Non-response should be very low if
26
action protocols are followed
Suggestion: Staff needs to investigate
beneficiary that do not gain body
weight or increase in MUAC as
expected. Staff should follow the
action protocols (for guidance on
action protocols see FANTA or Valid
manuals in Annex 16)
24
C.2 Medical referral rate
Serious medical illness and/or medical
complications that cannot be
diagnosed/treated in the programme
and need external specialised care
outside CMAM.
C.3 Transfer to TFP rate
High rates can point to low quality
of care by programme or outbreak
of diseases, e.g. malaria.
Medical referrals in targeted SFP and
OTP are uncommon if there is a
referral SC, as usually beneficiaries
are first referred to SC.
Suggestion: Follow the action
protocols. Consider stronger link to
HIV/
TB
programmes
and/or
improvement of quality of care
amongst staff (see Table 12).
Suggestion: Consider improvement
of quality of care amongst staff (see
Table 12).
If defaulters are not traced and their reason for defaulting is not confirmed it is possible that some defaulters could
actually have died, thus the defaulter rate might mask the death rate.
25
In targeted SFP it summarizes non-response rate, medical referral rate and transfer to TFP rate. In OTP/SC it
summarises non-response rate and medical referral rate.
26
Most cases of non-response should be referred for further diagnosis/treatment outside the programme and hence be
classified as medical referrals.
28
4.5
Single indicator guidance - Additional indicators
A. Coverage
Coverage indicates how many of the beneficiaries in need of treatment are taking part in the programme.
Coverage provides information on awareness, acceptability and accessibility of the programme and thus
aiding impact assessment. Coverage should be estimated by a population based coverage survey (e.g.
SQUEAC or CSAS); nutrition surveys are not particularly good tools for assessing coverage (especially for SAM
treatment as the sample is usually too small) but can give useful indirect estimates. Note that coverage
information is not collected routinely but can be calculated by indirect means (Annex 16).
Factors affecting coverage include:
• Awareness and perception of malnutrition
• Awareness and perception of the feeding programme (positive/negative feedback from community
members who attend the programme)
• Distance of treatment site from home and transportation means/costs to the treatment site
• Time/priority for other work
• Security
• Relationship between staff and beneficiaries
• High opportunity cost for beneficiaries or caregivers
• Social environment
• Availability of food and nutrition products at health facility (pipeline)
Suggested action: Among others factors, consider improvement of community awareness on malnutrition
and the programme, decentralise programme as much as possible, build staff/beneficiary relationships
(positive feedback)
B. Average weight gain (AWG) and Average length of stay (ALS)
The programme goal is to treat beneficiaries as quickly as possible and with maximal weight gain. AWG and
ALS share an inverse relationship (if AWG is low ALS is high).
Factors that negatively influence AWG and ALS:
• Poor quality of medical and/or nutritional care
• Low quantities of food received or consumed (issue of sharing or stealing)
• Low quality/care of preparation of therapeutic foods (dilution, recipes...)
• High levels of food insecurity in the area
• High number of Kwashiorkor cases
• High proportion of chronic diseases
• High absentee rate
• Discharges not given on time
Suggested action: Among other factors, consider improvement of quality of care amongst staff (Table 12),
make sure that absentees are traced and return to the programme, and that beneficiaries are discharged on
the same day that the exit criteria are reached.
C. Admissions
Trends in the number of admissions provide information on the general food and nutritional situation as well
as on the development of the programme over time. If possible, admission numbers should be compared to
the same month in the previous year (e.g. March 2012 with March 2011) keeping in mind food security
patterns (hunger gaps) 27 and possible changes in the catchment area. Furthermore, disease patterns (malaria
27
Usually the food security situation changes over the year with higher food insecurity just before harvest time and
lower food insecurity in post-harvest months. Malnutrition rates generally rise and fall according to this pattern,
29
season or ARI season) might have an impact on admission numbers. Admission numbers are used for
planning (e.g. number of feeding sites, food quantity, human resources, workload, etc.), lobbying/advocacy
and to verify that targets were reached. Additionally, categorising admissions by gender or criteria can
identify differences in the types of malnutrition.
Factors that can increase admission rates:
• Increased awareness by the population (especially for a new programme or after home visitor
component is implemented) and/or increased confidence in the programme
• Improved security (people are free to move)
• Increased burden of diseases and/or increased food insecurity
• Regular community/mass screening for malnutrition
C.1 Relapse
A record of relapse rates can help programme implementers to understand the general food security
situation in the area and can point to other underlying causes of malnutrition e.g. disease, inadequate
feeding and child care practices and others.
Reasons for high relapse rate:
• Low food security situation at household level; beneficiaries lose weight again, leading to a new episode
of malnutrition soon after recovery
• Beneficiaries may have been discharged from the programme too early.
Suggested action: Among other factors, consider interventions at the household level to increase food
security for vulnerable groups e.g. by linking discharged beneficiaries to Food Security and Livelihoods (FSL)
programmes directly. Advocate for additional assistance (GFD, cash, vouchers).
C.2 Readmission
Comparing numbers of defaulters and medical referrals will give an insight into how many beneficiaries
return to the programme. This is also an indicator of how effectively defaulter tracing is done.
Suggested action: Among other factors, improve defaulter tracing.
D. Percentage of male and female total admissions
This indicator can highlight gender imbalance thus showing if either gender is over- or under-represented in
total admissions to the programme. Any percentages that fall outside of the normal range of males and
females (44.5% - 55.5%28) should be investigated. Questions that should be asked include; Do both sexes
have the same access to treatment? Is one gender discouraged to seek treatment? Are males more
vulnerable to malnutrition than females (cultural norms), or vice versa?
E. Attendance rate29
This is the percentage of beneficiaries admitted to the programme that actually attend the programme on
each service day or each month. It gives information on acceptability and accessibility and helps in the
interpretation of outcome indicators. Data for attendance can be obtained from registration books.
Suggested action: Due to the high mortality risk associated with OTP beneficiaries, active tracing of absentees
should be organised as soon as it is noticed that a beneficiary has not attended a service day (rather than
waiting until the beneficiary becomes a defaulter). A list of absentees can be produced by the Programme
manager and provided to outreach workers in order to perform absentee tracing activities.
with subsequent impact on admission rates of feeding programmes.
Approximated from male/female normal ratio of 0.8-1.2
29
Formula for calculation: Daily/Weekly attendance (in %) = Number of beneficiaries present each distribution /
Number of beneficiaries expected x 100 and for Monthly attendance (in %): Sum weekly attendance / Number of
weeks
28
30
F. Percentage of beneficiaries requiring inpatient care (i.e. moved-in to SC)
This refers to the beneficiaries moved-out from OTP and moved-in to SC due to deterioration of their
nutritional situation and/or medical complications. It is worth noting that beneficiaries ‘moved-out from OTP
to SC’ might include two types of beneficiaries30; those that were transferred on the day of admission
(because they were “complicated-SAM”) which is good OTP practice, AND those who developed
“complicated-SAM” or lost weight after some time at the OTP, which may reflect poor practice at the OTP site.
In order to distinguish between the two types of moved-out, the number of beneficiaries ‘moved-out to SC’
the day of admission must be known. The significance of this indicator is similar to the ‘transfers to TFP’ rate
in targeted SFP.
30
This would depend on programme registration procedures and compliance i.e. whether a SAM case with medical
complications diagnosed at the OTP on the day of admission is directly given a referral slip to be admitted at the SC
or is first admitted and assigned a SAM number at the OTP before being transferred to the SC.
31
ANNEXES
Annex 1 Tools for data collection and reporting
This section describes the main data collection and reporting tools for SC, OTP and targeted SFP. Where
temples already exist these can be adapted to facilitate the improved monitoring and reporting standards
presented in this paper.
Beneficiary cards
Beneficiary cards are used in all three programmes. Standard targeted SFP beneficiary cards can also be used
for beneficiaries admitted under the OTP discharge section in TSFP as the same information is collected.
However, it should be clearly marked on the card that this beneficiary is a OTP discharge beneficiary.
Most organisations and health services use their own beneficiary cards. See Annex 2 for an example of a
targeted SFP beneficiary card from FANTA. Examples of OTP and SC beneficiary cards can be found in manuals
from both FANTA and the WHO31.
The minimum information to record on a card is:
•
•
•
•
•
•
•
•
•
Identification of the beneficiary: unique identification number (for OTP and SC only) (see below), name,
address – in case the beneficiary needs to be visited at home
Age (in months) or date of birth and sex
Anthropometry on admission (weight, height, MUAC)
Criteria used for admission (weight-for-height, oedema, MUAC, BMI, other)
Classification of admission (new admission, relapse, re-admission, etc.)
MUAC and weight for each service day
Anthropometry at discharge (weight, height, weight-for-height, MUAC)
Exit category (Recovered, dead, defaulter, etc.)
Dates of entry and exit from the programme
Cards usually contain additional information that is important for beneficiary management and follow up.
This may include; follow up of height, clinical description of the beneficiary's status, medical treatments
received, vaccination status, breastfeeding status, distribution of non-food items, distance to the feeding site,
dates for visits between admission and discharge.
For SAM beneficiaries, effective tracking between the OTP and SC can be aided by use of ‘unique
identification numbers’32. The unique identification number (also known as “SAM number”) is assigned at
the facility where the beneficiary is first diagnosed and enters into the programme, either the OTP or SC; this
number then stays with the beneficiary throughout their recovery. For targeted SFP a unique identification
number is not recommended.
Registration books
Individual programmes make different decisions about whether or not to maintain a registration book as well
as using beneficiary cards. If registration books are used, when more than one treatment group is admitted
at the feeding site it is advised record each group in separate sections of the registration book (e.g. children
6-59 months on pages 1-40, PLW on pages 41-80, TFP-follow up on pages 81-120). See Annexes 7-10 for
31
Management of the child with a serious infection or severe malnutrition, WHO (2000) downloadable at:
http://whqlibdoc.who.int/hq/2000/WHO_FCH_CAH_00.1.pdf and Training guide for Community-based
Management of Acute Malnutrition, FANTA (2008) downloadable at:
http://www.fantaproject.org/cmam/training.shtml
32
See FANTA or Valid International CMAM guidelines for examples of unique identification systems.
32
model registration books for programme reporting.
The information in the registration books can be used to fill in daily tally sheets and to triangulate
information from other sources to cross check for discrepancies or correct reporting errors.
Tally sheet
At the end of each service day, the feeding site supervisor should compile the reporting for the day in a
standard tally sheet for each treatment group (Annexes 11-13 provide tally sheets). This information can be
obtained directly from the registration book or from the beneficiary cards, if these are kept at the feeding
site. See Annex 14 for instructions on how to complete a tally sheet.
Monthly Site Report
At the end of the month the reporting for each feeding site can be compiled by transferring the totals of the
tally sheet onto a monthly site report sheet, or through direct data entry into a data base, e.g. CMAM Report,
if user capacity and resourcing exists.
33
Annex 2 Beneficiary card targeted SFP, FANTA 2008
Annex 3 Monthly site report template – SC
Cells in white and blue are completed manually. Cells in blue are optional categories and do not have an effect on performance indicator calculations if not used. Cells in yellow are calculated.
Annex 4 Monthly site report template – OTP
Cells in white and blue are completed manually. Cells in blue are optional categories and do not have an effect on performance indicator calculations if not used. Cells in yellow are calculated.
35
Annex 5 Monthly site report template – targeted SFP
Cells in white and blue are completed manually. Cells in blue are optional categories and do not have an effect on performance indicator calculations if not used. Cells in yellow are calculated.
Annex 6 Monthly site report template – OTP discharges in TSFP
36
Annex 7 Registration book - Inpatient Management of Acute malnutrition (SC)
Entry information
Serial Unique
Nb. ID Nb.
Date
Addres
Sex
of Name
s
Entry
Age
W
H
Exit information
WFH Oedema MUAC Type
(sd)
(Y/N) (mm) of Entry
*
Date Type WFH MUAC
Days
of of Exit (zs) (mm)
in SC
exit
**
Remarks
1
2
*Type of Entry: N = new admission; Rl, = relapse; Rad = re-admission; MiO = moved-in from OTP; O = other
**Type of Exit: POTP= promoted to OTP; R = recovered; D= defaulter; X= death; MR = medical referral; NR= non-response; O = other
Days in SC (length of stay): This is to be filled only for beneficiaries that are promoted to OTP to continue SAM treatment AND for those remaining in SC until recovered from
SAM. It is the number of days from Date of Entry until Date of Exit (date when beneficiaries is promoted to OTP or recovered in SC).
Annex 8 Registration book - Outpatient Management of Acute malnutrition (OTP)
Entry information: Visit 1
Exit Information
If recovered
Seri
al
Nb.
Uni
que
ID
Nb.
Date
of
Entry
Name
Address Sex
Age
WFH
W H
(sd)
Oedema MUAC
(Y/N)
(mm)
Type
of
Entry
*
Date
of
exit
Type of
Exit
**
WFH
(sd)
MUAC
(mm)
Days
in
OTP
Weight
on Exit
Attendance
(weekly visits)
Visit
2
Date
..up
to
Visit
12
1
2
Total for attendance
*Type of Entry: N = new admission; Rl, = relapse; Rad = readmission; MiSC = moved-in from SC; O = Other
**Type of Exit: R = recovered; D= defaulter; X= death; MR= Medical referral; NR = non-response; MoSC = moved-out to SC; MoOTP = moved-out to other OTP; O = Other
Days in OTP (length of stay): For recovered beneficiaries only. It is the number of days from Date of Entry until Date of Exit.
Weight on exit: This is the weight on the date of exit for those discharged as recovered.
Attendance/weekly visits: On each service day either 1) you will mark the attendance (X = present; O = absent) or 2) you may want to write down the weight on the day of
the visit (then absent children would be those without the follow up weight in)
Total for attendance: At the end of each page the total of children present should be noted as total: Present / Absent, e.g. 5 / 2
37
Rema
rks
Annex 9 Registration book - Targeted Supplementary Feeding Programme (TSFP)
Entry information: Visit 1
Exit Information
If recovered
Serial
Nb.
Unique
ID Nb.
Date
of
Entry
Name
Address
Sex
Age
W H WFH MUAC
(sd) (mm)
Type
of
Entry
*
Date
of
Exit
Type
of
Exit
**
WFH MUAC
(sd) (mm)
Days
in
tSFP
Weight
on Exit
Attendance
(weekly visits)
Visit
2
Date
Remarks
..up
to
Visit
12
1
2
Total for attendance
*Type of Entry: N = new admission; Rad = re-admission; Rl = relapse; MiSFP = moved-in from other tSFP; O = other
**Type of Exit: R = recovered; D= defaulter; X = death; NR= non-response; MR = medical referral, TTFP = transfer to TFP, MoSFP = move-out to other tSFP; O= other
Days in tSFP (length of stay): For recovered beneficiaries only. It is the number of days from Date of Entry until Date of Exit.
Weight on exit: This is the weight on the date of exit for those discharged as recovered.
Attendance/weekly visits: On each service day either 1) you will mark the attendance (X = present; O = absent) or 2) you may want to write down the weight on the day of
the visit (then absent children would be those without the follow up weight in)
Total for attendance: At the end of each page the total of children present should be noted as total: Present / Absent, e.g. 5 / 2
Annex 10 Registration book – OTP discharges in TSFP
Entry information: Visit 1
Serial
Nb.
Unique
ID Nb.
Date
of
Entry
Name
Address Sex Age Type of
W
Entry
*
H
WFH
(sd)
MUAC
(mm)
Attendance
(weekly visits)
Exit information
Date of
Exit
Type
of Exit
**
W
WFH
(sd)
MUAC
(mm)
Visit
2
Date
Remarks
..up to
Visit 12
1
2
Total for attendance
*Type of Entry: Tfol = TFP follow up; Chr =Chronic disease; PLW = Pregnant lactating women
**Type of exit: C = Completed; D = Dropped out; Ref= Referral; X = Death; O = other
Attendance/visits: On each service day either 1) you will mark the attendance (X = present; O = absent) or 2) you may want to write down the weight on the day of the visit
(then absent children would be those without the follow up weight in)
Total for attendance: At the end of each page the total of children present should be noted as total: Present / Absent, e.g. 5 / 2.
38
Annex 11 Tally sheet – OTP
Feeding
site
Month
Responsible person
Location
Year
Organisation/Agency
Treatment group
Date of Service day
1
2
3
4
5
Total beginning of period (V)
TOTAL
WFH/BMI (a)
MUAC (b)
ENTRIES
Oedema (c)
Relapse (d)
Re-admission (e)
Total Admissions (W=a+b+c+d+e)
Moved in from SC/OTP (f)
Other (g)
Total In (Y=W+f+g)
Recovered (h)
Death (i)
Defaulter unconfirmed (j)
Defaulter confirmed (k)
EXITS
Medical Referral (l)
Non-response (m)
Total Discharges (X=h+i+j+k+l+m)
Moved out OTP to SC (n)
Moved out OTP to OTP (o)
Other (p)
Total Out (Z=X+n+o+p)
Total end of period (V+Y-Z)
39
1
2
3
4
5
Annex 12 Tally sheet – targeted SFP
Feeding
site
Month
Responsible person
Location
Year
Organisation/Agency
Treatment group
Date of Service day
1
2
3
4
5
Total beginning of period (V)
TOTAL
WFH/BMI (a)
MUAC (b)
ENTRIES
Relapse (c)
Re-admission (d)
Total Admissions (W=a+b+c+d)
Moved in from other tSFP sites (e)
Other (f)
Total In (Y=W+e+f)
Recovered (g)
Death (h)
Defaulter unconfirmed (i)
Defaulter confirmed (j)
EXITS
Medical Referral (k)
Non-response (l)
Transfer to therapeutic programme
(m)
Total Discharges (X=g+h+i+j+k+l+m)
Moved out to other tSFP sites (o)
Other (p)
Total Out (Z=X+o+p)
Total end of period (V+Y-Z)
40
1
2
3
4
5
Annex 13 Tally sheet – OTP discharges in TSFP
Feeding
site
Month
Responsible person
Location
Year
Organisation/Agency
Treatment group
Date of Service day
1
2
3
4
5
Total beginning of period (V)
TOTAL
New beneficiaries (a)
No. completed programme (b)
EXITS
Referrals to TFP (c)
No. of dropouts (d)
Death (e)
Other (f)
Total Out (Z=b+c+d+e+f)
Total end of period (V+a-Z)
41
1
2
3
4
5
Annex 14 Instructions for completing a Tally Sheet
Example: Completing a tSFP
tally sheet for March 2012
(use one tally sheet per
treatment group)
Note: Most OTPs have weekly service rounds. Therefore there will be 4-5 service days to be filled
and added together for the reporting month. Sites with many beneficiaries may need more than
one service day to complete a service round. In this case one tally sheet per service round can be
used, and then added up for the reporting month.
42
A.
This example is for a tSFP
programme for children
aged 6-59 months old
that is run biweekly.
B.
The reporting month of
March has two service
days (i.e. two service
th
rounds); 12 March and
th
26 March 2012.
C.
At the end of each of
these
service
days
(columns 1 and 2) the
number of cases in each
reporting category (rows
related to ENTRIES and
EXITS) are entered with
the help of beneficiary
cards and/or registration
books.
D.
Total Admissions, Total
discharges, Total In, Total
Out and Total end of
period have to be
calculated
manually
using
the
formulas
provided in the tally
sheet (e.g. for Total
Admissions add rows a +
b + c + d)
E.
For calculation of all
totals for the reporting
month of March 2012,
figures for both service
days (i.e. columns 12/03
and 26/03) should be
added (e.g. for Total In: 7
+ 20 = 27) and the result
entered in the TOTAL
column on the right hand
side. These totals will be
entered into the monthly
site report form or
directly into the MRP
software.
Annex 15 Calculation and reporting of overall programme outcomes for SC and OTP together
Note: Rows highlighted in grey correspond to the basic analysis level (minimum reporting of performance indicators). The letters in capitals only refer to this table and are
not connected to any of the tables in the other parts of these guidelines.
OTP
Number
SC
%
EXITS
a
Promoted to OTP
Discharged recovered (to INS)
Death
Defaulter confirmed
Defaulter unconfirmed
Defaulter (confirmed+ unconfirmed)
Medical referral
Non-response
Non-recovery
Total discharges
ENTRIES
Moved-out from OTP to SC
Moved-in from OTP to SC
b
Moved-in from SC to OTP
c
b
A
B
C
D
C+D
E
F
E+F
V=
A+B+C+D+E+F
G
A/V x 100
B/V x 100
[C+D]/V
E/V x
F/V x
[E+F]/V
x 100
100
100
x 100
Number
I
J
K
L
M
L+M
N
O
N+O
Q=
I+J+K+L+M+N+O
OTP + SC
%
I/Q x 100
J/Q x 100
K/Q x 100
[L+M]/Q
N/Q x
O/Q x
[N+O]/Q
x 100
100
100
x 100
Number
A+J
B+K
C+L
D+M
C+D+L+M
E+N
F+O
E+F+N+O
Y=
A+B+C+D+E+F+J+K+L+M+N+O
%
[A+J]/Y x 100
[B+K]/Y x 100
[C+D+L+M]/Y x 100
[E+N]/Y x 100
[F+O]/Y x 100
[E+F+N+O]/Y x 100
P
% OTP beneficiaries requiring inpatient
c
care
Defaulter for which the outcome is not
confirmed
Missing beneficiary rate from SC to
d
OTP
Missing beneficiary rate from OTP to
d
SC
H
G/[V+G] x 100
D/[C+D] x 100
M/[L+M] x 100
D+M/[C+D+L+M] x 100
[I–H]/I x 100
[G–P]/G x 100
Table adapted from VALID Manual
These are movements within the programme, not exits. They are therefore not counted when calculating performance for the therapeutic programme as a whole, but they are included to
allow monitoring performance in the SC (successfully stabilised in SC and moved-out to OTP to continue SAM nutritional treatment).
b
These are movements within therapeutic programme and therefore are not included when calculating overall outcomes. They are included here to calculate missing beneficiary rate within
programme components and the % of OTP beneficiaries requiring inpatient care.
c
This is included in order to monitor the percentage of beneficiaries requiring inpatient care (see chapter 8 for details on interpretation)
d
% of beneficiaries moved from one facility to another facility and that fail to attend the receiving facility within a reasonable period of time. These can only be calculated when there is
complete reporting from all the OTPs in the geographical area under review (and excluding OTPs that transfer beneficiaries to SC in another district)
a
43
Annex 16 Resources
A. Community Management of Acute Malnutrition (CMAM)
Management of severe malnutrition: a manual for physicians and other senior health workers, WHO (1999)
http://whqlibdoc.who.int/hq/1999/a57361.pdf
Community-based Therapeutic Care. A Field Manual, Valid International (2006)
http://www.fantaproject.org/ctc/manual2006.shtml
Assessment and Treatment of Malnutrition in Emergency Situations. Manual of Therapeutic Care and Planning for a
Nutritional Programme. Action Contre La Faim/Prudhon, Claudine (2002)
Guidelines for the management of the severely malnourished, ACF, Michael Golden and Yvonne Grellety, 2007
The care of Acute, Moderate Malnutrition, Prevention of severe wasting, Targeted Supplementary Feeding Programme.
Yvonne Grellety, 2006
MSF nutrition guidelines, MSF 2006
Harmonised Training Package Version 2 update 2011, ENN and Nutrition Works, Module 11 and 12
http://www.ennonline.net/htpversion2/modules
Training guide for Community-based Management of Acute Malnutrition, FANTA (2008) – Module 8 Monitoring and
Reporting on CMAM http://www.fantaproject.org/cmam/training.shtml
B. Treatment of severely acute malnourished children < 6 months
Guidelines for the management of the severely malnourished, ACF, Michael Golden and Yvonne Grellety, 2007
MSF nutrition guidelines, 2006 http://medmissio.de/proxy/alfrescosystem/api/node/content/workspace/SpacesStore/87c2cbe3-8663-4afb-a56d-33a07d9c0557/test
Infant Feeding in Emergencies, Module 2, Version 1.0, Part 8, ENN, IBFAN, Terre des hommes, UNHCR, UNICEF, WFP,
WHO; (2004) http://helid.digicollection.org/en/d/Js8230e/3.html
Infant Feeding in Emergencies. Module 2, Version 1.1. Part 8, ENN, IBFAN-GIFA, Terre des hommes, CARE USA, Action
Contre la Faim, UNICEF, UNHCR, WHO, WFP, Linkages (2007) http://www.ennonline.net/resources/4
Management of Acute Malnutrition in Infants, (MAMI Project), ACF, UCL, ENN (2010).
http://www.ennonline.net/research/mami
Management of Severe Acute Malnutrition. Module 13: Harmonized Training Package (HTP) Version 2, ENN (2011)
http://www.ennonline.net/pool/files/ife/m13-management-of-severe-acute-malnutrition-entire-modeule.pdf
C. Monitoring and Evaluation of CMAM programmes
Training guide for Community-based Management of Acute Malnutrition, FANTA (2008) – Module 8 Monitoring and
Reporting on CMAM http://www.fantaproject.org/cmam/training.shtml
Monitoring Feeding Programmes, In: Nutrition Guidelines, MSF, 2006
Community-based Therapeutic Care. A Field Manual, Valid International (2006)
http://www.fantaproject.org/ctc/manual2006.shtml
Guidelines for the management of the severely malnourished, ACF, Michael Golden and Yvonne Grellety, 2007
D. MRP/CMAM Report related
Measuring the effectiveness of Supplementary Feeding Programmes in Emergencies. Navarro-Colorado, Carlos, Frances
Mason and Jeremy Shoham (2008) Humanitarian Practice Network. Network Paper 63.
http://www.ennonline.net/pool/files/ife/measuring-the-effectiveness-of-sfp-odi-networkpaper063.pdf
Development of a Minimum Reporting Package for Emergency Supplementary Feeding Programmes Project. ENN, Save
the Children UK (2011) http://www.ennonline.net/pool/files/research/mrp-report-final.pdf
44


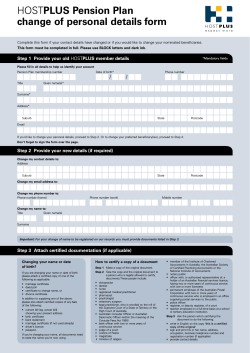


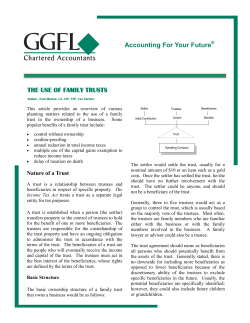


© Copyright 2026