
Rooster Rundown Template [April 2015].pages
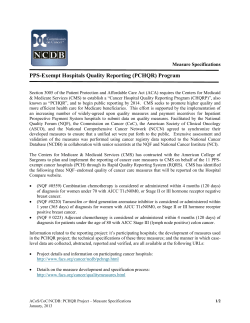
Rooster
Rundown
April 2015
WHAT DOES IT MEAN TO GET TO ZERO?
CHRONIC HOMELESSNESS: At any point in time, the number of people experiencing sheltered and
unsheltered chronic homelessness, excluding veterans experiencing chronic homelessness (who are
included in the group below), will be no greater than the current monthly housing placement rate
for people experiencing chronic homelessness.
Improvement
Track
40
[53%]
Zero
Track
35
[47%]
Improvement
Track
46
Zero
Track
29
[39%]
[61%]
VETERAN
CHRONIC
VETERAN HOMELESSNESS: At any point in time, the number of veterans experiencing sheltered and
unsheltered homelessness will be no greater than the current monthly housing placement rate for
veterans experiencing homelessness.
#ZeroHero
These 18 communities are Zero Track for BOTH
ZERO TRACK: These communities are
meeting or exceeding their monthly housing
placement targets for chronically homeless
individuals and/or veterans and are on track
to end either veteran homelessness by
December 31, 2015 or chronic homelessness
by December 31, 2016.
veteran and chronic homelessness!
Bergen County CoC
Cape Cod/Islands CoC
Charleston/Kanawha, Putnam, Boone, Clay Counties CoC
Greensboro/High Point CoC
Gulf Port/Gulf Coast Regional CoC
Ft. Lauderdale/Broward County CoC
Las Vegas CoC
Louisville/Jefferson County CoC
IMPROVEMENT TRACK: These communities
Miami/Dade County CoC
are not yet meeting their monthly housing
placement targets for chronically homeless
individuals and/or veterans but are
committed to improving in order to be on
track to end veteran homelessness by
December 31, 2015 and/or chronic
homelessness by December 31, 2016.
New Orleans/Jefferson Parish CoC
Omaha/Council Bluffs CoC
Rockford/Winnebago, Boone Counties CoC
Shreveport/Bossier/Northwest CoC
Sacramento City + County CoC
State of Connecticut
Utah Balance of State CoC
Wichita/Sedgwick County CoC
Winston Salem/Forsyth County CoC
Rooster
Rundown
April 2015
<< 34 communities (45%) are Zero Track for
chronic homelessness
Improvement
Track
40
<< 41 communities (55%) are Improvement
Zero
Track
35
Track for chronic homelessness
[47%]
% OF YTD TARGET REACHED: The percentages
[53%]
below represent a community's year-to-date
housing placements measured against their
cumulative monthly targets since beginning Zero:
2016. For example: If a community’s monthly
veteran housing placement targets to date add up
to 100 and that community has placed 150
veterans into housing, their % of YTD target reached
would be 150%.
CHRONIC
[ZERO TRACK]
COMMUNITY
% OF YTD TARGET
REACHED
Sacramento City + County CoC
206%
Salt Lake City + County CoC
203%
Ohio Balance of State CoC
194%
Springfield CoC
191%
Tulsa City + Broken Arrow CoC
185%
Utah Balance of State CoC
625%
Arlington County CoC
176%
Louisville/Jefferson County CoC
582%
Winston Salem/Forsyth County CoC
169%
Miami/Dade County CoC
458%
Charlotte/Mecklenberg CoC
164%
Omaha/Council Bluffs CoC
440%
Gulf Port/Gulf Coast Regional CoC
164%
Cook County CoC
437%
Las Vegas CoC
156%
Chicago CoC
368%
Pontiac/Royal Oak/Oakland County CoC
143%
Rockford/Winnebago, Boone Counties CoC
358%
Shreveport/Bossier/Northwest CoC
142%
Richmond/Henrico, Chesterfield, Hanover Counties CoC
357%
Bergen County CoC
141%
Charleston/Kanawha, Putnam, Boone, Clay Counties CoC
332%
Waukegan/North Chicago/Lake County CoC 139%
Provo/Mountainland CoC
329%
Cape Cod/Islands CoC
137%
Greensboro/High Point CoC
328%
Jacksonville-Duval, Clay Counties CoC
121%
Ft. Lauderdale/Broward County CoC
319%
Columbus-Muscogee/Russell County CoC
115%
West Palm Beach/Palm Beach County CoC
295%
State of Connecticut
114%
State of Rhode Island
262%
New Orleans/Jefferson Parish CoC
102%
Memphis/Shelby County CoC
219%
Wichita/Sedgwick County CoC
100%
** These communities are in the process of revising their Take Down Target, which will affect the % of YTD target reached.
Rooster
Rundown
Improvement
Track
40
Zero
Track
35
[47%]
[53%]
CHRONIC
[IMPROVEMENT TRACK]
COMMUNITY
% OF YTD TARGET
REACHED
Jackson/Rankin, Madison Counties CoC
87%
Nashville/Davidson County CoC
83%
San Antonio/Bexar County CoC
81%
Honolulu CoC
80%
State of New Mexico
75%
Phoenix CoC
73%
West Virginia Balance of State CoC
71%
Virginia Balance of State CoC
70%
Madison/Dane County CoC
65%
Roanoke City + County/Salem CoC
61%
Charleston/Low Country CoC
56%
Ann Arbor/Washtenaw County CoC
55%
Fort Worth/Arlington/Tarrant County CoC
55%
Bakersfield/Kern County CoC
51%
**
April 2015
Fresno/Madera County CoC
49%
Ft. Myers/Cape Coral/Lee County CoC
49%
Richmond/Contra Costa County CoC
49%
Tucson/Pima County CoC
49%
Metro Denver CoC
48%
Columbia/Midlands CoC
42%
Seattle CoC
42%
San Diego City + County CoC
41%
Oklahoma City CoC
39%
Santa Maria/Santa Barbara County CoC
39%
Detroit CoC
37%
Chattanooga/Southeast Tennessee CoC
36%
Dallas City + County/Irving CoC
36%
Huntington/Cabell, Wayne Counties CoC
29%
District of Columbia CoC
28%
Los Angeles City + County CoC
25%
Montgomery County CoC
24%
Kansas City/Independence/Lee’s Summit/Jackson County CoC
21%
Flint/Genesee County CoC
17%
Watsonville/Santa Cruz City + County CoC
15%
Kansas City/Wyandotte County CoC
14%
Norman/Cleveland County CoC
11%
Riverside City + County CoC
8%
Tallahassee/Leon County CoC
8%
Portsmouth CoC
0%
Lancaster City + County CoC
These communities are in the process of revising their Take Down Target, which will affect the % of YTD target reached.
**
Rooster
Rundown
April 2015
<< 29 communities (39%) are Zero Track for
veteran homelessness
Improvement
Track
46
<< 46 communities (61%) are Improvement
Zero
Track
29
Track for veteran homelessness
[39%]
% OF YTD TARGET REACHED: The percentages
below represent a community's year-to-date
housing placements measured against their
cumulative monthly targets since January 2015.
[61%]
For example: If a community’s monthly veteran
housing placement targets to date add up to 100
and that community has placed 150 veterans into
housing, their % of YTD target reached would be
150%.
VETERAN
[ZERO TRACK]
Lancaster City + County CoC
167%
Rockford/Winnebago/Boone Counties CoC
163%
SUSTAINING ZERO
Honolulu CoC
146%
New Orleans/Jefferson Parish CoC
Richmond/Contra Costa County CoC
139%
Las Vegas CoC
136%
Ft Myers/Cape Coral/Lee County CoC
127%
Ft Lauderdale/Broward County CoC
126%
Flint/Genesee County CoC
123%
Charleston/Kanawha, Putnam, Boone, Clay Counties CoC
122%
Portsmouth CoC
111%
Sacramento City + County CoC
109%
Roanoke City + County/Salem CoC
108%
Tallahassee/Leon County CoC
107%
Virginia Balance of State CoC
107%
Wichita/Sedgwick County CoC
104%
Utah Balance of State CoC
103%
Winston Salem/Forsyth County CoC
100%
State of Connecticut
100%
COMMUNITY
% OF YTD TARGET
REACHED
Bergen County CoC
617%
Cape Cod/Islands CoC
329%
Shreveport/Bossier/Northwest CoC
305%
Miami/Dade County CoC
270%
Greensboro/High Point CoC
231%
State of New Mexico
192%
Gulf Port/Gulf Coast Regional CoC
190%
Dallas City + County/Irving CoC
Omaha/Council Bluffs CoC
173%
171%
Louisville/Jefferson County CoC
170%
**
These communities are in the process of revising their Take Down Target, which will affect the % of YTD target reached.
Rooster
Rundown
Improvement
Track
46
Zero
Track
29
[39%]
[61%]
VETERAN
[IMPROVEMENT TRACK]
COMMUNITY
% OF YTD TARGET
REACHED
April 2015
West Palm Beach/Palm Beach County CoC
71%
Nashville/Davidson County CoC
71%
Norman/Cleveland County CoC
67%
San Antonio/Bexar County CoC
63%
Memphis/Shelby County CoC
61%
Tucson/Pima County CoC
61%
Riverside City + County CoC
56%
Ann Arbor/Washtenaw County CoC
55%
Fresno/Madera County CoC
53%
Metro Denver CoC
50%
Huntington/Cabell, Wayne Counties CoC
50%
San Diego City + County CoC
43%
Chattanooga/Southeast Tennessee CoC
41%
Santa Maria/Santa Barbara County CoC
40%
West Virginia Balance of State CoC
35%
Detroit CoC
34%
Oklahoma City CoC
33%
Tulsa City + County/Broken Arrow CoC
98%
Provo/Mountainland CoC
33%
Columbia/Midlands CoC
95%
Montgomery County CoC
32%
Jacksonville-Duval, Clay Counties CoC
94%
Arlington County CoC
27%
Salt Lake City + County CoC
94%
Richmond/Henrico, Chesterfield, Hanover Counties CoC
27%
Springfield CoC
91%
Pontiac/Royal Oak/Oakland County CoC
23%
District of Columbia CoC
89%
Phoenix CoC
18%
Seattle CoC
89%
Jackson/Rankin, Madison Counties CoC
15%
Columbus-Muscogee/Russell County CoC
88%
Kansas City/Independence/Lee’s Summit/Jackson County CoC
14%
Ohio Balance of State
88%
Madison/Dane County CoC
13%
Waukegan/North Chicago/Lake County CoC
84%
Kansas City/Wyandotte County CoC
0%
Fort Worth/Arlington/Tarrant County CoC
79%
Los Angeles County CoC
0%
Charleston/Low Country CoC
77%
Watsonville/Santa Cruz City + County CoC
0%
State of Rhode Island
75%
Cook County CoC
74%
Charlotte/Mecklenberg CoC
74%
Chicago CoC
72%
Bakersfield/Kern County CoC
71%


© Copyright 2026