
ECE 3793 Matlab Project 3 Solution
ECE 3793
Matlab Project 3 Solution
Spring 2015
Dr. Havlicek
PART I: the DFT
1. Matlab code:
%-------------------------------------------------------% P1
%
% - Create and plot the signal x_1[n] as a function of n.
% - Compute the DFT X_1[k]. Plot the magnitude and phase
%
as functions of k.
% - Plot the DFT magnitude as a function of the matlab
%
array index.
% - Plot the DFT magnitude as a function of the discrete
%
radian frequency w.
% - Compute and plot the IDFT.
%
n = 0:7;
% time variable
x1n = [0 1 1 1 1 1 0 0];
% our 8-point signal
X1k = fft(x1n);
% compute the DFT
X1kmag = abs(X1k);
% magnitude of the DFT
X1karg = angle(X1k);
% phase of the DFT
% plot the signal
figure(1);
stem(n,x1n);
axis([0 7 0 1.5]);
title(’Original Signal’);
xlabel(’n’);
ylabel(’x_1[n]’);
% plot DFT magnitude and phase as functions of k
k = 0:7;
% frequency index
figure(2);
stem(k,X1kmag); ylim([0 6]);
title(’DFT Magnitude’);
xlabel(’k’);
ylabel(’|X_1[k]|’);
figure(3);
stem(k,X1karg);
title(’DFT Phase’);
xlabel(’k’);
ylabel(’arg(X_1[k])’);
1
% plot DFT magnitude as a function of Matlab index
Matlab_idx = [1:8];
% Matlab index
figure(4);
stem(Matlab_idx,X1kmag); ylim([0 6]);
title(’DFT Magnitude’);
xlabel(’Matlab index’);
ylabel(’|X_1[index]|’);
% plot DFT magnitude as a function of discrete frequency
% (radians per sample)
w = [0:2*pi/8:7*2*pi/8];
% discrete frequency
figure(5);
stem(w,X1kmag); ylim([0 6]);
title(’DFT Magnitude’); ylim([0 6]);
xlabel(’discrete radian frequency \omega’);
ylabel(’|X_1[\omega]|’);
% Compute and plot the IDFT
x2n = ifft(X1k);
figure(6);
stem(n,x2n);
axis([0 7 0 1.5]);
title(’IDFT’);
xlabel(’n’);
ylabel(’IDFT’);
Original Signal
1.5
x1[n]
1
0.5
0
0
1
2
3
4
n
2
5
6
7
DFT Magnitude
6
5
|X1[k]|
4
3
2
1
0
0
1
2
3
4
5
6
7
5
6
7
k
DFT Phase
4
3
1
1
arg(X [k])
2
0
−1
−2
−3
0
1
2
3
4
k
3
DFT Magnitude
6
5
|X1[index]|
4
3
2
1
0
1
2
3
4
5
Matlab index
6
7
8
DFT Magnitude
6
5
|X1[ω]|
4
3
2
1
0
0
1
2
3
4
discrete radian frequency ω
4
5
6
IDFT
1.5
IDFT
1
0.5
0
0
1
2
3
4
5
6
7
n
2. Matlab code:
%-------------------------------------------------------% P2
%
% - Compute the centered DFT of x_1[n].
% - Plot the centered magnitude and phase as function of
%
- the discrete radian frequency w,
%
- the discrete hertzian frequency f.
% - Invert the DFT and plot.
%
n = 0:7;
% time variable
x1n = [0 1 1 1 1 1 0 0];
% our 8-point signal
X1k = fftshift(fft(x1n));
% compute the centered DFT
X1kmag = abs(X1k);
% magnitude of the centered DFT
X1karg = angle(X1k);
% phase of the centered DFT
% plot centered DFT magnitude & phase as functions of radian freq
w = [-4*2*pi/8:2*pi/8:3*2*pi/8]; % radian discrete freq
figure(1);
stem(w,X1kmag); ylim([0 6]);
title(’Centered DFT Magnitude’);
xlabel(’discrete radian frequency \omega’);
ylabel(’|X_1[\omega]|’);
figure(2);
stem(w,X1karg);
5
title(’Centered DFT Phase’);
xlabel(’discrete radian frequency \omega’);
ylabel(’arg(X_1[\omega])’);
% plot centered DFT magnitude & phase as functions of
%
Hertzian freq
f = [-0.5:1/8:3/8];
% Hertzian discrete freq
figure(3);
stem(f,X1kmag); ylim([0 6]);
title(’Centered DFT Magnitude’);
xlabel(’discrete Hertzian frequency f’);
ylabel(’|X_1[f]|’);
figure(4);
stem(f,X1karg);
title(’Centered DFT Phase’);
xlabel(’discrete Hertzian frequency f’);
ylabel(’arg(X_1[f])’);
% Compute and plot the IDFT
x2n = ifft(ifftshift(X1k));
figure(5);
stem(n,x2n);
axis([0 7 0 1.5]);
title(’IDFT’);
xlabel(’n’);
ylabel(’IDFT’);
Centered DFT Magnitude
6
5
|X1[ω]|
4
3
2
1
0
−4
−3
−2
−1
0
discrete radian frequency ω
6
1
2
3
Centered DFT Phase
4
3
2
1
arg(X [ω])
1
0
−1
−2
−3
−4
−3
−2
−1
0
discrete radian frequency ω
1
2
3
Centered DFT Magnitude
6
5
|X1[f]|
4
3
2
1
0
−0.5
−0.4
−0.3
−0.2
−0.1
0
0.1
discrete Hertzian frequency f
7
0.2
0.3
0.4
Centered DFT Phase
4
3
1
1
arg(X [f])
2
0
−1
−2
−3
−0.5
−0.4
−0.3
−0.2
−0.1
0
0.1
discrete Hertzian frequency f
0.2
0.3
0.4
IDFT
1.5
IDFT
1
0.5
0
0
1
2
3
4
n
8
5
6
7
3. Matlab code:
%-------------------------------------------------------% P3
%
% Plot the centered DFT magnitude of x_1[n] using
% normalized radian frequency.
%
x1n = [0 1 1 1 1 1 0 0];
% our 8-point signal
X1k = fftshift(fft(x1n));
% compute the centered DFT
X1kmag = abs(X1k);
% magnitude of the centered DFT
X1karg = angle(X1k);
% phase of the centered DFT
w = [-4*2*pi/8:2*pi/8:3*2*pi/8];
figure(1);
stem(w/pi,X1kmag);
axis([-1 1 0 6]);
title(’Centered DFT Magnitude’);
xlabel(’\omega/\pi’);
ylabel(’|X_1[\omega/\pi]|’);
% radian discrete freq
Centered DFT Magnitude
6
5
|X1[ω/π]|
4
3
2
1
0
−1
−0.8
−0.6
−0.4
−0.2
0
ω/π
9
0.2
0.4
0.6
0.8
1
4. (a) Matlab code:
%-------------------------------------------------------% P4a
%
% Show that the DFT is given by samples of the DTFT.
% - plot the DTFT magnitude of x1hat from -pi to pi.
%
- plot the centered DFT magnitude of x_1[n] on the
%
same graph.
% -plot the DTFT phase of x1hat from -pi to pi.
%
- plot the centered DFT phase of x_1[n] on the same
%
graph.
%
% Frequency vector for plotting the DTFT.
w = linspace(-pi,pi,1000);
Use 1000 points.
% The DTFT was computed analytically
X1hat = sin(2.5*w)./sin(w/2) .* exp(-3*j*w);
X1hatmag = abs(X1hat);
X1hatarg = angle(X1hat);
% Now compute the 8-point DFT
x1n = [0 1 1 1 1 1 0 0]; % our 8-point signal
k = -4:3;
% frequency index for the centered DFT
X1k = fftshift(fft(x1n));
X1kmag = abs(X1k);
X1karg = angle(X1k);
figure(1);
plot(w,X1hatmag,’-b’);
axis([-pi pi 0 6]);
hold on;
% plot the DTFT magnitude
% makes the next plot come out on the
%
same graph
plot(k*2*pi/8,X1kmag,’ro’); % plot the centered DFT magnitude
hold off;
%
using a symbol, but no line
%
and no stem.
title(’Magnitude of DTFT and centered 8-pt DFT’);
xlabel(’\omega’,’FontSize’,14);
ylabel(’$|\widehat X_1(e^{j\omega})|$, $|X_1[\omega]|$’,...
’Interpreter’,’latex’,’FontSize’,14);
legend(’DTFT’,’DFT’);
figure(2);
plot(w,X1hatarg,’-b’);
% plot the DTFT phase
axis([-pi pi -4 5]);
hold on;
plot(k*2*pi/8,X1karg,’ro’); % plot the centered DFT phase
10
hold off;
title(’Phase of DTFT and centered 8-pt DFT’);
xlabel(’\omega’,’FontSize’,14);
ylabel(’$\arg\widehat X_1(e^{j\omega})$, $\arg X_1[\omega]$’,...
’Interpreter’,’latex’,’FontSize’,14);
legend(’DTFT’,’DFT’);
11
Magnitude of DTFT and centered 8−pt DFT
6
DTFT
DFT
b 1 (ejω )|, |X1 [ω]|
|X
5
4
3
2
1
0
−3
−2
−1
0
1
2
3
ω
Phase of DTFT and centered 8−pt DFT
5
DTFT
DFT
4
b 1 (ejω ), arg X1 [ω]
arg X
3
2
1
0
−1
−2
−3
−4
−3
−2
−1
0
ω
12
1
2
3
(b) Matlab code:
%-------------------------------------------------------% P4b
%
% Change the length of x_1[n] to N=16.
%
% - plot the DTFT magnitude of x1hat from -pi to pi.
%
- plot the centered DFT magnitude of x_1[n] on the
%
same graph.
% -plot the DTFT phase of x1hat from -pi to pi.
%
- plot the centered DFT phase of x_1[n] on the same
%
graph.
%
% Frequency vector for plotting the DTFT.
w = linspace(-pi,pi,1000);
Use 1000 points.
% The DTFT was computed analytically
X1hat = sin(2.5*w)./sin(w/2) .* exp(-3*j*w);
X1hatmag = abs(X1hat);
X1hatarg = angle(X1hat);
% Now compute the 16-point DFT
x1n = [0 1 1 1 1 1 0 0 0 0 0 0 0 0 0 0]; % 16-point signal
k = -8:7;
% frequency index for the centered DFT
X1k = fftshift(fft(x1n));
X1kmag = abs(X1k);
X1karg = angle(X1k);
figure(1);
plot(w,X1hatmag,’-b’);
axis([-pi pi 0 6]);
hold on;
% plot the DTFT magnitude
% makes the next plot come out on the
%
same graph
plot(k*2*pi/16,X1kmag,’ro’); % plot the centered DFT magnitude
hold off;
%
using a symbol, but no line
%
and no stem.
title(’Magnitude of DTFT and centered 16-pt DFT’);
xlabel(’\omega’,’FontSize’,14);
ylabel(’$|\widehat X_1(e^{j\omega})|$, $|X_1[\omega]|$’,...
’Interpreter’,’latex’,’FontSize’,14);
legend(’DTFT’,’DFT’);
figure(2);
plot(w,X1hatarg,’-b’);
axis([-pi pi -4 5]);
hold on;
% plot the DTFT phase
13
plot(k*2*pi/16,X1karg,’ro’); % plot the centered DFT phase
hold off;
title(’Phase of DTFT and centered 16-pt DFT’);
xlabel(’\omega’,’FontSize’,14);
ylabel(’$\arg\widehat X_1(e^{j\omega})$, $\arg X_1[\omega]$’,...
’Interpreter’,’latex’,’FontSize’,14);
legend(’DTFT’,’DFT’);
14
Magnitude of DTFT and centered 16−pt DFT
6
DTFT
DFT
b 1 (ejω )|, |X1 [ω]|
|X
5
4
3
2
1
0
−3
−2
−1
0
1
2
3
ω
Phase of DTFT and centered 16−pt DFT
5
DTFT
DFT
4
b 1 (ejω ), arg X1 [ω]
arg X
3
2
1
0
−1
−2
−3
−4
−3
−2
−1
0
ω
15
1
2
3
PART II: Digital Audio
5. (a) Matlab code:
%---------------------------------------------------------% P5a
%
% Make a 2 second digital audio signal that contains a pure
% cosine tone with analog frequency 440 Hz.
% - play the signal through the sound card
% - plot the centered DFT magnitude in dB against
%
Hertzian analog freq, radian digital freq,
%
and normalized digital freq.
% - Write the signal to a wave file, read it back in, and
%
play it through the sound card again.
%
Fs = 44100;
N = Fs * 2;
n = 0:N-1;
f_analog = 440;
w_dig = 2*pi*f_analog/Fs;
x = cos(w_dig * n);
%
%
%
%
%
%
sampling frequency in Hz
length of the 2 sec signal
discrete time variable
analog frequency in Hz
radian digital frequency
the signal
% Normalize samples to the range [-1,1]
% Not really needed here b/c cos is already in this range,
% but done anyway to illustrate how you normalize.
x = x / max(abs(x));
sound(x,Fs,16);
% play it through sound card
X = fftshift(fft(x));
Xmag = abs(X);
XmagdB = 20*log10(Xmag);
% centered DFT
% centered DFT magnitude
% convert to dB
% Plot the centered magnitude against analog frequency
w = -pi:2*pi/N:pi-2*pi/N;
% dig rad freq vector
f = w * Fs /(2*pi);
% analog freq vector
figure(1);
plot(f,XmagdB);
xlim([-20000 20000]);
title(’Centered DFT Magnitude for 440 Hz Pure Tone’);
xlabel(’analog frequency, Hz’);
ylabel(’dB’);
% Plot the centered magnitude against radian digital freq
figure(2);
16
plot(w,XmagdB);
xlim([-pi pi]);
title(’Centered DFT Magnitude for 440 Hz Pure Tone’);
xlabel(’radian digital frequency \omega’);
ylabel(’dB’);
% Plot against normalized digital frequency
figure(3);
plot(w/pi,XmagdB);
xlim([-1 1]);
title(’Centered DFT Magnitude for 440 Hz Pure Tone’);
xlabel(’normalized digital frequency \omega/\pi’);
ylabel(’dB’);
% wait 3 seconds in case sound card is still busy
pause(3);
audiowrite(’A-440.wav’,x,Fs);
% write to wave file
[x2,Fs] = audioread(’A-440.wav’); % read it back in
sound(x2,Fs,16);
% play it again Sam!
Centered DFT Magnitude for 440 Hz Pure Tone
100
50
0
dB
−50
−100
−150
−200
−250
−300
−2
−1.5
−1
−0.5
0
0.5
analog frequency, Hz
17
1
1.5
2
4
x 10
Centered DFT Magnitude for 440 Hz Pure Tone
100
50
0
dB
−50
−100
−150
−200
−250
−300
−3
−2
−1
0
1
radian digital frequency ω
2
3
Centered DFT Magnitude for 440 Hz Pure Tone
100
50
0
dB
−50
−100
−150
−200
−250
−300
−1
−0.8
−0.6
−0.4
−0.2
0
0.2
0.4
normalized digital frequency ω/π
18
0.6
0.8
1
(b) Matlab code:
%---------------------------------------------------------% P5b
%
% Make a 2 second digital audio signal that contains a pure
% cosine tone with analog frequency 5 kHz.
% - play the signal through the sound card
% - plot the centered DFT magnitude in dB against
%
Hertzian analog freq, radian digital freq,
%
and normalized digital freq.
% - Write the signal to a wave file, read it back in, and
%
play it through the sound card again.
%
Fs = 44100;
N = Fs * 2;
n = 0:N-1;
f_analog = 5000;
w_dig = 2*pi*f_analog/Fs;
x = cos(w_dig * n);
x = x / max(abs(x));
sound(x,Fs,16);
X = fftshift(fft(x));
Xmag = abs(X);
XmagdB = 20*log10(Xmag);
%
%
%
%
%
%
%
%
%
%
%
sampling frequency in Hz
length of the 2 sec signal
discrete time variable
analog frequency in Hz
radian digital frequency
the signal
normalize to [-1,1]
play it through sound card
centered DFT
centered DFT magnitude
convert to dB
% Plot the centered magnitude against analog frequency
w = -pi:2*pi/N:pi-2*pi/N;
% dig rad freq vector
f = w * Fs /(2*pi);
% analog freq vector
figure(1);
plot(f,XmagdB);
xlim([-20000 20000]);
title(’Centered DFT Magnitude for 5 kHz Pure Tone’);
xlabel(’analog frequency, Hz’);
ylabel(’dB’);
% Plot the centered magnitude against radian digital freq
figure(2);
plot(w,XmagdB);
xlim([-pi pi]);
title(’Centered DFT Magnitude for 5 kHz Pure Tone’);
xlabel(’radian digital frequency \omega’);
ylabel(’dB’);
% Plot against normalized digital frequency
figure(3);
plot(w/pi,XmagdB);
19
xlim([-1 1]);
title(’Centered DFT Magnitude for 5 kHz Pure Tone’);
xlabel(’normalized digital frequency \omega/\pi’);
ylabel(’dB’);
% wait 3 seconds in case sound card is still busy
pause(3);
audiowrite(’A-5000.wav’,x,Fs);
% write to wave file
[x2,Fs] = audioread(’A-5000.wav’); % read it back in
sound(x2,Fs,16);
% play it again Sam!
Centered DFT Magnitude for 5 kHz Pure Tone
100
50
0
dB
−50
−100
−150
−200
−250
−300
−2
−1.5
−1
−0.5
0
0.5
analog frequency, Hz
20
1
1.5
2
4
x 10
Centered DFT Magnitude for 5 kHz Pure Tone
100
50
0
dB
−50
−100
−150
−200
−250
−300
−3
−2
−1
0
1
radian digital frequency ω
2
3
Centered DFT Magnitude for 5 kHz Pure Tone
100
50
0
dB
−50
−100
−150
−200
−250
−300
−1
−0.8
−0.6
−0.4
−0.2
0
0.2
0.4
normalized digital frequency ω/π
21
0.6
0.8
1
6. (a) Matlab code:
%---------------------------------------------------------% P6a
%
% Make some digital audio signals and demonstrate filtering.
% All signals are 4 seconds in duration.
% - Make x1 a 250 Hz pure tone.
% - Play x1 through the sound card.
% - Make x2 a swept frequency chirp from 1 kHz to 3 kHz.
% - Play x2 through the sound card.
% - Make x3 = x1 + x2.
% - Play x3 through the sound card.
% - Apply a lowpass digital Butterworth filter to x3 to
%
keep the pure tone and reject the chirp.
% - Play the filtered signal through the sound card.
% - Apply a highpass digital Butterworth filter to x3 to
%
keep the chirp and reject the pure tone.
% - Play the filtered signal through the sound card.
%
Fs = 44100;
N = Fs * 4;
n = 0:N-1;
% sampling frequency in Hz
% length of the 4 sec signal
% discrete time variable
% Make x1 a 250 Hz pure tone
f_analog = 250;
w_dig = 2*pi*f_analog/Fs;
x1 = cos(w_dig * n);
sound(x1,Fs,16);
pause(5);
%
%
%
%
%
pure tone analog frequency
radian digital frequency
the pure tone
play it through sound card
wait for sound card to clear
% Make x2 a chirp. Sweep analog freq from 1 kHz to 3 kHz
f_start_analog = 1000;
w_start_dig = 2*pi*f_start_analog/Fs;
f_stop_analog = 3000;
w_stop_dig = 2*pi*f_stop_analog/Fs;
phi = (w_stop_dig-w_start_dig)/(2*(N-1))*(n.*n) + w_start_dig*n;
x2 = cos(phi);
sound(x2,Fs,16);
% play it through sound card
pause(5);
% wait for sound card to clear
% Add the two signals
x3 = x1 + x2;
x3 = x3 / max(abs(x3));
sound(x3,Fs,16);
pause(5);
% normalize the range to [-1,1]
% play it through sound card
% wait for sound card to clear
22
% Use a lowpass digital Butterworth filter to keep the 250 Hz
%
pure tone and reject the chirp.
Wp = w_dig/pi;
% normalized passband edge freq
Ws = w_start_dig/pi;
% normalized stopband edge freq
Rp = 1;
% max passband ripple
Rs = 60;
% min stopband attenuation
[Nf, Wn] = buttord(Wp,Ws,Rp,Rs); % design filter order
[num,den] = butter(Nf,Wn);
% design the filter
h=fvtool(num,den);
% show frequency response
figure(2);
freqz(num,den,1024);
% plot frequency response
title(’Lowpass Frequency Response’);
y1 = filter(num,den,x3);
% apply the filter
y1 = y1 / max(abs(y1));
% normalize filtered signal
sound(y1,Fs,16);
% play it through sound card
pause(5);
% wait for sound card to clear
% Use a highpass digital Butterworth filter to keep the chirp
%
and reject the 250 Hz pure tone.
Ws = w_dig/pi;
% normalized stopband edge freq
Wp = w_start_dig/pi;
% normalized passband edge freq
Rp = 1;
% max passband ripple
Rs = 60;
% min stopband attenuation
[Nf, Wn] = buttord(Wp,Ws,Rp,Rs); % design filter order
[num2,den2] = butter(Nf,Wn,’high’); % design the filter
Hd = dfilt.df1(num2,den2);
% make filter object
addfilter(h,Hd);
% add filter 2 to fvtool
figure(3);
freqz(num2,den2,1024);
% plot frequency response
title(’ Highpass Frequency Response’);
y2 = filter(num2,den2,x3);
% apply the filter
y2 = y2 / max(abs(y2));
% normalize filtered signal
sound(y2,Fs,16);
% play it through sound card
23
Lowpass Frequency Response
Magnitude (dB)
0
−200
−400
−600
0
0.1
0.2
0.3
0.4
0.5
0.6
0.7
Normalized Frequency (×π rad/sample)
0.8
0.9
1
0
0.1
0.2
0.3
0.4
0.5
0.6
0.7
Normalized Frequency (×π rad/sample)
0.8
0.9
1
Phase (degrees)
0
−200
−400
−600
Highpass Frequency Response
Magnitude (dB)
0
−50
−100
−150
−200
0
0.1
0.2
0.3
0.4
0.5
0.6
0.7
Normalized Frequency (×π rad/sample)
0.8
0.9
1
0
0.1
0.2
0.3
0.4
0.5
0.6
0.7
Normalized Frequency (×π rad/sample)
0.8
0.9
1
Phase (degrees)
200
0
−200
−400
24
Magnitude Response (dB)
0
−50
−100
Filter #1
Magnitude (dB)
Filter #2
−150
−200
−250
−300
−350
0
0.1
0.2
0.3
0.4
0.5
0.6
Normalized Frequency (×π rad/sample)
0.7
0.8
(b) Matlab code:
%---------------------------------------------------------% P6b
%
% Make some digital audio signals and demonstrate filtering.
% All signals are 4 seconds in duration.
% - Make x1 a 1 kHz pure tone.
% - Play x1 through the sound card.
% - Make x2 a 3 kHz pure tone.
% - Play x2 through the sound card.
% - Make x3 = x1 + x2.
% - Play x3 through the sound card.
% - Apply a lowpass digital Butterworth filter to x3 to
%
keep the 1 kHz tone and filter out the 3 kHz tone.
% - Play the filtered signal through the sound card.
%
Fs = 44100;
N = Fs * 4;
n = 0:N-1;
% sampling frequency in Hz
% length of the 4 sec signal
% discrete time variable
% Make x1 a 1 kHz pure tone
f1_analog = 1000;
w1_dig = 2*pi*f1_analog/Fs;
% pure tone analog frequency
% radian digital frequency
25
0.9
x1 = cos(w1_dig * n);
sound(x1,Fs,16);
pause(5);
% the pure tone
% play it through sound card
% wait for sound card to clear
% Make x2 a 3 kHz pure tone
f2_analog = 3000;
w2_dig = 2*pi*f2_analog/Fs;
x2 = cos(w2_dig * n);
sound(x2,Fs,16);
pause(5);
%
%
%
%
%
% Add the two signals
x3 = x1 + x2;
x3 = x3 / max(abs(x3));
sound(x3,Fs,16);
pause(5);
% normalize the range to [-1,1]
% play it through sound card
% wait for sound card to clear
pure tone analog frequency
radian digital frequency
the pure tone
play it through sound card
wait for sound card to clear
% Use a lowpass digital Butterworth filter to keep the 1 kHz
%
tone and filter out the 3 kHz tone.
Wp = w1_dig/pi;
% normalized passband edge freq
Ws = w2_dig/pi;
% normalized stopband edge freq
Rp = 1;
% max passband ripple
Rs = 60;
% min stopband attenuation
[Nf, Wn] = buttord(Wp,Ws,Rp,Rs); % design filter order
[num,den] = butter(Nf,Wn);
% design the filter
h=fvtool(num,den);
% show frequency response
figure(2);
freqz(num,den,1024);
% plot frequency response
title(’Lowpass Frequency Response’);
y1 = filter(num,den,x3);
% apply the filter
y1 = y1 / max(abs(y1));
% normalize filtered signal
sound(y1,Fs,16);
% play it through sound card
26
Lowpass Frequency Response
Magnitude (dB)
200
0
−200
−400
−600
0
0.1
0.2
0.3
0.4
0.5
0.6
0.7
Normalized Frequency (×π rad/sample)
0.8
0.9
1
0
0.1
0.2
0.3
0.4
0.5
0.6
0.7
Normalized Frequency (×π rad/sample)
0.8
0.9
1
Phase (degrees)
0
−200
−400
−600
−800
Magnitude Response (dB)
0
−50
Magnitude (dB)
−100
−150
−200
−250
−300
0
0.1
0.2
0.3
0.4
0.5
0.6
Normalized Frequency (×π rad/sample)
27
0.7
0.8
0.9
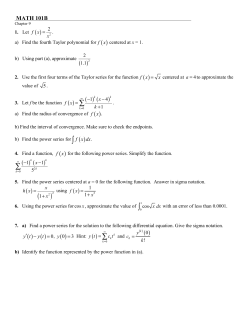
7.
Centered DFT Magnitude of Noisy Signal
100
80
Magnitude (dB)
60
40
20
0
−20
−40
−60
−1
−0.8
−0.6
−0.4
−0.2
0
0.2
0.4
Normalized Frequency ω/π
0.6
0.8
1
0.6
0.8
1
Centered DFT Magnitude of Noise Sample
80
60
Magnitude (dB)
40
20
0
−20
−40
−1
−0.8
−0.6
−0.4
−0.2
0
0.2
0.4
Normalized Frequency ω/π
From the centered DFT magnitude spectrum of the noise sample, we see that the noise
dips to a minimum “floor” of about -10 dB in a normalized frequency range of about
-0.2 to +0.2. Outside this frequency band, the noise is much stronger. Inside this
frequency band, the noise is overlapping the signal spectrum and therefore cannot be
removed by a linear filter without serious degradation to the signal. This suggests
that the filter stopband edge frequency should be placed at a normalized frequency of
approximately 0.2.
28
From the centered DFT magnitude spectrum of the noisy signal, we see that the
peak energy band of the signal, where the signal is above 20 dB, is concentrated in
a normalized frequency range of about -0.1 to +0.1. This suggests that the filter
passband edge frequency should be placed at a normalized frequency of approximately
0.1.
Using Wp = 0.1 and Ws = 0.2 with a passband ripple of Rp = 1 and a minimum stopband
attenuation of Rs = 60, we obtain a filter order of Nf = 11, which is less than allowable
maximum of 12.
The filter frequency response magnitude and Matlab code are shown below.
Magnitude (dB)
200
0
−200
−400
−600
0
0.1
0.2
0.3
0.4
0.5
0.6
0.7
Normalized Frequency (×π rad/sample)
0.8
0.9
1
0
0.1
0.2
0.3
0.4
0.5
0.6
0.7
Normalized Frequency (×π rad/sample)
0.8
0.9
1
Phase (degrees)
0
−200
−400
−600
−800
−1000
29
Magnitude Response (dB)
0
−50
Magnitude (dB)
−100
−150
−200
−250
−300
−350
0
0.1
0.2
0.3
0.4
0.5
0.6
Normalized Frequency (×π rad/sample)
0.7
0.8
Matlab code:
%---------------------------------------------------------% P7
%
% - Read noisy digital audio signal and sample of the noise.
% - Display centered DFT magnitude in dB for each signal.
% - Design a lowpass digital Butterworth filter to remove
%
the noise.
% - Apply the filter.
% - Play the filtered signal through the sound card and write
%
it out to a wave file.
%
[x1,Fs] = audioread(’noisysig.wav’);
[x2,Fs] = audioread(’noisesamp.wav’);
sound(x1,Fs,16);
pause;
% read the noisy signal
% read the noise sample
% play noisy signal through the sound card
% wait for sound to play; hit any key
% Compute and plot the centered DFT magnitude spectrum
%
for the noisy signal.
X1 = fftshift(fft(x1));
Nsig = length(x1); % length of the noisy signal
30
0.9
figure(1);
plot([-1:2/Nsig:1-2/Nsig],20*log10(abs(X1)));
grid on;
title(’Centered DFT Magnitude of Noisy Signal’);
xlabel(’Normalized Frequency \omega/\pi’);
ylabel(’Magnitude (dB)’);
% Compute and plot the centered DFT magnitude spectrum
%
for the noise sample.
X2 = fftshift(fft(x2));
Nnoise = length(x2); % length of the noise sample
figure(2);
plot([-1:2/Nnoise:1-2/Nnoise],20*log10(abs(X2)));
grid on;
title(’Centered DFT Magnitude of Noise Sample’);
xlabel(’Normalized Frequency \omega/\pi’);
ylabel(’Magnitude (dB)’);
% Design Filter
Wp = 0.10;
% normalized passband edge freq
Ws = 0.2;
% normalized stopband edge freq
Rp = 1.0;
% max passband ripple
Rs = 60;
% min stopband attenuation
[Nf, Wn] = buttord(Wp,Ws,Rp,Rs);
[num,den] = butter(Nf,Wn);
h = fvtool(num,den);
freqz(num,den,1024);
Nf
% Apply the filter. Play filtered signal through the
%
sound card and write to a wave file.
y = filter(num,den,x1);
y = y/max(abs(y));
sound(y,Fs,16);
audiowrite(’filteredsig.wav’,y,Fs);
31


© Copyright 2026