
Lab 1-2 motion down an incline-DN
PROBLEM #2:
MODELING MOTION DOWN AN INCLINE
You have a summer job working with a team investigating accidents for the state safety board. To decide on the
cause of one accident, your team needs to determine the acceleration of a car rolling down a hill without any brakes.
Everyone agrees that the car’s velocity increases as it rolls down the hill. Your team’s supervisor believes that the
car's acceleration also increases as it rolls down the hill. Do you agree? To resolve the issue, you decide to model the
motion of a cart moving down an inclined track in the laboratory.
EQUIPMENT
For this problem you will have a stopwatch, meter stick, an adjustable end stop, wood blocks, a video camera, and a
computer with video analysis applications in LoggerPro. You will also have a Vernier cart to roll down an aluminum
dynamics track.
WARM-UP
1.
2.
3.
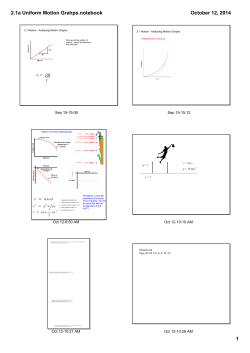
Sketch acceleration vs. time graphs for a cart moving (1) with a constant acceleration, (2) with increasing
acceleration, and (3) with decreasing acceleration. For easy comparison, draw these graphs next to each
other. Which graph do you think best represents a cart rolling down an incline?
Sketch a rough graph of instantaneous velocity vs. time for each of the three accelerations you drew in question
one. Which graph do you think best represents the velocity of a cart rolling down an incline? Change your
prediction from warm up #1 if necessary.
Sketch position vs. time graphs from the instantaneous velocity graphs for the 3 situations above. Which graph
do you think best represents the position of a cart moving down an incline? Change your prediction if
necessary.
PREDICTION
Final Answer: Sketch the acceleration vs. time graph for a cart released from rest near the top of an inclined track. Do
you think the cart's acceleration increases, decreases, or stays the same (is constant) as it moves down the track?
Explain your reasoning.
EXPLORATION AND MEASUREMENT
You will use a wood block and an aluminum track to create an incline. Each group will be creating a slightly different
incline.
Group 1: Small incline (one block of wood or one textbook), cart moves from left to right on camera
Group 2: Medium incline (two blocks of wood or two textbooks), cart moves from left to right on camera
Group 3: Large incline (three blocks of wood or three textbooks), cart moves from left to right on camera
Group 4: Small incline (one block of wood or one textbook), cart moves from right to left on camera
Group 5: Medium incline (two blocks of wood or two textbooks), cart moves from right to left on camera
Group 6: Large incline (three blocks of wood or three textbooks), cart moves from right to left on camera
Lab I - 1
Start with the cart at rest near the top of the track, with the start location marked with a piece of tape. Observe the
cart as it moves down the inclined track. BE SURE TO CATCH THE CART BEFORE IT HITS THE END STOP!
When placing the camera, consider which part of the motion you wish to capture. Try different camera positions
until you get the best possible video.
Where is the best place to release the cart so it does not damage the equipment but has enough of its motion captured
on video? Be sure to catch the cart before it collides with the end stop. Take a few practice videos using your flip
camera and play them back to make sure you have captured the motion you want.
Don’t forget to put an object in your picture for calibration, such as a meter stick.
ANALYSIS
1.
2.
3.
4.
5.
6.
7.
8.
9.
10.
11.
12.
13.
Create a folder in your account called Lab 1-2. You will analyze this video just like the last one.
We are going to use a tilted axis to analyze this video, so that all the motion is considered in the x direction.
Click on the set origin button and place the origin near the starting location of your cart. Then grab the ball on
the axis and rotate the x axis so that it is parallel with the track.
Fast forward your video to the point right after you let go of the cart. Why is it important to click on the same
point on the car’s image to record its position? Estimate your uncertainty in doing so.
On one graph, graph X and Y vs. time (same as lab 1.1), and graph X velocity and Y velocity on a second
graph.
We want our initial moment of data collection to be time=0. We can adjust the time by creating a new column.
Go to the Data menu and select New Calculated Column. Call the column Time adjusted, Ta for short, with s
as the units. In the formula box go to Variables and click on Time. Then subtract the value of your first time
data point. For example, my Ta column is calculated as "Time"-5.267.
Change your graphs so that the X axis is Time Adjusted instead of Time.
Now add another New Calculated Column. Name the column X Acceleration (Ax for short) with units m/s/s
(we will make sense of this later). In the formula box click on FunctionsCalculusDerivative. Inside the
parenthesis click on VariablesX velocity, so that it looks like this: derivative("X Velocity").
Now do this process again, except calling it Y Acceleration (Ay), with Y Velocity in the parenthesis.
Insert a new graph and graph X and Y accelerations vs. time adjusted.
In LoggerPro, choose the Curve Fit button to fit a quadratic function to represent the position vs. time graph in
the x direction, and a linear fit in the y direction.
Choose the Linear Fit button again to fit a function to represent the velocity vs. time graphs in the x and y
directions.
Do the same for the acceleration graphs.
Last of all,find the area under the X velocity graph like you did in lab 1.1.
CONCLUSION
Go back to the initial scenario, and describe how your results answer the question. Look back at your warm-up
questions, and explain any differences.


© Copyright 2026