
Management of patients with stroke or TIA: assessment, investigation, immediate management and
Management of patients with stroke
or TIA: assessment, investigation,
immediate management and
secondary prevention
A clinical and resource impact assessment
May 2009
© NHS Quality Improvement Scotland 2009
NHS Quality Improvement Scotland (NHS QIS) consents to the photocopying, electronic
reproduction by ‘uploading’ or ‘downloading’ from the website, retransmission, or other
copying of this report for the purpose of implementation in NHSScotland and
educational and ‘not-for-profit’ purposes. No reproduction by or for commercial
organisations is permitted without the express written permission of NHS QIS.
CONTENTS
1 EXECUTIVE SUMMARY ......................................................................................... 1
2 INTRODUCTION...................................................................................................... 8
2.1
Objective ........................................................................................................... 8
2.2
Key recommendations ...................................................................................... 8
2.3
Document overview ........................................................................................ 10
3 BACKGROUND AND METHODOLOGY............................................................... 12
3.1
Introduction ..................................................................................................... 12
3.2
Methodology to estimate clinical benefit ......................................................... 12
3.3
Methodology to estimate resources required/associated costs and savings... 13
3.4
Methodology to estimate cost of resources and associated savings............... 14
3.5
Limitations....................................................................................................... 18
4 SCOTTISH STROKE EPIDEMIOLOGY ................................................................ 19
4.1
Introduction ..................................................................................................... 19
4.2
Incidence of a first hospital admission as a result of stroke or TIA.................. 19
5 TIMELY THROMBOLYSIS .................................................................................... 25
5.1
Background..................................................................................................... 25
5.2
Patient group................................................................................................... 25
5.3
Clinical benefit and associated resource savings............................................ 25
5.4
Resource requirements................................................................................... 26
5.5
Costs............................................................................................................... 28
5.6
Sensitivity analysis.......................................................................................... 28
5.7
Analyses by NHS board .................................................................................. 29
6 TIMELY CAROTID IMAGING AND CAROTID ENDARTERECTOMY.................. 34
Background..................................................................................................... 34
6.1
6.2
Patient group................................................................................................... 34
6.3
Clinical benefit and associated resource savings........................................... 35
6.4
Resource requirements................................................................................... 36
6.5
Costs............................................................................................................... 36
6.6
Sensitivity analysis.......................................................................................... 36
6.7
Analyses by NHS board .................................................................................. 37
7
TIMELY CT DIAGNOSTICS ................................................................................. 41
7.1
Background..................................................................................................... 41
7.2
Patient group................................................................................................... 42
7.3
Clinical benefits............................................................................................... 42
7.4
Resources....................................................................................................... 42
7.5
Costs............................................................................................................... 44
7.6
Sensitivity analysis.......................................................................................... 44
8
9
REFERENCES....................................................................................................... 45
APPENDICES........................................................................................................ 47
Appendix 1
Key recommendations .................................................................. 47
Appendix 2
Acknowledgements ....................................................................... 49
Appendix 3
Resource impact assessment process.......................................... 50
Appendix 4.1 ICD-10 codes for stroke or TIA...................................................... 51
Appendix 4.2 ICD-10 codes for other cerebrovascular diseases ........................ 52
Appendix 5.1 Incidence of first ever hospital admission for stroke and TIA for
year ending 31 March 2007 .......................................................... 53
Appendix 5.2 Survival rates for stroke and TIA after a first ever hospital
admission for year ending 31 March 2007 .................................... 54
Appendix 5.3 Re-admission rates for stroke and TIA after a first ever hospital
admission for year ending 31 March 2007 .................................... 55
Appendix 5.4 Prior admission of patients who had a first ever admittance for
stroke or TIA for year ending 31 March 2007................................ 56
Appendix 5.5 Incidence of stroke and TIA resulting in a first ever hospital
admission by NHS board for year ending 31 March 2007............. 57
Appendix 5.6 Predicted mortality for patients with first admission of ischaemic
stroke for year ending 31 March 2007........................................... 58
Appendix 5.7 Predicted mortality and disability for patients with first admission of
ischaemic stroke for year ending 31 March 2007.......................... 59
Appendix 6.1 Estimated first hospital admissions for stroke or TIA..................... 60
Appendix 6.2 Estimated survival rates for patients following a first admission to
hospital for stroke or TIA ............................................................... 61
Appendix 6.3 Estimated re-admission rates for patients following a first
admission to hospital for stroke or TIA .......................................... 62
Appendix 6.4 Estimated prior admission rates for patients later admitted for
stroke or TIA for the first time ........................................................ 63
Appendix 6.5 Estimated admission rates for patients who have attended a
neurovascular outpatient clinic ...................................................... 64
Appendix 7.1 Costs for the Scottish Ambulance Service .................................... 65
Appendix 7.2 Costs for attendance at an A&E department................................. 66
Appendix 7.3 Costs per event for CT, MRI and ultrasound diagnostics .............. 67
Appendix 7.4 Costs for a stroke consultant outpatient attendance ..................... 68
Appendix 7.5 Costs for a consultant vascular surgeon outpatient attendance.... 69
Appendix 7.6 Mean variable cost per day (excluding overheads and theatre
costs) in a surgical ward................................................................ 70
Appendix 7.7 Mean variable cost per day (excluding overheads and theatre
costs) in a general medical ward................................................... 71
Appendix 7.8 Costs per hour for theatre time inclusive of overheads, staff costs
and consumables .......................................................................... 72
Appendix 7.9
Costs by function in NHS Greater Glasgow and Clyde ................. 73
LIST OF TABLES
Table 1-1
Clinical benefits measured as the number of bed days saved ................... 4
Table 1-2
Additional costs required to implement key recommendations ................. 6
Table 1-3
Total budgetary impact for Scotland and NHS board ................................ 7
Table 3-1
Table 3-2
Table 3-3
Gross salary costs for non-consulting staff ............................................. 15
Gross salary costs for consulting staff .................................................... 15
Consolidated surgical costs for carotid endarterectomy .......................... 17
Table 4-1
Table 4-2
Table 4-3
Table 4-4
Re-admission rates .................................................................................. 21
Annual re-admission rates estimated from first ever hospital admissions 21
Classification of the subtypes of cerebral infarcts .................................... 22
Extending OCSP model of infarction subtypes to population age groups 23
Table 5-1
Table 5-2
Table 5-3
Table 5-4
Table 5-5
Table 5-6
Table 5-7
Table 5-8
Clinical benefits of additional thrombolytic therapy .................................. 26
Additional costs to deliver thrombolytic therapy ....................................... 28
Additional costs if patients not directed to hospitals with CT scanners .... 29
Additional costs to deliver thrombolytic therapy ....................................... 29
Anticipated patients by NHS board .......................................................... 30
Additional benefit from timely thrombolysis by NHS board ...................... 31
Additional costs from timely thrombolysis by NHS board......................... 32
Sensitivity analysis: SAS unable to deliver patients to specified.............. 33
Table 6-1
Table 6-2
Table 6-3
Table 6-4
Table 6-5
Calculation to estimate number of patients eligible for surgery................ 35
Patients who are potential candidates for carotid endarterectomy........... 38
Estimated clinical benefit from timely carotid endarterectomy ................. 39
Estimated additional cost to achieve timely carotid endarterectomy........ 39
Sensitivity analyses of higher costs incurred if carotid Doppler required . 40
Table 7-1
Table 7-2
Table 7-3
Patient groups requiring CT scanning facilities ........................................ 42
Operational CT scanning hours per week in Scottish hospitals ............... 43
Costs to provide capacity to scan 24,300 people with stroke symptoms . 44
1
EXECUTIVE SUMMARY
In their recent report, Reducing Brain Damage: Faster access to better stroke care1, the
National Audit Office stated that in England and Wales, stroke costs the NHS and the
economy approximately £7 billion a year. Of this sum, £2.8 billion is estimated to be in
direct costs to the NHS, £2.4 billion of informal care costs borne by the patients’ family
and other carers, with a further £1.8 billion being lost productivity and disability income
for those under the age of 65 who are unable to work as a result of their condition.
Translating these numbers to Scotland suggests that the cost to the Scottish economy
as a result of stroke is in the region of some £700 million.
Whilst stroke is primarily associated with age and ageing, it is important to note that the
number of patients under the age of 65 who are being admitted to Scottish hospitals
due to stroke is increasing. This group now represents 26.5% of all stroke admissions;
up 32.5% from the 20.0% of admissions reported in 2000 as part of the Scottish Borders
Stroke Study2. Moreover, while the reported incidence of stroke has decreased
marginally over the last 10 years, this trend may not continue because of the population
demographics. In the next 10 years, one of the largest population deciles, the 55–65
age group, or the ‘baby boomers’, will progressively move into the next of the higher risk
stroke age groups.
The objective of this clinical and resource impact assessment is to facilitate more rapid
implementation of the key recommendations in SIGN Guideline 108 Management of
patients with stroke or TIA: assessment, investigation, immediate management and
secondary prevention3. The report provides each NHS board with an estimate of the
resources and costs required to implement the key recommendations, together with the
associated clinical benefits, including potential cost savings.
The guideline development group judged 15 recommendations to be clinically very
important and should be prioritised for implementation. Following discussion with
members of the group it was agreed that eight recommendations would not change
current practice and therefore would not have a material impact on current resource use.
These have been excluded from further analysis. A short explanation of each
recommendation including commentary for those that have been excluded is provided in
Appendix 1. Seven recommendations were judged to be clinically important and to
require significant resources on implementation. The associated clinical benefits,
resources and costs to implement these key recommendations are estimated in this
report. These have been grouped into two headings; timely thrombolysis and timely
carotid imaging and carotid endarterectomy. Implementing these two interventions are
the key challenges for NHS boards. The individual recommendations for each
intervention are:
1
Recommendations for timely thrombolysis
• Emergency medical services should be redesigned to facilitate rapid access to
specialist stroke services.
• Stroke patients requiring admission to hospital should be admitted to a stroke unit
staffed by a co-ordinated multidisciplinary team with a special interest in stroke care.
• All patients with suspected stroke should have brain imaging immediately on
presentation.
• Patients admitted with stroke within 4.5 hours of definite onset of symptoms, who are
considered suitable, should be treated with 0.9 mg/kg (up to maximum 90 mg)
intravenous recombinant tissue plasminogen activator (rt-PA).
Recommendations for timely carotid imaging and carotid endarterectomy
• All patients with non-disabling acute stroke syndrome/transient ischaemic attack
(TIA) in the carotid territory who are potential candidates for carotid surgery should
have carotid imaging.
• All patients with carotid artery territory stroke (without severe disability, modified
Rankin Scale [mRS] ≤2) or TIA should be considered for carotid endarterectomy as
soon as possible after the index event.
• Carotid endarterectomy (on the internal carotid artery ipsilateral to the
cerebrovascular event) should be considered in all:
- male patients with a carotid artery stenosis of 50–99% (by NASCET method)
- female patients with a carotid artery stenosis of 70–99%.
• For all patients, carotid endarterectomy should be performed as soon as the patient
is stable and fit for surgery, ideally within 2 weeks of the initial event.
Implementing both interventions requires the use of radiological diagnostics to assist in
the primary determination of specific stroke type. The analysis contained in Section 7 on
timely computed tomography (CT) diagnostics suggests approximately 24,300 CT
scans will be required annually for all patients with potential strokes, to include those
scanned immediately after thrombolysis. The resources and costs to manage a service
to deliver these are also discussed.
The methodology used to develop this report adopts proven processes and principles4-7.
Members of the guideline development group and other experts have provided advice
and participated in peer review. The draft findings were presented to representatives
from NHS Dumfries & Galloway, NHS Ayrshire & Arran, NHS Lanarkshire and NHS
Greater Glasgow and Clyde. Due to time constraints, it was not possible to visit all NHS
boards in Scotland. However, the remaining boards were provided with drafts of all the
underlying analyses for comment and feedback. The boards visited represent the
2
varying spatial diversity of all boards, namely those that have one major hospital, two
major hospitals, three major hospitals and multiple sites. The feedback from the visits
has been adapted for the remaining boards.
The information contained within this report at a national level represents the clinical,
resource and budget impact consolidation of each of the individual mainland NHS
boards, with the boards of NHS Orkney, NHS Shetland and NHS Western Isles
combined into a single entity, the NHS island boards. The epidemiological variations
that exist between the boards in Scotland have been taken into account in the
preparation of this work through extensive epidemiological modelling covering the last 3
years.
Estimated clinical benefits of implementing the key recommendations
Implementing SIGN 108 is forecast to require:
•
810 more patients receiving thrombolysis, compared to the current number of 205,
and
•
608 more patients receiving a carotid endarterectomy, and improving the timeliness
of the current 552 procedures such that these are delivered within 14 days from
event.
Diagnosing and managing these patients will require radiology departments to provide
CT scanning and other imaging services for approximately 24,300 patients per year.
The clinical benefits forecast following these interventions are estimated to be:
•
82 patients making a full recovery and 364 having an improved outcome following
thrombolysis, and
•
217 recurrent strokes avoided from timely carotid endarterectomy.
The associated bed days saved are estimated at 10,611, of which 4,752 are achieved
by timely thrombolysis and 5,859 from timely carotid endarterectomy. The financial
benefits are estimated at £2.94 million. This is calculated by applying a weighted
average variable cost for Scotland (excluding overheads) of £277 per bed day.
Table 1–1 gives the benefits by NHS board for each intervention. No account has been
taken of the savings that successful implementation will have in the longer term,
particularly from lower rehabilitation costs. Further analysis is provided in Sections 5
and 6 of this report.
3
Table 1-1
Clinical benefits measured as the number of bed days saved
Timely
Timely
NHS board
thrombolysis carotid
NHS Ayrshire & Arran
621
405
NHS Borders
153
135
NHS Dumfries & Galloway
234
189
NHS Fife
423
351
NHS Forth Valley
243
243
NHS Grampian
414
405
NHS Greater Glasgow and Clyde
801
1,809
NHS Highland
180
270
NHS Island Boards
36
54
NHS Lanarkshire
657
945
NHS Lothian
585
702
NHS Tayside
405
351
NHSScotland
4,752
5,859
Total
bed
Average
days weighted
Total
saved
cost
savings
1,026
£193
£198,018
288
£204
£58,752
423
£323
£136,629
774
£439
£339,786
486
£176
£85,536
819
£223
£182,637
2,610
£233
£608,130
450
£410
£184,500
90
£295
£26,550
1,602
£210
£336,420
1,287
£368
£473,616
756
£415
£313,740
10,611
£277 £2,944,314
Additional staff required to implement the key recommendations
Timely thrombolysis
Additional staff will be required to assess, deliver and immediately manage patients
receiving thrombolytic therapy. Each NHS board is assumed to require:
•
a band 7 specialist nurse who spends 1 hour assessing each of the 1,900 patients
who may be eligible for the therapy. If the responses indicate that the patient may
be eligible for the therapy then the nurse is assumed to call for a consultant.
Thereafter the nurse will attend patients receiving the therapy for a further 6 hours
as the drug is administered and to oversee the initial management.
•
consultant stroke physicians. Each NHS board is assumed to manage with no
additional consultant resource during the core weekday hours. The additional
workload associated with thrombolysing patients who present during core hours is
assumed to displace the existing workload. However, this should reduce as the
upfront investment in delivering the therapy is rewarded by having more patients
with improved outcomes and consequently discharged earlier. This assumption will
be particularly challenging for smaller boards where the consultant may have duties
to conduct outwith the main hospital. Seven NHS boards, being those forecast to
have more than 30 patients a year presenting for this therapy in the early evening,
are forecast to recruit an extra 0.5 whole time equivalent (WTE) consultant each to
4
cover five planned activities per week, providing cover until 8pm. All other out of
hours work is assumed to be undertaken by on-call arrangements.
The total staff required is estimated to be 4.2 WTE nurses, 35 additional planned
activities per week to provide consultant resource in the early evening and 760 out of
hours call-outs. An analysis of the staffing required by NHS board is provided in Section
5.7.
Carotid endarterectomy
Delivery of a timely carotid endarterectomy service will require staff to perform an
additional 608 carotid endarterectomy procedures. The additional staff required are 1.1
WTE vascular surgeons, 0.65 WTE band 5 and 0.65 WTE band 6 theatre nurses and
0.65 WTE anaesthetist.
Most inpatients should be able to receive the procedure during their initial inpatient stay,
whilst outpatients are assumed to be admitted for 2 nights, one before and one after the
procedure. The benefits from fewer recurrent strokes will reduce the demand for bed
days over time. For example, undertaking five carotid endarterectomy procedures within
14 days of the original events, will require a total of 10 bed days (2 night stay in a
surgical ward as a maximum) initially but may be rewarded by preventing one recurrent
stroke, saving some 27 bed days. However, there may be a timing issue for hospitals
since the extra beds and associated services are needed immediately but the overall
long term benefit could potentially be over 5 years8.
Timely CT diagnostics
The total number of staff required to provide a timely CT scanning service for patients
suspected of a stroke or TIA, and their subsequent management, is estimated to be
almost 740 planned activity sessions for stroke consultants to read the images and
approximately six band 7 radiographers, six band 6 radiographers, six band 3 helpers
and six band 2 clerical officers. Many of these staff will be in place. However, it has not
been possible to identify whether any additional staff could be required. Rather, an
analysis of the current service provision suggests there is sufficient capacity in the
system.
An estimated 3.8 WTE additional band 6 business administration managers are forecast
to be required across Scotland, in the first year, to support implementation.
Estimated costs required to implement the key recommendations
The estimated costs of implementing the key recommendations are £3.5 million in the
first year. Thereafter the £0.13 million for business support should fall, leaving additional
costs to the service of around £3.4 million.
5
Table 1–2 analyses the cost by NHS board for each of the three interventions. These
costs exclude any costs for additional diagnostics. Provision of an efficient CT scanning
service could cost approximately £0.95 million a year. It is not possible to estimate the
current costs and thus whether additional costs are required.
Table 1-2
Additional costs required to implement key recommendations in
SIGN 108
Timely
Business
Timely
carotid
admin
Total
NHS board
thrombolysis endarterectomy support
costs
NHS Ayrshire & Arran
£210,140
£33,439
£10,300
£253,879
NHS Borders
£34,314
£32,707
£5,150
£72,171
NHS Dumfries & Galloway
£52,696
£10,469
£5,150
£68,315
NHS Fife
£179,205
£69,429
£10,300
£258,934
NHS Forth Valley
£64,006
£17,460
£5,150
£86,616
NHS Grampian
£297,275
£29,960
£10,300
£336,534
NHS Greater Glasgow and Clyde
£294,679
£591,189
£36,049
£921,917
NHS Highland
£259,096
£22,427
£5,150
£286,673
NHS Island Boards
£5,133
£7,502
0
£12,635
NHS Lanarkshire
£229,262
£285,210
£15,449
£529,921
NHS Lothian
£217,764
£210,573
£15,449
£443,786
NHS Tayside
£178,759
£67,819
£10,300
£256,878
NHSScotland
£2,022,329
£1,377,185 £128,747 £3,528,260
Estimated net costs required to implement the key recommendations
Comparing the total cost of implementing the guideline with a valuation based on the
bed days saved is difficult to interpret. This is because reducing bed days seldom
releases additional funding or staff resources; rather the beds are used to manage
additional patients or non-stroke patients and staff are re-deployed elsewhere in the
board. Despite that caveat, the estimated net cost (before any enhancements are made
to the provision of diagnostic services) from implementing SIGN 108 is estimated at
approximately £0.6 million in year one, as detailed in Table 1–3.
6
Table 1-3
Total budgetary impact for Scotland and NHS boards of SIGN 108
NHS board
NHS Ayrshire & Arran
NHS Borders
NHS Dumfries & Galloway
NHS Fife
NHS Forth Valley
NHS Grampian
NHS Greater Glasgow and Clyde
NHS Highland
NHS Island Boards
NHS Lanarkshire
NHS Lothian
NHS Tayside
NHSScotland
Estimated
savings
£198,018
£58,752
£136,629
£339,786
£85,536
£182,637
£608,130
£184,500
£26,550
£336,420
£473,616
£313,740
£2,944,314
Total costs
£253,879
£72,171
£68,315
£258,934
£86,616
£337,535
£921,917
£286,673
£12,635
£529,921
£443,786
£256,878
£3,528,261
Net cost
impact
£55,861
£13,419
(£68,314)
(£80,852)
£1,080
£153,898
£313,787
£102,173
(£13,915)
£193,501
(£29,830)
(£56,862)
£583,946
NHS board reports
In support of this national report, each NHS board (with the islands combined) has
received spreadsheets covering:
•
data from ISD on the incidence and outcome of stroke that has resulted in a hospital
admission over the last 3 years, and
•
the assumptions, values for each key parameter and analysis used to estimate their
individual cost and savings.
It is hoped that these spreadsheets will provide a framework for boards to enable them
to model potential solutions to the challenges presented in implementing the key
recommendations in SIGN 108.
7
2
INTRODUCTION
2.1
Objective
The objective of this clinical and resource impact assessment is to facilitate more rapid
implementation of the key recommendations in SIGN Guideline 108 Management of
patients with stroke or TIA: assessment, investigation, immediate management and
secondary prevention3. The report provides each NHS board with an estimate of the
resources and costs required to implement the recommendations, together with the
associated clinical benefits. This report does not reproduce the SIGN guideline and
should be read in conjunction with it.
A recent Audit Commission report concluded that the lack of robust information on the
resources required and associated costs including any potential savings was one of the
biggest difficulties in developing plans to implement clinical guidelines9. This report aims
to provide such information to support implementation of the recommendations in NHS
boards. It does not attempt to cost all aspects of the current diagnosis and management
of patients with stroke or transient ischaemic attack (TIA).
No cost effectiveness analyses are presented within this report.
2.2
Key recommendations
Timing is a central theme throughout SIGN 108. The changes in practice that are
required to facilitate implementation of the key recommendations are not necessarily a
marked departure from current clinical practice or the patient pathway of care within the
acute setting. Rather, successful implementation requires doing the same things to a
more demanding timescale.
Stroke and TIA’s share common morbidity or co-morbidities with primarily, coronary
heart disease, peripheral vascular disease and diabetes10, each of which in turn require
the same resources, be that the Scottish Ambulance Service (SAS), radiological
diagnostics or indeed theatre time. For each of the key recommendations, a synopsis of
the relevant considerations that have been taken into account as part of the workflow
arrangements which led to the preparation of this report is noted below.
Timely thrombolysis
Emergency medical services should be redesigned to facilitate rapid access to
specialist stroke services (recommendation 2.1)
The costings have focussed on the front line diagnostics required to determine the
stroke type; a computed tomography (CT) scanner in the first instance. Adopting a
protocol for SAS that enables the paramedics to recognise a potential stroke patient and
to deliver the person to a hospital with a CT scanner rather than the nearest ‘place of
safety’ should reduce the number of secondary transfers from non-CT scanning
Accident & Emergency (A&E) departments. However, this may result in potentially
8
longer journeys in both distance and time. Under these circumstances, the use of the air
ambulance service may be required as the only method of transport suitable to move
patients to an appropriate place for thrombolytic therapy within the period of 4.5 hours of
symptom onset.
Stroke patients requiring admission to hospital should be admitted to a stroke
unit staffed by a co-ordinated multidisciplinary team with a special interest in
stroke care (recommendation 2.2)
All of Scotland’s hospitals which have a CT scanner also have a stroke unit
associated11; either as an acute receiving unit, a rehabilitation unit or a combination of
both. Geographical variations between and within NHS boards means that not all
hospitals are in a position to offer thrombolytic therapy or to provide surgical facilities for
carotid endarterectomy. Recruiting specialist nurses to deliver timely thrombolysis is
judged to be sufficient to ensure all hospitals admitting stroke patients are staffed by a
co-ordinated multidisciplinary team with a special interest in stroke care.
All patients with suspected stroke should have brain imaging immediately on
presentation (recommendation 2.3.1)
The imaging may take place following assessment at A&E or by elective attendance at
a neurovascular clinic. The report has quantified the demand for CT scanning services
in all settings and assessed the capacity required to meet this demand. Patients
requiring assessment for timely thrombolysis would still require to be seen on an urgent
basis.
Patients admitted with stroke within 4.5 hours of definite onset of symptoms, who
are considered suitable, should be treated with 0.9 mg/kg (up to maximum 90 mg)
intravenous rt-PA (recommendation 2.4)
The process of delivery of the thrombolytic agent can, depending on the weight of the
particular patient, take up to 1.5 hours to be delivered. Thereafter a period of 6 hours
must be allowed for patient recovery in an environment akin to either a high
dependency unit or an intensive care unit and thus require dedicated specialist care.
Timely carotid endarterectomy
All patients with non-disabling acute stroke syndrome/TIA in the carotid territory
who are potential candidates for carotid surgery should have carotid imaging
(recommendation 2.3.2)
All patients with carotid artery territory stroke or TIA should be considered for
carotid endarterectomy as soon as possible after the index event
(recommendation 2.6.1)
Carotid endarterectomy (on the internal carotid artery ipsilateral to the
cerebrovascular event) should be considered in all:
- male patients with a carotid artery stenosis of 50–99% (by NASCET method)
- female patients with a carotid artery stenosis of 70–99%
9
For all patients, carotid endarterectomy should be performed as soon as the
patient is stable and fit for surgery, ideally within 2 weeks of the initial event
(recommendation 2.6)
Implementing these recommendations will require arrangements to be made for
possible surgical intervention as soon as possible after initial symptom onset; ideally
within less than 14 days for maximum potential benefit based on the number needed to
treat (NNT) to avoid a single recurring stroke event. Given the tendency for this
procedure to be geared towards those with mild strokes (modified Rankin Scale [mRS]
≤2) and TIA’s the provision of this service must encompass not only those who have
been admitted, but also those who have had an initial referral to a neurovascular
outpatient clinic.
2.3
Document overview
Section 3 describes the methodology used to estimate the clinical benefit (which is
expressed as a number of bed days saved with the associated weighted average
variable costs [excluding overheads]), the estimate of resources required (including cost
calculations for consulting and non-consulting staff) and the provisions for consumable
costs, theatre operating rates per hour and the weighted average cost of the essential
radiological scans.
Section 4 describes the methodology adopted together with the background with
regards to stroke. This involved the development of a model to predict mortality at 1
month following a first hospital admission, and the predictability of recurrent events that
result in a re-admission at 3 months following an initial discharge for those who have
survived.
Sections 5, 6 and 7 report the estimates for each of the key recommendation groupings;
timely thrombolysis, timely carotid endarterectomy and timely CT diagnostics in more
detail. Sensitivity analyses are provided within each section.
The detailed appendices contain the following information:
Appendix 1 lists the 15 clinically important recommendations and explains why some
were excluded from further study. Appendix 2 acknowledges those who have
contributed to the development of this report. Appendix 3 provides a flowchart on the
resource impact assessment process and implementing guidelines. Appendix 4 details
the International Classification of Disease (ICD 10) codes as they relate to
cerebrovascular disease. Appendix 5 details the epidemiological model for Scotland that
has been derived from the analysis of mortality records from the General Register Office
for Scotland (GROS) and Scottish Morbidity Admission Records (SMR01) databases
from Information Services Division (ISD). Appendix 6 illustrates how these data has
been used to drive the consolidated demand for admissions, re-admissions and survival
rates for patients who are both inside and outside the follow up window of one year.
10
Appendix 7 provides an index to the sources of information which are published
annually by ISD in relation to costs in NHSScotland.
Further information
For further information on this report, to obtain a copy, or to provide feedback on its
usefulness please contact:
Joyce Craig
Lead Health Economist
NHS Quality Improvement Scotland
Delta House
50 West Nile Street
GLASGOW
G1 2NP
0141 225 6985
[email protected]
11
3
BACKGROUND AND METHODOLOGY
3.1
Introduction
Stroke is the third biggest cause of mortality and the primary cause of acquired disability
in the adult population1. It is estimated that hospital care for patients with a stroke
accounts for 7% of total beds occupied in Scottish hospitals and that the total cost of
care represents nearly 5% of the entire NHSScotland budget11. The outcome for
patients following stroke is generally referred to in terms of survival, functional status
(dependence and disability) and the risk of recurrence12-14. Recurrent stroke carries a
higher risk of mortality and can lead to profound long term disability in those who have
survived their initial stroke, depending on the base level of impairment from that event.
Implementing the key recommendations in SIGN 108 is anticipated to improve patient
outcomes by enabling the appropriate therapies to be administered in the optimal time
frames. Delivery of timely carotid endarterectomy should reduce the risk of a recurrent
cerebrovascular event. Delivery of timely thrombolysis should reduce the level of
possible dependency following a stroke and facilitate earlier hospital discharge.
3.2
Methodology to estimate clinical benefit
The mean length of stay as a result of stroke in Scottish hospitals is estimated at 27
days per event. This is a weighted average of the mean length of stay of 25.4 days
reported by the Scottish Stroke Care Audit (SSCAS)11 and the mean length of stay of
28.9 days for ischaemic stroke and 27.2 days for inconclusive stroke, reported by ISD15.
Preventing a stroke event that would otherwise result in either a repeat admission (if the
patient had already been admitted previously and then subsequently discharged) or a
first ever admission (if the patient had previously been seen at a neurovascular
outpatient clinic) is assumed to save 27 bed days.
SIGN 108 reports the clinical studies that demonstrate treatment with recombinant
tissue plasminogen activator (rt-PA) within 4.5 hours of symptom onset improves the
outcome of some but not all patients who are eligible for treatment. It should not be
seen as a ‘cure’ for ischaemic stroke, including the possibility of preventing recurrent
events; rather for some patients successful therapy can reduce the severity, including
the level of disability or impairment, which can accompany the event. In the pathway
from admission to final discharge the outcome from thrombolytic therapy has been
estimated to enable 10% of patients to make a full recovery and be discharged early
(the ‘Lazarus Effect’), whilst 45% of patients will have a significantly improved outcome
enabling earlier discharge16.
The question of time from symptom onset is fundamental in the delivery of thrombolytic
therapy. Patients who arrive at hospital where the time of symptom onset is judged to
be greater than 4.5 hours will not be eligible for therapy under the current licence for
use. In the preparation of this report, the ICD 10 code for inconclusive stroke (I64) has
been taken as an indicator, given the geographical variations within the epidemiology
12
(see Section 4) of the percentage of patients who currently do not arrive within the
appropriate time frame for thrombolytic consideration.
The time from symptom onset is also relevant for the effective provision of carotid
endarterectomy. Section 11.1.1 of SIGN 108 demonstrates that the NNT to prevent one
recurrent event rises as the time from symptom onset progresses. To calculate the
clinical benefit from carotid endarterectomy, this report assumes NHS boards are able
to provide the procedure within 14 days of the event, in line with the SIGN
recommendation. This maximises the potential clinical benefit.
This section of SIGN 108 also notes that ‘A proportion of patients who are severely
disabled immediately following their stroke event can make rapid recovery such that
they meet the criteria used in the studies’ for carotid endarterectomy’. This report
assumes thrombolysis can improve the outcome of patients sufficiently to enable them
to be considered for carotid evaluation and possible surgical intervention prior to
discharge. Following administration of thrombolytic therapy, carotid artery occlusion and
the anterior circulation infarcts that stem from this type of underlying cause have been
reported as a determinant of poor outcome in the 3 months following treatment17, when
by inference the risk of a recurrent event is greatest in this particular subtype of
ischaemic stroke (see Section 4)12-14. This may be reduced by carotid endarterectomy.
Not all patients who arrive within 4.5 hours of symptom onset will be eligible for
thrombolytic therapy. The Summary of Product Characteristics
(http://emc.medicines.org.uk/medicine/308/SPC/Actilyse/) does not recommend use for
patients over the age of 80 years. Other contraindications include patients with severe
stroke as assessed clinically and/or by appropriate imaging techniques, patients
receiving oral anticoagulants and evidence of any haemorrhage events, including liver
disease. These exclusions have been modelled in this report by assuming a specialist
nurse trained in thrombolytic therapy undertakes an assessment in an A&E environment.
For those patients who are assessed as unsuitable for thrombolysis but candidates for
carotid endarterectomy, rapid access to carotid imaging and potential surgical
intervention should be facilitated in order to meet the 14 day timeline for maximum
clinical benefit. Due to the current low numbers being treated for thrombolysis this
element has been difficult to model for this report, however it will be a significant factor
to consider as implementation progresses.
3.3
Methodology to estimate resources required and associated costs and
savings
Appendix 3 outlines the process developed and adopted to produce this report. Once
the key themes and associated recommendations had been identified, draft patient
pathways showing the changes required to implement each key recommendation were
developed. These were informed by the results of a literature search on the
epidemiology of stroke. ISD also provided extensive data on Scottish epidemiology and
the facilities available at each NHS board. These data were combined with knowledge
gained from intensive discussions with a number of the members of the guideline
development group, feedback from members of the stroke managed clinical networks
13
and on-site visits.
Discussions were also held with representatives from SAS. Planners from SAS
modelled the implications of changing the destination for potential stroke patients,
depending on the availability of CT scanning facilities.
The data from these sources were combined into several models. An independent
expert, with extensive knowledge of SSCAS was asked to validate the outcomes of the
epidemiological model and other clinical experts were asked to validate the pathways
assumed for their NHS board.
Where possible published resource and cost data from ISD were used and
supplemented by other published data as appropriate. Occasionally, unpublished
sources were used and referenced.
The models were made available to clinicians in all mainland NHS boards for review,
supported, where possible, by meetings to discuss the findings. Data values and
associated spreadsheets were quality assured by an independent health economist.
An evaluation of the usefulness of this report to NHS boards as they seek to implement
the recommendations in SIGN 108 will be commissioned by NHS Quality Improvement
Scotland.
3.4
Methodology to estimate cost of resources and associated savings
The cost of rt-PA alteplase was taken from BNF 56 (www.bnf.org) being:
• 10 mg
• 20 mg
• 50 mg
£135 excluding VAT; £158.63 including VAT at 17.5%
£180 excluding VAT; £211.50 including VAT at 17.5%
£300 excluding VAT; £352.50 including VAT at 17.5%.
For the purpose of this report the cost of alteplase has been taken as an average of 80
mg at a cost of £723 including VAT.
Costs for events such as SAS journeys, A&E attendance, radiology attendance,
outpatient consultation, inpatient stay and theatre costs per hour are routinely published
by ISD (http://www.isdscotland.org/isd/5822.html). The costs adopted in this report are a
weighted average taking into consideration the total costs (overheads, staff resources,
supplies and consumables) and dividing this by the number of events or patients who
have attended. To calculate the value of a ‘bed day saved’ the inpatient rate per day
has been adjusted to remove overheads and theatre costs, leaving primarily staff costs
plus some consumables that would normally be required during an inpatient stay. This
approach, primarily applied to the cost data for the mainland NHS boards, gives a
Scottish mean weighted cost for an overnight stay in a general medical ward, where
stroke unit costs are recorded, of £277 per day (see Table 1–1).
14
Appendix 7 details all of the costs that have been used in this report. These are
available to download from the ISD website at www.isdscotland.org/isd/4434.html. On
an individual NHS board level the supporting excel spreadsheets have the facility to
change the cost matrix should the need arise.
The mean staff costs for the additional staff required as a result of implementing SIGN
108 have been taken as the mid-point within the Agenda for Change pay scales as it
affects both consulting and non-consulting staff. This salary mid-point is ‘grossed up’ by
22% to take account of the current rate of national insurance contributions and pension
overhead. Translating costs into the relevant WTE for the additional members of staff
requires a further adjustment [52/42] to account for abstractions due to holiday
entitlement and training. Table 3–1 details the mid-point on the pay scale bands under
the current terms of employment in the NHS effective from 1 April 2008 for nonconsulting staff. Table 3–2 details the mid-point on the pay scale bands under the
current terms of employment in the NHS effective from 1 April 2008 for consulting staff.
Full details of NHS employment contracts for both consulting and non_consulting staff
are available from http://www.nhsemployers.org/PayAndContracts/Pages/Pay-andcontracts.aspx.
Table 3-1
Band
2
3
4
5
6
7
Table 3-2
Gross salary costs taken as mid-point within each salary band
including and adjustment for WTE costs for non-consulting staff
(Agenda for Change)
Mid-point
6
10
15
21
27
32
Base
Overhead @ 22%
£14,428
£3,174
£16,307
£3,588
£19,038
£4,188
£22,797
£5,015
£28,141
£6,191
£33,603
£7,393
Gross
Gross WTE
£17,602
£21,793
£19,895
£24,632
£23,226
£28,756
£27,812
£34,434
£34,332
£42,506
£40,996
£50,757
Gross salary costs taken as the mid-point salary band including and
adjustment for WTE costs for consulting staff (pay circular M&D
3/2008)
Pay Scale
Point
Base
Overhead @ 22%
Gross
Gross WTE
MC72/LC72
9
£88,049
£19,371 £107,420
£132,996
Clinical Excellence Awards
5
£14,565
£3,204 £17,769
£22,000
Total
£102,614
£22,575 £125,189
£154,996
Cost per individual session
Annual cost of one session per week
15
£397
£20,666
The cost for carotid endarterectomy as a weighted average for NHSScotland has been
derived from the total expected costs of surgery in each of the individual NHS boards to
include; a consultant outpatient appointment with a vascular surgeon, a secondary
confirmation of carotid disturbance (MRI equivalent) in order to guide the surgical
procedure, theatre time at 1.5 hours and a post-surgical carotid Doppler examination.
Table 3–3 details the calculation for carotid endarterectomy across the NHS boards in
Scotland for those patients who either return to a stroke ward or are cared for in a
surgical ward having been previously discharged or attended a neurovascular outpatient
clinic.
16
201
£732,696
£1,855
32
Estimated number of cases carried out to 31 March
2008 for analysis of additional cases
Total Costs for Outpatient Carotid Surgery
Consultant Outpatient - Vascular Surgergy
Secondary Confirmation - MRI Equivalent
Inpatient Surgery - Cost Per Day's Stay
Theatre Costs - 1.5 Hours
Secondary Confirmation - Ultrasound Post Surgery
Total Unit Costs - Inpatient Carotid Surgery
40
£1,869,010
351
£111,438
£2,443
7
£40,245
£114
£89
£560
£1,563
£42
£2,367
17
50
£102
£163
£636
£1,289
£39
£2,229
NHS
Borders
4
£16,266
£114
£89
£1,563
£42
£1,807
9
NHS
Borders
NHS
Ayrshire &
Arran
25
£50,968
£102
£163
£1,289
£39
£1,593
395
Costing methodology for procedures carried out on
NHS Scotland
patients requiring a new admission to a surgical
total
ward either from outpatient attendance or following
population
early discharge from a stroke ward
Total Number of Cases
765
Estimated number of cases carried out to 31 March
2008 for analysis of additional cases
Total Costs for Inpatient Carotid Surgery
Consultant Outpatient - Vascular Surgery
Secondary Confirmation - MRI Equivalent
Theatre Costs - 1.5 Hours
Secondary Confirmation - Ultrasound Post Surgery
Total Unit Costs - Inpatient Carotid Surgery
Total Number of Cases
NHS
Ayrshire &
Arran
NHS Scotland
total
population
17
£45,941
£114
£144
£508
£1,463
£68
£2,297
20
NHS
Dumfries &
Galloway
11
£23,258
£114
£144
£1,463
£68
£1,789
13
NHS
Dumfries &
Galloway
17
21
£95,376
£87
£302
£582
£1,317
£38
£2,326
41
NHS
Fife
14
£105
£302
£1,317
£38
£1,762
£0
£47,581
27
NHS
Fife
26
£67,844
£82
£305
£540
£1,116
£77
£2,120
32
NHS
Forth Valley
16
£30,023
£82
£305
£1,116
£77
£1,580
19
NHS
Forth Valley
36
£101,228
£108
£153
£548
£1,425
£66
£2,301
44
NHS
Grampian
29
£61,552
£114
£153
£1,425
£66
£1,759
35
NHS
Grampian
92
£699,501
£120
£240
£562
£1,674
£63
£2,660
NHS
Greater
Glasgow &
Clyde
263
34
£207,640
£120
£240
£1,674
£63
£2,097
NHS
Greater
Glasgow &
Clyde
99
31
£98,706
£168
£604
£528
£1,289
£79
£2,668
37
NHS
Highland
19
£47,074
£168
£604
£1,289
£79
£2,140
22
NHS
Highland
0
£0
£0
0
NHS
Island
Boards
3
£12,003
£114
£228
£1,025
£134
£1,500
8
NHS
Island
Boards
21
£262,801
£114
£161
£422
£1,320
£53
£2,069
127
NHS
Lanarkshire
8
£79,075
£114
£161
£1,320
£53
£1,647
48
NHS
Lanarkshire
39
£256,175
£134
£119
£704
£1,721
£48
£2,725
94
NHS
Lothian
22
£105,210
£136
£119
£1,721
£48
£2,023
52
NHS
Lothian
21
£89,755
£105
£236
£574
£1,298
£31
£2,244
40
NHS
Tayside
16
£52,045
£114
£236
£1,298
£31
£1,679
31
NHS
Tayside
Consolidated surgical costs for carotid endarterectomy, based on whether the patient returns to a
stroke ward or has a separate admission to a surgical ward
Costing methodoly for procedures carried out on
existing inpatients where after surgery the patient
returns back to the stroke (general medicine) ward
Table 3-3
3.5
Limitations
The current report has a number of limitations in that it is primarily based on an overall
model which encompasses a number of smaller models. The epidemiological model
balances across Scotland and is within 10% for individual NHS boards. It has therefore
been assumed to be robust and to generalise to events in future. Other important
assumptions are set out below.
•
On full implementation of SIGN 108, NHS boards will not transfer patients across
boundaries for thrombolysis or carotid endarterectomy.
•
An appropriate number of beds are available in the short term to accommodate the
anticipated demand for patients receiving timely thrombolysis and carotid
endarterectomy. Such interventions will reduce the demand for beds in the longer
term but there will be a mismatch between the immediate requirements and
realising the longer term benefit.
•
Each hospital modelled to deliver thrombolysis has sufficient beds in a high
dependency or intensive care unit available to accommodate the patients receiving
such therapy. These patients should be monitored for adverse events during the
immediate few hours after delivery of the drug.
•
No growth in the number of stroke patients managed beyond the 2007 mid-year
population baseline is assumed.
•
Staff and facilities will be shared efficiently across Scotland. For example, there may
be a need for an extra 4 WTE specialist nurses across Scotland to provide timely
thrombolysis. This may equate to, say, 0.2 WTE of a nurse in one hospital.
Recruiting such small increments of staff may not be possible, in which case the
staff numbers required will be a material underestimate.
•
The terminology refers to bed days ‘saved’, being bed days that will no longer be
required because the intervention reduces the risk of future strokes. In reality these
beds are likely to be occupied by patients with other conditions and thus the beds
will still be used.
•
The analyses do not aggregate the resources required to implement a revised
service with the potential savings from fewer clinical events. This is partly because
of timing differences, but also because the two estimates are made using different
approaches. However, users may wish to consider a net table.
•
Some significant cost categories have been excluded, particularly the cost of
service redesign and associated training and recruitment costs.
•
The role of telemedicine has also not been considered.
The analysis is not intended to be an absolute definitive solution to the implementation
challenges that are faced by NHS boards in Scotland either currently or when
implementing SIGN 108. Much of the work which is being presented here will have to be
repeated as time progresses, particularly as the true admission pattern for thrombolytic
therapy is revealed at individual board level.
18
4
SCOTTISH STROKE EPIDEMIOLOGY
4.1
Introduction
In order to better understand how implementing the key recommendations in SIGN 108
can improve patient outcomes it has been necessary to undertake an epidemiological
study of stroke as it relates to hospital admissions, rates of survival, the possibility of
recurrence and by inference the likelihood of dependency. The principal drivers behind
this study have been taken by way of extension from the published work of the
Oxfordshire Community Stroke Project 1981-1986 (OCSP)12-14 and the CommunityBased Stroke Incidence in a Scottish Population, the Scottish Borders Stroke Study
1998-2000 (SBSS)2.
This section details the work that has been undertaken at both a national and local level
in relation to stroke for the years ended 31 March 2006, 2007 and 200818. From the
information gathered, a model has been developed at a national level which predicts the
mortality of patients who have been admitted to hospital for the first time as a result of
their stroke to within 99% accuracy. At NHS board level the same model can predict
mortality, to within 90% or greater accuracy, in each of the 3 years.
4.2
Incidence of a first hospital admission as a result of stroke or TIA
Scotland has some of the best health service data in the world, in particular the SMR01
database of hospital admission records and the GROMR database of mortality records,
which are held by ISD and GROS respectively. The high quality data, consistency,
national coverage and the specific ability to link data between the two databases in
order to allow patient based analysis and follow up has been fundamental in the
analysis of patients who have been admitted to hospital for stroke or TIA.
Following the protocols defined in both the SBSS and OCSP in relation to first ever
stroke both ISD and GROS were asked to deliver data based on the following selection
criteria from the ICD 10 codes for cerebrovascular disease. Full details of the codes are
provided in Appendix 4:
• For hospital admissions:
Include all patients who had a unique admission record (with subsequent discharge)
in the range of ICD 10 codes specified for cerebrovascular disease including TIA’s for
each of the years ended 31 March 2006–31 March 2008 inclusive.
• For mortality records:
Include all deaths recorded (including autopsy) in the range of ICD 10 codes
specified for cerebrovascular disease including TIA’s for each of the years ended 31
March 2006–31 March 2008 inclusive.
19
• Linked data:
For hospital admissions, link the patient identification number and scan through the
historical database records for a period of up to 10 years and eliminate any
corresponding record that has had a previous entry in any of the ICD 10 codes
specified.
For mortality records, link the patient identification number and scan through the
SMR01 database records and eliminate any corresponding admission record found
that had an entry in any of the ICD 10 codes specified.
The resultant output combines unique records for patients who have either been
admitted on the first occasion with a diagnosis of stroke or TIA (discharge code) or have
died in the community as a result of their stroke, having never been admitted to hospital
historically for the condition. The unique records of hospital admissions can be indexed
within each of the individual years and linked back into the SMR01 database to search
for further information based on the patients’ identification number. Historical
information such as the last known hospital admission prior to the current event has
revealed the growing problem of liver toxicity, brought about through drug and alcohol
abuse, particularly in the younger cohort of patients being admitted for stroke in
Scotland. Whilst for older patients, the increasing significance of diabetes type 2 and
clinical obesity in relation to stroke is becoming more evident. Likewise, cross
referencing the linked patient identification numbers for each of the years in question to
the GROMR database has provided detailed information on the survival rates following
stroke at 1, 3, 6 and 12 months, regardless of whether the patient died in hospital or in
the community after having been discharged19.
Appendices 5–1 to 5–5 provide details of the consolidated results for Scotland for the
year ending 31 March 2007, which is the most recent year where all data collected
through the SMR01 database is most complete.
As a result of the extensive epidemiological studies carried out in the preparation of this
report, there is some evidence to suggest that the rate of recurrence of stroke, but not
TIA, in patients who have originally presented for a hospital admission in an historical
period in excess of 1 year is increasing. Table 4–1 analyses hospital admissions in the
years ending 31 March 2005, 2006 and 2007, being the last three years in which the
ISD SMR01 database has complete hospital submission records for patient admittance
and subsequent re-admittance following discharge. Recurrent events are linked to a first
ever admission in each of the years in question. The difference between total first ever
events and actual admissions indicates that a patient cohort has been admitted from a
prior period and that the percentage of patients this number represents is increasing.
20
Table 4-1
Re-admission rates estimated from data collected from the ISD
SMR01 database
Annual readmission rates calculated from
Stroke
total admissions & first ever stroke
Classifications
presentations
Recurrent
%
Total actual event from
Additional
admissions a prior
recurrence
year
First ever
event
Recurrent
events
Total
events
Readmission rate for 2005
Transient
Readmission rate for 2006
Ischaemic Attack Readmission rate for 2007
Average readmission from prior years
1,557
1,545
1,625
1,576
247
252
240
246
1,804
1,797
1,865
1,822
2,040
2,011
2,061
2,037
236
214
196
215
15.2%
13.9%
12.1%
13.7%
Readmission rate for 2005
Haemorrhagic
Readmission rate for 2006
Stroke
Readmission rate for 2007
Average readmission from prior years
1,185
1,165
1,198
1,183
126
137
131
131
1,311
1,302
1,329
1,314
1,544
1,498
1,561
1,534
233
196
232
220
19.7%
16.8%
19.4%
18.6%
Readmission rate for 2005
Ischaemic Stroke Readmission rate for 2006
Readmission rate for 2007
Average readmission from prior years
6,334
6,112
5,879
6,108
1,033
965
881
960
7,367
7,077
6,760
7,068
8,706
8,339
8,198
8,414
1,339
1,262
1,438
1,346
21.1%
20.6%
24.5%
22.1%
While there is evidence that a simple score (ABCD or ABCD2) can be used to identify
patients who, following an initial TIA, are likely to be at risk of developing an ischaemic
stroke event, the admissions history from the SMR01 database will not record all of
these, unless the stroke results in a hospital admission. What can be established is that
the relationship between age and the percentage of multiple hospital re-admissions
differs between TIA and both haemorrhagic and ischaemic stroke. For those suffering a
TIA, multiple re-admissions are more prevalent in the over 65 age groups, whilst in
either haemorrhagic or ischaemic stroke a greater percentage of stroke patients under
the age of 65 are presenting for repeat admissions, as detailed in Table 4–2.
Table 4-2
Annual re-admission rates estimated from first ever hospital
admissions
Stroke
Annual readmission rates calculated from
Total
Classifications first ever stroke presentations
population
0 - 44
years
45 - 54
years
55 - 64
years
65 - 74
years
75 - 84
years
85+
years
Readmission rate for 2005
Transient
Readmission rate for 2006
Ischaemic Attack Readmission rate for 2007
Average readmission rate - current year
15.9%
16.3%
14.8%
15.6%
15.4%
3.6%
10.8%
9.9%
15.2%
15.2%
7.0%
12.5%
17.8%
15.3%
8.1%
13.7%
13.8%
16.1%
14.4%
14.8%
16.5%
18.3%
20.2%
18.4%
16.7%
19.4%
18.5%
18.2%
Readmission rate for 2005
Haemorrhagic
Readmission rate for 2006
Stroke
Readmission rate for 2007
Average readmission rate - current year
10.6%
11.8%
10.9%
11.1%
19.0%
15.9%
11.0%
15.3%
13.6%
14.9%
9.1%
12.5%
13.2%
15.3%
12.4%
13.7%
11.4%
8.9%
13.7%
11.4%
8.9%
10.3%
9.5%
9.6%
4.2%
11.2%
9.3%
8.2%
Readmission rate for 2005
Ischaemic Stroke Readmission rate for 2006
Readmission rate for 2007
Average readmission rate - current year
16.3%
15.8%
15.0%
15.7%
19.1%
19.3%
14.9%
17.8%
20.6%
17.2%
15.7%
17.8%
18.0%
15.9%
15.5%
16.5%
17.4%
18.1%
16.5%
17.3%
16.5%
15.3%
15.3%
15.7%
11.8%
12.7%
12.3%
12.3%
21
The relationship between mortality and recurrent events which are likely to result in a
hospital re-admission can be explained by way of a clinical model.
Clinical model
The classification and natural history of clinically identifiable subtypes of cerebral
infarction has been described in detail as part of the OCSP12-14. In summary the four
different subtypes of infarct describe the estimated size of the lesion involved, the
likelihood of the cause and, where practicable, the level of recurrence that might be
expected for each of the groups on an annual basis. Table 4–3 details the four clinically
identifiable subtypes of cerebral infarction; Lacunar Infarcts (LACI or Lacunar Syndrome
LACS), Total Anterior Circulation Infarcts (TACI or Total Anterior Circulation Syndrome
TACS), Partial Anterior Circulation Infarcts (PACI or Partial Anterior Circulation
Syndrome PACS) and Posterior Circulation Infarcts (POCI or Posterior Circulation
Syndrome POCS). Rates of recurrence, population split, mortality and functional
outcome are from the original OCSP model. Information in relation to the likelihood of
carotid distortion and cardio-embolic origins, together with the estimated size of the
lesion, have also been included in Table 4–3 to illustrate the relationship between
anterior circulation infarcts and the disturbances in the carotid territory that are
associated with them.
Table 4-3
Classification of the subtypes of cerebral infarcts
OCSP classification of cerebral
infarcts
Clinical features:
Size of lesion
LACI
TACI
PACI
POCI
small
large
medium
Likelihood of carotid disturbance
low
high
high
Likelihood of cardio-embolic source
Likelihood of recurrent event
Average population split
Outcome at one year:
Mortality
Functional dependence
Functional independence
Total
low
9%
25%
high
6%
17%
high
17%
34%
small to
medium
not
applicable
medium
20%
24%
11%
28%
61%
100%
60%
36%
4%
100%
16%
29%
55%
100%
19%
19%
62%
100%
The population split between the four subtypes is an average of the population taken
over the 5 years of this particular study between 1981–1986, where the average age
range was more heavily concentrated in the region of 60–85 years (72.5 ± 12.6
standard deviation). While the general stroke population of those who have been
admitted to hospital in Scotland is also predominantly concentrated within this group,
this should not detract from the fact that there are patients outside of this age range who
22
are also being admitted. Closer inspection of the age specific incidence rates published
in the OCSP illustrates that, although a very rare occurrence at that time, Partial
Anterior Infarcts were predominantly evident in the under 45 age group and thereafter
diminishing across the age groups as the other types of infarcts took prominence. The
current adaptation of the four subtypes of infarction is shown in Table 4–4 where the
number of potential infarcts is exclusive of the estimates for cryptogenic stroke. The
allocation between the four subtypes is based on a ‘best fit’ to reach the population
average reported in the original study.
Table 4-4
Extending the OCSP model of infarction subtypes to population age
groups
Original known admissions reported by ISD as
Total
at 31 March 2008
population
Number of FES - TIA's Admitted
1,607
Number of FES - Haemorrhagic Admitted
1,193
Number of FES - Infarcts Admitted
5,743
Total Admissions
8,543
0 - 44
years
70
95
204
369
45 - 54
years
168
102
380
650
55 - 64
years
301
173
774
1,248
65 - 74
years
400
288
1,298
1,986
75 - 84
years
442
343
1,871
2,656
85+
years
226
192
1,216
1,634
Predictive Outcome Model (Adapted from OCSP 1986) - Identifying the Four Subtypes of Infarction
Cryptogenic Stroke - Not Included
Cryptogenic Stroke - Patients Excluded
Clinically identifiable subtypes of cerebral
infarction
LACI - Lacunar Infarcts
TACI - Total Anterior Circulation Infarcts
PACI - Partial Anterior Circulation Infarcts
POCI - Posterior Circulation Infracts
5%
300
40%
82
20%
76
10%
77
5%
65
0%
0
0%
0
Total
population
25%
17%
34%
24%
Subtotal
0 - 44
years
5%
5%
85%
5%
100%
45 - 54
years
35%
10%
40%
15%
100%
55 - 64
years
25%
15%
35%
25%
100%
65 - 74
years
25%
15%
35%
25%
100%
75 - 84
years
24%
17%
34%
25%
100%
85+
years
25%
25%
25%
25%
100%
LACI - Lacunar Infarcts
TACI - Total Anterior Circulation Infarcts
PACI - Partial Anterior Circulation Infarcts
POCI - Posterior Circulation Infracts
1,347
948
1,842
1,306
6
6
104
6
106
30
122
46
174
105
244
173
308
185
432
308
449
318
636
469
304
304
304
304
Total Infarcts excluding Cryptogenic Stroke
5,443
122
304
696
1,233
1,872
1,216
Outcome of Infarct Analysis
Having established the prominence of the four subtypes of infarct the model has been
extended to look at the relationship between mortality in the first month and the
possibility of re-admission for those who have survived in the first 3 months following
discharge, as these are the only events which can be counted in the SMR01 database.
Appendices 5.6 and 5.7 detail the full extension of the OCSP model as a best fit within
the population groups for the total population of Scotland for the year ending 31 March
2007. These show the relationship between admission, survival and re-admittance. It is
not possible to state that all patients who are being re-admitted to Scottish hospitals are
as a result of a recurrent cerebrovascular event as this would require access to
individual clinical patient information. Nonetheless, this model provides a best fit
explanation to help predict the number of surviving patients who are likely to be re-
23
admitted following discharge, together with an estimate of the level of dependency. Its
outputs are consistent with the observed data for Scotland and for each NHS board
over the last 3 years. Hence it is considered to be robust and to generalise to the future.
Given the robustness of the model, which has predicted mortality at 1 month and readmission at 3 months to within 98.9% and 97.2% respectively over the same period,
these data have been applied to underpin a principle assumption in this report. In order
to ‘save beds’ through effective implementation of the recommendation in SIGN 108,
there has to be the correct number of beds available (or allocated) in the first instance
so that they can be ‘saved’ or reallocated within the general medical ward, where most
stroke units are contained. Appendix 6 details the expected number of patients who are
due for admittance in Scottish hospitals for the year ending 31 March 2009 based on
the mid-year population estimate provided by the GROS as at 30 June 2007.
24
5
TIMELY THROMBOLYSIS
5.1
Background
SIGN 108 recommended administration of thrombolytic therapy with alteplase, within
4.5 hours from stroke onset. The guideline noted this significantly reduces death and
disability at 90 days. The recommendations analysed within this report as required to
deliver such a service include:
• Emergency medical services should be redesigned to facilitate rapid access to
specialist stroke services.
• Stroke patients requiring admission to hospital should be admitted to a stroke unit
staffed by a co-ordinated multidisciplinary team with a special interest in stroke care.
• All patients with suspected stroke should have brain imaging immediately on
presentation.
• Patients admitted with stroke within 4.5 hours of definite onset of symptoms, who are
considered suitable, should be treated with 0.9 mg/kg (up to maximum 90 mg)
intravenous rt-PA.
5.2
Patient group
The patient subgroup assumed to receive thrombolytic therapy are those with a NIH
Stroke Scale (NIHSS) score between 5–22, be under 80 years old (in accordance with
the recommendation in its licence) and not experiencing a recurrent stroke within 3
months of the previous stroke. This group is forecast to be approximately 1,900 patients
annually. Of these almost 50% will not be able to be treated within the 4.5 hour window
or will be contraindicated. The anticipated numbers receiving the therapy is 1,015. This
compares to an estimated 205 patients who are currently receiving the therapy, an
increase of 810 patients.
Approximately 48% of these patients are assumed to present at hospital between the
hours of 8am–6pm, Monday to Friday, 27% outside these hours on a weekday and the
remainder at a weekend. No-one is presumed to present after 11pm. This arrival pattern
is based on that known for myocardial infarction, revised to assume a cut-off at 11pm,
following discussion with the clinical experts in NHS boards currently administering the
therapy.
5.3
Clinical benefit and associated resource savings
SIGN 108 notes the main clinical benefit from delivery of effective thrombolytic therapy
is that some patients are able to make a full or near-full recovery. A pooled analysis
suggests that approximately 10% of patients may make a full recovery, 45% will have a
significantly improved outcome and 45% will have no change in outcome or an adverse
outcome21.
25
The mean length of continuous inpatient stay for patients with a cerebrovascular
disease diagnosis (excluding transient attacks) is 27 days (see Section 3.2). A full
recovery is forecast to save 18 days, an improved recovery 9 days and no clinical
change or an adverse outcome is assumed to save zero days. The mean cost for an
inpatient bed in a medical ward has been estimated to be £277. This cost is a direct
cost primarily comprising staff and consumables. It excludes all overheads. Table 5–1
provides an estimate of bed days saved and related costs.
Table 5-1
Clinical benefits of additional thrombolytic therapy
Patients
Estimated number of patients receiving thrombolytic therapy
Forecast number of patients receiving thrombolytic therapy on
implementation
Additional number of patients likely to benefit
Forecast outcome for these additional cases:
10% full recovery
45% improved outcome
45% no change in outcome or adverse outcome
Number of bed days saved based on mean of 27 days:
10% full recovery saving 18 days
45% improved outcome - saving 9 days
Total number of additional bed days saved
Total bed days financial savings
5.4
NHSScotland
205
1,015
810
82
364
323
1,476
3,276
4,752
£1,316,304
Resource requirements
A key requirement to enable rapid access to specialist stroke services is that all patients
with suspected stroke are identified early by paramedics and admitted to a hospital with
a CT scanner as a minimum. Currently approximately 9% of stroke patients are
estimated to be admitted to hospitals without such a scanner. Discussions with SAS
have identified that:
• ambulance paramedics and technicians who have undergone training on stroke
recognition are accurate in their assessment of potential stroke patients, and
• virtually all such patients could be taken to an alternative hospital with a scanner at
no extra cost to the service and within SAS response time targets.
The analysis assumes NHS boards and SAS agree revised protocols such that all
potential stroke patients are delivered to hospitals with a CT scanner. Adopting such
protocols would be resource saving for both SAS and the NHS board, onward journeys
to hospitals with scanners would be avoided, together with the requirement for two
26
clinical assessments, one at each hospital. The sensitivity analysis explores the costs of
not adopting this approach.
However, SAS estimates that approximately 100 additional patients will require air
transport to enable them to reach hospital in sufficient time to be assessed for
thrombolytic therapy. These patients are forecast to be in the Highlands and Grampian.
Other key assumptions include that:
• the protocol with SAS nominates a lead hospital (or hospitals) for stroke within the
NHS board area. Thus, no cross boundary services are assumed. This is different
from the current position where NHS Greater Glasgow and Clyde provide services for
other boards
• each board has sufficient high dependency beds to manage the additional 810
patients to receive thrombolysis, and
• staff can be trained to deliver the therapy at minimal cost.
The staff resources required to deliver the drug are assumed to be:
• band 7 specialist nurse who is assumed to require 1 hour to establish time of onset
of stroke and prior history for each of the 1,900 patients who may be eligible for
the therapy. If the responses indicate that the patient may be eligible for the
therapy then the nurse is assumed to call for a consultant. Thereafter the nurse will
attend the patient receiving the therapy for a further 6 hours as the drug is
administered and to oversee the initial management.
• consultant stroke physicians. Each NHS board is assumed to manage with no
additional consultant resource during the core weekday hours. The additional
workload from thrombolysing patients who present during weekday core hours is
assumed to displace existing workload. However, this should reduce as the upfront
investment in delivering the therapy is rewarded by having more patients with
improved outcomes and consequently discharged earlier. This assumption will be
particularly challenging for smaller boards where the consultant may have duties to
conduct outwith the main hospital.
Seven NHS boards, being those forecast to have more than 30 patients per year
presenting for this therapy in the early evening, are forecast to recruit an extra 0.5 WTE
consultant each to cover five planned activities a week, providing cover until 8pm. All
other out of hours work is assumed to be undertaken by on-call arrangements.
The total staff required is estimated at 4.2 WTE nurses, 35 additional planned activities
per week to provide consultant resources in the early evening and 760 out of hours callouts.
27
The other resources required are the alteplase itself and an additional CT scan after
administration of the drug.
The recruitment of these specialist nurses is judged to be sufficient to ensure all
hospitals admitting stroke patients are staffed by a co-ordinated multidisciplinary team
with a special interest in stroke care.
5.5
Costs
The unit costs for the resources required are:
•
•
•
•
•
•
air ambulance: £3,140 (Appendix 7.1)
band 7 specialist nurse: £40,996 (Section 3.4)
consultant stroke physician: £125,197 including overheads at 22% (Section 3.4)
out of hours call-out: £397 (Section 3.4)
alteplase: £723 including VAT (source www.bnf.org)
CT scan: £127 (Appendix 7.3).
Table 5-2 provides the estimated cost of delivering thrombolytic therapy to an additional
810 patients in Scotland.
Table 5-2
Additional costs to deliver thrombolytic therapy to an additional 810
patients
Event
SAS for air ambulance
Alteplase
CT scan
Specialist nurse
Additional consultant sessions
Additional call-out sessions
Total costs
5.6
Total costs
£317,415
£585,630
£102,682
£172,183
£542,360
£302,059
£2,022,329
Sensitivity analysis
Two sensitivity analyses have been performed on the delivery of thrombolytic therapy.
The first models the cost of failure to put in place robust protocols between SAS and the
NHS boards for the delivery of possible stroke patients to hospitals equipped with a CT
scanner. The analysis by NHS board identifies that almost 1,100 additional journeys
would be incurred, of which over 800 are out of hours. Each journey is associated with
two A&E admissions, one of which could be saved by adopting the appropriate protocol.
The unit costs and total costs of these events are set out in Table 5–3. This optimisation
of delivery of patients could save almost £350,000 per annum.
28
Table 5-3
Additional costs if patients are not directed to hospitals with CT
scanners
Event
Unit costs
Unnecessary SAS journeys
Unnecessary A&E assessments
Total costs
£213
£101
Total
costs
£235,873
£111,483
£347,356
The second sensitivity analysis assumes that NHS boards prioritise commissioning
services Monday to Friday during core hours only. The additional number of patients to
be treated falls to around 390, or by just over 50%. All costs, other than for consultants,
fall in line with the patient numbers. Under the assumptions, no additional consultant
costs would be required, with thrombolysis displacing other activities. The total cost falls
to around £567,149, equivalent to £1,455 per patient. This compares to a cost per
patient of almost £2,500 for the 7 days a week, 24 hours a day service (see Table 5–4).
Table 5-4
Additional costs to deliver thrombolytic therapy to an additional 390
patients
Event
SAS for air ambulance
Alteplase
CT scan
Specialist nurse
Additional consultant sessions
Additional call-out sessions
Total costs
5.7
Total costs
£152,829
£281,970
£49,530
£82,820
0
0
£567,149
Analyses by NHS board
Tables 5–5 to 5–8 provide further information on the epidemiology, costs and benefits
from timely thrombolysis by NHS board. Table 5–5 presents the anticipated patients,
Table 5–6 the additional clinical benefit, Table 5–7 the additional costs and Table 5–8
the sensitivity analysis assuming SAS are not able to deliver patients to the specified
hospital for timely thrombolysis.
29
10%
45%
45%
48%
27%
25%
Lazarus Effect - mRS < = 1
Improved Outcome - mRS < = 2
No Change in Dependency
Total Outcome
Predicted Outcome as a result of Thrombolysis
102
457
457
1,015
11
47
47
105
NHS
Ayrshire &
Arran
NHS Scotland
total
population
NHS
Ayrshire &
Arran
NHS Scotland
total
population
76
43
40
158
105
1,015
Total Anticipated Candidates
909
511
473
1,894
32.6%
3.4%
47.4%
3.4%
Admittance Pattern using Model for Optimal
Reperfusion in ST Elevation MI on an Annual Basis
Patients Arriving 8am to 6pm Mon - Fri
Patients Arriving 6pm to 11pm Mon - Fri
Patients Arriving 8am to 11pm Sat / Sun
Total Allocation
158
59.7%
57.8%
1,894
194
103
33
265
2,427
1,248
400
3,276
NHS
Ayrshire &
Arran
Subtotal
Less:
Hospital Admission > 4.5 Hours
Contraindications for Diabetes & Liver
No FES Infarcts Admitted
No of Recurrent Strokes Admitted
Less Predicted Recurrence at 3 months
Total number of Dependent Infarcts
Less:
Age Restriction for rt-PA License
NHS Scotland
total
population
Anticipated patients by NHS board
Dependency Analysis of Ischaemic Strokes mRS
> 2
Table 5-5
3
11
11
25
NHS
Borders
20
11
10
41
NHS
Borders
25
41.9%
2.9%
41
55.9%
56
25
8
73
NHS
Borders
30
4
18
18
40
NHS
Dumfries &
Galloway
30
17
15
61
NHS
Dumfries &
Galloway
40
34.8%
4.0%
61
52.8%
88
45
16
117
NHS
Dumfries &
Galloway
7
33
33
74
NHS
Fife
65
37
34
136
NHS
Fife
74
44.2%
4.2%
136
57.2%
175
94
31
238
NHS
Fife
4
19
19
42
NHS
Forth Valley
43
24
22
89
NHS
Forth Valley
42
51.6%
4.1%
89
60.7%
115
51
20
146
NHS
Forth Valley
9
41
41
91
NHS
Grampian
83
47
43
172
NHS
Grampian
91
46.5%
4.3%
172
59.4%
222
105
37
290
NHS
Grampian
26
117
117
261
NHS
Greater
Glasgow &
Clyde
NHS
Greater
Glasgow &
Clyde
223
126
116
465
261
41.8%
3.7%
465
60.1%
NHS
Greater
Glasgow &
Clyde
561
303
90
775
5
23
23
51
NHS
Highland
55
31
29
114
NHS
Highland
51
55.1%
4.0%
114
54.0%
155
83
26
212
NHS
Highland
1
2
2
5
NHS
Island
Boards
11
6
6
23
NHS
Island
Boards
5
73.3%
3.7%
23
53.3%
29
18
5
42
NHS
Island
Boards
12
55
55
123
NHS
Lanarkshire
107
60
56
222
NHS
Lanarkshire
123
43.0%
3.6%
222
61.1%
271
137
44
363
NHS
Lanarkshire
13
59
59
130
NHS
Lothian
119
67
62
247
NHS
Lothian
130
47.8%
2.9%
247
52.8%
348
175
55
468
NHS
Lothian
7
31
31
68
NHS
Tayside
79
45
41
165
NHS
Tayside
68
56.4%
3.3%
165
57.4%
213
110
35
288
NHS
Tayside
18
9
10%
45%
45%
1,476
3,276
4,752
Total number of additional bed days saved
105
810
54
99
3
11
11
25
25
0
72
162
4
18
18
40
40
0
NHS
NHS
Dumfries &
Borders
Galloway
126
297
7
33
33
74
74
0
31
243
72
171
4
19
19
42
42
0
NHS
NHS
Fife Forth Valley
621
153
234
423
* 25 patients from Ayrshire & Arran trf to Glasgow
198
423
11
47
47
105
1,015
82
364
364
0
NHS
Ayrshire &
Arran
205
Current estimate of the number of cases of patients receiving
thrombolytic therapy in Scotland
Forecast number of cases of patients who could receive
thrombolytic therapy in the future
Additional number of patients likely to benefit
Likely outcome for these additional cases:
10% Lazarus Effect - mRS < = 1
45% Improved Outcome - mRS < = 2
40% No Change in Dependency
Number of bed days saved based on average of 27 days
10% Lazarus Effect - Saving 18 Days
45% Improved Outcome - Saving 9 Days
NHS Scotland
total population
Additional benefit from timely thrombolysis by NHS board
Additional benefits as a result of improved access to
Thrombolytic Therapy
Table 5-6
414
126
288
7
32
32
71
91
20
801
252
549
14
61
61
136
261
125
NHS
NHS
Greater
Grampian Glasgow &
Clyde
180
54
126
3
14
14
31
51
20
NHS
Highland
36
18
18
1
2
2
5
5
0
657
198
459
11
51
51
113
123
10
NHS
NHS
Island
Lanarkshire
Boards
585
180
405
10
45
45
100
130
30
NHS
Lothian
405
126
279
7
31
31
68
68
0
NHS
Tayside
Total additional costs likely to be incurred in the
implementation of thrombolytic therapy throughout
Scotland
Scottish Ambulance Service - additional air transport services
required to deliver patients for thromolysis
Air ambulance costs per journey
Total additional costs for the Ambulance Service
Estimated number of patients likely to receive thrombolytic
therapy within the 4.5 hour window and without
complications:
Estimated number of patients likely to have received
thrombolysis to date
Additional number of patients following successful
implementation who could receive thrombolytic therapy on a
timely basis:
Cost of Alteplase rt-PA including VAT as per BNF
Cost of CT scan event in target hospital for thrombolysis
Total additional costs for drugs and diagnostics
Additional specialist nursing hours
Band 7 WTE Specialist Nurse
Total additional costs for specialist nursing
Additional consultant planned activities covering Monday to
Friday OOH from 5.30 pm to 9.00 pm
Additional consultant planned sessions cancelled as a result of
an OOH call out Monday to Friday
Additional consultant planned sessions cancelled as a result of
an OOH call out at the weekend
Additional costs for WTE consultant sessions
Additional costs for cancelled sessions following call out
Total additional costs for Consultants
74
42
NHS
Grampian
21
40
£77,480
£24,047
£101,527
292
468
£542,360
£302,059
£844,419
£210,140
5
35
£2,022,329
£723
£117
£88,115
788
0.5
£20,498
£723
£127
£688,311
6,373
4.2
£172,183
0
105
810
205
32
£34,314
£0
£8,395
£8,395
10
11
0
£723
£150
£21,820
191
0.1
£4,100
25
0
£52,696
£0
£12,707
£12,707
15
17
0
£723
£72
£31,790
301
0.2
£8,199
40
0
£179,205
£77,480
£20,662
£98,142
34
18
5
£723
£151
£64,665
580
0.4
£16,398
74
0
£64,006
£0
£18,354
£18,354
22
24
0
£723
£169
£37,452
341
0.2
£8,199
42
0
£297,275
£77,480
£26,256
£103,736
43
23
5
£723
£98
£58,238
560
0.4
£16,398
71
20
91
40
NHS
NHS
Fife Forth Valley
1,015
25
NHS
NHS
Dumfries &
Borders
Galloway
38
£3,129
£118,902
105
NHS
Ayrshire &
Arran
101
£3,143
£317,415
NHS Scotland
total population
Additional costs from timely thrombolysis by NHS board
Additional costs as a result of improved access to
thrombolytic therapy
Table 5-7
£294,679
£77,480
£71,252
£148,732
116
63
5
£723
£140
£117,250
1,058
0.7
£28,697
136
125
261
NHS
Greater
Glasgow &
Clyde
£259,096
£0
£23,596
£23,596
29
31
0
£723
£206
£28,788
255
0.2
£8,199
31
20
51
63
£3,151
£198,513
NHS
Highland
£5,133
£0
£0
£0
0
0
0
£723
£304
£5,133
53
0.0
£0
5
0
5
£229,262
£77,480
£33,972
£111,452
56
30
5
£723
£102
£93,213
882
0.6
£24,598
113
10
123
NHS
NHS
Island
Lanarkshire
Boards
£217,764
£77,480
£37,645
£115,125
62
33
5
£723
£99
£82,141
790
0.5
£20,498
100
30
130
NHS
Lothian
£178,759
£77,480
£25,173
£102,653
41
22
5
£723
£155
£59,707
573
0.4
£16,398
68
0
68
NHS
Tayside
Number of In Hours Transfers for Thrombolysis
Number of Out of Hours Transfers for Thrombolysis
Unit Cost of Ambulance Transfer
Potential additional costs to the Ambulance Service
Unit Cost of A&E Attendance
Potential additional costs through duplicate attendance in
A&E
40
79
£242
£28,904
£99
£11,824
297
811
£213
£235,873
£101
£111,483
NHS
Ayrshire &
Arran
£0
0
0
£495
£0
£123
NHS
Borders
33
£2,736
9
19
£460
£12,973
£97
NHS
Dumfries &
Galloway
£4,489
18
35
£192
£10,261
£84
NHS
Fife
£0
0
0
£176
£0
£97
NHS
Forth Valley
£3,533
13
25
£264
£10,137
£92
NHS
Grampian
Sensitivity analysis: SAS unable to deliver patients to specified
hospital for timely thrombolysis by NHS board
Sensitivity Analysis: The SAS are in the position to make every
attempt at establishing the time of symptom onset this
information can allow patients to be delivered directly to the NHS Scotland
total population
target hospital for thrombolysis. If time of onset is
established at the closed place of diagnostics, there will be
duplicate patient transfers and duplicate A&E admissions:
Table 5-8
£40,717
101
341
£163
£72,139
£92
NHS
Greater
Glasgow &
Clyde
£9,126
20
43
£489
£30,992
£144
NHS
Highland
£18,606
73
134
£170
£35,145
£90
NHS
Lanarkshire
£13,255
0
86
£171
£14,718
£154
NHS
Lothian
£7,198
22
49
£292
£20,605
£102
NHS
Tayside
6
TIMELY CAROTID IMAGING AND CAROTID ENDARTERECTOMY
6.1
Background
SIGN 108 refers to the randomised controlled trials and related pooled data that report
best medical treatment plus carotid endarterectomy is clinically effective compared to
best medical treatment only in preventing recurrent stroke. The greatest benefit was
seen in patients with severe stenosis. This evidence base informed the SIGN 108
recommendations on carotid endarterectomy to include that:
• all patients with carotid artery stroke without severe disability, (mRS ≤2) or TIA
ischaemic attack should be considered for carotid endarterectomy as soon as
possible after the index event
• carotid endarterectomy should be considered in all:
- male patients with a carotid artery stenosis of 50–99%
- female patients with a carotid artery stenosis of 70–99% and
• carotid endarterectomy should be performed as soon as the patient is stable and fit
for surgery, ideally within 2 weeks of event.
6.2
Patient group
The relevant patient group for this intervention is those patients with severe stenosis
who are fit enough for surgery as measured by the modified Rankin Scale or mRS ≤2.
The epidemiological model predicts that the annual incidence could be approximately
11,865 people. Approximately 6,060 of these will be inpatients and the balance will be
identified at neurovascular outpatient clinics. The inpatients include some 500 patients
who recover sufficiently following thrombolysis to benefit from surgery.
It is estimated that around 50% of these patients will not be judged suitable for surgery
for various reasons, to include co-morbidities. As noted in the guideline age in itself is
not a restriction. Of the remaining 6,010 it is predicted that the carotid Doppler results
will show that 80% of the TIA’s and 75% of relevant inpatients have stenosis, with 25%
being sufficiently severe to require surgery. Thus approximately 1,160 patients are
judged to meet the criteria in SIGN 108 for carotid endarterectomy; of these 395 (35%)
will be inpatients and the remaining 765 outpatients. This information is presented in
Table 6–1.
Currently approximately 552 carotid endarterectomy procedures are performed in
Scotland annually; 200 on inpatients and 350 on outpatients. The forecast additional
number of procedures is 608, being 194 on inpatients and 414 on outpatients.
34
Table 6-1
Calculation to estimate number of patients eligible for surgery
Patient groups
TIA's admitted mRS ≤2
TIA's in outpatients mRS ≤2
Infarcts admitted mRS ≤2
Infarcts in outpatients mRS ≤2
Total patients including thrombolysis with mRS ≤2
Of these patients fit for surgery:
TIA's admitted
TIA's outpatients
Infarcts admitted
Infarcts outpatients
Total patients fit for surgery
Of these patients with stenosis:
TIA’s with stenosis
Infarcts with stenosis
Total patients with stenosis
Patients with severe stenosis and fit for surgery
Of which:
inpatients
outpatients
6.3
Number of patients
in Scotland
2,084
3,187
3,980
2,615
11,866
1,093
1,584
2,037
1,294
6,008
2,141
2,497
4,638
1,160
395
765
Clinical benefit and associated resource savings
SIGN 108 notes the main clinical benefit from performing timely carotid endarterectomy
is to prevent future strokes. The guideline provides the NNT to prevent one ipsilateral
stroke at 5 years in patients with severe stenosis. The NNT rises steeply with the delay
between time of surgery and the primary event. Surgery performed within 2 weeks of
the event is associated with a NNT of 5 but at longer than 12 weeks the NNT rises to
125.
Records from SSCAS show that of the 552 patients currently undergoing this procedure
only 150 have it within 30 days of the event. Applying a NNT of 10 to these 150 events
suggests the current intervention is preventing approximately 15 strokes at 5 years.
Successful implementation of the recommendations in SIGN 108 could result in NHS
boards treating 1,160 patients within 14 days, thereby achieving a NNT of 5 and
preventing 232 strokes at five years. The additional 217 strokes prevented are
equivalent to approximately 5,860 bed days assuming a mean bed day stay of 27 days
per stroke patient (source ISD). The financial savings, assuming a mean direct cost for
an inpatient bed of £277 (see Section 3.2) is £1.62 million.
35
6.4
Resource requirements
The clinical resources required to perform a carotid endarterectomy on a patient who is
already in hospital is assumed to be an additional MRI or equivalent scan, 1.5 hours in
theatre (to include recovery) and an ultrasound post-surgery to inform the prognosis.
It is assumed each outpatient will receive the scan and theatre time and spend 2 nights
in hospital immediately prior to and post-surgery. Some surgeons may choose to
perform the operation without routinely requiring the patient to be hospitalised for 2
nights once they are familiar with the procedure and associated risks and complications.
The additional procedure related staff requirements are assumed to be:
• a surgeon who spends 2 hours with each patient,
• two theatre nurses (a band 5 and band 6 specialist nurse) who each require 1.5
hours, and
• an anaesthetist incurring 1.5 hours.
The additional staff required to carry out 608 extra procedures are 1.1 WTE surgeons,
0.65 WTE each of a band 5 and band 6 theatre nurse and 0.65 WTE anaesthetist.
The staff required for the additional scans is addressed in Section 7.
6.5
Costs
The unit costs associated with performing a carotid endarterectomy during an inpatient
stay are estimated at £1,855 (see Section 3.4 and Table 3–3). Conducting the
procedure on an outpatient is estimated to incur a cost of £2,443, with the difference
being the cost of 2 overnight stays in a surgical ward. Applying these costs to an
additional 194 inpatient and 414 outpatient procedures gives a total incremental cost of
£1.38 million. This is the central estimate of the additional costs of performing carotid
endarterectomy in line with the recommendations in SIGN 108.
6.6
Sensitivity analysis
An obvious sensitivity analysis is around patient numbers. For example, if an extra 300
patients are eligible for such a procedure then the costs would increase in proportion.
Thus the cost to manage 608 patients is estimated to be £1.38 million, and the costs to
manage 908 estimated at £2.06 million [being £1.38*908/608].
The analysis assumes that consultants can identify the 50% who are unlikely to be fit for
surgery without undertaking a carotid Doppler examination. If, however, this is not the
case then the cost is underestimated by £0.93 million; the cost of 5,570 visits to a
general surgery outpatient clinic plus a carotid Doppler examination. The combined
mean cost of these is £167 for each NHS board (see Section 3.4 and Table 3–3).
36
6.7
Analyses by NHS board
Tables 6–2 to 6–5 provide further information on the epidemiology, costs and benefits
from timely carotid endarterectomy by NHS board. Table 6–3 presents the estimated
clinical benefit, Table 6–4 the estimated additional costs to achieve timely carotid
endarterectomy, and Table 6–5 the sensitivity analysis of the higher costs that would be
incurred if a carotid Doppler scan is required to assess patients before surgery.
37
No of TIA's Likely to have Stenosis
No of Infarcts Likely to have Stenosis
Subtotal
Number of Patients with Stenosis severe enough to
require surgery
Outcome from Carotid Dopplar Examination for
Level of Stenosis
No of TIA's Admitted
No of TIA's in NV Outpatients
No of Infarcts - FES Admitted
No of Infarcts - NV Outpatients
Total Patients Including Thrombolysis
149
179
328
82
1,160
25
49
52
101
NHS
Borders
NHS
Ayrshire &
Arran
NHS Scotland
total
population
2,141
2,497
4,638
26
35
45
25
131
86
100
166
73
425
1,093
1,584
2,037
1,294
6,008
NHS
Borders
NHS
Ayrshire &
Arran
NHS Scotland
total
population
Number of Patients Scheduled for Carotid
Dopplar as First Line Investigation for Carotid
Stenosis
145
419
5,858
38.1%
14.5%
Number of Patients Restricted from Surgery
35.2%
14.4%
NHS
Borders
37.2%
13.0%
NHS
Ayrshire &
Arran
53
78
91
54
276
2
10
Estimate of patients too infirm to survive surgery
Contraindications - T2DM and Clinical Obesity
Restrictions on Patients being put forward for
Surgery
No of TIA's Admitted
No of TIA's in NV Outpatients
No of Infarcts - FES Admitted
No of Infarcts - NV Outpatients
Total Patients Including Thrombolysis
NHS Scotland
total
population
NHS
Ayrshire &
Arran
NHS Scotland
total
population
Independency Analysis of Ischaemic Strokes &
CBV Events mRS < = 2 post thrombolysis
161
206
329
148
844
NHS
Borders
53
508
Total Additional Patients
2,084
3,187
3,980
2,615
11,866
12
11
42
102
406
Improvements in mRS < = 1 (Discharged)
Improvements in mRS < = 2 (No Discharge)
NHS
Borders
NHS
Ayrshire &
Arran
NHS Scotland
total
population
Additions as a result of Thrombolysis
53
78
81
52
263
NHS
Borders
161
206
287
137
791
NHS
Ayrshire &
Arran
2,084
3,187
3,574
2,513
11,358
No of TIA's Admitted
No of TIA's in NV Outpatients
No of Infarcts - FES Admitted
No of Infarcts - NV Outpatients
Total Patients excluding Thrombolysis
NHS Scotland
total
population
33
46
85
131
NHS
Dumfries &
Galloway
28
30
67
47
172
NHS
Dumfries &
Galloway
193
40.9%
12.0%
NHS
Dumfries &
Galloway
58
65
139
102
364
NHS
Dumfries &
Galloway
20
4
16
NHS
Dumfries &
Galloway
58
65
123
98
344
NHS
Dumfries &
Galloway
68
123
148
271
NHS
Fife
73
81
140
58
352
NHS
Fife
381
37.2%
14.8%
NHS
Fife
147
175
286
124
732
NHS
Fife
37
7
30
NHS
Fife
147
175
256
117
695
NHS
Fife
38
51
91
113
204
NHS
Forth Valley
42
72
101
51
265
NHS
Forth Valley
244
35.6%
12.3%
NHS
Forth Valley
79
142
189
99
509
NHS
Forth Valley
21
4
17
NHS
Forth Valley
79
142
173
94
488
NHS
Forth Valley
79
110
207
317
NHS
Grampian
81
57
185
91
413
NHS
Grampian
430
37.1%
13.8%
NHS
Grampian
171
119
365
188
843
NHS
Grampian
46
9
36
NHS
Grampian
171
119
328
179
797
NHS
Grampian
362
NHS
Greater
Glasgow &
Clyde
736
712
1,448
NHS
Greater
Glasgow &
Clyde
290
630
514
436
1,870
1,675
35.0%
12.2%
NHS
Greater
Glasgow &
Clyde
NHS
Greater
Glasgow &
Clyde
524
1,226
951
843
3,544
130
26
104
NHS
Greater
Glasgow &
Clyde
NHS
Greater
Glasgow &
Clyde
524
1,226
847
817
3,414
59
104
133
237
NHS
Highland
71
59
116
62
308
NHS
Highland
349
39.4%
13.7%
NHS
Highland
149
131
241
136
656
NHS
Highland
26
5
21
NHS
Highland
149
131
220
131
630
NHS
Highland
Patients who are potential candidates for carotid endarterectomy
Independency Analysis of Ischaemic Strokes &
CBV Events mRS < = 2 pre thrombolysis
Table 6-2
9
16
18
34
NHS
Island
Boards
20
0
23
0
44
NHS
Island
Boards
38
38.2%
8.4%
NHS
Island
Boards
38
0
43
1
82
NHS
Island
Boards
3
1
2
NHS
Island
Boards
38
0
41
0
80
NHS
Island
Boards
175
353
345
698
NHS
Lanarkshire
133
309
247
213
901
NHS
Lanarkshire
775
34.1%
12.1%
NHS
Lanarkshire
226
588
457
404
1,676
NHS
Lanarkshire
62
12
49
NHS
Lanarkshire
226
588
408
392
1,615
NHS
Lanarkshire
146
231
354
585
NHS
Lothian
130
158
272
201
761
NHS
Lothian
829
38.3%
13.9%
NHS
Lothian
255
345
556
434
1,590
NHS
Lothian
65
13
52
NHS
Lothian
255
345
504
421
1,525
NHS
Lothian
71
133
151
284
NHS
Tayside
113
53
162
39
368
NHS
Tayside
381
37.1%
13.8%
NHS
Tayside
221
113
333
82
749
NHS
Tayside
34
7
27
NHS
Tayside
221
113
306
75
715
NHS
Tayside
65
7
10.8%
1
82
16
15
405
552
150
27.2%
15
1,160
232
217
5,859
NHS
Ayrshire &
Arran
5
135
5
26
36.4%
0
4
11
7
189
7
33
0.0%
0
0
28
NHS
NHS
Dumfries &
Borders
Galloway
13
351
14
68
20.0%
1
7
35
9
243
10
51
16.7%
1
7
42
NHS
NHS
Fife Forth Valley
15
405
16
79
26.2%
1
17
65
Total additional costs likely to be incurred in the
implementation of timely carotid endarterectomy
throughout Scotland
Estimated current number of procedures carried out on patients
required to be admitted to a surgical ward having either been
previously discharged or having attended an outpatient clinic
Additional inpatient procedures for new /re admission
Procedure costs by health board
Additional costs for inpatient surgery
Estimated future number of procedures carried out on patients
required to be admitted to a surgical ward having either been
previously discharged or having attended an outpatient clinic
Estimated future number of procedures carried out on existing
inpatients where recovery post surgery is within the existing
stroke unit
Estimated current number of procedures carried out on existing
inpatients where recovery post surgery is within the existing
stroke unit
Additional inpatient procedures
Procedure costs by health board
Additional costs for existing inpatient surgery
£33,439
£32,707
10
£2,367
£23,670
10
£2,229
£22,290
414
£2,447
£1,013,192
£1,377,185
7
40
17
351
50
5
£1,807
£9,037
7
£1,593
£11,149
194
£1,876
£363,993
765
4
25
201
9
39
£10,469
3
£2,297
£6,891
17
20
2
£1,789
£3,578
11
13
NHS
NHS
Dumfries &
Borders
Galloway
32
NHS
Ayrshire &
Arran
395
NHS Scotland
total population
£69,429
20
£2,326
£46,520
21
41
13
£1,762
£22,909
14
27
£17,460
6
£2,120
£12,720
26
32
3
£1,580
£4,740
16
19
NHS
NHS
Fife Forth Valley
£28,960
8
£2,301
£18,408
36
44
6
£1,759
£10,552
29
35
£591,189
171
£2,660
£454,860
92
263
65
£2,097
£136,329
34
99
NHS
Greater
NHS
Grampian Glasgow &
Clyde
67
1809
72
362
35.7%
5
45
126
NHS
NHS
Greater
Grampian Glasgow &
Clyde
Estimated additional cost to achieve timely carotid endarterectomy
Additional costs as a result of improved timely carotid
endarterectomy
Table 6-4
Current estimate of the number of cases of patients having
Carotid Endarterectomy peformed in Scotland
Current estimate of the number of cases of patients having
Carotid Endarterectomy performed within 30 days where the
NNT = 10 to avoid one recurrent event (from SSCAS as at 31
December 2007)
Effectiveness Ratio currently:
Current estimate of the number of events avoided:
Future estimate of the number of cases of patients having
Carotid Endarterectomy peformed in Scotland
Assuming 100% effectiveness for all procedures carried out
within 14 days where the NNT = 5 to avoid one recurrent
event would potentially avoid:
Additonal events avoided:
Number of bed days saved based on average of 27 days
NHS Scotland
total population
Estimated clinical benefit from timely carotid endarterectomy
Additional benefits as a result of improved access to Carotid
Endarterectomy
Table 6-3
£22,427
6
£2,668
£16,008
31
37
3
£2,140
£6,419
19
22
NHS
Highland
10
270
12
59
34.0%
2
17
50
NHS
Highland
35
945
35
175
0.0%
0
0
29
£7,502
0
£0
£0
0
0
5
£1,500
£7,502
3
8
£285,210
106
£2,069
£219,314
21
127
40
£1,647
£65,896
8
48
NHS
NHS
Island
Lanarkshire
Boards
2
54
2
8
0.0%
0
0
3
NHS
NHS
Island
Lanarkshire
Boards
£210,573
55
£2,725
£149,875
39
94
30
£2,023
£60,698
22
52
NHS
Lothian
26
702
29
146
49.2%
3
30
61
NHS
Lothian
£67,819
19
£2,244
£42,636
21
40
15
£1,679
£25,183
16
31
NHS
Tayside
13
351
14
71
43.2%
1
16
37
NHS
Tayside
Estimated Attendance for TIA Minor Stroke Clinic
Restricted by time - outside of 30 days from onset
Restricted by complications and co-morbidity
Total % of Attendees unlikely to warrant surgery
Number of investigations 'saved'
Cost - Consultant Outpatient General Surgery
Cost - Carotid Dopplar Examination
Total cost saved or incurred by Screening
£928,958
49.4%
5,568
11,278
NHS Scotland
total population
791
35.2%
14.4%
49.6%
393
£61
£39
£39,300
NHS
Ayrshire &
Arran
263
38.1%
14.5%
52.6%
139
£115
£42
£21,823
NHS
Borders
40
344
40.9%
12.0%
52.9%
182
£30
£68
£17,836
NHS
Dumfries &
Galloway
695
37.2%
14.8%
52.0%
361
£140
£33
£62,453
NHS
Fife
488
35.6%
12.3%
47.9%
234
£119
£77
£45,864
NHS
Forth Valley
797
37.1%
13.8%
51.0%
406
£105
£61
£67,396
NHS
Grampian
3,414
35.0%
12.2%
47.2%
1,613
£105
£61
£267,758
NHS
Greater
Glasgow &
Clyde
630
39.4%
13.7%
53.1%
335
£121
£110
£77,385
NHS
Highland
1,615
34.1%
12.1%
46.2%
746
£89
£49
£102,948
NHS
Lanarkshire
1,525
38.3%
13.9%
52.1%
795
£175
£50
£178,875
NHS
Lothian
715
37.1%
13.8%
50.9%
364
£95
£35
£47,320
NHS
Tayside
Sensitivity analyses of higher costs incurred if carotid Doppler required assessing patient before
surgery
Sensitivity Analysis: Carotid examinations should be carried
out with a view to include the most potential candidates for
surgery taking into account, time of symptom onset vs delay
to initial referral and potential complications and comorbidities. The cost of simply screening is measured as:
Table 6-5
7
7.1
TIMELY CT DIAGNOSTICS
Background
SIGN 108 recommends that ‘All patients with suspected stroke should have brain
imaging immediately on presentation’ (recommendation 2.3.1). The use of brain imaging
is the first level of diagnostics necessary to distinguish whether a patient is presenting
with a haemorrhagic stroke or an ischaemic stroke, including transient ischaemic events.
The successful implementation of thrombolytic therapy within 4.5 hours of symptom
onset requires the assessment of potential candidates using a CT head scanner
immediately on arrival in hospital. This may require the patient to take precedent over
others waiting for a scan, thereby interrupting the service for 15 minutes. Other stroke
patients requiring scanning are less time critical and thus should be able to be planned
within a daily schedule.
No definite admission pattern for thrombolytic patients has been established. Feedback
from some NHS boards indicates it is likely that a number of potential patients will
present mid morning when radiology departments are often at their busiest. Extensive
modelling has quantified the potential number of immediate scans required during this
peak time to be twice per week in the larger boards and once per fortnight in the smaller
boards. This assumes that all patients are delivered by SAS to the nominated target
hospital in each NHS board.
NHS Quality Improvement Scotland has published clinical standards on Stroke
Services: Care of the Patient in the Acute Setting for all patients admitted with a stroke.
These require that 80% of patients have CT/MRI imaging within 48 hours of admission.
The standards are under review with a proposal to require that 80% of patients have
CT/MRI imaging on the day of admission.
A model has been developed to measure the demands that CT scanning for stroke
places on radiology departments. This encompasses the resources and funding
required solely to manage patients with suspected stroke including TIA. This model
seeks to address some of the issues raised by members of the stroke managed clinical
networks who reported significant delays in the radiological diagnostics service. Such
services are tasked with delivering diagnostics to many other medical conditions, which
are subject to their own timeframes and waiting time initiatives. The following analysis
quantifies the resources required and costs of having a dedicated service for stroke.
NHS boards may be able to compare these resources to current service levels to
estimate whether additional resources are needed.
In addition, in the first year, each NHS board is assumed to require additional support
from a business administration manager to undertake the management and reporting of
inpatients and outpatients and model patient flows. This activity should assist in
optimising the resources required to support diagnostics, thrombolysis and carotid
endarterectomy.
41
7.2
Patient group
The patient group for timely CT scanning includes all diagnosed stroke inpatients plus
those who attend at a neurovascular outpatient clinic. In addition there are a number of
known stroke mimics whose symptoms on presentation are sufficiently similar to require
CT scanning as a first level diagnostic tool. The scan can eliminate this particular group
of patients from the stroke care pathway. The total patient group that gives rise to the
demand for CT diagnostics is detailed in Table 7–1.
Table 7-1
Patient groups requiring CT scanning facilities
Patient groups
Inpatient admittance (ISD epidemiology):
First ever hospital admission
Recurrent stroke event from current year
Recurrent stroke event from historical year
Uplift by 15% for mimics
Subtotal for inpatients
Outpatient attendance (SSCAS):
Estimated number of TIA patients
Estimated number of minor stroke patients
11% of patients with RAO or TMB
29% of patients with non CBV event
Subtotal for outpatients
NHSScotland total
Stroke
Mimic
Total
Attendance
8,814
1,339
1,767
1,759
13,679
3,187
2,513
1,075
2,825
17,620
5,659
9,600
23,279
Key: Retinal Artery Occlusion (RAO); Transient Monocular Blindness (TMB)
In addition, the 1,015 patients forecast to benefit from thrombolytic therapy are assumed
to receive a scan to assess any potential haemorrhagic activity as a result of the drug
administration. Thus, total demand is estimated to be almost 24,300 patients annually.
7.3
Clinical benefits
The clinical benefits associated with timely CT scanning are reported in Sections 5.3
and 6.3, being the clinical benefits attributable to timely thrombolysis and carotid
endarterectomy.
7.4
Resources
The resources required to meet the demand for CT scanning services in Scotland’s
hospitals have been calculated assuming 24,300 patients require a CT scan each year.
The annual demand is then expressed as a weekly demand assuming 50 operational
weeks per annum and no seasonality. Expressing this weekly demand in operational
machine hours, with each scan event taking 15 minutes, suggests that for Scotland a
42
total of 122 hours are required (see Table 7–2). This is equivalent to operating 25
scanners for 1 hour per day Monday to Friday. For the majority of NHS boards this will
be one scanner per hospital site providing acute stroke services, with the exception of
NHS Grampian and NHS Greater Glasgow and Clyde where it is equivalent to 1 hour
per weekday on two scanners per tertiary site.
Table 7-2
Calculation of operational CT scanning hours per week in Scottish
hospitals
Resources required for timely
CT scanning
NHS Ayrshire & Arran
NHS Borders
NHS Dumfries & Galloway
NHS Fife
NHS Forth Valley
NHS Grampian
NHS Greater Glasgow and Clyde
NHS Highland
NHS Island Boards
NHS Lanarkshire
NHS Lothian
NHS Tayside
NHSScotland
First
diagnostic
event
1,728
555
748
1,475
993
1,864
6,561
1,369
179
2,979
3,103
1,723
23,277
Additional
scan post
thrombolysis
105
25
40
74
42
91
261
51
5
123
130
68
1,015
Total
demand
1,833
580
788
1,549
1,035
1,955
6,822
1,420
184
3,102
3,233
1,791
24,292
Number
per
week
(50)
37
12
16
31
21
39
136
28
4
62
65
36
486
Operational
hours (15
min per
scan)
9.2
2.9
3.9
7.7
5.2
9.8
34.1
7.1
0.9
15.5
16.2
9.0
121.5
No of
scanners
extended
time
2
1
1
2
1
2
7
1
0
3
3
2
25
The staff resources required to provide a weekday service for each scanner are
assumed to be:
•
one 0.5 planned activity session for a stroke consultant to read the scans
•
0.2 WTE band 7 radiographer specialising in CT head scanning
•
0.2 WTE band 6 radiographer with an interest in CT head scanning
•
0.2 WTE band 3 helper, and
•
0.2 WTE band 2 clerical officer.
The annual resources required to provide a weekday service across Scotland are 625
planned activity sessions for consultants, 5 WTE band 7 radiographers, 5 WTE band 6
radiographers, 5 WTE band 3 helpers and 5 WTE band 2 clerical officers.
This simplistic approach provides sufficient capacity to scan all patients on a weekday
but not the two sevenths of inpatients; equivalent to approximately 4,340 inpatients who
will require a service at weekends. Increasing the resources to provide scanning
capability for those inpatients suggests the additional resources required are 737
43
planned activity sessions for consultants, 5.9 WTE band 7 radiographers, 5.9 WTE
band 6 radiographers, 5.9 WTE band 3 helpers and 5.9 WTE band 2 clerical officers.
Using this approach is consistent with assuming the number of appointments needed to
manage 24,300 scans is 28,640. The additional 18% capacity recognises some
outpatients will not attend the initial appointment and require a second appointment, the
need for repeat scans and cases where the scan takes more than 15 minutes.
An estimate of 3.8 WTE support from additional band 6 business administration
managers is forecast to be required across Scotland, in the first year, to support
implementation.
7.5
Costs
The unit costs and total costs for each resource are shown in Table 7–3.
Table 7-3
Unit cost and total cost to provide capacity to scan 24,300 people
with stroke symptoms per year
Resource
Stroke consultant
Band 7 radiographer
Band 6 radiographer
Band 3 helper
Band 2 clerical officer
Total for Scotland
Resources
required
15 planned
activities per week
5.9 WTE
5.9 WTE
5.9 WTE
5.9 WTE
Unit costs
£20,660 per
planned activity
£40,996
£34,332
£19,895
£17,602
Total costs
£309,900
£241,590
£202,319
£117,241
£103,729
£974,779
The additional cost of the 3.8 WTE band 6 business administration managers is
estimated at £128,745.
7.6
Sensitivity analysis
Information from SSCAS indicates that some NHS boards provide significantly more
outpatient clinics than are indicated to be required to manage this patient group.
44
8
REFERENCES
1. National Audit Office. Report by the Comptroller and Auditor General.
Department of Health. Reducing Brain Damage: Faster access to better stroke
care. HC 452 Session 2005-2006. 16 November 2005.
2. Syme P., Byrne A., Chen R., Devenny R., Forbes J. Community-based stroke
incidence in a Scottish population: the Scottish Borders Stroke Study. Stroke
2005; 36(9): 1837-43. (SBSS)
3. Scottish Intercollegiate Guidelines Network. Management of patients with stroke
or TIA: assessment, investigation, immediate management and secondary
prevention. A national clinical guideline. SIGN 108. 2008. Available from
www.sign.ac.uk
4. Mauskopf J. et al. Principles of Good Practice for Budget Impact Analysis: Report
of the ISPOR Task Force on Good Research Practice: Budget Impact Analysis.
Value in Health 2007; 10(5): 336-347.
5. Trueman P., Hutton J., Drummond M. Developing Guidance for Budget Impact
Analysis. Pharmacoeconomics 2001; 19(6): 609-621.
6. Trueman P., Cardow T. Independent Evaluation of the Resource Impact Tools
Developed Alongside the SIGN CHD Guidelines. York Health Economics
Consortium March 2008.
7. National Institute for Health and Clinical Excellence. Developing costing tools;
Methods guide. January 2008. Available from: www.nice.org.uk
8. Rothwell P., Gutnikov S., Warlow C. European Carotid Surgery Trialist’s C.
Reanalysis of the final results of the European Carotid Surgery Trial. Stroke
2003; 34(2): 514-23.
9. Audit Commission. National Report 2005. Managing the financial implications of
NICE guidance. Available from www.audit-commission.gov.uk
10. Scottish Goverment. Coronary Heart Disease and Stroke: Strategy for Scotland.
3 October 2002. available from www.scotland.gov.uk
11. NHS National Services Scotland. Scottish Stroke Care Audit. Stroke Services in
Scottish Hospitals; Data relating to 2005-2007. 2008 National Report. Available
from www.isdscotland.org
12. Bamford J., Sandercock P., Dennis M. et al. A prospective study of acute
cerebrovascular disease in the community: the Oxfordshire Community Stroke
Project 1981-86. 1. Methodology, demography and incident cases of first-ever
stroke. J Neurol Neurosurg Psychiatry 1988; 51: 1373-80
45
13. Bamford J., Sandercock P., Dennis M., Burn J., Warlow C. A prospective study of
acute cerebrovascular disease in the community: the Oxfordshire Community
Stroke Project 1981-86. 2. Incidence, case fatality rates and overall outcome at
one year of cerebral infarction, primary Intracerebral haemorrhage and
subarachnoid haemorrhage. J Neurol Neurosurg Psychiatry 1990; 53: 16-22
14. Bamford J., Sandercock P., Dennis M., Burn J., Warlow C. Classification and
natural history of clinically identifiable subtypes of cerebral infarction. Lancet
1991; 337: 1521-26
15. Murphy D. Information Services Division (ISD). Cerebrovascular Disease
Admissions in Scotland; episodes, continuous inpatient stays, number of patients
and estimated costs in the patient pathway of care for the financial years 2002/03
to 2007/08 inclusive. File Reference IR2008-01983 in response to a request by
Craig J. NHS Quality Improvement Scotland 13 August 2008.
16. Health Service Journal. Fast Thinking: Stroke Care 18-20. 12 March 2009
17. Caso V., Paciaroni M., Venti M., Palmerini F. et al. Determinant of outcome in
patients eligible for thrombolysis for ischaemic stroke. Vasc Health Risk Manag
2007; 3(5): 749-54
18. Murphy D. Information Services Division (ISD). Cerebrovascular Disease
Admissions & Mortality in Scotland; first ever occurrence of cerebrovascular
disease that has resulted in a hospital admission or that has resulted in death
without admission as a unique once only event. File Reference IR2008-02372 in
response to a request by Wallace G. NHS Quality Improvement Scotland 1
October 2008.
19. Murphy D. Information Services Division (ISD). Cerebrovascular Disease Unique
First Ever Admissions for Stroke or TIA in Scotland: Linked database results for
prior admission history, readmission and survival for the years 31 March 2006,
2007 and 2008. File Reference IR2008-02372 in response to a request by
Wallace G. NHS Quality Improvement Scotland 1 October 2008.
20. Hacke W., Donnan G., Fieschi C., Kaste M., von Kummer R., Broderick JP et al.
Association of outcomes with early stroke treatment: pooled analysis of
ATLANTIS, ECASS and NINDS rt-PA stroke trials. Lancet 2004; 363 768-74.
46
9
APPENDICES
Appendix 1
Key recommendations
The following recommendations were highlighted by the guideline development group
as being clinically very important and to be prioritised for implementation. Each
recommendation was then assessed as to whether it is a material change to current
practice and likely to have a material resource impact. If so, then the recommendation is
considered in this report. A brief commentary is provided for those recommendation
judged not to have a material impact on resource use.
SIGN 108 recommendation
Emergency medical services should be
redesigned to facilitate rapid access to specialist
stroke services.
Stroke patients requiring admission to hospital
should be admitted to a stroke unit staffed by a
co-ordinated multidisciplinary team with a
special interest in stroke care.
All patients with suspected stroke should have
brain imaging immediately on presentation.
All patients with non-disabling acute stroke
syndrome/TIA in the carotid territory who are
potential candidates for carotid surgery should
have carotid imaging.
Patients admitted with stroke within 4.5 hours of
definite onset of symptoms, who are considered
suitable, should be treated with 0.9 mg/kg (up to
maximum 90 mg) intravenous rt-PA.
For individuals aged up to 60 years who suffer
an acute MCA territory ischaemic stroke
complicated by massive cerebral oedema,
surgical decompression by hemicraniectomy
should be offered within 48 hours of stroke
onset.
Low-dose aspirin (75 mg daily) and dipyridamole
(200 mg modified release twice daily) should be
prescribed after ischaemic stroke or TIA for
secondary prevention of vascular events.
47
Commentary
Included in report
Included in report
Included in report
Included in report
Included in report
Included in report
Not included in report as this is current
practice
http://www.isdscotland.org/isd/servlet/File
Buffer?namedFile=QOF_Scot_200405_to_
200708_indicators_lookup.xls&pContentDi
spositionType=attachment
SIGN 108 recommendation
Clopidogrel (75mg daily) monotherapy should
be considered as an alternative to combination
aspirin and dipyridamole after ischaemic stroke
or TIA for secondary prevention of vascular
events.
A statin should be prescribed to patients who
have had an ischaemic stroke, irrespective of
cholesterol level.
Statin therapy after haemorrhagic stroke is not
routinely recommended unless the risk of further
vascular events outweighs the risk of further
haemorrhage.
Commentary
Not included in report as this is current
practice
http://www.isdscotland.org/isd/servlet/File
Buffer?namedFile=QOF_Scot_200405_to_
200708_indicators_lookup.xls&pContentDi
spositionType=attachment
Not included in report as this is current
practice
http://www.isdscotland.org/isd/servlet/File
Buffer?namedFile=QOF_Scot_200405_to_
200708_indicators_lookup.xls&pContentDi
spositionType=attachment
Not included in report as this is current
practice
All patients with carotid artery territory stroke
Included in report
(without severe disability, mRS ≤2) or transient
ischaemic attack should be considered for
carotid endarterectomy as soon as possible
after the index event.
Carotid endarterectomy (on the internal carotid
Included in report
artery ipsilateral to the cerebrovascular event)
should be considered in all:
• male patients with a carotid artery stenosis of
50–99% (by NASCET method)
• female patients with a carotid artery stenosis
of 70–99%.
For all patients, carotid endarterectomy should
Included in report
be performed as soon as the patient is stable
and fit for surgery, ideally within two weeks of
event.
Information should be offered to patients and
carers in a variety of formats, including easy
access.
Care givers should be offered ongoing practical
information and training individualised for the
needs of the person for whom they are caring.
48
Judged not to require material additional
resources or present system redesign
Judged not to require material additional
resources or present system redesign
Appendix 2
Acknowledgements
Authors (NHS Quality Improvement Scotland)
Mr George M Wallace
Ms Joyce Craig
Senior Project Cost Accountant
Lead Health Economist
Authors’ acknowledgements
We would like to thank all colleagues who contributed to the development of the report, provided
responses to questionnaires and assisted in quality assuring the assumptions and pathways in
individual NHS boards. In particular we would like to thank:
Guideline development group members:
Dr Anthony Byrne
Ms Hazel Fraser
Professor Peter Langhorne
Dr Keith Muir
Dr Scott Ramsay
Dr Giles Roditi
Dr Paul Syme
Stroke Consultant, Stirling Royal Infirmary
Lead MCN Nurse for Stroke, NHS Fife
Professor of Geriatric Medicine, Glasgow Royal Infirmary
Consultant Neurologist, Southern General Hospital, Glasgow
Stroke Consultant, St John’s Hospital, Livingstone
Consultant Radiologist, Glasgow Royal Infirmary
Consultant Physician, Borders General Hospital, Melrose
NHSScotland colleagues:
Dr Mark Barber
Ms Katrina Brennan
Ms Denise Brown
Dr George Crooks
Professor Martin Dennis
Ms Anne Duthie
Dr Andrew Farrall
Dr James Godfrey
Mr Christian Goskirk
Dr Ian Hay
Dr Christine McAlpine
Ms Pamela Mclauchlan
Ms Morag Medwin
Mr David Murphy
Ms Stephanie Phillips
Mr David Potter
Ms Camilla Young
Lead Clinician Stroke, NHS Lanarkshire
Stroke MCN Manager, NHS Lanarkshire
Stroke MCN Manager, NHS Ayrshire & Arran
Medical Director, Scottish Ambulance Service
Professor of Stroke Medicine, University of Edinburgh
Service Development Manager, Scottish Centre for Telehealth
Consultant Neuroradiologist, Royal Infirmary Edinburgh
Lead Clinician Stroke, NHS Ayrshire & Arran
Stroke MCN Manager, NHS Highland
Lead Clinician Stroke, NHS Dumfries & Galloway
Lead Clinician Stroke, NHS Greater Glasgow and Clyde
Director of Finance, Scottish Ambulance Service
Stroke MCN Manager, NHS Lothian
Information Services Division
Acting GM PPU, Scottish Ambulance Service
Stroke MCN Manager, NHS Dumfries & Galloway
Stroke MCN Manager, NHS Greater Glasgow and Clyde
49
Appendix 3
Resource impact assessment process
Stage 1: Draft guideline at consultation stage
Stage 2: Identify those recommendations likely to have a material resource impact
Stage 3: Identify key cost drivers for each material recommendation and gather
information on potential clinical benefits, pathways and cost evidence
Stage 4: Develop model to estimate clinical benefits and associated resources and
costs – incorporate sensitivity analysis
Stage 5: Develop national clinical and resource impact report
Stage 6: Determine links between national bodies and each NHS board and develop
cost template where required
Stage 7: Internal review with chair of the SIGN guideline development group and NHS
Quality Improvement Scotland
Stage 8: Circulate report and template to chair of guideline development group and
others for peer review; update report based on feedback and any changes following
consultations
Stage 9: Final sign-off
Stage 10: Publication, dissemination and impact assessment
50
Appendix 4.1 ICD-10 codes for stroke or TIA
G45
G45.0
G45.1
G45.2
G45.3
G45.4
G45.8
G45.9
I61
I61.0
I61.1
I61.2
I61.3
I61.4
I61.5
I61.6
I61.8
I61.9
I62
I62.0
I62.1
I62.9
I63
I63.0
I63.1
I63.3
I63.4
I63.6
I63.8
I63.9
I64
Source:
Transient cerebral ischaemic attacks and related syndromes
Excludes: neonatal cerebral ischaemia (P91.0)
Vertebro-basilar artery syndrome
Carotid artery syndrome (hemispheric)
Multiple and bilateral precerebral artery syndromes
Amaurosis fugax
Transient cerebral ischaemic attacks and related syndromes
Other transient cerebral ischaemic attacks and related syndromes
Transient cerebral ischaemic attack, unspecified
Intracerebral haemorrhage
Excludes: sequelae of intracerebral haemorrhage (I69.1)
Intracerebral haemorrhage in hemisphere, subcortical
Intracerebral haemorrhage in hemisphere, cortical
Intracerebral haemorrhage in hemisphere, unspecified
Intracerebral haemorrhage in brain stem
Intracerebral haemorrhage in cerebellum
Intracerebral haemorrhage, intraventricular
Intracerebral haemorrhage, multiple localised
Other intracerebral haemorrhage
Intracerebral haemorrhage, unspecified
Other nontraumatic intracranial haemorrhage
Excludes sequelae of intracranial haemorrhage (169.2)
Subdural haemorrhage (acute)(nontraumatic)
Nontraumatic extradural haemorrhage
Intracranial haemorrhage (nontraumatic), unspecified
Cerebral infarction
Excludes: sequelae of cerebral infarction (I69.3)
Cerebral infarction due to thrombosis of precerebral arteries
Cerebral infarction due to embolism of precerebral arteries
Cerebral infarction due to thrombosis of cerebral arteries
Cerebral infaction due to embolism of cerebral arteries
Cerebral infarction due to cerebral venous thrombosis, nonpyogenic
Other cerebral infarction
Cerebral infarction, unspecified
Stroke, not specified as haemorrhage or infarction
Cerebrivascular accident NOS
Excludes: sequelae of stroke (I69.4)
International Statistical Classification of Diseases and Related Health
Problems. Tenth Revision Volume 1. World Health Organisation,
Geneva 1992
51
Appendix 4.2 ICD-10 codes for other cerebrovascular diseases
I65
I65.0
I65.1
I65.2
I65.3
I65.8
I65.9
I66
I66.0
I66.1
I66.2
I66.3
I66.4
I66.8
I66.9
I67
I67.0
I67.1
I67.2
I67.3
I67.4
I67.5
I67.6
I67.7
I67.8
I67.9
I69
I69.0
I69.1
I69.2
I69.3
I69.4
I69.8
Source:
Occlusion and senosis of precerebral arteries, not resulting in cerebral
infarction
Excludes: when causing cerebral infarction (I63.-)
Occlusion and stenosis of vertebral artery
Occlusion and stenosis of basilar artery
Occlusion and stenosis of carotid artery
Occlusion and stenosis of multiple and bilateral precerebral arteries
Occlusion and stenosis of other precerebral artery
Occlusion and stenosis of unspecified precerebral artery
Occlusion and stenosis of cerebral arteries, not resulting in cerebral
infarction
Excludes: when causing cerebral infarction (163.-)
Occlusion and stenosis of middle cerebral artery
Occlusion and stenosis of anterior cerebral artery
Occlusion and stenosis of posterior cerebral artery
Occlusion and stenosis of cerebellar arteries
Occlusion and stenosis of multiple and bilateral cerebral arteries
Occlusion and stenosis of other cerebral artery
Occlusion and stenosis of unspecified cerebral artery
Other cerebrovascular diseases
Excludes: sequelae of the listed conditions (I69.8)
Dissection of cerebral arteries, nonruptured
Cerebral aneurysm, nonruptured
Cerebral atherosclerosis
Progressive vascular leukoencephalopathy
Hypertensive encephalopathy
Moyamoya disease
Nonpyogenic thrombosis of intracranial venous system
Cerebral arteritis, not elsewhere classified
Other specified cerebrovascular diseases
Cerebrivascular disease, unspecified
Sequelae of cerebrovasular disease
Sequelae of subarachnoid haemorrhage
Sequelae of intracerebral haemorrhage
Sequelae of other non traumatic intracranial haemorrhage
Sequelae of cerebral infarction
Sequelae of stroke, not specified as haemorrhage or infarction
Sequelae of other and unspecified cerebrovascular diseases
International Statistical Classification of Diseases and Related Health
Problems. Tenth Revision Volume 1. World Health Organisation,
Geneva 1992
52
Appendix 5.1 Incidence of first ever hospital admission for stroke and TIA for
year ending 31 March 2007
Population statistics mid year estimate
provided by GRO as at 30 June 2006
Age group analysis
% of total population
% reduction in population groups
Total
0 - 44
population
years
5,116,900 2,941,253
57.5%
45 - 54
years
713,310
13.9%
55 - 64
years
624,369
12.2%
12.5%
65 - 74
years
455,744
8.9%
27.0%
75 - 84
years
287,021
5.6%
37.0%
85+
years
95,203
1.9%
66.8%
Total
population
0 - 44
years
45 - 54
years
55 - 64
years
65 - 74
years
75 - 84
years
85+
years
1,625
65
142
284
437
465
232
1,625
0.32
65
0.02
142
0.20
284
0.45
437
0.96
465
1.62
232
2.44
I61 SMR01 Database ISD
Intracerebral GRO Mortality Records - I61
Haemorrhage Total Cases
Incidence
782
127
909
0.18
46
7
53
0.02
75
10
85
0.12
103
19
122
0.20
184
23
207
0.45
231
40
271
0.94
143
28
171
1.80
SMR01 Database ISD
I62 - Intracranial
GRO Mortality Records - I62
Haemorrhage
Total Cases
Incidence
416
50
466
0.09
36
1
37
0.01
24
1
25
0.04
66
3
69
0.11
93
8
101
0.22
136
14
150
0.52
61
23
84
0.88
SMR01 Database ISD
GRO Mortality Records - G45
GRO Mortality Records - I63
GRO Mortality Records - I69
Total Cases
Incidence
3,440
7
95
554
4,096
0.80
129
240
475
830
0
1
130
0.04
3
0
243
0.34
6
8
489
0.78
10
38
878
1.93
1,143
1
25
195
1,364
4.75
623
6
51
312
992
10.42
SMR01 Database ISD
GRO Mortality Records - I64
Total Cases
Incidence
2,432
900
3,332
0.65
59
2
61
0.02
129
7
136
0.19
271
16
287
0.46
548
72
620
1.36
831
316
1,147
4.00
594
487
1,081
11.35
75 - 84
years
1.62
1.47
8.75
10.22
11.84
85+
years
2.44
2.68
21.77
24.45
26.89
465
421
2,511
232
255
2,073
12.8%
21.3%
20.0%
41.0%
465
367
1,975
232
204
1,223
2,807
1,659
Stroke
Inpatient admission & GRO mortality
Classifications records with no previous history of CBV in
(ICD 10)
the year to 31 March 2007
SMR01 Database ISD
G45 - Transient GRO Mortality Records - Added to I63
Ischaemic Attack Total Cases
Incidence
I63 - Cerebral
Infarction
I64 Inconclusive
Stroke
Total
0 - 44
45 - 54
55 - 64
65 - 74
population
years
years
years
years
0.32
0.02
0.20
0.45
0.96
Incidence of TIA
0.27
0.03
0.15
0.31
0.68
Incidence of Haemorrhagic Stroke
1.45
0.06
0.53
1.24
3.29
Incidence of Cerebral Infarcts
Incidence of First Ever Stroke
1.72
0.10
0.69
1.55
3.96
Incidence of First Ever CBV Event
2.04
0.12
0.88
2.00
4.92
Predicted number of first ever cerebrovascular events
1,625
65
142
284
437
Predicted TIA's
1,375
90
110
191
308
Predicted Haemorrhagic Strokes
Predicted Ischaemic Strokes
191
379
776
1,498
7,428
% of first ever cerebrovascular events not admitted - death in the community
12.9%
8.9%
10.0%
11.5%
10.1%
% Haemorrhagic Stroke Deaths
% Ischaemic Stroke Deaths
20.9%
1.6%
2.6%
3.9%
8.0%
Number of patients admitted to Scottish hospitals in the year to 31 March 2007
1,625
65
142
284
437
Number of TIA's Admitted
1,198
82
99
169
277
Number of Haemorrhagic Admitted
5,879
188
369
746
1,378
Number of Ischaemic Infarcts Admitted
Total Number of Admissions
8,702
335
610
1,199
2,092
Events calculated from data collected
Source ISD19
53
Appendix 5.2 Survival rates for stroke and TIA after a first ever hospital
admission for year ending 31 March 2007
Number of TIA's
Number of haemorrhagic strokes
Number of ischaemic strokes
Total Admissions
Total
population
1,625
1,198
5,879
8,702
TIA
Survival rate
Haemorrhagic stroke
Survival rate
Ischaemic strokes
Survival rate
Outcome - Month 1 numbers survived
1,600
65
140
98.5%
100.0%
98.6%
736
55
73
61.4%
67.1%
73.7%
4,918
177
344
83.7%
94.1%
93.2%
Original admissions
Comparator Infarct Analysis - Known Deaths
Comparator Infarct Analysis - Predicted Deaths
961
954
0 - 44
years
65
82
188
335
11
7
45 - 54
years
142
99
369
610
55 - 64
years
284
169
746
1,199
25
19
65 - 74
years
437
277
1,378
2,092
75 - 84
years
465
367
1,975
2,807
85+
years
232
204
1,223
1,659
282
99.3%
114
67.5%
705
94.5%
435
99.5%
177
63.9%
1,227
89.0%
456
98.1%
219
59.7%
1,635
82.8%
222
95.7%
98
48.0%
830
67.9%
41
52
151
158
340
364
393
355
282
99.3%
108
63.9%
690
92.5%
425
97.3%
161
58.1%
1,162
84.3%
444
95.5%
194
52.9%
1,492
75.5%
209
90.1%
73
35.8%
675
55.2%
281
98.9%
105
62.1%
672
90.1%
414
94.7%
157
56.7%
1,124
81.6%
433
93.1%
175
47.7%
1,393
70.5%
190
81.9%
65
31.9%
593
48.5%
276
97.2%
102
60.4%
653
87.5%
405
92.7%
150
54.2%
1,076
78.1%
403
86.7%
160
43.6%
1,276
64.6%
170
73.3%
57
27.9%
521
42.6%
Outcome - Month 3 numbers survived
TIA
Survival rate
Haemorrhagic stroke
Survival rate
Ischaemic strokes
Survival rate
1,565
96.3%
661
55.2%
4,535
77.1%
65
100.0%
54
65.9%
177
94.1%
140
98.6%
71
71.7%
339
91.9%
Outcome - Month 6 numbers survived
TIA
Survival rate
Haemorrhagic stroke
Survival rate
Ischaemic strokes
Survival rate
1,522
93.7%
624
52.1%
4,293
73.0%
65
100.0%
53
64.6%
174
92.6%
139
97.9%
69
69.7%
337
91.3%
Outcome - Month 12 numbers survived
TIA
Survival rate
Haemorrhagic stroke
Survival rate
Ischaemic strokes
Survival rate
1,458
89.7%
591
49.3%
4,024
68.4%
Source ISD19
54
65
100.0%
53
64.6%
170
90.4%
139
97.9%
69
69.7%
328
88.9%
Appendix 5.3 Re-admission rates for stroke and TIA after a first ever hospital
admission for year ending 31 March 2007
Stroke
Number of patients readmitted at 3, 6 &
Classifications 12 months following a first ever
(ICD 10)
hospitalisation for a CBV event
SMR01 - Original admittance
45 - 54
years
55 - 64
years
65 - 74
years
75 - 84
years
85+
years
65
142
284
437
465
232
133
173
240
3
3
7
6
7
10
16
20
23
35
47
63
54
68
94
19
28
43
% Readmission at 12 months
14.8%
10.8%
7.0%
8.1%
14.4%
20.2%
18.5%
SMR01 - Original admittance
782
46
75
103
184
231
143
33
53
75
5
5
5
2
3
4
3
7
9
7
10
21
11
17
23
5
11
13
% Readmission at 12 months
9.6%
10.9%
5.3%
8.7%
11.4%
10.0%
9.1%
SMR01 - Original admittance
416
36
24
66
93
136
61
45
52
56
3
4
4
4
5
5
7
10
12
15
16
17
10
11
12
6
6
6
% Readmission at 12 months
13.5%
11.1%
20.8%
18.2%
18.3%
8.8%
9.8%
SMR01 - Original admittance
3,440
129
240
475
830
1,143
623
227
358
542
7
11
18
21
30
40
37
55
73
55
91
136
75
116
188
32
55
87
% Readmission at 12 months
15.8%
14.0%
16.7%
15.4%
16.4%
16.4%
14.0%
SMR01 - Original admittance
2,432
59
129
271
548
831
594
161
241
339
8
9
10
11
16
18
22
31
43
47
68
91
47
75
114
26
42
63
13.9%
16.9%
14.0%
15.9%
16.6%
13.7%
10.6%
SMR01 - Readmission at 3 months
I61 Intracerebral SMR01 - Readmission at 6 months
Haemorrhage SMR01 - Readmission at 12 months
SMR01 - Readmission at 3 months
I62 - Intracranial
SMR01 - Readmission at 6 months
Haemorrhage
SMR01 - Readmission at 12 months
I64 Inconclusive
Stroke
0 - 44
years
1,625
SMR01 - Readmission at 3 months
G45 - Transient
SMR01 - Readmission at 6 months
Ischaemic Attack
SMR01 - Readmission at 12 months
I63 - Cerebral
Infarction
Total
population
SMR01 - Readmission at 3 months
SMR01 - Readmission at 6 months
SMR01 - Readmission at 12 months
SMR01 - Readmission at 3 months
SMR01 - Readmission at 6 months
SMR01 - Readmission at 12 months
% Readmission at 12 months
Readmission summary for cerebral
infarcts at 12 months
Transient Ischaemic Attack
Haemorrhagic stroke (I61 & I62)
Ischaemic stroke (I63 & I64)
Readmission summary for infarcts at 3 months
Comparator Infarct Analysis - Known Readmissions
Comparator Infarct Analysis - Predicted Readmissions
Total
population
0 - 44
years
45 - 54
years
55 - 64
years
65 - 74
years
75 - 84
years
85+
years
14.8%
10.9%
15.0%
10.8%
11.0%
14.9%
7.0%
9.1%
15.7%
8.1%
12.4%
15.5%
14.4%
13.7%
16.5%
20.2%
9.5%
15.3%
18.5%
9.3%
12.3%
388
409
15
11
32
19
59
48
102
100
122
155
58
77
Source ISD19
55
Appendix 5.4 Prior admission of patients who had a first ever admittance for
stroke or TIA for year ending 31 March 2007
Stroke
Prior admissions identified for conditions
Classifications likely to be contra indicated for
(ICD 10)
thrombolysis & carotid surgery
Total
population
0 - 44
years
45 - 54
years
55 - 64
years
65 - 74
years
75 - 84
years
85+
years
SMR01 - Original admittance
1,625
65
142
284
437
465
232
SMR01 - Liver Complications
G45 - Transient
SMR01 - Type 1 Diabetes
Ischaemic Attack
SMR01 - Type 2 Diabetes
12
35
206
1
0
4
1
5
12
2
8
30
3
15
68
5
5
71
0
2
21
15.6%
7.7%
12.7%
14.1%
19.7%
17.4%
9.9%
SMR01 - Original admittance
782
46
75
103
184
231
143
I61 SMR01 - Liver Complications
Intracerebral SMR01 - Type 1 Diabetes
Haemorrhage SMR01 - Type 2 Diabetes
31
10
66
5
0
1
10
4
8
10
2
10
5
2
18
1
2
23
0
0
6
13.7%
13.0%
29.3%
21.4%
13.6%
11.3%
4.2%
SMR01 - Original admittance
416
36
24
66
93
136
61
SMR01 - Liver Complications
I62 - Intracranial
SMR01 - Type 1 Diabetes
Haemorrhage
SMR01 - Type 2 Diabetes
11
4
38
2
0
0
4
0
1
4
0
5
0
1
10
1
3
19
0
0
3
12.7%
5.6%
20.8%
13.6%
11.8%
16.9%
4.9%
SMR01 - Original admittance
3,440
129
240
475
830
1,143
623
SMR01 - Liver Complications
SMR01 - Type 1 Diabetes
SMR01 - Type 2 Diabetes
35
93
475
1
3
7
5
7
26
13
18
63
11
35
138
4
22
172
1
8
69
17.5%
8.5%
15.8%
19.8%
22.2%
17.3%
12.5%
SMR01 - Original admittance
2,432
59
129
271
548
831
594
SMR01 - Liver Complications
SMR01 - Type 1 Diabetes
SMR01 - Type 2 Diabetes
34
63
335
1
5
4
6
5
18
6
9
36
13
21
104
6
18
125
2
5
48
17.8%
16.9%
22.5%
18.8%
25.2%
17.9%
9.3%
% Total Complications Admitted
% Total Complications Admitted
% Total Complications Admitted
I63 - Cerebral
Infarction
% Total Complications Admitted
I64 Inconclusive
Stroke
% Total Complications Admitted
Complications summary by CBV event
Transient Ischaemic Attack
Haemorrhagic Stroke
Cerebral Infarcts
Complications summary by intervention
Contraindicated for Thrombolysis
Possible contraindications for carotid
surgery
Total
population
15.6%
13.4%
17.6%
Total
population
0 - 44
years
7.7%
9.8%
11.2%
0 - 44
years
45 - 54
years
12.7%
27.3%
18.2%
45 - 54
years
55 - 64
years
14.1%
18.3%
19.4%
55 - 64
years
65 - 74
years
19.7%
13.0%
23.4%
65 - 74
years
75 - 84
years
17.4%
13.4%
17.6%
75 - 84
years
85+
years
9.9%
4.4%
10.9%
85+
years
3.8%
5.3%
6.2%
6.2%
5.8%
2.5%
1.3%
13.6%
5.9%
11.0%
12.5%
17.1%
15.1%
9.5%
Source ISD19
56
Appendix 5.5 Incidence of stroke and TIA resulting in a first ever hospital
admission by NHS board for year ending 31 March 2007
Age Analysis of First Ever in a lifetime Stroke - Number of Cases
Stroke Event
G45 Transient Ischaemic Attack
Total ICH
Total Infarcts
Total Number of Stokes
Total CBV Events
0 - 44
years
65
90
191
281
346
45 - 54
years
142
110
379
489
631
55 - 64
years
284
191
776
967
1,251
65 - 74
years
437
308
1,498
1,806
2,243
75 - 84
years
465
421
2,511
2,932
3,397
85+
Total
years
population
232
1,625
255
1,375
2,073
7,428
2,328
8,803
2,560
10,428
Age Analysis of First Ever in a lifetime Stroke - Incidence per 1000 of the Population
Stoke Event
G45 Transient Ischaemic Attack
Total ICH
Total Infarcts
Total Number of Stokes
Total CBV Events
0 - 44
years
0.02
0.03
0.06
0.10
0.12
45 - 54
years
0.20
0.15
0.53
0.69
0.88
55 - 64
years
0.45
0.31
1.24
1.55
2.00
65 - 74
years
0.96
0.68
3.29
3.96
4.92
75 - 84
years
1.62
1.47
8.75
10.22
11.84
85+
Total
years
population
2.44
0.32
2.68
0.27
21.77
1.45
24.45
1.72
26.89
2.04
75 - 84
years
10.22
10.05
10.20
10.72
9.76
10.04
11.35
85+
Total
years
population
24.45
1.72
25.52
1.75
23.92
1.52
27.06
1.68
24.63
1.61
23.59
1.96
25.14
1.95
75 - 84
years
10.22
10.63
9.84
10.43
10.27
8.74
8.89
85+
Total
years
population
24.45
1.72
21.49
1.71
22.97
1.78
24.22
1.63
23.12
1.99
27.04
1.90
20.79
1.46
Health Board Analysis of Contribution to First Ever Stroke Incidence
Population
Ranking
Comparator
1
2
3
4
5
6
Health Board
Scotland
Greater Glasgow & Clyde
Lothian
Lanarkshire
Grampian
Tayside
Ayr
0 - 44
years
0.10
0.12
0.06
0.09
0.11
0.12
0.12
45 - 54
years
0.69
0.90
0.58
0.78
0.70
0.50
0.60
55 - 64
years
1.55
1.76
1.58
1.68
1.20
1.76
1.88
65 - 74
years
3.96
4.46
3.50
4.32
3.66
4.07
3.58
Health Board Analysis of Contribution to First Ever Stroke Incidence
Population
Ranking
Comparator
7
8
9
10
11
12
Health Board
Scotland
Fife
Highlands
Forth Valley
Dumfries
Borders
Islands
0 - 44
years
0.10
0.08
0.07
0.10
0.07
0.09
0.08
45 - 54
years
0.69
0.57
0.55
0.74
0.42
0.74
0.30
Source ISD19
57
55 - 64
years
1.55
1.28
1.27
1.41
1.63
1.15
0.73
65 - 74
years
3.96
4.27
3.86
3.79
3.64
3.83
2.54
Appendix 5.6 Predicted mortality for patients with first admission of ischaemic
stroke for year ending 31 March 2007
Original Admissions
Number of FES - TIA's Admitted
Number of FES - Haemorrhagic Admitted
Number of FES - Infarcts Admitted
Total Admissions
Total
population
1,625
1,198
5,879
8,702
0 - 44
years
65
82
188
335
45 - 54
years
142
99
369
610
55 - 64
years
284
169
746
1,199
65 - 74
years
437
277
1,378
2,092
75 - 84
years
465
367
1,975
2,807
85+
years
232
204
1,223
1,659
Predictive Outcome Model (Adapted from OCSP 1986) - Identifying the Four Subtypes of Infarction
Cryptogenic Stroke - Not Included
Cryptogenic Stroke - Patients Excluded
Clinically Identifiable Subtypes of Cerebral
Infarction
LACI - Lacunar Infarcts
TACI - Total Anterior Circulation Infarcts
PACI - Partial Anterior Circulation Infarcts
POCI - Posterior Circulation Infracts
5%
293
40%
75
20%
74
10%
75
5%
69
0%
0
0%
0
Total
population
25%
17%
34%
24%
Subtotal
0 - 44
years
5%
5%
85%
5%
100%
45 - 54
years
35%
10%
40%
15%
100%
55 - 64
years
25%
15%
35%
25%
100%
65 - 74
years
25%
15%
35%
25%
100%
75 - 84
years
24%
17%
34%
25%
100%
85+
years
25%
25%
25%
25%
100%
LACI - Lacunar Infarcts
TACI - Total Anterior Circulation Infarcts
PACI - Partial Anterior Circulation Infarcts
POCI - Posterior Circulation Infracts
1,384
975
1,885
1,345
6
6
96
6
103
30
118
44
168
101
235
167
327
196
458
327
474
336
672
495
306
306
306
306
Total Infarcts excluding Cryptogenic Stroke
5,589
114
295
671
1,308
1,977
1,224
75 - 84
years
4%
60%
11%
14%
85+
years
8%
65%
22%
21%
19
202
74
69
24
199
67
64
364
340
355
393
Outcome of Infarct Analysis
Predictive Outcome Model (Adapted from OCSP 1986) - 30 Day Mortality
Clinically Identifiable Subtypes of Cerebral
Total
0 - 44
45 - 54
55 - 64
65 - 74
Infarction
population
years
years
years
years
LACI - Lacunar Infarcts
4%
2%
2%
2%
4%
TACI - Total Anterior Circulation Infarcts
50%
25%
25%
25%
25%
PACI - Partial Anterior Circulation Infarcts
11%
5%
5%
5%
11%
POCI - Posterior Circulation Infracts
14%
7%
7%
7%
14%
Application of OCSP Mortality Rate at 6 Months - Applied in Scotland in the First 30 Days of Admission
LACI - Lacunar Infarcts
62
0
2
3
13
TACI - Total Anterior Circulation Infarcts
484
2
8
25
49
PACI - Partial Anterior Circulation Infarcts
214
5
6
12
50
POCI - Posterior Circulation Infracts
195
0
3
12
46
Predicted No of Deaths in the First Month
Known No of Deaths in the First Month
954
961
7
11
19
25
52
41
158
151
Predictive Outcome Model (Adapted from OCSP 1986) - Recurrent Strokes Readmitted in the First 3 Months
Number of Infarction Subtypes Survived at 1
Total
0 - 44
45 - 54
Month
population
years
years
LACI - Lacunar Infarcts
1,322
6
101
TACI - Total Anterior Circulation Infarcts
491
5
23
PACI - Partial Anterior Circulation Infarcts
1,671
91
112
POCI - Posterior Circulation Infracts
1,150
6
41
Application of OSCP Recurrent Stroke Rates
LACI - Lacunar Infarcts
2%
1%
1%
TACI - Total Anterior Circulation Infarcts
4%
2%
2%
PACI - Partial Anterior Circulation Infarcts
14%
11%
12%
POCI - Posterior Circulation Infracts
11%
8%
9%
Predicted Number of Patients to be readmitted as a result of Recurrent Stroke
LACI - Lacunar Infarcts
24
0
1
TACI - Total Anterior Circulation Infarcts
18
0
0
PACI - Partial Anterior Circulation Infarcts
237
10
13
POCI - Posterior Circulation Infracts
131
0
4
Predicted Readmissions at 3 Months
409
11
19
Known Readmissions at 3 Months
388
15
32
58
55 - 64
years
165
76
223
155
65 - 74
years
314
147
408
281
75 - 84
years
455
134
598
426
85+
years
282
107
239
242
1%
2%
13%
10%
2%
4%
14%
11%
2%
4%
15%
12%
2%
4%
16%
12%
2
2
29
16
48
59
6
6
57
31
100
102
9
5
90
51
155
122
6
4
38
29
77
58
Appendix 5.7 Predicted mortality and disability for patients with first admission
of ischaemic stroke for year ending 31 March 2007
Original Admissions
Number of FES - TIA' s Admitted
Number of FES - Haemorrhagic Admitted
Number of FES - Infarcts Admitted
Total Admissions
Total
population
1,625
1,198
5,879
8,702
0 - 44
years
65
82
188
335
45 - 54
years
142
99
369
610
55 - 64
years
284
169
746
1,199
65 - 74
years
437
277
1,378
2,092
75 - 84
years
465
367
1,975
2,807
85+
years
232
204
1,223
1,659
Predictive Outcome Model (Adapted from OCSP 1986) - Identifying Disability in the Four Subtypes of Infarction
Cryptogenic Stroke - Not Included
Cryptogenic Stroke - Patients Excluded
Clinically Identifiable Subtypes of Cerebral
Infarction
LACI - Lacunar Infarcts
TACI - Total Anterior Circulation Infarcts
PACI - Partial Anterior Circulation Infarcts
POCI - Posterior Circulation Infracts
5%
293
40%
75
20%
74
10%
75
5%
69
0%
0
0%
0
Total
population
25%
17%
34%
24%
Subtotal
0 - 44
years
5%
5%
85%
5%
100%
45 - 54
years
35%
10%
40%
15%
100%
55 - 64
years
25%
15%
35%
25%
100%
65 - 74
years
25%
15%
35%
25%
100%
75 - 84
years
24%
17%
34%
25%
100%
85+
years
25%
25%
25%
25%
100%
LACI - Lacunar Infarcts
TACI - Total Anterior Circulation Infarcts
PACI - Partial Anterior Circulation Infarcts
POCI - Posterior Circulation Infracts
1,384
975
1,885
1,345
6
6
96
6
103
30
118
44
168
101
235
167
327
196
458
327
474
336
672
495
306
306
306
306
Total Infarcts excluding Cryptogenic Stroke
5,589
114
295
671
1,308
1,977
1,224
Outcome of Infarct Analysis
Predictive Outcome Model (Adapted from OCSP 1986) - Death & Disability Rates at 30 Days
Clinically Identifiable Subtypes of Cerebral
Total
0 - 44
45 - 54
Infarction
population
years
years
Mortality Rate Detailed in Infarct Analysis & Readmission
4%
2%
2%
LACI - Lacunar Infarcts
50%
25%
25%
TACI - Total Anterior Circulation Infarcts
11%
5%
5%
PACI - Partial Anterior Circulation Infarcts
POCI - Posterior Circulation Infracts
14%
7%
7%
Application of OCSP Disability Rates at 30 Days - mRS of between 3 and 5
34%
20%
20%
LACI - Lacunar Infarcts
45%
30%
40%
TACI - Total Anterior Circulation Infarcts
33%
20%
20%
PACI - Partial Anterior Circulation Infarcts
POCI - Posterior Circulation Infracts
24%
10%
10%
Application of OCSP Disability Rates at 30 Days - mRS of between 0 and 2
61%
78%
78%
LACI - Lacunar Infarcts
5%
45%
35%
TACI - Total Anterior Circulation Infarcts
55%
75%
75%
PACI - Partial Anterior Circulation Infarcts
POCI - Posterior Circulation Infracts
61%
83%
83%
Total Allocation between Infarct Groups
100%
100%
100%
55 - 64
years
65 - 74
years
75 - 84
years
85+
years
2%
25%
5%
7%
4%
25%
11%
14%
4%
60%
11%
14%
8%
65%
22%
21%
30%
50%
25%
15%
35%
70%
30%
25%
35%
40%
40%
25%
40%
35%
40%
30%
68%
25%
70%
78%
100%
61%
5%
59%
61%
100%
61%
0%
49%
61%
100%
52%
0%
38%
49%
100%
Predictive Outcome Model (Adapted from OCSP 1986) - Allocation Split of Dependence at 30 Days
Number of Infarction Subtypes having an mRS
Total
of between 0 and 2
population
LACI - Lacunar Infarcts
846
48
TACI - Total Anterior Circulation Infarcts
1,041
PACI - Partial Anterior Circulation Infarcts
POCI - Posterior Circulation Infracts
823
Total Allocation between Infarct Groups
2,758
0 - 44
years
Number of Infarction Subtypes having an mRS
Total
of between 3 and 5
population
LACI - Lacunar Infarcts
475
443
TACI - Total Anterior Circulation Infarcts
630
PACI - Partial Anterior Circulation Infarcts
POCI - Posterior Circulation Infracts
327
Total Allocation between Infarct Groups
1,875
0 - 44
years
5
3
72
5
85
1
2
19
1
23
45 - 54
years
80
11
89
37
216
55 - 64
years
114
25
165
130
434
65 - 74
years
199
10
270
199
678
75 - 84
years
289
0
329
302
920
85+
years
159
0
116
150
425
45 - 54
years
21
12
24
4
61
55 - 64
years
50
51
59
25
185
65 - 74
years
114
137
137
82
471
75 - 84
years
166
134
269
124
693
85+
years
122
107
122
92
444
Predictive Outcome Model (Adapted from OCSP 1986) - Age Related Ratio between Dependency & Independency
Dependency Ratio
Totals for Scotland
Total
population
40%
0 - 44
years
21%
59
45 - 54
years
22%
55 - 64
years
30%
65 - 74
years
41%
75 - 84
years
43%
85+
years
51%
Appendix 6.1 Estimated first hospital admissions for stroke or TIA
Population statistics mid year estimate
provided by GRO as at 30 June 2007
Total
population
0 - 44
years
45 - 54
years
55 - 64
years
65 - 74
years
75 - 84
years
85+
years
Age group analysis
% of total population
% reduction in population groups
5,144,200
2,938,670
57.1%
728,462
14.2%
631,455
12.3%
13.3%
457,382
8.9%
27.6%
289,941
5.6%
36.6%
98,290
1.9%
66.1%
Incidence of stroke that has resulted in a first ever hospital admission
Stroke
Information from data collected in 3
Classifications
year incidence studies for Scotland
(ICD 10)
Incidence calculated for 2006
G45 - Transient Incidence calculated for 2007
Ischaemic Attack Incidence calculated for 2008
Average Incidence for Period
Incidence calculated for 2006
I61 Incidence calculated for 2007
Intracerebral
Incidence calculated for 2008
Haemorrhage
Average Incidence for Period
Incidence calculated for 2006
I62 - Intracranial Incidence calculated for 2007
Haemorrhage Incidence calculated for 2008
Average Incidence for Period
Incidence calculated for 2006
I63 - Cerebral Incidence calculated for 2007
Incidence calculated for 2008
Infarction
Average Incidence for Period
Incidence calculated for 2006
I64 Incidence calculated for 2007
Inconclusive
Incidence calculated for 2008
Stroke
Average Incidence for Period
Total
population
0 - 44
years
45 - 54
years
55 - 64
years
65 - 74
years
75 - 84
years
85+
years
0.30
0.32
0.31
0.31
0.18
0.18
0.17
0.18
0.08
0.09
0.09
0.09
0.84
0.80
0.75
0.80
0.68
0.65
0.66
0.66
0.03
0.02
0.02
0.02
0.02
0.02
0.02
0.02
0.01
0.01
0.01
0.01
0.05
0.04
0.05
0.05
0.02
0.02
0.02
0.02
0.20
0.20
0.23
0.21
0.12
0.12
0.13
0.12
0.05
0.04
0.05
0.04
0.35
0.34
0.31
0.33
0.18
0.19
0.22
0.20
0.47
0.45
0.48
0.47
0.24
0.20
0.20
0.21
0.11
0.11
0.11
0.11
0.88
0.78
0.75
0.80
0.55
0.46
0.53
0.51
0.83
0.96
0.87
0.89
0.42
0.45
0.43
0.43
0.22
0.22
0.25
0.23
2.19
1.93
1.80
1.97
1.37
1.36
1.36
1.36
1.47
1.62
1.52
1.54
1.02
0.94
0.87
0.95
0.44
0.52
0.46
0.48
4.97
4.75
4.22
4.65
4.37
4.00
3.93
4.10
2.61
2.44
2.30
2.45
1.61
1.80
1.49
1.63
0.73
0.88
0.84
0.82
10.54
10.42
9.84
10.26
11.95
11.35
10.84
11.38
Prevalence of first every CBV event that has resulted in outright mortality with no hospital admission record
Information from data collected in 3
Stroke
year incidence studies for Scotland Classifications
GRO Mortality Records
Haemorrhagic Prevalence calculated for 2006
Stroke
Prevalence calculated for 2007
Community Prevalence calculated for 2008
Average Prevalence for Period
Mortality
Prevalence calculated for 2006
Ischaemic Stroke
Prevalence calculated for 2007
Community
Prevalence calculated for 2008
Mortality
Average Prevalence for Period
Total
population
0 - 44
years
45 - 54
years
55 - 64
years
65 - 74
years
75 - 84
years
85+
years
13.6%
12.9%
12.2%
12.9%
21.4%
20.9%
20.7%
21.0%
7.4%
8.9%
8.7%
8.3%
3.0%
1.6%
1.9%
2.2%
15.8%
10.0%
19.7%
15.2%
2.7%
2.6%
1.8%
2.4%
11.7%
11.5%
12.2%
11.8%
5.3%
3.9%
4.4%
4.5%
11.7%
10.1%
8.3%
10.0%
10.2%
8.0%
10.2%
9.5%
15.8%
12.8%
11.4%
13.3%
22.2%
21.3%
20.8%
21.4%
15.6%
20.0%
16.2%
17.2%
41.3%
41.0%
40.2%
40.8%
Events calculated from data collected on
Total
0 - 44
45 - 54
55 - 64
65 - 74
75 - 84
85+
the probability of a first ever hospital
population
years
years
years
years
years
years
admission
0.31
0.02
0.21
0.47
0.89
1.54
2.45
Incidence of TIA
0.27
0.03
0.17
0.32
0.67
1.42
2.45
Incidence of Haemorrhagic Stroke
1.46
0.07
0.53
1.32
3.33
8.75
21.64
Incidence of Ischaemic Stroke
Incidence of first ever admisson - stroke
1.73
0.10
0.70
1.64
4.00
10.17
24.09
Incidence of first ever admission - CBV
2.04
0.13
0.91
2.11
4.89
11.70
26.54
Predicted number of cerebrovasclar events likely to lead to a first hospital admission
1,612
73
152
295
406
446
241
Predicted TIA's
1,378
96
121
204
305
412
241
Predicted Haemorrhagic Strokes
Predicted Ischaemic Strokes
7,605
199
386
832
1,525
2,536
2,127
Prevalance of cerebrovascular events that will not be admitted - death in the community
12.9%
8.3%
15.2%
11.8%
10.0%
13.3%
17.2%
% Haemorrhagic Stroke Deaths
% Ischaemic Stroke Deaths
21.0%
2.2%
2.4%
4.5%
9.5%
21.4%
40.8%
Number of CBV events due for a first ever admission to Scottish hospitals in the year to 31 March 2009
1,612
73
152
295
406
446
241
Number of TIA's
1,201
88
103
180
274
357
199
Number of Haemorrhagic
5,997
194
377
794
1,380
1,992
1,259
Number of Ischaemic Infarcts
Number of First Ever Admissions
8,811
355
632
Source ISD19
60
1,269
2,061
2,795
1,699
Appendix 6.2 Estimated survival rates for patients following a first admission to
hospital for stroke or TIA
Predicted first ever hospital admissions
as a result of stroke or CBV event
Number of FES - TIA's
Number of FES - Haemorrhagic
Number of FES - Infarcts
Total Admissions
Total
population
0 - 44
years
45 - 54
years
55 - 64
years
65 - 74
years
75 - 84
years
85+
years
1,612
1,201
5,997
8,811
73
88
194
355
152
103
377
632
295
180
794
1,269
406
274
1,380
2,061
446
357
1,992
2,795
241
199
1,259
1,699
0 - 44
years
45 - 54
years
55 - 64
years
65 - 74
years
75 - 84
years
85+
years
98.8%
100.0%
100.0%
99.6%
79.5%
67.1%
86.3%
77.6%
95.8%
94.1%
95.1%
95.0%
100.0%
98.6%
100.0%
99.5%
70.3%
73.7%
63.7%
69.3%
94.2%
93.2%
94.7%
94.0%
100.0%
99.3%
99.0%
99.4%
73.5%
67.5%
74.6%
71.9%
94.2%
94.5%
93.3%
94.0%
100.0%
99.5%
98.0%
99.2%
68.5%
63.9%
65.6%
66.0%
89.5%
89.0%
88.3%
88.9%
100.0%
98.1%
98.4%
98.8%
57.8%
59.7%
61.2%
59.6%
81.1%
82.8%
80.9%
81.6%
100.0%
95.7%
96.0%
97.2%
50.3%
48.0%
52.1%
50.1%
70.3%
67.9%
70.7%
69.6%
0 - 44
years
45 - 54
years
55 - 64
years
65 - 74
years
75 - 84
years
85+
years
72
69
185
326
0
20
10
30
151
71
354
577
1
32
22
55
293
129
747
1,169
2
51
48
100
403
181
1,228
1,811
3
93
153
249
441
213
1,625
2,278
5
144
367
516
234
100
877
1,211
7
99
383
489
8.4%
8.7%
7.9%
12.1%
18.5%
28.8%
0 - 44
years
45 - 54
years
55 - 64
years
65 - 74
years
75 - 84
years
85+
years
98.8%
100.0%
100.0%
99.6%
77.3%
64.6%
77.9%
73.3%
92.2%
90.4%
93.6%
92.1%
96.4%
97.9%
98.2%
97.5%
67.3%
69.7%
54.9%
64.0%
91.7%
88.9%
92.1%
90.9%
96.5%
97.2%
97.7%
97.1%
62.4%
60.4%
68.8%
63.9%
87.5%
87.5%
87.6%
87.5%
93.1%
92.7%
95.0%
93.6%
57.6%
54.2%
56.6%
56.1%
78.4%
78.1%
80.0%
78.9%
87.9%
86.7%
88.5%
87.7%
42.2%
43.6%
47.8%
44.5%
63.3%
64.6%
65.1%
64.3%
73.0%
73.3%
82.3%
76.2%
32.4%
27.9%
36.5%
32.3%
40.2%
42.6%
49.1%
44.0%
0 - 44
years
45 - 54
years
55 - 64
years
65 - 74
years
75 - 84
years
85+
years
72
65
179
316
0
24
15
39
148
66
343
557
4
37
34
75
286
115
695
1,096
8
65
99
172
380
154
1,088
1,622
26
120
292
438
391
159
1,281
1,831
55
198
711
964
183
64
554
801
57
135
706
898
11.1%
11.9%
13.6%
21.3%
34.5%
52.8%
Average survial rates following a first
Stroke
Total
ever admisson for stroke or TIA outcome
Classifications
population
at 1 month
Survival rates in 2006
99.9%
Transient
Survival rates in 2007
98.5%
Ischaemic Attack Survival rates in 2008
98.3%
98.9%
Average contribution for period
Survival rates in 2006
64.3%
Haemorrhagic Survival rates in 2007
61.4%
Stroke
Survival rates in 2008
65.0%
63.6%
Average contribution for period
Survival rates in 2006
84.0%
Survival rates in 2007
83.7%
Ischaemic Stroke
Survival rates in 2008
83.5%
83.7%
Average contribution for period
Predicted number of first ever admissons
Total
as a result of stroke or TIA event likely to
population
survive at 1 month
Number of FES - TIA's
1,595
Number of FES - Haemorrhagic
762
Number of FES - Infarcts
5,015
Total numbers survived at 1 month
7,372
Number of FES - TIA's
18
Number of FES - Haemorrhagic
439
Number of FES - Infarcts
982
Total mortality at 1 month
1,439
Total rate of mortality at 1 month
16.3%
Average survial rates following a first
Stroke
Total
ever admisson for stroke or TIA outcome
Classifications
population
at 1 year
Survival rates in 2006
89.8%
Transient
Survival rates in 2007
89.7%
Ischaemic Attack Survival rates in 2008
92.5%
90.7%
Average contribution for period
Survival rates in 2006
52.2%
Haemorrhagic Survival rates in 2007
49.3%
Stroke
Survival rates in 2008
54.1%
51.9%
Average contribution for period
Survival rates in 2006
68.2%
Survival rates in 2007
68.4%
Ischaemic Stroke
Survival rates in 2008
70.9%
69.2%
Average contribution for period
Predicted number of first ever admissons
Total
as a result of stroke or TIA event likely to
population
survive at 1 year
Number of FES - TIA's
1,462
Number of FES - Haemorrhagic
622
Number of FES - Infarcts
4,140
6,224
Total numbers survived at 1 year
Number of FES - TIA's
151
Number of FES - Haemorrhagic
579
Number of FES - Infarcts
1,857
2,587
Total mortality at 1 year
Total rate of mortality at 1 year
29.4%
61
Appendix 6.3 Estimated re-admission rates for patients following a first
admission to hospital for stroke or TIA
Predicted first ever hospital admissions
as a result of stroke or CBV event
Total
population
65 - 74
years
75 - 84
years
85+
years
Number of FES - TIA's
1,612
73
152
295
406
Number of FES - Haemorrhagic
1,201
88
103
180
274
Number of FES - Infarcts
5,997
194
377
794
1,380
Total Admissions
8,811
355
632
1,269
2,061
Incidence of First Ever Stroke with No Previous Admission History b/fwd from Incidence Summary
446
357
1,992
2,795
241
199
1,259
1,699
Stroke
Annual readmission rates calculated from
Total
Classifications first ever stroke presentations
population
0 - 44
years
45 - 54
years
55 - 64
years
0 - 44
years
45 - 54
years
55 - 64
years
65 - 74
years
75 - 84
years
85+
years
15.9%
16.3%
14.8%
15.6%
10.6%
11.8%
10.9%
11.1%
16.3%
15.8%
15.0%
15.7%
15.4%
3.6%
10.8%
9.9%
19.0%
15.9%
11.0%
15.3%
19.1%
19.3%
14.9%
17.8%
15.2%
15.2%
7.0%
12.5%
13.6%
14.9%
9.1%
12.5%
20.6%
17.2%
15.7%
17.8%
17.8%
15.3%
8.1%
13.7%
13.2%
15.3%
12.4%
13.7%
18.0%
15.9%
15.5%
16.5%
13.8%
16.1%
14.4%
14.8%
11.4%
8.9%
13.7%
11.4%
17.4%
18.1%
16.5%
17.3%
16.5%
18.3%
20.2%
18.4%
8.9%
10.3%
9.5%
9.6%
16.5%
15.3%
15.3%
15.7%
16.7%
19.4%
18.5%
18.2%
4.2%
11.2%
9.3%
8.2%
11.8%
12.7%
12.3%
12.3%
Total
population
0 - 44
years
45 - 54
years
55 - 64
years
65 - 74
years
75 - 84
years
85+
years
252
133
940
1,325
7
13
35
55
19
13
67
99
41
25
131
196
60
31
239
330
82
34
313
429
44
16
155
215
First ever
event
Recurrent
events
Total
events
1,557
1,545
1,625
1,576
1,185
1,165
1,198
1,183
6,334
6,112
5,879
6,108
247
252
240
246
126
137
131
131
1,033
965
881
960
1,804
1,797
1,865
1,822
1,311
1,302
1,329
1,314
7,367
7,077
6,760
7,068
Average readmission rates for stroke and
Total
TIA from prior years
population
0 - 44
years
45 - 54
years
55 - 64
years
65 - 74
years
75 - 84
years
85+
years
Transient Ischaemic Attack
Haemorrhagic Stroke
Ischaemic Stroke
13.7%
18.6%
22.1%
8.7%
25.6%
25.0%
10.9%
21.0%
25.1%
12.0%
22.9%
23.2%
12.9%
19.1%
24.4%
16.1%
16.0%
22.1%
15.9%
13.8%
17.3%
Total
population
0 - 44
years
45 - 54
years
55 - 64
years
65 - 74
years
75 - 84
years
85+
years
220
222
1,321
1,763
6
23
49
78
17
22
95
134
35
41
184
260
52
52
336
440
72
57
440
569
38
27
217
282
Readmission rate for 2005
Transient
Readmission rate for 2006
Ischaemic Attack Readmission rate for 2007
Average readmission rate - current year
Readmission rate for 2005
Haemorrhagic Readmission rate for 2006
Readmission rate for 2007
Stroke
Average readmission rate - current year
Readmission rate for 2005
Readmission rate for 2006
Ischaemic Stroke
Readmission rate for 2007
Average readmission rate - current year
Predicted Additional Admissions from
Recurrent Stroke in the Current Year
Number of FES - TIA's
Number of FES - Haemorrhagic
Number of FES - Infarcts
Total Admissions
Annual readmission rates calculated from
Stroke
total admissions & first ever stroke
Classifications
presentations
Readmission rate for 2005
Transient
Readmission rate for 2006
Ischaemic Attack Readmission rate for 2007
Average readmission from prior years
Readmission rate for 2005
Haemorrhagic Readmission rate for 2006
Readmission rate for 2007
Stroke
Average readmission from prior years
Readmission rate for 2005
Readmission rate for 2006
Ischaemic Stroke
Readmission rate for 2007
Average readmission from prior years
Predicted additional admissions from
recurrent stroke from prior years
Number of FES - TIA's
Number of FES - Haemorrhagic
Number of FES - Infarcts
Total Admissions
62
Recurrent
%
Total actual event from
Additional
admissions a prior
recurrence
year
2,040
236
15.2%
2,011
214
13.9%
2,061
196
12.1%
2,037
215
13.7%
1,544
233
19.7%
1,498
196
16.8%
1,561
232
19.4%
1,534
220
18.6%
8,706
1,339
21.1%
8,339
1,262
20.6%
8,198
1,438
24.5%
8,414
1,346
22.1%
Appendix 6.4 Estimated prior admission rates for patients later admitted for
stroke or TIA for the first time
Predicted first ever hospital admissions
as a result of stroke or CBV event
Stroke
Classifications
Total
population
65 - 74
years
75 - 84
years
85+
years
Number of FES - TIA's
1,612
73
152
295
406
Number of FES - Haemorrhagic
1,201
88
103
180
274
Number of FES - Infarcts
5,997
194
377
794
1,380
Total Admissions
8,811
355
632
1,269
2,061
Incidence of First Ever Stroke with No Previous Admission History b/fwd from Incidence Summary
446
357
1,992
2,795
241
199
1,259
1,699
Annual Complication Rates by CBV Event
Total
Calculated from First Ever Stroke
population
Presentations
0 - 44
years
45 - 54
years
55 - 64
years
0 - 44
years
45 - 54
years
55 - 64
years
65 - 74
years
75 - 84
years
85+
years
Complications arising in 2006
Transient
Complications arising in 2007
Ischaemic Attack Complications arising in 2008
Average Contribution
13.8%
15.6%
16.1%
15.2%
3.6%
7.7%
8.6%
6.6%
8.7%
12.7%
11.3%
10.9%
15.3%
14.1%
16.9%
15.4%
19.3%
19.7%
20.8%
19.9%
14.8%
17.4%
14.9%
15.7%
8.0%
9.9%
15.0%
11.0%
Complications arising in 2006
Haemorrhagic
Complications arising in 2007
Stroke
Complications arising in 2008
Average Contribution
14.1%
13.4%
16.1%
14.5%
4.5%
9.8%
7.4%
7.2%
10.9%
27.3%
22.5%
20.2%
19.6%
18.3%
20.2%
19.4%
19.1%
13.0%
18.8%
16.9%
14.0%
13.4%
16.0%
14.4%
7.8%
4.4%
9.4%
7.2%
Complications arising in 2006
Ischaemic Stroke Complications arising in 2007
Complications arising in 2008
Average Contribution
16.9%
17.6%
17.2%
17.2%
19.8%
11.2%
11.8%
14.2%
18.9%
18.2%
18.2%
18.4%
17.5%
19.4%
17.1%
18.0%
21.2%
23.4%
25.0%
23.2%
17.2%
17.6%
16.8%
17.2%
9.5%
10.9%
10.1%
10.2%
0 - 44
years
45 - 54
years
55 - 64
years
65 - 74
years
75 - 84
years
85+
years
5
6
28
39
10.9%
17
21
69
107
16.9%
46
35
143
223
17.6%
81
46
320
447
21.7%
70
52
342
464
16.6%
26
14
128
169
9.9%
0 - 44
years
45 - 54
years
55 - 64
years
65 - 74
years
75 - 84
years
85+
years
Predicted number of admissions included
Total
in First Ever Stroke likely to have
population
complications
Number of FES - TIA's
244
Number of FES - Haemorrhagic
174
Number of FES - Infarcts
1,030
Number of Admissions
1,449
16.4%
% of Total Admissions
Intervention
Annual Complication Rates by
Total
Anticipated Intervention Calculated from
population
FES Presentations
Contraindication Rate in 2006
Thrombolysis
Contraindication Rate in 2007
Ischaemic Stroke
Contraindication Rate in 2008
Only
Average Rate of Contraindication
3.5%
3.8%
3.7%
3.7%
10.9%
5.3%
4.9%
7.1%
6.9%
6.2%
8.9%
7.4%
3.6%
6.2%
4.0%
4.6%
4.7%
5.8%
5.8%
5.4%
2.8%
2.5%
3.0%
2.8%
1.0%
1.3%
0.7%
1.0%
Carotid Surgery
Contraindication Rate in 2006
TIA and
Contraindication Rate in 2007
Ischaemic Stroke
Contraindication Rate in 2008
Only
Average Rate of Contraindication
12.9%
13.6%
13.2%
13.2%
6.9%
5.9%
5.8%
6.2%
9.8%
11.0%
8.4%
9.7%
13.3%
12.5%
12.8%
12.9%
16.2%
17.1%
18.5%
17.3%
14.2%
15.1%
13.4%
14.2%
8.3%
9.5%
10.0%
9.3%
Source ISD19
63
Appendix 6.5 Estimated admission rates for patients who have attended a
neurovascular outpatient clinic
Predicted Admissions to Scottish
Total
Hospitals in the Year to 31st March 2009 population
55 - 64
years
65 - 74
years
75 - 84
years
85+
years
1,612
252
220
2,085
1,201
133
222
1,556
5,997
940
1,321
8,258
73
7
6
86
88
13
23
125
194
35
49
278
152
19
17
188
103
13
22
138
377
67
95
539
295
41
35
370
180
25
41
245
794
131
184
1,109
406
60
52
518
274
31
52
358
1,380
239
336
1,955
446
82
72
600
357
34
57
448
1,992
313
440
2,745
241
44
38
323
199
16
27
243
1,259
155
217
1,631
Total Admissions
11,898
488
865
1,725
2,831
3,793
2,196
Total
population
0 - 44
years
45 - 54
years
55 - 64
years
65 - 74
years
75 - 84
years
85+
years
Number of Ischaemic Events Admitted
10,343
364
727
1,480
2,473
3,345
1,954
Outpatient Attendance from SSCAS
RAO & Transient Monocular Blindness
Non Cerebrovascular Events
TIA and Minor Stroke Attendances
9,598
1,075
2,822
5,701
338
38
99
201
675
76
198
401
1,373
154
404
816
2,295
257
675
1,363
3,104
348
913
1,844
1,813
203
533
1,077
Total
population
0 - 44
years
45 - 54
years
55 - 64
years
65 - 74
years
75 - 84
years
85+
years
Independency Ratio First Ever Stroke
Independency Ratio Recurrent Stroke
60%
45%
79%
59%
78%
59%
70%
53%
59%
44%
57%
43%
49%
37%
No of TIA's Admitted
No of FES - Infarcts Admitted
No of Recurrent Strokes Admitted
No of Neurovascular OP Attendees
2,085
3,572
1,024
5,701
86
153
49
201
188
294
95
401
370
557
166
816
518
815
255
1,363
600
1,137
322
1,844
323
616
136
1,077
Total number of patients who subject to
further investigation may be suitable for
Carotid Surgery without complications
12,382
489
978
1,909
2,951
3,903
2,152
Total
population
0 - 44
years
45 - 54
years
55 - 64
years
65 - 74
years
75 - 84
years
85+
years
Dependency Ratio First Ever Stroke
Dependency Ratio Recurrent Stroke
40%
55%
21%
41%
22%
41%
30%
47%
41%
56%
43%
57%
51%
63%
No of FES - Infarcts Admitted
No of Recurrent Strokes Admitted
2,425
1,237
41
34
82
67
237
149
566
321
855
431
643
235
Total number of patients who subject to
further investigation may be suitable for
Thrombolysis assuming that they arrive on
time without complications
3,662
75
150
386
886
1,286
879
Independency Analysis of Ischaemic
Strokes & CBV Events mRS < = 2
25%
45 - 54
years
Number of FES - TIA's
Number of Recurrent TIA's CY
Number of Recurrent TIA's PY
Total number of TIA Admitted
Number of FES - Haemorrhagic
Number of Recurrent Heamorrhagic CY
Number of Recurrent Heamorrhagic PY
Total number of Haemorrhagic Strokes
Number of FES - Infarcts
Number of Recurrent Infarcts CY
Number of Recurrent Infarcts PY
Total number of Infarcts Admitted
Predicted Outpatients Attending
Neurovascular Clinics
93%
11%
29%
59%
0 - 44
years
Dependency Analysis of Ischaemic
Strokes mRS 3 - 5
64
214,869
1,821
8.47
4,170,592
0.44
AMBULANCE CAR SERVICE
Patient Journeys ( Incl. Escorts )
Total Cost £' 000
Cost per P.J. ( £ )
Total Mileage
Cost per Mile ( £ )
89
270
3,034
17,038
163
9.57
429,414
0.38
126,094
2,676
21.22
1,056,647
2.53
44,132
10,699
242.43
1,167,762
9.16
Ayrshire
and Arran
16
49
3,063
4,043
59
14.59
158,683
0.37
50,264
979
19.48
463,115
2.11
12,342
6,114
495.38
515,291
11.87
Borders
41
126
3,073
5,167
106
20.51
209,763
0.51
49,581
1,124
22.67
714,432
1.57
16,429
7,562
460.28
845,670
8.94
Dumfries &
Galloway
4
13
3,250
18,334
127
6.93
313,668
0.40
143,431
2,358
16.44
896,470
2.63
40,455
7,754
191.67
886,108
8.75
Fife
38
116
3,053
39,996
278
6.95
616,010
0.45
95,874
1,989
20.75
582,627
3.41
27,342
4,803
175.66
487,676
9.85
Forth
Valley
217
679
3,129
6,210
61
9.82
159,664
0.38
90,566
2,911
32.14
727,165
4.00
53,490
14,104
263.68
1,472,866
9.58
Grampian
462
1,390
3,009
18,772
295
15.71
656,885
0.45
383,231
6,903
18.01
2,238,765
3.08
150,552
24,502
162.75
1,725,264
14.20
Glasgow &
Clyde
1,300
4,096
3,151
41,428
274
6.61
500,820
0.55
77,172
1,894
24.54
1,139,976
1.66
39,179
19,151
488.81
1,861,851
10.29
Highland
44
135
3,068
37,353
216
5.78
529,751
0.41
140,313
3,484
24.83
898,469
3.88
65,299
11,106
170.08
1,075,616
10.33
Lanarkshire
29
88
3,034
10,249
61
5.95
178,030
0.34
181,011
4,249
23.47
788,098
5.39
88,300
15,066
170.62
1,476,701
10.20
Lothian
378
1,204
3,185
165
3
18.18
5,818
0.52
2,075
55
26.51
26,716
2.06
1,758
743
422.64
69,915
10.63
Orkney
250
803
3,212
-
3,243
112
34.54
78,623
1.42
1,684
470
279.10
78,519
5.99
Shetland
65
27
83
3,074
14,078
146
10.37
358,962
0.41
130,790
3,002
22.95
1,002,814
2.99
40,070
11,718
292.44
1,146,873
10.22
Tayside
379
1,214
3,203
2,036
32
15.72
52,971
0.60
3,457
124
35.87
15,070
8.23
3,076
1,889
614.11
222,951
8.47
Western
Isles
This is an ISD Scotland National Statistics release
25th November 2008
Source: ISD http://www.isdscotland.org/isd/4434.html Excel File R910
http://www.isdscotland.org/isd/servlet/FileBuffer?namedFile=Costs_R910_2008.xls&pContentDispositionType=inline
3,274
10,266
3,136
1,477,102
31,860
21.57
10,629,438
3.00
PATIENT TRANSPORT SERVICE
(excludes Ambulance Car Service)
Patient Journeys ( Incl. Escorts )
Total Cost £' 000
Cost per P.J. ( £ )
Total Mileage
Cost per Mile ( £ )
PATIENT AIR TRANSPORT SERVICE
Missions
Total Cost £' 000
Cost per Mission ( £ )
584,108
135,681
232.29
13,033,062
10.41
Scotland
ACCIDENT & EMERGENCY
Incidents
Total Cost £' 000
Cost per Incident ( £ )
Total Mileage
Cost per Mile ( £ )
ROAD AMBULANCE SERVICE
Board
R910: THE SCOTTISH AMBULANCE SERVICE
April 2007 - March 2008
Appendix 7.1 Costs for the Scottish Ambulance Service
A2
A2
A2
A2
A2
A1
A1
A2
A2
A2
A2
A2
A3
A2
A3
A3
A3
A2
A2
A2
A1
A3
A3
A1
A2
A1
A2
A2
A2
A3
A2
A3
A3
1,602,537
68,603
43,739
22,417
41,827
45,554
78,270
74,557
49,536
68,786
33,963
42,639
72,114
17,209
31,071
7,367
7,696
12,309
62,524
60,520
48,612
65,258
22,818
3,310
105,827
52,253
50,620
25,359
52,601
31,197
8,545
35,880
13,399
9,206
1,498,710
65,150
40,482
22,417
39,093
42,954
73,321
73,519
48,047
66,935
31,918
41,244
68,100
15,044
29,032
6,352
6,366
9,668
60,224
58,520
48,004
61,512
21,943
3,310
103,955
44,335
49,736
24,650
50,835
30,012
7,326
35,880
13,399
7,861
72
62
73
75
83
59
67
69
69
71
79
67
60
59
100
84
50
85
62
52
69
68
92
96
107
49
100
47
69
43
88
65
56
73
Total
£
£
30
32
28
50
18
18
18
23
27
29
25
16
25
35
48
80
49
34
30
30
33
23
35
92
54
21
31
17
34
19
28
37
43
96
Gross
Attendance
Cost per
Allocated
102
94
102
125
100
77
86
92
95
99
104
83
85
94
148
164
99
119
92
82
102
91
127
188
161
70
131
64
103
62
116
102
99
170
£
Other
ACT
£
Income
Income
-2
-1
0
0
0
-2
-3
-3
-7
-15
-1
-1
-6
-1
-1
-1
-1
-1
0
-2
0
-6
-3
-5
0
-1
-1
0
0
-
-7
-4
-5
-2
-2
-1
-7
-9
-8
-4
-4
-4
-8
-4
-12
-6
-1
-4
-6
-6
-14
-6
-2
-1
-25
-13
-4
-10
-6
-5
-6
-10
-1
-1
Cost per Attendance
Total Costs
£
Net
93
89
96
123
98
75
77
80
84
89
85
78
75
84
135
158
98
114
85
75
88
84
125
187
130
54
122
54
97
56
110
91
98
169
Index
Group
100
96
104
133
106
81
83
87
91
96
92
84
81
91
146
171
106
124
92
81
95
91
135
202
140
59
132
58
104
60
119
99
105
182
66
Source: ISD http://www.isdscotland.org/isd/4434.html Excel File R044 Macros Enabled
http://www.isdscotland.org/isd/servlet/FileBuffer?namedFile=Costs_R044_2008.xls&pContentDispositionType=inline
Totals or Averages
Crosshouse Hospital
The Ayr Hospital
Borders General
Queen Margaret Hospital
Victoria Kirkcaldy
West Hospitals
Glasgow Royal Infirmary
Southern General (SGH)
Royal Alexandra Hospital
Inverclyde Royal Hospital
Stobhill, Glasgow
Victoria Infirmary, Glasgow
Vale of Leven, Alexandria
Raigmore, Inverness
Lorn & Islands District G.H.
Caithness General
Belford
Wishaw General
Monklands Hospital
Hairmyres, East Kilbride
Aberdeen Royal Infirmary
Dr. Gray's, Elgin
Balfour, Kirkwall
Edinburgh Royal Infirmary
St. John's at Howden
Ninewells
Perth Royal Infirmary
Stirling Royal Infirmary
Falkirk Royal Infirmary
Western Isles, Stornoway
D&G Royal Infirmary
Galloway Community Hospital
Gilbert Bain, Lerwick
Cost per
Attendance
A
A
B
F
F
G
G
G
G
G
G
G
G
H
H
H
H
L
L
L
N
N
R
S
S
T
T
V
V
W
Y
Y
Z
Total
Direct
and Classification
New
Patients
Total
Attendances
25th November 2008
This is an ISD Scotland National Statistics release
* If menu is not active, change macro security settings using Tools, Macro, Security - set security level to Medium and re-open the report.
* Use drop-down menu to select specialties
Hospital, Board Cipher
Number of Hospitals: 86
Accident & Emergency
April 2007 - March 2008
R044: SPECIALTY GROUP COSTS - CONSULTANT OUTPATIENTS
Appendix 7.2 Costs for attendance at an A&E department
A
A
B
F
F
G
G
G
G
G
G
G
G
H
H
H
L
L
L
N
N
R
S
S
S
T
T
T
V
V
W
Y
Z
A2
A2
A2
A2
A2
A1
A1
A2
A2
A2
A2
A2
A3
A2
A3
A3
A2
A2
A2
A1
A3
A3
A1
A1
A2
A1
A2
A3
A2
A2
A3
A2
A3
248,808
7,701
6,980
4,948
6,406
6,710
16,125
13,701
17,792
9,557
8,620
5,999
7,997
5,406
7,695
364
758
8,634
7,350
7,410
20,233
2,960
15,770
14,119
8,529
9,356
3,669
3,597
6,208
6,165
771
5,651
-
Attendances
Net cost
per Attendance
Group
£
Index
115.46
116.56
115.71
150.12
151.22
125.23
124.52
111.11
139.50
132.47
107.87
126.04
76.90
86.84
36.20
200.42
211.73
102.26
103.69
102.93
97.63
89.13
98.78
135.89
55.53
155.42
132.02
165.11
169.09
131.70
304.02
72.12
-
CT Scanner
100
101
100
130
131
108
108
96
121
115
93
109
67
75
31
174
183
89
90
89
85
77
86
118
48
135
114
143
146
114
263
62
-
Magnetic Resonance
Imaging
Attendances
Net cost
per Attendance
Group
£
Index
96,525
228.59
3,831
125.99
3,145
163.40
2,386
88.86
5,741
250.45
8,782
229.98
3,614
200.85
12,743
252.18
2,915
239.47
1,802
195.00
29
204.28
1,393
168.95
787
156.97
3,998
604.39
2,670
169.87
1,851
161.97
2,372
159.76
4,211
153.26
6,996
177.84
9,746
244.80
15
99.40
4,372
236.18
2,341
258.38
2,144
255.73
1
304.81
4,726
237.56
100
55
71
39
110
101
88
110
105
85
89
74
69
264
74
71
70
67
78
107
43
103
113
112
133
104
-
398,069
19,999
9,250
6,029
14,116
8,349
16,830
35,472
8,531
12,996
8,234
9,889
9,880
3,950
12,520
2,167
1,655
13,818
13,609
12,556
21,784
5,143
645
41,752
13,536
18,482
13,533
7,068
3,250
10,877
7,919
1,569
10,486
1,761
Attendances
Net cost
per Attendance
Group
£
Index
52.87
38.96
38.86
41.50
37.81
31.31
64.15
52.35
65.73
62.41
50.82
60.73
36.23
40.91
78.84
135.33
200.48
45.56
47.89
58.13
66.38
25.34
199.41
47.68
63.11
25.05
31.19
38.55
39.33
77.33
60.43
100.57
68.30
114.27
100
74
73
78
72
59
121
99
124
118
96
115
69
77
149
256
379
86
91
110
126
48
377
90
119
47
59
73
74
146
114
190
129
216
25th November 2008
Ultrasonics
* If menu is not active, change macro security settings using Tools, Macro, Security - set security level to Medium and re-open the report.
* Use drop-down menu to select specialties
This is an ISD Scotland National Statistics release
67
Source: ISD http://www.isdscotland.org/isd/4434.html Excel File R120 Macros Enabled
http://www.isdscotland.org/isd/servlet/FileBuffer?namedFile=Costs_R120_2008.xls&pContentDispositionType=inline
Totals or Averages
Crosshouse Hospital
The Ayr Hospital
Borders General
Queen Margaret Hospital
Victoria Kirkcaldy
West Hospitals
Glasgow Royal Infirmary
Southern General (SGH)
Royal Alexandra Hospital
Inverclyde Royal Hospital
Stobhill, Glasgow
Victoria Infirmary, Glasgow
Vale of Leven, Alexandria
Raigmore, Inverness
Caithness General
Belford
Wishaw General
Monklands Hospital
Hairmyres, East Kilbride
Aberdeen Royal Infirmary
Dr. Gray's, Elgin
Balfour, Kirkwall
Edinburgh Royal Infirmary
Western General, Edinburgh
St. John's at Howden
Ninewells
Perth Royal Infirmary
Stracathro
Stirling Royal Infirmary
Falkirk Royal Infirmary
Western Isles, Stornoway
D&G Royal Infirmary
Gilbert Bain, Lerwick
Hospital, Board Cipher
and Classification
Number of Hospitals: 43
R120: RADIOLOGY SERVICES
April 2007 - March 2008
Appendix 7.3 Costs per event for CT, MRI and ultrasound diagnostics
A2
A2
A2
A2
A2
A1
A1
A2
A2
A2
A2
A2
A3
A2
A3
A3
A3
A2
A2
A2
A1
A3
A3
A1
A1
A2
A1
A2
A3
A2
A2
A3
A2
A3
A3
232,509
12,850
14,050
7,506
1,451
2,889
13,651
5,567
188
17,089
9,985
2,823
1,153
2,720
4,626
1,914
859
1,116
9,072
7,672
7,420
6,257
13,721
324
1,860
37,579
1,220
7,260
2,383
465
7,636
7,237
2,579
4,565
477
2,226
83,798
3,375
2,731
2,974
649
779
3,426
1,327
7
4,102
3,722
1,034
406
1,064
1,472
457
354
402
1,252
1,444
1,056
1,578
3,152
131
992
33,244
539
1,920
923
163
1,783
1,487
559
1,133
141
474
96
61
63
113
150
130
177
159
173
119
105
94
138
118
136
165
140
111
76
81
86
128
60
98
79
25
176
229
216
436
129
119
92
50
35
219
Total
£
£
36
25
30
82
49
31
46
27
39
16
26
19
35
9
28
88
30
29
90
55
64
43
23
48
41
7
93
89
30
136
49
49
14
18
20
37
Gross
Attendance
Cost per
Allocated
132
86
93
195
199
161
223
186
211
135
131
113
173
127
163
252
171
140
166
136
150
171
83
146
120
32
269
318
246
572
178
168
105
67
55
257
£
-13
-3
-3
-21
-3
-3
-23
-27
-32
-2
-1
-6
-18
0
-12
-7
-15
-10
-41
-26
-24
-34
-3
-46
-19
-1
-17
-75
-100
-110
-17
-20
-1
-2
-2
-1
Other
ACT
£
Income
Income
-9
-2
-2
-2
-59
-31
-7
-25
-13
-3
-3
-11
-1
-7
-1
-2
-9
-6
0
-6
0
-4
0
-6
-20
-2
-2
0
0
-
Cost per Attendance
Total Costs
£
Net
110
83
91
171
193
157
141
128
172
108
117
105
152
115
150
239
155
127
116
104
126
131
80
100
97
32
246
223
146
462
159
146
104
65
53
255
Index
Group
100
76
82
156
176
143
129
117
157
98
107
95
138
105
137
217
141
116
106
95
115
120
73
91
88
29
224
203
133
421
145
133
95
59
48
232
68
Source: ISD http://www.isdscotland.org/isd/4434.html Excel File R044 Macros Enabled
http://www.isdscotland.org/isd/servlet/FileBuffer?namedFile=Costs_R044_2008.xls&pContentDispositionType=inline
Totals or Averages
Crosshouse Hospital
The Ayr Hospital
Borders General
Queen Margaret Hospital
Victoria Kirkcaldy
West Hospitals
Glasgow Royal Infirmary
Southern General (SGH)
Royal Alexandra Hospital
Inverclyde Royal Hospital
Stobhill, Glasgow
Victoria Infirmary, Glasgow
Vale of Leven, Alexandria
Raigmore, Inverness
Lorn & Islands District G.H.
Caithness General
Belford
Wishaw General
Monklands Hospital
Hairmyres, East Kilbride
Aberdeen Royal Infirmary
Dr. Gray's, Elgin
Balfour, Kirkwall
Edinburgh Royal Infirmary
Western General, Edinburgh
St. John's at Howden
Ninewells
Perth Royal Infirmary
Stracathro
Stirling Royal Infirmary
Falkirk Royal Infirmary
Western Isles, Stornoway
D&G Royal Infirmary
Galloway Community Hospital
Gilbert Bain, Lerwick
Cost per
Attendance
A
A
B
F
F
G
G
G
G
G
G
G
G
H
H
H
H
L
L
L
N
N
R
S
S
S
T
T
T
V
V
W
Y
Y
Z
Total
Direct
and Classification
New
Patients
Total
Attendances
25th November 2008
This is an ISD Scotland National Statistics release
* If menu is not active, change macro security settings using Tools, Macro, Security - set security level to Medium and re-open the report.
* Use drop-down menu to select specialties
Hospital, Board Cipher
Number of Hospitals: 62
General Medicine
April 2007 - March 2008
R044: SPECIALTY GROUP COSTS - CONSULTANT OUTPATIENTS
Appendix 7.4 Costs for a stroke consultant outpatient attendance
A2
A2
A2
A2
A1
A1
A2
A2
A3
A3
A1
A1
A2
A2
32,623
1,727
1,919
1,018
1,601
2,496
3,856
2,284
1,874
234
88
5,102
5,759
2,567
2,098
12,681
911
462
431
821
1,005
1,459
1,001
840
69
35
2,901
1,902
469
375
98
67
88
83
70
88
124
103
92
55
71
96
120
74
104
Total
£
£
35
42
14
25
11
42
27
25
87
33
32
33
44
27
36
Gross
Attendance
Cost per
Allocated
133
109
102
108
81
130
150
128
179
88
103
129
165
101
140
£
Other
ACT
£
Income
Income
-5
0
0
-7
-21
-3
-1
-2
-2
-2
-7
-2
-2
-14
-5
-2
-2
-5
-27
0
-10
-8
-11
-19
-22
-17
-16
Cost per Attendance
Total Costs
£
Net
114
104
102
105
79
118
102
125
168
78
90
108
136
82
122
69
Source: ISD http://www.isdscotland.org/isd/4434.html Excel File R044 Macros Enabled
http://www.isdscotland.org/isd/servlet/FileBuffer?namedFile=Costs_R044_2008.xls&pContentDispositionType=inline
Totals or Averages
Crosshouse Hospital
The Ayr Hospital
Queen Margaret Hospital
Victoria Kirkcaldy
West Hospitals
Glasgow Royal Infirmary
Southern General (SGH)
Raigmore, Inverness
Caithness General
Belford
Aberdeen Royal Infirmary
Edinburgh Royal Infirmary
Stirling Royal Infirmary
Falkirk Royal Infirmary
Cost per
Attendance
A
A
F
F
G
G
G
H
H
H
N
S
V
V
Total
Direct
and Classification
New
Patients
Total
Attendances
Index
Group
100
91
89
92
69
104
89
110
147
68
79
95
119
72
107
25th November 2008
This is an ISD Scotland National Statistics release
* If menu is not active, change macro security settings using Tools, Macro, Security - set security level to Medium and re-open the report.
* Use drop-down menu to select specialties
Hospital, Board Cipher
Number of Hospitals: 14
Vascular Surgery
April 2007 - March 2008
R044: SPECIALTY GROUP COSTS - CONSULTANT OUTPATIENTS
Appendix 7.5 Costs for a consultant vascular surgeon outpatient attendance
A2
A2
A2
A2
A2
A1
A1
A2
A2
A2
A2
A2
A3
A2
A3
A3
A3
A2
A2
A2
A1
A3
A3
A1
A1
A2
A1
A2
A3
A2
A2
A3
A2
A3
A3
A
A
B
F
F
G
G
G
G
G
G
G
G
H
H
H
H
L
L
L
N
N
R
S
S
S
T
T
T
V
V
W
Y
Y
Z
5837
2627
2958
6526
104
8725
7291
3793
6857
3810
4613
5242
361
5774
1428
1102
1479
5003
3883
4453
7598
2673
880
10201
5901
816
7423
3282
384
4516
865
879
3542
36
1087
3.5
5.0
2.8
4.3
1.0
3.7
4.9
5.6
3.6
4.3
3.3
4.4
2.1
3.9
3.7
3.0
3.3
5.0
4.6
4.9
3.6
4.6
4.3
3.7
5.8
1.2
5.6
2.8
0.9
4.0
6.4
5.1
4.2
1.4
3.9
4.2
174
£
97
238.7
288.4
528.1
314.7
1177.5
251.0
317.1
510.9
386.3
283.1
333.7
410.8
253.0
303.4
296.2
216.8
289.1
216.8
338.3
280.5
428.5
314.9
1165.1
537.8
753.9
523.7
429.5
333.7
460.8
406.9
331.2
393.3
411.6
108.4
241.3
572
702
229
508
293
382
404
776
368
670
467
671
1150
478
425
447
570
418
515
616
420
650
749
655
609
181
785
352
7
548
277
612
494
197
1054
148
257
192
164
86
159
183
232
140
244
115
140
723
110
30
82
101
145
126
155
123
55
147
269
487
139
196
105
31
150
44
213
92
20
79
95
311
79
159
50
70
88
134
50
70
81
74
83
63
14
47
95
40
30
115
207
130
169
52
110
58
151
39
15
99
112
53
140
36
62
£
383.7
£
Other
Care
£
AHP
Direct Cost per Case
Direct
530
Pharmacy
and
£
Nursing
Dental
Medical
32
74
4
24
12
14
17
16
53
38
21
18
136
1
2
5
6
2
7
54
8
38
8
2
1
1
20
12
3
20
1
26
17
£
Theatre
530
522
587
506
535
565
529
501
629
385
384
739
258
491
206
205
379
641
409
461
697
392
121
486
525
687
900
346
903
382
466
568
654
371
195
542
£
92
153
130
19
204
258
287
94
126
178
124
145
159
44
92
67
95
95
132
73
48
110
126
25
279
113
220
132
132
33
70
69
62
138
Laboratory
Total
£
Case
770
858
494
765
648
517
733
734
424
580
681
650
547
583
1017
651
753
773
626
857
680
617
1189
923
985
920
1021
520
1248
633
715
567
671
724
1270
729
Cost per
Allocated
* If menu is not active, change macro security settings using Tools, Macro, Security - set security level to Medium and re-open the report.
* Use drop-down menu to select specialties
£
2477
3166
2113
2571
2822
2162
2529
3191
2145
2397
2260
2826
3294
2187
1987
1696
2285
2306
2143
2588
2687
2232
3643
3040
3635
2542
3764
1810
2887
2372
2089
2441
2551
1526
2989
2611
Gross
£
ACT
-44
-18
-104
-15
-7
-17
-24
-68
-53
-117
-83
-21
-43
-101
-15
-15
-12
-11
-22
-21
-10
-64
-1
-81
-82
-85
-79
-1
-13
-13
-58
-22
-3
-
Income
£
Other
-112
-88
-226
-49
-59
-151
-136
-170
-29
-11
-136
-189
-9
-81
-81
-33
-64
-121
-188
-124
-250
-123
-22
-254
-225
-224
-159
-69
-217
-250
-138
-65
-141
-41
-48
-149
Income
Net
2347
2974
1871
2515
2746
1987
2324
2968
1998
2303
2102
2594
3184
2091
1891
1650
2210
2162
1935
2454
2373
2109
3622
2705
3328
2234
3526
1740
2670
2109
1937
2318
2388
1482
2941
304
318
280
291
1608
242
217
310
260
311
310
273
1130
264
180
264
327
149
193
231
274
239
538
352
314
509
287
311
547
270
117
231
254
279
380
70
223
171
175
179
667
139
150
131
117
135
203
147
260
151
274
216
228
154
135
174
187
134
277
250
170
748
183
185
1317
156
111
111
161
521
327
526
489
455
470
2276
381
367
441
376
445
513
419
1390
414
454
480
555
302
328
405
462
373
815
603
484
1257
470
496
1863
426
228
342
415
800
707
Average
Average
Variable Cost Overhead Cost Total Cost
per Day
Per Day
Per Day
£
£
£
£
2418
274
174
449
Total Costs
Cost per Case
25th November 2008
This is an ISD Scotland National Statistics release
Source: ISD http://www.isdscotland.org/isd/4434.html Excel File R040 Macros Enabled
http://www.isdscotland.org/isd/servlet/FileBuffer?namedFile=Costs_R040_2008.xls&pContentDispositionType=inline
Totals or Averages
Stroke Hospitals:
Crosshouse Hospital
The Ayr Hospital
Borders General
Queen Margaret Hospital
Victoria Kirkcaldy
West Hospitals
Glasgow Royal Infirmary
Southern General (SGH)
Royal Alexandra Hospital
Inverclyde Royal Hospital
Stobhill, Glasgow
Victoria Infirmary, Glasgow
Vale of Leven, Alexandria
Raigmore, Inverness
Lorn & Islands District G.H.
Caithness General
Belford
Wishaw General
Monklands Hospital
Hairmyres, East Kilbride
Aberdeen Royal Infirmary
Dr. Gray's, Elgin
Balfour, Kirkwall
Edinburgh Royal Infirmary
Western General, Edinburgh
St. John's at Howden
Ninewells
Perth Royal Infirmary
Stracathro
Stirling Royal Infirmary
Falkirk Royal Infirmary
Western Isles, Stornoway
D&G Royal Infirmary
Galloway Community Hospital
Gilbert Bain, Lerwick
Average
and Classification
133558
Length
of Stay
Specialty
Discharges
Hospital, Board Cipher
Number of Hospitals: 41
General Surgery
April 2007 - March 2008
R040: SPECIALTY GROUP COSTS - INPATIENTS IN ALL SPECIALTIES (EXC LONG STAY)
Appendix 7.6 Mean variable cost per day (excluding overheads and theatre costs) in a surgical ward
A2
A2
A2
A2
A2
A1
A1
A2
A2
A2
A2
A2
A3
A2
A3
A3
A3
A2
A2
A2
A1
A3
A3
A1
A1
A2
A1
A2
A3
A2
A2
A3
A2
A3
A3
A
A
B
F
F
G
G
G
G
G
G
G
G
H
H
H
H
L
L
L
N
N
R
S
S
S
T
T
T
V
V
W
Y
Y
Z
11864
9694
8153
6510
9444
11950
13982
9201
9730
7595
8518
11651
4745
8734
1467
1679
1221
11115
11983
9640
12466
4249
1101
18649
5871
9328
14736
7843
24
9144
395
1600
6052
11
1052
260608
4.9
4.9
5.5
5.0
2.9
5.2
5.3
4.9
5.0
5.2
2.8
4.1
5.8
4.1
6.3
4.6
5.8
4.5
3.7
4.5
5.4
6.2
4.6
2.5
3.6
5.6
4.9
4.8
1.1
3.6
21.7
9.1
4.9
12.7
5.3
74.4
62.7
315.1
78.7
119.4
296.5
126.6
272.7
150.6
203.8
195.0
188.6
216.1
222.8
337.2
278.1
317.1
171.2
166.8
216.0
86.2
254.4
299.9
336.8
355.4
274.2
237.7
143.4
634.7
217.3
200.6
391.6
384.8
789.9
615.6
207.8
£
568
564
681
860
405
560
515
627
617
554
401
666
695
501
805
630
1326
498
372
417
426
1033
777
371
434
727
599
394
6
443
1834
1398
626
1708
932
£
182
319
268
256
102
155
166
238
214
148
96
145
178
163
31
152
170
158
107
94
458
161
98
54
160
151
232
179
15
145
225
170
206
158
123
179
£
89
95
94
158
114
142
85
106
76
74
47
56
83
118
14
50
103
43
86
70
226
97
221
44
76
108
113
55
109
69
194
247
157
112
95
95
9
17
11
8
33
9
11
8
9
12
15
42
8
16
2
1
1
4
2
3
55
3
8
17
2
1
1
8
25
4
22
7
24
£
2
4
314
4
5
28
7
1
0
2
211
9
9
3
11
£
102
72
53
91
255
195
304
156
105
104
184
109
118
106
85
166
158
167
107
64
54
26
48
56
215
129
145
136
136
64
119
112
68
129
£
591
687
706
733
519
675
488
623
359
516
448
527
387
588
1008
663
1116
531
459
757
442
621
998
439
441
691
584
389
779
462
1833
1239
681
1893
1101
562
£
1625
1821
2073
2172
1359
2095
1582
2181
1583
1616
1333
1776
1684
1716
2406
1890
3127
1572
1351
1725
1746
2230
2502
1274
1523
2024
1985
1291
2004
1485
4452
3542
2204
4779
2963
1736
Gross
£
ACT
-39
-20
-30
-14
-13
-28
-245
-68
-36
-35
-42
-47
-15
-34
-7
-15
-5
-9
-9
-9
-5
-62
-1
-44
-47
-40
-36
0
-7
-7
-131
-17
-21
-
Income
£
Other
-97
1523
1662
1835
2118
1309
1749
1451
1988
1537
1565
1187
1674
1644
1653
2309
1828
3041
1502
1285
1627
1517
2151
2467
1041
1344
1858
1842
1249
1969
1325
4310
3282
2072
4684
2921
188
198
204
279
274
207
181
280
235
201
264
281
215
258
174
251
328
214
225
192
200
245
320
241
253
208
256
180
808
237
114
222
281
219
343
71
119
141
128
147
180
130
92
128
72
99
160
129
66
143
161
144
191
117
125
167
82
100
217
176
124
123
119
81
719
127
85
137
138
149
208
308
340
332
426
454
337
273
408
307
300
424
410
281
401
336
395
519
331
350
358
282
345
538
417
377
331
374
261
1528
364
199
359
420
368
550
Average
Average
Variable Cost Overhead Cost Total Cost
Per Day
Per Day
per Day
£
£
£
£
1600
225
122
348
Net
Cost per Case
-82
-129
-223
-40
-22
-101
-63
-157
-11
-9
-99
-87
-6
-56
-82
-57
-77
-61
-57
-92
-167
-78
-36
-189
-131
-125
-107
-42
-35
-153
-135
-129
-115
-74
-42
Income
Total Costs
25th November 2008
This is an ISD Scotland National Statistics release
Source: ISD http://www.isdscotland.org/isd/4434.html Excel File R040 Macros Enabled
http://www.isdscotland.org/isd/servlet/FileBuffer?namedFile=Costs_R040_2008.xls&pContentDispositionType=inline
Totals or Averages
Stroke Hospitals:
Crosshouse Hospital
The Ayr Hospital
Borders General
Queen Margaret Hospital
Victoria Kirkcaldy
West Hospitals
Glasgow Royal Infirmary
Southern General (SGH)
Royal Alexandra Hospital
Inverclyde Royal Hospital
Stobhill, Glasgow
Victoria Infirmary, Glasgow
Vale of Leven, Alexandria
Raigmore, Inverness
Lorn & Islands District G.H.
Caithness General
Belford
Wishaw General
Monklands Hospital
Hairmyres, East Kilbride
Aberdeen Royal Infirmary
Dr. Gray's, Elgin
Balfour, Kirkwall
Edinburgh Royal Infirmary
Western General, Edinburgh
St. John's at Howden
Ninewells
Perth Royal Infirmary
Stracathro
Stirling Royal Infirmary
Falkirk Royal Infirmary
Western Isles, Stornoway
D&G Royal Infirmary
Galloway Community Hospital
Gilbert Bain, Lerwick
Case
£
552
Laboratory
£
4.6
Theatre
Cost per
Other
Care
AHP
Direct
Pharmacy
and
Dental
Average
Nursing
Medical
Specialty
Total
and Classification
Direct Cost per Case
Hospital, Board Cipher
Length
Allocated
Discharges
of Stay
Number of Hospitals: 36
General Medicine
April 2007 - March 2008
R040: SPECIALTY GROUP COSTS - INPATIENTS IN ALL SPECIALTIES (EXC LONG STAY)
Appendix 7.7 Mean variable cost per day (excluding overheads and theatre costs) in a general medical ward
A
A
B
F
F
G
G
G
G
G
G
G
G
H
H
H
L
L
L
N
N
R
S
S
S
T
T
T
V
V
W
Y
Y
Z
A2
A2
A2
A2
A2
A1
A1
A2
A2
A2
A2
A2
A3
A2
A3
A3
A2
A2
A2
A1
A3
A3
A1
A1
A2
A1
A2
A3
A2
A2
A3
A2
A3
A3
17
9
6
9
6
19
21
19
12
6
9
8
2
9
1
1
11
9
8
23
5
1
21
11
13
18
8
3
8
5
2
8
1
2
327
Theatres
of
Number
390
296
125
248
151
385
465
422
215
94
117
99
21
335
24
25
242
250
250
669
91
28
718
327
274
655
215
55
177
89
79
260
19
29
8,274
Week
Per
Hours
23
33
21
28
25
20
22
22
18
16
13
12
11
37
24
25
22
28
31
29
18
28
34
30
21
36
27
18
22
18
40
32
19
15
25
Per Week
100
91
130
82
109
99
80
88
88
71
62
51
49
42
147
95
101
87
110
124
115
72
111
135
117
83
144
106
73
87
71
157
128
73
58
Index
3,754
1,776
1,721
2,917
1,492
5,394
6,333
5,169
3,371
1,281
1,884
1,178
1,168
3,019
262
335
2,989
2,868
2,245
8,243
1,225
8,769
4,415
3,701
6,781
1,177
311
1,908
911
576
2,314
269
741
£000
95,598
Medical
& Dental
Group
Per Theatre
Theatre Hours Used
5,180
3,707
1,794
2,165
1,303
6,426
7,939
7,137
5,243
2,030
2,672
2,366
387
2,714
354
296
3,064
2,534
2,223
7,271
1,574
189
9,317
3,443
3,608
7,101
2,041
1,476
1,779
1,729
944
3,084
375
444
£000
109,961
Nursing
Staff
50
378
113
727
408
37
2
113
178
87
2
2
28
851
35
70
1,900
35
6
1,033
334
49
208
75
109
681
-
£000
7,918
Other
393
690
128
235
244
884
842
844
475
228
193
216
49
633
24
29
502
202
498
3,705
262
9
1,466
489
415
844
235
61
246
529
125
345
13
-
£000
16,606
Drugs
Direct Costs
71
23
351
88
384
443
387
205
24
8
38
78
10
1,266
23
40
17
49
45
519
551
3,395
1,728
51
2,616
795
104
12
4
0
£000
13,528
CSSD
Supplies
* If menu is not active, change macro security settings using Tools, Macro, Security - set security level to Medium and re-open the report.
* Use drop-down menu to select specialties
5,068
4,188
760
2,710
2,178
6,069
5,679
7,312
2,452
2,088
1,058
2,013
309
3,793
179
81
3,129
1,959
3,427
3,035
1,655
113
13,081
3,234
2,144
4,149
1,546
534
76
22
334
4,764
106
198
£000
92,512
Other
4,644
2,459
1,914
2,479
2,256
5,934
4,726
2,902
4,791
1,976
2,503
1,131
819
2,681
511
378
4,149
3,267
3,658
8,356
1,978
291
10,184
4,098
4,609
6,178
2,396
2,701
688
1,976
306
-
£000
101,891
Costs
Allocated
Total
19,159
13,221
6,781
11,321
8,265
25,187
25,908
23,682
16,534
7,698
8,350
6,983
2,770
14,957
1,387
1,230
13,849
10,879
12,097
33,030
7,245
602
42,853
15,679
14,483
29,482
9,455
5,183
6,834
4,062
2,879
13,175
1,074
1,383
£000
438,015
income)
ACT
(net of
Expenditure
£000
31
434
0
0
188
0
95
17
7
907
4
796
-
570
expenditure)
theatre
(netted in
ACT
Income
72
£
945
859
1,042
878
1,055
1,257
1,071
1,079
1,477
1,570
1,375
1,356
2,516
859
1,107
929
1,100
835
930
950
1,535
414
1,147
923
1,015
865
846
1,800
744
874
698
975
1,110
911
1,018
Index
Group
Hour Used
Theatre
per
Net Cost
93
84
102
86
104
123
105
106
145
154
135
133
247
84
109
91
108
82
91
93
151
41
113
91
100
85
83
177
73
86
69
96
109
90
100
25th November 2008
This is an ISD Scotland National Statistics release
Source: ISD http://www.isdscotland.org/isd/4434.html Excel File R140 Macros Enabled
http://www.isdscotland.org/isd/servlet/FileBuffer?namedFile=Costs_R140_2008.xls&pContentDispositionType=inline
Totals or Averages
Stroke Hospitals:
Crosshouse Hospital
The Ayr Hospital
Borders General
Queen Margaret Hospital
Victoria Kirkcaldy
West Hospitals
Glasgow Royal Infirmary
Southern General (SGH)
Royal Alexandra Hospital
Inverclyde Royal Hospital
Stobhill, Glasgow
Victoria Infirmary, Glasgow
Vale of Leven, Alexandria
Raigmore, Inverness
Caithness General
Belford
Wishaw General
Monklands Hospital
Hairmyres, East Kilbride
Aberdeen Royal Infirmary
Dr. Gray's, Elgin
Balfour, Kirkwall
Edinburgh Royal Infirmary
Western General, Edinburgh
St. John's at Howden
Ninewells
Perth Royal Infirmary
Stracathro
Stirling Royal Infirmary
Falkirk Royal Infirmary
Western Isles, Stornoway
D&G Royal Infirmary
Galloway Community Hospital
Gilbert Bain, Lerwick
& Classification
Hospital, Board Cipher
Number of Hospitals: 38
Acute Sector Hospitals excl Long Stay
April 2007 - March 2008
R140: THEATRE SERVICES
Appendix 7.8 Costs per hour for theatre time inclusive of overheads, staff costs and consumables
Appendix 7.9 Costs by function for hospitals in NHS Greater Glasgow and Clyde
Hospitals in Greater Glasgow & Clyde with a CT Scanner for first level diagnosis for the exclusion of haemorrhagic stroke
Glasgow
Royal
Southern
Victoria
Royal
Western
Alexandra
General
Infirmary
Infirmary
Infirmary
Stobhill
Hospital
Hospital Name
South
South
North
North
North
Paisley
Glasgow
Glasgow
Glasgow
Glasgow
Glasgow
Renfrew
Principal Location
Hospital Classification Code
A2
A2
A1
A1
A2
A2
Inverclyde
Royal
Hospital
Greenock
Inverclyde
A2
Vale of
Leven
Alexandria
Dumbarton
A3
Inverclyde
Royal
Hospital
Yes
Yes
Yes
Yes
No
No
Vale of
Leven
No
Yes
No
Yes
No
No
Southern
General
Yes
Yes
Yes
Yes
Yes
Yes
Victoria
Infirmary
No
Yes
Yes
Yes
No
No
Glasgow
Royal
Infirmary
Yes
Yes
Yes
Yes
Yes
No
Western
Infirmary
Yes
Yes
Yes
Yes
Yes
Yes
Stobhill
Yes
Yes
Yes
Yes
No
No
Royal
Alexandra
Hospital
Yes
Yes
Yes
Yes
No
No
6
0
3
3
5
1
6
0
4
2
4
2
4
2
2
4
Acute Stroke Unit Available
Rehabilitation Stroke Unit Available
If No Rehabilitation Unit are patients transferred Elsewhere
Neurovascular Clinic Available
Southern
General
Yes
Yes
n/a
Yes
Victoria
Infirmary
No
Yes
n/a
Yes
Glasgow
Royal
Infirmary
Yes
No
Yes
Yes
Western
Infirmary
Yes
No
Yes
Yes
Stobhill
Yes
Yes
n/a
Yes
Royal
Alexandra
Hospital
Yes
Yes
n/a
Yes
Inverclyde
Royal
Hospital
Yes
Yes
n/a
Yes
Vale of
Leven
No
Yes
n/a
No
Costs of Patient Transport: SAS Greater
Glasgow & Clyde
Accident & Emergency - Cost per Incident
Patient Transport Service - Cost per Journey
Ambulance Car Service - Cost per Journey
Patient Air Transport Service - Cost per Mission
Health
Board Total
163
18
16
3,009
Southern
General
163
18
16
3,009
Victoria
Infirmary
163
18
16
3,009
Glasgow
Royal
Infirmary
163
18
16
3,009
Western
Infirmary
163
18
16
3,009
Stobhill
163
18
16
3,009
Royal
Alexandra
Hospital
163
18
16
3,009
Inverclyde
Royal
Hospital
163
18
16
3,009
Vale of
Leven
163
18
16
3,009
Costs associated with an initial diagnosis of
Stroke in Greater Glasgow & Clyde
Accident & Emergency - Consultant Clinic Costs
CT Scanning - Cost Per Scan Event
MRI Scanning - Cost Per Scan Event
Ultrasound Scanning - Cost Per Scan Event
Health
Board Total
83
119
232
56
Southern
General
84
140
252
66
Victoria
Infirmary
75
77
169
36
Glasgow
Royal
Infirmary
80
111
201
52
Western
Infirmary
77
125
230
64
Stobhill
78
126
204
61
Royal
Alexandra
Hospital
89
132
239
62
Inverclyde
Royal
Hospital
85
108
195
51
Vale of
Leven
83
87
157
41
Inpatient costs per day in Greater Glasgow &
Health
Board Total
Clyde excluding surgery and overheads
Inpatient Costs per Day - General Medicine
233
Southern
General
280
Victoria
Infirmary
281
Glasgow
Royal
Infirmary
181
Western
Infirmary
207
Stobhill
264
Royal
Alexandra
Hospital
235
Inverclyde
Royal
Hospital
201
Vale of
Leven
215
Consultant outpatient costs per event in
Greater Glasgow & Clyde
Consultant Outpatients - General Medicine
Consultant Outpatients - General Surgery
Consultant Outpatients - Vascular Surgery
Health
Board Total
122
182
115
Southern
General
172
127
125
Victoria
Infirmary
152
125
0
Glasgow
Royal
Infirmary
128
96
102
Western
Infirmary
141
110
118
Stobhill
105
70
0
Royal
Alexandra
Hospital
108
98
0
Inverclyde
Royal
Hospital
117
103
0
Vale of
Leven
115
93
0
Surgical intervention costs for inpatients and
Health
Board Total
outpatients in Greater Glasgow & Clyde
Daycase Surgery - General Surgery
751
Inpatient Surgery - Cost Per Day's Stay
382
Theatre Costs - Per Hour
1,463
Southern
General
928
310
1,079
Victoria
Infirmary
840
273
1,356
Glasgow
Royal
Infirmary
720
217
1,071
Western
Infirmary
755
242
1,257
Stobhill
680
310
1,375
Royal
Alexandra
Hospital
581
260
1,477
Inverclyde
Royal
Hospital
730
311
1,570
Vale of
Leven
773
1,130
2,516
Current general service provision in the hospitals of
Greater Glasgow & Clyde in relation to stroke pathway
Accident & Emergency 24 Hour Coverage
CT Scanning Facilities
MRI Scanning Facilities
Ultrasound Scanning Facilities
Current Discharges for Carotid Endarterectomy
Currently Delivering Thrombolytic Therapy
Ranking out of 6
Estimated Number of Additional Hospital Transfers
Current service provision for stroke in Greater Glasgow &
Clyde
Source: NHS Quality Improvement Scotland
73
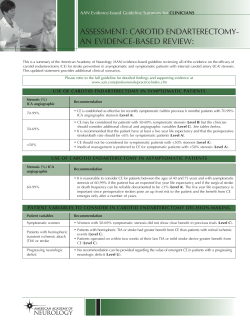


© Copyright 2026