
PDF - Big Yellow Self Storage
Big Yellow Group PLC Highlights Big Yellow Group PLC (“Big Yellow”, “the Group” or “the Company”) AUDITED RESULTS FOR THE YEAR ENDED 31 MARCH 2015 ABOUT US Big Yellow Group PLC is the UK’s brand leader in self storage. Big Yellow now operates from a platform of 84 stores, including 14 stores branded as Armadillo Self Storage, in which the Group has a 20% interest. We own a further five Big Yellow self storage development sites, of which two have planning consent. The current maximum lettable area of this platform is 5.1 million sq ft. When fully built out the portfolio will provide approximately 5.4 million sq ft of flexible storage space. Of the Big Yellow stores and sites, 96% are held freehold and long leasehold (by value); with the remaining 4% short leasehold. The Group has pioneered the development of the latest generation of self storage facilities, which utilise state of the art technology and are located in high profile, accessible, main road locations. Our focus on the location and visibility of our Big Yellow stores, coupled with our excellent customer service and our market leading online platform, has created the most recognised brand name in the UK self storage industry. STRONG OPERATING PERFORMANCE DELIVERS 32% EARNINGS GROWTH(2) Financial metrics Revenue Adjusted profit before tax(1) Adjusted diluted EPRA earnings per share(2) Dividend – final – total Adjusted NAV per share(3) Cash flow from operating activities (after net finance costs) Store metrics Occupancy growth(4) Occupancy (%)(4) Average net achieved rent per sq ft(4) Statutory metrics Profit before tax Basic earnings per share 1 See note 10 2 See note 12 3 See notes 12 and 14 Year ended 31 March 2015 £84.3m £39.4m 27.1p 11.3p 21.7p 510.4p £42.4m Year ended 31 March 2014 £72.2m £29.2m 20.5p 8.4p 16.4p 446.5p £32.8m % Growth 17 35 32 35 32 14 29 267,000 sq ft 73.2% £24.95 200,000 sq ft 67.9% £24.32 34 8 3 £105.2m 72.5p £59.8m 42.5p 76 71 4 See Portfolio Summary and Operating and Financial Review Highlights • Increased demand throughout UK • Growth in all our key store metrics • 32% increase in adjusted earnings per share and total dividend • Acquisition of remaining two thirds of Big Yellow Limited Partnership and £76.4m placing • Platform expanded by 234,000 sq ft: – Two new freehold stores constructed at Gypsy Corner and Enfield – Two existing freehold stores acquired in Oxford and Chester 1 Big Yellow Group PLC Highlights • Acquisition of freehold building in Cambridge for conversion • Acquisition of freehold interest in existing store in Battersea • Debt refinanced – diversified pool, extended maturity, lower cost • Two Armadillo joint ventures with Australian consortium – April 2014: Acquisition of ten store portfolio totalling 401,000 sq ft – February 2015: Acquisition of four store portfolio totalling 270,000 sq ft Nicholas Vetch, Executive Chairman of Big Yellow, commenting said: “We are pleased to report very strong results, with demand growth across our network reflecting improved economic growth not just in London, but within the UK as a whole. To deliver this performance we continue to innovate and maintain an unerring focus on all aspects of our business, such that we grow our market share and monetise the strength of our brand. We make no attempt to judge the economic cycle as it is a fruitless task and never more than now. We have now positioned the Group for the long-term so that we can enjoy the benefits of a strong economy and also adequately accommodate any reverses. The most important contribution to performance will be growing the occupancy and increasing rental rates in the existing platform of stores. In addition, there is scope to add more stores but the availability of land, and competition for it, makes this challenging. That said, there will be opportunities and we are well positioned to exploit them. The objective is very simple; to grow earnings and dividend at a compelling, but sustainable rate over a long period of time, without taking undue risk.” 2 Big Yellow Group PLC Chairman’s Statement Big Yellow Group PLC (“Big Yellow”, “the Group” or “the Company”), the UK’s brand leader in self storage, is pleased to announce results for the fourth quarter and the year ended 31 March 2015. We are pleased to report very strong results, with demand growth across our network reflecting improved economic growth not just in London, but within the UK as a whole. To deliver this performance we continue to innovate and maintain an unerring focus on all aspects of our business, such that we grow our market share and monetise the strength of our brand. Financial results Revenue for the year was £84.3 million (2014: £72.2 million), an increase of 17%. Excluding the Partnership stores consolidated from 1 December 2014, revenue was £80.6 million, an increase of 12% from the prior year. The stores have grown in occupancy over the year from 67.9% to 73.2% at 31 March 2015. Cash inflows from operating activities (after finance costs) increased by £9.6 million (29%) to £42.4 million for the year (2014: £32.8 million). The Group made an adjusted profit before tax in the year of £39.4 million (2014: £29.2 million), up 35%. This translated into a 32% increase in adjusted earnings per share to 27.1p (2014: 20.5p). The Group made a statutory profit before tax for the year of £105.2 million, compared to a profit of £59.8 million last year. The revaluation gain on the investment property portfolio is £64.5 million for the year, reflecting the improved operating performance of the business and yield compression. The Group has net bank debt of £277.1 million at 31 March 2015 (2014: £226.1 million). This represents approximately 27% (2014: 28%) of the Group’s gross property assets totalling £1,022.8 million (2014: £804.8 million) and 35% (2014: 36%) of the adjusted net assets of £801.4 million (2014: £634.4 million). The Group’s income cover for the year (expressed as the ratio of cash generated from operations against interest paid) was 5.4 times (2014: 4.1 times). On an annualised basis at March the ratio was 5.9 times. Placing and acquisition of Big Yellow Limited Partnership We set up Big Yellow Limited Partnership with Pramerica Real Estate Investors in November 2007 to build out our regional portfolio, allowing us to focus the Group’s resources on developing our London sites. The Partnership had a limited life, with Big Yellow having a call option over Pramerica’s equity interest crystallising from the March 2015 balance sheet. We were therefore very pleased to have come to an agreement with Pramerica to accelerate this process and on 1 December 2014 acquired their 66.67% share for £39.25 million and the underlying Partnership debt (£57 million) totalling £96.25 million. This was largely funded by a successful placing raising £76.4 million (net of expenses) in November 2014. The acquisition represented an opportunity to employ more capital into prime Big Yellow branded assets and consolidate the Group’s position as the leading UK self storage brand, where the Company has detailed knowledge and visibility over the assets acquired. Investment in new capacity In the year we have made some progress in growing our self storage platform in key target locations, although competition for land remains high, particularly in London. In July we acquired a freehold store in Oxford from Fort Box Self Storage for £4.1 million. The store has been rebranded as a Big Yellow, and has a current lettable area of 35,000 sq ft, with expansion space for a further 10,000 sq ft. Our existing 33,000 sq ft Oxford store averages over 85% occupied and this acquisition will allow us to drive growth in occupancy and rental yield from our larger operating platform. We acquired the freehold of a former Royal Mail depot in Cambridge adjacent to the Cambridge Retail Park, Newmarket Road, completing in April 2015, which we intend to refurbish and convert into a 55,000 sq ft self storage centre, opening in late 2015. We expect the total investment including refurbishment to be approximately £9.3 million. 3 Big Yellow Group PLC Chairman’s Statement This is our first new site acquisition for construction in seven years. The acquisition is testament to our confidence in both Cambridge and our business model. It should be noted, however, that the opportunity took 14 years to present itself, despite continual searching over that time. We opened our 60,000 sq ft store in Enfield on 1 April 2015, on a prominent location on the A10. We intend to construct our store in Central Guildford over the course of the year, and anticipate it opening in Autumn 2016. We have acquired the freehold interest of our existing 34,000 sq ft store in Battersea, which had 12 years remaining on the occupational lease together with a 14,100 sq ft retail unit let to Halfords on an annual rent of £458,000 with 7 years unexpired, part of which is sublet to Pets at Home. The next rent review date is January 2017. The total consideration paid was £23 million. This increases the freehold ownership of our portfolio and protects our position in this important central London location. In the medium term, we will redevelop the 1.5 acre site to include a larger Big Yellow store together with other uses. In April 2014 we acquired the Armadillo portfolio in a joint venture with an Australian consortium for a property value of £19.75 million. Our equity invested in this joint venture is £1.9 million, representing a 20% stake. The business has traded ahead of expectations since acquisition, and, in addition to the management fees earned, we have received a first year dividend of £178,000, representing a 9.3% yield. In January 2015, the Group acquired the entire share capital of Big Storage Limited, a self storage company with five stores in the North West of England, for a property value of £24.9 million. The Group retained the store in Chester, which will be rebranded as Big Yellow. The Group subsequently sold the company with the remaining four stores to a joint venture company for a property value of £19.3 million, of which the Group owns 20% and an Australian consortium the remaining 80%. These four stores will be rebranded as Armadillos. This brings our Armadillo brand to 14 stores with a total capacity of 671,000 sq ft, and blended occupancy of 69.0% at 31 March 2015. Dividends The Group’s dividend policy is to distribute 80% of full year adjusted earnings per share. The final dividend declared is 11.3 pence per share. The dividend declared for the year of 21.7 pence per share represents an increase of 32% from 16.4 pence per share last year. Our people Success in any business is ultimately driven from within and with all making a contribution. I believe that we have a unique culture in the business with accessible management and a non-hierarchical structure which values and endeavours to reward everyone in the organisation for their contribution to our success. Our strong performance during the year was driven as always by the efforts and loyalty of our Big Yellow team, and our people remain pivotal to the achievement of our key medium term objectives of driving occupancy, revenue, and cash flow growth. Outlook We make no attempt to judge the economic cycle as it is a fruitless task and never more than now. We have now positioned the Group for the long-term so that we can enjoy the benefits of a strong economy and also adequately accommodate any reverses. The most important contribution to performance will be growing the occupancy and increasing rental rates in the existing platform of stores. In addition, there is scope to add more stores but the availability of land, and competition for it, makes this challenging. That said, there will be opportunities and we are well positioned to exploit them. The objective is very simple; to grow earnings and dividend at a compelling, but sustainable rate over a long period of time, without taking undue risk. Nicholas Vetch Chairman 18 May 2015 4 Big Yellow Group PLC Strategic Report The Strategic report discusses the following areas: Our strategy and business model Operational and marketing review Store performance Financial review Going concern basis Principal risks and uncertainties Corporate social responsibility OUR STRATEGY AND BUSINESS MODEL Our Strategy Our strategy from the outset has been to develop Big Yellow into the market leading self storage brand, which we have achieved with unprompted awareness of over seven times that of our nearest competitor (source: YouGov survey, May 2015). We concentrate on developing our stores in main road locations with high visibility, where our distinctive branding generates high awareness of Big Yellow. Self storage demand from businesses and individuals at any given store is linked in part to local economic activity, consumer and business confidence, all of which are inter-related. Fluctuations in housing activity whether in the rented or owner occupied sector are also a factor and in our view influence the top slice of demand over and above a core occupancy. This has been demonstrated by the resilience of our like-for-like stores since September 2007 despite a collapse in housing activity and GDP over the period 2007 to 2009. Local GDP and hence business and housing activity are greatest in the larger urban conurbations and in particular London and the South East. Furthermore, people and businesses are space constrained in these more expensive areas. Barriers to entry in terms of competition for land and difficulty around obtaining planning are also highest in more urbanised locations. Over the last 16 years we have created a portfolio of 70 purpose built prime Big Yellow self storage centres, largely freehold and focussed on London, the South East and large metropolitan cities. 61% of our current store revenue derives from within the M25; for London and the South East, the proportion of current store revenue is 80%. The REVPAF performance of our stores in London was more resilient over the downturn than in the regions. Our Big Yellow stores are on average 63,000 sq ft, compared to an industry average of 41,000 sq ft (source: The Self Storage Association 2015 UK Annual Survey). The upside from filling our larger than average sized stores is, in our view, only possible in large metropolitan markets, where self storage demand from domestic and business customers is the highest. As the operating costs of our assets are relatively fixed, larger stores in bigger urban conurbations, particularly London, drive higher revenues and higher operating margins. We continue to believe that the medium term opportunity to create shareholder value will be principally achieved by leasing up existing stores to drive revenue, the majority of which flows through to the bottom line given that our operating and central overhead costs are already largely fixed and embedded. Our key objectives remain: - leveraging our market leading brand position to generate new prospects, principally from our online mobile and desktop platforms; - focusing on training, selling skills, and customer satisfaction to maximise prospect conversion and referrals; - growing occupancy and net rent so as to drive revenue optimally at each store; - maintaining a focus on cost control, so revenue growth is transmitted through to earnings growth; - maintaining a conservative capital structure in the business with Group pre-interest cash flow cover of a minimum of five times annual interest expense; and 5 Big Yellow Group PLC Strategic Report - producing sustainable returns for shareholders through a low leverage, low volatility, high distribution REIT. In the fifteen years since flotation in May 2000, Big Yellow has delivered a Total Shareholder Return (“TSR”), including dividends reinvested, of 15.2% per annum, in aggregate 740% at the closing price of 647.5p on 31 March 2015. This compares to 7.8% per annum for the FTSE Real Estate Index and 4.8% per annum for the FTSE All Share index over the same period. This demonstrates the power of compounding over the longer term. Our business model Attractive market dynamics • • • • UK self storage penetration in key urban conurbations remains relatively low Very limited new supply coming onto the market Resilient through the downturn Sector growth is positive, with increasing domestic demand Our competitive advantage • • • • • • Industry’s most recognised brand Prominent stores on arterial or main roads, with extensive frontage and high visibility Largest share of web traffic from mobile and desktop platforms Excellent customer service, customer feedback programme with store level customer satisfaction surveys Largest UK self storage footprint by Maximum Lettable Area (“MLA”) capacity Primarily freehold estate concentrated in London and South East and other large metropolitan cities Larger average store capacity – economies of scale, higher operating margins Secure financing structure with strong balance sheet Evergreen income streams • • • • 47,250 customers Average length of stay for existing customers of 22 months 29% of customers in stores > two year length of stay Low bad debt expense (0.15% of revenue in the year) Strong growth opportunities • • • • • • Driving REVPAF with a focus on occupancy growth Yield management as occupancy increases Demand increasing with improving economic activity Growth in national accounts and business customer base Increasing the platform from the Group’s resources Continuing investment in our 20% Armadillo joint ventures Conversion into quality earnings • • • • Freehold assets for high operating margins and operational advantage Low technology & obsolescence product, maintenance capex fully expensed Annual compound adjusted eps growth of 17% since 2004/5 Annual compound cash flow growth of 16% since 2004/5 • • The self storage market In the recently published 2015 Self Storage Association UK Survey, only 45% of those surveyed had a reasonable or good awareness of self storage, in line with findings from our own research. Furthermore, only 6% of the 2,151 adults surveyed were currently using self storage or were thinking of using self storage in the next year. This indicates a continued opportunity for growth and with increasing use, together with the ongoing marketing efforts of everyone in the industry, we anticipate awareness to grow. Growth in new facilities across the industry has been limited to regional areas of the UK, particularly in the north, whereas in London, there were very few new openings last year and indeed capacity is expected to fall in the next twelve months with the closures of stores for redevelopment into alternative uses. Between 2010 and 2014 average industry openings have been approximately nine per year, which compares to an average of 34 per year in the preceding four years. 6 Big Yellow Group PLC Strategic Report 78% of respondents to the survey expected an improvement in profits this year, compared to 79% last year, and 84% expect rents for new customers to rise in 2015 compared to 87% last year. The Self Storage Association (“SSA”) estimate that the UK industry is made up of approximately 1,022 self storage facilities (of which 159 are purely container operations), providing 35.7 million sq ft of self storage space, equating to 0.56 sq ft per person in the UK. This compares to 7.3 sq ft per person in the US, 1.6 sq ft per person in Australia and 0.1 sq ft for mainland Europe, where the roll-out of self storage is a more recent phenomenon (source: Self Storage Association 2015 UK Annual Survey). 346 self storage facilities in the UK are held by large operators (defined as those managing 10 facilities or more) which represents 40% of the total number of self storage centres, but we would estimate approximately 50 to 60% of total capacity. Awareness of self storage will continue to grow as more businesses and individuals use the product at a time when the supply side is restricted, with very few store openings expected in the calendar year. Big Yellow is well placed to benefit from the growing self storage market, given the strength of our brand, and online platform which delivers approximately 86% of our prospect enquiries. Our portfolio is strategically focussed on London, the South East and large metropolitan cities, where barriers to entry and economic activity are at their highest. KPIs The key performance indicators of our stores are occupancy and rental yield, which together drive the revenue of the business. These are three key measures which are focussed on by the Board, and are reported on a weekly basis. Over the course of past five years, both occupancy and revenue have grown significantly. Rental yield was relatively stable between 2010 and 2012, reduced following the introduction of VAT in 2013 and grew by 6.1% in the year to 31 March 2014. It has decreased this year by 3.5%, principally reflecting the acquisition of the Big Yellow Limited Partnership stores at a lower average net rent per sq ft, being a regional portfolio. On a like for like basis, net rent has grown by 2.4% this year. Our key focus is on continuing to grow occupancy, with rental yield growth following once the stores have reached higher occupancy levels. Adjusted profit before tax, adjusted earnings per share and distributions to shareholders are our other KPIs. We have delivered compound eps growth of 15% over the past five years, and compound dividend growth of 24% over the same period. Compound adjusted eps growth since 2004/5 is 17%. Capital structure In November 2013, the Company carried out a study of debt leverage and its impact on the long-term share performance of businesses, with the help of an external consultant. The study covered 40 quoted companies in the REIT space together with other consumer facing businesses for the period from 2000 to 2013. The main objective was to see if the results supported our long held view that lower geared businesses outperform in the long-term. Different business models with varying operating margins might, at the margin, have different optimum levels of debt. However a consistent theme emerged that excessive levels of debt have been universally value destructive. In a narrow window between 2003 and 2006 higher levels of debt would have delivered higher returns, but even during that period optimum levels of debt were lower than might be expected, and would have required pinpoint accuracy in timing. Transmission of this value destruction did result in significant underperformance and marked increases in share price volatility. Optimum levels of LTV gearing (expressed as net debt to gross asset value) ranged from 10% in moments of extreme fear (2008 to 2009) to 43% in periods of exuberance (2003 to 2006). Using 2009 to 2013 as a base, which is more representative of the long-term norm, albeit on a conservative basis, the optimum level of LTV was found to be 23%. We have previously said that we believe that the Group would benefit from lower leverage and the Board has a longterm target of Group income cover of over 5 times. The relationship of this metric to capital leverage is not perfectly correlated but making long-term assumptions on values and interest is reasonably correlated. We believe that the optimum level of LTV is 20% to 30% with a target of mid 20s from the current level of 27%. Given the subjective nature of valuations we prefer to express this target as net operating income over debt costs. 7 Big Yellow Group PLC Operational and Marketing Review Overview We now have a portfolio of 73 Big Yellow stores and sites of which 70 are currently open (Enfield opened on 1 April 2015). In addition we operate from 14 Armadillo Self Storage centres which are located in northern cities. Our store in Cambridge is expected to open in late 2015, and our store at Guildford Central is expected to open in Summer 2016. Planning negotiations are ongoing at our site in central Manchester. Access to capital and bank facilities has improved in the last year for real estate businesses, including self storage, however this is mainly for larger well-capitalised groups, rather than necessarily the smaller, independent operators. Growth in new openings over the last four years has averaged 1% of total capacity per annum, down significantly from the previous decade. Additionally, in our core markets in London and the South East, very high land values will render the opportunity for creating new self storage centres difficult. We believe that we are in a relatively strong position given the strength of our balance sheet and our proven property development expertise together with our ability to access funding to exploit the right opportunity. Operations The Big Yellow store model is well established. The “typical” store has 60,000 sq ft of net lettable storage area and takes some three to five years to achieve 80% plus occupancy. Some stores have taken longer than this given they opened just before or during the downturn. The average room size occupied in the portfolio is currently 67 sq ft, compared to 68 sq ft last year. The store is open seven days a week and is initially run by three staff, with a part time member of staff added once the store occupancy justifies the need for the extra administrative and sales workload. The drive to improve store operating standards and consistency across the portfolio remains a key focus for the Group. Excellent customer service is at the heart of our business objectives, as a satisfied customer is our best marketing tool. We measure customer service standards through a programme of mystery shoppers and online customer reviews, which give an average customer service score of 4.8 out of 5. At the start of the prior year we launched a new customer-experience programme which combines the feedback from mystery shopping and customer reviews into the reinforcement of customer focus in our store operations. Our net promoter scores from this programme have increased over the year with part of the store teams’ bonus linked to the scores they achieve. We have a team of eight Area Managers in place who have on average worked for Big Yellow for eleven years. They develop and support the stores to drive the growth of the business. The store bonus structure rewards occupancy growth, sales growth and cost control through quarterly targets based on occupancy and store profitability, including the contribution from ancillary sales of insurance and packing materials. Information on bonus build up is circulated monthly and stores are consulted in preparing their own targets and budgets each quarter, leading to improved visibility, a better understanding of sales lines and control of operating costs. We believe that as a consumer-facing branded business it is paramount to maintain the quality of our estate and customer offering. We therefore continue to invest in preventative maintenance, store cleaning and the repair and replacement of essential equipment, such as lifts and gates. The ongoing annual expenditure is approximately £30,000 per store, which is included within cost of sales. This excludes our rolling programme of store makeovers, which typically take place every five years, at a cost of approximately £20,000 per store. Demand Of the customers moving into our stores in the last year, surveys undertaken indicate approximately 45% are linked to the housing market, either customers renting storage space whilst moving within the rental sector or the owner occupied sector. During the year 12% of our customers who moved in took storage space as a spare room for decluttering and approximately 33% of our customers used the product because some event has occurred in their lives generating the need for storage; they may be moving abroad for a job, have inherited possessions, are getting married or divorced, are students who need storage during the holidays, or homeowners developing into their lofts or basements. The balance of 10% of our customer demand during the year came from businesses. Our business customers range across a number of industry types, such as retailers, e-tailers, professional service companies, hospitality companies and importers/exporters. These businesses store stock, documents, equipment, or promotional materials all requiring a convenient flexible solution to their storage, either to get started or to free up more expensive space. 8 Big Yellow Group PLC Operational and Marketing Review We have a dedicated national accounts team for business customers who wish to occupy space in multiple stores. These accounts are billed and managed centrally. We have four full time members of staff working on growing and managing our national account customers. The national accounts team can arrange storage at short notice at any location for our customers. In smaller towns where we do not have representation, we have negotiated sub-contract arrangements with other operators who meet certain operating standards. Revenue from our national accounts increased by 48% compared to the prior year. Business customers typically stay longer than domestic customers, and also on average occupy larger rooms. Whilst only representing 10% of new customers during the year, businesses represent 18% of our overall customer numbers, occupying 34% of the space in our stores. The average room size occupied by business customers is 125 sq ft, against 54 sq ft for domestic customers. This compares with the SSA Survey result for the industry as a whole which had 59% of space occupied by domestic customers and 41% of space by businesses. We would expect to have a higher proportion of domestic customers given our focus on London and other large metropolitan cities. We have seen solid demand from business customers, as they seek a cost effective, flexible solution to their storage requirements, preferring self storage to the commitment of a long lease. We believe there is an opportunity to grow business occupancy and national accounts in the coming year. We have improved our business offer further, we have increased the resource of our national accounts team, and we are increasing our marketing to drive business prospects. Marketing and eCommerce Our marketing strategy continues to focus on driving customer satisfaction and response through our multiple digital platforms. For the last nine years, we have commissioned a YouGov survey to help us monitor our brand awareness. In our most recent survey, conducted in May 2015, we used a statistically robust sample size of 1,035 respondents in London and 2,040 for the rest of the UK. The survey has shown our prompted awareness to be at 75% in London, two and a half times our nearest competitor and 44% for the rest of the UK, over three times higher than our nearest competitor. For unprompted brand awareness, our recall in London is 52% and for the rest of the UK it is 22%, both more than seven times higher than our nearest competitor. These surveys continue to prove we are the UK’s brand leader in self storage (source: YouGov, May 2015). Online The Big Yellow website, whether accessed by desktop, tablet or smartphone, receives the largest share of prospects, accounting for 86% of all sales leads across the year ended 31 March 2015. Telephone is the first point of contact for 9% of prospects and walk-in enquiries, where we have had no previous contact with a prospect, represent 5%. We have the largest online market share of web visits to self storage company websites in the UK. Across the year ended 31 March 2015, our online market share of web visits ranged from 33% to 39%. Our nearest competitor ranged from 14% to 19% online market share for the same period (source: Experian Hitwise 44 largest UK operators). We continually monitor and improve the website user journey to make the experience as informative, customer focussed and intuitive as possible. Our mobile strategy is central to this. By the end of March 2015, smartphones and tablets accounted for 48% of all web visits. Specifically, smartphones alone accounted for 32% of web visits in March 2015, up from 27% in March 2014. Whether it is through desktop, tablet or mobile, our customers enjoy a seamless experience whichever digital route they choose. We are continually developing helpful and time saving online tools such as check-in online, online FAQs, video store tours and online chat. These all help the customer to make an informed choice about their self storage requirements. Online customer reviews Consistent with our strategy of putting the customer at the heart of our business, our online customer reviews generate real-time feedback from customers as well as providing positive word of mouth referral to our web visitors. Through our ‘Big Impressions’ customer feedback programme, we ask our new customers to rate our product and service and with the users permission, we then publish these independent reviews on the website. There are currently over 11,500 reviews published. 9 Big Yellow Group PLC Operational and Marketing Review The Big Impressions programme also generates customer feedback on their experience when they move out of a Big Yellow store and also from those prospects who decided not to store with us. In addition, this programme reinforces best practice of customer service at our stores where customer reviews and mystery shop results are transparently accessible at all levels. In addition, we also gain real-time insight from customers who submit reviews to a third party customer review site. These reviews are currently averaging 9.5 out of 10. We also regularly monitor Google reviews and mentions of Big Yellow within the social mediums of Twitter, online forums and blogs. We use this insight to continually improve our service offering. Driving online traffic Search engines are the most important acquisition tool for us, accounting for the majority of all traffic to the website. We continue to invest in search engine optimisation (“SEO”) techniques both on and off the site. This helps us to maintain our high positions for the most popular and most searched for terms such as “storage” and “self storage” in the organic listings on Google. The sponsored search listings remain the largest source of paid for traffic and we ensure our prominence in these listings is balanced with effective landing pages to maximise site conversion. This year, we have also continued with online display advertising on websites which are targeted to our core audience groups. This activity performs both a direct response and branding role. Efficiencies in online spend are continuing into the year ending 31 March 2016, ensuring the return on investment is maximised from all of our different online traffic sources. Online marketing budgets will continue to remain fluid and be directed towards the media with the best return on investment. Social media Social media continues to be complementary to our existing marketing channels. Our activity is most focussed on Twitter, not only monitoring and answering queries regarding self storage, but also posting our own creative tweets, tips and advice. The Big Yellow YouTube channel is used to showcase our stores to web prospects through a video store tour. We use both domestic and business versions to help prospects experience the quality of the product without the need for them to visit the store in person. Our recently revamped online blog is updated regularly with tips and advice for homeowners and businesses as well as summaries of our charitable and CSR initiatives. PR We have used PR stories in the year to help raise the awareness of Big Yellow and the benefits of self storage to different audience groups. These have focussed on the flexible benefits of using self storage for when you are looking to sell your home, an intriguing insight into how household clutter can damage relationships, plus research into the growing demographic trend of the Boomerang Generation who are returning home to live back with their parents after having flown the nest. These stories help to promote the wider uses of Big Yellow Self Storage against everyday issues and have generated both national and regional media coverage online and offline. They are also supported by radio interviews which allow us to talk about the benefits of Big Yellow. Budget During the year the Group spent approximately £3.6 million on marketing (4% of total store revenue). We have increased the budget for the year ahead to £4 million with a focus on driving our revenue through delivering more prospects to the website. 10 Big Yellow Group PLC Store Performance PROFORMA PORTFOLIO SUMMARY – BIG YELLOW STORES 2015 Mature(1) Established Developing Number of stores(2) At 31 March Total capacity (sq ft) Occupied space (sq ft) Percentage occupied Net rent per sq ft Total Mature 2014 Established Developing Total 50 14 5 69 48 14 4 66 3,121,000 2,350,000 75.3% £25.89 883,000 613,000 69.4% £22.73 340,000 215,000 63.2% £25.05 4,344,000 3,178,000 73.2% £25.23 3,017,000 2,146,000 71.1% £25.62 883,000 536,000 60.7% £22.09 270,000 150,000 55.6% £23.83 4,170,000 2,832,000 67.9% £24.85 £22.49 74.7% £25.73 £18.04 67.7% £22.33 £16.40 58.1% £23.80 £21.09 71.9% £24.95 £21.03 70.6% £25.05 £15.43 58.7% £21.63 £14.37 51.1% £22.85 £19.41 66.8% £24.32 £000 58,695 £000 13,355 £000 4,701 £000 76,751 £000 53,367 £000 11,211 £000 3,153 £000 67,731 9,871 2,519 790 13,180 9,272 2,329 632 12,233 136 68,702 54 15,928 86 5,577 276 90,207 91 62,730 85 13,625 95 3,880 271 80,235 (20,596) (5,573) (2,187) (28,356) (19,973) (5,373) (1,732) (27,078) (1,941) 46,165 10,355 3,390 (1,941) 59,910 (2,005) 40,752 8,252 2,148 (2,005) 51,152 67.2% 65.0% 60.8% 66.4% 65.0% 60.6% 55.4% 63.8% £m 311.0 311.0 £m 145.4 1.7 147.1 £m 74.0 0.2 74.2 £m 530.4 1.9 532.3 For the year REVPAF(3) Average occupancy Average annual rent psf Self storage income Other storage related income (4) Ancillary store rental Income Total store revenue Direct store operating costs (excluding depreciation) Short and long leasehold rent(5) Store EBITDA(6) Store EBITDA margin Deemed cost To 31 March 2015 Capex to complete Total (1) The mature stores have been open for more than six years at 1 April 2014. The established stores have been open for between three and six years at 1 April 2014 and the developing stores have been open for fewer three years at 1 April 2014. The Group acquired two stores during the year in Chester and Oxford. These are shown within mature stores in the current year as they have been open for more than six years. (2) The Group acquired the 66.7% of Big Yellow Limited Partnership that it did not previously own on 1 December 2014. The results of the stores in the Partnership have been included in the results above for both years to give a clearer understanding of the underlying performance of all Big Yellow stores. The table below shows the results excluding the period when the stores were not wholly owned. 2015 2014 Partnership Partnership results as an results as an Per above associate Statutory Per above associate Statutory £000 £000 £000 £000 £000 £000 Store revenue 90,207 (7,476) 82,731 (9,529) 70,706 80,235 Store EBITDA 59,910 (4,659) 55,251 (5,480) 45,672 51,152 (3) Total store revenue divided by the average maximum lettable area in the year. (4) Packing materials, insurance and other storage related fees. (5) Rent for six mature short leasehold properties accounted for as investment properties and finance leases under IFRS with total self storage capacity of 398,000 sq ft, and a long leasehold lease-up store with a capacity of 64,000 sq ft. The Group acquired the freehold of its Battersea store in December 2014. (6) Store earnings before interest, tax, depreciation, amortisation, and an allocation of central overhead. 11 Big Yellow Group PLC Store Performance PORTFOLIO SUMMARY – ARMADILLO STORES ARMADILLO 1 (1) March 2015 March 2014 Number of stores 10 10 401,000 253,000 63.1% £14.66 401,000 240,000 59.9% £14.31 £11.20 62.9% £14.53 £10.03 58.9% £13.84 Self storage income Other storage related income Ancillary store rental income £000 3,665 817 10 £000 3,273 738 12 Total store revenue 4,492 4,023 (2,035) (2,016) 2,457 54.7% 2,007 49.9% At 30 September: Total capacity (sq ft) Occupied space (sq ft) Percentage occupied Net rent per sq ft For the 6 month period: REVPAF Average occupancy Average annual rent psf Direct store operating costs (excluding depreciation) Store EBITDA Store EBITDA margin Cumulative capital expenditure To 31 March 2015 To complete £m 19.8 0.2 Total capital expenditure 20.0 (1) The Group acquired an interest in Armadillo 1 on 16 April 2014. The results shown here are to provide readers with a clearer understanding of the performance of the portfolio. Please see note 13d for the Group’s share of Armadillo 1’s results since ownership. (2) The Group acquired an interest in Armadillo 2, a portfolio of four stores in the North West on 3 February 2015. The four stores were 77.8% occupied of their 270,000 sq ft capacity at 31 March 2015. The trading figures for this portfolio will be presented from next year. Please see note 13d for the Group’s share of Armadillo 2’s results since ownership. 12 Big Yellow Group PLC Store Performance We had a very strong quarter to June with good net move-in growth. The second quarter peaked in August and then we saw many of our students and short term house moves starting to vacate in September, leading to a relatively flat quarter. The third quarter saw student and house move vacations leading to a net loss in units occupied and sq ft. In the final quarter we have seen a return to growth in net occupied rooms and increased occupancy in the stores by 82,000 sq ft. The table below illustrates the move-in performance in the year. Store move-ins April to June July to September October to December January to March Total Year ended 31 March 2015 20,196 21,873 16,897 16,131 75,097 Year ended 31 March 2014 18,685 19,946 14,848 15,464 68,943 % 8 10 14 4 9 Net move-ins 31 March 2015 5,613 (704) (1,410) 1,126 4,625 In all Big Yellow stores, the occupancy growth in the current year was 346,000 sq ft, against an increase of 200,000 sq ft in the prior year. This growth includes 24,000 sq ft of occupancy acquired with the acquisition of Fort Box Self Storage in Oxford (“Oxford 2”), and 55,000 sq ft of occupancy acquired with the acquisition of Big Storage Chester. The net occupancy growth in the year was therefore 267,000 sq ft. This growth represents an average of 3,870 sq ft per store (2014: 3,030 sq ft per store). Store occupancy summary 50 mature stores 14 established stores 5 developing stores Total – all 69 stores Occupancy Occupancy 31 March 2015 31 March 2014 000 sq ft 000 sq ft 2,146 2,350 536 613 150 215 2,832 3,178 Growth for Growth for year year to to 31 March 2015 31 March 2014 000 sq ft 000 sq ft 204 109 77 51 65 40 346 200 The 50 mature stores are 75.3% occupied compared to 71.1% at the same time last year. The 14 established stores have grown in occupancy from 60.7% to 69.4%. The five developing stores added 65,000 sq ft of occupancy in the year to reach closing occupancy of 63.2%. Overall store occupancy has increased in the year from 67.9% to 73.2%. All 69 stores open at the year end are trading profitably at the EBITDA level. Pricing and rental yield We have continued our sales promotion offer throughout the year of “50% off for up to your first 8 weeks storage”. Our Price Promise is also used to match competitors’ prices, if the product is comparable. Pricing is dynamically generated and takes into account customer demand and local competition. In the year ended 31 March 2015, net rent in the like for like stores grew by 2.4%. This has been a combination of reducing discounts to new customers and retaining price increases from existing customers. As the stores lease-up, our pricing model reduces the level of promotional discounts offered in individual stores. This squeezing out of promotions leads to an increase in net achieved rents. The table below illustrates this, showing the growth in net rent per sq ft for the portfolio over the year. Average occupancy in the year 0 to 60% 60 to 70% 70 to 80% Above 80% Net rent per sq ft growth over the year 1.1% 1.4% 2.0% 5.9% 13 Big Yellow Group PLC Store Performance The table below shows the average key metrics across the store portfolio for the year ended 31 March 2015: Store capacity Sq ft occupied per store at 31 March 2015 % occupancy Revenue per store EBITDA per store EBITDA margin Mature stores 62,420 47,000 75.3% £1,374,000 £923,000 67.2% Established stores 63,071 43,786 69.4% £1,138,000 £740,000 65.0% Developing stores 68,000 43,000 63.2% £1,115,000 £678,000 60.8% Armadillo Self Storage In April 2014 we acquired the Armadillo portfolio of 10 stores, which we have been managing since 2009, with an Australian consortium. The Armadillo platform was added to in February 2015 with the acquisition of a further four stores following the purchase of Big Storage by the Group and its subsequent disposal to a company in which the Group has a 20% interest, with the balance held by an Australian consortium. The Armadillo stores are lower-frills, but good quality, largely freehold assets in towns where we would not typically locate a Big Yellow store. Armadillo provides a number of operational advantages to the Group, such as a wider platform to sell to national accounts, more promotional opportunities for staff, more efficient use of the Company’s overhead and benefits online. The Group will consider other opportunities to add to the Armadillo platform if the right stores or portfolio become available. Development pipeline There are two freehold sites with planning for Big Yellow stores to be developed. We also own a 4.5 acre development site in central Manchester where we are in planning discussions for a mixed use scheme incorporating a new Big Yellow store. We have acquired the freehold interest of our existing 34,000 sq ft store in Battersea, which had 12 years remaining on the occupational lease together with a 14,100 sq ft retail unit let to Halfords on an annual rent of £458,000 with 7 years unexpired, part of which is sublet to Pets at Home. The next rent review date is January 2017. The total consideration paid was £23 million. This increases the freehold ownership of our portfolio and protects our position in this important central London location. In the medium term, we will redevelop the 1.5 acre site to include a larger Big Yellow store together with other uses. The Group also owns an office building adjacent to our Wandsworth store which we are seeking planning permission to convert to self storage, adding approximately 30,000 sq ft of net storage space to the store. The status of the development pipeline is summarised in the table below: City Location Status Battersea Potential redevelopment of Big Yellow store and adjoining retail in a mixed use residential scheme to increase our self storage capacity Adjacent to the Cambridge Retail Park, Newmarket Road Prime location in centre of Guildford on Woodbridge Meadows Prime location on Water Street in central Manchester Possible extension of 30,000 sq ft to existing 47,000 store Early design discussions with the Borough Council Cambridge Guildford Manchester Wandsworth Anticipated capacity Up to an additional 60,000 sq ft Existing B8 consent, detailed signage consent required Consent granted 55,000 sq ft Planning under negotiation 50,000 sq ft to 70,000 sq ft Additional 30,000 sq ft Planning under negotiation 56,000 sq ft The Group manages the construction and fit-out of its stores in-house, as we believe it provides both better control and quality, and we have an excellent record of building stores on time and within budget. 14 Big Yellow Group PLC Financial Review Financial results Placing and acquisition of Big Yellow Limited Partnership In November 2014 the Group issued 14.35 million new ordinary shares at 547.5 pence per share raising £76.4 million (net of expenses). Following the Placing the Group completed the buy-out of its partner Pramerica Real Estate Investors from its existing joint venture, Big Yellow Limited Partnership (accelerated from the option date of 31 March 2015). The purchase price was £39.25 million, close to the book value at 30 September 2014 and was paid in cash. Big Yellow Limited Partnership was created in November 2007 and the portfolio consisted of 12 stores located in Birmingham, Camberley, Edinburgh, High Wycombe, Leeds, Liverpool, Nottingham, Poole, Reading, Sheffield (two stores) and Stockport. At the price paid the portfolio had an implied first year pre-admin net operating income yield of 6.8%, rising to 8.1% if the stores achieve 85% occupancy at today’s rental levels. Revenue Total revenue for the year was £84.3 million, an increase of £12.1 million (17%) from £72.2 million in the prior year. The revenue excluding the Partnership stores consolidated from 1 December was £80.6 million for the year, representing an increase of 12% from last year. The other revenue is fee income earned from Big Yellow Limited Partnership (until 30 November), management fee income from the Armadillo Partnerships, and tenant income on sites where we have not started development. Other sales (included within the above), comprising the selling of packing materials, insurance and storage related charges, represented 16.8% of storage income for the year (2014: 17.5%) and generated revenue of £11.8 million for the year, up 13% from £10.5 million in 2014. The table below reconciles the quarterly store revenue compared to the prior year, showing the impact on revenue of the Partnership stores acquired on 1 December 2014. Quarter Same stores* Same stores BYLP stores 2015 2014 consolidated £m £m % £m April to June 18.6 16.7 11% July to September 20.5 18.4 11% October to December 20.3 17.9 13% 1.0 January to March 19.6 17.7 11% 2.7 Total 79.0 70.7 12% 3.7 * - the same stores are the Big Yellow stores excluding the BYLP stores. 2015 total £m 18.6 20.5 21.3 22.3 82.7 % increase on 2014 11% 11% 19% 26% 17% Operating costs Cost of sales comprises principally of the direct store operating costs, including store staff salaries, utilities, business rates, insurance, a full allocation of the central marketing budget, and repairs and maintenance. Cost of sales in the income statement has increased by £2.4 million (9%) to £27.4 million (2014: £25.0 million). Of this increase £1.4 million relates to the operating costs of the Partnership stores from 1 December 2014. The operating costs of the new stores at Gypsy Corner, Oxford 2 and Chester account for £0.7 million of the increase, with the remaining increase of £0.3 million due to general inflationary pressures in part offset by rates rebates received at a couple of stores. Administrative expenses in the income statement have increased by £0.9 million compared to the prior year, largely due to an increase of £0.6 million in the share based payment charge and associated national insurance on the vesting of share incentives. £2.1 million of the £8.5 million administrative expense is non-cash IFRS 2 sharebased payment charges. 15 Big Yellow Group PLC Financial Review Store EBITDA Store EBITDA for the year was £55.3 million, an increase of £9.6 million (21%) from £45.7 million for the year ended 31 March 2014. Of this increase £2.3 million relates to the Partnership stores from 1 December 2014. The EBITDA after adjusting for this is £53.0 million, an increase of 16% from the prior year. The overall EBITDA margin for all Big Yellow stores during the year was 66.4%, compared to 63.8% last year. Interest expense on bank borrowings The gross bank interest expense for the year was £10.1 million, a decrease of £0.7 million from the prior year. This reflects the reduction in debt costs after the refinancing during the year, partly offset by the increase in debt in December 2014 following the acquisition of Big Yellow Limited Partnership and the acquisition of the freehold of our Battersea store. The average cost of borrowing during the year was 3.9%, compared to 4.5% in the prior year. Total interest payable has decreased in the statement of comprehensive income from £11.3 million to £10.7 million principally due to the decrease in the gross bank interest expense. Capitalised interest decreased by £0.1 million from the prior year, with the Group constructing its store at Enfield in the current year, compared with constructing Gypsy Corner during the prior year. Profit before tax The Group made a profit before tax in the year of £105.2 million, compared to a profit of £59.8 million in the prior year. After adjusting for the gain on the revaluation of investment properties and other matters shown in the table below, the Group made an adjusted profit before tax in the year of £39.4 million, up 35% from £29.2 million in 2014. Profit before tax analysis Profit before tax Gain on revaluation of investment properties Movement in fair value on interest rate derivatives Gains on surplus land Share of non-recurring (gains)/losses in associates Adjusted profit before tax 2015 £m 105.2 (64.5) 2.3 (1.3) (2.3) 39.4 2014 £m 59.8 (28.3) (2.7) 0.4 29.2 The movement in the adjusted profit before tax from the prior year is illustrated in the table below: Adjusted profit before tax – year ended 31 March 2014 Increase in gross profit Reduction in net interest payable Increase in administrative expenses Increase in share of recurring profit of associates Decrease in capitalised interest Adjusted profit before tax – year ended 31 March 2015 £m 29.2 9.8 0.8 (0.9) 0.6 (0.1) 39.4 Diluted EPRA earnings per share based on adjusted profit after tax was up 32% to 27.1p (2014: 20.5p) (see note 12). Basic earnings per share for the year was 72.5p (2014: 42.5p) and fully diluted earnings per share was 71.9p (2014: 42.2p). REIT status The Group converted to a Real Estate Investment Trust (“REIT”) in January 2007. Since then the Group has benefited from a zero tax rate on the Group’s qualifying self storage earnings. The Group only pays tax on the 16 Big Yellow Group PLC Financial Review profits attributable to our residual business, comprising primarily of the sale of packing materials and insurance, and fees earned from Big Yellow Limited Partnership and from the management of the Armadillo portfolio. REIT status gives the Group exemption from UK corporation tax on profits and gains from its qualifying portfolio of UK stores. Future revaluation gains on developments and our existing open stores will be exempt from corporation tax on capital gains, provided certain criteria are met. The Group has a rigorous internal system in place for monitoring compliance with criteria set out in the REIT regulations. On a monthly basis, a report to the Executive on compliance with these criteria is carried out. To date, the Group has complied with all REIT regulations, including forward looking tests. Taxation There is a tax credit in the current year of £0.4 million. This compares to a tax charge in the prior year of £0.3 million. We received a refund of £0.2 million in the year in respect of the conversion charge paid when the Group converted to a REIT in January 2007. This was in respect of two properties which did not provide REITable supplies prior to their disposal. The balance of the credit relates to a release of part of the prior year tax charge offset by the current year tax provision. Dividends REIT regulatory requirements determine the level of Property Income Dividend (“PID”) payable by the Group. On the basis of the full year distributable reserves for PID purposes, a PID of 16.1 pence per share is payable (31 March 2014: 13 pence per share PID). The Board is recommending the payment of a final dividend of 11.3 pence per share. The table below summarises the declared dividend for the year: Dividend (pence per share) Interim dividend – PID – discretionary – total 31 March 2015 10.4p nil p 10.4p 31 March 2014 8.0p nil p 8.0p Final dividend – PID – discretionary – total 5.7p 5.6p 11.3p 5.0p 3.4p 8.4p Total dividend – PID – discretionary – total 16.1p 5.6p 21.7p 13.0p 3.4p 16.4p Subject to approval by shareholders at the Annual General Meeting to be held on 21 July 2015, the final dividend will be paid on 23 July 2015. The ex-div date is 11 June 2015 and the record date is 12 June 2015. Cash flow growth The Group is strongly cash generative and draws down from its longer term committed facilities as required to meet obligations. 17 Big Yellow Group PLC Financial Review A summary of the cash flow for the year is set out in the table below: Cash generated from operations Net finance costs (including tax) Free cash flow Capital expenditure (including finance lease payments) Acquisition of Big Yellow Limited Partnership Acquisition of Big Storage Limited Asset sales (including Big Storage Limited) Receipt from Capital Goods Scheme Investment in associates (net of dividends received) Cash flow after investing activities Ordinary dividends Issue of share capital Non-recurring finance costs Net movement on Big Storage loans Repayment of Partnership loan Increase/(decrease) in borrowings Net cash inflow/(outflow) Opening cash and cash equivalents Closing cash and cash equivalents Debt Net debt Year ended 31 March 2015 £000 Year ended 31 March 2014 £000 51,875 (9,478) 42,397 (43,704) (37,406) (15,114) 10,429 3,557 (3,620) (43,461) (27,890) 77,094 (4,057) 4,241 (57,000) 55,966 4,893 3,301 8,194 (285,334) (277,140) 43,290 (10,538) 32,752 (9,570) 756 23,938 (19,591) 42 (8,938) (4,549) 7,850 3,301 (229,368) (226,067) Free cash flow pre-capital expenditure increased by 29% to £42.4 million for the year (2014: £32.8 million). In the year capital expenditure outflows were £43.7 million, up from £9.6 million in the prior year. During the year we acquired an existing store in Oxford, the freehold of Chester, the freehold of our store in Battersea and paid the deposit on acquiring a site in Cambridge. We also constructed our Enfield store and invested in Phase 2 fit outs. Additionally, as discussed elsewhere in this report, we acquired the two thirds share of Big Yellow Limited Partnership and acquired, and subsequently disposed of the share capital of Big Storage Limited with four stores excluding the leasehold interest in Chester. The cash flow after investing activities was a net outflow of £43.5 million in the year, compared to an inflow of £23.9 million in 2014; the reduction being due to the increase in capital expenditure in the year. The nonrecurring finance costs in the year relate to £1.4 million of payments made to cancel interest rate derivatives and £2.6 million relating to arrangement fees paid for the M&G and senior debt loans. 18 Big Yellow Group PLC Financial Review Balance sheet Property The Group’s 69 stores and four stores under development at 31 March 2015, which are classified as investment properties, have been valued by Cushman & Wakefield (“C&W”) and this has resulted in an investment property asset value of £1,022.8 million, comprising £965.5 million (94.4%) for the 63 freehold (including two long leaseholds) open stores, £41.6 million (4.1%) for the six short leasehold open stores and £15.7 million (1.5%) for the four investment properties under construction. Value at 31 March 2015 £m 1,007.1 15.7 1,022.8 Analysis of property portfolio Investment property Investment property under construction Total Revaluation movement in year £m 63.6 0.9 64.5 Investment property Each Big Yellow store is reviewed and valued individually by Cushman & Wakefield LLP (“C&W”). The Armadillo stores have been valued by Jones Lang LaSalle. The valuations in the current year have grown from the prior year, with a revaluation surplus of £63.6 million on the open Big Yellow stores. Of this increase 75% is due to an improvement in the cap rate used in the valuations, reflecting transactional evidence and a wider shift in the UK real estate market in the last six months. The balance of the increase (25%) is due to the growth in cash flow from the assets. The valuation is based on an average occupancy over the 10 year cash flow period of 79.9% across the whole portfolio. Number of stores MLA capacity (sq ft) Valuation at 31 March 2015 (£m) Value per sq ft (£) Occupancy at 31 March 2015 Stabilised occupancy assumed Net initial yield pre-admin expenses Stabilised yield assuming no rental growth Mature Leasehold Freehold 6 44 398,000 2,723,000 41.6 689.6 105 253 78.1% 74.9% 81.2% 80.2% 11.2% 6.4% 12.0% 7.0% Established Freehold 14 883,000 183.9 208 69.4% 82.3% 6.1% 7.6% Developing Freehold 5 340,000 92.0 271 63.2% 84.8% 4.7% 7.7% Total 69 4,344,000 1,007.1 232 73.2% 81.1% 6.4% 7.4% The initial yield pre-administration expenses assuming no rental growth is 6.4% (2014: 6.3%) rising to a stabilised yield of 7.4% (2014: 7.8%). The stores are assumed to grow to stabilised occupancy in 26 months on average. Note 14 contains more detail on the assumptions underpinning the valuations. There is very little transaction activity in the prime self storage market, although there has been some activity for secondary assets. As referenced in note 14, C&W’s valuation report further confirms that the properties have been valued individually but that if the portfolio was to be sold as a single lot or in selected groups of properties, the total value could differ significantly. C&W state that in current market conditions they are of the view that there could be a material portfolio premium. Investment property under construction The three wholly owned development sites (excluding Gypsy Corner which was transferred to investment property in the year) have increased in value by £6.0 million, £5.1 million relating to capital expenditure incurred, with the balance of £0.9 million a revaluation surplus. Purchaser’s cost adjustment 19 Big Yellow Group PLC Financial Review As in prior years, we have instructed an alternative valuation on our assets using a purchaser’s cost assumption of 2.75% (see note 14 for further details) to be used in the calculation of our adjusted diluted net asset value. This Red Book valuation on the basis of 2.75% purchaser’s costs, results in a higher property valuation at 31 March 2015 of £1,068.4 million (£45.6 million higher than the value recorded in the financial statements). With the share of uplift on the revaluation of the Armadillo stores, this translates to 29.3 pence per share. The revised valuation translates into an adjusted net asset value per share of 510.4 pence (2014: 446.5 pence) after the dilutive effect of outstanding share options. Surplus land At 31 March 2015 the Group owned £3.3 million of land surplus to our requirements at one site. We aim to sell this surplus land once we have maximised its realisable value through planning improvements. The site is held at the lower of cost and net realisable value and has not been externally valued. In September, the Group sold its surplus site at Guildford Central for £2.8 million, representing a profit over book value of £1.3 million. Receivables At 31 March 2015 we have a receivable of £9.2 million in respect of payments due back to the Group under the Capital Goods Scheme as a consequence of the introduction of VAT on self storage from 1 October 2012. On acquisition of the remaining 66.7% of Big Yellow Limited Partnership, the Group’s receivable under the Capital Goods Scheme increased by £3.4 million. The debtor has been discounted in accordance with International Accounting Standards to the net present value using the Group’s average cost of debt, with £0.5 million of the discount being unwound through interest receivable in the period. The gross value of the debtor before discounting is £10.3 million. The Group received £3.6 million under the Capital Goods Scheme during the year, with the October 2015 receipt accelerated to January 2015 following the merger of the Group’s two VAT groups. Movement in adjusted NAV The year on year movement in adjusted net asset value (see note 12) is illustrated in the table below: Movement in adjusted net asset value 1 April 2014 Share placing 1 April 2014 (restated) Adjusted profit Equity dividends paid Revaluation movements (including share of associate) Movement in purchaser’s cost adjustment Other movements (eg share schemes) 31 March 2015 Equity shareholders’ funds £m 634.4 76.4 710.8 39.4 (27.9) 67.6 8.9 2.6 801.4 EPRA adjusted NAV per share (pence) 446.5 7.9 454.4 25.1 (17.8) 43.2 5.7 (0.2) 510.4 20 Big Yellow Group PLC Financial Review Borrowings We focus on improving our cash flows and for the year we had healthy Group interest cover of 5.4 times (2014: 4.1 times) based on cash generated from operations against interest paid, allied to a relatively conservative debt structure secured principally against the freehold estate. During the year we completed the refinancing of our £145 million bank facility with Lloyds and HSBC, extending the maturity to August 2019. 50% of the bank facility is term and 50% is revolving. The term loan attracts a margin of 175 bps and the revolving loan a margin of 150 bps, reflecting a reduction of 75bps for both tranches from the previous facility. This facility was increased to £170 million in December 2014. The Group bank facility contains a covenant requiring us to have 50% of all borrowings fixed. In addition, the Group has further diversified its pool of lenders by signing a new £70 million facility with M&G Investments Limited, the term of which will be seven years from the date of drawdown which can occur at any time in the period up to 29 June 2015. The loan will be secured over a portfolio of 15 freehold self storage centres. 50% of the seven year loan is fixed by way of a forward start interest rate derivative, the balance of the loan is variable based on three month LIBOR plus margin. The average cost of the M&G loan at the current rate of LIBOR will be 3.75%. The Group agreed a short term bridging facility of £70 million with Lloyds Bank plc, which is repayable immediately on the drawdown of the M&G loan. The Group has a £100 million 15 year loan with Aviva Commercial Finance Limited. The loan has a fixed interest rate of 4.9% and amortises to £60 million over the course of the 15 years. The loan outstanding at 31 March 2015 was £94.3 million. During the year the Group cancelled £40 million of its existing interest rate derivatives at a cash cost of £1.4 million, leaving £30 million fixed at 2.8% plus applicable margin. As a result of this refinancing, and prior to the drawing of the M&G facility, our average cost of debt has decreased from 4.6% to 3.3% at the end of the financial year. Following the M&G facility being drawn and the Lloyds bridging loan being repaid we would expect the average cost to be approximately 3.8% based on the current levels of LIBOR and current levels of drawn debt. The Group was in compliance with its banking covenants at 31 March 2015. The Group currently has a net debt to gross property assets ratio of 27%, and a net debt to adjusted net assets ratio of 35%. At 31 March 2015, the fair value on the Group’s interest rate derivatives was a liability of £3.7 million. The Group does not hedge account its interest rate derivatives. As recommended by EPRA (European Public Real Estate Association), the fair value movements are eliminated from adjusted profit before tax, diluted EPRA earnings per share, and adjusted net assets per share. Treasury continues to be closely monitored and its policy approved by the Board. We maintain a keen watch on medium and long-term rates and the Group’s policy in respect of interest rates is to maintain a balance between flexibility and hedging of interest rate risk. Cash deposits are only placed with approved financial institutions in accordance with the Group’s Treasury policy. 21 Big Yellow Group PLC Financial Review Share capital The share capital of the Company totalled £15.8 million at 31 March 2015 (2014: £14.3 million), consisting of 158,055,735 ordinary shares of 10p each (2014: 143,061,147 shares). The Group placed 14.35 million shares in the year at 547.5 pence per share. Shares issued for the exercise of options during the year amounted to 0.6 million at an average exercise price of 540p (2014: 421,500 shares at an average price of 450p). The Group holds 1.4 million shares in treasury and 1.5 million shares within an Employee Benefit Trust (“EBT”). These shares are shown as a debit in reserves and are not included in calculating net asset value per share. Opening shares Shares issued for the placing Shares issued for the exercise of options Closing shares in issue Shares held in EBT Shares held in treasury Closing shares for NAV purposes 2015 No. 2014 No. 143,061,147 14,352,711 641,877 158,055,735 (1,500,000) (1,418,750) 155,136,985 142,639,647 421,500 143,061,147 (1,500,000) (1,418,750) 140,142,397 73,136,757 shares were traded in the market during the year ended 31 March 2015 (2014: 54,249,527). The average mid-market price of shares traded during the year was 553.4p with a high of 667.0p and a low of 460.6p. Big Yellow Limited Partnership The Group acquired the remaining two thirds of Big Yellow Limited Partnership that it did not previously own on 1 December. In the consolidated accounts of Big Yellow Group PLC, up to the date of acquisition the Partnership is treated as an associate. We have provided in note 13d the balance sheet and income statement of the Partnership up to the date of acquisition, along with the Group’s share of the income statement captions. The Group earned certain construction and operational fees from the Partnership. For the year to 31 March 2015, these fees amounted to £0.5 million (2014: £0.6 million). The Partnership bank facility was repaid immediately following completion of the acquisition by the Group. Armadillo Self Storage In April 2014 we acquired the Armadillo portfolio with an Australian consortium for a total property value of £19.75 million. The Group initially invested £3.6 million representing a stake of 38% in the business (“Armadillo 1”). Our partners had a right to increase their share from 62% to 80% at par, which they exercised in July 2014, reducing the Group’s investment to £1.9 million (20% of the business). In the consolidated accounts of Big Yellow Group PLC, our investment in the vehicle is treated as an associate using the equity accounting method. Armadillo 1 has an £11 million loan from Lloyds Bank which expires in April 2019. The occupancy of the stores is 253,000 sq ft, against a total capacity of 401,000 sq ft, with growth of 13,000 sq ft over the year. The stores’ occupancy at 31 March 2015 was 63.1% (31 March 2014: 59.9%). The net rent achieved at 31 March 2015 by the Armadillo 1 stores is £14.66 per sq ft, an increase of 2.4% from the same time last year. The revenue of the portfolio increased by 12% to £4.5 million for the year to 31 March 2015 compared to £4.0 million last year. Armadillo 1 made an operating profit of £2.0 million in the period from acquisition, of which Big Yellow’s share is £0.5 million (representing 38% until July and 20% thereafter). After net interest costs, the revaluation of investment properties, deferred tax on the revaluation surplus and interest rate derivatives, the profit for the period from acquisition for Armadillo 1 was £9.0 million, of which the Group’s share was £1.8 million. There has been a significant increase in the valuation of the portfolio due to the growth in cash flow and additionally cap rate compression in the valuation of secondary assets following transactional evidence in the year. 22 Big Yellow Group PLC Financial Review Big Yellow has a five year management contract in place. For the period from acquisition to 31 March 2015 fees amounted to £0.6 million (including fees in relation to due diligence carried out on acquisition). The Group’s share of the dividend declared for the year is £178,000, representing a 9.3% yield on our investment, which together, with our ongoing management fees of £400,000 per annum, gives a first year cash return of approximately 30% on the investment. Big Storage In January 2015 the Group acquired the entire share capital of Big Storage Limited for a property value of £24.9 million. The net consideration was £15.1 million, taking into account the existing bank debt in the company and adjusted for working capital. The Group repaid the bank debt through a £13.9 million loan from Lloyds Bank, which expires in January 2020. The company owned five self storage centres in North West England. The Group transferred the store at Chester to another subsidiary company of the Group, and the store will be rebranded as a Big Yellow. The Group has subsequently acquired the freehold of the store in Chester. In February 2015, the Group subsequently sold the share capital of Big Storage Limited to a company (“Armadillo 2”) in which it has a 20% interest, with the balance of the equity owned by an Australian consortium, for a net consideration of £7.6 million. This represents a property value of £19.3 million less the £13.9 million Lloyds loan and adjusted for working capital. In the consolidated accounts of Big Yellow Group PLC, our investment in Armadillo 2 is treated as an associate using the equity accounting method. The four stores will be rebranded as Armadillo stores. The occupancy of the stores is 210,000 sq ft, against a total capacity of 270,000 sq ft, with growth of 13,000 sq ft over the year. The stores’ occupancy at 31 March 2015 was 77.8% and the net rent achieved at 31 March 2015 is £15.90 per sq ft. Armadillo 2 made an operating profit of £0.2 million in the period, of which Big Yellow’s share is £0.04 million. After net interest costs, the revaluation of investment properties, deferred tax on the revaluation surplus and interest rate derivatives, the profit for the period from acquisition for Armadillo 2 was £0.7 million, of which the Group’s share was £0.1 million. Big Yellow has a five year management contract in place. For the period from acquisition to 31 March 2015 fees amounted to £0.2 million (including fees in relation to due diligence carried out on acquisition). GOING CONCERN A review of the Group’s business activities, together with the factors likely to affect its future development, performance and position are set out in the Strategic Report. The financial position of the Group, its cash flows, liquidity position and borrowing facilities are shown in the balance sheet, cash flow statement and accompanying notes in the financial statements. Further information concerning the Group’s objectives, policies and processes for managing its capital; its financial risk management objectives; details of its financial instruments and hedging activities; and its exposures to credit risk and liquidity risk can be found in this Report and in the notes to the financial statements. After reviewing Group and Company cash balances, borrowing facilities, forecast valuation movements and projected cash flows, the Directors believe that the Group and Company have adequate resources to continue operations for the foreseeable future. In reaching this conclusion the Directors have had regard to the Group’s operating plan and budget for the year ending 31 March 2016 and projections contained in the longer-term business plan which covers the period to March 2022. The Directors have considered carefully the Group’s trading performance and cash flows as a result of the uncertain global economic environment and the other principal risks to the Group’s performance and are satisfied with the Group’s positioning. For this reason, they continue to adopt the going concern basis in preparing the financial statements. 23 Big Yellow Group PLC Consolidated Statement of Comprehensive Income Year ended 31 March 2015 2015 £000 Note 84,276 (27,351) 72,196 (25,040) Gross profit 56,925 47,156 Administrative expenses (8,505) (7,619) 48,420 64,465 1,318 39,537 28,350 - 114,203 3,516 495 (10,704) (2,274) 67,887 180 415 2,681 (11,315) - Revenue Cost of sales Operating profit before gains and losses on property assets Gain on the revaluation of investment properties Profit on disposal of surplus land Operating profit Share of profit of associates Investment income – interest receivable – fair value movement of derivatives Finance costs – interest payable – fair value movement of derivatives 3 2014 £000 13a,14 15 13d 7 7 8 8, 18 Profit before taxation Taxation 9 105,236 351 59,848 (300) Profit for the year (attributable to equity shareholders) 5 105,587 59,548 105,587 59,548 Total comprehensive income for the year (attributable to equity shareholders) Basic earnings per share 12 72.5p 42.5p Diluted earnings per share 12 71.9p 42.2p EPRA earnings per share are shown in Note 12. All items in the consolidated statement of comprehensive income relate to continuing operations. 24 Big Yellow Group PLC Consolidated Balance Sheet 31 March 2015 Non-current assets Investment property Investment property under construction Interests in leasehold property Plant, equipment and owner-occupied property Goodwill Investment in associates Capital Goods Scheme receivable Note 2015 £000 2014 £000 13a 13a 13a 13b 13c 13d 16 1,007,110 15,681 20,829 3,050 1,433 5,572 9,039 776,390 22,303 23,814 2,985 1,433 17,861 7,620 1,062,714 852,406 3,315 304 16,379 8,194 6,059 290 13,531 3,301 28,192 23,181 1,090,906 875,587 Current assets Surplus land Inventories Trade and other receivables Cash and cash equivalents 15 16 Total assets Current liabilities Trade and other payables Borrowings Obligations under finance leases Non-current liabilities Derivative financial instruments Borrowings Obligations under finance leases 17 19 21 18c 19 21 Total liabilities Net assets Equity Called up share capital Share premium account Reserves 22 Equity shareholders’ funds (32,612) (72,136) (1,705) (26,818) (2,034) (1,615) (106,453) (30,467) (3,679) (210,736) (19,124) (2,813) (226,044) (22,199) (233,539) (251,056) (339,992) (281,523) 750,914 594,064 15,806 44,922 690,186 14,306 44,278 535,480 750,914 594,064 The financial statements were approved by the Board of Directors and authorised for issue on 18 May 2015. They were signed on its behalf by: James Gibson, Director John Trotman, Director Company Registration No. 03625199 25 Big Yellow Group PLC Consolidated Statement of Changes in Equity Year ended 31 March 2015 Share capital £000 Share Other nonpremium distributable account reserve £000 £000 Capital redemption reserve £000 Retained earnings £000 Own shares £000 Total £000 At 1 April 2014 Total comprehensive gain for the year Issue of share capital Dividend Credit to equity for equity-settled share based payments 14,306 44,278 - 1,653 539,450 (5,623) 594,064 1,500 - 644 - 74,950 - - 105,587 (27,890) - 105,587 77,094 (27,890) - - - - 2,059 - 2,059 At 31 March 2015 15,806 44,922 74,950 1,653 619,206 (5,623) 750,914 The other non-distributable reserve arose in the year following the placing of 14.35 million ordinary shares. Year ended 31 March 2014 Share capital £000 Share premium account £000 Capital redemption reserve £000 Retained earnings £000 Own shares £000 At 1 April 2013 Total comprehensive gain for the year Issue of share capital Dividend Credit to equity for equity-settled share based payments 14,264 44,278 1,653 498,056 (5,623) 552,628 42 - - - 59,548 (19,591) - 59,548 42 (19,591) - - - 1,437 - 1,437 At 31 March 2014 14,306 44,278 1,653 539,450 (5,623) 594,064 Total £000 26 Big Yellow Group PLC Consolidated Cash Flow Statement Year ended 31 March 2015 2015 £000 114,203 (64,465) (1,318) 566 918 2,059 (14) (1,172) 1,098 2014 £000 67,887 (28,350) 526 974 1,437 10 (1,652) 2,458 Cash generated from operations Interest paid Interest received Tax credit received 51,875 (9,692) 27 187 43,290 (10,558) 20 - Cash flows from operating activities 42,397 32,752 2,815 (42,555) (231) 3,557 (37,406) (15,114) 7,614 (3,709) 89 (8,460) (136) 756 - (84,940) (7,840) 77,094 (918) (27,890) (1,408) (2,649) (57,000) (9,659) 13,900 55,966 42 (974) (19,591) (8,938) 47,436 (29,461) Net increase/(decrease) in cash and cash equivalents 4,893 (4,549) Opening cash and cash equivalents 3,301 7,850 Closing cash and cash equivalents 8,194 3,301 Note Operating profit Gain on the revaluation of investment properties Profit on disposal of surplus land Depreciation Depreciation of finance lease capital obligations Employee share options (Increase)/decrease in inventories Increase in receivables Increase in payables Investing activities Sale of surplus land Purchase of non-current assets Additions to surplus land Receipts from Capital Goods Scheme Acquisition of Big Yellow Limited Partnership (net of cash acquired) Acquisition of Big Storage Limited Disposal of Big Storage Limited Net investment in associates Dividend received from associate 13a, 14 15 13b 13a 6 13d 13a 13a 13d 13d Cash flows from investing activities Financing activities Issue of share capital Payment of finance lease liabilities Equity dividends paid Payments to cancel interest rate derivatives Refinancing fees Repayment of Big Yellow Limited Partnership loan Repayment of Big Storage AIB loan Drawing of Big Storage Lloyds loan Increase/(reduction) in borrowings Cash flows from financing activities 13a 11 27 Big Yellow Group PLC Reconciliation of Net Cash Flow to Movement in Net Debt Year ended 31 March 2015 Note 2015 £000 2014 £000 Net increase/(decrease) in cash and cash equivalents in the year Cash flow from (increase)/decrease in debt financing 4,893 (55,966) (4,549) 8,938 Change in net debt resulting from cash flows (51,073) 4,389 Movement in net debt in the year Net debt at the start of the year Net debt at the end of the year 18 (51,073) (226,067) 4,389 (230,456) (277,140) (226,067) 28 Big Yellow Group PLC Notes to the financial statements Year ended 31 March 2015 1. GENERAL INFORMATION Big Yellow Group PLC is a Company incorporated in the United Kingdom under the Companies Act 2006. The address of the registered office is 2 The Deans, Bridge Road, Bagshot, Surrey, GU19 5AT. The nature of the Group’s operations and its principal activities are set out in note 4 and in the Strategic Report. These financial statements are presented in pounds sterling because that is the currency of the economic environment in which the Group operates. 2. BASIS OF PREPARATION The condensed set of financial statements set out above (which was approved by the Board on 18 May 2015) has been compiled in accordance with IFRS, but does not contain sufficient information to constitute a full set of IFRS financial statements. This financial information does not constitute the Company's statutory accounts for the years ended 31 March 2014 and 31 March 2015, but is derived from those accounts. Those accounts give a true and fair view of the assets, liabilities, financial position and profit and loss of the Company and the undertakings included in the consolidation taken as a whole. The Company's statutory accounts for the year ended 31 March 2014 have been filed with the Registrar of Companies. The Company's statutory accounts for the year ended 31 March 2015 will be filed with the Registrar of Companies following the Annual General Meeting. The auditors' reports on both the 2014 and 2015 accounts were unqualified; did not draw attention to any matters by way of emphasis; and did not contain statements under s498(2) or (3) Companies Act 2006 or preceding legislation. The statutory accounts have been prepared in accordance with International Financial Reporting Standards (IFRS) adopted for use in the European Union and therefore comply with Article 4 of the EU IAS Regulation and with those parts of the Companies Act 2006 that are applicable to companies reporting under IFRS. The Group has applied all accounting standards and interpretations issued by the International Accounting Standards Board and International Financial Reporting Interpretations Committee relevant to its operations and effective for accounting periods beginning on 1 April 2014. The same accounting policies as applied in the Group’s statutory accounts for the year ended 31 March 2014 have been applied in this condensed set of financial statements. Going concern A review of the Group’s business activities, together with the factors likely to affect its future development, performance and position are set out on in the Strategic Report. The financial position of the Group, its cash flows, liquidity position and borrowing facilities are shown in the balance sheet, cash flow statement and accompanying notes to the financial statements. Further information concerning the Group’s objectives, policies and processes for managing its capital; its financial risk management objectives; details of its financial instruments and hedging activities; and its exposures to credit risk and liquidity risk can be found in the Strategic Report and in the notes to the financial statements. After reviewing Group and Company cash balances, borrowing facilities, forecast valuation movements and projected cash flows, the Directors believe that the Group and Company have adequate resources to continue operations for the foreseeable future. In reaching this conclusion the Directors have had regard to the Group’s operating plan and budget for the year ending 31 March 2016 and projections contained in the longer term business plan which covers the period to March 2022. The Directors have considered carefully the Group’s trading performance and cash flows as a result of the uncertain global economic environment and the other principal risks to the Group’s performance, and are satisfied with the Group’s positioning. For this reason, they continue to adopt the going concern basis in preparing the financial statements. 29 Big Yellow Group PLC Notes to the financial statements Year ended 31 March 2015 3. REVENUE Analysis of the Group’s operating revenue can be found below and in the Portfolio Summary. Open stores Self storage income Other storage related income Ancillary store rental income Other revenue Non-storage income Fees earned from Big Yellow Limited Partnership Other management fees earned Revenue per statement of comprehensive income Interest receivable on bank deposits (see note 7) Total revenue per IAS 18 2015 £000 2014 £000 70,631 11,849 251 59,994 10,475 237 82,731 70,706 268 458 819 420 640 430 84,276 72,196 27 20 84,303 72,216 Non-storage income derives principally from rental income earned from tenants of properties awaiting development. 4. SEGMENTAL INFORMATION IFRS 8 requires operating segments to be identified on the basis of internal reports about components of the Group that are regularly reviewed by the Chief Executive to allocate resources to the segments and to assess their performance. Given the nature of the Group’s business, there is one segment, which is the provision of self storage and related services. Revenue represents amounts derived from the provision of self storage and related services which fall within the Group's ordinary activities after deduction of trade discounts and value added tax. The Group’s net assets, revenue and profit before tax are attributable to one activity, the provision of self storage and related services. These all arise in the United Kingdom in the current year and prior year. 30 Big Yellow Group PLC Notes to the financial statements Year ended 31 March 2015 5. PROFIT FOR THE YEAR a) Profit for the year has been arrived at after charging/(crediting): 2015 £000 Depreciation of plant, equipment and owner-occupied property Leasehold property depreciation Gain on the revaluation of investment property Profit on disposal of surplus land Cost of inventories recognised as an expense Employee costs (see note 6) Operating lease rentals Auditor’s remuneration for audit services (see below) 2014 £000 566 918 (64,465) (1,318) 977 13,084 95 213 526 974 (28,350) 923 11,075 188 197 2015 £000 2014 £000 Fees payable to the Company’s auditor for the audit of the Company’s annual accounts Other services – audit of the Company’s subsidiaries’ annual accounts 160 140 31 27 Total audit fees 191 167 Interim review Tax services – advisory Assurance of CSR report Other services Real estate advice (planning) 34 131 22 80 - 33 21 20 21 1 Total non-audit fees 267 96 b) Analysis of auditor’s remuneration: Fees payable to Deloitte LLP and their associates for non-audit services to the Company are not required to be disclosed because the consolidated financial statements are required to disclose such fees on a consolidated basis. Fees charged by Deloitte LLP to Armadillo Storage Holding Company Limited and Armadillo Storage Holding Company 2 Limited in the year amounted to £211,000, of which £156,000 related to non-audit services. 31 Big Yellow Group PLC Notes to the financial statements Year ended 31 March 2015 6. EMPLOYEE COSTS The average monthly number of full-time equivalent employees (including Executive Directors) was: 2015 Number 2014 Number 256 44 246 43 300 289 2015 £000 2014 £000 8,982 1,655 388 2,059 8,007 1,275 356 1,437 13,084 11,075 2015 £000 2014 £000 Bank interest receivable Unwinding of discount on Capital Goods Scheme receivable Total interest receivable 27 468 495 20 395 415 Fair value movement on interest rate derivatives Total investment income 495 2,681 3,096 Sales Administration At 31 March 2015 the total number of Group employees was 337 (2014: 325). Their aggregate remuneration comprised: Wages and salaries Social security costs Other pension costs Share-based payments 7. INVESTMENT INCOME 32 Big Yellow Group PLC Notes to the financial statements Year ended 31 March 2015 8. 9. FINANCE COSTS 2015 £000 2014 £000 Interest on bank borrowings Capitalised interest Interest on obligations under finance leases 10,080 (399) 1,023 10,768 (484) 1,031 Total interest payable 10,704 11,315 Change in fair value of interest rate derivatives Total finance costs 2,274 12,978 11,315 TAXATION The Group converted to a REIT in January 2007. As a result the Group does not pay UK corporation tax on the profits and gains from its qualifying rental business in the UK provided that it meets certain conditions. Non-qualifying profits and gains of the Group are subject to corporation tax as normal. The Group monitors its compliance with the REIT conditions. There have been no breaches of the conditions to date. UK current tax 2015 £000 2014 £000 Current tax: - Current year - Prior year - Conversion charge refund 90 (254) (187) 300 - (351) 300 2015 £000 2014 £000 105,236 22,100 59,848 13,765 (12,109) (739) (1,475) (7,234) (278) (438) 263 90 (6,368) 147 (6,386) (41) (817) 300 A reconciliation of the tax (credit)/charge is shown below: Profit before tax Tax charge at 21% (2014 - 23%) thereon Effects of: Revaluation of investment properties Share of results of associates Permanent differences Profits from the tax exempt business Gain on disposal of surplus land Utilisation of brought forward losses Movement on other unrecognised deferred tax assets Current year tax charge Prior year adjustment (441) - Total tax (credit)/charge (351) 300 At 31 March 2015 the Group has unutilised tax losses of £32.8 million (2014: £36.5 million) available for offset against certain types of future taxable profits. All losses can be carried forward indefinitely. 33 Big Yellow Group PLC Notes to the financial statements Year ended 31 March 2015 10. ADJUSTED PROFIT BEFORE TAX AND ADJUSTED EBITDA Profit before tax (Gain)/loss on revaluation of investment properties – wholly owned – in associate (net of deferred tax) Change in fair value of interest rate derivatives – Group – in associate Profit on disposal of surplus land Share of non-recurring losses in associate Adjusted profit before tax Net bank interest Depreciation (see note 13b) Adjusted EBITDA 2015 £000 2014 £000 105,236 (64,465) (2,731) 2,274 124 (1,318) 285 59,848 (28,350) 662 (2,681) (258) - 39,405 29,221 9,654 566 10,264 526 49,625 40,011 Adjusted profit before tax which excludes gains and losses on the revaluation of investment properties, changes in fair value of interest rate derivatives, net gains and losses on surplus land, and non-recurring items of income and expenditure have been disclosed to give a clearer understanding of the Group’s underlying trading performance. EPRA earnings are £39,756,000 for the year after the tax credit of £351,000 (2014: £28,921,000 after a tax charge of £300,000). 11. DIVIDENDS Amounts recognised as distributions to equity holders in the year: Final dividend for the year ended 31 March 2014 of 8.4p (2013: 6.0p) per share. Interim dividend for the year ended 31 March 2015 of 10.4p (2014: 8.0p) per share. Proposed final dividend for the year ended 31 March 2015 of 11.3p (2014: 8.4p) per share. 2015 £000 2014 £000 11,774 8,384 16,116 11,207 27,890 19,591 17,541 11,774 Subject to approval by shareholders at the Annual General Meeting to be held on 21 July 2015, the final dividend will be paid on 23 July 2015. The ex-div date is 11 June 2015 and the record date is 12 June 2015. The Property Income Dividend (“PID”) payable for the year is 16.1 pence per share (2014: 13 pence per share). 34 Big Yellow Group PLC Notes to the financial statements Year ended 31 March 2015 12. EARNINGS AND NET ASSETS PER SHARE Earnings per ordinary share Year ended 31 March 2015 Basic Dilutive share options Diluted Adjustments: Gain on revaluation of investment properties Change in fair value of interest rate derivatives Profit on disposal of surplus land Share of associate non-recurring (gains)/losses Earnings £m 105.6 105.6 Year ended 31 March 2014 Shares million 145.7 1.2 Pence per share 72.5 (0.6) 146.9 71.9 Earnings £m 59.5 59.5 Shares million 139.9 1.2 Pence per share 42.5 (0.3) 141.1 42.2 (64.5) - (43.9) (28.3) - (20.1) 2.3 (1.3) - 1.6 (0.9) (2.7) - - (1.9) - (2.3) - (1.6) 0.4 - 0.3 EPRA – diluted 39.8 146.9 27.1 28.9 141.1 20.5 EPRA – basic 39.8 145.7 27.3 28.9 139.9 20.7 The calculation of basic earnings is based on profit after tax for the year. The weighted average number of shares used to calculate diluted earnings per share has been adjusted for the conversion of share options. EPRA earnings and earnings per ordinary share before non-recurring items, movements on revaluation of investment properties, gains on surplus land, the change in fair value of interest rate derivatives, and share of associate non-recurring gains and losses (including deferred tax on revaluation surpluses) have been disclosed to give a clearer understanding of the Group’s underlying trading performance. 35 Big Yellow Group PLC Notes to the financial statements Year ended 31 March 2015 12. EARNINGS AND NET ASSETS PER SHARE (CONTINUED) The European Public Real Estate Association (“EPRA”) has issued recommended bases for the calculation of net assets per share information and this is shown in the table below: 31 March 2015 £000 750,914 452 751,366 31 March 2014 £000 594,064 483 594,547 3,679 46 425 2,813 (26) - 755,516 597,334 484.0 478.5 481.1 423.9 418.5 420.5 EPRA NAV (as above) (£000) Valuation methodology assumption (see note 14) (£000) 755,516 45,927 597,334 37,057 Adjusted net asset value (£000) Adjusted net assets per share (pence) 801,443 510.4 634,391 446.5 No. of shares 158,055,735 (1,418,750) (1,500,000) 155,136,985 1,896,437 157,033,422 No. of shares 143,061,147 (1,418,750) (1,500,000) 140,142,397 1,926,527 142,068,924 Basic net asset value Exercise of share options EPRA NNNAV Adjustments: Fair value of derivatives Fair value of derivatives – share of associate Share of deferred tax in associates EPRA NAV Basic net assets per share (pence) EPRA NNNAV per share (pence) EPRA NAV per share (pence) Shares in issue Own shares held in treasury Own shares held in EBT Basic shares in issue used for calculation Exercise of share options Diluted shares used for calculation Net assets per share are shareholders’ funds divided by the number of shares at the year end. The shares currently held in the Group’s Employee Benefit Trust and in treasury are excluded from both net assets and the number of shares. Adjusted net assets per share include the effect of those shares issuable under employee share option schemes and the effect of alternative valuation methodology assumptions (see note 14). 36 Big Yellow Group PLC Notes to the financial statements Year ended 31 March 2015 13. NON-CURRENT ASSETS a) Investment property, investment property under construction and interests in leasehold property Investment property £000 Investment property under construction £000 Interests in leasehold property £000 Total £000 At 31 March 2013 Additions Capital Goods Scheme adjustment Transfer to surplus land Adjustment to present value Revaluation (see note 14) Depreciation 745,605 1,745 1,186 (1,330) 29,184 - 17,277 5,860 (834) - 21,803 2,985 (974) 784,685 7,605 1,186 (1,330) 2,985 28,350 (974) At 31 March 2014 776,390 22,303 23,814 822,507 36,343 111,055 1,478 12,650 24,900 (19,300) 63,594 1,007,110 5,157 (12,650) 871 15,681 - 41,500 111,055 1,478 (2,067) 24,900 (19,300) 64,465 (918) 1,043,620 Additions Acquisition of Partnership stores Transfer from surplus land Reclassification Adjustment to present value Acquisition of Big Storage Disposals Revaluation (see note 14) Depreciation At 31 March 2015 (2,067) (918) 20,829 The income from self storage accommodation earned by the Group from its investment property is disclosed in note 3. Direct operating expenses, which are all applied to generating rental income, arising on the investment property in the year are disclosed in the Portfolio Summary. Included within additions is £0.4 million of capitalised interest (2014: £0.5 million), calculated at the Group’s average borrowing cost for the year of 3.9%. 55 of the Group’s investment properties are pledged as security for loans, with a total external value of £861.0 million. The adjustment to present value in leasehold properties in the year arises due to the acquisition of the freehold of the Battersea store and extinguishment of the lease liability. 37 Big Yellow Group PLC Notes to the financial statements Year ended 31 March 2015 13. NON-CURRENT ASSETS a) Investment property, investment property under construction and interests in leasehold property (continued) Accounting for the acquisition of Big Storage Limited In January 2015 the Group acquired the entire share capital of Big Storage Limited for a property value of £24.9 million. The net consideration is shown below. The company owned five self storage centres in North West England. The Group subsequently transferred the store at Chester to another subsidiary company of the Group. This store will be rebranded as a Big Yellow. To determine the assets and liabilities acquired at the date of completion of Big Storage Limited the Group have used the balance sheet at the date of acquisition. The following provides a breakdown of the fair value of the assets and liabilities acquired. Investment property Other non-current assets Current assets Current liabilities Non-current liabilities £000 24,900 17 1,701 (1,619) (9,885) Net assets (100%) 15,114 Net assets acquired (100%) Satisfied by cash consideration £000 15,114 (15,114) - In February 2015, the Group sold the share capital of Big Storage Limited to a company (“Armadillo 2”) in which it has a 20% interest, with the balance of the equity owned by an Australian consortium. The disposal was at book and fair value, so there was no profit or loss recorded on disposal. The following provides a breakdown of the assets and liabilities disposed of. Between transactions the Group controlled Big Storage Limited and contractually controlled the assets. Investment property Other non-current assets Current assets Current liabilities Non-current liabilities Net assets (100%) £000 19,300 17 3,942 (1,519) (14,126) 7,614 £000 7,614 (7,614) On a net basis, the Group acquired property of £5.6 million, cash of £1.9 million and invested £1.8 million into Armadillo 2. Net assets disposed (100%) Satisfied by cash consideration 38 Big Yellow Group PLC Notes to the financial statements Year ended 31 March 2015 13. NON-CURRENT ASSETS (CONTINUED) b) Plant, equipment and owner occupied property Cost At 31 March 2013 Reclassification Retirement of fully depreciated assets Additions Freehold property £000 Leasehold improvements £000 Plant and machinery £000 1,867 (9) 44 9 826 - (15) - - (418) 17 Total £000 25 - 6,958 - 9,720 - (5,813) 744 (6,246) 761 1,889 4,235 - At 31 March 2014 Retirement of fully depreciated assets Additions 1,843 53 42 - At 31 March 2015 1,885 53 544 25 1,416 3,923 (261) 2 (44) (2) (609) - (15) - (6,041) - (6,970) - 15 (49) (3) 418 (27) (7) 5,813 (440) 6,246 (526) At 31 March 2014 Retirement of fully depreciated assets Charge for the year (293) (49) (218) (22) (668) (1,250) (35) (1) 52 (53) (3) 891 (474) 943 (566) At 31 March 2015 (328) (50) (219) (25) (251) (873) Depreciation At 31 March 2013 Reclassification Retirement of fully depreciated assets Charge for the year 425 Motor vehicles £000 Fixtures, fittings & office equipment £000 (52) 171 25 - (891) 418 (943) 631 Net book value At 31 March 2015 1,557 3 325 - 1,165 3,050 At 31 March 2014 1,550 4 207 3 1,221 2,985 c) Goodwill The goodwill relates to the purchase of Big Yellow Self Storage Company Limited in 1999. The asset is tested bi-annually for impairment. The carrying value remains unchanged from the prior year as there is considered to be no impairment in the value of the asset. 39 Big Yellow Group PLC Notes to the financial statements Year ended 31 March 2015 13. NON-CURRENT ASSETS (CONTINUED) d) Investment in associates The table below shows the movement for all associates in the period and reconciles to the income statement and the balance sheet. Big Yellow Limited Partnership Armadillo 1 At the beginning of the year Subscription for partnership capital and advances Part disposal of Partnership interest Share of results (see below) Dividends Acquisition of remaining interest Investment at the end of year 17,861 - Armadillo 2 - - 3,648 (1,728) 1,807 (89) 3,638 1,789 145 1,934 1,564 (19,425) - Total associates 17,861 5,437 (1,728) 3,516 (89) (19,425) 5,572 Big Yellow Limited Partnership At the start of the year the Group had a 33.3% interest in Big Yellow Limited Partnership. This interest was accounted for as an associate, using equity accounting. The Partnership commenced trading on 1 December 2007. On 1 December 2014, the Group acquired the remaining 66.7% of the Partnership interest that it did not previously own. From this date, the Partnership is accounted for as a wholly owned subsidiary of the Group. The results up to this date are equity accounted as shown in the note below: At the beginning of the year Share of results (see below) Acquisition of remaining interest 31 March 2015 £000 17,861 1,564 (19,425) 31 March 2014 £000 17,681 180 - - 17,861 40 Big Yellow Group PLC Notes to the financial statements Year ended 31 March 2015 13. NON-CURRENT ASSETS (CONTINUED) d) Investment in associates (continued) The figures below show the trading results of Big Yellow Limited Partnership, and the Group’s share of the results and the net assets of the Partnership. 1 April 2014 to 30 November 2015 £000 Year ended 31 March 2014 £000 Income statement (100%) Revenue Cost of sales Administrative expenses 7,476 (3,367) (86) 9,529 (4,846) (112) Operating profit Gain/(loss) on the revaluation of investment properties Net interest payable Fair value movement of interest rate derivatives 4,023 2,473 (1,569) (233) 4,571 (1,985) (2,820) 774 4,694 540 Big Yellow Limited Partnership Profit before and after tax Balance sheet (100%) Investment property Other non-current assets Current assets Current liabilities Derivative financial instruments Non-current liabilities Net assets (100%) 31 March 2015 £000 - 31 March 2014 £000 108,110 3,588 3,009 (3,201) 77 (58,000) - 53,583 41 Big Yellow Group PLC Notes to the financial statements Year ended 31 March 2015 13. NON-CURRENT ASSETS (CONTINUED) d) Investment in associates (continued) Group share of (33.3%) Operating profit Gain/(loss) on the revaluation of investment properties Net interest payable Fair value movement of interest rate derivatives Profit for the year Associate net assets 1 April 2014 to 30 November 2015 £000 1,341 824 (523) (78) Year ended 31 March 2014 £000 1,524 (662) (940) 258 1,564 180 - 17,861 Accounting for the acquisition The following provides a breakdown of the fair value of the assets and liabilities acquired. The investment properties have been valued by the Directors with regard to the September 2014 property valuations performed by Cushman & Wakefield LLP uplifted for the capital movement in the two month period to the Acquisition date. Investment property Other non-current assets Current assets Current liabilities Non-current liabilities Net assets (100%) Net assets acquired (66.67% of £58.9 million) Satisfied by cash consideration £000 111,055 3,566 3,312 (2,058) (57,000) 58,875 £000 39,250 (39,250) - From the date of acquisition of the Partnership on 1 December 2014 to 31 March 2015, the revenue of the Partnership was £3.7 million, and the statutory profit before tax was £4.3 million. The profit for the Partnership for the full year from 1 April 2014 was £9.0 million. Excluding the share of results of the Partnership as an associate of £1.6 million, the combined statutory profit before tax of the Group and the Partnership for the full year would have been £112.6 million. 42 Big Yellow Group PLC Notes to the financial statements Year ended 31 March 2015 13. NON-CURRENT ASSETS (CONTINUED) d) Investment in associates (continued) Armadillo The Group has a 20% interest in Armadillo Storage Holding Company Limited (“Armadillo 1”) and a 20% interest in Armadillo Storage Holding Company 2 Limited (“Armadillo 2”). Both interests are accounted for as associates, using the equity method of accounting. At the beginning of the year Subscription for partnership capital and advances Part disposal of Partnership interest Share of results (see below) Dividends Armadillo 1 31 March 31 March 2015 2014 £000 £000 - Armadillo 2 31 March 31 March 2015 2014 £000 £000 - 3,648 (1,728) 1,807 (89) - 1,789 145 - - 3,638 - 1,992 - The Group’s total subscription for partnership capital and advances in Armadillo Storage Holding Company Limited is £1,920,000 and £1,789,000 in Armadillo Storage Holding Company 2 Limited. The investment properties owned by Armadillo 1 and Armadillo 2 have been valued at 31 March 2015 by Jones Lang LaSalle. 43 Big Yellow Group PLC Notes to the financial statements Year ended 31 March 2015 13. NON-CURRENT ASSETS (CONTINUED) d) Investment in associates (continued) The figures below show the trading results of the Partnerships, and the Group’s share of the results and the net assets of the Partnerships. Armadillo Storage 1 Armadillo Storage 2 Period from 16 April 2014 to 31 March 2015 £000 Period from 3 February 2015 to 31 March 2015 £000 Income statement (100%) Revenue Cost of sales Administrative expenses 4,321 (2,258) (100) 627 (335) (75) Operating profit Gain on the revaluation of investment properties Net interest payable Acquisition costs written off Fair value movement of interest rate derivatives Deferred tax Profit attributable to shareholders Dividends paid Retained profit 1,963 10,078 (504) (467) (197) (1,833) 9,040 (447) 8,593 217 1,449 (73) (540) (35) (290) 728 728 30,125 1,005 1,132 (2,151) (197) (11,721) 23,175 1,465 1,256 (1,406) (35) (14,785) 18,193 9,670 Group share Operating profit Gain on the revaluation of investment properties Net interest payable Acquisition costs written off Fair value movement of interest rate derivatives Deferred tax Profit attributable to shareholders Dividends paid Retained profit 471 2,042 (123) (177) (39) (367) 1,807 (89) 1,718 43 290 (15) (108) (7) (58) 145 145 Associates’ net assets 3,638 1,934 Balance sheet (100%) Investment property Other non-current assets Current assets Current liabilities Derivative financial instruments Non-current liabilities Net assets (100%) 44 Big Yellow Group PLC Notes to the financial statements Year ended 31 March 2015 14. VALUATION OF INVESTMENT PROPERTY Deemed cost £000 Revaluation on deemed cost £000 Valuation £000 373,503 1,478 111,055 352,857 - 726,360 1,478 111,055 12,990 1,762 41,678 542,466 (340) 6,948 63,609 423,074 12,650 8,710 105,287 965,540 16,199 (1,762) 265 14,702 33,831 (6,948) (15) 26,868 50,030 (8,710) 250 41,570 389,702 1,478 111,055 386,688 - 776,390 1,478 111,055 12,990 41,943 557,168 (340) 63,594 449,942 12,650 105,537 1,007,110 Investment property under construction At 31 March 2014 Transfer to investment property Movement in year At 31 March 2015 29,642 (12,990) 5,157 21,809 (7,339) 340 871 (6,128) 22,303 (12,650) 6,028 15,681 Valuation of all investment property At 31 March 2014 Transfer from surplus land Acquisition of Partnership stores Movement in year At 31 March 2015 419,344 1,478 111,055 47,100 578,977 379,349 64,465 443,814 798,693 1,478 111,055 111,565 1,022,791 Freehold stores At 31 March 2014 Transfer from surplus land Acquisition of Partnership stores Transfer from investment property under construction Transfer on freehold acquisition Movement in year At 31 March 2015 Leasehold stores At 31 March 2014 Transfer on freehold acquisition Movement in year At 31 March 2015 Total of open stores At 31 March 2014 Transfer from surplus land Acquisition of Partnership stores Transfer from investment property under construction Movement in year At 31 March 2015 The Group has classified the fair value investment property and the investment property under construction within Level 3 of the fair value hierarchy. There has been no transfer to or from Level 3 in the year. 45 Big Yellow Group PLC Notes to the financial statements Year ended 31 March 2015 14. VALUATION OF INVESTMENT PROPERTY (CONTINUED) The wholly owned freehold and leasehold investment properties have been valued at 31 March 2015 by external valuers, Cushman & Wakefield LLP (“C&W”). The valuation has been carried out in accordance with the RICS Valuation – Professional Standards, published by The Royal Institution of Chartered Surveyors (“the Red Book”). The valuation of each of the investment properties and the investment properties under construction has been prepared on the basis of either Fair Value or Fair Value as a fully equipped operational entity, having regard to trading potential, as appropriate. The valuation has been provided for accounts purposes and as such, is a Regulated Purpose Valuation as defined in the Red Book. In compliance with the disclosure requirements of the Red Book, C&W have confirmed that: Of the members of the RICS who have been the signatories to the valuations provided to the Group for the same purposes as this valuation, one has done so since September 2004 and the other has done so since September 2014; C&W have been carrying out this bi-annual valuation for the same purposes as this valuation on behalf of the Group since September 2004; C&W do not provide other significant professional or agency services to the Group; In relation to the preceding financial year of C&W, the proportion of the total fees payable by the Group to the total fee income of the firm is less than 5%; and The fee payable to C&W is a fixed amount per store, and is not contingent on the appraised value. Market uncertainty C&W’s valuation report comments on valuation uncertainty resulting from low liquidity in the market for self storage property. C&W note that in the UK since Q1 2013 there have only been four transactions involving multiple assets and 8 single asset transactions. C&W state that due to the lack of comparable market information in the self storage sector, there is greater uncertainty attached to their opinion of value than would be anticipated during more active market conditions. Portfolio Premium C&W’s valuation report further confirms that the properties have been valued individually but that if the portfolio was to be sold as a single lot or in selected groups of properties, the total value could differ significantly. C&W state that in current market conditions they are of the view that there could be a material portfolio premium. Valuation methodology C&W have adopted different approaches for the valuation of the leasehold and freehold assets as follows: Freehold and long leasehold The valuation is based on a discounted cash flow of the net operating income over a ten year period and notional sale of the asset at the end of the tenth year. Assumptions A. Net operating income is based on projected revenue received less projected operating costs together with a central administration charge of 6% of the estimated annual revenue subject to a cap and a collar. The initial net operating income is calculated by estimating the net operating income in the first 12 months following the valuation date. 46 Big Yellow Group PLC Notes to the financial statements Year ended 31 March 2015 14. VALUATION OF INVESTMENT PROPERTY (CONTINUED) B. The net operating income in future years is calculated assuming either straight-line absorption from day one actual occupancy or variable absorption over years one to four of the cash flow period, to an estimated stabilised/mature occupancy level. In the valuation the assumed stabilised occupancy level for the 69 trading stores (both freeholds and leaseholds) open at 31 March 2015 averages 81.1% (31 March 2014: 81.1%). The projected revenues and costs have been adjusted for estimated cost inflation and revenue growth. The average time assumed for the 69 stores to trade at their maturity levels is 24 months (31 March 2014: 31.5 months. C. The capitalisation rates applied to existing and future net cash flow have been estimated by reference to underlying yields for industrial and retail warehouse property, yields for other trading property types such as student housing and hotels, bank base rates, ten year money rates, inflation and the available evidence of transactions in the sector. The valuation included in the accounts assumes rental growth in future periods. If an assumption of no rental growth is applied to the external valuation, the net initial yield pre-administration expenses for the 69 stores is 6.4% (31 March 2014: 6.3%) rising to a stabilised net yield pre-administration expenses of 7.4% (31 March 2014: 7.8%). D. The future net cash flow projections (including revenue growth and cost inflation) have been discounted at a rate that reflects the risk associated with each asset. The weighted average annual discount rate adopted (for both freeholds and leaseholds) is 10.4% (31 March 2014: 11.0%). E. Purchaser’s costs of 5.8% (see below) have been assumed initially and sale plus purchaser’s costs totalling 6.8% are assumed on the notional sales in the tenth year in relation to the freehold stores. Short leasehold The same methodology has been used as for freeholds, except that no sale of the assets in the tenth year is assumed but the discounted cash flow is extended to the expiry of the lease. The average unexpired term of the Group’s six short leasehold properties is 16.5 years (31 March 2014: seven short leasehold properties with 16.8 years unexpired). Investment properties under construction C&W have valued the stores in development adopting the same methodology as set out above but on the basis of the cash flow projection expected for the store at opening and after allowing for the outstanding costs to take each scheme from its current state to completion and full fit-out. C&W have allowed for holding costs and construction contingency, as appropriate. One scheme does not yet have planning consent and C&W have reflected the planning risk in their valuation. Immature stores: value uncertainty C&W have assessed the value of each property individually. However, two of the Group’s stores are relatively immature and have low initial cash flows. C&W have endeavoured to reflect the nature of the cash flow profile for these properties in their valuation, and the higher associated risks relating to the as yet unproven future cash flows, by adjustment to the capitalisation rates and discount rates adopted. However, immature low cash flow stores of this nature are rarely, if ever, traded individually in the market, unless as part of a distressed sale or similar situation. Although, there is more evidence of immature low cash flow stores being traded as part of a group or portfolio transaction. Please note C&W’s comments in relation to market uncertainty in the self storage sector due to the lack of comparable market transactions and information. The degree of uncertainty relating to the two immature stores is greater than in relation to the balance of the properties due to there being even less market evidence that might be available for more mature properties and portfolios. 47 Big Yellow Group PLC Notes to the financial statements Year ended 31 March 2015 14. VALUATION OF INVESTMENT PROPERTY (CONTINUED) C&W state that in practice, if an actual sale of the properties were to be contemplated then any immature low cash flow stores would normally be presented to the market for sale lotted or grouped with other more mature assets owned by the same entity, in order to alleviate the issue of negative or low short term cash flow. This approach would enhance the marketability of the group of assets and assist in achieving the best price available in the market by diluting the cash flow risk. C&W have not adjusted their opinion of Fair Value to reflect such a grouping of the immature assets with other properties in the portfolio and all stores have been valued individually. However, they highlight the matter to alert the Group to the manner in which the properties might be grouped or lotted in order maximise their attractiveness to the market place. C&W consider this approach to be a valuation assumption but not a Special Assumption, the latter being an assumption that assumes facts that differ from the actual facts existing at the valuation date and which, if not adopted, could produce a material difference in value. As noted above, C&W have not assumed that the entire portfolio of properties owned by the entity would be sold as a single lot and the value for the whole portfolio in the context of a sale as a single lot may differ significantly (either higher or lower) from the aggregate of the individual values for each property in the portfolio, reflecting the lotting assumption described above. Valuation assumption for purchaser’s costs The Group’s investment property assets have been valued for the purposes of the financial statements after deducting notional purchaser’s cost of 5.8% of gross value, as if they were sold directly as property assets. The valuation is an asset valuation which is entirely linked to the operating performance of the business. They would have to be sold with the benefit of operational contracts, employment contracts and customer contracts, which would be very difficult to achieve except in a corporate structure. This approach follows the logic of the valuation methodology in that the valuation is based on a capitalisation of the net operating income after allowing a deduction for operational cost and an allowance for central administration costs. Sale in a corporate structure would result in a reduction in the assumed Stamp Duty Land Tax but an increase in other transaction costs reflecting additional due diligence resulting in a reduced notional purchaser’s cost of 2.75% of gross value. All the significant sized transactions that have been concluded in the UK in recent years were completed in a corporate structure. The Group therefore instructed C&W to carry out a Red Book valuation on the above basis, and this results in a higher property valuation at 31 March 2015 of £1,068.4 million (£45.6 million higher than the value recorded in the financial statements). The total valuations in the two Armadillo Partnerships performed by Jones Lang LaSalle are £1.6 million higher than the value recorded in the financial statements, of which the Group’s share is £0.3 million. The sum of these is £45.9 million and translates to 29.3 pence per share. We have included this revised valuation in the adjusted diluted net asset calculation (see note 14). 15. SURPLUS LAND At 31 March 2014 Transfer to investment property Disposal Additions At 31 March 2015 £000 6,059 (1,478) (1,497) 231 3,315 During the year a gain of £1,318,000 arose on the disposal of surplus land at one site (2014: no disposals). 48 Big Yellow Group PLC Notes to the financial statements Year ended 31 March 2015 16. TRADE AND OTHER RECEIVABLES Current 31 March 2015 £000 31 March 2014 £000 3,062 184 371 12,762 2,594 1,344 384 9,209 16,379 13,531 9,039 7,620 Trade receivables Capital Goods Scheme receivable Other receivables Prepayments and accrued income Non-current Capital Goods Scheme receivable Trade receivables are net of a bad debt provision of £19,000 (2014: £42,000). The Directors consider that the carrying amount of trade and other receivables approximates their fair value. The Financial Review contains commentary on the Capital Goods Scheme receivable. Trade receivables The Group does not typically offer credit terms to its customers, requiring them to pay in advance of their storage period and hence the Group is not exposed to significant credit risk. A late charge of 10% is applied to a customer’s account if they are greater than 10 days overdue in their payment. The Group provides for receivables on a specific basis. There is a right of lien over the customers’ goods, so if they have not paid within a certain time frame, we have the right to sell the items they store to recoup the debt owed by the customer. Trade receivables that are overdue are provided for based on estimated irrecoverable amounts determined by reference to past default experience. For individual storage customers, the Group does not perform credit checks, however this is mitigated by the fact that these customers are required to pay in advance, and also to pay a deposit ranging from between one week to four weeks’ storage income. Before accepting a new business customer who wishes to use a number of the Group’s stores, the Group uses an external credit rating to assess the potential customer’s credit quality and defines credit limits by customer. There are no customers who represent more than 5% of the total balance of trade receivables. Included in the Group’s trade receivable balance are debtors with a carrying amount of £210,000 (2014: £285,000) which are past due at the reporting date for which the Group has not provided as there has not been a significant change in credit quality and the amounts are still considered recoverable. The average age of these receivables is 43 days past due (2014: 37 days past due). 49 Big Yellow Group PLC Notes to the financial statements Year ended 31 March 2015 16. TRADE AND OTHER RECEIVABLES (CONTINUED) Ageing of past due but not impaired receivables 1 - 30 days 30 - 60 days 60 + days Total 2015 £000 44 33 133 2014 £000 136 52 97 210 285 2015 £000 42 99 (122) 2014 £000 45 73 (76) Movement in the allowance for doubtful debts Balance at the beginning of the year Amounts provided in year Amounts written off as uncollectible Balance at the end of the year 19 42 The concentration of credit risk is limited due to the customer base being large and unrelated. Accordingly, the Directors believe that there is no further credit provision required in excess of the allowance for doubtful debts. Ageing of impaired trade receivables 1 - 30 days 30 - 60 days 60 + days Total 2015 £000 3 16 2014 £000 5 37 19 42 50 Big Yellow Group PLC Notes to the financial statements Year ended 31 March 2015 17. TRADE AND OTHER PAYABLES Current Trade payables Other payables Accruals and deferred income Amounts owed to associate VAT repayable under Capital Goods Scheme 31 March 2015 £000 31 March 2014 £000 11,653 7,286 13,640 33 10,758 5,647 10,330 2 81 32,612 26,818 The Group has financial risk management policies in place to ensure that all payables are paid within the credit terms. The Directors consider the carrying amount of trade and other payables and accruals and deferred income approximates fair value. 18. FINANCIAL INSTRUMENTS The Group manages its capital to ensure that entities in the Group will be able to continue as going concerns while maximising the return to stakeholders through the optimisation of the debt and equity balance. The capital structure of the Group consists of debt, which includes the borrowings disclosed in note 19, cash and cash equivalents and equity attributable to equity holders of the parent, comprising issued capital, reserves and retained earnings. The Group’s debt facilities require 50% of total drawn debt to be fixed. The Group has complied with this during the year. With the exception of derivative instruments which are classified as a financial liability at fair value through the profit and loss (“FVTPL”), financial liabilities are categorised under amortised cost. All financial assets are categorised as loans and receivables. Exposure to credit, interest rate and currency risks arises in the normal course of the Group’s business. Derivative financial instruments are used to manage exposure to fluctuations in interest rates, but are not employed for speculative purposes. 51 Big Yellow Group PLC Notes to the financial statements Year ended 31 March 2015 18. FINANCIAL INSTRUMENTS (CONTINUED) Significant accounting policies Details of the significant accounting policies and methods adopted, including the criteria for recognition, the basis of measurement and the basis on which income and expenses are recognised, in respect of each class of financial asset, financial liability and equity instrument are disclosed in note 2 to the financial statements. A. Balance sheet management The Group’s Board reviews the capital structure on an ongoing basis. As part of this review, the Board considers the cost of capital and the risks associated with each class of capital. The Group seeks to have a conservative gearing ratio (the proportion of net debt to equity). The Board considers at each review the appropriateness of the current ratio in light of the above. The Board is currently satisfied with the Group’s gearing ratio. The gearing ratio at the year end is as follows: 2015 £000 2014 £000 Debt Cash and cash equivalents (285,334) 8,194 (229,368) 3,301 Net debt Balance sheet equity Net debt to equity ratio (277,140) 750,914 36.9% (226,067) 594,064 38.1% Debt is defined as long-term and short-term borrowings, as detailed in note 19, excluding finance leases and debt issue costs. Equity includes all capital and reserves of the Group attributable to equity holders of the Company. Net debt is defined as gross bank borrowings less cash and cash equivalents. B. Debt management The Group currently borrows through a senior term loan, secured on 40 self storage assets and sites, and through a 15 year loan with Aviva Commercial Finance Limited secured on a portfolio of 15 self storage assets. The Group also has a short term bridging loan from Lloyds of £70 million, which is to be repaid through a £70 million seven year loan from M&G Investments Limited, which will be drawn in June 2015, and secured on a portfolio of 15 self storage assets. Borrowings are arranged to ensure an appropriate maturity profile and to maintain short term liquidity. Funding is arranged in the Group through banks and financial institutions with whom the Group has a strong working relationship. C. Interest rate risk management The Group is exposed to interest rate risk as entities in the Group borrow funds at both fixed and floating interest rates. The risk is managed by the Group by maintaining an appropriate mix between fixed and floating rate borrowings, and by the use of interest rate swap contracts. Hedging activities are evaluated regularly to align with interest rate views and defined risk appetite; ensuring optimal hedging strategies are applied, by either positioning the balance sheet or protecting interest expense through different interest rate cycles. At 31 March 2015 the Group had two interest rate derivatives in place; £30 million fixed at 2.80% (excluding the margin on the underlying debt instrument) until September 2016, and £35 million fixed at 2.635% (excluding the margin on the underlying debt instrument) with a forward start date of 29 June 2015. This forward start swap is included in the total amount of fixed debt for the purposes of meeting the requirement to have at least 50% of debt fixed. 52 Big Yellow Group PLC Notes to the financial statements Year ended 31 March 2015 18. FINANCIAL INSTRUMENTS (CONTINUED) Under interest rate swap contracts, the Group agrees to exchange the difference between fixed and floating rate interest amounts calculated on agreed notional principal amounts. Such contracts enable the Group to mitigate the risk of changing interest rates on the fair value of issued fixed rate debt held and the cash flow exposures on the issued variable rate debt held. The fair value of interest rate swaps at the reporting date is determined by discounting the future cash flows using the curves at the reporting date and the credit risk inherent in the contract, and is disclosed below. The average interest rate is based on the outstanding balances at the end of the financial year. The £30 million interest rate swap settles on a monthly basis. The floating rate on the interest rate swap is one month LIBOR. The Group settles the difference between the fixed and floating interest rate on a net basis. The £35 million forward start interest rate swap settles on a three-monthly basis. The floating rate on the interest rate swap is three month LIBOR. The Group will settle the difference between the fixed and floating interest rate on a net basis. The Group does not hedge account for its interest rate swaps and states them at fair value, with changes in fair value included in the statement of comprehensive income. The loss in the statement of comprehensive income for the year on the fair value of interest rate derivatives was £2,274,000 (2014: gain of £2,681,000). The fair value of the above derivatives at 31 March 2015 was a liability of £3,679,000 (2014: liability of £2,813,000). D. Interest rate sensitivity analysis In managing interest rate risks the Group aims to reduce the impact of short-term fluctuations on the Group’s earnings, without jeopardising its flexibility. Over the longer term, permanent changes in interest rates may have an impact on consolidated earnings. At 31 March 2015, it is estimated that an increase of 0.5 percentage points in interest rates would have reduced the Group’s adjusted profit before tax and net equity by £805,000 (2014: reduced adjusted profit before tax by £315,000) and a decrease of 0.5 percentage points in interest rates would have increased the Group’s adjusted profit before tax and net equity by £805,000 (2014: increased adjusted profit before tax by £315,000). The sensitivity has been calculated by applying the interest rate change to the variable rate borrowings, net of interest rate swaps, at the year end. The Group’s sensitivity to interest rates has increased during the year, following the drawing of further floating rate debt. The Board monitors closely the exposure to the floating rate element of our debt. 53 Big Yellow Group PLC Notes to the financial statements Year ended 31 March 2015 18. FINANCIAL INSTRUMENTS (CONTINUED) E. Cash management and liquidity Ultimate responsibility for liquidity risk management rests with the Board of Directors, which has built an appropriate liquidity risk management framework for the management of the Group’s short, medium and long-term funding and liquidity management requirements. The Group manages liquidity risk by maintaining adequate reserves, banking facilities and reserve borrowing facilities by continuously monitoring forecast and actual cash flows and matching the maturity profiles of financial assets and liabilities. Included in note 19 is a description of additional undrawn facilities that the Group has at its disposal to further reduce liquidity risk. Short term money market deposits are used to manage liquidity whilst maximising the rate of return on cash resources, giving due consideration to risk. F. Foreign currency management The Group does not have any foreign currency exposure. G. Credit risk The credit risk management policies of the Group with respect to trade receivables are discussed in note 16. The Group has no significant concentration of credit risk, with exposure spread over 47,000 customers in our stores. The credit risk on liquid funds is limited because the counterparties are banks with high credit-ratings assigned by international credit-rating agencies. H. Financial maturity analysis In respect of interest-bearing financial liabilities, the following table provides a maturity analysis for individual elements. 2015 Maturity Debt Aviva mortgage Bank loan payable at variable rate Debt fixed by interest rate derivatives Total Total £000 Less than one year £000 One to two years £000 Two to five years £000 More than five years £000 94,334 161,000 2,136 70,000 2,243 - 7,427 91,000 82,528 - 30,000 - - 30,000 - 285,334 72,136 2,243 128,427 82,528 The £70 million loan showing as due within one year will be repaid through the drawing of the seven year £70 million facility from M&G Investments Limited in June 2015. 54 Big Yellow Group PLC Notes to the financial statements Year ended 31 March 2015 18. FINANCIAL INSTRUMENTS (CONTINUED) 2014 Maturity Total £000 Less than one year £000 One to two years £000 Two to five years £000 More than five years £000 96,368 63,000 2,034 - 2,136 - 7,073 63,000 85,125 - 70,000 - - 70,000 - 229,368 2,034 2,136 140,073 85,125 Debt Aviva mortgage Bank loan payable at variable rate Debt fixed by interest rate derivatives Total I. Fair values of financial instruments The fair values of the Group’s cash and short term deposits and those of other financial assets equate to their book values. Details of the Group’s receivables at amortised cost are set out in note 16. The amounts are presented net of provisions for doubtful receivables, and allowances for impairment are made where appropriate. Trade and other payables, including bank borrowings, are carried at amortised cost. Finance lease liabilities are included at the fair value of their minimum lease payments. Derivatives are carried at fair value. For those financial instruments held at valuation, the Group has categorised them into a three level fair value hierarchy based on the priority of the inputs to the valuation technique in accordance with IFRS 7. The hierarchy gives the highest priority to quoted prices in active markets for identical assets or liabilities (Level 1) and the lowest priority to unobservable inputs (Level 3). If the inputs used to measure fair value fall within different levels of the hierarchy, the category level is based on the lowest priority level input that is significant to the fair value measurement of the instrument in its entirety. The fair value of the Group’s outstanding interest rate derivative, as detailed in note 18C, has been estimated by calculating the present value of future cash flows, using appropriate market discount rates, representing Level 2 fair value measurements as defined by IFRS 7. There are no financial instruments which have been categorised as Level 1 or Level 3. 55 Big Yellow Group PLC Notes to the financial statements Year ended 31 March 2015 18. FINANCIAL INSTRUMENTS (CONTINUED) J. Maturity analysis of financial liabilities The contractual maturities based on market conditions and expected yield curves prevailing at the year end date are as follows: Trade and Borrowings other Interest and Finance payables rate swaps interest leases Total 2015 £000 £000 £000 £000 £000 From five to twenty years From two to five years From one to two years - 885 1,213 916 114,628 158,166 12,655 24,529 5,207 1,735 140,042 164,586 15,306 Due after more than one year Due within one year 32,612 3,014 1,175 285,449 82,267 31,471 1,735 319,934 117,789 Total 32,612 4,189 367,716 33,206 437,723 2014 Trade and other payables £000 Interest rate swaps £000 Borrowings and interest £000 Finance leases £000 Total £000 - 306 1,062 115,534 155,696 12,279 28,355 6,308 1,646 143,889 162,310 14,987 Due after more than one year Due within one year 26,818 1,368 1,558 283,509 12,279 36,309 1,646 321,186 42,301 Total 26,818 2,926 295,788 37,955 363,487 From five to twenty years From two to five years From one to two years 56 Big Yellow Group PLC Notes to the financial statements Year ended 31 March 2015 18. FINANCIAL INSTRUMENTS (CONTINUED) K. Reconciliation of maturity analyses The maturity analysis in note 18J shows non-discounted cash flows for all financial liabilities including interest payments. The table below reconciles the borrowings column in note 19 with the borrowings and interest column in the maturity analysis presented in note 18J. 2015 Borrowings £000 Interest £000 Unamortised Borrowings borrowing and costs interest £000 £000 From five to twenty years From two to five years From one to two years 82,528 128,427 2,243 30,890 28,487 10,412 1,210 1,252 - 114,628 158,166 12,655 Due after more than one year Due within one year 213,198 72,136 69,789 10,131 2,462 - 285,449 82,267 Total 285,334 79,920 2,462 367,716 2014 Borrowings £000 Interest £000 Unamortised Borrowings borrowing and costs interest £000 £000 From five to twenty years From two to five years From one to two years 85,125 140,073 2,136 29,119 15,623 10,143 1,290 - 115,534 155,696 12,279 Due after more than one year Due within one year 227,334 2,034 54,885 10,245 1,290 - 283,509 12,279 Total 229,368 65,130 1,290 295,788 57 Big Yellow Group PLC Notes to the financial statements Year ended 31 March 2015 19. BORROWINGS 31 March 2015 £000 31 March 2014 £000 2,136 70,000 72,136 2,034 2,034 Non-current liabilities Bank borrowings Aviva mortgage Unamortised loan arrangement costs 121,000 92,198 (2,462) 133,000 94,334 (1,290) Total non-current borrowings 210,736 226,044 Total borrowings 282,872 228,078 Secured borrowings at amortised cost Current liabilities Aviva mortgage Bank borrowings The weighted average interest rate paid on the borrowings during the year was 3.9% (2014: 4.5%). The Group has £49,000,000 in undrawn committed bank borrowing facilities at 31 March 2015, which expire between four and five years (2013: £22,000,000 expiring between two and three years). Additionally, the Group has a £70 million committed facility from M&G Investments Limited which it intends to draw in June 2015 to repay the bridging facility from Lloyds. The M&G facility expires in June 2022. In April 2012, the Group completed a £100 million 15 year fixed rate loan with Aviva Commercial Finance Limited. The loan is secured over a portfolio of 15 freehold self storage centres. The annual fixed interest rate on the loan is 4.9%. The loan amortises to £60 million over the course of the 15 years. The debt service is payable monthly based on fixed annual amounts. The loan outstanding on the fifth anniversary will be £89.8 million; £76.7 million outstanding on the tenth anniversary, with £60 million remaining at expiry in April 2027. The Group has a £170 million 5 year bank facility with Lloyds and HSBC expiring in August 2019. £85 million of the facility is term loan with £85 million revolving. The blended margin on the facility is 1.625%. The Group was in compliance with its banking covenants at 31 March 2015 and throughout the year. 58 Big Yellow Group PLC Notes to the financial statements Year ended 31 March 2015 19. BANK BORROWINGS (CONTINUED) Interest rate profile of financial liabilities Weighted average interest rate Period for which the rate is fixed Weighted average period until maturity Total £000 Floating rate £000 Fixed rate £000 At 31 March 2015 Gross financial liabilities 285,334 161,000 124,334 3.3% 8.0 years 5.0 years At 31 March 2014 Gross financial liabilities 229,368 63,000 166,368 4.5% 7.4 years 6.1 years All monetary liabilities, including short term receivables and payables are denominated in sterling. The weighted average interest rate includes the effect of the Group’s interest rate derivatives. The Directors have concluded that the carrying value of borrowings equates to its fair value. Narrative disclosures on the Group’s policy for financial instruments are included within the Strategic Report and in note 18. 20. DEFERRED TAX Deferred tax assets in respect of share based payments (£0.2 million), interest rate swaps (£0.7 million), corporation tax losses (£5.4 million), capital allowances in excess of depreciation (£0.4 million) and capital losses (£1.1 million) in respect of the non-REIT taxable business have not been recognised due to uncertainty over the projected tax liabilities arising in the short term within the non-REIT taxable business. 21. OBLIGATIONS UNDER FINANCE LEASES Minimum lease Present value minimum payments of lease payments 2015 2014 2015 2014 £000 £000 £000 £000 Amounts payable under finance leases: Within one year Within two to five years inclusive Greater than five years Less: future finance charges Present value of lease obligations 1,735 6,942 24,529 1,646 7,954 28,355 1,705 6,077 13,047 1,615 6,973 15,226 33,206 37,955 20,829 23,814 (12,377) (14,141) 20,829 23,814 All lease obligations are denominated in sterling. Interest rates are fixed at the contract date. All leases are on a fixed repayment basis and no arrangements have been entered into for contingent rental payments. The carrying amount of the Group’s lease obligations approximates their fair value. 59 Big Yellow Group PLC Notes to the financial statements Year ended 31 March 2015 22. SHARE CAPITAL Authorised 2015 2014 £000 £000 20,000 Ordinary shares of 10 pence each 20,000 Called up, allotted and fully paid 2015 2014 £000 £000 15,806 Movement in issued share capital Number of shares at 31 March 2013 Exercise of share options – Share option schemes Number of shares at 31 March 2014 Exercise of share options – Share option schemes Share placing Number of shares at 31 March 2015 14,306 142,639,647 421,500 143,061,147 641,877 14,352,711 158,055,735 The Company has one class of ordinary shares which carry no right to fixed income. At 31 March 2015 options in issue to Directors and employees were as follows: Date option Granted 9 July 2008 3 August 2009 12 July 2010 28 February 2011 19 July 2011 12 March 2012 11 July 2012 12 March 2013 19 July 2013 25 February 2014 29 July 2014 16 March 2015 Option price per ordinary share nil p** nil p** nil p ** 263p * nil p ** 240p * nil p ** 305.5p * nil p ** 442.6p* nil p** 494.6p* Date first exercisable 9 July 2011 3 August 2012 12 July 2013 28 February 2014 19 July 2013 1 April 2015 11 July 2015 1 April 2016 19 July 2016 1 April 2017 29 July 2017 1 April 2018 Date on which the exercise period expires 8 July 2018 2 August 2019 11 July 2020 29 August 2014 19 July 2021 1 October 2015 10 July 2022 1 October 2016 19 July 2023 1 October 2017 29 July 2024 1 October 2018 Number of ordinary shares 2015 2,075 5,807 14,587 92,347 616,977 32,254 511,821 24,711 511,091 106,541 Number of ordinary shares 2014 7,320 5,625 14,049 24,471 485,582 99,088 621,977 38,954 514,821 25,686 - 1,918,211 1,837,573 * SAYE (see note 23) ** LTIP (see note 23) OWN SHARES The own shares reserve represents the cost of shares in Big Yellow Group PLC purchased in the market, and held by the Big Yellow Group PLC Employee Benefit Trust, along with shares issued directly to the Employee Benefit Trust. 1,500,000 shares are held in the Employee Benefit Trust (2014: 1,500,000), and 1,418,750 shares are held in treasury (2014: 1,418,750). 60 Big Yellow Group PLC Notes to the financial statements Year ended 31 March 2015 23. SHARE-BASED PAYMENTS The Company has four equity share-based payment arrangements, namely approved and unapproved share option schemes, an LTIP scheme, an Employee Share Save Scheme (“SAYE”) and a Long Term Bonus Performance Plan. The Group recognised a total expense in the year related to equity-settled share-based payment transactions of £2,059,000 (2014: £1,437,000). Equity-settled share option plans The Group granted options to employees under Approved and Unapproved Inland Revenue Share option schemes between November 1999 and November 2003. Since 2004 the Group has operated an Employee Share Save Scheme (“SAYE”) which allows any employee who has more than six months service to purchase shares at a 20% discount to the average quoted market price of the Group shares at the date of grant. The associated savings contracts are three years at which point the employee can exercise their option to purchase the shares or take the amount saved, including interest, in cash. The scheme is administered by Yorkshire Building Society. On an annual basis since 2004 the Group awarded nil-paid options to senior management under the Group’s Long Term Incentive Plan (“LTIP”). The awards are conditional on the achievement of challenging performance targets as described in the Remuneration Report. The awards granted in 2004, 2005 and 2006 vested in full. The awards granted in 2007 and 2009 lapsed, and the awards granted in 2008 and 2010 partially vested. The awards granted in 2011 fully vested in the year. The weighted average share price at the date of exercise for options exercised in the year was £5.40 (2014: £4.50). 14,350 options were exercised in the prior year for the “ESO” share option scheme. These were the last options remaining under this scheme. 2015 No. of options 2014 No. of options Outstanding at beginning of year Granted during the year Lapsed during the year Exercised during the year 1,649,374 724,345 (93,955) (617,406) 1,746,765 514,821 (213,310) (398,902) Outstanding at the end of the year 1,662,358 1,649,374 Exercisable at the end of the year 22,469 - LTIP scheme The weighted average fair value of options granted during the year was £907,000 (2014: £759,000). 61 Big Yellow Group PLC Notes to the financial statements Year ended 31 March 2015 23. SHARE BASED PAYMENTS (CONTINUED) Employee Share Save Scheme (“SAYE”) 2015 2014 Weighted Weighted 2015 average average No. of exercise price 2014 exercise price options (£) No of options (£) Outstanding at beginning of year Granted during the year Forfeited during the year Exercised during the year 188,199 106,541 (14,416) (24,471) 2.84 4.95 2.83 2.63 198,646 25,686 (27,885) (8,248) 2.61 3.04 2.74 2.55 Outstanding at the end of the year 255,853 3.74 188,199 2.84 Exercisable at the end of the year - - - - Options outstanding at 31 March 2015 had a weighted average contractual life of 2 years (2014: 1.8 years). The inputs into the Black-Scholes model are as follows: Expected volatility Expected life Risk-free rate Expected dividends LTIP SAYE 22% 3 years 0.7% 4.1% 24% 3 years 0.7% 4.1% Expected volatility was determined by calculating the historical volatility of the Group’s share price over the year prior to grant. Long Term bonus performance plan The Group has a joint share ownership plan in place. This is accounted for as an equity instrument. The plan was set up in November 2012. Directors have a partial interest in 1,500,000 shares with the Group’s Employee Benefit Trust. The fair value of each award is £2 subject to the vesting criteria as set out in the Directors’ Remuneration Report. At 31 March 2015 the weighted average contractual life was 0.6 years. 24. CAPITAL COMMITMENTS At 31 March 2015 the Group had capital commitments of £4.4 million in respect of the acquisition of a property in Cambridge, which completed on 1 April 2015. There were no other amounts contracted but not provided in respect of the Group’s properties as at 31 March 2015 (2014: no capital commitments). 25. EVENTS AFTER THE BALANCE SHEET DATE There are no reportable post balance sheet events. 62 Big Yellow Group PLC Notes to the financial statements Year ended 31 March 2015 26. RELATED PARTY TRANSACTIONS Transactions between the Company and its subsidiaries, which are related parties, have been eliminated on consolidation and are not disclosed in this note. Transactions with Big Yellow Limited Partnership As described in note 13, the Group had a 33.3% interest in Big Yellow Limited Partnership, and entered into transactions with the Partnership during the year on normal commercial terms as shown in the table below. From 1 December 2014 the Partnership was wholly owned by the Group and therefore from this date activity with the Partnership is no longer shown in this note. Transactions with Armadillo Storage Holding Company Limited As described in note 13, the Group has a 20% interest in Armadillo Storage Holding Company Limited, and entered into transactions with Armadillo during the period on normal commercial terms as shown in the table below. In the prior year fees earned from Armadillo were not a related party transaction. Transactions with Armadillo Storage Holding Company 2 Limited As described in note 13, the Group has a 20% interest in Armadillo Storage Holding Company 2 Limited, and entered into transactions with Armadillo during the period on normal commercial terms as shown in the table below. 31 March 2015 £000 Fees earned from Big Yellow Limited Partnership (to 30 November 2014) Fees earned from Armadillo 1 (since 16 April 2014) Fees earned from Armadillo 2 Balance due from the Partnership Balance due from Armadillo 1 Balance due from Armadillo 2 31 March 2014 £000 458 560 208 287 71 640 338 - AnyJunk Limited James Gibson is a Non-Executive Director and shareholder in AnyJunk Limited and Adrian Lee is a shareholder in AnyJunk Limited. During the year AnyJunk Limited provided waste disposal services to the Group on normal commercial terms, amounting to £24,000 (2014: £32,000). No other related party transactions took place during the years ended 31 March 2015 and 31 March 2014. 63 Big Yellow Group PLC Notes to the financial statements Year ended 31 March 2015 Ten Year Summary 2015 £000 2014 £000 2013 £000 2012 £000 2011 £000 2010 £000 2009 £000 2008 £000 2007 £000 2006 £000 Revenue 84,276 72,196 69,671 65,663 61,885 57,995 58,487 56,870 51,248 41,889 Operating profit before gains and losses on property assets 48,420 39,537 37,454 35,079 32,058 29,068 30,946 29,342 27,067 21,645 Cash flow from operating activities 42,397 32,752 30,186 27,388 23,534 19,063 10,203 14,388 16,726 16,125 105,236 59,848 31,876 (35,551) 6,901 10,209 (71,489) 102,618 152,837 118,547 39,405 29,221 25,471 23,643 20,207 16,514 13,791 15,006 14,233 12,601 750,914 594,064 552,628 494,500 544,949 547,285 502,317 580,886 487,979 244,139 27.1p 20.5p 19.3p 18.2p 15.5p 13.0p 11.9p 11.7p 10.0p 8.9p 21.7p 16.4p 11.0p 10.0p 9.0p 4.0p 0p 9.5p 9.0p 5.0p 69 3,178 66 2,832 66 2,632 65 2,458 62 2,130 60 1,915 54 1,775 48 1,850 43 1,835 37 1,672 346 47,250 200 41,800 174 38,500 328 36,300 215 32,800 140 30,500 (75) 28,500 15 30,500 163 30,100 202 27,800 300 289 286 279 273 252 239 218 191 178 Results Profit/(loss) before taxation Adjusted profit before taxation Net assets EPRA earnings per share Declared total dividend per share Key statistics Number of stores open Sq ft occupied (000) Occupancy increase in year 000 sq ft) Number of customers Average no. of employees during the year 64


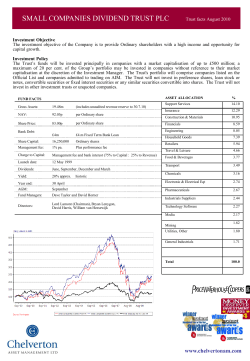


© Copyright 2026