
Delivering Performance - CapitaLand Retail China Trust
Delivering Performance
CapitaRetail China Trust
Annual Report 2014
Corporate Profile
First and only China shopping mall real estate
investment trust in Singapore
CapitaRetail China Trust (CRCT) is the first and only
People’s Republic of China shopping mall real estate
investment trust (REIT) in Singapore, with a portfolio
of 10 income-producing shopping malls. Listed on
the Singapore Exchange Securities Trading Limited
(SGX-ST) on 8 December 2006, it is established
with the objective of investing on a long-term basis
in a diversified portfolio of income-producing real
estate used primarily for retail purposes and located
primarily in China, Hong Kong and Macau.
The geographically diversified portfolio of quality
shopping malls is located in six of China’s cities.
The malls are CapitaMall Xizhimen, CapitaMall
Wangjing, CapitaMall Grand Canyon, CapitaMall
Anzhen and CapitaMall Shuangjing in Beijing;
CapitaMall Qibao in Shanghai; CapitaMall
Minzhongleyuan in Wuhan, Hubei Province;
CapitaMall Erqi in Zhengzhou, Henan Province;
CapitaMall Saihan in Huhhot, Inner Mongolia; and
CapitaMall Wuhu in Wuhu, Anhui Province.
All the malls in the portfolio are positioned as one-stop
family-oriented shopping, dining and entertainment
destinations for the sizeable population catchment
areas in which they are located, and are accessible
via major transportation routes or access points.
A significant portion of the properties’ tenancies
consists of major international and domestic retailers
such as Walmart, Carrefour and the Beijing Hualian
Group (BHG) under master leases or long-term
leases, which provide CRCT Unitholders with stable
and sustainable returns. The anchor tenants are
complemented by popular specialty brands such
as UNIQLO, ZARA, Vero Moda, Sephora, Watsons,
KFC, Pizza Hut and BreadTalk.
CRCT is managed by an external manager,
CapitaRetail China Trust Management Limited
(CRCTML or the Manager), which is an indirect
wholly-owned subsidiary of CapitaLand Limited,
one of Asia’s largest real estate companies
headquartered and listed in Singapore.
Vision
Sustainable and resilient REIT with a professionally
managed portfolio of quality retail real estate
across China.
Mission
Deliver sustainable income growth to our Unitholders
and value add to the community and stakeholders by
enhancing organic growth through proactive asset
management; creating new value through innovative
asset enhancement strategies; and capitalising on
yield-accretive acquisitions.
Contents
02
04
10
11
13
14
16
24
25
27
44
47
53
Financial Highlights
Letter to Unitholders
Trust Structure
Organisation Structure
Growth Strategies
Portfolio at a Glance
Board of Directors
Year in Brief
Trust Management Team
Corporate Governance
Enterprise Risk Management
Operations Review
Financial Review
56
59
61
63
64
66
68
76
147
148
150
IBC
Capital Management
Investor & Media Relations
Unit Price Performance
Corporate Social Responsibility
People & Talent Management
Portfolio Summary
Portfolio Details
Financial Statements
Interested Person Transactions
Unitholders’ Statistics
Mall Directory
Corporate Information
Delivering Performance
With a clear focus and disciplined approach towards executing our strategies, CapitaRetail China Trust
(CRCT) continued to deliver a strong performance in 2014. With our portfolio of 10 quality shopping malls
in major Chinese cities, we have leveraged on our expertise in proactive mall management and asset
enhancement to create resilient and growing returns for our Unitholders. CRCT will continue to strengthen
our portfolio and seek suitable expansion opportunities as we tap on China’s rising consumption to enhance
Unitholder value.
Highlights of 2014
Net Property
Income
Total Deposited
Properties
S$2.3
billion
S$132.4
million
Distribution
Per Unit
9.82
cents
Distributable
Income
10
S$80.9
Portfolio
Occupancy Rate
95.9%
million
properties
Aggregate
Leverage
Total Returns
for the Year
28.7%
28.4%
Annual
Shopper Traffic
Tenants’
Sales
89.8
RMB1,630
million
per square metre
Delivering Performance | 01
Financial Highlights
Gross Revenue (S$ million)
Net Property Income (S$ million)
132.41
203.31
152.5
119.0
2010
160.1
131.9
2011
77.2
2012
2013
2014
Distributable Income (S$ million)
2010
52.2
2010
103.0
2012
2013
85.8
2011
70.1
8.36
8.70
9.54
2010
1
9.02
9.82
57.2
2011
2012
2013
2014
2010
2011
2012
Net Asset Value Per Unit (S$)
1.17
2014
Distribution Per Unit (cents)
80.9
66.8
99.7
1.48
1.33
1.31
2011
2012
2013
1.63
2014
Includes new contribution from CapitaMall Grand Canyon which was acquired on 30 December 2013.
02 | CapitaRetail China Trust Annual Report 2014
2013
2014
Balance Sheet
As at 31 December
Total Assets (S$’000)
Total Deposited Properties2 (S$’000)
Net Assets Attributable to Unitholders
(S$’000)
Total Borrowings (S$’000)
Market Capitalisation (S$ million)
Net Asset Value Per Unit (S$)
Portfolio Property Valuation (S$’000)
Financial Ratios
As at 31 December
Earnings Per Unit (cents)
Distribution Per Unit (cents)
Net Tangible Assets Per Unit (S$)
Aggregate Leverage5 (%)
Interest Cover (times)
Management Expense Ratio6 (%)
Financial Derivatives
20101
20111
20121
20131
20141
1,274,478 1,536,268 1,648,791 2,184,291 2,358,062
1,229,196 1,482,001 1,623,824 2,155,554 2,328,008
734,507
401,958
775
1.17
1,215,089
913,839
433,048
792
1.33
1,440,620
978,742
465,847
1,232
1.31
1,476,988
1,186,951
713,458
1,068
1.48
2,058,094
1,349,738
672,893
1,337
1.63
2,250,7833
20101
17.84
8.36
1.17
31.1
6.2
1.0
20111
18.22
8.70
1.33
28.0
7.3
0.9
20121
19.524
9.54
1.31
28.0
8.5
1.0
20131
17.52
9.02
1.48
32.6
8.5
0.9
20141
17.69
9.82
1.63
28.7
5.6
1.0
As at 31 December
Net Fair Value of Financial Derivatives7 (S$ million)
Proportion of Financial Derivatives to Net Assets Attributable to Unitholders (%)
1
2
3
4
5
6
7
20141
(7.1)
(0.5)
The financial year from 1 January to 31 December.
All the assets of CRCT (or proportional share if CRCT owns less than 100% of a Barbados Company as defined in the CRCT Prospectus
dated 29 November 2006 (CRCT Prospectus) and/or a Project Company (as defined in the CRCT Prospectus)) including the properties
and all the authorised investment of CRCT for the time being held or deemed to be held upon the trust under the trust deed dated
23 October 2006 as amended by the First Supplemental Deed dated 8 November 2006, Second Supplemental Deed dated 15 April
2010, Third Supplemental Deed dated 5 April 2012 and Fourth Supplemental Deed dated 14 February 2014 (collectively, the Trust
Deed), and excluding undistributed income at the year end.
Based on valuation as at 31 December 2014. Portfolio property valuation included the valuation of the 10 malls and the carrying amount
of CapitaMall Minzhongleyuan’s three residential units. Refer to page 104 for the details of the valuers as at 31 December 2014.
The figure has been restated for the effect of preferential offering completed on 20 November 2013.
The aggregate leverage is calculated based on total borrowings and deferred payments over the total assets. Total assets included the
hedging effects on the net assets denominated in Renminbi (RMB).
Refers to the expenses of CRCT excluding property expenses and interest expenses but including performance component of CRCTML’s
management fees, expressed as a percentage of weighted average net assets.
Financial derivatives include non-deliverable forwards and interest rate swaps which CRCT entered into as a form of hedging against
the underlying foreign currency and interest rate risks. The net fair value derivative represented a negative 0.5% over the net assets of
CRCT as at 31 December 2014.
Delivering Performance | 03
Letter to Unitholders
(Left) Liew Cheng San Victor, Chairman
(Right) Tony Tan Tee Hieong, Chief Executive Officer
With CapitaMall Grand Canyon’s maiden contribution, gross revenue surged 24.2%
year-on-year to RMB987.6 million and net property income (NPI) increased 25.7% to
RMB643.1 million for FY 2014. Besides the lift provided by CapitaMall Grand Canyon’s
contribution, we also recorded robust organic growth in several of our other malls.
On a same mall basis1, gross revenue and net property income grew 6.8% and 9.2%
year-on-year respectively.
04 | CapitaRetail China Trust Annual Report 2014
Dear Unitholders,
On behalf of the Board of Directors of the Manager,
we are pleased to present the Annual Report for the
financial year ended 31 December 2014 (FY 2014).
Despite the headwinds in China’s economy in
FY 2014, we continued to press on and achieved
another year of solid performance.
Delivering strong performance
With CapitaMall Grand Canyon’s maiden contribution,
gross revenue surged 24.2% year-on-year to
RMB987.6 million and net property income (NPI)
increased 25.7% to RMB643.1 million for FY 2014.
Besides the lift provided by CapitaMall Grand
Canyon’s contribution, we also recorded robust
organic growth in several of our other malls. On a same
mall basis1, gross revenue and net property income
grew 6.8% and 9.2% year-on-year respectively.
For FY 2014, distributable income increased 15.4%
year-on-year to S$80.9 million. Unitholders received a
distribution per unit (DPU) of 4.99 cents in September
2014 and will be receiving a DPU of 4.83 cents in
March 2015. Total DPU for FY 2014 was 9.82 cents,
an 8.9% increase compared to FY 2013. Based on
CRCT’s closing price of S$1.615 on 31 December
2014, the distribution yield was 6.1%.
Our proactive approach towards mall management
has enabled us to stay ahead of our competition
and remain popular among tenants and shoppers.
For FY 2014, tenants’ sales increased 16.2%1 - above
the national average retail sales growth of 12.0%2 and shopper traffic grew 3.9%1. We committed 650
leases with an average increase of 23.1% over
preceding rental rates. The strong average increase
in rent was mainly attributed to CapitaMall Grand
Canyon’s robust rental reversion of 43.1%. CapitaMall
Wangjing and CapitaMall Saihan also recorded high
rental reversions of 29.8% and 20.7% respectively.
As at 31 December 2014, committed occupancy for
the portfolio remained high at 95.9%, and valuation
of our malls was RMB10.6 billion – 5.7% higher than
a year ago.
CRCT’s unit price appreciated 21.4% in FY 2014,
outperforming the Straits Times Index, the FTSE
Straits Times Real Estate Index and the FTSE
Straits Times Real Estate Investment Trust Index.
Including the distribution payout of 9.32 cents3,
CRCT generated a high total return of 28.4% for
Unitholders in FY 2014.
Positioning for growth
In end-2013, we completed the acquisition of
CapitaMall Grand Canyon, a quality shopping mall
located in Fengtai District, South Beijing. It is the third
largest property (based on NPI contribution) in our
portfolio and contributed 13.5% to FY 2014 NPI.
Upon completion of the acquisition, we reconfigured
the mall’s retail units to optimise the usage of
floor space, adjusted the tenant mix to meet the
changing needs and aspirations of our shoppers,
and organised many exciting marketing and
promotional events to drive shopper traffic and
tenants’ sales. We widened our food and beverage
(F&B) selections by bringing in popular F&B
tenants such as Nanjing Impressions (南京大牌档),
Golden Tripod Attic (金鼎轩), Sunshine Kitchen
(汤城小厨) and Childhood Villas (童年小筑).
Committed occupancy increased to 99.7% as at
31 December 2014 and rental reversion was a
strong 43.1% for FY 2014. We will continue to finetune our offerings and upgrade the infrastructure
to cater to our shoppers’ needs, and strengthen
our position in South Beijing. We are confident that
CapitaMall Grand Canyon will continue to be one
of our key growth engines in FY 2015.
On 1 May 2014, we reopened CapitaMall
Minzhongleyuan in Wuhan after a 10-month closure
to carry out extensive asset enhancement works.
We performed a major overhaul to reinforce the
building’s interior infrastructure and improve the
layout to achieve better efficiency and higher rentals.
We also rejuvenated the building’s façade while
retaining its historical charm, and differentiated our
offerings by introducing new-to-market concepts.
The revamped mall was well-received by both
tenants and shoppers.
In order to facilitate the construction of the new
subway Line 6 linking Hankou and Hanyang,
the Wuhan government announced on 1 August
2014 an extensive road closure at the section
of
Zhongshan
Avenue
where
CapitaMall
Minzhongleyuan is located. While we expect
shopper traffic and tenants’ sales to be temporarily
affected during this two-year road closure,
CapitaMall Minzhongleyuan stands to benefit
from greater accessibility once Line 6 becomes
operational by end-2016. It will also enjoy proximity
to the Jianghan Road subway interchange for Line
2 and Line 6, which is a critical transport hub linking
Hankou, Hanyang and Wuchang – the three main
areas of Wuhan.
Delivering Performance | 05
Letter to Unitholders
CapitaMall Wuhu, located in Wuhu – the second
largest city in Anhui Province – has been undergoing
major tenant adjustments to cater to the changing
environment. One of the key improvements included
reconfiguring Level 4 into an F&B and entertainment
zone. A popular buffet restaurant Guonei Guowai
(锅内锅外) will be opening in the rezoned area in the
second quarter of 2015. The mall is committed to
bring in more quality new retailers to enhance the
shopping experience.
We continue to unlock and enhance the value of
our two largest malls, CapitaMall Xizhimen and
CapitaMall Wangjing, in Beijing. We broadened
the F&B selections and refreshed the fashion and
beauty offerings in both malls. Established retailers
such as Green Tea (绿茶), Yun Hai Yao (云海肴),
Etude House, Charles & Keith and L’OCCITANE
opened to overwhelming response from shoppers.
Both malls achieved robust growth in FY 2014.
CapitaMall Xizhimen registered a 13.8% year-onyear increase in NPI, while CapitaMall Wangjing
recorded an 11.2% increase. With solid footfall and
rising tenants’ sales, both malls were able to retain
strong performing tenants while attracting popular
new retailers. We will continue to actively engage
our tenants and shoppers as we keep abreast of
the latest retail trends.
During the year, we successfully refinanced a
S$100.0 million loan with extended maturity to
2020. Overall cost of borrowings was 3.32%. As at
31 December 2014, CRCT’s borrowings totalled
S$672.9 million, of which 72.6% were fixed and
95.6% were unencumbered. Aggregate leverage
was a healthy 28.7%. To date, we have refinanced
the S$88.0 million term loan which matured in
February 2015.
Caring for the community
As our shopping malls form an integral part of the
communities where they are located, we are proud to
support various community programmes and adopt
green initiatives that promote sustainable growth.
Strengthening our financial position
In line with our prudent and proactive approach
towards capital management, we continued to
enhance our funding structure and strategy in
FY 2014.
In 2014, we carried out “My Schoolbag”, one of
CapitaLand’s key annual corporate social
responsibility programmes, for the fifth consecutive
year. Staff volunteers from CapitaMall Xizhimen,
CapitaMall Wangjing and CapitaMall Saihan
actively participated in this meaningful programme,
where new schoolbags are given to underprivileged
children. Last year, each schoolbag contained more
than 100 items, including arts and crafts materials
and a water bottle on top of basic stationery items.
Funding for the programme was donated by
CapitaLand Hope Foundation, the philanthropic
arm of CapitaLand, and our shoppers. This is the
first time that My Schoolbag has canvassed for
donations from the public. CapitaMall Wangjing and
CapitaMall Minzhongleyuan were among several
CapitaMalls in China that rallied shoppers to support
this meaningful cause.
We applied the Distribution Reinvestment Plan that
we established in March 2013 to the distributions
paid out in March 2014 and September 2014.
We received good support from our Unitholders,
with participation rates of 41.9% and 29.6%
respectively.
Our malls continued to make a positive impact on their
local communities in their own ways. For example,
CapitaMall Wangjing organised a winter clothes
donation drive for the poor in the rural regions of
West China, and CapitaMall Grand Canyon held
a charity concert to rally shoppers to donate
06 | CapitaRetail China Trust Annual Report 2014
necessities to orphans. CapitaMall Xizhimen and
CapitaMall Grand Canyon also held events for
shoppers to adopt stray cats and dogs.
We continued to step up efforts to conserve our
environment for future generations, and actively
engaged our stakeholders through a series of
activities to raise awareness of climate change and
to reduce energy consumption. A key highlight
was our annual participation in Earth Hour 2014,
when six of our malls – CapitaMall Xizhimen,
CapitaMall Wangjing, CapitaMall Grand Canyon,
CapitaMall Qibao, CapitaMall Saihan and CapitaMall
Wuhu – turned off their façade and non-essential
lights throughout the night.
As part of our green effort, CapitaMall Qibao set up
a rooftop farm to encourage urban residents to get
closer to nature and enjoy the process of growing
their own food. Since opening in 2013, the farm
has been gaining popularity among schools and
families. In an effort to promote green transportation,
CapitaMall Qibao also held a cycling event that
received overwhelming response from the local
communities.
Moving forward
China’s economy grew 7.4%2 and retail sales
increased 12.0%2 year-on-year to RMB26.2 trillion2
in 2014. Urban disposable income per capita and
expenditure per capita grew 9.0%2 and 5.8%2
year-on-year respectively.
In 2014, the Chinese government continued to place
a strong emphasis on quality long-term growth.
Going forward, the Chinese leaders have affirmed
that there will be greater focus on in-depth structural
reforms, which will drive domestic consumption and
support the governing of the country. We believe the
Chinese government’s efforts to build a sustainable
1
2
3
economy and enhance social stability will benefit
CRCT’s business in the long run. The Chinese
Academy of Social Sciences, China’s official
think-tank, has forecast 2015 GDP growth to be
around 7.0%.
In FY 2015, we will continue to strengthen the
competitiveness of our portfolio and ensure our malls
stay ahead of the game. With the financial flexibility
provided by our robust balance sheet, we are actively
looking out for suitable acquisition opportunities to
propel our next phase of growth. With our proven
track record, we are confident that CRCT will
continue to deliver sustainable and resilient growth
to our Unitholders in the coming year.
Acknowledgements
We wish to express our deepest appreciation to our
Board of Directors, shoppers, tenants, business
partners and staff for their contributions and
unwavering support in FY 2014.
We welcome Professor Tan Kong Yam, who joined
us on 31 October 2014. With his expertise and
experience, we are confident that he will contribute
significantly to our Board.
Last but not least, we thank you, our Unitholders,
for your confidence and trust in us. We look forward
to your continued support in 2015 and beyond.
Liew Cheng San Victor
Chairman
Tony Tan Tee Hieong
Chief Executive Officer
26 February 2015
Excluding CapitaMall Minzhongleyuan, which reopened on 1 May 2014 and CapitaMall Grand Canyon, which was acquired on
30 December 2013.
Source: National Bureau of Statistics of China.
Comprising DPU of 4.33 cents paid out in March 2014 and 4.99 cents paid out in September 2014.
Delivering Performance | 07
致信托单位持有人之信函
尊敬的信托单位持有人,
我们谨代表管理人董事会呈报截至2014年12月31日财政
年度(2014财年)的致信托单位持有人报告。
尽管中国经济在2014年增长放缓,凯德商用中国信托仍继
续前进并取得丰硕业绩。
业绩表现强劲
2014财年,首次贡献收入的凯德MALL•大峡谷推动总收
入同比去年剧增24.2%达9.876亿人民币,净物业收入增长
25.7%达6.431亿人民币。除了凯德MALL•大峡谷贡献收入
的有利因素外,其他购物中心也取得强劲的内部增长。按同
个购物中心基准1计算,总收入和净物业收入分别同比去年
增长6.8%和9.2%。
2014财年,可派发收入同比去年增加15.4%,达8,090万新
元。单位持有人在2014年9月获得每单位派息4.99新分,并
将在2015年3月获得每单位派息4.83新分。2014财年的每
单位派息总额为9.82新分,较2013财年增加8.9%。按凯德
商用中国信托于2014年12月31日的闭市价1.615新元计算,
派息率为6.1%。
积极的购物中心管理方式不仅让我们在竞争中保持领先
地位,还让我们继续受到租户以及消费者的欢迎。2014财
年,我们的租户销售额增长16.2%1(高于国内12.0% 2 的平
均零售销售额增长),客流则增长3.9%1。2014年度签定的
650份租约较之前租约平均租金增长23.1%;这主要归功
于凯德MALL•大峡谷,其租金大幅增加43.1%。此外,凯德
MALL•望京和凯德MALL•赛罕租金也分别大幅增加29.8%
和20.7%。截止至2014年12月31日,旗下购物中心的整体
出租率保持在95.9%的高位。整体购物中心估值也较去年
上升5.7%达106亿人民币。
2014财年,凯德商用中国信托的单位价格上升21.4%,表
现超越海峡时报指数、富时海峡时报不动产指数和富时
海峡时报不动产投资信托指数。包括9.32新分 3 的派息在
内,凯德商用中国信托于2014财年为单位持有人带来高达
28.4%的总回报。
蓄势待发
2013年底,我们完成了对凯德MALL•大峡谷的收购。这个
高品质的购物中心座落于北京南部的丰台区,是凯德商用
中国信托旗下的第三大物业,2014财年净物业收入占整体
的13.5%。
08 | CapitaRetail China Trust Annual Report 2014
收购完成后,我们重新规划购物中心的零售单位布局,优化
楼面空间的使用,调整租户组合,以满足消费者不断变化的
需求和期望。我们还组织了多场精彩的市场推广和促销活
动,以吸引客流和提高租户销售额。我们提供更多的餐饮选
择,引进南京大牌档、金鼎轩、汤城小厨和童年小筑等多家
受欢迎的餐饮品牌租户。截至2014年12月31日,出租率增至
99.7%,且2014财年租金大幅增长43.1%。我们将继续完善
品牌组合,提升基础设施,以迎合消费者的需求,巩固在北
京南部的地位。我们相信,凯德MALL•大峡谷在2015财年
仍将是凯德商用中国信托一个主要的增长引擎。
2014年5月1日,位于武汉的凯德新民众乐园在关闭10个月进
行大规模资产改良工程后重新开业。我们进行了重大翻修,
强化了大厦的内部基础设施,改善了布局,以提升使用效率
和提高租金。我们在保持大厦历史韵味的同时也修复了其外
立面,并通过引进首次登陆市场的零售概念,让我们的服务
脱颖而出。翻新后的购物中心深受租户和消费者欢迎。
为兴建连接汉口与汉阳的新地铁6号线,武汉政府在2014年
8月1日宣布,凯德新民众乐园所在的中山大道地段封路,为
期两年。尽管我们预期客流和租户销售额在封路期间会暂
时受到影响,但一旦6号线在2016年底开通运营后,该地区
的交通便利性将大幅度提升,凯德新民众乐园也会从中受
益。届时,该购物中心将邻近2号线与6号线的江汉路地铁
转换站,这是连接武汉三个主要区域汉口、汉阳和武昌的关
键交通枢纽。
位于安徽省第二大城市芜湖的凯德广场•芜湖,正在进行
大规模的租户调整以适应不断变化的环境。其中一项主要
改造工程包括将四楼改造成餐饮和休闲娱乐区。重新布局
后,时下颇受欢迎的自助餐厅锅内锅外将于2015年第二季
度进驻。该购物中心将竭力招揽更多高品质的新零售商进
驻,以提升购物体验。
我们将继续发掘并提升位于北京的两家最大购物中心凯
德MALL•西直门和凯德MALL•望京的价值。我们在该两
家购物中心引入更多的餐饮选择,并更新了时装和美容
品牌。绿茶、云海肴、Etude House、Charles & Keith
和L’OCCITANE等著名零售商的进驻,受到消费者的热
烈欢迎。2014财年,两家购物中心均实现强劲增长。凯德
MALL•西直门的净物业收入同比去年增长13.8%,而凯德
MALL•望京则增长11.2%。凭藉稳定的客流和不断增长的
租户销售额,两家购物中心在保留业绩表现优异的租户的
同时,也吸引新的知名品牌进驻。我们将继续紧贴最新的
零售潮流,积极与租户和消费者保持互动。
财务状况稳健
秉承审慎与积极的资本管理方法,我们在2014财年继续优
化资金架构和策略。
我们为2014年3月和2014年9月的派息,采用了于2013年
3月设立的配售再投资计划。此计划获得了单位持有人的
大力支持,参与度分别高达41.9%和29.6%。
在这一年内,我们成功为一笔1亿新元的借款进行再融资,
并将借款期延至2 02 0年。整体借款成本为3.32%。截至
2014年12月31日,凯德商用中国信托的总借款为6.729亿
新元,其中72.6%为定息借款,95.6%为无产权负担借款。
负债比率则为28.7%,表现稳健。迄今为止,我们已成功地
为于2015年2月到期的8,800万新元债务进行再融资。
关爱社会
凯德商用中国信托旗下的购物中心已成为所在社区不可或
缺的一部分,我们非常荣幸能够支持各项社区活动并通过
绿色行动推动可持续发展。
2014年,我们连续第五年参与凯德集团名为“凯德•我的第
一个书包”的标志性年度企业社会责任项目。凯德MALL•
西直门、凯德MALL•望京及凯德MALL•赛罕的员工踊跃参
与了此项有意义的活动,充当志愿者向弱势学生捐赠新书
包。去年,每个书包都包含100多件文具,除了基本的文具
外,还包括工艺美术材料以及一个水壶。该活动的资金由
凯德集团旗下的慈善专属基金凯德希望基金及消费者捐
赠。凯德MALL•望京和凯德新民众乐园连同其他凯德旗
下的购物中心,号召消费者支持此项有意义的活动,这是
凯德•我的第一个书包活动首次面向公众筹募善款。
我们的购物中心也继续以各自的方式在其所在的社区发挥
正面影响。例如,凯德MALL•望京为中国西部农村地区贫
困人士组织了一次冬衣募捐,而凯德MALL•大峡谷则举办
了一场慈善音乐会,呼吁消费者为孤儿捐赠生活必需品。
凯德MALL•西直门和凯德MALL•大峡谷还举办收养流浪
猫和流浪狗的活动。
为了下一代,我们继续努力保护环境,并通过一系列推动
改善气候变化和减少能源消耗的活动与我们的利益相关者
互动。其中一个亮点,是我们为响应2014年地球一小时活
动,把六家购物中心(凯德MALL•西直门、凯德MALL•望
京、凯德MALL•大峡谷、凯德七宝购物广场、凯德MALL•
赛罕及凯德广场•芜湖)的外墙灯和非主要的照明灯彻夜
关闭。
1
2
3
作为绿色行动的一部分,凯德七宝购物广场开辟屋顶农
场,鼓 励城镇 居民走 进 大自然,体 验自己种 植食 物的过
程。自2013年开办以来,该农场已受到了学校及家庭的热
烈欢迎。为倡导绿色出行,凯德七宝购物广场还举办了一
场骑自行车活动,在当地社区引起了热烈反响。
锐意进取
2014年,中国经济增长7.4% 2 ,零售销售额同比去年增长
12.0% 2,达26.2万亿人民币2。城镇居民人均可支配收入和
人均支出同比去年分别增长9.0% 2 和5.8%2。
2014年,中国政府继续着眼于高质量的长期增长。展望未
来,中国领导人已表明将更注重深层次的结构改革,从而
拉动内需,助力国家治理。长远而言,我们相信中国政府努
力推动经济的可持续发展和促进社会稳定,将有利于凯德
商用中国信托的业务。中国的官方智库中国社会科学院预
测,2015年的国内生产总值将会增长7.0%左右。
2015财年,我们将继续提高组合的竞争力,确保在竞争中
处于领先地位。凭藉稳健的资产负债表所带来的灵活融资
能力,我们正积极物色合适的收购机会,以期推进下一阶
段的增长。鉴于优异的业绩记录,我们相信凯德商用中国
信托将在来年继续为我们的单位持有人带来可持续和具韧
性的增长。
致谢
我们借此机会对董事会、消费者、租户、业务伙伴及员工于
2014财年作出的贡献及持续的支持表示深切的感激。
我们谨此欢迎陈光炎教授于2014年10月31日加入董事会。
相信他的专长及经验将会对董事会作出重大贡献。
最后,衷心感谢各位单位持有人一直以来对我们的信心及
信任。我们也期待在2015年及以后继续获得您的支持。
廖青山
主席
陈智雄
首席执行官
2015年2月26日
不包括于2014年5月1日重新开业的凯德新民众乐园和于2013年12月30日收购的凯德MALL•大峡谷。
资料来源:中国国家统计局。
包括于2014年3月支付的每单位派息4.33新分和于2014年9月支付的每单位派息4.99新分。
Delivering Performance | 09
Trust Structure
Singapore
Unitholders
Holding of Units
The Manager
CapitaRetail China Trust
Management Limited
Distributions
Management
Services
Trustee
Fees
Management
Fees
Acts on behalf
of Unitholders
The Trustee
HSBC Institutional
Trust Services
(Singapore) Limited
Barbados
Singapore
Dividends, Interest Income and Principal
Repayment of Shareholder’s Loans
Dividends
Ownership and Shareholder’s Loans
Ownership and Shareholder’s Loans
Singapore
Companies
Barbados
Companies
China
Dividends
51.0%
Ownership and
Shareholder’s
Loans
100% Ownership and
Shareholder’s Loans
Proportionate Share
of Dividends, Interest
Income and Principal
Repayment of
Shareholder’s Loans
100% Ownership and
Shareholder’s Loans
Project
Companies
Project
Company
Dividends, Interest Income and Principal
Repayment of Shareholder’s Loans
Net
Property
Income
Ownership
Properties
(Excluding
CapitaMall Wuhu)
Property
Management
Services
Property Manager’s
Fees
The Property
Managers
10 | CapitaRetail China Trust Annual Report 2014
Ownership
Net
Property
Income
CapitaMall
Wuhu
Property
Manager’s
Fees
Property
Management
Services
The Property
Manager
Organisation Structure
The Manager
CapitaRetail China Trust Management Limited
Board of Directors
Audit Committee
Chief Executive Officer
Finance Team
Investment and
Asset Management Team
Investor Relations Team
Delivering Performance | 11
Growth Strategies
Integrated Retail Real Estate Management Platform
CRCT enjoys access to CapitaLand’s integrated shopping mall business model, with in-house
capabilities in retail real estate investment, development, mall operations, asset management
and fund management.
Net Property Income
Distributions
Unitholders
Retail Real Estate
Ownership
Investment
Retail Real Estate Management
Property
Management
Retail
Management
& Operational
Leasing
Retail Real Estate Capital Management
Strategic
Marketing
Design &
Development
Management
As the Manager, we seek to drive continued
growth of CRCT through the following threepronged strategy:
1.Enhancing Organic Growth through Proactive
Asset Management
Most of our leases provide for an annual
step-up in the base rent and for rent to be payable
on the basis of the higher of either base rent or
a percentage of tenants’ gross sales turnover,
thereby providing stability and potential upside in
rental income.
Apart from organic growth through rental receipts,
we work closely with the mall managers to
identify improvements to the malls’ retail offerings
and tenant mix, and carry out marketing and
promotional initiatives to drive up shopper traffic
and non-rental income.
2.Creating New Value through Innovative Asset
Enhancement Strategies
We also actively explore innovative asset
enhancement initiatives to improve the returns
of our malls. These include the reconfiguration
of the retail units or floor plates to achieve better
efficiency and higher rental potential, and retrofitting and refurbishing the malls to maintain their
appeal to tenants and shoppers.
Asset
Management
Strategic
Planning &
Investment
Fund
Structuring &
Management
3.Capitalising on Yield-Accretive
Acquisitions Growth Model
We are always identifying and evaluating
yield-accretive acquisition opportunities
from our secured and proprietary pipeline,
and other third-party vendors.
CRCT is provided with long-term growth
potential from its rights of first refusal to
purchase assets held by CapitaMalls China
Income Fund, CapitaMalls China Income
Fund II (previously known as CapitaMalls
China Incubator Fund), CapitaMalls China
Income Fund III (previously known as
CapitaMalls China Development Fund II),
CapitaMalls China Development Fund III,
as well as CapitaMalls Asia, which is the
wholly-owned shopping mall business unit
of CapitaLand Limited, one of Asia’s largest
real estate companies headquartered and
listed in Singapore.
In evaluating acquisition opportunities, we
will focus on properties which can maintain
or enhance CRCT’s distribution yield; the
properties’ potential asset enhancement
opportunities; and properties with potential
to demonstrate strong growth in occupancy
rates, sustainable rental yields, and quality
tenant and lease profiles.
Delivering Performance | 13
Portfolio at a Glance
2. CapitaMall Wangjing
1. CapitaMall Xizhimen
3. CapitaMall Grand Canyon
4. CapitaMall Anzhen
5. CapitaMall Shuangjing
14 | CapitaRetail China Trust Annual Report 2014
6. CapitaMall Saihan
Beijing
1. CapitaMall Xizhimen
2. CapitaMall Wangjing
3. CapitaMall Grand Canyon
4. CapitaMall Anzhen
5. CapitaMall Shuangjing
Huhhot
6. CapitaMall Saihan
Zhengzhou
7. CapitaMall Erqi
Shanghai
8. CapitaMall Qibao
Wuhu
9. CapitaMall Wuhu
Wuhan
10. CapitaMall Minzhongleyuan
7. CapitaMall Erqi
9. CapitaMall Wuhu
8. CapitaMall Qibao
10.CapitaMall Minzhongleyuan
Delivering Performance | 15
Board of Directors
1
2
3
4
5
6
7
1
2
3
4
5
6
7
Liew Cheng San Victor
Lim Ming Yan
Fong Heng Boo
Christopher Gee Kok Aun
Ng Kok Siong
Professor Tan Kong Yam
Tony Tan Tee Hieong
16 | CapitaRetail China Trust Annual Report 2014
Chairman & Non-Executive Independent Director
Deputy Chairman & Non-Executive Non-Independent Director
Non-Executive Independent Director
Non-Executive Independent Director
Non-Executive Non-Independent Director
Non-Executive Independent Director
Chief Executive Officer & Executive Non-Independent Director
Liew Cheng San Victor, 68
Chairman
Non-Executive Independent Director
Bachelor of Social Sciences (Honours), University of Singapore
Date of first appointment as a director: 31 October 2006
Date of appointment as Chairman: 1 January 2009
Length of service as a director (as at 31 December 2014): 8 years 2 months
Board committee served on
•
Corporate Disclosure Committee (Chairman)
Present principal commitments
•
Accuron Technologies Limited (Director)
•
Allocated Bullion Solutions Pte. Ltd. (Chairman)
•
Catalist Advisory Panel (Member)
•
Singapore Aerospace Manufacturing Private Limited (Director)
•
Singapore Institute of Management (Vice-Chairman, Governing Council, Chairman, Investment
Committee and Member, Audit Committee and Nominating Committee)
•
Singapore Institute of Management Pte. Ltd. (Director)
Background and working experience
•
Corporate Advisor of Temasek Holdings (Private) Limited (From 2004 to June 2011)
•
Corporate Advisor of Singapore Technologies Pte Ltd (From February 2002 to 2004)
•
Executive Vice President, Global Markets and Treasury of Overseas Union Bank Limited (From
1980 to 2002)
Award
•
Public Service Star (2000)
Delivering Performance | 17
Board of Directors
Lim Ming Yan, 52
Deputy Chairman
Non-Executive Non-Independent Director
Bachelor of Engineering (Mechanical) and Economics (First Class Honours), University of
Birmingham, UK
Date of first appointment as a director: 1 January 2013
Date of appointment as Deputy Chairman: 1 January 2013
Length of service as a director (as at 31 December 2014): 2 years
Board committees served on
•
Corporate Disclosure Committee (Member)
•
Executive Committee (Chairman)
Present directorships in other listed companies
•
Ascott Residence Trust Management Limited (manager of Ascott Residence Trust) (Deputy
Chairman)
•
CapitaCommercial Trust Management Limited (manager of CapitaCommercial Trust) (Deputy
Chairman)
•
CapitaLand Limited
•
CapitaMall Trust Management Limited (manager of CapitaMall Trust) (Deputy Chairman)
Present principal commitments (other than directorships in listed companies)
•
Building and Construction Authority (Board Member)
•
Business China (Director)
•
CapitaLand China Holdings Pte Ltd (Chairman)
•
CapitaLand Hope Foundation (Director)
•
CapitaLand Limited (President & Group CEO)
•
CapitaLand Regional Investments Limited (Chairman)
•
CapitaLand Singapore Limited (Chairman)
•
CapitaMalls Asia Limited 1 (Chairman)
•
CTM Property Trust, Steering Committee (Chairman)
•
LFIE Holding Limited (Co-Chairman)
•
Shanghai YiDian Holding (Group) Company (Director)
•
Singapore-China Foundation Ltd. (Governor)
•
Singapore Tourism Board (Board Member)
•
The Ascott Limited (Chairman)
Directorship in other listed companies held over the preceding three years
•
Central China Real Estate Limited
Background and working experience
•
Chief Operating Officer of CapitaLand Limited (From May 2011 to December 2012)
•
CEO of The Ascott Limited (From July 2009 to February 2012)
•
CEO of CapitaLand China Holdings Pte Ltd (From July 2000 to June 2009)
Awards
•
Outstanding Chief Executive (Overseas) at the Singapore Business Awards 2006
•
Magnolia Award by the Shanghai Municipal Government in 2003 and 2005
1
Delisted on 22 July 2014.
18 | CapitaRetail China Trust Annual Report 2014
Fong Heng Boo, 65
Non-Executive Independent Director
Bachelor of Accountancy (Honours), University of Singapore
Date of first appointment as a director: 1 January 2013
Length of service as a director (as at 31 December 2014): 2 years
Board committee served on
•
Audit Committee (Chairman)
Present directorships in other listed companies
•
Asian American Medical Group Limited
•
Colex Holdings Limited
•
Pteris Global Limited
•
Sapphire Corporation Limited
Present principal commitments (other than directorships in listed companies)
•
Botanical Services Pty Ltd (Director)
•
CapitaLand Township Development Fund II Pte. Ltd. (Director)
•
CapitaLand Township Holdings Pte. Ltd. (Director)
•
Certis CISCO Security Pte. Ltd. (Director)
•
Council for Estate Agencies (Member, Licensing & Practice Committee and Member, Audit
Committee)
•
Eastern Health Alliance Pte. Ltd. (Director)
•
Surbana International Consultants Holdings Pte. Ltd. (Director)
Background and working experience
•
Director, Special Duties of Singapore Totalisator Board (From July 2004 to December 2014)
•
Senior Vice President, Corporate Services of Singapore Turf Club (From May 2000 to June 2004)
•
Deputy General Manager, Corporate Services of Singapore Turf Club (From May 1998 to May
2000)
•
Chief Financial Officer of Easycall International Pte Ltd/Matrix Telecommunications Ltd (From
June 1996 to April 1998)
•
General Manager, Corporate Services of Amcol Holdings Limited (From October 1993 to May
1996)
•
Assistant Auditor-General of Auditor-General’s Office (From February 1987 to September 1993)
•
Divisional Director of Auditor-General’s Office (From May 1980 to January 1987)
•
Auditor of Auditor-General’s Office (From November 1975 to April 1979)
Award
•
Institute of Certified Public Accountants of Singapore Silver Medal (1999)
Delivering Performance | 19
Board of Directors
Christopher Gee Kok Aun, 46
Non-Executive Independent Director
Bachelor of Arts in Law (Honours), University of Nottingham, UK
Member, The Institute of Chartered Financial Analysts
Date of first appointment as a director: 24 January 2014
Length of service as director (as at 31 December 2014): 11 months
Board committee served on
•
Audit Committee (Member)
Present principal commitments
•
Institute of Policy Studies, Lee Kuan Yew School of Public Policy, National University of
Singapore (Research Fellow)
•
Manas Asian Equities Value Fund (Director)
Background and working experience
•
Head, Singapore Equities Research of J.P. Morgan Securities Singapore Private Limited (From
July 2002 to February 2012)
•
Head, Asia Real Estate Equities Research of J.P. Morgan Securities Singapore Private Limited
(From September 2006 to February 2012)
•
Head, Singapore and Malaysia Equities Research of ING Barings Securities (From June 2000 to
June 2002)
•
Head, Malaysia Equities Research and Investment Analyst of ING Barings Securities Malaysia
Sdn. Bhd. (From June 1994 to June 2000)
•
Audit and Corporate Recovery of Price Waterhouse, London (From September 1990 to March
1994)
20 | CapitaRetail China Trust Annual Report 2014
Professor Tan Kong Yam, 59
Non-Executive Independent Director
Bachelor in Economics, Princeton University
PhD in Economics, Stanford University
Date of first appointment as a director: 31 October 2014
Length of service as a director (as at 31 December 2014): 2 months
Board committee served on
•
Audit Committee (Member)
Present principal commitments
•
APS Asset Management Pte Ltd (Director)
•
Changi Airport Group (Singapore) Pte. Ltd. (Director)
•
Nanyang Technological University of Singapore (Professor of Economics)
•
Surbana International Consultants Holdings Pte. Ltd. (Director)
Background and working experience
•
Senior Economist, Beijing Office of World Bank (From July 2002 to July 2005)
•
Member, Expert Group on the 11th Five Year Plan of World Bank (2004)
•
Chief Economist of The Ministry of Trade and Industry (From July 1999 to June 2002)
•
Head, Department of Business Policy at NUS Business School of National University of
Singapore (From 1988 to 1999)
Delivering Performance | 21
Board of Directors
Ng Kok Siong, 43
Non-Executive Non-Independent Director
Bachelor of Accountancy (Honours), Nanyang Technological University of Singapore
Date of first appointment as a director: 21 July 2009
Length of service as a director (as at 31 December 2014): 5 years 5 months
Board committees served on
•
Audit Committee (Member)
•
Corporate Disclosure Committee (Member)
•
Executive Committee (Member)
Present directorship in other listed companies
•
CapitaMalls Malaysia REIT Management Sdn. Bhd. (manager of CapitaMalls Malaysia Trust)
Present principal commitment (other than directorships in listed companies)
•
CapitaLand Limited (Chief Corporate Development Officer)
Background and working experience
•
Chief Financial Officer of CapitaMalls Asia Limited (From November 2009 to August 2014)
•
Senior Vice President, Strategic Finance of CapitaLand Limited (From October 2008 to
September 2009)
•
Senior Vice President, CapitaLand Eurasia of CapitaLand Limited (From January 2007 to
October 2008)
•
Vice President, Office of the President of CapitaLand Limited (From September 2005 to January
2007)
•
Strategy and Portfolio Manager of Shell Oil Products East (From August 2003 to September
2005)
•
Planning and Appraisal Advisor of Shell Oil Products East (From July 2001 to August 2003)
•
Regional Advisor of Exxon Mobil Asia Pacific Pte Ltd (From May 2000 to July 2001)
•
Global Analyst of Esso Coordination Centre N.V. (From January 1999 to May 2000)
•
Senior Planning Analyst of Esso Singapore Private Limited (From July 1998 to January 1999)
22 | CapitaRetail China Trust Annual Report 2014
Tony Tan Tee Hieong, 48
Chief Executive Officer
Executive Non-Independent Director
Bachelor of Accountancy, National University of Singapore
Master of Business Administration, University of Manchester
Date of first appointment as a director: 1 July 2010
Length of service as a director (as at 31 December 2014): 4 years 6 months
Board committee served on
•
Executive Committee (Member)
Background and working experience
•
Deputy CEO of CapitaRetail China Trust Management Limited (From April 2010 to June 2010)
•
Head, Finance of CapitaRetail China Trust Management Limited (From September 2007 to June
2010)
•
Asia Pacific Treasurer of IKEA (From August 1998 to September 2007)
•
Treasury Accountant of Wearnes International (From May 1995 to August 1998)
•
Money Market Dealer of Credito Italiano Bank (From April 1994 to May 1995)
•
Money Market Broker of Harlow Ueda Sassoon (From November 1992 to April 1994)
•
Auditor of Ernst & Young (From June 1991 to October 1992)
Delivering Performance | 23
Year in Brief 2014
Month
Events
January
Distributable income of S$70.1 million for the financial year ended 2013 was
4.9% higher than the previous year. Distribution per unit (DPU) for financial
year ended 2013 was 9.02 cents.
March
Paid a DPU of 4.33 cents to Unitholders for the period 1 July to 31 December
2013.
April
With strong contribution from the newly acquired CapitaMall Grand Canyon,
net property income (NPI) increased robustly by 25.0% and distributable
income grew 13.2% year-on-year for 1Q 2014.
Held its annual general meeting with all the resolutions duly passed.
May
CapitaMall Minzhongleyuan reopened after going through a major asset
enhancement initiative.
July
NPI increased 29.5% and distributable income grew 18.7% year-on-year for
2Q 2014.
Clinched the Bronze award for the Best Annual Report (REITs and Business
Trusts category) at the Singapore Corporate Awards 2014.
September
Paid a DPU of 4.99 cents to Unitholders for the period 1 January to 30 June
2014, an increase of 6.4% compared to the same period in the previous year.
October
NPI increased 29.2% and distributable income grew 14.1% year-on-year for
3Q 2014.
Participated in the “5th Singapore Corporate Governance Week – Statement of
Support” organised by Securities Investors Association (Singapore) in
demostration of CRCT’s commitment to good corporate governance.
24 | CapitaRetail China Trust Annual Report 2014
Trust Management Team (CRCTML)
Tony Tan Tee Hieong
Chief Executive Officer & Executive Director
Refer to the description under the section on Board of Directors.
INVESTMENT AND ASSET MANAGEMENT TEAM
The Investment and Asset Management Team is responsible for identifying and evaluating potential
acquisitions and investments, as well as formulating business and enhancement plans for CRCT’s
assets. They work closely with the property managers as well as the shopping malls’ centre
management to ensure that the plans are diligently implemented.
Tan Tze Wooi
Vice President, Investment and Asset Management
Tze Wooi has over 17 years of financial experience in real estate, corporate banking, credit and
auditing in Singapore and China. He was an Investment and Asset Manager for CapitaMalls Asia
before joining CRCTML. He is a Chartered Financial Analyst and holds a Bachelor of Accountancy
(Honours) from Nanyang Technological University, Singapore.
Toh Yee-Shui
Vice President, Investment and Asset Management
Yee-Shui has over 13 years of experience in the real estate and banking industry in Singapore and
China. He was an Investment and Asset Manager in China for CapitaMalls Asia before joining
CRCTML. He is a Chartered Financial Analyst and holds a Master of Science in Financial Engineering
from the National University of Singapore.
FINANCE TEAM
The Finance Team is responsible for all finance-related functions, including the preparation of
statutory accounts, budgeting, sourcing and management of funds, management of treasury and tax
affairs, compliance, liaison with external audit, and all other finance-related matters.
Joanne Tan Siew Bee
Head, Finance
Joanne has over 14 years of finance and accounting experience. She holds a professional degree
with the Association of Chartered Certified Accountants (ACCA) and is a Chartered Accountant of
Singapore.
Delivering Performance | 25
Trust Management Team (CRCTML)
FUND ANALYST
The Fund Analyst is responsible for developing and maintaining financial and asset models to
analyse the performance of CRCT at the property level, as well as preparing asset reports on the
assets.
Samantha Huang Yin
Executive, Investment and Asset Management
Samantha graduated with a Bachelor of Science in Real Estate from the National University of
Singapore in 2013. Prior to joining CRCTML, she gained internship and traineeship exposure in
various real estate firms.
INVESTOR RELATIONS MANAGER
The Investor Relations Manager is responsible for maintaining transparent communications with
Unitholders, potential investors and analysts through communication channels such as the annual
reports, press releases, presentations, roadshows and CRCT’s website.
Leng Tong Yan
Manager, Investor Relations
Tong Yan has over eight years of experience in auditing and investor relations. She was an Internal
Audit Manager with CapitaMalls Asia before joining CRCTML in May 2013. She holds a Bachelor of
Accountancy from Nanyang Technological University, Singapore and is a Chartered Accountant of
Singapore.
26 | CapitaRetail China Trust Annual Report 2014
Corporate Governance
OUR ROLE
Our primary role as the manager of CRCT (Manager) is to set the strategic direction of CRCT and
make recommendations to HSBC Institutional Trust Services (Singapore) Limited, in its capacity as
trustee of CRCT (Trustee), on acquisition, divestment and enhancement of the assets of CRCT in
accordance with its stated investment strategy. The research, evaluation and analysis required for
this purpose are coordinated and carried out by us as the Manager.
As the Manager, we have general powers of management over the assets of CRCT. Our primary
responsibility is to manage the assets and liabilities of CRCT for the benefit of the unitholders of
CRCT (Unitholders). We do this with a focus on generating rental income and enhancing asset value
over time so as to maximise the returns from the investments, and ultimately the distributions and total
returns to Unitholders.
Our other functions and responsibilities as the Manager include:
(a)
using our best endeavours to conduct CRCT’s business in a proper and efficient manner and to
conduct all transactions with, or on behalf of CRCT, at arm’s length;
(b) preparing annual business plans for review by the directors of the Manager (Directors),
including forecasts on revenue, net income and capital expenditure, explanations on major
variances to previous years’ plans, written commentaries on key issues and underlying
assumptions on rental rates, operating expenses and any other relevant assumptions;
(c)
ensuring compliance with relevant laws and regulations, including the Listing Manual of
Singapore Exchange Securities Trading Limited (SGX-ST) (Listing Manual), the Code on
Collective Investment Schemes (CIS Code) issued by the Monetary Authority of Singapore
(MAS) (including Appendix 6 of CIS Code (Property Funds Appendix)) and the tax rulings issued
by the Inland Revenue Authority of Singapore on the taxation of CRCT and Unitholders;
(d) attending to all regular communications with Unitholders; and
(e)
supervising CapitaLand Retail (Shanghai) Management & Consulting Co., Ltd. (Property
Manager), the property manager which performs the day-to-day property management
functions (including leasing, marketing, promotion, coordination and property management) for
CRCT’s malls.
CRCT, constituted as a trust, is externally managed by the Manager and therefore has no personnel
of its own. The Manager appoints experienced and well qualified management to run its day-to-day
operations. All Directors and employees of the Manager are remunerated by the Manager and not
CRCT.
The Manager was appointed in accordance with the terms of the trust deed constituting CRCT and
dated 23 October 2006 (as amended, varied or supplemented from time to time) (Trust Deed). The
Trust Deed also outlines certain circumstances under which the Manager can be removed, including
by notice in writing given by the Trustee upon the occurrence of certain events, or by a resolution
passed by a simple majority of Unitholders present and voting at a meeting of Unitholders duly
convened and held in accordance with the provisions of the Trust Deed.
The Manager is a subsidiary of CapitaLand Limited (CL) which holds a significant unitholding interest
in CRCT. CL is a long-term real estate developer and investor and has strong inherent interests in the
performance of CRCT. CL’s retention of a significant unitholding interest in CRCT ensures its
commitment to CRCT and aligns its interests with other Unitholders. The Manager’s association with
CL provides the following benefits, amongst other things, to CRCT:
(a)
stable pipeline of property assets through CL’s development activities;
Delivering Performance | 27
Corporate Governance
(b) wider and better access to banking and capital markets on favourable terms;
(c)
fund raising and treasury support; and
(d) access to a bench of experienced management talent.
OUR CORPORATE GOVERNANCE CULTURE
The Manager aspires to the highest standards of corporate conduct as guided by the Principles of
the Code of Corporate Governance 2012 (Code). The Manager believes in developing and
maintaining sound and transparent policies and practices to meet the specific business needs of
CRCT and to provide a firm foundation for a trusted and respected business enterprise. The Manager
remains focused on complying with the substance and spirit of the Principles of the Code while
achieving operational excellence and delivering CRCT’s long-term strategic objectives.
The Manager has received accolades from the investment community for excellence in corporate
governance. More details can be found in the Investor & Media Relations section on pages 59 to 60
of the Annual Report.
This report sets out the corporate governance practices for financial year (FY) 2014 with reference
to the Code. Where there are deviations from the principles and guidelines of the Code, an
explanation has been provided within this report.
(A) BOARD MATTERS
The Board’s Conduct of Affairs
Principle 1:
Every company should be headed by an effective Board to lead and control the company. The
Board is collectively responsible for the long-term success of the company. The Board works
with Management to achieve this objective and Management remains accountable to the Board.
The Manager is led by a board of Directors (Board) comprising a majority of non-executive
independent Directors. Each Director brings to the Board skills, experience, insights and sound
judgement, which together with his strategic networking relationships, serve to further the interests
of CRCT. At all times, the Directors are collectively and individually obliged to act honestly and with
diligence, and consider the best interests of Unitholders.
The Board oversees the affairs of the Manager, in furtherance of the Manager’s primary responsibility
to manage the assets and liabilities of CRCT for the benefit of Unitholders. The Board appoints the
Chief Executive Officer (CEO), who, assisted by the management team of the Manager
(Management), is responsible for the day-to-day management and overall operations of CRCT’s
business.
The Board provides leadership to the Management, sets strategic directions and oversees the
management of CRCT. The Board establishes goals for Management and monitors the achievement
of these goals. It ensures that proper and effective controls are in place to assess and manage
business risks and compliance with requirements under the Listing Manual, the Property Funds
Appendix, as well as any other applicable guidelines prescribed by the SGX-ST, the MAS or other
relevant authorities, and applicable laws. It also sets the disclosure and transparency standards for
CRCT and ensures that obligations to Unitholders and other stakeholders are understood and met.
The Board has reserved authority to approve certain matters and these include:
(a)
material acquisitions, investments, disposals and divestments;
(b) issue of new units;
(c)
income distributions and other returns to Unitholders; and
28 | CapitaRetail China Trust Annual Report 2014
(d) matters which involve a conflict of interest for a controlling unitholder or a Director.
Various Board Committees, namely the Audit Committee (AC), Corporate Disclosure Committee
(CDC) and Executive Committee (EC) have been constituted with clear written terms of reference to
assist the Board in the discharge of its functions. The composition of the various Board Committees
is set out on page 43 of the Annual Report.
Each of these Board Committees operates under delegated authority from the Board. The Board may
form other Board Committees as dictated by business imperatives. Membership of the various Board
Committees is managed to ensure an equitable distribution of responsibilities among Board
members, to maximise the effectiveness of the Board and to foster active participation and
contribution from Board members. Diversity of experience and appropriate skills are considered in
the composition of the respective Board Committees.
The Board has adopted a set of internal controls which establishes approval limits for, amongst other
things, capital expenditure, investments, divestments and debts. Apart from matters that specifically
require the Board’s approvals, the Board delegates authority for transactions below those limits to
Board Committees and Management. Approval sub-limits are also provided at management level to
optimise operational efficiency.
The Board meets at least once every quarter, and as required by business imperatives. Where
exigencies prevent a Director from attending a Board meeting in person, the Articles of Association
of the Manager permit the Director to participate via teleconferencing or video conferencing. The
Board and Board Committees may also make decisions by way of resolutions in writing.
A total of four Board meetings were held in FY 2014. A table showing the attendance record of
Directors at meetings of the Board and AC during FY 2014 is set out on page 43 of the Annual Report.
The Manager believes in the manifest contribution of its Directors beyond attendance at formal Board
and Board Committees meetings. To judge a director’s contributions based on his attendance at
formal meetings alone would not do justice to his overall contributions, which include being
accessible by Management for guidance or exchange of views outside the formal environment of
Board and Board Committees meetings.
The Manager provides suitable training for Directors. Upon appointment, each Director is provided
with a formal letter of appointment and is also given a copy of the Directors’ Manual (which includes
information on a broad range of matters relating to the role of a director). All Directors on appointment
are required to undertake an induction programme to familiarise themselves with matters relating to
the business activities of CRCT, its strategic directions and policies, the regulatory environment in
which CRCT operates and the Manager’s corporate governance practices. The Manager also
provides appropriate training for first-time directors including industry-specific knowledge.
Following their appointment, Directors are provided with opportunities for continuing education in
areas such as directors’ duties and responsibilities, changes to regulations and accounting
standards and industry-related matters, so as to be updated on matters that affect or may enhance
their performance as Directors or Board Committee members.
Delivering Performance | 29
Corporate Governance
Board Composition and Guidance
Principle 2:
There should be a strong and independent element on the Board, which is able to exercise
objective judgement on corporate affairs independently, in particular, from Management and
10% shareholders. No individual or small group of individuals should be allowed to dominate
the Board’s decision making.
The Board comprises individuals who are business leaders and professionals with financial, banking,
fund management, real estate, legal, investment and accounting backgrounds. The varied
backgrounds of the Directors enable Management to benefit from their external, diverse and
objective perspectives on issues brought before the Board. The size and composition of the Board
are reviewed regularly to ensure that the Board is of appropriate size and has an optimal mix of
expertise and experience, and comprises persons who, as a group, provide the necessary core
competencies, taking into consideration the nature and scope of CRCT’s operations.
The Board presently comprises seven Directors, of whom four are non-executive independent
Directors. The profiles of the Directors are set out on pages 17 to 23 of the Annual Report.
The independence of each Director is reviewed by the Board upon appointment, and thereafter
annually and as and when circumstances require. An independent director is one who has no
relationship with the Manager, its related corporations, its shareholders who hold 10% or more of the
voting shares in the Manager, or Unitholders who hold 10% or more of the units in issue of CRCT or
its officers that could interfere, or be reasonably perceived to interfere, with the exercise of the
Directors’ independent business judgement in the best interests of CRCT. The Board has determined
that Mr Liew Cheng San Victor, Mr Fong Heng Boo, Mr Christopher Gee Kok Aun and Professor Tan
Kong Yam are independent Directors under the Code.
Chairman and Chief Executive Officer
Principle 3:
There should be a clear division of responsibilities between the leadership of the Board and the
executives responsible for managing the company’s business. No one individual should
represent a considerable concentration of power.
To maintain an appropriate balance of power, increased accountability and greater capacity of the
Board for independent decision making, the roles and responsibilities of the Chairman and the CEO
are held by separate individuals.
The non-executive independent Chairman is responsible for leading the Board and ensuring that the
Board is effective on all aspects of its role. The CEO has full executive responsibilities over the
business directions and operational decisions of CRCT and is responsible for implementing CRCT’s
strategies and policies and for conducting CRCT’s business. The Chairman and the CEO are not
immediate family members. The separation of the roles of the Chairman and the CEO and the
resulting clarity of roles provide a healthy professional relationship between the Board and
Management and facilitate robust deliberations on the business activities of CRCT and the exchange
of ideas and views to help shape the strategic process.
The Chairman is responsible for leadership of the Board and for creating the conditions for overall
Board, Board Committee and individual Director effectiveness. This includes setting the agenda of
the Board in consultation with the CEO and promoting constructive engagement among the Directors
as well as between the Board and the CEO on strategic issues.
The Chairman plays a significant leadership role by providing clear oversight, advice and guidance
to the CEO and Management on strategies and business operations.
30 | CapitaRetail China Trust Annual Report 2014
Board Membership
Principle 4:
There should be a formal and transparent process for the appointment and re-appointment of
directors to the Board.
The Manager does not have a nominating committee. In view that the Manager is a dedicated
manager to only CRCT, and taking into account the activities and scale of business of CRCT, the
limited number of independent director appointment and the fact that independent directors
constitute more than half of the Board of the Manager, the Board considers that the objectives of a
nominating committee may be achieved by the full Board (of which comprises a majority of
independent Directors) undertaking the responsibilities of a nominating committee. Therefore, the
Board performs the functions that such a committee would otherwise perform, namely, it administers
nominations to the Board, reviews the structure, size and composition of the Board, and reviews the
independence of Board members. Directors of the Manager are not subject to periodic retirement by
rotation.
Under the Code, the composition of the Board, including the selection of candidates for new
appointments to the Board as part of the Board’s renewal process, is determined using the following
principles:
(a)
the Board should comprise Directors with a broad range of commercial experience, including
expertise in fund management, the property industry, banking and legal fields; and
(b) at least one-third of the Board should comprise independent Directors. Where, amongst other
things, the Chairman of the Board is not an independent Director, at least half of the Board
should comprise independent Directors.
Renewal or replacement of Board members do not necessarily reflect their contributions to date, but
may be driven by the need to position and shape the Board in line with the evolving needs of CRCT
and its business.
The selection of candidates is evaluated taking into account various factors including the current and
mid-term needs and goals of CRCT, as well as the relevant expertise of the candidates and their
potential contributions. Candidates may be put forward or sought through contacts and
recommendations.
Guideline 4.4 of the Code recommends that the Board determine the maximum number of listed
company board representations which any director may hold and disclose this in the annual report.
The Board is of the view that, the limit on the number of listed company directorships that an
individual may hold should be considered on a case-by-case basis, as a person’s available time and
attention may be affected by many different factors such as whether they are in full-time employment
and their other responsibilities. A Director with multiple directorships is expected to ensure that
sufficient attention is given to the affairs of the Manager in managing the assets and liabilities of
CRCT for the benefit of Unitholders. The Board believes that each individual Director is best placed
to determine and ensure that he is able to devote sufficient time and attention to discharge his duties
and responsibilities as a Director of the Manager, bearing in mind his other commitments. In
considering the nomination of Directors for appointment, the Board will take into account, amongst
other things, the competing time commitments faced by Directors with multiple Board memberships.
All Directors had confirmed that notwithstanding the number of their individual listed company board
representations and other principal commitments, which the Directors held, they were able to devote
sufficient time and attention to the affairs of the Manager in managing the assets and liabilities of
CRCT for the benefit of Unitholders. The Board is of the view that the current commitments of each
of its Directors are reasonable and each of the Directors is able to and has been adequately carrying
out his duties.
Delivering Performance | 31
Corporate Governance
Board Performance
Principle 5:
There should be a formal annual assessment of the effectiveness of the Board as a whole and
its board committees and the contribution by each director to the effectiveness of the Board.
The Manager believes that Board performance is ultimately reflected in the long-term performance
of CRCT.
The Board strives to ensure that there is an optimal blend in the Board of background, experience
and knowledge in business, finance and management skills critical to CRCT’s business and that each
Director could bring to the Board an independent and objective perspective to enable balanced and
well-considered decisions to be made in the interests of CRCT. Contributions by an individual Board
member can also take other forms, including providing objective perspectives on issues, facilitating
business opportunities and strategic relationships, and accessibility by Management outside of a
formal environment of Board and/or Board Committees meetings.
Reviews of Board performance are carried out on an informal basis. The Manager believes that
collective Board performance and that of individual Board members are better reflected in, and
evidenced by, its and their proper guidance, diligent oversight and able leadership, and the support
that it lends to Management in steering CRCT in the appropriate direction, and the long-term
performance of CRCT whether under favourable or challenging market conditions. The Board was
also able to assess the Board Committees through their regular reports to the Board on their
activities.
Access to Information
Principle 6:
In order to fulfil their responsibilities, directors should be provided with complete, adequate
and timely information prior to board meetings and on an on-going basis so as to enable them
to make informed decisions to discharge their duties and responsibilities.
The Manager recognises the importance of providing the Board with timely, adequate and relevant
information prior to Board meetings, and as and when the need arises.
As a general rule, Board papers are sent to Board members at least five working days prior to the
Board meeting to allow the members to prepare for the Board meetings and to enable the discussions
to focus on questions that the members may have. However, sensitive matters may be tabled at the
meeting itself or discussed without any papers being distributed.
In line with the Manager’s commitment to limit paper wastage and reduce its carbon footprint, the
Manager no longer provides printed copy of Board papers and Directors are instead provided with
tablet devices to enable them to access and read Board and Board Committee papers prior to and
at meetings. This initiative also enhances information security as the papers are downloaded to tablet
devices through an encrypted channel.
In addition to providing timely, adequate and relevant information to the Board on Board affairs and
issues requiring the Board’s decision, Management also provides on-going reports relating to the
operational and financial performance of the Manager, such as monthly management reports.
Where appropriate, informal meetings are also held for Management to brief Directors on prospective
deals and potential developments in the early stages before formal Board approval is sought.
The Board has separate and independent access to Management including the company secretary
of the Manager (Company Secretary) at all times. The Company Secretary attends to corporate
secretarial administration matters and is the corporate governance advisor on corporate matters to
the Board and Management. The Company Secretary attends Board meetings. The Board, whether
as individual Directors or as a group, is also entitled to have access to independent professional
advice where required, at the Manager’s expense.
32 | CapitaRetail China Trust Annual Report 2014
The AC also meets the internal auditors and external auditors separately at least once a year, without
the presence of the CEO and Management and has unfettered access to any information that it may
require.
(B) REMUNERATION MATTERS
Procedures for Developing Remuneration Policies
Principle 7:
There should be a formal and transparent procedure for developing policy on executive
remuneration and for fixing the remuneration packages of individual directors. No director
should be involved in deciding his own remuneration.
Level and Mix of Remuneration
Principle 8:
The level and structure of remuneration should be aligned with the long-term interest and risk
policies of the company, and should be appropriate to attract, retain and motivate (a) the
directors to provide good stewardship of the company, and (b) key management personnel to
successfully manage the company. However, companies should avoid paying more than is
necessary for this purpose.
Disclosure on Remuneration
Principle 9:
Every company should provide clear disclosure of its remuneration policies, level and mix of
remuneration, and the procedure for setting remuneration, in the company’s Annual Report. It
should provide disclosure in relation to its remuneration policies to enable investors to
understand the link between remuneration paid to directors and key management personnel,
and performance.
The Manager believes that a framework of remuneration for the Board and key executives should not
be taken in isolation. It should be linked to the building of management bench strength and the
development of key executives. This is to ensure continual development of talent and renewal of
strong and sound leadership for a sustainable business and a lasting company in the best interests
of CRCT.
The remuneration of the Directors and employees of the Manager is paid by the Manager, and not by
CRCT. As the Manager is a subsidiary of CL, it adheres to the remuneration policies and practices
of CL. The Manager therefore does not have a remuneration committee.
The Manager’s tapping on the compensation framework of CL puts the Manager in a better position
to attract better qualified management talent, who may otherwise not be attracted to a standalone
REIT manager. The Manager being a subsidiary of CL also provides an intangible benefit of allowing
its employees to be associated with a wider corporate group identity which can offer them the depth
and breadth of experience and career horizon and this enables the Manager to attract and retain
qualified individuals.
The Board has carefully considered the remuneration policies and practices of CL and is satisfied
that such policies and practices will provide the Manager with a suitable remuneration policy.
The Directors’ fees for FY 2014 are shown in the table on page 34 of the Annual Report. The CEO
does not receive any fees in his capacity as a Director. Directors’ fees generally comprise a basic
retainer fee as a Director, an additional fee for serving on any of the Board Committees and an
attendance fee for participation in meetings of the Board and any of the Board Committees, project
meetings and verification meetings.
Delivering Performance | 33
Corporate Governance
Non-executive Directors (save for Directors who are employees of CL or CapitaMalls Asia Limited
(CMA)) receive Directors’ fees which are payable by way of cash and units in CRCT (Units). The
Manager believes that the payment of a portion of the Directors’ fees in Units will serve to align the
interests of such Directors with that of Unitholders and CRCT’s long-term growth and value.
Director’s Fees 1,2
Board Members
Liew Cheng San Victor
Lim Ming Yan
FY 2013
S$129,000
S$129,000
4
S$117,000 3
S$11,143
S$91,000
6
S$76,000
S$68,291
N.A.
S$10,161
N.A.
4
S$94,000 3
N.A.
N.A.
N.A.
Chew Gek Khim 5
Fong Heng Boo
S$89,572
Christopher Gee Kok Aun
Professor Tan Kong Yam
FY 2014
7
8
Ng Kok Siong
Tony Tan Tee Hieong
N.A.
N.A.: Not Applicable.
1
2
3
4
5
6
7
8
Inclusive of attendance fees of (a) S$2,000 per meeting attendance in person, (b) S$1,700 per meeting attendance via
teleconferencing or video conferencing, and (c) S$1,000 per meeting attendance at project and verification meetings subject
to a maximum of S$10,000 per Director per annum. Directors’ fees are subject to the approval of the Manager’s sole
shareholder.
Each non-executive Director (save for non-executive Directors who are employees of CL or CMA) shall receive up to 20% of
his Directors’ fees in the form of Units (subject to rounding adjustments). The remainder of the Directors’ fees shall be paid
in cash. No new Units will be issued for this purpose as these Units will be paid by the Manager from the Units it holds.
In respect of non-executive Directors who are employees of CL or CMA, their Directors’ fees in respect of FY 2013 were paid
to CL and CMA respectively in cash.
With effect from FY 2014, non-executive Directors who are employees of CL or CMA do not receive Directors’ fees.
Chew Gek Khim resigned as a non-executive independent Director and ceased to be the Chairperson of the AC with effect
from 5 February 2014. All Directors’ fees paid and payable to Chew Gek Khim were paid/will be paid in cash.
Fong Heng Boo was appointed as Chairman of the AC with effect from 5 February 2014.
Christopher Gee Kok Aun was appointed as a non-executive independent Director and a member of the AC with effect from
24 January 2014.
Professor Tan Kong Yam was appointed as a non-executive independent Director and a member of the AC with effect from 31
October 2014.
(C) ACCOUNTABILITY AND AUDIT
Accountability
Principle 10:
The Board should present a balanced and understandable assessment of the company’s
performance, position and prospects.
The Manager provides Unitholders with quarterly and annual financial statements. In presenting the
annual and quarterly financial statements to Unitholders, the Board aims to provide Unitholders with
a balanced, clear and understandable assessment of CRCT’s performance, position and prospects.
In order to achieve this, Management provides the Board with management accounts on a monthly
basis and such explanation and information as any Director may require, to enable the Directors to
keep abreast, and make a balanced and informed assessment, of CRCT’s financial performance,
position and prospects.
The Manager believes in conducting itself in ways that seek to deliver maximum sustainable value to
Unitholders. Best practices are promoted as a means to build an excellent business for Unitholders
and the Manager is accountable to Unitholders for CRCT’s performance. Prompt fulfilment of
statutory reporting requirements is but one way to maintaining Unitholders’ confidence and trust in
the capability and integrity of the Manager.
34 | CapitaRetail China Trust Annual Report 2014
Risk Management and Internal Controls
Principle 11:
The Board is responsible for the governance of risk. The Board should ensure that
Management maintains a sound system of risk management and internal controls to safeguard
shareholders’ interests and the company’s assets, and should determine the nature and extent
of the significant risks which the Board is willing to take in achieving its strategic objectives.
The Manager has in place an adequate and effective system of internal controls addressing material
financial, operational, compliance and information technology risks to safeguard Unitholders’
interests and CRCT’s assets.
The Board has overall responsibility for the governance of risk and exercises oversight of the risk
management strategy and framework. The AC assists the Board in strengthening the Manager’s risk
management capabilities for CRCT and its subsidiaries (CRCT Group).
In carrying out this responsibility, in particular, the AC:
(a)
makes recommendations to the Board on risk appetite including associated risk parameters for
CRCT Group;
(b) oversees Management in the formulation, updating and maintenance of an adequate and
effective risk management framework, policies and strategies for managing risks that are
consistent with the approved risk appetite and parameters for CRCT Group and report to the
Board on its decisions on any material matters concerning the aforementioned;
(c)
makes the necessary recommendations to the Board such that an opinion and comment
regarding the adequacy and effectiveness of the risk management and internal control systems
can be made by the Board in the annual report of CRCT in accordance with the Listing Manual
and the Code; and
(d) reports to the Board on any material breaches of risk limits and the adequacy of any proposed
action.
The Manager adopts an Enterprise Risk Management (ERM) Framework which sets out the required
environmental and organisational components for managing risk in an integrated, systematic and
consistent manner. The ERM Framework and related policies are reviewed annually.
The Manager consistently seeks to improve and strengthen its ERM Framework. As part of the ERM
Framework, Management, amongst other things, undertakes and performs a Risk and Control
Self-Assessment (RCSA) process. As a result of the RCSA process, the Manager produces and
maintains a risk register which identifies the material risks CRCT Group faces and the corresponding
internal controls it has in place to manage or mitigate those risks. The material risks are reviewed
annually by the AC and the Board. The AC also reviews the approach of identifying and assessing
risks and internal controls in the risk register. The system of risk management and internal controls
is reviewed and, where appropriate, refined, regularly by Management, the AC and the Board.
The Manager has established an approach towards how risk appetite is defined, monitored and
reviewed for CRCT Group. Approved by the Board, the Risk Appetite Statement (RAS), addresses the
management of material risks faced by CRCT Group. Alignment of CRCT Group’s risk profile to the
RAS is achieved through various communication and monitoring mechanisms (including key
performance indicators set for Management) put in place across the various functions within the
Manager.
More information on CRCT’s ERM Framework can be found in the Enterprise Risk Management
section on pages 44 to 46 of the Annual Report.
Internal auditors and external auditors conduct audits that involve testing the effectiveness of the
material internal controls for CRCT Group addressing financial, operational, compliance and
information technology risks. This includes testing, where practical, material internal controls in areas
Delivering Performance | 35
Corporate Governance
managed by external service providers. Any material non-compliance or lapses in internal controls
together with corrective measures recommended by the internal auditors and external auditors are
reported to and reviewed by the AC. The adequacy and effectiveness of the measures taken by the
Manager in response to the recommendations made by the internal auditors and external auditors are
also reviewed by the AC.
The Board has received assurance from the CEO and the Head, Finance of the Manager that:
(a)
the financial records for CRCT Group have been properly maintained and the financial
statements for the year ended 31 December 2014 give a true and fair view of CRCT Group’s
operations and finances; and
(b) the system of risk management and internal controls in place for CRCT Group is adequate and
effective in addressing the material risks faced by CRCT Group in its current business
environment including material financial, operational, compliance and information technology
risks. The CEO and the Head, Finance of the Manager have obtained similar assurance from the
respective risk and control owners.
In addition, in FY 2014, the Board has received quarterly certification by Management on the integrity
of financial reporting and the Board has provided a negative assurance confirmation to Unitholders
as required by the Listing Manual.
Based on the ERM Framework established and the reviews conducted by Management and both the
internal auditors and external auditors, as well as the assurance from the CEO and the Head, Finance
of the Manager, the Board concurs with the recommendation of the AC and is of the opinion, that the
system of risk management and internal controls addressing material financial, operational,
compliance and information technology risks established by the Manager is adequate and effective
to meet the needs of CRCT Group in its current business environment as at 31 December 2014.
The Board notes that the system of risk management and internal controls established by the
Manager provides reasonable assurance that CRCT Group, as it strives to achieve its business
objectives, will not be significantly affected by any event that can be reasonably foreseen or
anticipated. However, the Board also notes that no system of risk management and internal controls
can provide absolute assurance in this regard, or absolute assurance against poor judgement in
decision making, human error, losses, fraud or other irregularities.
Audit Committee
Principle 12:
The Board should establish an Audit Committee with written terms of reference which clearly
set out its authority and duties.
The AC comprises four non-executive Directors, the majority of whom (including the Chairman of the
AC) are independent. The members bring with them invaluable recent and relevant managerial and
professional expertise in accounting and related financial management domains.
The AC has explicit authority to investigate any matter within its terms of reference. Management is
required to provide the fullest co-operation in providing information and resources, and in
implementing or carrying out all requests made by the AC. The AC has direct access to the internal
auditors and external auditors and full discretion to invite any Director or executive officer to attend
its meetings. Similarly, both the internal auditors and external auditors are given unrestricted access
to the AC.
The AC is guided by its terms of reference, in particular, the AC:
(a)
monitors and evaluates the effectiveness of the Manager’s system of risk management and
internal controls (including financial, operational, compliance and information technology
36 | CapitaRetail China Trust Annual Report 2014
controls and risk management policies and systems) through reviewing written reports from the
internal auditors and external auditors to ensure that where deficiencies in internal controls have
been identified, appropriate and prompt remedial action is taken by Management;
(b) reviews the significant financial reporting issues and judgements so as to ensure the integrity of
the financial statements of CRCT Group and any announcements relating to CRCT Group’s
financial performance;
(c)
reviews the effectiveness of the internal audit function;
(d) reviews the scope and results of the external audit and also assesses the cost effectiveness, the
independence and objectivity of the external auditors;
(e)
makes recommendations to the Board on the proposals to Unitholders on the appointment,
re-appointment and removal of the external auditors, and approving the remuneration of the
external auditors;
(f)
reviews and approves processes to regulate transactions involving an Interested Person (as
defined in Chapter 9 of the Listing Manual) and/or Interested Party (as defined in the Property
Funds Appendix) (each, an Interested Person) and CRCT and/or its subsidiaries (Interested
Person Transactions), in particular, ensuring compliance with the provisions of the Listing
Manual and the Property Funds Appendix relating to Interested Person Transactions; and
(g) reviews the policy and arrangements by which employees of the Manager and any other persons
may, in confidence, report suspected fraud or irregularity or suspected infringement of any laws
or regulations or rules or, raise concerns about possible improprieties in matters of financial
reporting or other matters with a view to ensuring that arrangements are in place for such
concerns to be raised and independently investigated, and for appropriate follow-up action to
be taken.
The AC has reviewed the nature and extent of non-audit services provided by the external auditors
during FY 2014 and the fees paid for such services. The AC is satisfied that the independence of the
external auditors has not been impaired by the provision of those services. The external auditors
have also provided confirmation of their independence to the AC. The aggregate amount of fees paid
and payable to the external auditors for FY 2014 was S$437,002 of which audit fees amounted to
S$429,002 and non-audit fees amounted to S$8,000.
In FY 2014, the AC also met with the internal auditors and external auditors, without Management’s
presence, to discuss the reasonableness of the financial reporting process, the system of internal
controls, and the significant comments and recommendations by the auditors. Where relevant, the
AC makes reference to the best practices and guidance in the Guidebook for Audit Committees in
Singapore and the practice directions issued from time to time in relation to Financial Reporting
Surveillance Programme administered by the Accounting and Corporate Regulatory Authority of
Singapore.
The Manager confirms, on behalf of CRCT, that CRCT complies with Rule 712 and Rule 715 of the
Listing Manual.
Internal Audit
Principle 13:
The company should establish an effective internal audit function that is adequately resourced
and independent of the activities it audits.
The Manager has in place an internal audit function supported by CL’s Internal Audit Department (CL
IA) which reports directly to the AC and administratively to the CEO. CL IA plans its internal audit
schedules in consultation with, but independently of, Management and its plan is submitted to the AC
Delivering Performance | 37
Corporate Governance
for approval prior to the beginning of each year. The AC also meets with CL IA at least once a year
without the presence of Management. CL IA has unfettered access to the Manager’s documents,
records, properties and employees, including access to the AC.
CL IA is a corporate member of the Singapore branch of the Institute of Internal Auditors Inc. (IIA),
which has its headquarters in the USA. CL IA subscribes to, and is guided by, the International
Standards for the Professional Practice of Internal Auditing (Standards) developed by the IIA and has
incorporated these Standards into its audit practices.
To ensure that internal audits are performed by competent professionals, CL IA recruits and employs
suitably qualified professional staff with the requisite skill set and experience.
CL IA identifies and provides training and development opportunities for its staff to ensure their
technical knowledge and skill set remain current and relevant.
(D) SHAREHOLDER RIGHTS AND RESPONSIBILITIES
Shareholder Rights
Principle 14:
Companies should treat all shareholders fairly and equitably, and should recognise, protect
and facilitate the exercise of shareholders’ rights, and continually review and update such
governance arrangements.
The Manager is committed to treating all Unitholders fairly and equitably and keeping all Unitholders,
other stakeholders and analysts informed of the performance and changes in CRCT or its business
which would be likely to materially affect the price or value of Units, on a timely and consistent basis,
so as to assist Unitholders and investors in their investment decisions.
The Manager provides accurate and timely disclosure of material information on the SGXNet.
All Unitholders are entitled to attend general meetings and are accorded the opportunity to
participate effectively and vote at general meetings. All Unitholders are also informed of the rules,
including voting procedures, governing such meetings.
Communication with Shareholders
Principle 15:
Companies should actively engage their shareholders and put in place an investor relations
policy to promote regular, effective and fair communication with shareholders.
The Manager has in place the Investor Relations and Corporate Communications team which
facilitates effective communication with Unitholders, analysts, fund managers and the media.
The Manager actively engages with Unitholders and has put in place a Unitholders’ Communication
and Investor Relations Policy (Policy) to promote regular, effective and fair communication with
Unitholders. The Policy is uploaded on CRCT’s website at www.capitaretailchina.com.
The Board has established the CDC which assists the Board in the discharge of its function to meet
the legal and regulatory obligations arising under the laws and regulations of Singapore relating to
and to conform to best practices in the corporate disclosure and compliance process.
More information on the Manager’s investor and media relations with Unitholders can be found in the
Investor & Media Relations section on pages 59 to 60 of the Annual Report and the Policy which is
available on CRCT’s website.
CRCT’s distribution policy is to distribute at least 90.0% of its distributable income (other than gains
from the sale of properties by CRCT which are determined to be trading gains), with the actual level
of distribution to be determined at the Manager’s discretion.
38 | CapitaRetail China Trust Annual Report 2014
Conduct of Shareholder Meetings
Principle 16:
Companies should encourage greater shareholder participation at general meetings of
shareholders, and allow shareholders the opportunity to communicate their views on various
matters affecting the company.
The Manager supports the principle of encouraging Unitholders’ participation and voting at general
meetings. Unitholders receive a CD containing the CRCT Annual Report (printed copies are available
upon request) and notice of the annual general meeting. As and when an extraordinary general
meeting is to be held, Unitholders will receive a copy of the circular which contains details of the
matters to be proposed for Unitholders’ consideration and approval. Notices of the general meetings
are also advertised in the press and issued via SGXNet.
At general meetings, Unitholders are encouraged to communicate their views on and discuss with the
Board and the Manager matters affecting CRCT. Representatives of the Trustee, Directors (including
the respective Chairpersons of the Board and the AC), the Manager’s senior management and the
external auditors, would usually be present at general meetings.
To safeguard Unitholders’ interests and rights, a separate resolution is proposed for each
substantially separate issue at general meetings. To ensure transparency in the voting process and
better reflect Unitholders’ interest, the Manager conducts poll voting for Unitholders/proxies present
at the meeting for all the resolutions proposed at the general meetings. The total number of votes cast
for or against the resolutions and the respective percentages are announced after the general
meetings via SGXNet. Minutes of the general meetings are taken and are available to Unitholders for
their inspection upon request.
Unitholders also have the opportunity to communicate their views and discuss with the Board and
Manager matters affecting CRCT after the general meetings.
(E) ADDITIONAL INFORMATION
Executive Committee
Apart from the AC and CDC, the Board has also established an EC.
The EC oversees the day-to-day activities of the Manager and that of CRCT, on behalf of the Board.
The EC is guided by its terms of reference, in particular, the EC:
(a)
reviews, endorses and recommends to the Board strategic directions and management policies
of the Manager in respect of CRCT;
(b) oversees operational, investment and divestment matters within its approved financial limits;
and
(c)
reviews management reports and operating budgets.
The members of the EC meet informally during the course of the year.
Dealings with Interested Persons
Review Procedures for Interested Person Transactions
The Manager has established internal control procedures to ensure that all Interested Person
Transactions are undertaken on an arm’s length basis and on normal commercial terms, which are
generally no more favourable than those extended to unrelated third parties, and are not prejudicial
to the interests of CRCT and Unitholders. In respect of such transactions, the Manager would have
to demonstrate to the AC that such transactions are undertaken on normal commercial terms and are
not prejudicial to the interests of CRCT and Unitholders which may include obtaining (where
practicable) third party quotations or obtaining valuations from independent valuers (in accordance
Delivering Performance | 39
Corporate Governance
with applicable provisions of the Listing Manual and the Property Funds Appendix). The internal
control procedures also ensure compliance with Chapter 9 of the Listing Manual and the Property
Funds Appendix.
In particular, the following procedures are in place:
Interested Person Transactions 1
Approving Authority,
Procedures and Disclosure
Below S$100,000 per transaction
•
Trustee
S$100,000 and above per transaction (which singly, or when
aggregated with other transactions 2 with the same Interested
Person in the same financial year is less than 3.0% of CRCT’s
latest audited net tangible assets/net asset value)
•
•
Trustee
Audit Committee
Transaction 2 which:
(a) is equal to or exceeds 3.0% of CRCT’s latest audited net
tangible assets/net asset value; or
(b) when aggregated with other transactions 2 with the same
Interested Person in the same financial year is equal to or
exceeds 3.0% of CRCT’s latest audited net tangible
assets/net asset value
•
•
•
Trustee
Audit Committee
Immediate announcement
Transaction 2 which:
(a) is equal to or exceeds 5.0% of CRCT’s latest audited net
tangible assets/net asset value; or
(b) when aggregated with other transactions 2 with the same
Interested Person in the same financial year is equal to or
exceeds 5.0% of CRCT’s latest audited net tangible
assets/net asset value
•
•
•
•
Trustee
Audit Committee
Unitholders
Immediate announcement
1
Excluding interested person transactions falling under the exceptions set out in Rules 915 and 916 of the Listing Manual.
2
Any transaction of less than S$100,000 in value is disregarded.
Role of the Audit Committee for Interested Person Transactions
The Manager’s internal control procedures are intended to ensure that Interested Person
Transactions are conducted at arm’s length and on normal commercial terms, and are not prejudicial
to CRCT and Unitholders’ interests.
The Manager maintains a register to record all Interested Person Transactions which are entered into
by CRCT (and the basis on which they are entered into, including the quotations obtained to support
such basis). All Interested Person Transactions are subject to regular periodic reviews by the AC,
which in turn obtains advice from CL IA, to ascertain that the guidelines and procedures established
to monitor Interested Person Transactions, including the relevant provisions of the Listing Manual and
the Property Funds Appendix, as well as any other guidelines which may from time to time be
prescribed by the SGX-ST, the MAS or other relevant authorities, have been complied with. The
review includes an examination of the nature of the transaction and its supporting documents or such
other information deemed necessary by the AC. If a member of the AC has an interest in a
transaction, he is to abstain from participating in the review and approval process in relation to that
transaction. In addition, the Trustee also reviews such audit reports to ascertain that the Listing
Manual and the Property Funds Appendix have been complied with.
Details of all Interested Person Transactions (equal to or exceeding S$100,000 each in value) entered
into by CRCT during FY 2014 are disclosed on page 147 of the Annual Report.
40 | CapitaRetail China Trust Annual Report 2014
Dealing with Conflicts of Interest
The following principles and procedures have been established to deal with potential conflicts of
interest which the Manager (including its Directors, executive officers and employees) may
encounter in managing CRCT:
(a)
the Manager is a dedicated manager to CRCT and will not manage any other REIT or be involved
in any other real property business;
(b) all resolutions at meetings of the Board in relation to matters concerning CRCT must be decided
by a majority vote of the Directors, including at least one non-executive independent Director;
(c)
in respect of matters in which CL and/or its subsidiaries have an interest, whether direct or
indirect, any nominees appointed by CL and/or its subsidiaries to the Board will abstain from
voting. In such matters, the quorum must comprise a majority of the non-executive independent
Directors and shall exclude such nominee Directors of CL and/or its subsidiaries;
(d) in respect of matters in which a Director or his associates have an interest, whether direct or
indirect, such interested Director will abstain from voting. In such matters, the quorum must
comprise a majority of the Directors and shall exclude such interested Director(s);
(e)
if the Manager is required to decide whether or not to take any action against any person in
relation to any breach of any agreement entered into by the Trustee for and on behalf of CRCT
with an affiliate of the Manager, the Manager is obliged to consult with a reputable law firm
(acceptable to the Trustee) which shall provide legal advice on the matter. If the said law firm
is of the opinion that the Trustee, on behalf of CRCT, has a prima facie case against the party
allegedly in breach under such agreement, the Manager is obliged to pursue the appropriate
remedies under such agreement; and
(f)
at least one-third of the Board shall comprise non-executive independent Directors.
Additionally, the Trustee has been granted rights of first refusal by CapitaMalls China Income Fund,
CapitaMalls China Income Fund II, CapitaMalls China Income Fund III, CapitaMalls China
Development Fund III and CMA over any proposed sale or certain proposed acquisitions (as the case
may be) of shares or equity interests in properties by CapitaMalls China Income Fund, CapitaMalls
China Income Fund II, CapitaMalls China Income Fund III, CapitaMalls China Development Fund III
and CMA in China.
In respect of voting rights where the Manager would face a conflict between its own interests and that
of Unitholders, the Manager shall cause such voting rights to be exercised according to the
discretion of the Trustee.
Dealings in Securities
The Manager has devised and adopted a securities dealing policy for the Manager’s officers and
employees which applies the best practices recommendations in the Listing Manual. To this end, the
Manager has issued guidelines to its Directors and employees as well as certain relevant executives
of the CL group, which sets out prohibitions against dealings in CRCT’s securities (i) while in
possession of material unpublished price sensitive information, (ii) during two weeks before the
release of CRCT’s results for the first three quarters, and (iii) during one month before the release of
CRCT’s full-year results. The Manager will also not deal in CRCT’s securities during the same period.
Under these guidelines, all Directors and employees of the Manager as well as certain relevant
executives of the CL group are directed to refrain from dealing in CRCT’s securities on short-term
considerations. They are also regularly reminded of laws against insider trading.
Delivering Performance | 41
Corporate Governance
(F) CODE OF BUSINESS CONDUCT
The Manager adheres to an ethics and code of business conduct policy which deals with issues such
as confidentiality, conduct and work discipline, corporate gifts and concessionary offers. Clear
policies and guidelines on how to handle workplace harassment and grievances are also in place.
The policies and guidelines are published on CL’s intranet which is accessible by all employees of
the Manager.
The policies that the Manager has implemented aim to help to detect and prevent occupational fraud
in mainly three ways.
First, the Manager offers fair compensation packages, based on practices of pay-for-performance
and promotion based on merit to its employees. The Manager also provides various healthcare
subsidies and financial assistance schemes to alleviate the common financial pressures its
employees face.
Second, clearly documented policies and work procedures incorporate internal controls which
ensure that adequate checks and balances are in place. Periodic audits are also conducted to
evaluate the efficacy of these internal controls.
Finally, the Manager seeks to build and maintain the right organisational culture through its core
values, educating its employees on good business conduct and ethical values.
Bribery and Corruption Prevention Policy
The Manager adopts a strong stance against bribery and corruption. In addition to clear guidelines
and procedures for the giving and receipt of corporate gifts and concessionary offers, all employees
of the Manager are required to make a declaration on an annual basis where they pledge to uphold
the Manager’s core values and not to engage in any corrupt or unethical practices. This serves as a
reminder to all employees to maintain the highest standards of integrity in their work and business
dealings.
The Manager’s zero tolerance policy towards bribery and corruption extends to its business dealings
with third parties. Pursuant to such policy, the Manager requires that certain agreements incorporate
anti-bribery and anti-corruption provisions.
Whistle-Blowing Policy
A whistle-blowing policy and other procedures are put in place to provide employees of the Manager
and parties who have dealings with the Manager with well defined, accessible and trusted channels
to report suspected fraud, corruption, dishonest practices or other improprieties in the workplace,
and for the independent investigation of any reported incidents and appropriate follow up action. The
objective of the whistle-blowing policy is to encourage the reporting of such matters – that employees
or external parties making any reports in good faith will be able to do so with the confidence that they
will be treated fairly, and to the extent possible, be protected from reprisal.
Anti-Money Laundering and Countering the Financing of Terrorism Measures
As a holder of a Capital Markets Services licence issued by the MAS, the Manager abides by the
MAS’ guidelines on the prevention of money laundering and countering the financing of terrorism.
Under these guidelines, the main obligations of the Manager are:
(a)
customer due diligence;
(b) suspicious transaction reporting;
42 | CapitaRetail China Trust Annual Report 2014
(c)
record keeping;
(d) employee screening; and
(e)
staff training.
The Manager has developed and implemented a policy on the prevention of money laundering and
terrorist financing and is alert at all times to suspicious transactions. Where there is a suspicion of
money laundering or terrorist financing, the Manager performs due diligence checks on its
counterparties in order to ensure that it does not enter into business transactions with terrorist
suspects or other high risk persons or entities. Suspicious transactions are also reported to the
Suspicious Transaction Reporting Office of the Commercial Affairs Department.
Under this policy, the Manager must retain all relevant records or documents relating to business
relations with its customers or transactions entered into for a period of at least five years following the
termination of such business relations or the completion of such transactions.
All prospective employees of the Manager are also screened against various lists of terrorist
suspects issued by the MAS. Periodic training is provided by the Manager to its Directors and
employees to ensure that they are updated and aware of applicable anti-money laundering and
terrorist financing regulations, the prevailing techniques and trends in money laundering and terrorist
financing and the measures adopted by the Manager to combat money laundering and terrorist
financing.
Composition and Attendance Record of Meetings of the Board and Board Committees
Attendance Record of
Meetings in FY 2014
Composition
Board
Audit
Committee
Audit
Committee
Corporate
Disclosure
Committee
Executive
Committee
Number of
Meetings
Held: 4
Number of
Meetings
Held: 4
Liew Cheng San Victor
–
Chairman
–
4 out of 4
N.A
Lim Ming Yan
–
Member
Chairman
3 out of 4
N.A.
Chairperson
–
–
1 out of 1
1 out of 1
Fong Heng Boo 2
Chairman
–
–
4 out of 4
4 out of 4
Christopher Gee
Kok Aun 3
Member
–
–
3 out of 4
3 out of 4
Ng Kok Siong
Member
Member
Member
4 out of 4
4 out of 4
Professor Tan
Kong Yam4
Member
–
–
N.A.
N.A.
–
–
Member
4 out of 4
N.A.
Board Members
Chew Gek Khim
1
Tony Tan Tee Hieong
N.A.: – Not Applicable.
1
2
3
4
Chew Gek Khim resigned as a non-executive independent Director and ceased to be Chairperson of the Audit Committee with
effect from 5 February 2014.
Fong Heng Boo was appointed as Chairman of the Audit Committee with effect from 5 February 2014.
Christopher Gee Kok Aun was appointed as a non-executive independent Director and a member of the Audit Committee with
effect from 24 January 2014.
Professor Tan Kong Yam was appointed as a non-executive independent Director and a member of the Audit Committee with
effect from 31 October 2014.
Delivering Performance | 43
Enterprise Risk Management
Risk management is an integral part of CRCT Group’s business at both the strategic and operational
level. A proactive approach towards risk management supports the attainment of CRCT Group’s
business objective and corporate strategy, thereby creating and preserving value.
The Manager of CRCT Group (Manager) recognises that risk management is about opportunities as
much as it is about threats. To capitalise on opportunities, the Manager has to take risks. Therefore,
risk management is not about pursuing risk minimisation as a goal but rather optimising the
risk-reward relationship, within known and agreed risk appetite levels. The Manager therefore takes
risks in a prudent manner for justifiable business reasons.
The Board of Directors of the Manager (Board) is responsible for the governance of risk across CRCT
Group. The responsibilities include determining CRCT Group’s risk appetite, overseeing CRCT
Group’s Enterprise Risk Management (ERM) Framework, regularly reviewing CRCT Group’s risk
profile, material risks and mitigation strategies, and ensuring the effectiveness of risk management
policies and procedures. For these purposes, it is assisted by the Audit Committee (AC) which
provides dedicated oversight of risk management at the Board level.
The AC comprises four independent board members and meets on a quarterly basis. The meetings
are regularly attended by the CEO as well as key management staff.
The Board has approved CRCT Group’s risk appetite which determines the nature and extent of
material risks which CRCT Group is willing to take to achieve its strategic objectives. CRCT Group’s
Risk Appetite (RAS) is expressed via formal high level and overarching statements. Having
considered key stakeholders’ interests, the RAS sets out explicit, forward-looking views of the CRCT
Group’s desired risk profile and is aligned to CRCT Group’s strategy and business plans.
ENTERPRISE RISK MANAGEMENT FRAMEWORK
ERM Framework
Risk Strategy
Risk
Identification
& Assessment
• Risk Appetite
• Risk & Control
Self-Assessment
• Investment Risk Evaluation
• Scenario Analysis
• Whistle-blowing/
Business Malpractice
Risk Monitoring • Key Risk Indicators
& Reporting
Risk
Response
• Accept
• Avoid
• Mitigate
• Transfer
Independent Review & Audit
Internal Control System
Board Oversight & Senior Management Involvement
Risk-Aware Culture
CRCT Group’s ERM Framework sets out the required environmental and organisational components
which enable CRCT Group to manage risks in an integrated, systematic and consistent manner. The
ERM Framework and related risk management policies are reviewed annually and are periodically
validated by external ERM consultants.
44 | CapitaRetail China Trust Annual Report 2014
A robust internal control system and an effective, independent review and audit process are the twin
pillars that underpin CRCT Group’s ERM Framework. While the line management is responsible for
the design and implementation of effective internal controls using a risk-based approach, the
outsourced Internal Audit team reviews such design and implementation to provide reasonable
assurance to the AC on the adequacy and effectiveness of the internal control system.
Annually, the Manager facilitates and coordinates CRCT’s Group-wide Risk and Control SelfAssessment (RCSA) exercise that requires respective risk and control owners to proactively identify,
assess and document material risks as well as the corresponding key controls and mitigating
measures needed to address them. Material risks and their associated controls are consolidated and
reviewed by the Manager before they are presented to the AC and the Board.
Awareness of and preparedness for potential risks affecting CRCT Group’s business continuity helps
the Manager to minimise the impact of disruption to its business operations. CRCT Group has in
place a business continuity plan. In addition, the outsourced Information Techolology (IT) team has
also put in place a disaster recovery strategy, which is reviewed and tested on an annual basis.
The Manager believes that having the right risk culture and people with the right attitude, values and
knowledge are fundamental to CRCT Group’s success. Therefore, the Manager works closely with
CapitaLand’s Risk Assessment Group to proactively enhance risk management knowledge within
CRCT Group and promote a culture of risk awareness.
MANAGING MATERIAL RISKS
The Manager undertakes an iterative and comprehensive approach to identifying, managing,
monitoring and reporting of material risks across CRCT Group. Such material risks include:
ACTS OF GOD AND PANDEMIC
Natural disasters, catastrophes and pandemic events are beyond CRCT Group’s control. Such
events may significantly damage our properties or disrupt our operations and reduce shopper traffic.
This could lead to loss of income for our tenants and possibly defaults on lease payments, resulting
in adverse effect on our business and financial conditions. The Manager manages such risks through
established crisis management standard operating procedures at each property.
COMPETITION RISK
CRCT Group faces keen competition from established players and new market entrants in the
property industry. It adopts a relentless approach towards strengthening its competitiveness through
high-quality products and services, product differentiation, pricing, asset enhancement initiatives
and branding. CRCT Group also promotes shopper loyalty through shopper-centric initiatives and
shopper loyalty programmes.
ECONOMIC RISK
CRCT Group is exposed to economic, financial and property markets developments in major cities
in China. These developments may reduce revenue, increase costs and result in downward
revaluation of our assets. Market illiquidity during a financial crisis makes asset divestment
challenging and this can affect CRCT Group’s investment, financial and strategic objectives. The
Manager manages this by adopting a disciplined approach towards financial management and
having a balanced portfolio.
FOREIGN EXCHANGE RISK
CRCT Group is exposed to Chinese Renminbi (RMB) flutuation against Singapore Dollar which is the
distribution pay out currency. Where possible, CRCT Group adopts a natural hedging by borrowing
in RMB which matches the revenue stream generated from its investments. Non-RMB denominated
Delivering Performance | 45
Enterprise Risk Management
term loans are hedged via non-deliverable forwards so as to match its underlying assets which are
denominated in RMB. In relation to CRCT Group’s overseas investments in foreign subsidiaries whose
net assets are exposed to currency translation risk and are held for long term investment purposes,
the differences arising from such translation are captured under foreign currency translation reserve
which are reviewed and monitored on a regular basis.
INFORMATION TECHNOLOGY RISK
The outsourced IT team has put in place policies and procedures to manage IT risks. These policies
and procedures govern IT security, vendor selection, access controls and data security. Disaster
recovery testing is conducted regularly to validate the system continuity plan that is put in place. In
addition, network penetration testing is also conducted regularly to check for potential security gaps.
INTEREST RATE RISK
Some of CRCT Group’s existing debt carry floating interest rates, and consequently, the interest cost
to CRCT Group for such loans will be subjected to fluctuations in interest rates. As part of CRCT
Group’s active capital management strategy, the Manager enters into hedging transactions to
partially mitigate the risk of such interest rate fluctuations through the use of interest rate swaps
and/or fixed rate borrowings. The exposure to interest rate risk is further managed through regular
reviews with senior management on the optimal mix of fixed and floating rate borrowings. In addition,
debt portfolio is reviewed on an on-going basis, taking into account the investment holding period
and nature of the assets.
LIQUIDITY RISK
The Manager actively monitors CRCT Group’s debt maturity profile, operating cash flow and the
availability of funding so as to ensure sufficient funds are available to meet its capital, refinancing
and operating needs. To manage liquidity risk, CRCT Group seeks to maintain adequate levels of
liquid resources to cover its working capital obligations. Moreover, CRCT Group has access to debt
capital market through its Medium Term Note (MTN) Programme to raise funds for acquisition,
development and/or refinance maturing debt. CRCT Group’s ability to raise funds from both banks
and debt capital markets has enabled it to diversify it sources of funding to avoid over-reliance on
any single source of funding.
POLITICAL AND POLICY RISK
CRCT Group’s properties and investments are mainly in China, where it could be exposed to political
and policy risks such as political leadership uncertainty, inconsistency in public policies, social
unrest, etc. Such risks could result in the deterioration of the economic or social conditions and affect
the financial viability of CRCT Group’s investments or even the control of assets. To mitigate these
risks, overseas operations are managed by experienced management teams supported by local
teams who are familiar with the local conditions and culture.
46 | CapitaRetail China Trust Annual Report 2014
Operations Review
Committed Occupancy Rates
As at
31 December 2014 1
%
As at
31 December 2013 1
%
97.0
99.3
99.7
73.9 2
96.1
100.0
73.9 4
100.0
100.0
100.0
95.9
98.3
99.0
95.9
N.A. 3
97.1
99.9
90.9
100.0
100.0
100.0
98.2
CapitaMall Xizhimen
CapitaMall Wangjing
CapitaMall Grand Canyon
CapitaMall Minzhongleyuan
CapitaMall Qibao
CapitaMall Saihan
CapitaMall Wuhu
CapitaMall Anzhen
CapitaMall Shuangjing
CapitaMall Erqi
CRCT Portfolio
N.A.:
1
2
3
4
Not Applicable
Based on committed leases.
Impacted by road closure to facilitate the construction of a new subway line.
CapitaMall Minzhongleyuan is excluded as the mall was closed temporarily from 1 July 2013 to 30 April 2014 to carry out asset
enhancement initiative.
Tenancy adjustment to differentiate market positioning from competing malls.
Shopper Traffic 1
CapitaMall Xizhimen
CapitaMall Wangjing
CapitaMall Grand Canyon
CapitaMall Minzhongleyuan
CapitaMall Qibao
CapitaMall Saihan
CapitaMall Wuhu
CRCT Portfolio
2014
Million
2013
Million
36.9
10.4
9.5
4.1 3
13.2
8.9
6.8
89.8
34.9
10.6
N.A. 2
N.A. 2
11.5
8.4
7.9
73.3
N.A.: Not Applicable
1
CapitaMall Anzhen, CapitaMall Shuangjing and CapitaMall Erqi do not have traffic counters.
2
CapitaMall Grand Canyon is excluded as its acquisition was completed on 30 December 2013. CapitaMall Minzhongleyuan
is excluded as the mall was closed temporarily from 1 July 2013 to 30 April 2014.
3
Shopper traffic for CapitaMall Minzhongleyuan is from 1 May 2014 to 31 December 2014 as the mall reopened on 1 May 2014
after completion of asset enhancement initiative.
Portfolio Tenants’ Sales (RMB per square metre) 1
1,846
1,541
1,516
1,327
1Q
1,629
1,403
1,356
2Q
1,403
3Q
2013
1
1,630
1,522
4Q
Ful l Year
2014
Based on tenants’ sales (excluding Department Stores and Supermarkets) from CapitaMall Xizhimen, CapitaMall Wangjing,
CapitaMall Qibao, CapitaMall Saihan and CapitaMall Wuhu. Prior year’s numbers have been restated for comparative
purposes.
Delivering Performance | 47
Operations Review
Lease Expiry Profile
CapitaMall Anzhen, CapitaMall Erqi and the majority of the Gross Rentable Area (GRA) of CapitaMall
Shuangjing are let out under master-leases. The master-leases are long-term with a typical tenure of
20 years which help to ensure stable cash flows. For tenants which are not under master-leases, the
typical lease term is 15 to 20 years for anchor tenants, five to seven years for mini-anchor tenants and
up to three years for specialty tenants.
New Leases and Renewals
Number of New
Leases/Renewals
in FY 2014 1
Variance Over
Preceding
Rental 2,3
%
125
134
96
88
147
60
650
15.6
29.8
43.1
10.9
20.7
1.2
23.1
CapitaMall Xizhimen
CapitaMall Wangjing
CapitaMall Grand Canyon
CapitaMall Qibao
CapitaMall Saihan
CapitaMall Wuhu
CRCT Portfolio 4
1
2
3
4
Excludes new leases at newly created lettable area, short-term renewals (< 1 year), units vacant for >= 1 year and
pre-terminated leases.
Excludes turnover rent component.
Majority of leases have rental escalation clauses.
Excludes CapitaMall Minzhongleyuan as the mall was closed temporarily from 1 July 2013 to 30 April 2014 for asset
enhancement initiative.
Weighted Average Lease Expiry by Mall
(As at 31 December 2014)
Weighted Expiry
(by Total Rental Income)
Years
Weighted Expiry
(By Net Lettable Area
(NLA))
Years
CapitaMall Xizhimen
5.4
2.8
CapitaMall Wangjing
7.5
3.5
CapitaMall Grand Canyon
8.5
4.6
CapitaMall Minzhongleyuan
1.5
1.4
CapitaMall Qibao
4.5
2.9
CapitaMall Saihan
6.6
3.3
CapitaMall Wuhu
4.2
2.8
CapitaMall Anzhen
10.6
10.6
CapitaMall Erqi
11.9
11.9
CapitaMall Shuangjing
9.0
8.5
CRCT Portfolio
9.0
6.7
48 | CapitaRetail China Trust Annual Report 2014
Lease Expiry Profile for 2015 By Mall
(As at 31 December 2014)
Total Rental
Income/month
% of
RMB’000
Total 3
NLA
CapitaMall
CapitaMall
CapitaMall
CapitaMall
CapitaMall
CapitaMall
CapitaMall
1
2
3
Xizhimen
Wangjing
Grand Canyon
Minzhongleyuan
Qibao
Saihan
Wuhu
No. of
leases 1
sq m
% of
Total 2
82
99
112
168
53
112
62
9,778
6,243
6,080
7,891
7,459
8,014
3,209
19.3%
11.5%
13.5%
34.3%
14.6%
26.1%
8.6%
6,180
4,018
3,411
2,794
1,475
2,043
744
28.9%
23.7%
30.0%
60.2%
18.7%
46.2%
38.2%
Based on all committed leases as at 31 December 2014.
As percentage of each mall’s total NLA as at 31 December 2014.
As percentage of each mall’s total rental income for the month of December 2014.
Portfolio Lease Expiry Profile
(As at 31 December 2014)
66.9
35.4
24.3
19.5
11.8
10.2
7.5
2015
2016
% of Total NLA for the month of December 2014
9.0
5.9
5
4 .8
20 1 7
2 01 8
Beyond 2 0 1 8
% of Total Rental Income for the month of December 2014
Delivering Performance | 49
Operations Review
Turnover Rent
CRCT’s favourable lease structure helps to provide Unitholders with a stable and growing rental cash
flow. Most of the leases for the anchors, mini-anchors and specialty tenants have an annual step-up
in the base rent. In addition, most of the leases also contain provisions for rent to be payable at the
applicable base rent or at a percentage of sales turnover, whichever is higher. The combination of
direct point-of-sales systems, system link-up with tenants’ point-of-sales and central cashier systems
at our malls allows us to keep track of tenants’ sales. The long-term master leases at CapitaMall
Anzhen, CapitaMall Erqi and CapitaMall Shuangjing contain provisions for upside in rental through
step-ups in the base rent. In addition, the master leases at CapitaMall Anzhen and CapitaMall Erqi
provide further potential upside through a percentage of tenants’ sales turnover if the turnover
exceeds an agreed threshold.
Committed Leases with Turnover Rent
Provisions by Total Rental Income (%)
(As at 31 December 2014)
Committed Leases with Turnover Rent
Provisions by NLA (%)
(As at 31 December 2014)
Committed Leases with Turnover Rent Provisions
85.1%
Committed Leases with Turnover Rent Provisions
72.0%
Committed Leases without Turnover Rent Provisions
14.9%
Committed Leases without Turnover Rent Provisions
28.0%
Trade Sector Analysis
by Total Rental Income (%)
(As at 31 December 2014)
Fashion & Accessories
Food & Beverage
Department Store
Supermarket
Beauty & Healthcare
Shoes & Bags
Houseware & Furnishings
Leisure & Entertainment
Education
Others
Trade Sector Analysis
by Committed NLA (%)
(As at 31 December 2014)
28.4
21.8
14.6
9.4
7.7
3.4
2.8
2.6
2.4
6.9
50 | CapitaRetail China Trust Annual Report 2014
Fashion & Accessories
Food & Beverage
Department Store
Supermarket
Beauty & Healthcare
Shoes & Bags
Houseware & Furnishings
Leisure & Entertainment
Education
Others
11.9
12.3
29.5
28.0
3.6
1.1
4.3
1.8
4.4
3.1
The portfolio’s biggest tenant is Beijing Hualian Group (BHG) which operates the master-leased
Beijing Hualian Department Stores at CapitaMall Anzhen and CapitaMall Erqi. It is also the anchor
tenant at CapitaMall Xizhimen, CapitaMall Wangjing and CapitaMall Saihan.
TOP 10 TENANTS
(Based on percentage of Total Rental Income in the month of December 2014 1)
% % Total
NLA committed
Rental
sq m
NLA Income 1
Trade
Category
Lease
Expiry 2
Sep/2015 185,182
Dec/2018
Sep/2020
Jul/2025
Nov/2026
Sep/2028
Jun/2029
40.4%
18.4%
Tenant
Brand Names
BHG(北京)百貨有
限公司
Beijing
Hualian
Department
Store
Beijing
Hualian
Supermarket
Costa Coffee
Department
Store
上海聯家超市有限
公司3
北京家樂福商業有
限公司3
Carrefour
Supermarket
Jan/2024
Mar/2024
Dec/2030
60,077
13.1%
4.4%
綾致時裝(天津)有限
公司3
金林德伯格(天津)有
限公司3
Only
Jack & Jones
Vero Moda
Selected
J.Lindeberg
Fashion &
Accessories
May/2015
Sep/2015
Oct/2015
Nov/2015
Dec/2015
Jan/2016
Mar/2016
Apr/2016
Apr/2017
Jun/2017
5,410
1.2%
3.7%
迅銷(中國)商貿有限
公司
優衣庫商貿有限公
司
UNIQLO
Fashion &
Accessories
Apr/2016
Nov/2018
Aug/2020
4,520
1.0%
2.0%
北京百安居裝飾建
材有限公司
B&Q
Houseware &
Furnishings
Apr/2024
17,429
3.8%
1.4%
北京為之味餐飲有
限公司3
北京為之味餐飲有
限公司第三分公
3
司
富迪康(北京)餐飲管
理有限公司3
夾揀成廚麻辣
燙
姑姑宴
川成元麻辣香
鍋
金湯玉線
港仔驛棧
Food &
Beverage
May/2016
Sep/2016
Nov/2016
Apr/2017
Mar/2018
Sep/2018
Nov/2018
1,894
0.4%
1.3%
北京華聯呼和浩特
金宇綜合超市有
限公司
北京華聯綜合超市
股份有限公司
華聯咖世家(北京)餐
飲管理有限公司
Supermarket
Food &
Beverage
Delivering Performance | 51
Operations Review
1
2
3
Lease
Expiry 2
% % Total
NLA committed
Rental
sq m
NLA Income 1
Tenant
Brand Names
Trade
Category
北京必勝客比薩餅
有限公司3
北京肯德基有限公
3
司
天津肯德基有限公
3
司
上海肯德基有限公
3
司
銅陵金壇餐飲有限
公司3
KFC
Pizza Hut
Food &
Beverage
Jul/2016
Apr/2017
May/2017
Sep/2017
Sep/2018
Dec/2021
Apr/2022
2,795
0.6%
1.0%
北京拉夏樂微服飾
有限公司
拉夏貝爾服飾(太倉)
有限公司
上海拉夏貝爾服飾
股份有限公司
上海樂歐服飾有限
公司
La Chapelle
Candie’s
Fashion &
Accessories
Sep/2015
Mar/2016
Dec/2017
Feb/2018
3,001
0.7%
1.0%
北京聯郡餐飲管理
有限公司
北京聯郡餐飲管理
有限公司第三分
公司
南京大牌檔
Food &
Beverage
Feb/2023
Jun/2024
Oct/2024
3,043
0.7%
0.8%
蓋璞(北京)商業有限
公司
GAP
Fashion &
Accessories
Sep/2018
Apr/2021
2,153
0.5%
0.8%
Includes CapitaMall Minzhongleyuan and CapitaMall Grand Canyon.
Some of the tenants have signed more than one tenancy agreement and this has resulted in more than one lease expiry date
for such tenants.
Under the same group of companies respectively.
52 | CapitaRetail China Trust Annual Report 2014
Financial Review
In RMB terms, FY 2014 gross revenue for the portfolio was RMB987.6 million, an increase of 24.2%
over FY 2013. The was mainly due to the new contribution of RMB138.1 million from CapitaMall Grand
Canyon, which was acquired on 30 December 2013. The remaining increase of RMB54.4 million was
contributed by other malls due to higher rental growth and higher tenants’ sales, except for
CapitaMall Wuhu where tenancy adjustment is currently being carried out. Gross revenue in SGD
terms for FY 2014 increased by $43.2 million, 27.0% over FY 2013.
Gross Revenue By Property
Multi-Tenanted Malls
CapitaMall Xizhimen
CapitaMall Wangjing
CapitaMall Grand Canyon
CapitaMall Minzhongleyuan3
CapitaMall Qibao
CapitaMall Saihan
CapitaMall Wuhu
Master-Leased Malls
CapitaMall Anzhen
CapitaMall Erqi
CapitaMall Shuangjing
Total
FY 2014 1
S$’000
FY 2013 2
S$’000
%
Change
FY 20141
RMB’000
FY 2013 2
RMB’000
%
Change
53,978
41,100
28,430
5,150
19,821
11,456
6,802
166,737
48,596
36,871
–
4,578
17,813
9,962
7,043
124,863
11.1
11.5
N.M.
12.5
11.3
15.0
(3.4)
33.5
262,259
199,691
138,129
25,020
96,301
55,663
33,049
810,112
241,352
183,118
–
22,738
88,468
49,474
34,978
620,128
8.7
9.1
N.M.
10.0
8.9
12.5
(5.5)
30.6
16,794
10,385
9,346
36,525
203,262
16,262
10,084
8,866
35,212
160,075
3.3
3.0
5.4
3.7
27.0
81,596
50,459
45,407
177,462
987,574
80,766
50,082
44,033
174,881
795,009
1.0
0.8
3.1
1.5
24.2
FY 2014 1
(%)
FY 2013 2
(%)
26.6
20.2
14.0
2.5
9.8
5.6
3.3
30.4
23.0
–
2.9
11.1
6.2
4.4
8.3
5.1
4.6
10.2
6.3
5.5
Gross Revenue Contribution By Property
Multi-Tenanted Malls
CapitaMall Xizhimen
CapitaMall Wangjing
CapitaMall Grand Canyon
CapitaMall Minzhongleyuan 3
CapitaMall Qibao
CapitaMall Saihan
CapitaMall Wuhu
Master-Leased Malls
CapitaMall Anzhen
CapitaMall Erqi
CapitaMall Shuangjing
1
2
3
The financial year from 1 January 2014 to 31 December 2014.
The financial year from 1 January 2013 to 31 December 2013.
CapitaMall Minzhongleyuan’s gross revenue was impacted by the road closure to facilitate the construction of a new subway
line.
N.M. – Not Meaningful
Delivering Performance | 53
Financial Review
In RMB terms, NPI for FY 2014 increased by RMB131.4 million, or 25.7% over FY 2013. This was
mainly due to the new contribution of RMB86.6 million from CapitaMall Grand Canyon which was
acquired on 30 December 2013. FY 2014 recorded higher NPI for all malls except CapitaMall
Minzhongleyuan and CapitaMall Wuhu. Multi-tenanted malls that registered strong double digit
growth in NPI included CapitaMall Saihan, CapitaMall Qibao, CapitaMall Xizhimen and CapitaMall
Wangjing. The master-leased malls – CapitaMall Anzhen, CapitaMall Erqi and CapitaMall Shuangjing
– also showed stable year-on-year growth.
NPI By Property
FY 2014 1
S$’000
FY 2013 2
S$’000
%
Change
FY 2014 1
RMB’000
FY 2013 2
RMB’000
%
Change
CapitaMall Xizhimen
37,988
32,649
16.4
184,571
162,153
13.8
CapitaMall Wangjing
29,557
26,007
13.7
143,607
129,164
11.2
17,815
–
N.M.
86,555
–
N.M.
271
675
(59.9)
1,313
3,353
(60.8)
CapitaMall Qibao
8,543
7,270
17.5
41,506
36,102
15.0
CapitaMall Saihan
6,155
5,171
19.0
29,909
25,681
16.5
CapitaMall Wuhu
2,394
2,911
(17.8)
11,630
14,458
(19.6)
102,723
74,683
37.5
499,091
370,911
34.6
13,777
13,319
3.4
66,936
66,149
1.2
CapitaMall Erqi
8,336
7,963
4.7
40,504
39,549
2.4
CapitaMall Shuangjing
7,529
7,073
6.4
36,579
35,126
4.1
29,642
28,355
4.5
144,019
140,824
2.3
132,365
103,038
28.5
643,110
511,735
25.7
FY 2014 1
(%)
FY 20132
(%)
CapitaMall Xizhimen
28.6
31.7
CapitaMall Wangjing
22.3
25.2
13.5
–
Multi-Tenanted Malls
CapitaMall Grand Canyon
CapitaMall Minzhongleyuan
3
Master-Leased Malls
CapitaMall Anzhen
Total
NPI Contribution By Property
Multi-Tenanted Malls
CapitaMall Grand Canyon
3
0.2
0.7
CapitaMall Qibao
6.5
7.1
CapitaMall Saihan
4.7
5.0
CapitaMall Wuhu
1.8
2.8
10.4
12.9
CapitaMall Erqi
6.3
7.7
CapitaMall Shuangjing
5.7
6.9
CapitaMall Minzhongleyuan
Master-Leased Malls
CapitaMall Anzhen
1
2
3
N.M.
The financial year from 1 January 2014 to 31 December 2014.
The financial year from 1 January 2013 to 31 December 2013.
CapitaMall Minzhongleyuan’s NPI was impacted by the road closure to facilitate the construction of a new subway line.
– Not Meaningful
54 | CapitaRetail China Trust Annual Report 2014
Portfolio Valuations And Property Yield
Valuation
2014
(in per sq
m of GRA)
Property
Yield
Valuation Valuation
20141
2014
2013
Valuation
2014
Valuation
2013
RMB
million
RMB
million
RMB
%
CapitaMall Xizhimen
2,777
2,600
33,428
CapitaMall Wangjing
2,050
1,900
CapitaMall Grand Canyon
1,948
CapitaMall Anzhen
S$
million
S$
million
6.6
588.4
532.2
30,143
7.0
434.4
388.9
1,882
27,842
4.4
412.8
385.2
973
949
22,397
6.9
206.2
194.3
CapitaMall Erqi
606
590
6,562
6.7
128.4
120.8
CapitaMall Minzhongleyuan
564
504
15,051
N.M
119.5
103.2
CapitaMall Shuangjing
558
543
11,281
6.6
118.2
111.2
CapitaMall Qibao
485
472
6,669
8.6
102.8
96.6
CapitaMall Saihan
400
362
9,538
7.5
84.8
74.1
CapitaMall Wuhu
260
251
5,698
4.5
55.1
51.4
–
2
2,250.6
2,057.9
Total
10,621
10,053
6.4
1
2
Property yield is calculated based on NPI for FY 2014 and the valuation as at 31 December 2014.
Excludes CapitaMall Minzhongleyuan’s 2014 yield as the mall was impacted by the road closure to facilitate the construction
of a new subway line.
N.M. – Not Meaningful
S$’000
Investment Properties as at 31 December 2014
Surplus on revaluation for FY 2014
1
2,250,783 1
104,829
The carrying amount of the investment properties includes the valuation of the 10 retail malls and the carrying amount of
CapitaMall Minzhongleyuan’s three residential units.
Delivering Performance | 55
Capital Management
As at 31 December 2014, CRCT maintains the following debt facilities:
RMB denominated facility
•
the RMB495.0 million five-year secured term loan facility
S$ denominated facilities
•
the S$151.0 million money market line facilities
•
the S$88.0 million three-year trust term loan facility
•
the S$50.0 million three-year trust term loan facility
•
the S$50.0 million four-year trust term loan facility
•
the S$50.5 million four-year trust term loan facility
•
the S$75.0 million four-year trust term loan facility
•
the S$50.0 million five-year trust term loan facility
•
the S$75.0 million five-year trust term loan facility
•
the S$100.0 million five-year trust term loan facility
US$ denominated facility
•
the US$50.0 million money market line facility
Multicurrency Medium Term Notes
•
the S$500.0 million multicurrency Medium Term Notes (MTN) Programme
CRCT has sufficient untapped facilities, which include S$500.0 million from the MTN Programme, and
money market line facilities of S$121.5 million and US$50.0 million. Current aggregate leverage for
CRCT is at 28.7% (below the Monetary Authority of Singapore’s requirement of 35%) with a total
outstanding debt of S$672.9 million.
CRCT’s effective capital management includes hedging its currency and interest rate risk exposures.
Other than the natural hedge where loans are borrowed in RMB, CRCT also hedges its non-RMB
denominated loans. This provides a currency match against CRCT’s assets which are predominantly
denominated in RMB. However, CRCT does not hedge the equity largely denominated in RMB as
CRCT is of the view that such equity investments are long-term. CRCT will hedge the RMB cash flow
from operations if it is determined with certainty the exact timing in which they will be remitted back
to Singapore for distribution purposes. As at 31 December 2014, CRCT has hedged its non-RMB
loans through non-deliverable forwards (NDF) with a notional amount of S$258.0 million which
represented 53.9% (including RMB denominated loans) of total outstanding debts.
The fair value derivatives for FY 2014, which was included as financial derivatives in total assets and
total liabilities, were S$1.5 million and S$8.6 million respectively. This net amount represented a
negative 0.5% of the net assets of CRCT as at 31 December 2014.
CRCT successfully refinanced the term loans that matured in November 2014, and kept the overall
average cost of debt at 3.32%.
56 | CapitaRetail China Trust Annual Report 2014
Debt maturity each year as a percentage of total outstanding debt as at 31 December 2014 is as
follows:
Debt Maturity Profile (S$ million)
(As at 31 December 2014)
S$’million
700.0
600.0
27.4%
500.0
400.0
300.0
200.0
72.6%
5.3
29.5
88.0
100.0
5.3
5.3
89.0
100.0
125.5
50.0
75.0
100.0
0.0
Total Debt1 (S$ million)
% of Outstanding Debt
Total Debt
672.9
100.0%
2015
122.8
18.3%
2016
105.3
15.6%
Variable Rate
Fixed Rate
Trust - Unsecured Offshore Term Loan2
1
2
3
4
2017
130.8
19.4%
2018
139.0
20.7%
2019
75.0
11.1%
2020
100.0
14.9%
Trust-Unsecured Money Market Line3
CapitaMall Grand Canyon - Secured Onshore Term Loan4
Total debt excludes interest and upfront fees.
Comprises multiple term loans drawn in Singapore at the Trust level, these include fixed and/or floating term loan facilities.
Comprises multiple floating rate money market facilities.
Secured onshore term loan comprises a RMB term loan of S$104.9 million (RMB495.0 million). The loan is secured by a legal
mortgage over CapitaMall Grand Canyon and bears interest referenced against three to five years People’s Bank of China
(“PBOC”) base lending rate. This secured RMB term loan is payable on a semi-annual basis starting six months from the first
drawdown date. Outstanding loan will be repaid on final maturity.
As at 31 December 2014, 18.3% or S$122.8 million of CRCT’s debt will mature in 2015. To date, the
Manager has refinanced S$88.0 million which matured in February 2015.
Cash Flows and Liquidity
CRCT takes a proactive role in monitoring its cash and liquid reserves to ensure adequate funding
is available for distributions to Unitholders as well as to meet any short-term liabilities.
Operating Activities
Operating net cash flow for FY 2014 was S$111.4 million, an increase of S$42.8 million over the
operating cash flow of S$68.6 million in the preceding financial year. This was mainly due to the
contribution of operating income from CapitaMall Grand Canyon which was acquired on 30
December 2013.
Investing Activities
CRCT adheres to stringent criteria when evaluating potential acquisitions. This involves a thorough
review of risks and returns, and to overall add value to the existing portfolio and future growth
expectations. CRCT will constantly look for new acquisition opportunities.
Delivering Performance | 57
Capital Management
Financing Activities
CRCT continues to adopt a prudent and proactive approach to monitor the cash position and level
of borrowings to ensure a healthy cash position to finance its operations. During the year, CRCT has
fully repaid two of its onshore loans amounting to S$131.5 million resulting in net cash used in
financing activities. CRCT can also tap on the capital and debt markets to facilitate any new
acquisitions.
Cash and Cash Equivalents
As at 31 December 2014, the value of the cash and cash equivalents at CRCT stood at S$86.6 million
compared with S$105.5 million as at 31 December 2013. S$26.7 million of cash retained from our
distributions on 27 March 2014 and 25 September 2014 through Distribution Reinvestment Plan were
used for general corporate and working capital purposes. This is in accordance with the stated use
and allocation of the proceeds from the announcements.
Key Financial Indicators
As at
31 December 2014
Unencumbered Assets to Assets as % of Total Assets (%)
Aggregate Leverage (%)
28.7
2
5.5
Net Debt/EBITDA (times)
Interest Coverage (times)
3
Average Term to Maturity (Years)
Average Cost of Debt (%) 4
1
2
3
4
95.6
1
5.6
2.8
3.32
Aggregate leverage is calculated based on total borrowings and deferred payments over total assets. Total assets include the
hedging effects on the net assets denominated in RMB.
Net Debt comprises gross debt less transaction costs and EBITDA refers to earnings before interest, tax, depreciation and
amortisation excluding change in fair value of financial derivatives, investment properties and unrealised foreign exchange
gain or loss.
Ratio of net income before change in fair value of financial derivative, investment properties and unrealised foreign exchange
gain or loss at CRCT Group over interest expense from FY 2014.
Ratio of interest expense over weighted average borrowings.
58 | CapitaRetail China Trust Annual Report 2014
Investor & Media Relations
We are committed to provide the investment and media communities with timely, effective,
unbiased and transparent information. We maintain a high standard of access through our wide
variety of communication channels such as meetings, conference calls, roadshows, conferences and
mall visits. Our Unitholders’ Communication and Investor Relations Policy states the guiding
principles of our approach, and it is available on our corporate website at
http://www.capitaretailchina.com/ir_policy.html.
During the year, senior management participated, in roadshows in Hong Kong and Singapore. We
held our full-year and half-year financial analysts’ and media results briefings in January and July
respectively. CRCT’s results, strategies and outlook were communicated during the briefings. The
recordings of the results briefings were posted on our website to keep our stakeholders abreast of
the latest developments of the Trust. On 16 April 2014, we held our annual general meeting, which
gave us an opportunity to have close interaction with our Unitholders. Our communication efforts
have been recognised by the investing community. In July 2014, CRCT was conferred the Bronze
award for Best Annual Report under the REITs and Business Trusts category at the Singapore
Corporate Awards.
Individual and group mall visits are arranged for investors and analysts travelling to the cities in
which our malls are located. These visits offer them a first-hand experience of our malls’ operations
and a greater appreciation of the long-term growth potential of CRCT.
All our latest announcements and news are promptly released to SGX-ST and published on CRCT’s
website (www.capitaretailchina.com). Unitholders and potential stakeholders have 24-hour access to
CRCT’s website for information such as quarterly results, press releases, annual reports and CRCT’s
unit price. An email alert service is also provided so that registered participants can receive email
alerts on CRCT’s latest announcements and press releases. In addition, the public can pose
questions via a dedicated “Ask Us” email address ([email protected]).
INVESTOR RELATIONS & MEDIA CALENDAR 2014
Date
Event
Organiser
29 Jan
FY 2013 results briefing to media and analysts, Singapore
CRCT
29 Jan
FY 2013 post results briefing, Singapore
BAML
18 – 19 Feb
Non-deal roadshow, Hong Kong
J.P. Morgan
5 – 6 Mar
ASEAN Stars Conference 2014
BAML
16 Apr
Annual General Meeting
CRCT
24 Apr
1Q 2014 post results briefing, Singapore
UBS
26 – 27 Jun
Asia Pacific Property Conference
Citibank
24 Jul
2Q 2014 results briefing to media and analysts, Singapore
CRCT
24 Jul
2Q 2014 post results briefing, Singapore
DBS
11 Aug
CapitaLand Debt Investor Day
CapitaLand
24 Oct
3Q 2014 post results briefing, Singapore
J.P. Morgan
12 – 13 Nov
Thirteenth Annual Asia Pacific Summit
Morgan
Stanley
Delivering Performance | 59
Investor & Media Relations
FINANCIAL CALENDAR 2015 – 2016 (TENTATIVE)
April 2015
2015 First Quarter Results Announcement
Annual General Meeting
July 2015
2015 Second Quarter Results Announcement
September 2015
2015 First Half Distribution to Unitholders
October 2015
2015 Third Quarter Results Announcement
January 2016
2015 Full Year Results Announcement
March 2016
2015 Second Half Distribution to Unitholders
ANALYST COVERAGE (AS AT 26 FEBRUARY 2015)
China International Capital Corporation
Daiwa Capital Markets
DBS Bank
J.P. Morgan Securities
Macquarie Capital Securities
OCBC Investment Research
UBS Securities
UNITHOLDER & MEDIA ENQUIRIES
If you have any enquiries or would like to find out more about CRCT, please contact:
The Manager
Ms Leng Tong Yan
Mr Lim Seng Jin
Investor Relations
Corporate Communications
Tel: (65) 6713 2888
Fax: (65) 6713 2999
Email: [email protected]
Website: www.capitaretailchina.com
The Unitholder Registrar
Boardroom Corporate & Advisory Services Pte. Ltd.
50 Raffles Place
#32-01 Singapore Land Tower
Singapore 048623
Tel: +65 6536 5355
Fax: +65 6536 1360
Website: www.boardroomlimited.com
For depository-related matters such as change of details pertaining to Unitholders’ investment
records, please contact:
The Central Depository (Pte) Limited
9 North Buona Vista Drive
#01-19/20 The Metropolis
Singapore 138588
Tel: +65 6535 7511
Fax: +65 6535 0775
Email: [email protected]
Website: www.sgx.com/cdp
60 | CapitaRetail China Trust Annual Report 2014
Unit Price Performance
CRCT Trading Data in FY 2014
Highest Unit Price (S$)
1.705
Lowest Unit Price (S$)
1.285
Average Closing Unit Price (S$)
1.500
Opening Unit Price on 2 January 2014 (S$)
1.330
Closing Unit Price on 31 December 2014 (S$)
1.615
Turnover (million units)
223.6
CRCT Monthly Trading Performance in FY 2014
1.71
1.32
1.38
1.40
1.48
1.52
1.62
1.48
1.57
1.63
1.60
23.6
23.6
21.6
1.62
22.6
21.5
19.5
17.8
17.6
15.4
14.5
14.8
11.3
Jan-14
Feb-14
Mar-14
Apr-14
May-14
Jun-14
Trading Volume (million units)
Jul-14
Aug-14
Sep-14
Oct-14
Nov-14
Dec-14
Closing Unit Price as at end of the month (S$)
Delivering Performance | 61
Unit Price Performance
Comparative Yields (%)
(As at 31 December 2014)
6.1
5.6
4.0
3.7
3.3
2.5
2.3
0.3
CRCT
Yield1
Singapore
10-year
Govt Bond
Yield2
China
10-year Govt
Bond Yield2
FSSTI
Yield3
FSTRE
Yield4
FSTREI
Yield5
CPF
Ordinary
Account6
12-month
Fixed
(S$) Deposit7
Source: Bloomberg, CRCTML, Central Provident Fund (CPF) Board, Monetary Authority of Singapore.
1
2
3
4
5
6
7
Based on distribution per unit of 9.82¢ for FY 2014 and the unit closing price of S$1.615 on 31 December 2014.
Singapore Government 10-year and China Government 10-year bond yields as at 31 December 2014.
Average 12-month gross dividend yield of Straits Times Index stocks as at 31 December 2014.
Average 12-month gross dividend yield of Straits Times Real Estate Index as at 31 December 2014.
Average 12-month gross dividend yield of Straits Times REIT Index as at 31 December 2014.
Prevailing CPF-Ordinary Account savings rate.
Average 12-month S$ fixed deposit savings rate as at December 2014.
Change in Unit Price/Index Value (%)
60%
50%
40%
30%
20%
10%
0%
-10%
Dec
2013
Jan
2014
Feb
2014
Mar
2014
Apr
2014
May
2014
Jun
2014
Jul
2014
Aug
2014
Sep
2014
Oct
2014
Nov
2014
CRCT
Shanghai Exchange Composite Index (SHCOMP)
FTSE Straits Times REIT Index (FSTREI)
FTSE Straits Times Real Estate Index (FSTRE)
Straits Times Index (FSSTI)
62 | CapitaRetail China Trust Annual Report 2014
Dec
2014
Corporate Social Responsibility
As a committed corporate citizen, we continue to promote charity causes in benefit of the
communities served by our shopping malls, and adopt green practices that contribute to sustainable
development.
SUPPORTING THE COMMUNITY
“My Schoolbag”, a key annual CapitaLand corporate social responsibility programme, took place in
China for the fifth consecutive year in September 2014, in conjunction with the start of the new
academic year. For the second year running, CapitaLand partnered with the China Foundation for
Poverty Alleviation (CFPA) to distribute new schoolbags to about 16,000 first grade pupils from over
250 schools, including 22 CapitaLand Hope Schools.
The programme also canvassed for public donations for the first time through the collaboration with
CFPA. Including pledges from CapitaLand Hope Foundation (CHF), the philanthropic arm of
CapitaLand, the amount raised to purchase these schoolbags and stationery totalled RMB1.59
million (S$330,500). The children were also in for a treat with additional bag contents last year – each
bag contained over 100 items, including arts and crafts materials and a water bottle, on top of basic
stationery.
The event involved about 500 volunteers comprising staff, retailers and shoppers. Staff volunteers
from CapitaMall Xizhimen, CapitaMall Wangjing and CapitaMall Saihan took part in the programme.
Besides My Schoolbag, our malls held community activities in support of various causes throughout
the year. CapitaMall Wangjing initiated a winter clothes donation drive for the poor rural regions of
West China, a move that drew a warm response from the mall’s surrounding communities. CapitaMall
Xizhimen and CapitaMall Grand Canyon organised adoption events for stray cats and dogs, while the
latter also held a charity concert to rally shoppers to donate daily necessities to orphans. CapitaMall
Wuhu invited 25 underprivileged families to spend Mid-Autumn Festival in the mall.
BEING GREEN
We remain strongly committed to protecting our environment for future generations, and continue to
minimise the environmental footprint of our malls’ operations.
A recurring highlight was our participation in the World Wide Fund for Nature’s (WWF) Earth Hour
2014, the global movement to raise awareness of climate change. Our malls showed strong support
by turning off façade and non-essential lights throughout the night, beginning at 8.30pm on Saturday,
29 March 2014. Six of our malls – CapitaMall Xizhimen, CapitaMall Wangjing, CapitaMall Grand
Canyon, CapitaMall Qibao, CapitaMall Saihan and CapitaMall Wuhu – took part in the event.
Beyond Earth Hour, our malls also engaged different stakeholders in activities throughout the year to
raise awareness of climate change and the role each of us can play in conserving the environment.
CapitaMall Saihan joined hands with the local authorities to increase awareness of environmental
protection by involving shoppers in maintaining the cleanliness of the streets and bus stops, while
CapitaMall Qibao held a cycling event to promote green transportation. CapitaMall Qibao also
houses a rooftop farm that provides children and families with a hands-on approach to learning green
values, thus reinforcing the importance of environmentally friendly practices to the future generation.
Delivering Performance | 63
People & Talent Management
We recognise that our people are our greatest asset and are integral to the success of the
organisation. We adopt an integrated human capital strategy to continually develop and grow our
people to reach their fullest potential.
TALENT MANAGEMENT
We actively seek outstanding talents to support our business growth in China. To strengthen the
management bench and talent pipeline for leadership succession planning, we recruit talents at different
points in their careers, from fresh graduates to young, mid-career professionals and industry veterans.
Through our network with various distinguished China and overseas universities, we attract young talents
to join our Management Associate Programme and Graduate Development Programme.
Our scale allows us to provide a platform for cross-fertilisation of skills and capabilities, where our
employees have the opportunity to rotate to different malls, functions, cities or countries within
CapitaLand’s portfolio as part of their career development and growth.
COMPETITIVE REMUNERATION PACKAGE
We provide a comprehensive and competitive remuneration package which includes short-term cash
bonuses and long-term equity-based reward plans such as Restricted Share Plan and Performance
Share Plan. Such reward plans aim to tie incentive with performance, as well as to retain talent. We
conduct regular benchmarking exercises against different markets and are innovative in our
compensation strategies to ensure that we remain competitive and continue to attract and retain
talent.
DEVELOPING OUR PEOPLE
We strongly believe that continual learning is a fundamental building block of growth, and ample
training opportunities are provided to expand our people’s capabilities and realise their potential. We
collaborate with CapitaLand to offer our employees a suite of training and development programmes
that will help them gain the relevant knowledge and skills required to achieve business excellence.
Apart from classroom training, our employees are encouraged to proactively learn at their own time
and pace through our online learning platform iCampus, which contains a library of more than 400
courses in English and Chinese.
For new employees, we have in place structured programmes such as the new hire orientation
modules on iCampus, where staff can learn company information and policies and processes. This
helps to seamlessly integrate and ease new employees into our culture and system. During their first
three months of service, they are invited to attend a four-day immersion programme where they can
gain deeper insights into our management philosophy, core values, business strategy and
operations. The immersion programme also provides an opportunity for new employees to network
and interact with colleagues from other malls and functions.
To sharpen the leadership, management and business skills of the senior management team, we
partner with CapitaLand Institute of Management and Business (CLIMB) to organise and run
leadership and management programmes.
ENGAGING OUR PEOPLE
We believe it is important to engage our employees through regular communication. Staff
communication sessions with senior management are held on a regular basis to keep our employees
abreast of CRCT’s financial results and strategic business thrusts. In addition, regular recreational,
team-building and networking events are organised to foster engagement and cohesiveness.
CARING FOR OUR PEOPLE
We value and care for our people. We believe our success is shaped by our people and we will
continue to develop our human capital to achieve optimal performance.
64 | CapitaRetail China Trust Annual Report 2014
This page has been intentionally left blank.
Portfolio Summary
CapitaMall
Xizhimen
凱德MALL•西直門
CapitaMall
Wangjing
凱德MALL•望京
CapitaMall
Grand Canyon
凱德MALL•大峽谷
CapitaMall
Minzhongleyuan
凱德新民眾樂園
Address
No. 1 Xizhimenwai
Avenue,
Xicheng District,
Beijing
No. 33 Guangshun
North Street,
Chaoyang District,
Beijing
No. 16 South Third
Ring West Road,
Fengtai District,
Beijing
GFA (sq m)
(As at 31 December 2014)
83,075
83,768
GRA (sq m)
(As at 31 December 2014)
83,075
NLA (sq m)
(As at 31 December 2014)
CapitaMall
Shuangjing
凱德MALL•雙井
CapitaMall Qibao
凱德七寶購物廣場
CapitaMall Saihan
凱德MALL•賽罕
CapitaMall Wuhu
凱德廣場•蕪湖
CapitaMall Anzhen CapitaMall Erqi
凱德MALL•安貞
凱德廣場•二七
No. 704
Zhongshan Avenue,
Jianghan District,
Hankou Wuhan,
Hubei Province
No. 3655,
Qixin Road,
Minhang District,
Shanghai
No. 26
Ordos Street,
Saihan District,
Huhhot,
Inner Mongolia
Autonomous
Region
No. 37 Zhongshan
North Road,
Jinghu District,
Wuhu,
Anhui Province
Building 4, Zone 5,
Anzhenxili,
Chaoyang District,
Beijing
No. 3 Minzhu Road,
Erqi District,
Zhengzhou,
Henan Province
No. 31
Guangqu Road,
Chaoyang District,
Beijing
92,918
41,717
83,986
41,938
59,624
43,443
92,356
49,463
68,010
69,967
37,472
72,729
41,938
45,634
43,443
92,356
49,463
50,592
54,109
44,915
23,003
50,979
30,714
37,354
43,443
92,356
51,2446
Number of Leases
(As at 31 December 2014)
237
226
204
213
166
186
101
2
2
10
Land Use
Right Expiry
23 August 2044
23 August 2054
15 May 2043
15 May 2053
29 August 2044
29 August 2054
30 June 2044
15 Sep 2045
10 March 20434
11 March 2041
20 March 2041
29 May 2044
7 October 2034
5 March 2042
3 June 2042
31 May 2042
10 July 2042
Market Valuation1 (RMB million)
(As at 31 December 2014)
2,777.0
2,050.0
1,948.0
564.0
485.0
400.0
260.0
973.0
606.0
558.0
Purchase Price (RMB million)
1,863.5
1,102.0
1,760.0
395.0
264.0
315.0
130.0
772.0
454.0
414.0
1 December 2006
Phase 1:
5 February 2008
Phase 2:
29 September 2008
30 December 2013
30 June 2011
8 November 2006
1 December 2006
8 November 2006
8 November 2006
1 December 2006
1 December 2006
Committed Occupancy Rate
(As at 31 December 2014)
97.0%
99.3%
99.7%
73.9%
96.1%
100.0%
73.9%
100.0%
100.0%
100.0%
Shopper Traffic for 20143 (Million)
36.9
10.4
9.5
4.15
13.2
8.9
6.8
–
–
–
Major Tenants
Beijing Hualian
Supermarket/Costa
Coffee
Vero Moda/Only/
Selected/
Jack & Jones
UNIQLO
為之味(夾揀成廚麻辣
燙/金湯玉線/川成元
麻辣香鍋/姑姑宴/
港仔驛棧)
KFC
La Chapelle
GAP
南京大牌檔
綠茶
Beijing Hualian
Group (Department
Store &
Supermarket)
UNIQLO
Vero Moda/Only/
Selected/
Jack & Jones/
J.Lindeberg
為之味(夾揀成廚麻辣
燙/金湯玉線/川成元
麻辣香鍋/姑姑宴)
I.T
ZARA
南京大牌檔
Carrefour
Poly Cinema
H&M
GAP
富貴時代美食廣場
La Chapelle/
Candie’s
Vero Moda/Only/
Selected/
Jack & Jones
南京大牌檔
UA Cinemas
innisfree
Starbucks
adidas
Originals
Swatch
七寶大光明影城
(Cinema)
Carrefour
UNIQLO
Bao Da Xiang
Shopping For Kids
H3 Club (Gym)
Haoledi (KTV)
Beijing Hualian
Supermarket
Jinyi Cinema
Nike
Vero Moda/Only/
Selected/
Jack & Jones
KFC/Pizza Hut
BreadTalk
La Chapelle
:Chocoolate
Walmart
阿香婆麻辣涮火鍋
McDonald’s
KFC
Beijing Hualian
Department Store
Beijing Hualian
Supermarket
Beijing Hualian
Department Store
Beijing Hualian
Supermarket
Carrefour
B&Q
Apple
SASA
Subway
Gross Revenue for 2014
(RMB million)
262.3
199.7
138.1
25.0
96.3
55.7
33.0
81.6
50.5
45.4
NPI for 2014 (RMB million)
184.6
143.6
86.6
1.3
41.5
29.9
11.6
66.9
40.5
36.6
Name
Acquisition Date
1.
2.
2
Independent valuation of CapitaMall Grand Canyon was conducted by CBRE Pte. Ltd.
Independent valuations of CapitaMall Anzhen, CapitaMall Shuangjing and CapitaMall Saihan were conducted by DTZ
Debenham Tie Leung International Property Advisers (Shanghai) CO., Ltd.
Independent valuations of CapitaMall Qibao, CapitaMall Wuhu, CapitaMall Wangjing and CapitaMall Erqi were conducted by
Knight Frank Petty Limited.
Independent valuations of CapitaMall Xizhimen and CapitaMall Minzhongleyuan were conducted by Colliers International
(Hong Kong) Limited.
Refers to the completion of the acquisition of the special purpose vehicles which own the properties.
66 | CapitaRetail China Trust Annual Report 2014
3.
4.
5.
6.
CapitaMall Shuangjing, CapitaMall Anzhen, and CapitaMall Erqi do not have traffic counters.
CapitaMall Qibao is indirectly held by CRCT under a master lease with Shanghai Jin Qiu (Group) Co., Ltd, the legal owner.
The master-lease expires in January 2024, with the right to renew for a further term of 19 years and two months. Accordingly,
the land-use right is owned by the legal owner.
Shopper traffic for CapitaMall Minzhongleyuan is from 1 May 2014 to 31 December 2014 as the mall reopened on 1 May 2014
after completion of asset enhancement initiative.
Includes the area zoned for civil defense but certified for commercial use.
Delivering Performance | 67
Portfolio Details
CAPITAMALL XIZHIMEN
•
•
•
•
Strategically located at Xizhimen transport hub, well-served by Beijing’s subway Line 2, Line 4
and Line 13, as well as the national rail and bus interchange.
Retail podium of an integrated development.
Well-supported by large shopper catchment from daily commuters passing through the busy
transportation hub and middle-income residents from the vicinity.
Attracts working professionals and students from the nearby Beijing’s Financial Street,
universities and technological zones of Zhongguancun District.
Lease Expiry Profile
(As at 31 December 2014)
37.0
28.9
24.5
19.3
19.1
15.3
14.8
13.7
12.7
10.4
2015
2016
% of Total Net Lettable Area
2017
2018
Beyond 2018
% of Total Rental Income
Trade Sector Analysis (%)
(As at 31 December 2014)
Trade Categories
Food & Beverage
Fashion & Accessories
Supermarket
Beauty & Healthcare
Education
Shoes & Bags
Sundry & Services
Houseware & Furnishings
Sporting Goods & Apparel
Information & Technology
Office
Gifts & Souvenirs
Jewellery/Watches/Pens
Toys & Hobbies
Warehouse
68 | CapitaRetail China Trust Annual Report 2014
By Committed
NLA
(%)
By Total Rental
Income
(%)
29.4
28.5
21.0
8.0
5.6
2.5
1.5
1.5
0.5
0.3
0.3
0.3
0.3
0.2
0.1
29.2
39.3
3.7
12.0
3.6
5.3
2.4
1.7
0.6
0.7
0.0
0.6
0.6
0.3
0.0
CAPITAMALL WANGJING
•
•
•
•
Leading comprehensive shopping mall in the densely populated residential suburb of Wangjing.
Convenient access by key highways, well-served by numerous bus routes and in close proximity
to the Wangjingxi subway station.
A popular one-stop shopping, dining and entertainment destination in Wangjing.
International tenants include ZARA, UNIQLO and Calvin Klein.
Lease Expiry Profile
(As at 31 December 2014)
63.8
31.5
26.3
23.7
11.5
14.1
10.8
3.9
2015
2016
2017
% of Total Net Lettable Area
5.7
7.7
2018
Beyond 2018
% of Total Rental Income
Trade Sector Analysis (%)
(As at 31 December 2014)
Trade Categories
Department Store
Food & Beverage
Supermarket
Fashion & Accessories
Beauty & Healthcare
Education
Warehouse
Toys & Hobbies
Sundry & Services
Houseware & Furnishings
Leisure & Entertainment
Shoes & Bags
Information & Technology
Jewellery/Watches/Pens
Sporting Goods & Apparel
Gifts & Souvenirs
By Committed
NLA
(%)
By Total Rental
Income
(%)
35.4
19.8
16.5
13.4
6.9
2.0
1.1
1.0
0.9
0.8
0.8
0.5
0.3
0.3
0.2
0.1
11.4
27.4
3.0
32.8
10.5
3.6
0.0
1.5
2.4
1.6
0.9
1.7
1.2
1.3
0.4
0.3
Delivering Performance | 69
Portfolio Details
CAPITAMALL GRAND CANYON
•
•
•
•
Strategically located in the up-and-coming Fengtai District of South Beijing with strong
economic fundamentals.
One of the pioneer shopping malls in South Beijing.
Facing the busy South Third Ring West road, the shopping mall is easily accessible from the
Majiapu subway station, Beijing South Railway Station and numerous bus stops.
Well-established among the local community with its comprehensive offerings. Popular tenants
include Carrefour, H&M, Sephora, Nanjing Impressions and Poly Cinema.
Lease Expiry Profile
(As at 31 December 2014)
56.5
30.0
29.1
13.5
16.3
12.1
12.0
10.5
12.6
6.9
2015
2016
2017
% of Total Net Lettable Area
2018
Beyond 2018
% of Total Rental Income
Trade Sector Analysis (%)
(As at 31 December 2014)
Trade Categories
Supermarket
Fashion & Accessories
Food & Beverage
Leisure & Entertainment
Education
Beauty & Healthcare
Sundry & Services
Sporting Goods & Apparel
Shoes & Bags
Houseware & furnishings
Warehouse
Jewellery/Watches/Pens
Music & Videos
Toys & Hobbies
Information & Technology
Electricals & Electronics
Gifts & Souvenirs
Books & Stationery
70 | CapitaRetail China Trust Annual Report 2014
By Committed
NLA
(%)
By Total Rental
Income
(%)
31.5
19.6
18.6
12.6
4.9
3.4
2.4
2.1
1.5
0.7
0.7
0.6
0.4
0.4
0.3
0.2
0.1
0.0
9.0
30.0
22.8
8.1
4.7
6.5
3.3
3.9
3.6
1.5
0.0
3.0
0.8
1.3
0.9
0.2
0.3
0.1
CAPITAMALL MINZHONGLEYUAN
•
•
•
•
•
Strategically located along Zhongshan Avenue, an established shopping and entertainment belt
that enjoys strong retail activities and pedestrian flow.
Easily accessible via public bus routes and subway Line 1 and Line 2.
Strong and diverse tenant base that comprises quality and well-known tenants such as innisfree,
Starbucks, adidas Originals and Studio City (Wuhan) – the operator of IMAX Screen, as well as
local fashion tenants offering young and trendy brands not commonly available in department
stores.
A natural focal point among youths and young adults.
Zhongshan Avenue along where CapitaMall Minzhongleyuan is located has been closed since
20 August 2014. The road closure is to facilitate the construction of the new subway Line 6 which
will last for two years.
Lease Expiry Profile
(As at 31 December 2014)
60.2
34.3
26.7
15.8
17.0
8.3
3.7
0.7
2015
2016
% of Total Net Lettable Area
2017
2018
3.9
3.3
Beyond 2018
% of Total Rental Income
Trade Sector Analysis (%)
(As at 31 December 2014)
Trade Categories
Leisure & Entertainment
Fashion & Accessories
Food & Beverage
Beauty & Healthcare
Sundry & Services
Shoes & Bags
Jewellery/Watches/Pens
Houseware & Furnishings
Information & Technology
Sporting Goods & Apparel
Toys & Hobbies
Music & Videos
Warehouse
Gifts & Souvenirs
Art Gallery
By Committed
NLA
(%)
By Total Rental
Income
(%)
35.2
34.6
13.4
5.7
3.3
3.0
1.6
0.6
0.6
0.6
0.5
0.4
0.2
0.2
0.1
6.7
55.1
13.7
9.0
2.2
5.5
3.3
0.5
1.4
1.5
0.2
0.2
0.1
0.4
0.2
Delivering Performance | 71
Portfolio Details
CAPITAMALL QIBAO
•
•
•
•
•
One of the largest shopping malls in Shanghai Minhang District, near Hongqiao transport hub.
Located in a growing mid-to high-end residential locality to the west of Shanghai’s Central
Business District.
One-stop family shopping destination providing shopping, dining and entertainment for
residents.
Brought in the first modern cinema to Qibao vicinity.
Houses popular fashion retailer UNIQLO’s first duplex store in Minhang District.
Lease Expiry Profile
(As at 31 December 2014)
41.0
25.3
18.7
14.6
20.5
15.8
2015
2016
16.6
13.5
2017
% of Total Net Lettable Area
18.9
11.2
2018
Beyond 2018
% of Total Rental Income
Trade Sector Analysis (%)
(As at 31 December 2014)
Trade Categories
Supermarket
Food & Beverage
Fashion & Accessories
Leisure & Entertainment
Beauty & Healthcare
Education
Sundry & Services
Houseware & Furnishings
Shoes & Bags
Warehouse
Information & Technology
Toys & Hobbies
Jewellery/Watches/Pens
Gifts & Souvenirs
Art Gallery
72 | CapitaRetail China Trust Annual Report 2014
By Committed
NLA
(%)
By Total Rental
Income
(%)
29.8
24.0
17.9
10.3
9.8
4.8
1.1
0.7
0.6
0.3
0.3
0.2
0.1
0.1
0.0
6.2
37.1
30.0
6.4
7.9
3.4
3.2
1.7
2.1
0.0
0.8
0.3
0.4
0.4
0.1
CAPITAMALL SAIHAN
•
•
•
•
One of the most popular one-stop shopping destinations in Huhhot.
Near the heart of Huhhot’s main retail cluster.
Well-served by public transportation.
The range of retail offerings has widened with the opening of Jinyi Cinema, and new food and
beverage outlets after the completion of asset enhancement initiative.
Lease Expiry Profile
(As at 31 December 2014)
50.7
46.2
26.1
20.6
16.8
9.4
8.2
5.4
2015
2016
2017
% of Total Net Lettable Area
8.2
5.6
2018
Beyond 2018
% of Total Rental Income
Trade Sector Analysis (%)
(As at 31 December 2014)
Trade Categories
Supermarket
Fashion & Accessories
Food & Beverage
Leisure & Entertainment
Sporting Goods & Apparel
Shoes & Bags
Beauty & Healthcare
Warehouse
Sundry & Services
Houseware & Furnishings
Toys & Hobbies
Information & Technology
Jewellery/Watches/Pens
Books & Stationery
Gifts & Souvenirs
By Committed
NLA
(%)
By Total Rental
Income
(%)
36.1
19.4
14.5
10.3
6.4
5.4
2.4
2.1
1.0
0.9
0.6
0.5
0.3
0.1
0.0
12.5
33.6
17.5
3.7
10.1
12.0
4.8
0.0
1.1
1.7
0.8
0.9
1.0
0.2
0.1
Delivering Performance | 73
Portfolio Details
CAPITAMALL WUHU
•
•
•
•
Located approximately 1 km north of Wuhu’s Central Business District.
Near the popular Fenghuang Food Street and close to several commercial projects.
One of the first one-stop shopping, dining and entertainment destinations in the locality.
Positioned as a destination for young working adults and middle-income families which fits well
with the targeted population catchment’s demographic profile.
Lease Expiry Profile
(As at 31 December 2014)
53.2
38.2
32.6
14.0
11.7
8.6
4.1
2015
3.3
2016
2017
% of Total Net Lettable Area
1.4
3.5
2018
Beyond 2018
% of Total Rental Income
Trade Sector Analysis (%)
(As at 31 December 2014)
Trade Categories
Supermarket
Food & Beverage
Fashion & Accessories
Beauty & Healthcare
Shoes & Bags
Sundry & Services
Gifts & Souvenirs
Jewellery/Watches/Pens
Toys & Hobbies
Houseware & Furnishings
Sporting Goods & Apparel
74 | CapitaRetail China Trust Annual Report 2014
By Committed
NLA
(%)
By Total Rental
Income
(%)
69.7
15.6
6.7
1.8
1.8
1.6
1.3
0.5
0.4
0.3
0.3
24.5
29.9
21.0
4.2
7.0
4.7
3.7
2.4
1.1
1.3
0.2
CAPITAMALL SHUANGJING
•
•
•
Located in the Chaoyang District, in close proximity to Beijing’s Central Business District.
Well-served by bus routes and close to Dawanglu and Guomao subway stations.
Strong supermarket anchor, drawing significant shopper traffic from the nearby Central
Business District and neighbouring residential areas.
Lease Expiry Profile
(As at 31 December 2014)
95.4
9.2
0.0
0.0
1.4
2015
2016
3.2
2.3
2017
% of Total Net Lettable Area
0.0
88.5
0.0
2018
Beyond 2018
% of Total Rental Income
Trade Sector Analysis (%)
(As at 31 December 2014)
Trade Categories
Supermarket
Houseware & Furnishings
Fashion & Accessories
Sundry & Services
Food & Beverage
Information & Technology
Beauty & Healthcare
By Committed
NLA (%)
By Total Rental
Income (%)
61.0
34.0
3.2
1.0
0.5
0.2
0.1
56.3
31.2
2.3
4.9
1.8
1.8
1.7
CAPITAMALL ANZHEN
•
•
•
•
Located in a densely populated area to the south of Beijing’s Olympic Village.
Adjacent to the North Third Ring Road and a major bus terminal.
One of the most popular and well-established shopping destinations in the area.
Master-leased to BHG.
CAPITAMALL ERQI
•
•
•
Located in Zhengzhou’s Central Business District, at the heart of Erqi District, Zhengzhou’s
premier shopping district.
Attracts repeat shoppers who are mainly residents and office workers in the vicinity, as well as
visitors to the province.
Master-leased to BHG.
Delivering Performance | 75
Financial
Statements
Report of the Trustee
77
Statement by the Manager
78
Independent Auditors’ Report
79
Statements of Financial Position
80
Statements of Total Return
81
Distribution Statements
82
Statements of Movements in Unitholders’ Funds
84
Portfolio Statement
85
Consolidated Statement of Cash Flows
87
Notes to the Financial Statements
89
76 | CapitaRetail China Trust Annual Report 2014
Report of the Trustee
Year ended 31 December 2014
HSBC Institutional Trust Services (Singapore) Limited (the “Trustee”) is under a duty to take into
custody and hold the assets of CapitaRetail China Trust (the “Trust”) in trust for the Unitholders. In
accordance with the Securities and Futures Act (Cap. 289), its subsidiary legislation and the Code
on Collective Investment Schemes, the Trustee shall monitor the activities of CapitaRetail China Trust
Management Limited (the “Manager”) for compliance with the limitations imposed on the investment
and borrowing powers as set out in the Trust Deed dated 23 October 2006 (as amended by a first
supplemental deed dated 8 November 2006, a second supplemental deed dated 15 April 2010, a
third supplemental deed dated 5 April 2012 and a fourth supplemental deed dated 14 February
2014) (collectively the “Trust Deed”) between the Manager and the Trustee in each annual
accounting period and report thereon to Unitholders in an annual report.
To the best knowledge of the Trustee, the Manager has, in all material respects, managed the Trust
during the year covered by these financial statements, set out on pages 80 to 146, in accordance
with the limitations imposed on the investment and borrowing powers set out in the Trust Deed.
For and on behalf of the Trustee,
HSBC Institutional Trust Services (Singapore) Limited
Antony Wade Lewis
Director
Singapore
26 February 2015
Delivering Performance | 77
Statement by the Manager
Year ended 31 December 2014
In the opinion of the directors of CapitaRetail China Trust Management Limited (the “Manager”), the
accompanying financial statements set out on pages 80 to 146 comprising the statements of financial
position, statements of total return, distribution statements and statements of movements in
Unitholders’ funds of the CapitaRetail China Trust (the “Trust”) and its subsidiaries (the “Group”) and
of the Trust, the portfolio statement and statement of cash flows of the Group and a summary of
significant accounting policies and other explanatory information, are drawn up so as to present
fairly, in all material respects, the financial position of the Group and of the Trust and the portfolio of
the Group as at 31 December 2014, the total return, distributable income and movements in
Unitholders’ funds of the Group and of the Trust and cash flows of the Group for the year ended on
that date in accordance with the recommendations of Statement of Recommended Accounting
Practice 7 “Reporting Framework for Unit Trusts” issued by the Institute of Singapore Chartered
Accountants and the provisions of the Trust Deed. At the date of this statement, there are reasonable
grounds to believe that the Group will be able to meet its financial obligations as and when they
materialise.
For and on behalf of the Manager,
CapitaRetail China Trust Management Limited
Tan Tee Hieong
Director
Singapore
26 February 2015
78 | CapitaRetail China Trust Annual Report 2014
Independent Auditors’ Report
Unitholders of CapitaRetail China Trust
(Constituted in the Republic of Singapore pursuant to a trust deed dated 23 October 2006
(as amended))
We have audited the accompanying financial statements of CapitaRetail China Trust (the “Trust”) and
its subsidiaries (the “Group”), which comprise the statements of financial position of the Trust and the
Group and the portfolio statement of the Group as at 31 December 2014, the statements of total
return, distribution statements and statements of movements in Unitholders’ funds of the Trust and of
the Group and the statement of cash flows of the Group for the year then ended, and a summary of
significant accounting policies and other explanatory information, as set out on pages 80 to 146.
MANAGER’S RESPONSIBILITY FOR THE FINANCIAL STATEMENTS
The Manager of the Trust is responsible for the preparation and fair presentation of these financial
statements in accordance with the recommendations of Statement of Recommended Accounting
Practice 7 “Reporting Framework for Unit Trusts” issued by the Institute of Singapore Chartered
Accountants, and for such internal control as the Manager of the Trust determines is necessary to
enable the preparation of financial statements that are free from material misstatement, whether due
to fraud or error.
AUDITORS’ RESPONSIBILITY
Our responsibility is to express an opinion on these financial statements based on our audit. We
conducted our audit in accordance with Singapore Standards on Auditing. Those standards require
that we comply with ethical requirements and plan and perform the audit to obtain reasonable
assurance about whether the financial statements are free from material misstatement.
An audit involves performing procedures to obtain audit evidence about the amounts and disclosures
in the financial statements. The procedures selected depend on the auditor’s judgement, including
the assessment of the risks of material misstatement of the financial statements, whether due to fraud
or error. In making those risk assessments, the auditor considers internal control relevant to the
entity’s preparation and fair presentation of the financial statements in order to design audit
procedures that are appropriate in the circumstances, but not for the purpose of expressing an
opinion on the effectiveness of the entity’s internal control. An audit also includes evaluating the
appropriateness of accounting policies used and the reasonableness of accounting estimates made
by the Manager of the Trust, as well as evaluating the overall presentation of the financial statements.
We believe that the audit evidence we have obtained is sufficient and appropriate to provide a basis
for our audit opinion.
OPINION
In our opinion, the consolidated financial statements of the Group and the statement of financial
position, statement of total return, distribution statement and statement of movements in Unitholders’
funds of the Trust present fairly, in all material respects, the financial position of the Group and the
Trust as at 31 December 2014 and the total return, distributable income, and movements in
Unitholders’ funds of the Group and of the Trust and the cash flows of the Group for the year then
ended in accordance with the recommendations of Statement of Recommended Accounting Practice
7 “Reporting Framework for Unit Trusts” issued by the Institute of Singapore Chartered Accountants.
KPMG LLP
Public Accountants and
Chartered Accountants
Singapore
26 February 2015
Delivering Performance | 79
Statements of Financial Position
As at 31 December 2014
Group
Trust
Note
2014
$’000
2013
$’000
2014
$’000
2013
$’000
Investment properties
4
2,250,783
2,058,094
–
–
Plant and equipment
5
7,759
7,325
–
–
Interests in subsidiaries
6
–
–
1,093,523
1,028,567
Trade and other receivables
7
11,347
11,371
201
224
11
1,547
2,044
1,547
2,044
8
86,626
105,457
238
249
2,358,062
2,184,291
1,095,509
1,031,084
51,140
57,719
5,386
9,060
41,158
34,980
–
–
Assets
Financial derivatives
Cash and cash equivalents
Less:
Liabilities
Trade and other payables
9
Security deposits
Interest-bearing borrowings
10
671,713
712,338
566,823
474,383
Financial derivatives
11
8,605
5,208
8,605
5,208
Deferred tax liabilities
12
204,923
159,620
–
–
2,707
561
15
20
980,246
970,426
580,829
488,671
1,377,816
1,213,865
514,680
542,413
Provision for taxation
Net assets
Represented by:
Unitholders’ funds
13
1,349,738
1,186,951
514,680
542,413
Non-controlling interest
14
28,078
26,914
–
–
1,377,816
1,213,865
514,680
542,413
828,118
803,027
828,118
803,027
1.63
1.48
0.62
0.68
Units in issue (’000)
Net asset value per unit
attributable to Unitholders
($)
15
The accompanying notes form an integral part of these financial statements.
80 | CapitaRetail China Trust Annual Report 2014
Statements of Total Return
Year ended 31 December 2014
Group
Trust
2014
$’000
2013
$’000
2014
$’000
2013
$’000
Gross rental income
Other income
189,088
14,174
149,083
10,992
–
–
–
–
Gross revenue
203,262
160,075
–
–
Land rental
Property related tax
Business tax
Property management fees &
reimbursables
Other property operating expenses
(5,620)
(10,943)
(11,272)
(5,238)
(8,938)
(9,009)
–
–
–
–
–
–
(10,078)
(32,984)
(8,028)
(25,824)
–
–
–
–
Total property operating expenses
(70,897)
(57,037)
–
–
Net property income
132,365
103,038
–
–
Note
Manager’s management fees
– Base fee
– Performance fee
Manager’s acquisition fee
Trustee’s fees
Audit fees
Valuation fees
Other trust operating (expenses)/income
Dividend income
Foreign exchange gain – realised
Finance income
Finance costs
Net finance (costs)/income
Total return before change in fair value
of financial derivatives, investment
properties and unrealised foreign
exchange (loss)/gain
Change in fair value of financial
derivatives
Change in fair value of investment
properties
Foreign exchange (loss)/gain – unrealised
17
18
18
19
20
4
(5,527)
(5,295)
–
(368)
(479)
(188)
(2,151)
–
1,371
(4,283)
(4,122)
–
(302)
(407)
(278)
(426)
–
746
(5,527)
(5,295)
–
(368)
(164)
–
(537)
–
675
(4,283)
(4,122)
(3,562)
(302)
(155)
–
265
17,396
620
874
(21,926)
(21,052)
1,133
(11,329)
(10,196)
24,405
(12,470)
11,935
24,210
(9,784)
14,426
98,676
83,770
–
1,423
(6,977)
(20,148)
104,829
(41)
99,159
101
–
16,406
–
13,922
184,453
(48,505)
10,148
(8)
14,057
(20)
719
20,283
Total return for the year before taxation
Taxation
21
203,464
(57,109)
Total return for the year after taxation
Non-controlling interest
14
146,355
(1,757)
135,948
(3,030)
10,140
–
14,037
–
144,598
132,918
10,140
14,037
17.69
17.52
17.69
17.52
Total return for the year attributable to
Unitholders
Earnings per unit (cents)
– Basic
– Diluted
22
The accompanying notes form an integral part of these financial statements.
Delivering Performance | 81
Distribution Statements
Year ended 31 December 2014
Group
Trust
2014
$’000
2013
$’000
2014
$’000
2013
$’000
Amount available for distribution
to Unitholders at beginning of
the year
34,902
11,256
34,902
11,256
Total return for the year attributable
to Unitholders
144,598
132,918
10,140
14,037
Note
Distribution adjustments
A
(63,716)
(62,858)
70,742
56,023
Income for the year available for
distribution to Unitholders
B
80,882
70,060
80,882
70,060
115,784
81,316
115,784
81,316
Amount available for distribution
to Unitholders
Distribution to Unitholders during
the year:
– Distribution of 4.33 cents per unit
for the period from 1 July 2013
to 31 December 2013
(34,771)
–
(34,771)
–
– Distribution of 4.99 cents per unit
for the period from 1 January
2014 to 30 June 2014
(40,863)
–
(40,863)
–
– Distribution of 1.50 cents per unit
for the period from 2 November
2012 to 31 December 2012
–
(11,234)
–
(11,234)
– Distribution of 4.69 cents per unit
for the period from 1 January
2013 to 30 June 2013
–
(35,180)
–
(35,180)
Amount available for distribution
to Unitholders at end of the
year
Number of Units entitled to
distribution (’000)
Distribution per Unit (cents)
*
*
(75,634)
(46,414)
(75,634)
(46,414)
40,150
34,902
40,150
34,902
828,118
803,027
9.82
9.02
The Distribution per Unit relates to the distribution in respect of the relevant financial year. The
distribution relating to 1 July 2014 to 31 December 2014 will be paid within 90 days of the end
of the distribution period, in accordance with the provisions of the Trust Deed.
The accompanying notes form an integral part of these financial statements.
82 | CapitaRetail China Trust Annual Report 2014
Note A – Distribution adjustments
Group
Note
Trust
2014
$’000
2013
$’000
2014
$’000
2013
$’000
5,295
4,122
5,295
4,122
(1,423)
6,977
20,148
(103,960)
(96,944)
–
–
36,364
32,306
–
–
(4,244)
(3,164)
–
–
(6)
(19)
Distribution adjustment items:
– Manager’s management fees
(performance component
paid/payable in Units)
– Change in fair value of financial
derivatives
–
– Change in fair value of
investment properties1
– Deferred taxation
1
– Transfer to general reserve
– Unrealised foreign exchange
gain 1
– Other adjustments
– Net overseas income not
distributed to the Trust
Net effect of distribution
adjustments
(16,406)
(13,922)
2,835
2,264
–
–
–
–
74,876
45,675
70,742
56,023
(63,716)
(62,858)
Note B – Income for the year available for distribution to Unitholders
Comprises:
– from operations
– from Unitholders’ contribution
Total Unitholders’ distribution
1
16
6,006
24,385
6,006
24,385
74,876
45,675
74,876
45,675
80,882
70,060
80,882
70,060
Excludes non-controlling interest’s share.
The accompanying notes form an integral part of these financial statements.
Delivering Performance | 83
Statements of Movements in Unitholders’ Funds
Year ended 31 December 2014
Group
Trust
2014
$’000
2013
$’000
2014
$’000
2013
$’000
1,186,951
978,742
542,413
504,541
144,598
132,918
10,140
14,037
–
–
Operations
Unitholders’ funds as at beginning of the year
Change in Unitholders’ funds resulting from
operations
Transfer to general reserve
Net increase in net assets resulting from
operations
(4,244)
(3,164)
140,354
129,754
10,140
14,037
2,251
157
2,251
157
Translation differences from financial
statements of foreign operations
46,749
52,209
–
–
Exchange differences on monetary items
forming part of net investment in
foreign operations
16,290
20,819
–
–
Exchange differences on hedges of net
investment in foreign operations
(6,977)
(21,572)
–
–
Net gain recognised directly in
Unitholders’ funds
58,313
51,613
2,251
157
4,244
3,164
–
–
–
59,038
–
59,038
– Units issued and to be issued as
satisfaction of the portion of Manager’s
management fees payable in Units
5,295
4,122
5,295
4,122
– Units issued in respect of acquisition fee for
CapitaMall Grand Canyon
3,562
–
3,562
–
26,653
8,732
26,653
8,732
(75,634)
(46,414)
(75,634)
(46,414)
Movements in hedging reserve
Effective portion of changes in fair value of
cash flow hedges
Movements in foreign currency translation
reserve
Movement in general reserve
Unitholders’ transactions
New Units issued
Creation of Units paid/payable to Manager
Units issued in respect of the distribution
reinvestment plan
Distributions to Unitholders
Equity issue expenses
Net (decrease)/increase in net assets
resulting from Unitholders’ transactions
Unitholders’ funds as at end of year
–
(40,124)
1,349,738
The accompanying notes form an integral part of these financial statements.
84 | CapitaRetail China Trust Annual Report 2014
(1,800)
23,678
1,186,951
–
(1,800)
(40,124)
23,678
514,680
542,413
Portfolio Statement
As at 31 December 2014
Group
Description of
leasehold
property
Location
Term of
lease
(years)
Lease
expiry
Valuation
Percentage
of
Unitholders’
funds
Valuation
2014
2013
2014
2013
2014
2013
RMB’000
RMB’000
$’000
$’000
%
%
CapitaMall
Xizhimen
No. 1
Xizhimenwai
Avenue,
Xicheng District,
Beijing
40 – 50
August
2044/2054
2,777,000
2,600,000
588,446
532,246
43.6
44.8
CapitaMall
Wangjing
No. 33 Guangshun
North Street,
Blk 213 & 215,
Chaoyang District,
Beijing
38 – 48
May
2043/2053
2,050,000
1,900,000
434,395
388,949
32.2
32.8
CapitaMall
Grand Canyon
No. 16 Nansanhuan
Xi Road,
Fengtai District,
Beijing
40 – 50
August
2044/2054
1,948,000
1,881,793
412,781
385,222
30.5
32.5
CapitaMall
Anzhen
Section 5
No. 4 of Anzhen
Xi Li,
Chaoyang District,
Beijing
29 – 37
October
2034/
March and
June 2042
973,000
949,000
206,179
194,270
15.3
16.4
CapitaMall Erqi
No. 3 Minzhu Road,
Erqi District,
Zhengzhou,
Henan Province
38
May 2042
606,000
590,000
128,411
120,779
9.5
10.2
CapitaMall
Minzhongleyuan1
No. 704
Zhongshan
Avenue,
Jianghan District,
Hankou, Wuhan,
Hubei Province
40
June 2044/
September
2045
564,911
504,911
119,705
103,360
8.9
8.7
CapitaMall
Shuangjing
No. 31
Guangqu Road,
Chaoyang District,
Beijing
40
July 2042
558,000
543,000
118,240
111,158
8.8
9.4
CapitaMall
Qibao2
No. 3655
Qi Xin Road,
Minhang District,
Shanghai
39
March
2043
485,000
472,000
102,772
96,623
7.6
8.1
CapitaMall
Saihan
No. 26
Ordos Street,
Saihan District,
Huhhot,
Inner Mongolia
Autonomous
Region
35
March
2041
400,000
362,000
84,760
74,105
6.3
6.2
10,361,911
9,802,074
2,195,689
2,006,712
162.7
169.1
Balance carried
forward
The accompanying notes form an integral part of these financial statements.
Delivering Performance | 85
Portfolio Statement
As at 31 December 2014
Description of
leasehold
property
Location
Term of
lease
(years)
Lease
expiry
Balance brought
forward
CapitaMall
Wuhu
No. 37 Zhongshan
North Road,
Jinghu District,
Wuhu,
Anhui Province
40
Investment properties, at valuation
May 2044
Valuation
Percentage
of
Unitholders’
funds
Valuation
2014
2013
2014
2013
2014
2013
RMB’000
RMB’000
$’000
$’000
%
%
10,361,911
9,802,074
2,195.689
2,006,712
162.7
169.1
260,000
251,000
55,094
51,382
4.1
4.3
10,621,911
10,053,074
2,250,783
2,058,094
166.8
173.4
(64.7)
(71.1)
102.1
102.3
Other assets and liabilities (net)
(872,967)
1,377,816
Net assets attributable to noncontrolling interests
Net assets attributable to Unitholders
(28,078)
1,349,738
(844,229)
1,213,865
(26,914)
1,186,951
(2.1)
100.0
(2.3)
100.0
Notes:
1
The carrying amount of CapitaMall Minzhongleyuan includes the valuation of the retail mall and carrying amount of the three
residential units.
2
CapitaMall Qibao is held under a master lease by CapitaRetail Dragon Mall (Shanghai) Co., Ltd, a subsidiary of CapitaRetail
China Investments (B) Alpha Pte. Ltd. The master lease was entered with Shanghai Jin Qiu (Group) Co., Ltd (“Jin Qiu”), the
legal owner of CapitaMall Qibao and expires in January 2024, with the right to renew for a further term of 19 years and two
months from January 2024 at the option of the Group. Accordingly, the land use rights is held by Jin Qiu.
The accompanying notes form an integral part of these financial statements.
86 | CapitaRetail China Trust Annual Report 2014
Consolidated Statement of Cash Flows
Year ended 31 December 2014
Group
2014
$’000
2013
$’000
146,355
135,948
(874)
21,926
2,754
28
57,109
5,295
81
(104,829)
–
(1,133)
11,329
2,088
(58)
48,505
4,122
176
(99,159)
(1,423)
Operating income before working capital changes
Changes in working capital:
Trade and other receivables
Trade and other payables
127,845
100,395
(60)
2,083
(766)
(10,582)
Cash generated from operating activities
Income tax paid
129,868
(18,452)
89,047
(20,422)
Net cash from operating activities
111,416
68,625
Investing activities
Interest received
Net cash outflow on purchase of investment property
Capital expenditure on investment properties
Proceeds from disposal of plant and equipment
Purchase of plant and equipment
874
–
(14,597)
13
(2,960)
1,133
(134,610)
(7,906)
5
(1,937)
(16,670)
(143,315)
Financing activities
Proceeds from issuance of new Units
Distribution to Unitholders
Payment of equity issue expenses
Payment of financing expenses
Proceeds from draw down of interest-bearing borrowings
Repayment of interest-bearing borrowings
Settlement of derivative contracts
Interest paid
–
(48,981)
(460)
(774)
250,900
(294,797)
(832)
(22,317)
59,038
(37,682)
(915)
(977)
309,148
(279,752)
(2,824)
(11,309)
Net cash (used in)/from financing activities
(117,261)
34,727
(22,515)
105,457
3,684
(39,963)
140,476
4,944
86,626
105,457
Note
Operating activities
Total return for the year after taxation
Adjustments for:
Finance income
Finance costs
Depreciation and amortisation
Impairment losses/(write-back) on trade receivables, net
Taxation
Manager’s management fees paid/payable in Units
Plant and equipment written off
Change in fair value of investment properties
Change in fair value of financial derivative
A(i)
B
A(ii)(iii)
Net cash used in investing activities
Decrease in cash and cash equivalents
Cash and cash equivalents at 1 January
Effect of foreign exchange rate changes on cash balances
Cash and cash equivalents at 31 December
8
The accompanying notes form an integral part of these financial statements.
Delivering Performance | 87
Consolidated Statement of Cash Flows
Year ended 31 December 2014
Notes:
(A) Significant non-cash and other transactions
(i) $4.0 million (2013: $3.1 million) of the $5.3 million (2013: $4.1 million) of the performance
component of the Manager’s management fee was paid during the year through the issue
of 2,682,096 Units (2013: 2,074,331 Units). The remaining $1.3 million (2013: $1.0 million)
will be paid through the issue of 844,273 new Units (2013: 786,472 new Units) subsequent
to the year end.
(ii)
The Group incurred $36.1 million to purchase investment property in 2008, of which $nil
and $43,000 were paid in 2014 and 2013 respectively.
(iii) The Group enhanced its investment properties during the year, of which $3.4 million (2013:
$6.6 million) was paid. During the year, the Group paid $11.2 million (2013: $1.3 million) of
the prior years unpaid balance.
(B) Significant non-cash and other transactions
Net cash outflows on acquisition of subsidiaries are provided below:
Group
2014
$’000
2013
$’000
Investment property
–
380,459
Cash
Other assets
Other liabilities
–
–
–
8,293
2,861
(248,710)
Net identifiable assets and liabilities acquired
–
142,903
Cash consideration paid
Cash acquired
–
–
(142,903)
8,293
Net cash outflow
–
(134,610)
The accompanying notes form an integral part of these financial statements.
88 | CapitaRetail China Trust Annual Report 2014
Notes to the Financial Statements
These notes form an integral part of the financial statements.
The financial statements were authorised for issue by the Manager and the Trustee on 26 February
2015.
1.
GENERAL
CapitaRetail China Trust (the “Trust”) is a Singapore-domiciled unit trust constituted pursuant to
the trust deed dated 23 October 2006 (as amended by the first supplemental deed dated 8
November 2006, a second supplemental deed dated 15 April 2010, a third supplemental deed
dated 5 April 2012 and a fourth supplemental deed dated 14 February 2014) (collectively the
“Trust Deed”) between CapitaRetail China Trust Management Limited (the “Manager”) and
HSBC Institutional Trust Services (Singapore) Limited (the “Trustee”). The Trust Deed is
governed by the laws of the Republic of Singapore. The Trustee is under a duty to take into
custody and hold the assets of the Trust held by it or through its subsidiaries (the “Group”) in
trust for the holders (“Unitholders”) of Units in the Trust (the “Units”).
The Trust was formally admitted to the Official List of the Singapore Exchange Securities Trading
Limited (the “SGX-ST”) on 8 December 2006 (the “Listing Date”) and was included under the
Central Provident Fund (“CPF”) Investment Scheme on 8 December 2006.
The principal activities of the Trust are those relating to investment in a diversified portfolio of
income-producing properties located primarily in the People’s Republic of China (“China”),
Hong Kong and Macau and used primarily for retail purposes.
The principal activities of the subsidiaries are those of investment holding of properties located
in China and used for retail purposes.
The Group has entered into several service agreements in relation to the management of the
Trust and its property operations. The fee structures for these services are as follows:
(a)
Trustee’s fees
Pursuant to the Trust Deed, the Trustee’s fee shall not exceed 0.03% per annum of the value
of all the assets of the Group (“Deposited Property”), subject to a minimum of $15,000 per
month, excluding out of pocket expenses and Goods and Service Tax.
(b) Manager’s management fees
The Manager is entitled under the Trust Deed to the following management fees:
•
a base fee of 0.25% per annum of the value of the Deposited Property;
•
a performance fee of 4.0% per annum of the net property income in the relevant
financial year (calculated before accounting for the performance fee in that financial
year); and
•
an authorised investment management fee of 0.5% per annum of the value of
authorised investments which are not real estate. Where such authorised investment is
an interest in a property fund (either a real estate investment trust or private property
fund) wholly managed by a wholly-owned subsidiary of CapitaLand Limited, no
authorised investment management fee shall be payable in relation to such authorised
investment.
Delivering Performance | 89
Notes to the Financial Statements
1.
GENERAL (continued)
(b) Manager’s management fees (continued)
The Manager may elect to receive the management fees in cash or Units or a combination
of cash and/or Units (as it may in its sole discretion determine).
(c)
Property management fees
Under the property management agreements in respect of each property, the property
managers will provide lease management services, property tax services and marketing
co-ordination services in relation to that property. The property managers are entitled to the
following fees:
•
2.0% per annum of the gross revenue;
•
2.0% per annum of the net property income; and
•
0.5% per annum of the net property income in lieu of leasing commissions otherwise
payable to the property managers and/or third party agents.
(d) Acquisition fee
For any authorised investment acquired from time to time by the Trustee on behalf of the
Trust, the acquisition fee payable to the Manager shall be:
•
up to 1.5% of the purchase price in the case of any authorised investment (as defined
in the Trust Deed) acquired by the Trust for less than $200 million; and
•
1.0% of the purchase price in the case of any authorised investment acquired by the
Trust for $200 million or more.
The acquisition fee payable in respect of any authorised investment acquired from time to
time by the Trustee on behalf of the Trust from CapitaMalls China Income Fund, CapitaMalls
China Income Fund II, CapitaMalls China Income Fund III, CapitaMalls China Development
Fund III, or CapitaMalls Asia Limited shall be 1.0% of the purchase price paid by the Trust.
No acquisition fee was payable for the acquisition of the initial property portfolio of the
Trust.
The acquisition fee is payable to the Manager in the form of cash and/or Units (as the
Manager may elect) at the prevailing market price provided that in respect of any
acquisition of real estate assets from interested parties, such a fee should, if required by
the applicable laws, rules and/or regulations, be in the form of Units issued by the Trust at
prevailing market price(s) and subject to such transfer restrictions as may be imposed.
Any payment to third party agents or brokers in connection with the acquisition of any
authorised investments for the Trust shall be paid by the Manager to such persons out of
the Deposited Property of the Trust or the assets of the relevant special purpose vehicle,
and not out of the acquisition fee received or to be received by the Manager.
90 | CapitaRetail China Trust Annual Report 2014
1.
GENERAL (continued)
(e) Divestment fee
The Manager is entitled to receive a divestment fee of 0.5% of the sale price of any
authorised investment disposed directly or indirectly by the Trust, prorated if applicable to
the proportion of the Trust’s interest.
The divestment fee is payable to the Manager in the form of cash and/or Units (as the
Manager may elect) at the prevailing market price provided that in respect of any
divestment of real estate assets to interested parties, such a fee should, if required by the
applicable laws, rules and/or regulations, be in the form of Units issued by the Trust at
prevailing market price(s) and subject to such transfer restrictions as may be imposed.
Any payment to third party agents or brokers in connection with the divestment of any
authorised investments for the Trust shall be paid by the Manager to such persons out of
the Deposited Property of the Trust or the assets of the relevant special purpose vehicle,
and not out of the divestment fee received or to be received by the Manager.
2.
BASIS OF PREPARATION
(a) Statement of compliance
The financial statements have been prepared in accordance with the recommendations of
Statement of Recommended Accounting Practice (“RAP”) 7 “Reporting Framework for Unit
Trusts” issued by the Institute of Singapore Chartered Accountants, the applicable
requirements of the Code on Collective Investment Schemes (the “CIS Code”) issued by the
Monetary Authority of Singapore (“MAS”) and the provisions of the Trust Deed. RAP 7
requires that accounting policies adopted should generally comply with the principles
relating to recognition and measurement of the Singapore Financial Reporting Standards
(“FRS”).
(b) Basis of measurement
The financial statements have been prepared on the historical cost basis except for the
following material items on the statement of financial position:
(c)
•
derivative financial instruments are measured at fair value
•
investment properties are measured at fair value.
Functional and presentation currency
Items included in the financial statements of each entity in the Group are measured using
the currency that best reflects the economic substance of the underlying events and
circumstances relevant to that entity (the “functional currency”). The consolidated financial
statements of the Group are presented in Singapore dollars, which is the functional
currency of the Trust. All financial information presented in Singapore dollars has been
rounded to the nearest thousand, unless otherwise stated.
Delivering Performance | 91
Notes to the Financial Statements
2.
BASIS OF PREPARATION (continued)
(d) Use of estimates and judgements
The preparation of financial statements in conformity with RAP 7 requires the Manager to
make judgements, estimates and assumptions that affect the application of accounting
policies and the reported amounts of assets, liabilities, income and expenses. The
estimates and associated assumptions are based on historical experience and various
other factors that are believed to be reasonable under the circumstances, the results of
which form the basis of making the judgements about carrying amounts of assets and
liabilities that are not readily apparent from other sources.
Estimates and underlying assumptions are reviewed on an ongoing basis. Revisions to
accounting estimates are recognised in the period in which the estimates are revised and
any future periods affected.
Information about assumptions and estimation uncertainties that have a significant risk of
resulting in a material adjustment within the next financial year are included in the following
notes:
•
•
(e)
Note 4
Note 27
–
–
Valuation of investment properties
Valuation of financial instruments.
Changes in accounting policies
(i) Subsidiaries
FRS 110 Consolidated Financial Statements introduces a new control model that
focuses on whether the Group has power over an investee, exposure or rights to
variable returns from its involvement with the investee and ability to use its power to
affect those returns.
In accordance with the transitional provisions of FRS 110, the Group reassessed its
involvement with investees under the new control model. The adoption of the new
standard did not result in a change in the control conclusion in respect of its
investment in its investees.
(ii) Disclosure of interests in other entities
From 1 January 2014, as a result of FRS 112 Disclosure of Interests in Other Entities,
the Group has expanded its disclosures about its interests in subsidiaries (see Note 6
and Note 14).
(iii) Offsetting of financial assets and financial liabilities
Under the Amendments to FRS 32 Financial Instruments: Presentation – Offsetting
Financial Assets and Financial Liabilities, to qualify for offsetting, the right to set off a
financial asset and a financial liability must not be contingent on a future event and
must be enforceable both in the normal course of business and in the event of default,
insolvency or bankruptcy of the entity and all counterparties. The adoption of
amendments to FRS 32 does not have any significant impact on the financial position
or performance of the Group and the Trust.
92 | CapitaRetail China Trust Annual Report 2014
2.
BASIS OF PREPARATION (continued)
(e) Changes in accounting policies (continued)
(iv) Disclosures of recoverable amount for non-financial assets
From 1 January 2014, the Group has adopted Amendments to FRS 36: Impairment of
Assets Recoverable Amount Disclosures for Non-Financial Assets. The adoption of
Amendments to FRS 36 has no impact on the financial position or performance of the
Group and the Trust.
(v)
3.
Levies
The Group has adopted INT FRS 121 Levies with a date of initial application of 1
January 2014. The adoption of INT FRS 121 does not have any significant impact on
the financial position or performance of the Group and the Trust.
SIGNIFICANT ACCOUNTING POLICIES
The accounting policies set out below have been applied consistently to all periods presented
in these financial statements, and have been applied consistently by Group entities, except as
explained in Note 2(e), which addresses changes in accounting policies.
(a)
Basis of consolidation
(i) Subsidiaries
Subsidiaries are entities controlled by the Group. The Group controls an entity when
it is exposed to, or has rights to, variable returns from its involvement with the entity
and has the ability to affect these returns through its power over the entity. The
financial statements of subsidiaries are included in the consolidated financial
statements from the date that control commences until the date that control ceases.
The Group’s acquisition of subsidiaries are primarily accounted for as acquisitions of
assets as the subsidiaries are special purpose vehicles established for the sole
purpose of holding assets.
(ii) Loss of control
Upon the loss of control, the Trust derecognises the assets and liabilities of the
subsidiary, any non-controlling interests and the other components of equity related to
the subsidiary. Any surplus or deficit arising on the loss of control is recognised in the
statement of total return.
If the Group retains any interest in the previous subsidiary, then such interest is
measured at fair value at the date that control is lost. Subsequently, it is accounted for
as an equity-accounted investee or as an available-for-sale financial asset depending
on the level of influence retained.
(iii) Transactions eliminated on consolidation
Intra-group balances and transactions, and any unrealised income or expenses
arising from intra-group transactions, are eliminated in preparing the consolidated
financial statements. Unrealised gains arising from transactions with equity accounted
investees are eliminated against the investment to the extent of the Group’s interest in
the investee. Unrealised losses are eliminated in the same way as unrealised gains,
but only to the extent that there is no evidence of impairment.
Delivering Performance | 93
Notes to the Financial Statements
3.
SIGNIFICANT ACCOUNTING POLICIES (continued)
(a) Basis of consolidation (continued)
(iv) Accounting for subsidiaries by the Trust
Investments in subsidiaries are stated in the Trust’s statement of financial position at
cost less accumulated impairment losses.
(b) Foreign currency
(i) Foreign currency transactions
Transactions in foreign currencies are translated at the foreign exchange rates ruling
at the date of the transaction. Monetary assets and liabilities denominated in foreign
currencies at the reporting date are retranslated at the foreign exchange rates ruling
at that date. Non-monetary assets and liabilities measured at cost in a foreign currency
are translated using foreign exchange rates at the date of the transaction. Nonmonetary assets and liabilities denominated in foreign currencies that are measured at
fair value are retranslated at the foreign exchange rates ruling at the date on which the
fair value was determined.
Foreign currency differences arising on retranslation are recognised in the statement
of total return, except for differences arising on the retranslation of monetary items that
in substance form part of the Group’s net investment in a foreign operation (see below)
and financial derivatives designated as hedges of the net investment in a foreign
operation (see Note 3(c)(iii)).
(ii) Foreign operations
The assets and liabilities of foreign operations are translated to Singapore dollars at
exchange rates at the reporting date. The income and expenses of foreign operations
are translated to Singapore dollars at exchange rates at the dates of the transactions.
Goodwill and fair value adjustments arising on the acquisition of a foreign operation
are treated as assets and liabilities of the foreign operation and translated at the
exchange rate at the reporting date.
Foreign currency differences are recognised in the foreign currency translation
reserve. When a foreign operation is disposed of, in part or in full, the relevant amount
is transferred to the statement of total return.
(iii) Net investment in a foreign operation
Exchange differences arising from monetary items that in substance form part of the
Trust’s net investment in a foreign operation are recognised in the Trust’s statement of
total return. Such exchange differences are reclassified to foreign currency translation
reserve in the consolidated financial statements. When the hedged net investment is
disposed of, the cumulative amount in the foreign currency translation reserve is
transferred to the statement of total return as an adjustment to the gain or loss arising
on disposal.
94 | CapitaRetail China Trust Annual Report 2014
3.
SIGNIFICANT ACCOUNTING POLICIES (continued)
(c) Financial instruments
(i) Non-derivative financial assets
The Group initially recognises loans and receivables and deposits on the date that
they are originated. All other financial assets are recognised initially on the trade date
at which the Group becomes a party to the contractual provisions of the instrument.
The Group derecognises a financial asset when the contractual rights to the cash flows
from the asset expire, or it transfers the rights to receive the contractual cash flows on
the financial asset in a transaction in which substantially all the risks and rewards of
ownership of the financial asset are transferred. Any interest in transferred financial
assets that is created or retained by the Group is recognised as a separate asset or
liability.
Financial assets and liabilities are offset and the net amount presented in the
statement of financial position when, and only when, the Group has a legal right to
offset the amounts and intends either to settle on a net basis or to realise the asset and
settle the liability simultaneously.
The Group has loans and receivables as its non-derivative financial assets.
Loans and receivables
Loans and receivables are financial assets with fixed or determinable payments that
are not quoted in an active market. Such assets are recognised initially at fair value
plus any directly attributable transaction costs. Subsequent to initial recognition, loans
and receivables are measured at amortised cost using the effective interest method,
less any impairment losses.
Loans and receivables comprise non-trade amounts due from subsidiaries, trade and
other receivables excluding prepayments and cash and cash equivalents.
Cash and cash equivalents comprise cash balances and bank deposits.
(ii) Non-derivative financial liabilities
Financial liabilities are recognised initially on the trade date at which the Group
becomes a party to the contractual provisions of the instrument.
The Group derecognises a financial liability when its contractual obligations are
discharged or cancelled or expired.
Financial assets and liabilities are offset and the net amount presented in the
statement of financial position when, and only when, the Group has a legal right to
offset the amounts and intends either to settle on a net basis or to realise the asset and
settle the liability simultaneously.
Delivering Performance | 95
Notes to the Financial Statements
3.
SIGNIFICANT ACCOUNTING POLICIES (continued)
(c) Financial instruments (continued)
(ii) Non-derivative financial liabilities (continued)
The Group has the following non-derivative financial liabilities: trade and other
payables, security deposits and interest-bearing borrowings.
Such financial liabilities are recognised initially at fair value plus any directly
attributable transaction costs. Subsequent to initial recognition, these financial
liabilities are measured at amortised cost using the effective interest method.
(iii) Derivative financial instruments, including hedge accounting
The Group holds derivative financial instruments to hedge its foreign currency and
interest rate risk exposures. Embedded derivatives are separated from the host
contract and accounted for separately if the economic characteristics and risks of the
host contract and the embedded derivative are not closely related, a separate
instrument with the same terms as the embedded derivative would meet the definition
of a derivative, and the combined instrument is not measured at fair value through the
statement of total return.
On initial designation of the hedge, the Group formally documents the relationship
between the hedging instrument(s) and hedged item(s), including the risk
management objectives and strategy in undertaking the hedge transaction and the
hedged risk, together with the methods that will be used to assess the effectiveness
of the hedging relationship. The Group makes an assessment, both at the inception of
the hedge relationship as well as on an ongoing basis, of whether the hedging
instruments are expected to be “highly effective” in offsetting the changes in the fair
value or cash flows of the respective hedged items attributable to the hedged risk, and
whether the actual results of each hedge are within a range of 80%-125%. For a cash
flow hedge of a forecast transaction, the transaction should be highly probable to
occur and should present an exposure to variations in cash flows that could ultimately
affect the statement of total return.
Derivatives are recognised initially at fair value; attributable transaction costs are
recognised in the statement of total return when incurred. Subsequent to initial
recognition, derivatives are measured at fair value, and changes therein are
accounted for as described below.
Cash flow hedges
When a derivative is designated as the hedging instrument in a hedge of the variability
in cash flows attributable to a particular risk associated with a recognised asset or
liability or a highly probable forecast transaction that could affect total return, the
effective portion of changes in the fair value of the derivative is recognised and
presented in the hedging reserve in Unitholders’ fund. The amount recognised in the
hedging reserve is removed and included in the statement of total return in the same
period as the hedged cash flows affect the statement of total return under the same
line item in the statement of total return as the hedged item. Any ineffective portion of
changes in the fair value of the derivative is recognised immediately in the statement
of total return.
96 | CapitaRetail China Trust Annual Report 2014
3.
SIGNIFICANT ACCOUNTING POLICIES (continued)
(c) Financial instruments (continued)
(iii) Derivative financial instruments, including hedge accounting (continued)
Cash flow hedges (continued)
If the hedging instrument no longer meets the criteria for hedge accounting, expires
or is sold, terminated or exercised, or the designation is revoked, then hedge
accounting is discontinued prospectively. The cumulative gain or loss previously
recognised and presented in the hedging reserve in Unitholders’ fund remains there
until the forecast transaction occurs. When the hedged item is a non-financial asset,
the amount recognised in the hedging reserve is transferred to the carrying amount of
the asset when it is recognised. If the forecast transaction is no longer expected to
occur, then the balance in the hedging reserve is recognised immediately in the
statement of total return. In other cases, the amount recognised in the hedging reserve
is transferred to the statement of total return in the same period that the hedged item
affects the statement of total return.
Hedge of net investment in foreign operation
Foreign currency differences arising on the retranslation of a financial liability
designated as a hedge of a net investment in a foreign operation are recognised in the
Trust’s statement of total return. On consolidation, such differences are recognised
directly, as part of foreign currency translation reserve, to the extent that the hedge is
effective. To the extent that the hedge is ineffective, such differences are recognised
in the statement of total return. When the hedged net investment is disposed of, the
cumulative amount in the foreign currency translation reserve attributable to that
investment is transferred to the statement of total return as an adjustment to the gain
or loss on disposal.
(d) Investment properties
Investment properties are properties held either to earn rental income or capital
appreciation or both. Investment properties are accounted for as non-current assets and
are stated at initial cost on acquisition and at fair value thereafter. The cost of a purchased
property comprises its purchase price and any directly attributable expenditure.
Transaction costs are included in the initial measurement. Fair value is determined in
accordance with the Trust Deed, which requires the investment properties to be valued by
independent registered valuers at least once a year in accordance with the CIS Code
issued by the MAS.
Any increase or decrease on revaluation is credited or charged to the statement of total
return as a net change in fair value of the investment properties.
Subsequent expenditure relating to investment properties that have already been
recognised is added to the carrying amount when it is probable that future economic
benefits, in excess of the originally assessed standard of performance of the existing asset
will flow to the Group.
All other subsequent expenditure is recognised as an expense in the period in which it is
incurred.
Delivering Performance | 97
Notes to the Financial Statements
3.
SIGNIFICANT ACCOUNTING POLICIES (continued)
(d) Investment properties (continued)
When an investment property is disposed of, the resulting gain or loss recognised in the
statement of total return is the difference between the net disposal proceeds and the
carrying amount of the property.
Investment properties are not depreciated. The properties are subject to continued
maintenance and regularly revalued on the basis set out above.
(e)
Plant and equipment
(i) Recognition and measurement
Plant and equipment are stated at cost less accumulated depreciation and
accumulated impairment losses. Cost includes expenditure that is directly attributable
to the acquisition of the asset.
When parts of an item of plant and equipment have different useful lives, they are
accounted for as separate items (major components) of plant and equipment.
Gains or losses arising from the retirement or disposal of plant and equipment are
determined as the difference between the estimated net disposal proceeds and the
carrying amount of the asset and are recognised in the statement of total return on the
date of retirement or disposal.
(ii) Subsequent costs
The cost of replacing part of an item of plant and equipment is recognised in the
carrying amount of the item if it is probable that the future economic benefits
embodied within the part will flow to the Group and its cost can be measured reliably.
The cost of the day-to-day servicing of plant and equipment are recognised in the
statement of total return as incurred.
(iii) Depreciation
Depreciation is provided on a straight-line basis so as to write off items of plant and
equipment, and major components that are accounted for separately, over their
estimated useful lives as follows:
Improvement to premises
–
5 years
Plant and machinery
–
3 to 5 years
Motor vehicles
–
5 years
Furniture, fittings and equipment
–
2 to 5 years
Depreciation methods, useful lives and residual values are reviewed, and adjusted as
appropriate, at each reporting date.
98 | CapitaRetail China Trust Annual Report 2014
3.
SIGNIFICANT ACCOUNTING POLICIES (continued)
(f) Impairment
(i) Financial assets (including receivables)
A financial asset not carried at fair value through the statement of total return is
assessed at each reporting date to determine whether there is objective evidence that
it is impaired. A financial asset is impaired if objective evidence indicates that a loss
event has occurred after the initial recognition of the asset, and that the loss event had
a negative effect on the estimated future cash flows of that asset that can be estimated
reliably.
Objective evidence that financial assets are impaired can include default or
delinquency by a debtor, restructuring of an amount due to the Group on terms that the
Group would not consider otherwise, indications that a debtor will enter bankruptcy.
The Group considers evidence of impairment for receivables at both a specific asset
and collective level. All individually significant receivables are assessed for specific
impairment. All individually significant receivables found not to be specifically
impaired are then collectively assessed for any impairment that has been incurred but
not yet identified. Receivables that are not individually significant are collectively
assessed for impairment by grouping together receivables with similar risk
characteristics.
In assessing collective impairment, the Group uses historical trends of the probability
of default, timing of recoveries and the amount of loss incurred, adjusted for
management’s judgement as to whether current economic and credit conditions are
such that the actual losses are likely to be greater or less than suggested by historical
trends.
An impairment loss in respect of a financial asset measured at amortised cost is
calculated as the difference between its carrying amount and the present value of the
estimated future cash flows discounted at the asset’s original effective interest rate.
Losses are recognised in the statement of total return and reflected in an allowance
account against receivables. Interest on the impaired asset continues to be
recognised through the unwinding of the discount. When the Group considers that
there are no realistic prospects of recovery of the asset, the relevant amounts are
written off. If the amount of impairment loss subsequently decreases and the decrease
can be related objectively to an event occurring after the impairment was recognised,
then the previously recognised impairment loss is reversed through the statement of
total return.
(ii) Non-financial assets
The carrying amounts of the Group’s non-financial assets, other than investment
properties, are reviewed at each reporting date to determine whether there is any
indication of impairment. If any such indication exists, then the asset’s recoverable
amount is estimated.
Delivering Performance | 99
Notes to the Financial Statements
3.
SIGNIFICANT ACCOUNTING POLICIES (continued)
(f) Impairment (continued)
(ii) Non-financial assets (continued)
The recoverable amount of an asset or cash-generating unit is the greater of its value
in use and its fair value less costs to sell. In assessing value in use, the estimated
future cash flows are discounted to their present value using a pre-tax discount rate
that reflects current market assessments of the time value of money and the risks
specific to the asset. For the purpose of impairment testing, assets that cannot be
tested individually are grouped together into the smallest group of assets that
generates cash inflows from continuing use that are largely independent of the cash
inflows of other assets or groups of assets (the “cash-generating unit”, or “CGU”).
An impairment loss is recognised if the carrying amount of an asset or its CGU
exceeds its estimated recoverable amount. Impairment losses are recognised in the
statement of total return. Impairment losses recognised in respect of the CGU are
allocated first to reduce the carrying amount of any goodwill allocated to the units, and
then to reduce the carrying amounts of the other assets in the unit (group of units) on
a pro rata basis.
An impairment loss in respect of goodwill is not reversed. In respect of other assets,
impairment losses recognised in prior periods are assessed at each reporting date for
any indications that the loss has decreased or no longer exists. An impairment loss is
reversed if there has been a change in the estimates used to determine the
recoverable amount. An impairment loss is reversed only to the extent that the asset’s
carrying amount does not exceed the carrying amount that would have been
determined, net of depreciation or amortisation, if no impairment loss had been
recognised.
(g) Unitholders’ funds
Unitholders’ funds represent the residual interests in the Group’s net assets upon
termination and are classified as equity.
Expenses incurred in connection with the issuance of Units in the Trust are deducted
directly against the Unitholders’ funds.
(h) Employee benefits
(i) Defined contribution plans
Obligations for contributions to defined contribution pension plans are recognised as
an expense in the statement of total return as incurred.
(ii) Short-term benefits
Short-term employee benefit obligations are measured on an undiscounted basis and
are expensed as the related service is provided.
A provision is recognised for the amount expected to be paid under short-term cash
bonus if the Group has a present legal or constructive obligation to pay this amount as
a result of past service provided by the employee and the obligation can be estimated
reliably.
100 | CapitaRetail China Trust Annual Report 2014
3.
SIGNIFICANT ACCOUNTING POLICIES (continued)
(i) Distribution policy
The Trust’s distribution policy is to distribute at least 90.0% of its distributable income in
each financial year to Unitholders, other than from the sale of properties that are
determined by Inland Revenue Authority of Singapore to be trading gains.
(j)
Revenue recognition
(i) Rental income
Rental income receivable under operating leases is recognised on a straight-line basis
over the term of the lease, except where an alternative basis is more representative of
the pattern of benefits to be derived from the leased assets. Lease incentives granted
are recognised as an integral part of the total rental to be received. Contingent rentals,
which include gross turnover rental, are recognised as income in the accounting
period on an earned basis. No contingent rental is recognised if there are uncertainties
due to the possible return of the amounts received.
(ii) Dividend income
Dividend income is recognised when the right to receive payment is established.
(k)
Lease payments
Payment made under operating leases are recognised in profit or loss on a straight-line
basis over the term of the lease. Lease incentives received are recognised as an integral
part of the total lease expense, over the term of the lease.
Contingent lease payments are accounted for by revising the minimum lease payments
over the remaining term of the lease when the lease adjustment is confirmed.
(l)
Expenses
(i) Property expenses
Property expenses are recognised on an accrual basis.
(ii) Manager’s management fees, property management fees and Trustee’s fees
These are recognised on an accrual basis based on the applicable formula stipulated
in Note 1.
(m) Finance income and finance costs
Finance income comprises interest income recognised in the statement of total return as it
accrues, using the effective interest method.
Finance costs which comprise interest expense on borrowings and expense incurred in
connection with borrowings are recognised in the statement of total return, using the
effective interest method over the period of the borrowings.
Delivering Performance | 101
Notes to the Financial Statements
3.
SIGNIFICANT ACCOUNTING POLICIES (continued)
(n) Taxation
Taxation on the returns for the year comprises current and deferred tax. Taxation is
recognised in the statement of total return except to the extent that it relates to items
recognised directly in Unitholders’ fund.
Current tax is the expected tax payable on the taxable income for the year, using tax rates
enacted or substantively enacted at the reporting date and any adjustment to tax payable
in respect of previous years.
Deferred tax is in respect of temporary differences between the carrying amounts of assets
and liabilities for financial reporting purposes and the amounts used for taxation purposes.
Deferred tax is not recognised for:
•
temporary differences on the initial recognition of assets or liabilities in a transaction
that is not a business combination and that affects neither accounting nor taxable
profit; and
•
temporary differences relating to investments in subsidiaries to the extent that it is
probable that they will not reverse in the foreseeable future.
Deferred tax is measured at the tax rates that are expected to be applied to the temporary
differences when they reverse, based on the laws that have been enacted or substantively
enacted by the reporting date. Deferred tax assets and liabilities are offset if there is a
legally enforceable right to offset current tax liabilities and assets and they relate to income
taxes levied by the same tax authority on the same taxable entity, or on different tax entities,
but they intend to settle current tax liabilities and assets on a net basis or their tax assets
and liabilities will be realised simultaneously.
A deferred tax asset is recognised only to the extent that it is probable that future taxable
profits will be available against which the unused tax losses and credits can be utilised.
Deferred tax assets are reduced to the extent that it is no longer probable that the related
tax benefits will be realised.
Except for the tax exemption as described below, income earned by the Trust will be
subject to Singapore income tax at the trustee level at the prevailing corporate tax rate.
The Trust is exempted from Singapore income tax under Section 13(12) of the Singapore
Income Tax Act on the following income:
(i)
dividends; and
(ii)
interest on shareholders’ loans,
payable by its subsidiaries in Barbados and Singapore out of underlying rental income
derived from the investment properties in China.
102 | CapitaRetail China Trust Annual Report 2014
3.
SIGNIFICANT ACCOUNTING POLICIES (continued)
(n) Taxation (continued)
This exemption is granted subject to certain conditions, including the condition that the
Trustee is a tax resident of Singapore.
The tax exemption also applies to dividends payable by these subsidiaries out of gains, if
any, derived from the disposal of their shares in the subsidiaries in China.
(o) Earnings per unit
The Group presents basic and diluted earnings per unit (“EPU”) data for its Units. Basic
EPU is calculated by dividing the total return attributable to Unitholders of the Group by the
weighted average number of ordinary Units outstanding during the period. Diluted EPU is
determined by adjusting the total return attributable to Unitholders and the weighted
average number of Units outstanding for the effects of all dilutive potential Units.
(p) Segment reporting
An operating segment is a component of the Group that engages in business activities from
which it may earn revenues and incur expenses, including revenues and expenses that
relate to transactions with any of the Group’s other components. Operating segments are
reported in a manner consistent with the internal reporting provided to the Chief Operating
Decision-Makers (“CODMs”). The CODMs has been identified as the Chief Executive
Officer (“CEO”) and Head of Finance.
Segment results that are reported to the Group CEO include items directly attributable to
a segment as well as those that can be allocated on a reasonable basis. Unallocated items
comprise mainly financial derivative assets and liabilities, other receivables, cash and cash
equivalents, trade and other payables, and interest-bearing borrowings.
Segment capital expenditure is the total cost incurred during the year to acquire plant and
equipment and capital expenditure on investment properties.
(q) New standards, interpretations and revised recommended accounting practice not yet
adopted
The Group has not applied the following accounting standards (including their
consequential amendments) and interpretations that have been issued as of the reporting
date but are not yet effective:
•
FRS 16 Property, plant and equipment
•
FRS 19 Defined benefit plans: Employee Contributions
•
FRS 24 Related party disclosures
•
FRS 40 Investment property
•
FRS 108 Operating segments
•
FRS 113 Fair value measurement
The initial application of these new standards and amendments to standards is not
expected to have a significant effect on the financial statements of the Group.
Delivering Performance | 103
Notes to the Financial Statements
4.
INVESTMENT PROPERTIES
Group
2014
2013
$’000
$’000
2,058,094
1,476,988
–
380,459
12,478
17,973
2,070,572
1,875,420
Changes in fair value
104,829
99,159
Translation differences
75,382
83,515
2,250,783
2,058,094
At beginning of year
Acquisition of investment property
Expenditure capitalised
At the end of year
Investment properties are stated at fair value based on valuation performed by independent
professional valuers having appropriate recognised professional qualifications and recent
experience in the location and category of property being valued. In determining the fair value,
the valuers have used valuation methods which involve certain estimates. The Manager reviews
the key valuation parameters and underlying data including market-corroborated capitalisation
rates, term and reversion rates and discount rates adopted by the valuers and is of the view that
the valuation methods and estimates are reflective of the current market conditions.
The fair values are based on open market values, being the estimated amount for which a
property could be exchanged on the date of the valuation between a willing buyer and a willing
seller in an arm’s length transaction wherein the parties had each acted knowledgeably and
without compulsion.
The valuers have considered valuation techniques including the capitalisation, discounted cash
flows and/or term and reversion approaches in arriving at the open market value as at the
reporting date.
The capitalisation approach capitalises an income stream into a present value using revenue
multipliers or single-year capitalisation rates. The discounted cash flow method involves the
estimation and projection of an income stream over a period and discounting the income stream
with an internal rate of return to arrive at the market value. The term and reversion approach
capitalises net rental income on a fully leased basis with regards to the current passing rental
income from existing tenancies and potential future reversionary income at the market level.
Fair value of the investment properties were based on independent professional full valuations
carried out by the following valuers on the dates stated below:
Valuers
Valuation Date
Valuation Date
DTZ Debenham Tie Leung International
Property Advisers (Shanghai) Co., Ltd.
31 December 2014
–
Knight Frank Petty Limited
31 December 2014
–
CBRE Pte. Ltd.
31 December 2014
31 December 2013
Colliers International (Hong Kong)
Limited
31 December 2014
31 December 2013
104 | CapitaRetail China Trust Annual Report 2014
4.
INVESTMENT PROPERTIES (continued)
Investment properties comprise retail properties that are held mainly for use by tenants under
operating leases. Most leases contain an initial non-cancellable period of within 1 to 3 years
(2013: within 1 to 3 years).
Contingent rents, representing income based on certain sales achieved by tenants, recognised
in the statement of total return during the year amounted to $11.9 million (2013: $7.6 million).
5.
PLANT AND EQUIPMENT
Improvement
to premises
$’000
Group
Cost
At 1 January 2013
Assets acquired
Additions
Disposal/written off
Translation difference on
consolidation
Plant and
machinery
$’000
Motor
vehicles
$’000
371
–
–
(56)
376
20
8,094
2,387
(46)
335
–
(36)
283
10
4
203
500
10,718
309
137
6,452
17,616
2,921
12
1,405
(639)
211
–
48
(51)
145
111
1
(106)
3,469
677
578
(1,353)
6,746
800
2,032
(2,149)
175
12
At 31 December 2013
Charge for the year
Disposal/written off
Translation difference on
consolidation
3,874
1,586
(35)
220
45
(33)
181
8
At 31 December 2014
5,606
Carrying amounts
At 1 January 2013
At 31 December 2014
Less: Accumulated
depreciation
At 1 January 2013
Assets acquired
Charge for the year
Disposal/written off
Translation difference on
consolidation
7
201
–
(68)
6
5,063
1,989
694
(1,504)
Total
$’000
6,982
44
1,344
(652)
At 31 December 2013
Additions
Disposal/written off
Translation difference on
consolidation
157
155
–
(118)
Furniture,
fittings and
equipment
$’000
254
6,496
663
(910)
12,573
2,188
2,038
(2,330)
657
15,126
3,050
(1,060)
179
372
3,550
1,050
(843)
7,801
2,697
(966)
4
132
325
240
122
3,889
9,857
4,061
160
12
1,594
5,827
At 31 December 2013
4,220
115
44
2,946
7,325
At 1 January 2014
4,220
115
44
2,946
7,325
At 31 December 2014
5,112
69
15
2,563
7,759
157
16
(55)
Delivering Performance | 105
Notes to the Financial Statements
6.
INTERESTS IN SUBSIDIARIES
Trust
2014
$’000
(a)
Unquoted equity, at cost
(b) Loans to subsidiaries
Non-trade amounts due from subsidiaries
(a)
2013
$’000
385,035
385,035
326,428
315,480
382,060
328,052
708,488
643,532
1,093,523
1,028,567
Details of the subsidiaries are as follows:
Name of subsidiaries
Principal activities
Place of
incorporation/
business
Effective equity held
by the Group
2014
2013
%
%
(i)
Direct subsidiaries
*
CapitaRetail China
Investments (B)
Pte. Ltd.
Investment holding
Barbados
100
100
*
CapitaRetail China
Investments (B)
Alpha Pte. Ltd.
Investment holding
Barbados
100
100
*
CapitaRetail China
Investments (B)
Beta Pte. Ltd.
Investment holding
Barbados
100
100
*
CapitaRetail China
Investments (B)
Gamma Pte. Ltd.
Investment holding
Barbados
100
100
**
CapitaRetail China
Investments (BVI)
Alpha Limited
Investment holding
British Virgin
Islands
100
100
***
Somerset (Wuhan)
Investments Pte Ltd
Investment holding
Singapore
100
100
***
CapitaLand Retail
Investments (SY)
Pte Ltd
Investment holding
Singapore
100
100
106 | CapitaRetail China Trust Annual Report 2014
6.
INTERESTS IN SUBSIDIARIES (continued)
Name of subsidiaries
(ii)
Principal activities
Place of
incorporation/
business
Property investment
China
100
100
Effective equity held
by the Group
2014
2013
%
%
Indirect subsidiaries
Subsidiary of
CapitaRetail China
Investments (B) Pte.
Ltd.
*
CapitaRetail Beijing
Wangjing Real Estate
Co., Ltd.
Subsidiaries of
CapitaRetail China
Investments (B)
Alpha Pte. Ltd.
*
CapitaRetail Beijing
Anzhen Real Estate
Co., Ltd.
Property investment
China
100
100
*
CapitaRetail Dragon Mall
(Shanghai) Co., Ltd.
Property investment
China
100
100
*
CapitaRetail Beijing
Shuangjing Real
Estate Co., Ltd.
Property investment
China
100
100
*
CapitaRetail Henan
Zhongzhou Real
Estate Co., Ltd.
Property investment
China
100
100
*
Huaxin Saihan Huhhot
Real Estate Co., Ltd.
Property investment
China
100
100
Property investment
China
100
100
Subsidiary of
CapitaRetail China
Investments (B) Beta
Pte. Ltd.
*
CapitaRetail Beijing
Xizhimen Real Estate
Co., Ltd.
Delivering Performance | 107
Notes to the Financial Statements
6.
INTERESTS IN SUBSIDIARIES (continued)
Name of subsidiaries
(ii)
Principal activities
Place of
incorporation/
business
Property investment
China
51
51
Property investment
China
100
100
Property investment
China
100
100
Effective equity held
by the Group
2014
2013
%
%
Indirect subsidiaries
(continued)
Subsidiary of
CapitaRetail China
Investments (B)
Gamma Pte. Ltd.
*
CapitaMalls Wuhu
Commercial Property
Co., Ltd.
Subsidiary of Somerset
(Wuhan) Investments
Pte Ltd
*
Wuhan New Minzhong
Leyuan Co., Ltd.
Subsidiary of
CapitaLand Retail
Investments (SY) Pte
Ltd
*
Beijing Huakun Real
Estate Management
Co., Ltd.
*
**
***
Audited by other member firms of KPMG International.
This subsidiary is not required to be audited by the laws of the country of incorporation.
Audited by KPMG LLP Singapore.
(b) The loans to subsidiaries, amounting to $326.4 million (2013: $315.5 million) and the
non-trade amounts due from subsidiaries amounting to $363.4 million (2013: $310.1 million)
are unsecured and settlement is neither planned nor likely to occur in the foreseeable
future. As these amounts are, in substance, a part of the Trust’s net investments in the
subsidiaries, they are stated at cost, less accumulated impairment. The remaining $18.7
million (2013: $18.0 million) of the non-trade amounts due from subsidiaries are unsecured,
interest-free and repayable on demand. The loans to subsidiaries bear interest fixed at
7.5% (2013: 7.5%).
108 | CapitaRetail China Trust Annual Report 2014
7.
TRADE AND OTHER RECEIVABLES
Trade receivables
Impairment losses
Group
2014
$’000
2013
$’000
Trust
2014
$’000
2,302
2,653
–
–
–
–
(141)
(351)
2013
$’000
2,161
2,302
–
–
Other receivables
2,549
2,840
201
219
Deposits
1,150
1,104
–
–
Loans and receivables
5,860
6,246
201
219
Prepayments
5,487
5,125
–
5
11,347
11,371
201
224
Concentration of credit risk relating to loans and receivables is limited due to the Group’s many
varied tenants located in several cities in China and the credit policy of obtaining security
deposits from tenants for leasing the Group’s investment properties. These tenants comprise
retailers engaged in a wide variety of consumer trades.
The maximum exposure to credit risk for loans and receivables at the reporting date (by
geographical area in China) is:
Group
2014
2013
$’000
$’000
31
32
Beijing
3,626
4,483
Shanghai
1,277
1,212
725
300
5,659
6,027
Inner Mongolia
Others
Delivering Performance | 109
Notes to the Financial Statements
7.
TRADE AND OTHER RECEIVABLES (continued)
Impairment losses
The ageing of loans and receivables at the reporting date is:
Gross
2014
$’000
2013
$’000
Impairment
2014
2013
$’000
$’000
4,460
4,278
–
–
Past due 1 – 30 days
369
1,074
–
–
Past due 31 – 60 days
297
410
–
3
Past due 61 – 90 days
225
132
–
–
More than 90 days past due
650
703
141
348
6,001
6,597
141
351
Group
Not past due
Gross
2014
$’000
2013
$’000
Impairment
2014
2013
$’000
$’000
Trust
Not past due
201
219
–
–
The movement in the allowance for impairment in respect of trade receivables during the year
is as follows:
Note
At 1 January
Impairment losses/(write-back) on
trade receivables, net
Provision acquired
Allowance utilised
Translation difference
At 31 December
17
Group
2014
$’000
2013
$’000
351
163
28
(58)
–
(244)
332
(94)
6
8
141
351
The majority of the trade receivables are mainly from tenants that have good credit records with
the Group. The allowance account in respect of trade receivables is used to record impairment
losses unless the Group is satisfied that no recovery of the amount owing is possible; at that
point the amounts are considered irrecoverable and are written off against the financial asset
directly. During the year ended 31 December 2014, the Group collected $0.1 million (2013: $0.1
million) of its impaired trade receivables.
110 | CapitaRetail China Trust Annual Report 2014
7.
TRADE AND OTHER RECEIVABLES (continued)
Impairment losses (continued)
The Group’s historical experience in the collection of loans and receivables falls within the
recorded allowances. The Manager believes that no additional credit risk beyond the amounts
provided for collection losses is inherent in the Group’s loans and receivables, based on
historical payment behaviours and the security deposits held (if applicable).
8.
CASH AND CASH EQUIVALENTS
Group
2014
$’000
9.
2013
$’000
Trust
2014
$’000
2013
$’000
Cash at banks and in hand
58,992
71,311
238
249
Fixed deposits with financial
institutions
27,634
34,146
–
–
86,626
105,457
238
249
TRADE AND OTHER PAYABLES
Group
2014
$’000
Trade payable
2013
$’000
Trust
2014
$’000
2013
$’000
650
802
–
63
11,187
12,463
2,582
3,047
Accrued development expenditure
7,528
9,893
–
–
Amounts due to related parties
(trade)
2,344
5,214
1,467
4,677
–
–
–
17
24,069
23,502
–
–
Interest payable
1,564
1,745
1,337
1,256
Other payables
3,798
4,100
–
–
51,140
57,719
5,386
9,060
Accrued operating expenses
Amount due to subsidiary (trade)
Other deposits and advances
Included in amounts due to related parties (trade) are amounts due to the Manager, Property
and Project Managers of $1.5 million (2013: $4.7 million), $0.7 million (2013: $0.5 million) and
$nil (2013: $14,000) respectively.
Delivering Performance | 111
Notes to the Financial Statements
10. INTEREST-BEARING BORROWINGS
Note
Group
2014
$’000
2013
$’000
Trust
2014
$’000
2013
$’000
Unsecured term loans
(a)
538,503
456,465
538,503
435,503
Secured loans
(b)
104,890
216,993
–
–
Money market facilities
29,500
40,000
29,500
40,000
Less: Unamortised
transactions costs
(1,180)
(1,120)
(1,180)
(1,120)
671,713
(a)
712,338
566,823
474,383
As at 31 December 2014, unsecured term loans comprise $100.0 million, $88.0 million,
$50.5 million, three $50.0 million, two $75.0 million fixed/floating rate trust term loans
(collectively known as “Trust Term Loan Facilities”). These facilities have negative pledge
covenants which require the Trust, amongst others:
(i)
not to, without the prior written consent of the lender, create or have outstanding any
security on or over the Group’s interest in any of the investment properties;
(ii)
in the event of a sale of any of the investment properties, to repay an amount equal to
the proportion of the market value of the investment properties sold to the total market
value of the investment properties as determined by the lender based on the latest
annual valuation reports of the investment properties; and
(iii) not to provide any guarantee for any other entities except for secured borrowings for
new investment properties acquired with existing mortgages.
The Trust Term Loan Facilities are repayable in full at maturity, although the Trust has the
option to make early prepayments.
In respect of the unsecured RMB term loan, 20% of the original RMB term loan principal of
RMB128.0 million was repayable on a semi-annual basis in equal instalments starting in
2012 and the remaining was fully repaid on full maturity of the term loan on 30 June 2014.
(b) At the reporting date, secured loans comprise of a RMB term loan of $104.9 million
(RMB495.0 million) (2013: $106.5 million (RMB520.0 million)) and a RMB bridge loan of $nil
(2013: $110.5 million (RMB540.0 million)). Interest rates for the term loan bear interest
referenced against the 3 to 5 years People’s Bank of China (“PBOC”) base lending rate and
1 year PBOC base lending rate for the bridge loan.
As security for the loans, the Trust has granted in favour of the lender the following:
(i)
a mortgage over CapitaMall Grand Canyon;
(ii)
an assignment of the rental revenue of CapitaMall Grand Canyon; and
(iii) an assignment of the insurance policies relating to CapitaMall Grand Canyon.
112 | CapitaRetail China Trust Annual Report 2014
10. INTEREST-BEARING BORROWINGS (continued)
In respect of the secured RMB term loan, RMB12.5 million is payable on a semi-annual
basis from June 2014. The outstanding loan balance of RMB407.5 million is payable in full
upon maturity on 19 December 2018. The RMB bridge loan of RMB540.0 million was fully
repaid in 2014.
Terms and debt repayment schedule
Terms and conditions of the outstanding interest-bearing borrowings are as follows:
Nominal
interest
rate per
annum
%
Year of
maturity
Face
value
$’000
Carrying
amount
$’000
1.54
2015
29,500
29,500
S$ unsecured floating rate loan
1.85 – 1.91
2015
88,000
87,996
S$ unsecured fixed rate loan
2.35 – 2.45
2016
50,000
49,946
S$ unsecured floating rate loan
1.37 – 1.84
2016
50,000
49,929
S$ unsecured floating rate loan
1.52 – 2.00
2017
50,503
50,381
S$ unsecured floating rate loan
1.31 – 1.59
2017
75,000
74,775
2.75
2018
50,000
49,829
RMB secured floating rate term loan
6.00 – 6.40
2018
104,890
104,890
S$ unsecured floating rate loan
1.46 – 1.71
2019
75,000
74,713
S$ unsecured floating rate loan
1.65
2020
100,000
99,754
672,893
671,713
2014
Group
S$ unsecured floating rate money
market facility
S$ unsecured fixed rate loan
Delivering Performance | 113
Notes to the Financial Statements
10. INTEREST-BEARING BORROWINGS (continued)
Terms and debt repayment schedule (continued)
Nominal
interest
rate per
annum
%
Year of
maturity
Face
value
$’000
Carrying
amount
$’000
1.54
2015
29,500
29,500
S$ unsecured floating rate loan
1.85 – 1.91
2015
88,000
87,996
S$ unsecured fixed rate loan
2.35 – 2.45
2016
50,000
49,946
S$ unsecured floating rate loan
1.37 – 1.84
2016
50,000
49,929
S$ unsecured floating rate loan
1.52 – 2.00
2017
50,503
50,381
S$ unsecured floating rate loan
1.31 – 1.59
2017
75,000
74,775
2.75
2018
50,000
49,829
S$ unsecured floating rate loan
1.46 – 1.71
2019
75,000
74,713
S$ unsecured floating rate loan
1.65
2020
100,000
99,754
568,003
566,823
Trust
S$ unsecured floating rate money
market facility
S$ unsecured fixed rate loan
2013
Group
S$ unsecured floating rate money
market facility
1.04 – 1.25
2014
40,000
40,000
S$ unsecured floating/fixed rate loan
1.41 – 2.66
2014
100,000
99,908
RMB unsecured floating rate term loan
6.77
2014
20,962
20,962
RMB secured floating rate bridge loan
6.00
2014
110,544
110,544
S$ unsecured floating rate loan
1.85 – 1.98
2015
88,000
87,952
S$ unsecured fixed rate loan
2.35 – 2.45
2016
50,000
49,896
S$ unsecured floating rate loan
1.36 – 1.40
2016
50,000
49,879
S$ unsecured floating rate loan
1.51 – 1.55
2017
50,503
50,331
S$ unsecured fixed rate loan
2.75
2018
50,000
49,779
S$ unsecured floating rate loan
1.51
2018
47,000
46,638
RMB secured floating rate term loan
6.40
2018
106,449
106,449
713,458
712,338
114 | CapitaRetail China Trust Annual Report 2014
10. INTEREST-BEARING BORROWINGS (continued)
Terms and debt repayment schedule (continued)
Nominal
interest
rate per
annum
%
Year of
maturity
Face
value
$’000
Carrying
amount
$’000
Trust
S$ unsecured floating rate money
market facility
1.04 – 1.25
2014
40,000
40,000
S$ unsecured floating/fixed rate loan
1.41 – 2.66
2014
100,000
99,908
S$ unsecured floating rate loan
1.85 – 1.98
2015
88,000
87,952
S$ unsecured fixed rate loan
2.35 – 2.45
2016
50,000
49,896
S$ unsecured floating rate loan
1.36 – 1.40
2016
50,000
49,879
S$ unsecured floating rate loan
1.51 – 1.55
2017
50,503
50,331
S$ unsecured fixed rate loan
2.75
2018
50,000
49,779
S$ unsecured floating rate loan
1.51
2018
47,000
46,638
475,503
474,383
The following are the contractual maturities of non-derivative financial liabilities, including
estimated interest payments and excluding the impact of netting agreements:
Carrying
amount
Contractual
cash flow
Within
1 year
Within 2 to
5 years
After
5 years
$’000
$’000
$’000
$’000
$’000
S$ unsecured floating rate
money market facility
29,500
(29,541)
(29,541)
–
–
S$ unsecured floating rate loan
87,996
(88,410)
(88,410)
–
–
S$ unsecured fixed rate loan
49,946
(51,721)
(1,182)
(50,539)
–
S$ unsecured floating rate loan
49,929
(51,474)
(945)
(50,529)
–
S$ unsecured floating rate loan
50,381
(53,622)
(1,030)
(52,592)
–
2014
Group
S$ unsecured floating rate loan
74,775
(80,500)
(1,378)
(79,122)
–
S$ unsecured fixed rate loan
49,829
(54,640)
(1,375)
(53,265)
–
RMB secured floating rate term
loan
104,890
(128,173)
(11,597)
(116,576)
–
S$ unsecured floating rate loan
74,713
(84,147)
(1,484)
(82,663)
S$ unsecured floating rate loan
99,754
(116,347)
(1,924)
(13,978)
Trade and other payables
(Note 9)
51,140
(51,140)
(51,140)
Security deposits
41,158
(41,158)
(15,309)
(21,643)
(4,206)
764,011
(830,873)
(205,315)
(520,907)
(104,651)
–
–
(100,445)
–
Delivering Performance | 115
Notes to the Financial Statements
10. INTEREST-BEARING BORROWINGS (continued)
Terms and debt repayment schedule (continued)
Carrying
amount
Contractual
cash flow
Within
1 year
Within 2 to
5 years
After
5 years
$’000
$’000
$’000
$’000
$’000
29,500
(29,541)
(29,541)
–
–
Trust
S$ unsecured floating rate
money market facility
S$ unsecured floating rate loan
87,996
(88,410)
(88,410)
S$ unsecured fixed rate loan
49,946
(51,721)
(1,182)
(50,539)
–
S$ unsecured floating rate loan
49,929
(51,474)
(945)
(50,529)
–
S$ unsecured floating rate loan
50,381
(53,622)
(1,030)
(52,592)
–
S$ unsecured floating rate loan
74,775
(80,500)
(1,378)
(79,122)
–
S$ unsecured fixed rate loan
49,829
(54,640)
(1,375)
(53,265)
–
S$ unsecured floating rate loan
74,713
(84,147)
(1,484)
(82,663)
S$ unsecured floating rate loan
99,754
(116,347)
(1,924)
(13,978)
5,386
(5,386)
(5,386)
572,209
(615,788)
(132,655)
S$ unsecured floating rate
money market facility
40,000
(40,073)
(40,073)
–
–
S$ unsecured floating/fixed
rate loan
99,908
(101,564)
(101,564)
–
–
RMB unsecured floating rate
term loan
20,962
(21,663)
(21,663)
–
–
RMB secured floating rate
bridge loan
110,544
(117,158)
(117,158)
–
–
S$ unsecured floating rate
loans
234,800
(251,106)
(3,913)
(247,193)
–
99,675
(106,067)
(2,550)
(103,517)
–
106,449
(136,760)
(11,830)
(124,930)
–
Trade and other payables
(Note 9)
57,719
(57,719)
(57,719)
Security deposits
34,980
(34,980)
(13,034)
(20,121)
(1,825)
805,037
(867,090)
(369,504)
(495,761)
(1,825)
Trade and other payables
(Note 9)
–
–
(382,688)
–
–
(100,445)
–
(100,445)
2013
Group
S$ unsecured fixed rate loans
RMB secured floating rate term
loan
116 | CapitaRetail China Trust Annual Report 2014
–
–
10. INTEREST-BEARING BORROWINGS (continued)
Terms and debt repayment schedule (continued)
Carrying
amount
Contractual
cash flow
Within
1 year
Within 2 to
5 years
After
5 years
$’000
$’000
$’000
$’000
$’000
S$ unsecured floating rate
money market facility
40,000
(40,073)
(40,073)
–
–
S$ unsecured floating/fixed
rate loan
99,908
(101,564)
(101,564)
–
–
S$ unsecured floating rate
loans
234,800
(251,106)
(3,913)
(247,193)
–
99,675
(106,067)
(2,550)
(103,517)
–
9,060
(9,060)
(9,060)
483,443
(507,870)
(157,160)
Trust
S$ unsecured fixed rate loans
Trade and other payables
(Note 9)
–
(350,710)
–
–
It is not expected that the cash flows included in the maturity analysis could occur significantly
earlier, or at significantly different amounts.
11. FINANCIAL DERIVATIVES
Group and Trust
2014
2013
$’000
$’000
Financial derivative assets
Financial derivative liabilities
1,547
2,044
(8,605)
(5,208)
The following are the contractual maturities of financial derivative assets and liabilities, including
estimated interest payments:
Carrying
amount
$’000
Contractual
cash flow
$’000
1,481
1,793
66
66
1,547
1,859
Within
1 year
$’000
Within 2 to
5 years
$’000
Group and Trust
Financial derivative assets
2014
Interest rate swaps
Non-deliverable forward
(1,111)
–
(1,111)
2,904
66
2,970
Delivering Performance | 117
Notes to the Financial Statements
11. FINANCIAL DERIVATIVES (continued)
Carrying
amount
$’000
Contractual
cash flow
$’000
Within
1 year
$’000
Within 2 to
5 years
$’000
302
322
1,742
1,742
1,742
–
2,044
2,064
1,172
892
2013
Interest rate swaps
Non-deliverable forward
(570)
892
Financial derivative liabilities
2014
Interest rate swaps
(19)
(48)
(48)
(8,586)
(8,586)
(5,669)
(2,917)
(8,605)
(8,634)
(5,717)
(2,917)
Interest rate swaps
(1,090)
(1,261)
(1,388)
Non-deliverable forward
(4,118)
(4,118)
(1,286)
(2,832)
(5,208)
(5,379)
(2,674)
(2,705)
Non-deliverable forward
–
2013
127
It is not expected that the cash flows included in the maturity analysis could occur significantly
earlier, or at significantly different amounts.
The table also indicates the periods in which the cash flows associated with derivatives that are
expected to occur and impact the statement of total return and Unitholders’ funds.
118 | CapitaRetail China Trust Annual Report 2014
12. DEFERRED TAX LIABILITIES
Movements in deferred tax liabilities during the financial year are as follows:
At
1 January
$’000
Statement
of total
return
(Note 21)
$’000
Acquired on
acquisition of
investment
property
$’000
Translation
difference
$’000
At
31 December
$’000
154,876
34,364
–
8,722
197,962
4,744
2,217
–
–
6,961
159,620
36,581
–
8,722
204,923
114,258
28,116
4,123
8,379
154,876
–
4,744
–
–
4,744
114,258
32,860
4,123
8,379
159,620
Group
2014
Investment properties
Tax on unrepatriated profits
2013
Investment properties
Tax on unrepatriated profits
Deferred tax assets have not been recognised in respect of the following item because it is not
probable that future taxable profit will be available against which the Group can utilise the
benefits therefrom:
Group
2014
$’000
Tax losses
48,500
2013
$’000
51,106
The tax losses are subject to agreement by the tax authorities and compliance with tax
regulations in the country in which the subsidiaries operate. These tax losses can be carried
forward up to five consecutive years and will expire on the fifth year from which the tax losses
arise.
Delivering Performance | 119
Notes to the Financial Statements
13. UNITHOLDERS’ FUNDS
Note
Net assets resulting from
operations
Group
2014
$’000
768,262
2013
$’000
627,908
14,662
4,522
(a)
1,459
Foreign currency translation
reserve
(b)
66,043
9,981
–
–
498,559
538,683
498,559
538,683
15,415
11,171
–
–
1,349,738
1,186,951
514,680
542,413
General reserve
(a)
(c)
1,459
2013
$’000
Hedging reserve
Unitholders’ transactions
(792)
Trust
2014
$’000
(792)
The hedging reserve comprises the effective portion of the cumulative net change in the fair
value of cash flow hedging instruments relating to forecast hedged transactions.
(b) The foreign currency translation reserve comprises:
(i)
foreign exchange differences arising from the translation of the financial statements of
foreign operations whose functional currencies are different from the functional
currency of the Trust;
(ii)
the gains or losses on financial instruments used to hedge the Group’s net investment
in foreign operations that are determined to be effective hedges; and
(iii) the foreign exchange differences on monetary items which form part of the Group’s net
investment in foreign operations, provided certain conditions are met.
(c)
General reserve
The subsidiaries incorporated in China are required to transfer 10% of their profits after
taxation, as determined under the accounting principles and relevant financial regulations
of China to the general reserve until the reserve balance reaches 50% of registered capital.
The transfer to this reserve must be made before distribution of dividends to its
shareholders.
General reserve can be used to make good previous years’ losses, if any, and may be
converted to registered capital in proportion to the existing interests of the shareholders,
provided that the balance after such conversion is not less than 25% of the registered
capital.
120 | CapitaRetail China Trust Annual Report 2014
14. NON-CONTROLLING INTEREST
The following summarises the financial information of the Group’s significant subsidiary with
material non-controlling interest. At the reporting date, the Group only had one subsidiary with
significant non-controlling interest of 49% (2013: 49%), CapitaMalls Wuhu Commercial Property
Co., Ltd..
Group
2014
$’000
2013
$’000
58,980
55,225
5,790
6,727
Non-current liabilities
(20,576)
(25,311)
Current liabilities
(23,882)
(19,128)
20,312
17,513
9,952
8,581
Add non-controlling interest loans in respect of the Group’s
investment in a subsidiary in China:
18,126
18,333
Net assets attributable to non-controlling interest
28,078
26,914
Revenue
6,802
7,043
Total return after taxation
2,007
4,553
Total return after taxation
983
2,231
Add interest relating to non-controlling interest loans in
respect of the Group’s investment in a subsidiary in
China:
774
799
Total return allocated to non-controlling interest
1,757
3,030
Cash flows from operating activities
1,211
2,479
2014
Non-current assets
Current assets
Net assets
Net assets based on percentage shareholdings
Attributable to non-controlling interest:
Cash flows used in investing activities
(136)
(199)
Cash flows used in financing activities
(2,376)
(2,163)
Net (decrease)/increase in cash and cash equivalents
(1,301)
117
There are no dividends paid to non-controlling interest in 2014 and 2013.
Delivering Performance | 121
Notes to the Financial Statements
15. UNITS IN ISSUE
2014
Number of
Units
2013
Number of
Units
803,026,588
748,909,649
– as payment of Manager’s management fees
3,468,568
2,669,258
– as payment of acquisition fee of CapitaMall Grand
Canyon
2,735,125
–
–
45,413,704
18,887,423
6,033,977
828,117,704
803,026,588
844,273
786,472
828,961,977
803,813,060
Balance as at beginning of year
New Units issued:
– in connection with preferential offering exercise
completed on 20 November 2013
– as payment of distribution under distribution
reinvestment plan
Total issued Units as at end of year
New Units to be issued:
– as payment of Manager’s management fees
Total issued and issuable Units as at end of year
Units issued during the year ended 31 December 2014 are as follows:
(a)
On 10 February 2014, the Trust issued 2,735,125 new Units at an issue price of $1.3023 per
Unit as payment of the related acquisition fees of CapitaMall Grand Canyon;
(b) On 27 March 2014, the Trust issued 11,408,589 new Units at an issue price of $1.276 per
Unit as payment of distribution under distribution reinvestment plan for the period from
1 July 2013 to 31 December 2013;
(c)
On 31 March 2014, the Trust issued 786,472 new Units at an issue price of $1.311 per Unit
as payment of the performance component of the management fee for the period from
1 October 2013 to 31 December 2013;
(d) On 5 June 2014, the Trust issued 933,248 new Units at an issue price of $1.3861 per Unit
as payment of the performance component of the management fee for the period from
1 January 2014 to 31 March 2014;
(e)
On 25 September 2014, the Trust issued 7,478,834 new Units at an issue price of $1.617
per Unit as payment of distribution under distribution reinvestment plan for the period from
1 January 2014 to 30 June 2014;
(f)
On 29 September 2014, the Trust issued 930,416 new Units at an issue price of $1.4709 per
Unit as payment of the performance component of the management fee for the period from
1 April 2014 to 30 June 2014;
(g) On 25 November 2014, the Trust issued 818,432 new Units at an issue price of $1.5769 per
Unit as payment of the performance component of the management fee for the period from
1 July 2014 to 30 September 2014.
122 | CapitaRetail China Trust Annual Report 2014
15. UNITS IN ISSUE (continued)
Units issued during the year ended 31 December 2013 are as follows:
(a)
On 28 March 2013, the Trust issued 594,927 new Units at an issue price of $1.6251 per Unit
as payment of the performance component of the management fee for the period from
1 October 2012 to 31 December 2012;
(b) On 6 June 2013, the Trust issued 601,471 new Units at an issue price of $1.7203 per Unit
as payment of the performance component of the management fee for the period from
1 January 2013 to 31 March 2013;
(c)
On 25 September 2013, the Trust issued 6,033,977 new Units at an issue price of $1.447
per Unit as payment of distribution under distribution reinvestment plan for the period from
1 January 2013 to 30 June 2013;
(d) On 30 September 2013, the Trust issued 755,049 new Units at an issue price of $1.3993 per
Unit as payment of the performance component of the management fee for the period from
1 April 2013 to 30 June 2013;
(e)
On 20 November 2013, the Trust issued 45,413,704 new Units at an issue price of $1.30 per
Unit in connection with the preferential offering exercise to finance the acquisition of
CapitaMall Grand Canyon; and
(f)
On 29 November 2013, the Trust issued 717,811 new Units at an issue price of $1.392 per
Unit as payment of the performance component of the management fee for the period from
1 July 2013 to 30 September 2013.
The issue prices were determined based on the volume weighted average traded price for all
trades done on the SGX-ST in the ordinary course of trading for the last 10 business days of the
relevant periods in which the management fees accrue.
Each Unit in the Trust represents an undivided interest in the Trust. The rights and interests of
Unitholders are contained in the Trust Deed and include the right to:
•
one vote per Unit;
•
receive income and other distributions attributable to the Units held;
•
participate in the termination of the Trust by receiving a share of all net cash proceeds
derived from the realisation of the assets of the Trust less any liabilities, in accordance with
their proportionate interests in the Trust. However, a Unitholder has no equitable or
proprietary interest in the underlying assets of the Trust and is not entitled to the transfer
to it of any assets (or part thereof) or any estate or interest in any asset (or part thereof) of
the Trust; and
•
attend all Unitholders’ meetings. The Trustee or the Manager may (and the Manager shall
at the request in writing of not less than 50 Unitholders or one-tenth in number of
Unitholders, whichever is lesser) at any time convene a meeting of Unitholders in
accordance with the provisions of the Trust Deed.
Delivering Performance | 123
Notes to the Financial Statements
15. UNITS IN ISSUE (continued)
The restrictions of a Unitholder include the following:
•
a Unitholder’s right is limited to the right to require due administration of the Trust in
accordance with the provisions of the Trust Deed; and
•
a Unitholder has no right to request the Manager to redeem his Units while the Units are
listed on the SGX-ST.
A Unitholder’s liability is limited to the amount paid or payable for any unit in the Trust. The
provisions of the Trust Deed provide that no Unitholder will be personally liable to indemnify the
Trustee or any creditor of the Trustee in the event that the liabilities of the Trust exceed its assets.
16. TOTAL UNITHOLDERS’ DISTRIBUTION
Unitholders’ distribution for the year is accounted for as distribution from operations and
distribution from Unitholders’ contributions:
(a)
Distribution from operations
This refers to distribution made by the Trust that is represented by income received or
receivable during the financial year, as the case may be, net of expenses. Such income
comprises mainly the following:
•
dividend from subsidiaries in Barbados and Singapore paid out of dividend declared
by the subsidiaries in China;
•
dividend from subsidiaries in Barbados and Singapore paid out of net interest income
earned by subsidiaries in Barbados and Singapore on shareholders’ loans extended
to subsidiaries in China; and
•
interest income earned by the Trust on shareholders’ loans extended to subsidiaries in
Barbados and Singapore.
The above income originates from profits and income derived by the subsidiaries in China
in respect of the current financial year.
(b) Distribution from Unitholders’ contributions
This refers to the amount of distribution made by the Trust for the financial year where the
underlying cash is not, or may not be, received or receivable as income by the Trust during
that period. Such distribution comprises mainly the following:
•
profits from operations arising from the investment properties which are declared as
dividend income after the financial year, as the case may be, and accordingly also
received as dividends by the Trust after that year;
•
profits from operations arising from the investment properties which cannot be
declared as dividends;
•
adjustment for depreciation expenses of the investment properties; and
124 | CapitaRetail China Trust Annual Report 2014
16. TOTAL UNITHOLDERS’ DISTRIBUTION (continued)
(b) Distribution from Unitholders’ contributions (continued)
•
adjustments for trust expenses that are paid in Units, foreign currency differences
attributable to net investment hedges undertaken by the Trust and certain unrealised
expenses.
Income available for distribution to Unitholders at end of the year
Distributions are made on a semi-annual basis, with the amount calculated as at 30 June and
31 December each year for the six-month period ending on each of the said dates. In
accordance with the provisions of the Trust Deed, the Manager is required to pay distributions
within 90 days of the end of each distribution period. Distributions, when paid, will be in
Singapore dollars.
Distributions for the period from 1 January 2014 to 30 June 2014 had been paid on 25
September 2014. Distributions for the period from 1 July 2014 to 31 December 2014 will be paid
within 90 days of the end of the distribution period, in accordance with the provisions of the Trust
Deed.
17. OTHER PROPERTY OPERATING EXPENSES
Group
2014
$’000
2013
$’000
Utilities
7,223
5,304
Advertising and promotion
3,989
3,447
Maintenance
7,925
6,088
Staff costs
9,060
7,311
2,032
Note
Depreciation of plant and equipment
5
2,697
Impairment losses/(write-back) on trade
receivables, net
7
28
(58)
Amortisation of deferred expenditure included in
other receivables
57
56
Plant and equipment written off
81
176
1,924
1,468
32,984
25,824
Others
Included in staff costs is contribution to defined contribution plans of $1.7 million (2013: $1.4
million).
Delivering Performance | 125
Notes to the Financial Statements
18. MANAGER’S MANAGEMENT FEES
Manager’s management fees comprise base fee of $5.5 million (2013: $4.3 million) and
performance fee of $5.3 million (2013: $4.1 million). The Manager has elected to receive all the
performance fee in the form of Units. $4.0 million (2013: $3.1 million) of the $5.3 million (2013:
$4.1 million) of performance component of the Manager’s management fee was paid during the
year through the issue of 2,682,096 Units (2013: 2,074,331 Units). The remaining $1.3 million
(2013: $1.0 million) will be paid through the issue of 844,273 new Units (2013: 786,472 new
Units) subsequent to the year end.
19. OTHER TRUST OPERATING EXPENSES/(INCOME)
Group
2014
$’000
2013
$’000
Trust
2014
$’000
2013
$’000
Professional fees
191
321
28
136
Acquisition related expenses
888
–
–
–
Non-deal roadshow expenses
10
–
10
–
1,062
105
499
(401)
2,151
426
537
(265)
Others
20. FINANCE INCOME AND FINANCE COSTS
Group
2014
$’000
2013
$’000
Trust
2014
$’000
2013
$’000
Interest income:
– financial institutions
874
1,133
29
119
–
–
24,376
24,091
874
1,133
24,405
24,210
(21,212)
(10,987)
(11,980)
(9,442)
(714)
(342)
(490)
(342)
Finance costs
(21,926)
(11,329)
(12,470)
(9,784)
Net finance (costs)/income
recognised in statement of total
return
(21,052)
(10,196)
11,935
14,426
– subsidiaries
Finance income
Interest expenses
Other finance costs
126 | CapitaRetail China Trust Annual Report 2014
21. TAXATION
Note
Group
2014
$’000
2013
$’000
Trust
2014
$’000
16,607
–
15
8
5
2013
$’000
Current taxation
Current year
19,487
Under/(over) provision in
prior years
1,041
(962)
20,528
15,645
8
20
36,581
32,860
–
–
57,109
48,505
8
20
2013
$’000
Trust
2014
$’000
Deferred taxation
Origination of temporary
differences
12
Income tax expense
Reconciliation of effective tax rate
Group
2014
$’000
Total return for the year before
taxation
Tax calculated using Singapore tax
rate of 17%
2013
$’000
203,464
184,453
10,148
14,057
34,589
31,357
1,725
2,390
10,157
8,310
–
–
Adjustments:
Effect of different tax rates in foreign
jurisdictions
Income not subject to tax
Expenses not deductible for tax
purposes
Deferred tax assets not recognised
Utilisation of previously unrecognised
tax losses
(27)
(401)
(6,959)
(9,917)
–
–
1,186
4,273
562
–
–
–
–
–
–
(3,196)
Tax losses not allowed to be carried
forward
4,049
3,270
4,048
3,269
Foreign tax suffered
6,738
10,127
–
–
Under/(over) provision in prior years
1,041
8
5
8
20
57,109
(962)
48,505
Delivering Performance | 127
Notes to the Financial Statements
22. EARNINGS PER UNIT
The calculation of basic earnings per unit is based on weighted average number of Units during
the year and total return for the year after taxation and non-controlling interest before
distribution.
Group
2014
Total return for the year after taxation and non-controlling interest
before distribution
2013
$’000
$’000
144,598
132,918
Trust
Number
Number
of Units
of Units
2014
2013
’000
’000
Issued Units at beginning of year
Effect of creation of new Units:
– Manager’s management fees paid/payable in Units
– As payment of acquisition fee of CapitaMall Grand Canyon
– Units issued in connection with preferential offering exercise
completed on 20 November 2013
– As payment of distribution under distribution reinvestment plan
Weighted average number of issued and issuable Units
at end of year
803,027
748,910
13,876
337
6,362
–
–
372
3,332
79
817,612
758,683
Diluted earnings per unit is the same as the basic earnings per unit as there are no dilutive
instruments in issue during the year.
Group
2014
$’000
Amount available for distribution to Unitholders at end of the year
80,882
2013
$’000
70,060
23. RELATED PARTY TRANSACTIONS
For the purposes of these financial statements, parties are considered to be related to the Group
if the Group has the ability, directly or indirectly, to control the party or exercise significant
influence over the party in making financial and operating decisions, or vice versa, or where the
Group and the party are subject to common significant influence. Related parties may be
individuals or other entities. The Manager, being CapitaRetail China Trust Management Limited
is an indirect wholly-owned subsidiary of a substantial Unitholder of the Trust. The Property and
Project Managers, being CapitaLand Retail (Shanghai) Management & Consulting Co., Ltd. and
CapitaLand Retail (Beijing) Facilities & Projects Consulting Co., Ltd. are indirect wholly-owned
subsidiaries of a substantial Unitholder of the Trust.
128 | CapitaRetail China Trust Annual Report 2014
23. RELATED PARTY TRANSACTIONS (continued)
In the normal course of the operations of the Trust, the Manager’s management fees and the
Trustee’s fees have been paid or are payable to the Manager and Trustee respectively. The
property management fees, reimbursables and project management fees have been paid or are
payable to the Property and Project Managers respectively.
24. FINANCIAL RATIOS
Ratio of expenses to average net asset value 1
– including performance component of Manager’s management
fees
– excluding performance component of Manager’s management
fees
Portfolio turnover rate 2
Group
2014
%
2013
%
1.03
0.89
0.61
–
0.52
–
Notes:
1
The annualised ratio is computed in accordance with the guidelines of the Investment Management Association of
Singapore. The expenses used in the computation relate to expenses at the Group level, excluding property related
expenses and borrowing costs.
2
The annualised ratio is computed based on the lesser of purchases or sales of underlying investment properties of the
Group expressed as a percentage of weighted average net asset value.
25. OPERATING SEGMENTS
The Group has ten reportable segments, as described below, which are the Group’s investment
properties. The investment properties are managed separately because they require different
operating and marketing strategies. For each of the investment properties, the CODMs review
internal management reports on a monthly basis.
All of the Group’s reportable segments are investment properties located in China used primarily
for retail purposes. The reporting segments are as follows:
•
•
•
•
•
•
•
•
•
•
CapitaMall
CapitaMall
CapitaMall
CapitaMall
CapitaMall
CapitaMall
CapitaMall
CapitaMall
CapitaMall
CapitaMall
Xizhimen
Wangjing
Grand Canyon
Anzhen
Erqi
Minzhongleyuan
Shuangjing
Qibao
Saihan
Wuhu
Segment revenue comprises mainly income generated from its tenants. Segment net property
income represents the income earned by each segment after allocating property operating
expenses. This is the measure reported to the CODMs for the purpose of assessment of
segment performance. In addition, the CODMs monitor the non-financial assets as well as
financial assets attributable to each segment when assessing segment performance.
Delivering Performance | 129
Notes to the Financial Statements
25. OPERATING SEGMENTS (continued)
Segment results, assets and liabilities include items directly attributable to a segment as well as
those that can be allocated on a reasonable basis. Unallocated items comprise mainly the
Trust’s financial assets and liabilities and its expenses. Segment capital expenditure is the total
cost incurred during the year to acquire segment assets that are expected to be used for more
than one year.
Information regarding the Group’s reportable segments is presented in the tables in the
following pages.
For the purpose of monitoring segment performance, the Group’s CODMs monitor the
non-financial assets as well as financial assets attributable to each segment.
130 | CapitaRetail China Trust Annual Report 2014
Delivering Performance | 131
Capital expenditure
(925)
36,162
–
Write-back/(impairment losses)
on trade receivables, net
Net change in fair value of
investment properties
(796)
81,993
609,155
74,322
–
Depreciation and amortisation
Other segment items:
Segment liabilities
Segment assets
Reportable segment total
return before taxation
Finance costs
203
37,988
Segment net property income
Finance income
53,978
3,723
50,255
– Gross revenue
– Others
– Gross rental income
External revenues:
(1,741)
29,647
19
(784)
66,678
548,622
62,573
–
220
32,649
48,596
3,155
45,441
$’000
$’000
(1,508)
29,872
–
(613)
80,052
449,088
60,038
–
146
29,557
41,100
3,158
37,942
2013
(719)
42,251
–
(562)
66,071
423,837
68,547
–
255
26,007
36,871
3,677
33,194
$’000
2014
2013
2014
$’000
CapitaMall
Wangjing
CapitaMall
Xizhimen
Information about reportable segments
25. OPERATING SEGMENTS (continued)
(1,348)
13,098
110
(606)
131,578
422,550
20,248
(9,709)
58
17,815
28,430
3,384
25,046
$’000
2014
–
–
–
–
235,185
396,192
–
–
–
–
–
–
–
$’000
2013
CapitaMall Grand
Canyon
–
4,940
–
(44)
28,097
214,877
18,114
(717)
97
13,777
16,794
6
16,788
$’000
2014
2013
(98)
1,716
–
(45)
46,303
207,476
13,613
(1,545)
173
13,319
16,262
1
16,261
$’000
CapitaMall
Anzhen
(322)
3,004
–
(89)
16,632
146,577
11,331
–
43
8,336
10,385
–
10,385
$’000
2014
(71)
1,370
–
(80)
14,011
129,896
9,271
–
58
7,963
10,084
25
10,059
$’000
2013
CapitaMall Erqi
(4,103)
87,076
110
(2,148)
338,352
1,842,247
184,053
(10,426)
547
107,473
150,687
10,271
140,416
$’000
$’000
2013
(2,629)
74,984
19
(1,471)
428,248
1,706,023
154,004
(1,545)
706
79,938
111,813
6,858
104,955
Sub Total
2014
132 | CapitaRetail China Trust Annual Report 2014
(98)
(26)
3,259
(9,710)
(Impairment losses)/writeback on trade
receivables, net
Net change in fair value of
investment properties
Capital expenditure
11,520
121,898
Depreciation and
amortisation
Other segment items
Segment liabilities
Segment assets
3,522
–
Finance costs
Reportable segment total
return before taxation
40
271
5,150
240
4,910
(10,985)
273
(8)
(99)
12,105
107,106
903
–
19
675
4,578
292
4,286
$’000
$’000
Finance income
Segment net property
income
– Gross revenue
– Others
– Gross rental income
External revenues:
2013
2014
CapitaMall
Minzhongleyuan
(149)
2,942
–
(10)
16,110
123,405
10,402
–
48
7,529
9,346
15
9,331
$’000
2014
(73)
1,953
–
(11)
14,327
117,053
8,896
–
77
7,073
8,866
331
8,535
$’000
2013
CapitaMall
Shuangjing
25. OPERATING SEGMENTS (continued)
Information about reportable segments (continued)
Notes to the Financial Statements
(626)
2,101
–
(106)
18,840
115,867
11,008
–
125
8,543
19,821
2,173
17,648
$’000
2014
(1,107)
9,451
10
(109)
16,812
110,344
16,764
–
103
7,270
17,813
2,190
15,623
$’000
2013
CapitaMall
Qibao
(765)
7,679
–
(211)
9,747
91,091
14,025
–
49
6,155
11,456
925
10,531
$’000
2014
(209)
7,977
–
(228)
4,673
81,952
13,090
–
73
5,171
9,962
839
9,123
$’000
2013
CapitaMall
Saihan
(175)
1,772
(112)
(181)
4,770
61,335
4,247
–
36
2,394
6,802
550
6,252
$’000
2014
(244)
4,521
37
(170)
5,143
58,647
7,704
–
32
2,911
7,043
482
6,561
$’000
2013
CapitaMall
Wuhu
(11,425)
17,753
(138)
(606)
60,987
513,596
43,204
–
298
24,892
52,575
3,903
48,672
$’000
2013
227,257
(10,426)
845
132,365
203,262
14,174
189,088
$’000
2014
201,361
(1,545)
1,010
103,038
160,075
10,992
149,083
$’000
2013
Grand Total
(12,618)
24,175
39
(617)
53,060
(15,528)
104,829
(28)
(2,754)
399,339
(15,247)
99,159
58
(2,088)
481,308
475,102 2,355,843 2,181,125
47,357
–
304
23,100
48,262
4,134
44,128
$’000
Sub Total
2014
25. OPERATING SEGMENTS (continued)
Reconciliations of reportable segment revenues, total return, assets and liabilities and
other material items
2014
$’000
2013
$’000
203,262
160,075
227,257
201,361
– Other corporate expenses
(23,793)
(16,908)
Total return before taxation
203,464
184,453
2,355,843
2,181,125
2,219
3,166
2,358,062
2,184,291
Total liabilities for reportable segments
399,339
481,308
Other unallocated amounts
580,907
489,118
Consolidated liabilities
980,246
970,426
Reportable
segment
totals
$’000
Unallocated
amounts
$’000
Consolidated
totals
$’000
845
29
874
Revenue
Total revenue for reporting segments
Total return
Total return for reportable segments before taxation
Unallocated amounts:
Assets
Total assets for reportable segments
Other unallocated amounts
Consolidated assets
Liabilities
Other material items 2014
Finance income
Finance costs
(10,426)
(11,500)
(21,926)
Other material items 2013
Finance income
Finance costs
1,010
(1,545)
123
(9,784)
1,133
(11,329)
Geographical segments
All of the Group’s investment properties are used for retail purposes and are primarily located
in China.
Major tenant
Revenue from one tenant of the Group represents approximately $36.6 million (2013: $35.5
million) of the Group’s total revenue.
Delivering Performance | 133
Notes to the Financial Statements
26. COMMITMENTS
(a) Capital commitments
Group
2014
$’000
2013
$’000
3,636
4,023
Payable:
– contracted but not provided for
(b) The Group leases out its investment properties. Operating lease rentals are receivable as
follows:
Group
2014
$’000
2013
$’000
Receivable:
(c)
– within 1 year
175,125
158,326
– after 1 year but within 5 years
414,530
364,307
– after 5 years
372,730
412,612
962,385
935,245
The Group has non-cancellable leases with rentals payable as follows:
Group
2014
$’000
2013
$’000
4,782
5,819
– after 1 year but within 5 years
25,386
23,992
– after 5 years
27,795
32,854
57,963
62,665
Payable:
– within 1 year
134 | CapitaRetail China Trust Annual Report 2014
27. CAPITAL AND FINANCIAL RISK MANAGEMENT
Capital management
The Group’s objectives when managing capital are to optimise Unitholders’ value through the
mix of available capital sources which include debt and equity instruments whilst complying with
statutory and constitutional capital and distribution requirements, maintaining aggregate
leverage and interest service coverage ratios within approved limits. As a key part of the Group’s
overall strategy, the Board of the Manager reviews the Group and the Trust’s debt and capital
management cum financing policy regularly so as to optimise the Group and the Trust’s funding
structure. The Board also monitors the Group and the Trust’s exposure to various risk elements
by closely adhering to clearly established management policies and procedures.
The Group is subject to the aggregate leverage limit as defined in Appendix 6 of the CIS Code
(“Property Fund Appendix”). The Property Fund Appendix stipulates that the total borrowings
and deferred payments (together, the “Aggregate Leverage”) of a property fund should not
exceed 35.0% of its Deposited Property except that the Aggregate Leverage of a property fund
may exceed 35.0% of its Deposited Property (up to a maximum of 60.0%) if a credit rating of the
property fund from Fitch Inc., Moody’s or Standard and Poor’s is obtained and disclosed to the
public. The Group’s aggregate leverage limit did not exceed 35.0% during the year, and was
28.7% (2013: 32.6%) as at 31 December 2014. In computing the aggregate leverage, the Trust
has considered the effect of hedging the net assets denominated in RMB.
There were no changes in the Group’s approach to capital management during the financial
year.
Financial risk management
Overview
The Group’s returns are primarily from net operating income and capital appreciation of its
assets. However, these returns are exposed to financial risks including credit, liquidity, interest
rate and foreign currency risks.
Financial risk management is integral to the whole business of the Group. The Group adopts an
integrated approach to manage the financial risks arising in the normal course of the Group’s
business. The Group has written risk management policies and guidelines, and established
processes to monitor and manage significant exposures. Risk management policies and
processes are reviewed regularly to reflect changes in market conditions and the Group’s
activities.
The Group adheres to standardised accounting and financial policies and exercises effective
controls over the financial affairs of its subsidiaries. This is achieved by ensuring group-wide
adherence to a comprehensive set of guidelines covering contracts, policies and procedures
and other requirements. Adequate measures are in place to ensure that the reliability and
integrity of financial information compiled from subsidiaries are kept intact.
Credit risk
While it is necessary to assume a certain level of tenant credit risks to remain competitive in
China, the Group has established credit limits for tenants and monitors their balances on an
ongoing basis. Risks associated with credit limits are reflected in the level of security deposits
and bank guarantees placed as collateral in respect of the leases. Appropriate risk mitigating
actions are in place to manage trade receivables.
Delivering Performance | 135
Notes to the Financial Statements
27. CAPITAL AND FINANCIAL RISK MANAGEMENT (continued)
Financial risk management (continued)
Credit risk (continued)
The Group establishes an allowance for impairment that represents its estimate of incurred
losses in respect of trade and other receivables. The main components of this allowance are a
specific loss component that relates to individually significant exposures, and a collective loss
component established for groups of similar assets in respect of losses that have been incurred
but not yet identified. The collective loss allowance is determined based on historical data of
payment statistics for similar financial assets.
The allowance account in respect of trade and other receivables is used to record impairment
losses unless the Group is satisfied that no recovery of the amount owing is possible. At that
point, the financial asset is considered irrecoverable and the amount charged to the allowance
account is written off against the carrying amount of the impaired financial asset.
Cash and fixed deposits are placed with banks and financial institutions which are regulated.
Liquidity risk
The Group monitors its liquidity risk and maintains a level of cash and cash equivalents deemed
adequate by management to finance the Group’s operations and to mitigate the effects of
fluctuations in cash flows. Typically the Group ensures that it has sufficient cash on demand to
meet expected operational expenses for a reasonable period, including the servicing of
financial obligations.
In addition, the Group maintains the following debt facilities and programme as at 31 December
2014.
RMB denominated facility:
•
the RMB495.0 million five-year secured term loan facility
S$ denominated facilities:
•
the S$151.0 million money market line facilities
•
the S$88.0 million three-year trust term loan facility
•
the S$50.0 million three-year trust term loan facility
•
the S$50.0 million four-year trust term loan facility
•
the S$50.5 million four-year trust term loan facility
•
the S$75.0 million four-year trust term loan facility
•
the S$50.0 million five-year trust term loan facility
•
the S$75.0 million five-year trust term loan facility
•
the S$100.0 million five-year trust term loan facility
136 | CapitaRetail China Trust Annual Report 2014
27. CAPITAL AND FINANCIAL RISK MANAGEMENT (continued)
Financial risk management (continued)
Liquidity risk (continued)
US$ denominated facility:
•
the US$50.0 million money market line facility
Multicurrency Medium Term Notes:
•
the $500.0 million multicurrency Medium Term Note (“MTN”) Programme
As at 31 December 2014, the Group has drawn down $538.5 million of its trust term loan facilities
and $29.5 million of the money market facility. The Group has also drawn down RMB495.0 million
of the five-year secured term loan facility.
The Group also monitors and observes the Property Fund Appendix issued by MAS concerning
limits on total borrowings.
Interest rate risk
The Manager adopts a proactive interest rate management policy to manage the risk associated
with changes in interest rates on the Group’s loan facilities while also seeking to ensure that the
ongoing cost of debt remains competitive.
As at 31 December 2014, the Group has interest rate swaps (“IRS”) with notional contract
amount of $388.5 million (2013: $315.5 million). The Group pays a fixed rate interest and
receives a variable rate equal to the Swap Offer Rate (“SOR”) on the notional contract amount.
The Group classifies the IRS as cash flow hedges to hedge the exposure to changes in the
variability of interest rate fluctuations on certain of its term loans.
The term loans and the underlying IRS have the same terms and conditions.
The Manager proactively seeks to minimise the level of interest rate risk by locking the majority
of the Group’s borrowings at fixed rates. As at 31 December 2014, the Group has locked in
approximately 72.6% (2013: 61.0%) of its borrowings at fixed rates.
Fair value sensitivity analysis for fixed rate instruments
The Group does not account for any fixed rate financial liabilities at fair value through profit or
loss and the Group does not designate interest rate derivatives as hedging instruments under
a fair value hedge accounting model. Therefore a change in interest rates at the reporting date
would not affect the statement of total return.
Cash flow sensitivity analysis for variable rate instruments
The net change in fair value of the interest component of IRS as at 31 December 2014 of $2.3
million (2013: $0.2 million), representing the effective portion of the cash flow hedge, has been
recognised directly in hedging reserves.
Delivering Performance | 137
Notes to the Financial Statements
27. CAPITAL AND FINANCIAL RISK MANAGEMENT (continued)
Financial risk management (continued)
Interest rate risk (continued)
Cash flow sensitivity analysis for variable rate instruments (continued)
Effects of a 100 basis point (“bp”)* movement in interest rate at the reporting date would
increase/(decrease) statement of total return and Unitholders’ funds by the amounts shown
below. This analysis assumes that all other variables, in particular foreign currency rates, remain
constant. The analysis is performed on the same basis for 2013.
*
100 basis point is equivalent to 1 percentage point
Statement of
total return
100 bp
100 bp
increase
decrease
$’million
$’million
Unitholders’ funds
100 bp
100 bp
increase
decrease
$’million
$’million
Group and Trust
2014
Interest rate swaps
Variable rate instruments
–
(1.8)
–
1.8
(3.1)
–
3.1
–
Cash flow sensitivity (net)
(1.8)
1.8
(3.1)
3.1
2013
Interest rate swaps
Variable rate instruments
–
(0.5)
–
0.5
(1.9)
–
1.9
–
Cash flow sensitivity (net)
(0.5)
0.5
(1.9)
1.9
Foreign currency risk
The Group is exposed to foreign currency risk on cash holdings and operating expenses that are
denominated in a currency other than the respective functional currencies of the Group entities.
The currencies giving rise to this risk are primarily the United States dollar (“US dollar”) and
Chinese Renminbi (“RMB”).
As the Trust intends to be a long term investor in China, the Manager has taken a view not to
hedge the RMB equity exposure arising from its investments in China unless certain risks are
specifically identified. The Manager’s strategy is to achieve a natural hedge through local RMB
financing and any non-RMB denominated loan will be hedged into RMB where possible, to
protect the going concern of the Trust in the event of large currency fluctuation. However, the
Manager will hedge the RMB cash flow from operations if it is determined with certainty that they
are to be remitted back to Singapore for distribution purposes.
138 | CapitaRetail China Trust Annual Report 2014
27. CAPITAL AND FINANCIAL RISK MANAGEMENT (continued)
Financial risk management (continued)
Foreign currency risk (continued)
The Group’s and Trust’s exposures to foreign currency are as follows:
US Dollars
RMB
Total
S$’000
S$’000
S$’000
193
94
287
167
86
253
US Dollars
RMB
Total
S$’000
S$’000
S$’000
Loans to subsidiaries
326,428
–
326,428
Non-trade amounts due from subsidiaries
165,060
–
165,060
31
79
110
491,519
79
491,598
Loans to subsidiaries
315,480
–
315,480
Non-trade amounts due from subsidiaries
159,677
–
159,677
11
71
82
475,168
71
475,239
Group
2014
Cash and cash equivalents
2013
Cash and cash equivalents
Trust
2014
Cash and cash equivalents
2013
Cash and cash equivalents
Sensitivity analysis
A 10% strengthening of Singapore dollar against the US dollar and RMB at the reporting date
would increase/(decrease) total return after tax by the amounts shown below. This analysis
assumes that all other variables, in particular interest rates, remain constant. The analysis is
performed on the same basis for 2013.
Statements of total return
Group
Trust
$’000
$’000
2014
US dollars
RMB
(19)
(49,152)
(9)
(8)
Delivering Performance | 139
Notes to the Financial Statements
27. CAPITAL AND FINANCIAL RISK MANAGEMENT (continued)
Financial risk management (continued)
Foreign currency risk (continued)
Sensitivity analysis (continued)
Statements of total return
Group
Trust
$’000
$’000
2013
US dollars
RMB
(17)
(47,517)
(9)
(7)
A 10% weakening of Singapore dollar against the US dollar and RMB would have had the equal
but opposite effect on the US dollar and RMB to the amounts shown above, on the basis that all
other variables remain constant.
Hedge of net investment in foreign operation
The non-deliverable forwards (“NDF”) of $258.0 million (2013: $288.0 million) are designated as
hedges of the Group’s net investment in certain subsidiaries in China.
The net change in fair value of the net investment hedge comprised the effective portion of $7.0
million (2013: $21.6 million) which was recognised in the foreign currency translation reserve.
Sensitivity analysis
For NDF (accounted for as net investment hedges), a change of 10% in foreign exchange rate
at the reporting date would increase/(decrease) Unitholders’ funds as at 31 December 2014 by
the amounts shown below. This analysis assumes that all other variables, in particular interest
rates, remain constant. The analysis is performed on the same basis for 2013.
Unitholders’ funds
10% increase 10% decrease
$’million
$’million
Group
2014
Non-deliverable forwards
20.1
(24.6)
21.9
(26.8)
2013
Non-deliverable forwards
140 | CapitaRetail China Trust Annual Report 2014
27. CAPITAL AND FINANCIAL RISK MANAGEMENT (continued)
Accounting classifications and fair values
Fair values versus carrying amounts
Note
Loans and
receivables
Fair value –
hedging
instruments
Other financial
liabilities
within scope
of FRS 39
Total
carrying
amount
Fair value
$’000
$’000
$’000
$’000
$’000
Group
2014
Trade and other receivables
7
5,860
–
–
5,860
5,860
Cash and cash equivalents
8
86,626
–
–
86,626
86,626
Financial derivative assets
11
–
1,547
–
1,547
1,547
92,486
1,547
–
94,033
94,033
–
–
51,140
51,140
51,140
–
–
41,158
41,158
39,782
Trade and other payables
9
Security deposits
Interest-bearing borrowings
10
–
–
671,713
671,713
672,943
Financial derivative liabilities
11
–
8,605
–
8,605
8,605
–
8,605
764,011
772,616
772,470
2013
Trade and other receivables
7
6,246
–
–
6,246
6,246
Cash and cash equivalents
8
105,457
–
–
105,457
105,457
Financial derivative assets
11
–
2,044
–
2,044
2,044
111,703
2,044
–
113,747
113,747
–
–
57,719
57,719
57,719
–
–
34,980
34,980
33,803
Trade and other payables
9
Security deposits
Interest-bearing borrowings
10
–
–
712,338
712,338
715,504
Financial derivative liabilities
11
–
5,208
–
5,208
5,208
–
5,208
805,037
810,245
812,234
Delivering Performance | 141
Notes to the Financial Statements
27. CAPITAL AND FINANCIAL RISK MANAGEMENT (continued)
Accounting classifications and fair values (continued)
Fair values versus carrying amounts (continued)
Note
Loans and
receivables
Fair value –
hedging
instruments
Other financial
liabilities
within scope
of FRS 39
Total
carrying
amount
Fair value
$’000
$’000
$’000
$’000
$’000
Trust
2014
Non-trade amounts due from
subsidiaries
6
18,693
–
–
18,693
18,693
Trade and other receivables
7
201
–
–
201
201
Cash and cash equivalents
8
238
–
–
238
238
Financial derivative assets
11
–
1,547
–
1,547
1,547
19,132
1,547
–
20,679
20,679
9
–
–
5,386
5,386
5,386
Interest-bearing borrowings
10
–
–
566,823
566,823
568,053
Financial derivative liabilities
11
–
8,605
–
8,605
8,605
–
8,605
572,209
580,814
582,044
Trade and other payables
2013
Non-trade amounts due from
subsidiaries
6
17,954
–
–
17,954
17,954
Trade and other receivables
7
219
–
–
219
219
Cash and cash equivalents
8
249
–
–
249
249
Financial derivative assets
11
–
2,044
–
2,044
2,044
18,422
2,044
–
20,466
20,466
9
–
–
9,060
9,060
9,060
Interest-bearing borrowings
10
–
–
474,383
474,383
477,549
Financial derivative liabilities
11
–
5,208
–
5,208
5,208
–
5,208
483,443
488,651
491,817
Trade and other payables
142 | CapitaRetail China Trust Annual Report 2014
27. CAPITAL AND FINANCIAL RISK MANAGEMENT (continued)
Accounting classifications and fair values (continued)
Estimation of fair value
The following summarises the significant methods and assumptions used in estimating the fair
values of financial instruments of the Group and Trust.
Investment Properties
Refer to Note 4 on the valuation methods used to arrive at the fair value of investment properties.
Financial derivatives
The fair value of non-deliverable forwards is based on banks’ quotes. These quotes are tested
for reasonableness by discounting the difference between the contractual forward price and the
current forward price for the residual maturity of the contract using a risk-free interest rate
(based on government bonds).
The fair value of interest rate swaps is based on banks’ quotes. These quotes are tested for
reasonableness by discounting estimated future cash flows based on the terms and maturity of
each contract and using market interest rates for a similar instrument at the measurement date.
Interest-bearing borrowings
Fair value, which is determined for disclosure purposes, is calculated based on the present
value of future principal and interest cash flows, discounted at the market rate of interest at the
reporting date.
Other financial assets and liabilities
The carrying amounts of financial assets and liabilities with a maturity of less than one year
(including trade and other receivables, cash and cash equivalents, trade and other payables
and current security deposits) are assumed to approximate their fair values because of the short
period to maturity. All other financial assets and liabilities (non-current security deposits) are
discounted to determine their fair values.
Interest rates used in determining fair values
The interest rates used to discount estimated cash flows, where applicable, are based on the
forward yield curve as at 31 December 2014 plus an adequate constant credit spread, and are
as follows:
Interest-bearing borrowings
Security deposits
2014
% p.a.
2013
% p.a.
1.31-6.40
1.04-6.77
1.84
1.85
Delivering Performance | 143
Notes to the Financial Statements
27. CAPITAL AND FINANCIAL RISK MANAGEMENT (continued)
Fair value hierarchy
The table below analyses financial and non-financial instruments carried at fair value, by
valuation method. The different levels have been defined as follows:
•
Level 1: quoted prices (unadjusted) in active markets for identical assets or liabilities;
•
Level 2: inputs other than quoted prices included within Level 1 that are observable for the
asset or liability, either directly (i.e., as prices) or indirectly (i.e., derived from prices); and
•
Level 3: inputs for the asset or liability that are not based on observable market data
(unobservable inputs).
Level 1
$’000
Level 2
$’000
Level 3
$’000
Total
$’000
Group and Trust
2014
Financial instruments
Non-deliverable forwards
–
(8,520)
–
(8,520)
Interest rate swaps
–
1,462
–
1,462
–
(7,058)
–
(7,058)
Non-financial instruments
Investment properties
–
–
2,250,783
2,250,783
2,243,725
–
(7,058)
2,250,783
Non-deliverable forwards
–
(2,376)
–
(2,376)
Interest rate swaps
–
(788)
–
(788)
–
(3,164)
–
(3,164)
2013
Financial instruments
Non-financial instruments
Investment properties
–
–
–
(3,164)
2,058,094
2,058,094
2,058,094
2,054,930
Financial assets and financial liabilities not carried at fair value but for which fair values
are disclosed
Non-current security deposits and fixed rates interest-bearing borrowings which are level 2
financial instruments has fair value of $24.5 million and $100.0 million (2013: $20.8 million and
$102.0 million) respectively.
144 | CapitaRetail China Trust Annual Report 2014
27. CAPITAL AND FINANCIAL RISK MANAGEMENT (continued)
Fair value hierarchy (continued)
Level 3 fair values
The reconciliation from the beginning balances to the ending balances for Level 3 fair value
measurements of investment properties is disclosed in Note 4.
The following table shows the key unobservable inputs used in the valuation models:
Inter-relationship between
key unobservable inputs and
fair value measurement
Valuation methods
Key unobservable inputs
Capitalisation approach
•
Capitalisation rate (5.75%)
(2013: from 5.00% to
6.75%)
The fair value increases as
capitalisation rates decreases.
Discounted cash flows
approach
•
Discount rates
(from 7.00% to 11.00%)
(2013: from 8.75% to
11.00%)
The fair value increases as
discount rates and terminal
rates decreases.
•
Terminal rates
(from 4.00% to 6.50%)
(2013: from 5.50% to
6.75%)
•
Term and reversion rates
(from 4.25% to 10.50%)
(2013: from 5.50% to
7.00%)
Term and reversion
approach
The fair value increases as
term and reversion rates
decreases.
Key unobservable inputs
Key unobservable inputs correspond to:
•
Investment property yields derived from specialised publications from the related markets
and comparable transactions.
•
Discount rate, based on the risk-free rate for 10-year bonds issued by the government in
the relevant market.
Offsetting financial assets and financial liabilities
The disclosures set out in the tables below include financial assets and financial liabilities that:
•
are offset in the Trust’s statements of financial position; or
•
are subject to an enforceable master netting arrangement, irrespective of whether they are
offset in the statement of financial position
Financial instruments such as loans and receivables and financial liabilities are not disclosed in
the tables below unless they are offset in the statements of financial position.
The Trust’s derivative transactions that are not transacted on an exchange are entered into under
International Swaps and Derivatives Association (“ISDA”) Master Agreements. In certain
circumstances, for example when a termination event such as a default occurs, all outstanding
transactions under the agreement are terminated, the termination value is assessed and only a
single net amount is due or payable in settlement of all transactions.
Delivering Performance | 145
Notes to the Financial Statements
27. CAPITAL AND FINANCIAL RISK MANAGEMENT (continued)
Fair value hierarchy (continued)
Offsetting financial assets and financial liabilities (continued)
Under the agreements signed, the Trust and its counterparties neither have a legal obligation
nor intend to settle on a net basis or to realise the assets and settle the liabilities simultaneously.
In addition, the right of set-off of recognised amounts is enforceable only following the
occurrence of a termination event as set out in the agreements. Accordingly, the ISDA
agreements do not meet the criteria for offsetting and the derivatives financial instruments
presented below are not offset in the Statement of Financial Position.
Financial assets and liabilities subject to offsetting and enforceable master netting
arrangement under termination events
31 December 2014
Financial assets
Interest rate swaps
Non-deliverable forward
Financial liabilities
Interest rate swaps
Non-deliverable forward
31 December 2013
Financial assets
Interest rate swaps
Non-deliverable forward
Financial liabilities
Interest rate swaps
Non-deliverable forward
Gross
amounts of
recognised
financial
instruments
$’000
Gross amount
of recognised
financial
instruments
offset in the
statement of
financial
position
$’000
Net amounts
of financial
instruments
presented in
the statement
of financial
position
$’000
1,481
66
–
–
1,481
66
(13)
(66)
1,468
–
1,547
–
1,547
(79)
1,468
19
8,586
–
–
19
8,586
(13)
(66)
6
8,520
8,605
–
8,605
(79)
8,526
302
1,742
–
–
302
1,742
(139)
(1,240)
163
502
2,044
–
2,044
(1,379)
665
1,090
4,118
–
–
1,090
4,118
(139)
(1,240)
951
2,878
5,208
–
5,208
(1,379)
3,829
Related
amounts not
offset in the
statement of
financial
position
$’000
Net amounts
$’000
28. SUBSEQUENT EVENTS
On 29 January 2015, the Manager declared a distribution of 4.83 cents per Unit to Unitholders
in respect of the period from 1 July 2014 to 31 December 2014.
146 | CapitaRetail China Trust Annual Report 2014
Interested Person Transactions
The transactions entered into with interested persons during the financial year, which fall under the
Listing Manual and the Property Funds Appendix of the CIS Code (excluding transactions of less than
$100,000 each), are as follows:
Name of Interested Persons
Aggregate value of all
interested person
transactions during the
financial year under review
(excluding transactions of
less than S$100,000 and
transactions conducted
under shareholder’s
mandate pursuant to
Rule 920)
S$’000
Aggregate value of all
interested person
transactions during the
financial year under review
under shareholder’s
mandate pursuant to
Rule 920 (excluding
transactions less than
S$100,000)
S$’000
CapitaLand Limited and its subsidiaries or associates
– Management fees 1
10,822
–
– Property management fees
(including reimbursables)
10,302
–
HSBC Institutional Trust Services (Singapore) Limited
Trustee’s fees
1
362
–
For the purposes of Rule 907 of the Listing Manual of the SGX-ST, in arriving at this figure, the market price of the units (being
the closing price of the units traded on the SGX-ST on the relevant date of issue of the units) issued to the Manager for its
management fees, was used to determine the amount of the aggregate asset management fees paid to the Manager for the
period from 1 January 2014 to 31 December 2014.
Saved as disclosed above, there were no additional Interested Person Transactions (excluding
transactions of less than S$100,000 each) entered into during the financial period under review.
The fees and charges payable by CRCT to the Manager under the Trust Deed, and to the Property
Managers under the Property Management Agreements (collectively, the “Exempted Agreements”),
each of which constitutes a Interested Person Transaction, are deemed to have been specifically
approved by the Unitholder upon purchase of the Units and are therefore not subject to Rules 905
and 906 of the Listing Manual to the extent that there is no subsequent change to the rates and/or
bases of the fees charged thereunder which will affect CRCT. However, the renewal of such
agreements will be subject to Rules 905 and 906 of the Listing Manual.
Please also see Related Party Transactions on note 23 in the financial statements.
SUBSCRIPTION OF CRCT UNITS
An aggregate of 3,468,568 Units were issued in relation to the performance component of the
Manager’s management fee paid during the year. As at 31 December 2014, 828,961,977 Units were
in issue and outstanding. In the first quarter of 2015, 844,273 Units will be issued to the Manager as
part payment of the performance component of its management fee for the fourth quarter of 2014.
Delivering Performance | 147
Unitholders’ Statistics
As at 23 February 2015
ISSUED AND FULLY PAID UNITS
828,117,704 Units (voting rights: 1 vote per Unit)
Market Capitalisation: S$1,378,815,977.16 (based on closing Unit price of S$1.665 on 23 February
2015)
DISTRIBUTION OF UNITHOLDINGS
No. of
Unitholders
%
No. of Units
%
32
1,717
4,249
1,755
21
0.41
22.09
54.66
22.57
0.27
1,458
1,673,084
18,220,651
72,882,069
735,340,442
0.00
0.20
2.20
8.80
88.80
7,774
100.00
828,117,704
100.00
No. of
Unitholders
%
No. of Units
%
7,581
110
83
97.52
1.41
1.07
823,378,259
2,577,879
2,161,566
99.43
0.31
0.26
7,774
100.00
828,117,704
100.00
S/No. Name
No. of Units
%
1
2
3
4
5
6
7
8
9
10
11
12
13
14
15
16
17
18
19
20
175,990,578
157,033,221
138,939,292
111,723,549
41,004,283
31,843,543
18,089,178
15,844,747
14,455,106
5,936,373
4,134,458
4,100,083
3,084,629
2,862,499
1,879,412
1,647,290
1,614,469
1,504,035
1,249,740
1,240,957
21.25
18.96
16.78
13.49
4.95
3.85
2.18
1.91
1.75
0.72
0.50
0.50
0.37
0.35
0.23
0.20
0.19
0.18
0.15
0.15
734,177,442
88.66
Size of Holdings
1 – 99
100 – 1,000
1,001 – 10,000
10,001 – 1,000,000
1,000,001 and above
LOCATION OF UNITHOLDERS
Country
Singapore
Malaysia
Others
TWENTY LARGEST UNITHOLDERS
HSBC (Singapore) Nominees Pte Ltd
Retail Crown Pte. Ltd.
DBS Nominees (Private) Limited
Citibank Nominees Singapore Pte Ltd
DBSN Services Pte. Ltd.
CapitaRetail China Trust Management Limited
DB Nominees (Singapore) Pte Ltd
Raffles Nominees (Pte) Limited
United Overseas Bank Nominees (Private) Limited
BNP Paribas Securities Services Singapore Branch
DBS Vickers Securities (Singapore) Pte Ltd
Koo Boon Hooi (Qiu Wenhui)
Bank Of Singapore Nominees Pte. Ltd.
Morgan Stanley Asia (Singapore) Securities Pte Ltd
Phillip Securities Pte Ltd
OCBC Securities Private Limited
ABN AMRO Nominees Singapore Pte Ltd
OCBC Nominees Singapore Private Limited
Siong Lim Private Limited
Societe Generale, Singapore Branch
148 | CapitaRetail China Trust Annual Report 2014
DIRECTORS’ INTERESTS IN UNITS AND CONVERTIBLE SECURITIES AS AT 21 JANUARY 2015
Based on the Register of Directors’ Unitholdings, save for those disclosed below, none of the
Directors holds any interest in Units and convertible securities issued by CRCT.
Name of Director
No. of Units
Direct Interest
Deemed Interest
Liew Cheng San Victor
Lim Ming Yan
Fong Heng Boo
Ng Kok Siong
Tony Tan Tee Hieong
121,319
181,154
10,340
251,000
34,989
–
–
–
–
–
SUBSTANTIAL UNITHOLDERS’ UNITHOLDINGS AS AT 23 FEBRUARY 2015
Based on the information available to the Manager as at 23 February 2015, the unitholdings of
Substantial Unitholders of CRCT are as follows:
Name of Substantial Unitholder
Temasek Holdings (Private) Limited (THPL)
CapitaLand Limited (CL)
CapitaMalls Asia Limited (CMA)
CapitaLand Retail China Pte. Ltd. (CLRC)
Direct Interest
No. of Units
%
–
–
–
Deemed Interest
No. of Units
%
–
314,985,916 1
38.04
–
311,581,764
2
37.63
311,581,764
3
37.63
4
18.96
–
–
–
157,033,221
Retail Crown Pte. Ltd.
157,033,221
18.96
–
–
HSBC Institutional Trust Services (Singapore)
Limited, as trustee of CapitaMall Trust
122,705,000
14.82
–
–
Matthews International Capital Management,
LLC (MICM)
–
–
60,253,000 5
7.28
–
48,680,000
6
5.88
44,302,000
7
5.35
8
5.34
Matthews International Funds (MIF)
AIA Group Limited (AIAGL)
–
–
–
AIA Company Limited (AIACL)
50,000
0.01
44,252,000
AIA Singapore Private Limited
44,252,000
5.34
–
–
1
THPL is deemed to have an interest in the unitholdings in which its associated companies have or are deemed to have an
interest pursuant to Section 4 of the Securities and Futures Act, Chapter 289 of Singapore. THPL is wholly-owned by the
Minister for Finance.
2
CL is deemed to have an interest in the unitholdings of HSBC Institutional Trust Services (Singapore) Limited, as trustee of
CapitaMall Trust and its indirect wholly-owned subsidiaries namely, Retail Crown Pte. Ltd. and the Manager.
CMA is deemed to have an interest in the unitholdings of HSBC Institutional Trust Services (Singapore) Limited, as trustee of
CapitaMall Trust and its indirect wholly-owned subsidiaries namely, Retail Crown Pte. Ltd. and the Manager.
3
4
5
6
7
8
CLRC is deemed to have an interest in the unitholdings of its direct wholly-owned subsidiary namely, Retail Crown Pte. Ltd..
MICM is a U.S. registered investment advisor who has a discretionary authority over its clients’ investment.
MIF is deemed to have an interest in the unitholdings of Brown Brothers Harriman & Co, the custodian for Units owned by MIF.
AIAGL is deemed to have an interest in the unitholdings of its direct wholly-owned subsidiary namely, AIACL and its indirect
wholly-owned subsidiary namely, AIA Singapore Private Limited.
AIACL is deemed to have an interest in the unitholdings of its direct wholly-owned subsidiary namely, AIA Singapore Private
Limited.
FREEFLOAT
Based on the information made available to the Manager, approximately 49.27% of the Units in CRCT
were held in the hands of the public as at 23 February 2015. Accordingly, Rule 723 of the Listing
Manual of the SGX-ST has been complied with.
Delivering Performance | 149
Malls Directory
Name of Mall
Address
Tel (General)
Fax (General)
CapitaMall
Xizhimen
凱德MALL•西直門
No. 1 Xizhimenwai Street,
Xicheng District, Beijing
北京市西城區西直門外大街1號
(86) 10 5830 1111
(86) 10 5830 1599
CapitaMall
Wangjing
凱德MALL•望京
No. 33 Guangshun North Street,
Chaoyang District, Beijing
北京市朝陽區廣順北大街33號
(86) 10 8472 9898
(86) 10 8472 9800
CapitaMall Grand
Canyon
凱德MALL•大峽谷
No.16 South Third Ring West
Road, Fengtai District, Beijing
北京市豐台區南三環西路16號
(86) 10 8756 2780
(86) 10 8526 7556
CapitaMall
Minzhongleyuan
凱德新民眾樂園
No. 704 Zhongshan Avenue,
Jianghan District, Hankou,
Wuhan, Hubei Province
湖北省武漢市漢口江漢區中山大道
704號
(86) 27 8553 0108
(86) 27 8537 9137
CapitaMall Qibao
凱德七寶購物廣場
No. 3655 Qixin Road, Minhang
District, Shanghai
上海市閔行區七莘路3655號
(86) 21 6479 3030
(86) 21 6479 0808
CapitaMall Saihan
凱德MALL•賽罕
No. 26 Ordos Street,
(86) 47 1596 1222
Saihan District, Huhhot,
Inner Mongolia Autonomous Region
內蒙古自治區呼和浩特市賽罕區鄂
爾多斯大街26號
(86) 47 1597 1671
CapitaMall Wuhu
凱德廣場•蕪湖
No. 37 Zhongshan North Road,
Jinghu District, Wuhu,
Anhui Province
安徽省蕪湖市鏡湖區中山北路37號
(86) 55 3599 1888
(86) 55 3599 1886
CapitaMall Anzhen Building 4, Zone 5, Anzhenxili,
凱德MALL•安貞
Chaoyang District, Beijing
北京市朝陽區安貞西里5區4號樓
(86) 10 5879 9001
(86) 10 5879 9009
CapitaMall Erqi
凱德廣場•二七
No. 3 Minzhu Road,
Erqi District, Zhengzhou,
Henan Province
河南省鄭州市二七區民主路3號
(86) 27 8359 1800
(86) 27 8359 1818
CapitaMall
Shuangjing
凱德MALL•雙井
No. 31 Guangqu Road,
Chaoyang District, Beijing
北京市朝陽區廣渠路31號
(86) 10 5879 9001
(86) 10 5879 9009
.
150 | CapitaRetail China Trust Annual Report 2014
Corporate Information
CAPITARETAIL CHINA TRUST
THE MANAGER
REGISTERED ADDRESS
HSBC Institutional Trust Services
(Singapore) Limited
21 Collyer Quay
#10-02 HSBC Building
Singapore 049320
www.capitaretailchina.com
Email: [email protected]
REGISTERED ADDRESS
CapitaRetail China Trust
Management Limited
168 Robinson Road
#30-01 Capital Tower
Singapore 068912
Tel: +65 6713 2888
Fax:+65 6713 2999
Stock Code: AU8U
Counter Name:CapitaR China TR
BOARD OF DIRECTORS
Liew Cheng San Victor
Chairman & Non-Executive
Independent Director
TRUSTEE
HSBC Institutional Trust Services
(Singapore) Limited
21 Collyer Quay
#03-01 HSBC Building
Singapore 049320
Tel: +65 6658 6906
Fax:+65 6534 5526
AUDITOR
KPMG LLP
Public Accountants and
Chartered Accountants
16 Raffles Quay
#22-00 Hong Leong Building
Singapore 048581
Tel: +65 6213 3388
Fax:+65 6225 0984
Partner-In-Charge: Ronald Tay
Appointed: With effect from financial
year ended 31 December 2012
UNIT REGISTRAR
Boardroom Corporate &
Advisory Services Pte. Ltd.
50 Raffles Place
#32-01 Singapore Land Tower
Singapore 048623
Tel: +65 6536 5355
Fax:+65 6536 1360
Lim Ming Yan
Deputy Chairman &
Non-Executive Non-Independent
Director
Fong Heng Boo
Non-Executive Independent
Director
Christopher Gee Kok Aun
Non-Executive Independent
Director
AUDIT COMMITTEE
Fong Heng Boo
Chairman
Christopher Gee Kok Aun
Ng Kok Siong
Professor Tan Kong Yam
CORPORATE DISCLOSURE
COMMITTEE
Liew Cheng San Victor
Chairman
Lim Ming Yan
Ng Kok Siong
EXECUTIVE COMMITTEE
Lim Ming Yan
Chairman
Ng Kok Siong
Tony Tan Tee Hieong
COMPANY SECRETARY
Goh Mei Lan
Ng Kok Siong
Non-Executive Non-Independent
Director
Professor Tan Kong Yam
Non-Executive Independent
Director
Tony Tan Tee Hieong
Chief Executive Officer &
Executive Non-Independent
Director
This Annual Report to Unitholders may contain forward-looking statements. Forward-looking statement is subject to inherent uncertainties and is based on
numerous assumptions. Actual performance, outcomes and results may differ materially from those expressed in forward-looking statements. Representative
examples of factors which may cause the actual performance, outcomes and results to differ materially from those in the forward-looking statements include
(without limitation) changes in general industry and economic conditions, interest rate trends, cost of capital and capital availability, availability of real estate
investment opportunities, competition from other companies, shifts in customers’ demands, changes in operating conditions, including employee wages,
benefits and training, governmental and public policy changes and the continued availability of financing in the amounts and the terms necessary to support
future business. You are cautioned not to place undue reliance on these forward-looking statements, which are based on the current views of management on
future events.
All rights are reserved.
CapitaRetail China Trust Management Limited
As Manager of CapitaRetail China Trust
Company Registration No. 200611176D
168 Robinson Road
#30-01 Capital Tower
Singapore 068912
Tel: +65 6713 2888
Fax: +65 6713 2999
Email: [email protected]
www.capitaretailchina.com
This annual report is printed on environmentally-friendly paper.


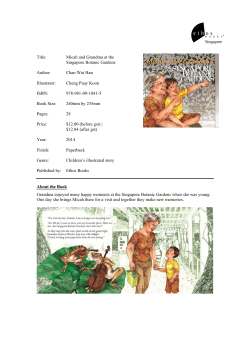
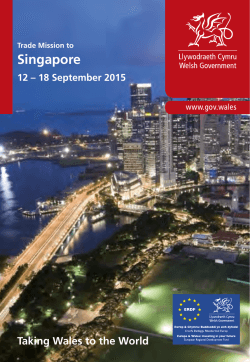

© Copyright 2026