
A Things of Interest Recommendation by Leveraging
A
Things of Interest Recommendation by Leveraging Heterogeneous
Relations in the Internet of Things
Lina Yao, The University of Adelaide, Australia
Quan Z. Sheng, The University of Adelaide, Australia
Anne H. H. Ngu, The Texas State University, USA
Xue Li, The University of Queensland, Australia
Internet of Things (IoT) bridges the gap between the physical and the digital worlds, which enables a deeper understanding of user
preferences and behaviors. The rich interactions and relations between users and things calls for effective and efficient recommendation approaches to better meet users interest and needs. In this paper, we focus on the problem of things recommendation in
IoT, which is important for many applications such as e-commerce and health care. We discuss the new properties of recommending things of interest in IoT, and propose a unified probabilistic factor based framework by fusing relations across heterogeneous
entities of IoT, e.g., user-thing relations, user-user relations and thing-thing relations, to make more accurate recommendations.
Specially, we develop a hypergraph to model things’ spatio-temporal correlations, on top of which implicit things correlations can
be generated. We have built an IoT testbed to validate our approach and the experimental results demonstrate its feasibility and
effectiveness.
General Terms: Design, Algorithms, Performance
Additional Key Words and Phrases: Internet of Things, data mining, hypergraph, latent relationships, recommendation
1. INTRODUCTION
Internet of Things (IoT) accelerate the growth of data available on the Internet, and the traditional search
paradigms can become incapable of digging the information that people need from massive and deep resources. Furthermore, given the dynamic nature of devices, organizations, and social structures involved in
the IoT, intelligent and automated approaches are needed to support decision makers with the knowledge
derived from the vast amount of information available through IoT networks. IoT is more desirable of
an effective and efficient paradigm of pro-active discovering rather than post-active searching, in which a
user who has certain information needs will search on the Internet for related resources, while the concept
of “discovery” refers to the ability to push relevant and related resources to the user, especially according
to the meta data collected from the user’s historical activities in terms of activities on resources or with
other people.
To realize pro-active discovery on the future Internet, in this paper, we explore the topic of things
recommendation. Things recommendation is a crucial step for promoting and taking full advantages of
Internet of Things, where it benefits the individuals, businesses and society on a daily basis on two main
aspects. On the one hand, it can deliver relevant things (e.g., things that users might need) to users based
on their preferences and interests. On the other hand, it can also serve to optimize the time and cost of
using IoT in a particular situation. Physical things in reality have multiple unique attributes. For instance,
physical things have states (e.g., in use or not in use; expired or not expired). When a certain thing
is in use, it can not be used simultaneously by another user. Under this circumstance, a recommender
system can refer the user to a list of similar things which are available. Recommendation in Internet of
Things is more spontaneous, context dependence and monopolistic under certain circumstances compared
with traditional recommendations. Consequently, things recommendation is much more complex than
traditional recommender systems like recommending books or movies to consumers. The followings are
some of the reasons that cause the additional complexity in things recommendation:
— Diverse relations. The heterogeneous relationships and inter-dependencies between entities (people and
things), data, information and knowledge in Internet of Things are growing exponentially, leading to
complexity and gross inefficiencies. Failure to distinguish the various types of relations may result in
inaccurate recommendation results.
— Highly dynamic. The dynamic nature of things calls for models that can rapidly adapt to the constantly
changing status of things and always present the most up to date recommendation results.
— Spatio-temporal correlated. User behaviors on things are intrinsically correlated both spatially and temporally. The heterogeneous nature of spatio-temporal data is a big challenge for recommendation.
— Incomplete description. Things are usually associated with descriptions, categories or social tags to describe their attributes of functionality or non-functionality. However, unlike traditional recommendation
ACM Transactions on Internet Technology, Vol. V, No. N, Article A, Publication date: January YYYY.
A:2
(i.e., recommending a movie), the textual information associated with things is usually incomplete and
ambiguous.
In light of the above challenges, we propose a probabilistic matrix factorization based framework to
address things recommendation problem in IoT. We fuse information from social networks of users and
correlation networks of things, by learning shared latent factors stemming from the probabilistic matrix
factorization on three matrices, namely users relation, things correlations, and observable things usage
interactions. A user’s social connections can provide valuable clues about her preferences. However,
constructing a collaborative user model is not trivial, since not all information from the social environment
is equally useful. In our framework, we leverage the social relation information in designing the social
regularization term to constrain the matrix factorization objective function. The social regularization term
can indirectly model the propagation of the user’s interest and preference.
We also propose a graph-based approach to uncover things correlations by analyzing things usage frequency, which reflects two implications: i) users’ preferences or needs on things can be partially revealed
by how frequently a user uses each thing; ii) higher usage frequency on a thing from a user indicates
more needs on this thing. Our approach adopts the probabilistic matrix factorization based on dimensionality reduction techniques. More specifically, the user-thing frequency matrix (induced from things usage
logs) is factorized into two low-dimensional factor matrices: user latent matrix and thing latent matrix.
Finally, the state of physical things are rapidly updated and one thing can not be used by multiple users
in certain circumstances. For instance, an ATM machine being in use can not be used by another person.
We embed a sequential Monte Carlo based mechanism into our proposed framework to continuous refine
the things availability temporally, and integrate this latest information in the recommendation results. Our
main contributions are summarized as follows:
— We focus on things recommendation and systematically analyze things correlations, which has substantial impact on users behaviors on things usage and human decision making process. This work is based
on our previous work on correlation discovery of ubiquitous things in IoT and preliminary exploration
on things recommendation [Yao et al. 2013; Yao et al. 2014b].
— Things correlations can be uncovered and utilized for serving user-thing usage pattern prediction. In
particular, we develop a hypergraph-based approach to derive things implicit correlations in a queryrank style, in which complex relations in user-thing interactions can be represented at utmost without
unnecessary information loss.
— We propose a sequential Monte Carlo based method to continuously track the availability status of
physical things, and embed such dynamic feature of physical things into our proposed framework to
improve recommendation results.
— We validate and evaluate our model on a real-world Internet of Things testbed. The experimental results
demonstrate the feasibility and effectiveness of our approach.
The rest of this paper is organized as follows. We formulate our problem in Section 2. We present
the proposed framework and technical details in Section 3. We describe the setting of our experimental
environment and report our evaluation results in Section 4. Finally, we overview the related work in
Section 5 and discuss future research directions in Section 6.
2. PROBLEM FORMULATION
We argue that both users’ relations and things’ correlations should be taken into account for making accurate recommendations in IoT. Indeed, users’ relations (i.e., friendships) can have significant impact on
things usage patterns. Personal tastes are correlated. Research in [Kameda et al. 1997] shows that friendships and relations between users play a substantial role in human decision making in social networks. For
instance, people usually turn to a friend’s advice about a commodity (e.g., hair straighter) or a restaurant
before they go for them. Sometimes, such influence from the friend circle is even more substantial than
high ratings given by other people [Sinha and Swearingen 2001]. In addition, if one user is using a certain
thing (e.g., a laptop), the status of thing can spread to her friendship circle, and the people in her circle
will know the thing is not available. They therefore need to turn to other similar things if they need them.
Such kind of situation typically happens in Internet of Things, and affects the things’ usage events. It also
affects the people’s decision making process and recommendation results.
As mentioned above, things are functionality-oriented and things that have similar or same functionalities hold strong relationships. We argue that physical things have more distinctive structures and conACM Transactions on Internet Technology, Vol. V, No. N, Article A, Publication date: January YYYY.
A:3
Fig. 1. The graph induced from users’ social networks and things correlations. The connections consist of three types of links,
including users’ friendships within users’ social network, things correlations with correlation graph of things and things usage links
within user-thing interactions. Our task is to predict the dyadic relationship between users and things , in other words, recommending
certain things to users.
nections in terms of their functionalities in real life (i.e., usefulness), as well as non-functionalities (i.e.,
availability). For example, different things provide different functionalities (e.g., microwave and printer),
and will be of interest to different groups of people. Pairwise things with strong correlations indicate
either they have similar functionalities or they have more likelihood to be used together. For instance, a
water tap and a chop board are both in use when we prepare meals, since most of the time we need to wash
cooking materials (e.g., vegetables) before chopping them. In either case, similar things usage pattern will
be reflected and the latent correlations between things will be revealed, which have the potential to affect
the recommendation process in an implicit way and have not been explored much yet.
Figure 1 gives an overview of user-thing interactions in Internet of Things, in which the addition of
interactions (things use events) creates new relations and correlations. We can build three graphs from it:
a user-thing graph, a thing-thing graph, and a user-user graph.
— User-thing graph. In the user-thing graph (shown in the middle with black dash lines of Figure 1), there
are two types of nodes, users and things. An edge starting from a user and ending at a thing indicates
that the user has used or invoked the thing (e.g., used an ATM machine in KFC), and the weight of the
edge can indicate the number of usage. We name this as things usage events in this paper.
— User-user graph. In the user-user graph (shown in the right with blue lines of Figure 1), a node is a user
and an edge is the original connection between two users in an existing social network.
— Thing-thing graph. In the thing-thing graph (shown in the left with red lines of Figure 1), a node is a
thing and a directed edge between two things indicates that some users consecutively use and invoke
the things. The weight associated with an edge represents the strength of the correlation between two
things, which is derived from the users’ interactions on the things, e.g., two things may be connected if
they have been used at similar time or at similar types of locations. This implicit relations initially can
not be observed and are inferred from things usage events (Section 3.2).
Formally, given the historical things’ usage logs Y ∈ RI×J of I users P = {p1 , ..., pI } and J things
T = {t1 , ..., tJ } with rij as the number of times user pi used thing tj . We have the profile information for
each yij , such as temporal information, which indicates what time the usage event happened, and spatial
information, which indicates where the thing is used. The things correlations can be derived by mining
the usage patterns. In the meantime, we craft the social information of users in terms of their connections
with each other.
Things usage logs represent the interactions between users and things, each log happens when a person
interacts with a particular thing. The location L denotes the things’ location information, where S is a set
ACM Transactions on Internet Technology, Vol. V, No. N, Article A, Publication date: January YYYY.
A:4
of time stamps, indicating that a user accesses a thing at a specific time in a specific location. Each usage
event record is a triple of ThingID,Timestamp, Location as described in the following.
D EFINITION 1 (T HINGS U SAGE E VENT). Let T = {t1 , . . . , tn }, U = {u1 , ..., um }, S =
{s1 , ..., sp } and L = {l1 , ..., lq } represent the set of things, users, timestamps and locations, respectively. A usage event of a thing t, denoted by h ∈ H = {h1 , ..., hi } = {< t, u, s, l > |t ∈ T ∧ u ∈
U ∧ s ∈ S ∧ l ∈ L}, which indicates that user u used thing t located in a specific location l at timestamp
s.
Things recommendation in IoT can be formulated as predicting the dyadic relationships between people
and things by leveraging informative relations from the thing-thing graph, the user-thing graph and the
user-user graph. In other words, our model merges three heterogeneous types of dyadic relationships,
namely people to things ({∃yi,j , ∀i ∈ P, j ∈ T }), people to people ({∃si,i′ , ∀i, i′ ∈ P}), and things to
things ({∃ti,i′ , ∀i, i′ ∈ T }), where P and T denote people and things respectively. Figure 1 shows the
graphical representation of the three relationships.
We aim at recommending certain things to users according to predicted things usage value, which is
reflected by the usage frequency of things. In particular, a pair of user-thing instance (i, j), ∀i ∈ T , ∀j ∈
P generates the interactive relationship which can be abstracted as:
{(i, j) → yij } where i ∈ T , j ∈ P
(1)
which forms a matrix Y ∈ Y |I||J | . Our goal is to predict the missing entries y˜i˜j given testing pair (˜i, ˜j).
Things with bigger values of y˜i˜j will be recommended to a given user.
3. PROPOSED RECOMMENDATION FRAMEWORK
In this section, we introduce our unified framework, where the information from social relations and
things correlations are coupled simultaneously through shared latent factors learned from three matrices:
the user-user friendship matrix, the thing-thing correlation matrix, and the user-thing usage matrix. Our
methodology fuses user relationships, things correlations and user-thing interactions together, and incorporates three relationships: user-user connections, thing-thing correlations, and user-thing interactions
(thing usage). We describe how to encode these three relationship matrices in our model from Section 3.1
to Section 3.2.
3.1. Decoding Users Friendship
We construct a directed weighted graph Gu = (Vu , Ev ), whose vertex set Vu corresponds to users set
{u1 , ..., um }, edges set Ev represents the friendships between users and the range of their associated
weight are in [0, 1]. Bigger weights indicate stronger ties between users. The weight Wu indicates the
user similarity influenced by the social links between users, reflecting the homophily (i.e., similar users
may have similar interests). We use the cosine similarity to calculated sii′ as follows:
′
sii′
eαcos(b(i),b(i ))
=∑
αcos(b(i),(b(k))
k∈Ω(i) e
(2)
b(i) · b(i′ )
, Ω(i) is the set of the user i’s friends (i.e., j ∈ Ω(i)), b(i) is the
||b(i)||||b(i′ )||
binary vector of things used by user i, || · || is the L-2 norm of vector b(·), and α is a parameter that reflects
the preference for transitioning to a user who interacts with the same things.
After we obtain the users’ friendship matrix from Gu , we factorize users’ friendship matrix to derive
a high-quality, low dimensional feature representation to user-based latent features vectors ui ∈ R1×m
and factor-based latent feature vectors u′i′ ∈ R1×m on analyzing the social network graph Gu . The
conditional probability of sii′ over the observed social network is determined by:
where cos(b(i), b(i′ )) =
sii′ ∼ P r(sii′ |uTi u′i′ ; σs )
where ui ∼ N (0, σu2 ), u′i′ ∼ N (0, σu2 ′ )
(3)
Similar to the Web link adjacency, if a user i has lots of links to other users, the trust value of sii′ should
be decreased. While if a user i is trusted by many other users, the trust value sii′ should be increased, since
the user can be considered as local authority, sii′ should be adjusted as:
ACM Transactions on Internet Technology, Vol. V, No. N, Article A, Publication date: January YYYY.
A:5
Table I. Samples of one user’s things usage log
ThingID
1
5
5
5
4
4
2
...
Timestamp
20101108020307
20101109073226
20101109074235
20101109075139
20101109091202
20101109091408
20101109171643
...
Location
Office-1
Sec4-KitchenHome
Sec4-KitchenHome
Sec4-KitchenHome
Sec2-LivingRoom1
Sec2-LivingRoom1
Sec4-KitchenHome
...
Table II. Processed samples of one
user’s things usage log
ThingID
t1
t5
t5
t5
t4
t4
t2
...
√
s∗ii′ =
Timestamp
s1
s4
s4
s4
s3
s3
s2
...
Location
p2
p4
p4
p4
p1
p1
p4
...
d− (i′ )
× Sii′
d+ (i) + d− (i′ )
(4)
where d+ (i) represents the outdegree of node i, while d− (i′ ) indicates the indegree of i′ . Equation 3 can
be reformulated as:
s∗ii′ ∼ P r(s∗ii′ |uT u′ ; σs )
(5)
3.2. Decoding Things Correlations
Compared with users’ social relations, things correlation are implicit and not straightforward to obtain,
and there are some unique challenges in order to learn things correlations [Yao et al. 2013]. To fully
utilize the rich information in things usage logs mentioned above, we extract implicit things correlations
by mining the underlying connections among things and their spatio-temporal patterns in this paper.
Our study builds on the theory of homophily from the field of social networks, which implies that
people with similar characteristics tend to form relationships [McPherson et al. 2001]. Then, the presence of relationships among people can be used to infer their similarities. Moreover, the stronger the
tie, the higher the similarity. This inference is particularly useful when characteristics of people are not
directly observable or incomplete. We advocate that the homophily principle applies to things as well,
that is, things with strong interactive relationships tend to have strong correlations. We propose a unified hypergraph to represent the various entities and heterogeneous relations in collection of things usage
events in terms of temporal and spatial dimensions, hypergraph is a generalization of the ordinary graph,
where the edges, also known as hyperedges, are arbitrary non-empty subsets of the vertex set [Zhou et al.
2006; Agarwal et al. 2006]. With hypergraph modeling, the vertice represent various types of entities in
user-thing interactions (e.g., people, things, temporal and spatial information etc.), and the hyperedges
represent heterogeneous relations among entities via connecting arbitrary subsets of vertice. In this way,
we not only incorporate heterogeneous relations, e.g., the similarity between locations, but also utilize
the spatio-temporal historical interactions on things collections. On top of this unified hypergraph, we develop a ranking-based algorithm to learn the most related things according to a query by propagating the
information of target thing through the structure of this constructed hypergraph. We take an example to
show processing of things usage logs as follows. Table I shows some raw samples of things usage events
in terms of time and location dimensions, and Table II shows the same samples after processing where
things, locations, and time stamps are represented using unique IDs. Note that the 2nd, the 3rd, and the
4th timestamps fall into a same time period, and they are therefore given the same timestamp ID. Figure 2
reflects the location-thing and time-thing matrices extracted from logs.
ACM Transactions on Internet Technology, Vol. V, No. N, Article A, Publication date: January YYYY.
A:6
Fig. 2. Spatio-Temporal matrices extracted from samples shown in Table I
1 is to represent heterogeneous entities and relations (e.g.,
Fig. 3. Overview of Proposed Things Correlation Derivation: stage ⃝
2 is to develop a ranking algorithm to search
things, locations and timestamps) in things usage events to a unified hypergraph; stage ⃝
related things (the blue arrows show the training stage while the yellow arrows show the test stage).
Given things usage logs in terms of temporal and spatial factors, thing-thing correlation derivation can
be formally formulated as Problem 1.
P ROBLEM 1 (T HINGS C ORRELATION D ERIVATION). Given each thing denoted as a vector yi
whose initial entry corresponding to the target thing is 1, 0 otherwise. Its relations of the rest of other
things related the given thing can be quantified by learning a ranking function.
To solve this problem, there are two subproblems that need to be solved sequentially, defined as subproblem 1 and subproblem 2 respectively.
S UBPROBLEM 1 (M ODELING). Given a collection of things usage events H, construct a hypergraphbased model HG representing the heterogeneous entities and their complex relations across and within
the entities.
S UBPROBLEM 2 (I NFERENCE). Given the constructed hypergraph HG induced from things usage
events collection H, learn a rank function that can produce a list of related things for each target thing.
These two subproblems are successive relations. Ideally, a solution should be robust in capturing and
reflecting the hidden pattern in usage events, and also be efficient in ranking the candidates.
Our proposed solution (see Figure 3) can be decomposed into two stages: i) descriptive stage and ii)
predictive stage. The first stage aims at embracing the multiple relations in things usage events, and we
particularly propose a hypergraph to model the heterogeneous entities and relations of things usage events
(corresponding to Subproblem 1). In the second stage, we infer a list of most related things given a querying thing by developing a ranking algorithm on top of the descriptive model in stage 1 (corresponding to
Subproblem 2).
3.2.1. Hypergraph Preliminary. As a generalization of the conventional graphs, a hypergraph can naturally address these mentioned challenges (as demonstrated in Figure 4). The fundamental idea is to
explore the underlying similarity relationships among vertices via constructing a hypergraph with various
ACM Transactions on Internet Technology, Vol. V, No. N, Article A, Publication date: January YYYY.
A:7
hyperedges to capture the high-order and complex similarities. Hypergraph has been extensively explored
in recommendation [Bu et al. 2010] and multi-label classification [Sun et al. 2008].
Let HG(V, E) be a hypergraph with the vertex set V = T ∪ L ∪ S and the set of hyperedges E. A
hyperedge e is a non empty subset of V where ∪e∈E = V. Let HG(V, E, W) be a weighted hypergraph
where W : E → R+ is the hyperedge weight. The hypergraph is said to be connected when there
is a path between each pair of vertices. A path is a connected sequence of vertices over hyperedges
{v1 , e1 , v2 , e2 , ..., ek−1 , vk } where {vi , vi+1 } ⊆ ei . A hyperedge e is said to be incident with v when
v ∈ e. A hypergraph has an incidence matrix H ∈ R|V|×|E| and each entry h(v, e) is defined as follows
[Bu et al. 2010; Zhou et al. 2006]:
{
h(v, e) =
1
0
if v ∈ e
if v ∈
/e
(6)
So, the degree d(v) of vertex v and the degree δ(e) of hypergraph degree e are defined as follows:
∑
d(v) =
W(e)h(v, e)
e∈E
δ(e) =
∑
h(v, e) = |e|
(7)
v∈V
where W(e) is the weight of the hyperedge e, and δ|e| is the number of vertices in e. We use De and Dv
to denote the diagonal matrices of the degrees of hyperedges and vertices respectively.
3.2.2. Subproblem 1: Modeling. We first introduce some intuitions behind using hypergraph to model
things usage events, and then describe how to realize the modeling task defined in subproblem 1.
As mentioned before, things usage event is a four-elemental tuple containing object, user, timestamp,
location, which means there are four types of entities and multiple relationships across these entities. We
summarize three major challenges in order to exploit and model the rich information:
— How to model heterogeneous relations with minimal information loss. The various entities and relations
make it difficult to develop a unified framework taking into account all objects and relations. For example, there are three types of contextual attributes in things usage events. To illustrate their relations with
objects, we generally need to construct three separate graphs, e.g., location-thing graph and time-thing
graph. However, dividing multiple relations into separated graphs can cause non-trivial information loss.
— How to robustly model high-order relations. There exist some relations which are more complex, and
it will cause information loss if simply being modeled using low-order modeling approach, e.g., using
pairwise similarity based graph. Plus, a pairwise relation between two nodes is only based on their own
characteristics. If one of them is corrupt, their relation will be broken. As a result, the relations between
pairwise nodes are not stable.
— How to reveal latent connections. The complex dependencies among a variety of entities make it hard
to detect a latent relationship between entities. For example, although the usage frequency of thing
< t1 , t3 > being used together falls below some threshold, they might actually be meaningfully related.
Let us say things < t3 , t2 > are used together frequently, and < t1 , t2 > are also used frequently
together. The presence of t2 actually provides some possible latent connection for < t1 , t3 >, which
needs to be uncovered.
Conventional graph can overcome these obstacles partially. However, it is difficult to fully capture the
heterogeneous and complex relations in things usage events by using conventional graph. For instance,
the underlying cross-entity relationships in things usage events usually have richer structures than conventional graphs can contain. Figure 4 (a) shows a simple example to compare the scenarios of using
conventional graph (left) and of using hypergraph to model temporal relations of things (right). In this
example, a thing t1 is accessed at time1 and time2 . The conventional graph obviously can not capture this connection, e.g., to show time1 and time2 relations with t1 respectively, it needs two edges
< time1 , t1 > and < time2 , t1 >. From this representation, we can not derive relations whether t1 and
t2 are accessed in the same time interval. However, the hypergraph can tackle this problem naturally due
to the fact that its edges can contain any number of arbitrary nodes. The hyperedge < time1 , time2 , t1 >
clearly demonstrates the relations among the entities. Figure 4 (b) shows one thing is highly possible to be
ACM Transactions on Internet Technology, Vol. V, No. N, Article A, Publication date: January YYYY.
A:8
Fig. 4. Illustrative example of hypergraph vs. conventional graph on modeling things usage events in terms of unified relations
and high-order relations: (a) the conventional graph (left) in which a pair of user and thing is connected if the user accessed this
thing. This graph can not clearly reflect whether the graph measures pairwise relations, e.g., < time1 , t1 > and < time2 , t1 >,
and the hypergraph (right), where each hyperedge can contain any number of arbitrary nodes to exhibit more complex relations,
e.g., hyperedges can be written as < time1 , time2 , t1 > (ellipse shadow), from which we can clearly know thing t1 is accessed
at < time1 , time2 > ; (b) the conventional graph (left) in which two things can be connected if they are accessed at same time
interval, but it can not tell whether this thing is accessed at other time frames, and the hypergraph (right) can reasonably represents
this complex relations.
Table III. Hyperedges in Things Usage Events
Index
1
2
3
4
Index
5
External Relations across Entities
Notation Hyperedges
ET T I
Thing-Thing-Time
ET T L
Thing-Thing-Location
E LLT
Location-Location-Thing
E IIT
Time-Time-Thing
Internal Relations within Entities
Notation Hyperedges
p
EL
p-nearest locations
accessed at multiple specific time frames. The conventional graph (left) describing binary correlations can
not capture this high-order relations, however hypergraph (right) can accomplish this complex relations
naturally.
A hyperedge in our things usage hypergraph can be a set of vertices with either the same type or
different types. The former kind of hyperedge captures the relations among the same type of objects,
while the later captures the relations across different types of objects. Things usage events consists of
four types of entities. Let T denote the set of things, I denote the set of timestamps and L denote the
set of locations. In our data model, we formalize a hypergraph HG that contains six different implicit
and complex relations with different entities, namely external relations across entities. Another two highorder relations are constructed within two types of entities including users and locations, which we call
internal relations. Table III summarizes all the hyperedges modeled by our unified hypergraph. We briefly
introduce them in the following.
External Relations. There are four external relations in our model:
— E T T I . This represents the scenario that two things are used at a same time period. The weight w(eti tj ik )
for this relation is set to be the frequency that both things ti and tj are used in same time period ik . The
calculation is same as Equation 9.
w(eti tj ik ) = |{(ti , tj , ik )}|ti ∈ T , tj ∈ T , ik ∈ L|
(8)
and it can be normalized as:
w(eti tj ik )
√
∑|T |
tl tj ik )
ti tm i k )
m=1 w(e
l=1 w(e
w(eti tj ik ) = √∑
|T |
(9)
ACM Transactions on Internet Technology, Vol. V, No. N, Article A, Publication date: January YYYY.
A:9
— E T T L . This represents that two things are used at a same location. The weight w(eti tj lk ) for this relation
is set to be the frequency that both things ti and tj are used in the same location lk . The calculation is
same as Equation 9.
— E IIT . In this relation, if one thing is used at the same timestamp, we assign the weight as 1.
— E LLT . In this relation, if one thing is used in the same location, we assign the weight as 1.
Internal Relations.
— E L . In this relation, we consider the similarity between different locations. In the hypergraph, a hyperedge of this type is each location and its top p similar locations. For each location li , its weight of
hyperedge is calculated as:
p
1∑
w(e ) =
sim(li , lj )
p j=1
p
lip
(10)
where sim(li , lj ) is the similarity between two locations. Given two locations, we measure their similarity using the Jaccard coefficient between the sets of things used at each location:
sim(li , lj ) =
|Γoi ∩ Γoj |
|Γoi ∪ Γoj |
(11)
where Γoi and Γoj denote the set of used things at location li and location lj respectively.
Based on hypergraph modeling introduced above, we can derive the vertex-hyperedge incidence matrix
H (as shown in Table 3.2.2) and also the weight matrix W. The size of both matrices depends on the
cardinality of different element sets involved in the matrices, and they are all sparse matrices.
Table IV. The incident matrix H of proposed hypergrah
T
I
L
ET T I
T ET T I
IE T T I
0
ET T L
T ET T L
0
LE T T L
E LLT
T E LLT
0
0
E IIT
T E IIT
IE IIT
LE LLT
p
EL
0
0
p
LE L
3.2.3. Subproblem 2: Inference. To infer the related things for a given querying thing, we adopt a
spectral clustering based semi-supervised learning framework [Zhu 2006]. The goal is that given each
thing i, to estimate a ranking function f which allocates other things with different relateness scores f (i)
over hypergraph HG, indicating their relevance with querying thing i ∈ V. Let ti ∈ t be the query vector
for thing i. The learning process can be formulated under a regularization framework as follows:
Q(f ) = E(f ) + µℓ(f , t)
(12)
where E(f ) is the quadratic energy function, which smooths the vertices nearby according to Markov
assumption, in other word, the nearby vertices on HG should have similar relatedness score, ℓ(f , t) is
the loss function measuring the difference between predicted relatedness score and true scores. µ is the
regularizer. The equation can be expanded as:
|V|
1 ∑∑ 1
Q(f ) =
2 i,j=1
δ(e)
e∈E
∑
(vi ,vj )⊂e
2
|V |
f
∑
fj i
−
W(e) √
||fi − ti ||2
+µ
d(vi ) d(vj ) i=1
(13)
The optimal relatedness scores can be learned recursively by solving the optimization problem in a
closed form [Zhou et al. 2006]:
f ∗ = argminf Q(f ) = (1 − α)(1 − αΘ)−1 t
where
α = 1/1 + µ and Θ =
Dv−1/2 HWDe−1 HT Dv−1/2
ACM Transactions on Internet Technology, Vol. V, No. N, Article A, Publication date: January YYYY.
(14)
A:10
1
2
3
4
5
6
7
8
9
10
11
12
13
14
15
16
17
18
19
ALGORITHM 1: Hypergraph based Things Correlation Learning
Input: A sequence of things usage events H and things set t = {t1 , .., tn }
Output: Relation matrix of things T
Constructing hypergraph HG as described in Section 3.2.2;
Computing incident matrix H;
Computing weight matrix H;
Computing vertice degree matrix Dv ;
Computing hyperedge degree matrix De ;
−1/2
−1/2
Computing Θ = Dv
HWDe−1 HT Dv
;
Initializing T = ∅;
for i=1:n do
Initializing relatedness score vector ti as: the i-th element is tii = 1, other elements are equal to 0;
Let f 0 = ti ;
while δ < ξ do
f j+1 = αΘf j + (1 − α)ti ;
for k = 1:n do
δ ← max |fkj+1 − fkj |;
end
end
Output {t1 , ..tn } sorted by relatedness score with ti ;
T = T ∪ ti ;
end
The Equation 14 can be reformulated as:
f ∗ = αΘf ∗ + (1 − α)t
(15)
Our things correlation approach is implemented in a two-stage process. We first integrate both interactive relationships formulated across things, timestamps and locations, and pairwise relationships formulated between any homogeneous entities from the things usage events in a unified hypergraph. Then,
given the hypergraph representation of things usage events, we treat correlation derivations as a ranking
problem over the hypergraph, where each thing is treated as a query ti (line 9 in Algorithm 1). Our task
is to rank other nodes on the hypergraph according to their related score to the query node (from line 8 in
Algorithm 1). Following this process, we can derive pairwise relations of things. The detailed algorithm
of things derivation is summarized in Algorithm 1.
3.3. Decoding User-Thing Interactions
User-thing interactions yij are embodied by the usage frequency of thing i by user j in a certain timespan.
We can map the usage frequency to interval [0, 1] by using function f (x) = (x − ymin )/(ymax − ymin )
without loss of generality, where ymax and ymin are the maximum and minimum usage values respectively. The dyadic relationship between a user and a thing does not only depend on their latent factor
U T V , whose vulnerability is that it makes use of past interactions and can not handle brand new things
well, i.e., cold start problem. To tackle this issue, we use the explicit features directly by profiling users
observable features xi ∈ Rc (i.e., age, gender, location etc.) and things observable features zj ∈ Rd
(i.e., textual description of things functionalities, things contextual information etc) [Yang et al. 2011b]. c
and d are the dimensionality of users observable features and things observable features respectively. The
dyadic relationship (thing usage value) depends on not only the inner product of latent factors of users
and things, but also their observable features. Things usage value yij can be defined as the following
conditional probability:
yij ∼ P r(yij |ui , vj , xi , zj , σy2 )
(16)
We adopt the bilinear product to specify the similarity between user observable features and thing
observable features [Chu and Park 2009]. The pairwise similarity between xi and zj can be denoted as:
rij = wT (xi ⊗ zj )
(17)
ACM Transactions on Internet Technology, Vol. V, No. N, Article A, Publication date: January YYYY.
A:11
where w is a column vector of entries {wmn }, and xi ⊗ zj denotes the Kronecker product of xi and zj .
Equation 17 can be rewritten as:
rij = xTi W zj
(18)
where matrix W ∈ R
is a weight coefficients capturing pairwise associations between user i’s explicit
feature vector and thing j’s explicit feature vector including key state indicator or descriptive information
of things. The explicit feature vector xi of user i reflects demographic information of users like gender,
identity etc.
The explicit feature vector zj of things includes static features and dynamic features. The static features
contain textual descriptors of things, and property information. Since the dynamic feature consists of
things availability which changes over time, we adopt a particle filtering based tracking method to obtain
the latest things’ availability [Yao and Sheng 2011], which indicates things availability temporally.
So the thing usage value depends on both the inner product of user and thing latent factors and the bilinear product of user observable features and thing observable features. Equation 16 can be reformulated
as:
m×n
yij ∼ P r(yij |uTi vj + rij , σy2 )
(19)
3.4. The Fusion Model
Given observable data for O = {Oy , Os , Ot }, our framework can be denoted as an optimization problem
of minimizing the negative logarithm of P r(O|Σ)P r(Σ) via:
min L(Σ) = min λy
Σ
∑
ℓ(yij , uTi vj + rij ) + λs
∑
ℓ(s∗ii′ , uTi u′i′ ) + λt
ℓ(tjj ′ , vjT vj′ ′ )
jj ′ ∈Ot
ii′ ∈Os
ij∈Oy
∑
(20)
+λw ||w|| + λU ||U || + λV ||V ||
2
2
2
where ℓ· is a loss function (we adopt the most widely used ℓ2 loss). A gradient descent process can be
implemented to solve the parameters. Given a training dataset {yij }, the objective function in Equation 20
can be found by performing gradient descent in ui , vj and wmn .
∂ℓ
(yij , uT v + rij )vj + uTi ui )
∂ui
∂ℓ
(21)
vj → vj − δ × (
(yij , uT v + rij )ui + vjT vj )
∂vj
∂ℓ
w →w−δ×(
(yij , uT v + rij )ui vjT + wT w)
∂w
where δ is the learning rate. After we obtain the optimal parameters Σ∗ , we can use them to predict the
given testing data {˜i, ˜j, y˜i,˜j }
ui → ui − δ × (
y˜i˜j = u˜Ti v˜j +
cd
∑
∗
x˜in z˜jm wmn
(22)
mn
where c and d are the dimensionality of users’ explicit features x and things explicit features z.
Our proposed fusion model couples three types of relations: user social relations, thing correlations and
user-thing relations. The model is constrained by three types of information: similar user regularization,
similar thing correlation, and similar cohesion between users and things. We use the aforementioned
information to help better shape the user and thing latent representative spaces to generate more accurate
recommendation results on things of interest.
4. EVALUATIONS
We conducted several experiments to evaluate the performance of our proposed approach. The first experiment is to compare our approach with other state-of-the-art methods. The second experiment is to
demonstrate the impact of social networks and things correlations on recommendation respectively. The
third experiment demonstrates the impact of different methods of things correlation derivation. We also
study the impact of different time granularity decomposition in the fourth experiment.
ACM Transactions on Internet Technology, Vol. V, No. N, Article A, Publication date: January YYYY.
A:12
4.1. Experimental Settings
We set up a testbed that consists of several different places (e.g., bedroom, bathroom, garage, kitchen),
where approximately 127 physical things (e.g., couch, laptop, microwave oven, fridge) are monitored by
attaching RFID tags and sensors. This task greatly benefits from our extensive experience in a large RFID
research project [Wu et al. 2012]. We have developed a research prototype that provides an environment
where users can check and control things real time via a Web interface1 . Figure 5 (a) shows some RFID
devices and sensors used in the implementation and Figure 5 (b) shows part of the kitchen setting in our
testbed. In our implementation, things are exposed on the Web using RESTful Web services, which can
be discovered and accessed from a Web-based interface.
Figure 6 shows the architecture of our testbed. The system features a layered architecture, and is developed using the Microsoft .NET framework and SQL Server 2012. Physical things and their related data
and events are mapped to corresponding virtual resources, which can be aggregated and visualized via a
range of software components. The system provides two ways to identify physical objects and connect
them to the Web. The first one is to use RFID technology, where the physical objects are attached with
RFID tags and interrogated by RFID readers. The second one is to combine sensors with objects to transfer the raw data to the network. The raw data captured by readers and sensors will be further processed.
The data access layer i) manages RFID tags and sensors associated with physical things, ii) collects raw
RFID and sensor data and processes them, and iii) provides a universal API for higher level programs to
retrieve the status of things. Due to inherent characteristics of RFID and sensor data (e.g., volatile) [Sheng
et al. 2008], this layer contains several software components for filtering and cleaning the collected raw
data, and adapting such data for high-level applications. The advantage of the data access layer is to allow
the system to provide data synchronously. This is important since some devices work with more than one
sensor and the sensor readings may come asynchronously. This layer works in a scalable plug-and-play
fashion, where new sensors can be easily plugged-in and the existing sensors can be removed.
The Virtual Things module maps a collection of classes (also called virtual things) to their corresponding physical things. Each virtual thing communicates with the sensor hive, collects the information, and
interprets the current status of the corresponding physical device. The Event Management layer focuses
on event processing that automatically extracts and aggregates things usage events based on the data feeds
from the virtual things layer in a pipelined fashion. The pipeline consists of three main phases: the event
detection, the contextual information retrieval, and the event aggregation.
In our implementation, there are two ways to detect usage events of things: sensor-based for detecting
state changes and RFID-based for detecting mobility [Yao et al. 2013]. In the sensor-based detection, the
usage of an object is reflected by changes of the object’s status, e.g., a microwave oven moved from an
idle to an in-use state. In the RFID-based detection, the movement of an object indicates that the object is
being used. For example, if a coffee mug is moving, it is likely that the mug is being used. In this situation,
we adopt a generic method based on comparing descriptive statistics of the Received Signal Strength
Indication (RSSI) values in consecutive sliding windows [Parlak et al. 2011]. The statistics obtained from
two consecutive windows are expected to differ significantly when an object is moved.
The Contextual Information Retriever fetches contextual information contained in things usage events.
In our current implementation, we focus on three types of contextual information: identity (user), temporal
(timestamp) and spatial (location) information [Yao and Sheng 2012; Yao et al. 2013]. For the spatial
information, we consider two situations. For static objects (e.g., refrigerator), the spatial information is a
prior knowledge. For mobile objects (e.g., RFID-tagged coffee mug), we provide coarse-grain and finegrain methods for localization. The coarse-grain method uses the RSSI signal received from a tagged
object to approximate its proximity to an RFID antenna. Each zone is covered by a mutually exclusive
set of RFID antennas. The zone scanned by an antenna with the maximum RSSI signal is regarded as the
object’s location. The fine-grain method compares the signal descriptors from an object at an unknown
location to a previously constructed radio map or fingerprint. We use the Weighted k Nearest Neighbors
algorithm (w-kNN) to find the most similar fingerprints and compute a weighted average of their 2D
positions to estimate the unknown tag location [Yao et al. 2013].
Finally, the Service Layer consists of a rule engine and a service container. The service container
converts events and data into corresponding services. In particular, the service repository stores the descriptions of services (in the form of RESTful APIs) for things, where applications can easily access the
data associated with a particular thing stored in the database (e.g., usage history of a device), as well
1 https://www.youtube.com/watch?v=t4DHt0vUulY
ACM Transactions on Internet Technology, Vol. V, No. N, Article A, Publication date: January YYYY.
A:13
(a)
(b)
Fig. 5. The settings of system (a) some sensors and RFID devices, and (b) part of the kitchen setting (e.g., sensor-enabled microwave oven and toaster)
as manipulate the actuators (e.g., turning on or off a light). The APIs are represented using JavaScript
Object Notation (JSON), which is developed from the JavaScript for representing simple data structures
and associative objects. The service manager is responsible for abstracting services from the lower level,
representing them as services, and storing them into the service repository.
Ten volunteers participated in the data collection by interacting with RFID-tagged things for a period
of four months, generating 20,179 records on the interactions of tagged things. The dataset collected
from our testbed is still small. To make the dataset big enough for experimental studies, we augmented
our dataset with Washington State University’s CASAS datasets2 , which were also collected from a
smart home environment. More specifically, we used dataset1 [Cook et al. 2009] and dataset2 [Singla
et al. 2010]. From the datasets, we identified 52 more things (e.g., bowel, door, coffee table and watertap) and deduced things usage events. For the location information, we refered to the sensor layout
of each dataset for grouping sensors into corresponding locations. For example, L-11 to L-15 are located in the bathroom, so we mapped the location of things usage events related to L-11 to L-15 to the
bathroom. Each activity was transformed into things usage events, to be used in our experiments. For
example, consider the activity of “reading a magazine in couch”, we converted it into two events, <
magazine, person1, timestamp, livingroom > and < couch, person1, timestamp, livingroom >.
The detailed data preparation process can be found in [Yao et al. 2014a] and Table V is a summary of the
statistics of the dataset. It should be noted that “scale” in the table refers to the usage frequency between
the least frequent used things and the most frequent used things. For example, for Cooking, one of the
least used thing is the blender (54 times), while one of the most used thing is the fridge (2442, the door
open/close times of the fridge).
Table V. Statistics of the dataset
No.
1
2
3
4
5
6
Category
Entertainment
Office
Cooking
Transportation
Medicine/Medical
House Appliances
# Things
44
26
42
13
10
44
# Scale
68 - 1132
511 - 1790
54 - 2442
31 - 870
22 - 89
46 - 2863
We adopt Mean Absolute Error (MAE) to measure the accuracy of our approach. MAE calculates the
average of absolute difference between predicted usage values and actual values as the following:
∑
˜ij |
ij |yij − y
M AE =
(23)
n
where yij is the actual thing’s usage values between user i and thing j, y˜ij is the predicted thing’s usage
value, and n is the number of the predicted thing’s usage values. The lower the MAE, the better the
2 http://ailab.wsu.edu/casas/datasets/
ACM Transactions on Internet Technology, Vol. V, No. N, Article A, Publication date: January YYYY.
A:14
Web-based User Interface
GUI for Admin
User Interface
Service Container
Service Layer
Service
Manager
Service
Repositor
y
Rule Engine
Data Repository
Listening Things Events
Event
Management
Change
Things Status
Record Things Status to Database
Event Processing Unit
Contextual Information Retriever
Event Detector
Event Aggregator
Generate
Things
Events
Virtual Things
Subscribe Events
Sensor Hive
Wrapper
Apply Changes to Physical Things
Data Access Layer
Physical Things
Microwave Oven
Light
Fridge
RFID positioning
grid
Toaster
Fig. 6. The system architecture
performance. Due to the size of our dataset, in our experiments, we calculated MAE based on the overall
MAE on prediction things usage value across all categories.
4.2. Results
4.2.1. Performance Comparison. This experiment compares the prediction accuracy of our proposed
approach based on fusing social networks and things correlations (FST) with some state-of-the art
approaches based on probabilistic factor analysis, namely Probabilistic Matrix Factorization (PMF)
[Salakhutdinov and Mnih 2007], SoRec [Ma et al. 2008] and SVD++ [Koren 2008].
— NMF applies non-negative matrix factorization on user-location matrix to predict the possibility of thing
usage. The user-thing interaction matrix can be decomposed into two lower dimension matrices in this
method:
m n
1 ∑∑
min
(yij − uTi vj )2
(24)
U,V 2
i=1 j=1
— Probabilistic Matrix Factorization (PMF) is briefly defined as:
ACM Transactions on Internet Technology, Vol. V, No. N, Article A, Publication date: January YYYY.
A:15
Table VI. MAE Comparison with Other Approaches on All Categories
Training Data
# of Factors
NMF
PMF
SVD++
SoRec
FST
FST/S
FST/T
10%
5
10
0.8825 0.8746
0.8635 0.8544
0.8425 0.8311
0.8103 0.7978
0.7903 0.7746
0.7894 0.7867
0.7927 0.7893
20%
5
10
0.8613
0.8567
0.8245
0.8153
0.8004
0.7982
0.7872
0.7723
0.7712
0.7648
0.7747
0.7710
0.7782
0.7739
50%
5
10
0.8513 0.8472
0.7662 0.7495
0.7410 0.7273
0.7317 0.7168
0.7231 0.7106
0.7273 0.7217
0.7311 0.7304
yij ∼ P r(uTi vj , σy )
(25)
where ui and vj are the low dimensional factors learned from user-item interactions.
— SoRec integrates users’ social network structure and the user-item interaction matrix. The integration is
based on the probabilistic factor analysis through the shared user latent feature space ui , by learning the
low-rank user latent feature space ui and u′i′ on social network, and the item latent feature space vj on
user-item interaction matrix. It can be defined as:
sii′ ∼ p(sii′ |uTi u′i′ , σr )
yij ∼ p(yij |uTi vj , σy )
(26)
— SVD++ combines the neighborhood models and latent factor models together.
yij ∼ p(yij |ˆ
uTi vj , σy )
∑
where u
ˆi =
i′ ∈N⟩
∑
ωii′ u′i′
i′ ∈Ni
ωii′
(27)
, and Ni refers to neighbor of user i.
This experiment evaluated our approach, in particular its capability in handling the cold start problem,
an important issue in recommender systems which refers to providing accurate prediction when some
users only use few things or even have no usage historical records at all. In order to verify the capability
of our approach on predicting usage value of things that have not been used, we randomly selected and
marked off p% of data (p= 10, 20 and 50) from our dataset as training data and different number of latent
factors (5 and 10) to test all the methods. The experimental results are shown in Table VI.
From the table, it is clear that our approach outperforms other methods on different training ratios and
different number of factors, especially when the training data is small, i.e., when the training ratio is 10%.
The reason lies in PMF is a pure probabilistic factor model. Relying heavily on user-thing usage matrix, it can not deal with the circumstance where little interactions information is available. SoRec works
better than PMF and SVD++ because of its aggregation of user-user internal information (social links).
Our approach not only incorporates users and things internal information, but also defines the explicit
features (i.e., content) for users (e.g., users profile) and things (e.g., description of things functionalities),
which makes our approach perform better when there is a cold start problem. The experimental result further demonstrates the effectiveness on improving the recommendation accuracy by incorporating things
correlations.
4.2.2. Impact of Things Correlations and Social Influence. This experiment evaluated the impact of
users’ relations and things correlations to our model. To do so, we excluded the things correlations information from our model, denoted as FST/T, and the social relations from the model (FST/S) respectively.
FST/T is defined as:
yij ∼ P r(yij |uTi vj + rij , σy )
sii′ ∼ P r(sii′ |uTi u′i′ )
(28)
And FST/S is defined as:
yij ∼ P r(yij |uTi vj + rij , σy )
tjj ′ ∼ P r(tjj ′ |vjT vj′ ′ )
ACM Transactions on Internet Technology, Vol. V, No. N, Article A, Publication date: January YYYY.
(29)
A:16
0.9
0.8
0.8
0.7
0.7
0.6
Single Level
Two−Level
Fine Two−Level
#factor=5
#factor=10
0.5
0.4
0.5
MAE
MAE
0.6
0.4
0.3
0.3
0.2
0.2
0.1
0.1
0
Hyper
Trinity
(a)
STUnion
0
#factor=5
#factor=10
(b)
Fig. 7. (a) Impact of Hypergraph-based Correlations Derivation and (b) Impact of single level and two level time decomposition
FST/T is similar to SoRec in [Ma et al. 2008], but it is imported with the explicit features of users and
things. Besides, we excluded the social influence factors, namely FST/S, which has the same structure as
FST/T since our model FST holds a symmetrical structure. We implemented FST/T, FST/S and FST, and
conducted experiments to study their performance. We varied the training ratio as 10%, 20% and 50%,
and the number of factors are 5 and 10 respectively.
The results in Table VI show that the performance of FST/T drops when we take out the things correlations from FST. This validates our intuition that things’ correlations do affect users’ decision making
process and behavior pattern when they use services offered by different things. Another finding is that
FST/S consistently performs better than FST/T. In other words, things correlations has more influence
than users’ social relations. Comparing with traditional Internet resource like images or documents, physical things have bigger impact on users’ behavior because of their closeness with people and its nonduplicability. This is indeed a unique feature of Internet of Things. For instance, one physical thing can
not be simultaneously used by multiple users, which will affect users’ usage behavior. For example, if
microwave in room1 is in use now, someone else has to seek for another microwave in room2 even he
planed to use the microwave in room1 because it is closer to his office. Although this affects the things
usage, we found that the improvement is not quite obvious. The reason might lie in that our dataset is not
sparse due to its relatively small size. The impact of fusing things correlations on top of users’ relations
do not have siginificant impact on the recommendation accuracy.
4.2.3. Impact of Different Things Correlation Derivation. We compared our hypergraph-based approach
with other conventional graph based approaches, which are described as follows:
— Trinity. This method constructs three separate graphs from things usage events, namely user-thing graph,
time-thing graph and location-thing graph respectively. We name this approach as trinity [Yao and Sheng
2012].
— STUnion. This method builds two graphs: one is using a spatio-temporal graph and a social graph. The
two graphs model things usage contextual information and user-thing relationships respectively. We
name this approach as STUnion [Yao et al. 2013].
Figure 7 (a) shows the significant improvement of the performance by using our proposed hypergraphbased approach. Our approach outperforms the other two conventional graph based methods. The reason
is that hypergraph-based approach naturally integrates various relations into a unified framework without
information loss, where high-order correlations across different entities are well-captured, which encodes
the users’ preference, contextual connections of things, and hence makes the results better. Compared with
the hypergraph based unified framework, the other two methods use conventional graphs, and squeezing
the complex relations across heterogeneous entities causes some information loss, even though STUnion
outperforms Trinity by integrating spatial information and temporal information together. Besides, mapping things usage information into separate graphs, which needs to tune parameters to find the optimal
weight assignment of each graph. The optimal settings usually depend on different categories of things
based on our previous study, that is another reason why the two conventional graph based methods perform worse than hypergraph based method.
ACM Transactions on Internet Technology, Vol. V, No. N, Article A, Publication date: January YYYY.
A:17
4.2.4. Impact of Time Granularity. To study the influence of different time granularities on system performance, we deployed three strategies of processing timestamps in our proposed framework. One strategy is single level decomposition, in which the time is decomposed into 24 hours. Another strategy is
more refined granularity, namely two-level time decomposition, where we decompose the times into discrete 24 hours and week/weekend days. Monday to 18: 00 of Friday belong to the week days and 18:00
of Friday to Sunday belong to the weekend days. In this case, we have 24*2 time segments. The third
strategy is namely fine two-level decomposition, where times are decomposed into 24 hours and 7 days,
where we have 24*7 time nodes. Figure 7(b) shows the comparative results. The fine two-level decomposition slightly outperforms the other two strategies. The reason might be two-level strategy considers
the human periodical behavior patterns. Intuitively, users behave differently when using different things
due to the nature of functions of things. As a result, different patterns, naturally formed in aggregated
behaviors of visitors to various kinds of things, are embedded in the things usage logs. For instance, users
generally tend to spend more time on things belonging to entertainment category or home category, less
time on office category on the weekend compared with weekdays. The second strategy nicely describes
the features of periods.
5. RELATED WORK
In this section, we provide an overview about collaborative filtering approaches and thing search in Internet of things, which are closely related to our approach.
5.1. Collaborative Filtering
Collaborative filetering (CF) techniques exploit historical interactions of user behaviors for future prediction based on either neighborhood methods [Sarwar et al. 2001; Deshpande and Karypis 2004; Linden
et al. 2003] or latent factor methods [Koren et al. 2009; Hofmann 2003; Salakhutdinov and Mnih 2007].
The idea behinds neighborhood-based methods is that interactions between users and items can be inferred from the observation of users or items neighborhood. It predicts very well in learning the locality
of dependencies, but does not explain the global relationships in the user-item interactions. The idea behind latent factor models is that preferences of a user are determined by a small number of latent factors,
and it can learn the informative latent feature space but fails in capturing the local dependency of user
or item neighborhood. Multiple unified models are proposed to combine neighborhood-based methods
and latent factor based methods together. For example, [Koren 2008] proposes an approach combining
neighborhood based CF and latent factor model together, and the performance is significantly improved.
[Salakhutdinov and Mnih 2007] proposes a probabilistic matrix factorization framework, which scales
linearly with the number of observations and performs well on the large and sparse dataset. However, all
of them can not handle the cold-start problem very well. [Agarwal and Chen 2009] addresses the coldstart problem by integrating explicit features of users and items into latent factors learning process. They
develop a regression-based latent factor model for rating prediction, which uses features for factor estimation. In their methods, the user and item latent factors are estimated through independent regression on
user and item features, and the recommendation is calculated from a multiplicative function on both user
and item factors.
However, these research efforts assume users are independent or unrelated to each other. This assumption does not work well in the context of social networks where users social interactions have a big impact
on recommending process. Most recent research work focus on exploiting the information of users’ connections for recommendation. Many approaches have been developed to integrate users’ social information in recommendation. [Jamali and Ester 2009] proposes a social recommendation framework based on
probabilistic matrix factorization via employing user social networks and user-item ratings. [Yang et al.
2011a] designs a joint friendship and interest propagation model, where the user-item interest network
and the user-user friendship network are jointly modeled through latent user and item factors. [Zhou et al.
2012] proposes a kernel-based probabilistic matrix factorization, which incorporating external information into the matrix factorization process via assuming latent factors are in Gaussian distribution. [Gu et al.
2010] develops a unified model for CF based on graph regularized weighted nonnegative matrix factorization. They adopt user demographic and item genre information to construct neighborhood graphs and
incorporated user and item graphs in weighted nonnegative matrix factorization. [Ma et al. 2008] proposes
a matrix factorization method to exploit the social network information. Compared with these research
efforts, we construct the things correlation graph capturing global connections and similarities between
things, and integrate the graph with users’ social relation graph to learn the latent factors simultaneously.
ACM Transactions on Internet Technology, Vol. V, No. N, Article A, Publication date: January YYYY.
A:18
5.2. Things Search
Searching related things (objects) is a key service in ubiquitous environments, such as the emerging Internet of Things (IoT) and smart environments. However, effectively searching for things is significantly
more complicated than searching for documents because things are tightly bound to contextual information (e.g., location) and are often moving from one status to another. In addition, things do not have easily
indexable properties, unlike human-readable text in the case of documents.
As in the traditional Web search, things search can be realized by exploiting keyword-based methods,
like Microsearch [Tan et al. 2010], and Snoogle [Wang et al. 2008]. But the accuracy of these methods is
not satisfying due to the insufficient content features of ubiquitous things. Another mainstream solution to
search in a ubiquitous computing environment (e.g., Internet of Things) is via semantic Web related techniques. For example, Mitetz et al. [Mietz et al. 2013] present a scalable semantic-based search model for
Internet of Things. Perera et al. [Perera et al. 2013] propose a middleware for sensor search based on users’
priorities and other characteristics of sensors (e.g., reliability and accuracy). GSN [Aberer et al. 2006],
Microsoft SensorMap [Nath et al. 2007] and linked sensor middleware [Le-Phuoc et al. 2011] support
search for sensors based on textual metadata that describes the sensors (e.g., type and location of a sensor,
measurement unit, object to which the sensor is attached). Such metadata is often manually entered by the
person who deploy the sensors. Other users can then search for sensors with certain metadata by entering
appropriate keywords. There are efforts to provide a standardized vocabulary to describe sensors and their
properties such as SensorML3 or the Semantic Sensor Network Ontology (SSN)4 . Unfortunately, these
ontologies and their use are rather complex. It is problematic that end users are able to provide correct
descriptions of sensors and their deployment context without the help from experts. In other words, this
type of solutions require the time-consuming prior and expertise knowledge, e.g., define the descriptions
of things and their corresponding characteristics under a uniform format such as Resource Description
Framework (RDF). Furthermore, these solutions do not exploit the rich information about users historical
interactions with things, containing implicit relations of different entities, e.g., if some users have the
similar usage pattern on some things, which may indicate close connection of these things.
Another alternative approach for searching things is based on search-by-example. The work in [Truong
et al. 2012] adopts this approach to sensors, i.e., a user provides a sensor, respectively a fraction of its
past output as an example, and requests sensors that produced similar output in the past. Ostermaier et
al. [Ostermaier et al. 2010] propose a real-time search engine for Web of Things, which allows searching
real-world entities having certain properties. They associate a Web page to a real-world entity (e.g., a
meeting room) containing additional structured metadata about the sensors connected to it. This method
takes care of the valuable information of historical data, but misses the relations among contextual information. Maekawa et al. [Maekawa et al. 2012] propose a context-aware web search in ubiquitous
sensor environments, and Yao et al. [Yao and Sheng 2012; Yao et al. 2013; Yao et al. 2014b] construct
the models that captures the pairwise relations between things via mapping the contextual information
into separate graphs. However, more complex relations between heterogeneous objects can not be captured in these works. In addition, some useful information and structure might be lost when flatting the
multi-dimensional information into graphs.
Compared with the related work mentioned above, our proposed approach has two obvious advantages.
First of all, the only data source needed in our approach is the interactions between users and things. This
interaction events are handy to obtain with recent development of sensor networks and RFID technology.
Secondly, we solve things searching problem from extracting the underlying relations among ubiquitous
things and their interconnections via mining the rich information hidden in the human-thing interactions.
6. CONCLUSIONS AND FUTURE DIRECTIONS
Recommending the right thing to use at the specific time and location is a fundamental concern in the
emergent Internet of Things research. The work presented in this paper is a continuing exploration of
our previous work in [Yao 2012; Yao et al. 2013]. In particular, we have shown that both users’ relations
and things correlations have synergy effect on things recommendation. We propose a probabilistic matrix factorization based model integrating users’ social relations (i.e., friendship) and things correlations
together, where simultaneous latent factors are learned by revealing three dyadic relationships, including
user-user, user-thing and thing-thing relationships. Specially, we develop a unified hypergraph to model
3 http://www.opengeospatial.org/standards/sensorml
4 http://www.w3.org/2005/Incubator/ssn/ssnx/ssn
ACM Transactions on Internet Technology, Vol. V, No. N, Article A, Publication date: January YYYY.
A:19
complex relations of user-thing interactions for deriving latent things spatio-temporal correlations. We
also integrate the content and other additional information of users and things to cope with the cold-start
problem in recommendations. We conduct extensive experiments to validate and examine our proposed
model, and the results demonstrate its feasibility and effectiveness.
There are a number of interesting research directions that we are planning to work to further improve
our approach.
Recommendation in Big Data. Internet of Things is one of the biggest contributors to the emerging
Big Data, in which vast amounts of data would need to be processed with more computational resources.
There are two main directions to exploit our model in the Big Data environment. The first one is related
to the mathematical properties of the algorithms (e.g., constructing more efficient data structures so that
the data can fit in memory), and the second solution is related to the software engineering aspects of
manipulating data on the scale of terabytes or even petabytes, such as constructing efficient, distributed,
I/O infrastructure for accessing and manipulating the IoT data in a large-scale environment.
Online Update. In the Internet of Things, physical things are more dynamic compared with traditional
Web resources. In another future work, we plan to improve our model so that it can adaptively propagate up-to-date information from things correlations network and make more accurate recommendations.
Things states can be dynamically monitored and updated in the recommending process. It is important to
achieving the capability of IoT recommendation in real-time without sacrificing the accuracy.
REFERENCES
Karl Aberer, Manfred Hauswirth, and Ali Salehi. 2006. A middleware for fast and flexible sensor network deployment. In Proceedings of the 32nd International conference on Very Large Data Bases. VLDB Endowment, 1199–1202.
D. Agarwal and B.C. Chen. 2009. Regression-based latent factor models. In Proceedings of the 15th ACM SIGKDD International
Conference on Knowledge Discovery and Data Mining. ACM, 19–28.
Sameer Agarwal, Kristin Branson, and Serge Belongie. 2006. Higher order learning with graphs. In Proceedings of the 23rd international conference on Machine learning. ACM, 17–24.
Jiajun Bu, Shulong Tan, Chun Chen, Can Wang, Hao Wu, Lijun Zhang, and Xiaofei He. 2010. Music recommendation by unified hypergraph: combining social media information and music content. In Proceedings of the international conference on
Multimedia. ACM, 391–400.
Wei Chu and Seung-Taek Park. 2009. Personalized Recommendation on Dynamic Content Using Predictive Bilinear Models. In
Proceedings of the 18th International World Wide Web Conference (WWW 2009). 691–700.
DJ Cook, M Schmitter-Edgecombe, and others. 2009. Assessing the quality of activities in a smart environment. Methods of information in medicine 48, 5 (2009), 480.
Mukund Deshpande and George Karypis. 2004. Item-based Top-n Recommendation Algorithms. ACM Transactions on Information
Systems (TOIS) 22, 1 (2004), 143–177.
Quanquan Gu, Jie Zhou, and Chris HQ Ding. 2010. Collaborative Filtering: Weighted Nonnegative Matrix Factorization Incorporating User and Item Graphs.. In Proceedings of the 2010 SIAM International Conference on Data Mining. 199–210.
Thomas Hofmann. 2003. Collaborative Filtering via Gaussian Probabilistic Latent Semantic Analysis. In Proceedings of the 26th
Annual International ACM SIGIR Conference on Research and Development in Informaion Retrieval.
Mohsen Jamali and Martin Ester. 2009. TrustWalker: a random walk model for combining trust-based and item-based recommendation. In Proceedings of the 15th ACM SIGKDD International Conference on Knowledge Discovery and Data Mining. ACM,
397–406.
Tatsuya Kameda, Yohsuke Ohtsubo, and Masanori Takezawa. 1997. Centrality in Sociocognitive Networks and Social Influence:
An Illustration in a Group Decision-Making Context. Journal of Personality and Social Psychology 73, 2 (1997), 296.
Yehuda Koren. 2008. Factorization meets the neighborhood: a multifaceted collaborative filtering model. In Proceedings of the 14th
ACM SIGKDD International Conference on Knowledge Discovery and Data Mining. ACM, 426–434.
Y. Koren, R. Bell, and C. Volinsky. 2009. Matrix factorization techniques for recommender systems. Computer 42, 8 (2009), 30–37.
Danh Le-Phuoc, Hoan Nguyen Mau Quoc, Josiane Xavier Parreira, and Manfred Hauswirth. 2011. The linked sensor middleware:
connecting the real world and the semantic web. Proceedings of the Semantic Web Challenge (2011).
Greg Linden, Brent Smith, and Jeremy York. 2003. Amazon.com Recommendations: Item-to-Item Collaborative Filtering. IEEE
Internet Computing 7, 1 (2003), 76–80.
Hao Ma, Haixuan Yang, Michael R Lyu, and Irwin King. 2008. Sorec: social recommendation using probabilistic matrix factorization. In Proceedings of the 17th ACM Conference on Information and Knowledge Management. ACM, 931–940.
Takuya Maekawa, Yutaka Yanagisawa, Yasushi Sakurai, Yasue Kishino, Koji Kamei, and Takeshi Okadome. 2012. Context-aware
web search in ubiquitous sensor environments. ACM Transactions on Internet Technology (TOIT) 11, 3 (2012), 12.
Miller McPherson, Lynn Smith-Lovin, and James M Cook. 2001. Birds of a feather: Homophily in social networks. Annual review
of sociology (2001), 415–444.
ACM Transactions on Internet Technology, Vol. V, No. N, Article A, Publication date: January YYYY.
A:20
Richard Mietz, Sven Groppe, Kay R¨omer, and Dennis Pfisterer. 2013. Semantic Models for Scalable Search in the Internet of
Things. Journal of Sensor and Actuator Networks 2, 2 (2013), 172–195.
Suman Nath, Jie Liu, and Feng Zhao. 2007. Sensormap for wide-area sensor webs. Computer 40, 7 (2007), 0090–93.
Benedikt Ostermaier, K Romer, Friedemann Mattern, Michael Fahrmair, and Wolfgang Kellerer. 2010. A real-time search engine
for the web of things. In The International Conference on Internet of Things. IEEE, 1–8.
Siddika Parlak, Ivan Marsic, and Randall S Burd. 2011. Activity recognition for emergency care using RFID. In Proceedings of
the 6th International Conference on Body Area Networks. ICST (Institute for Computer Sciences, Social-Informatics and
Telecommunications Engineering), 40–46.
Charith Perera, Arkady Zaslavsky, Peter Christen, Michael Compton, and Dimitrios Georgakopoulos. 2013. Context-aware sensor
search, selection and ranking model for Internet of Things middleware. In Proceedings of The 14th International Conference
on Mobile Data Management (MDM), Vol. 1. IEEE, 314–322.
Ruslan Salakhutdinov and Andriy Mnih. 2007. Probabilistic Matrix Factorization. In Proceedings of the 21st International Conference on Neural Information Processing Systems (NIPS).
B. Sarwar, G. Karypis, J. Konstan, and J. Reidl. 2001. Item-based collaborative filtering recommendation algorithms. In Proceedings
of the 10th International Conference on World Wide Web. ACM, 285–295.
Quan Z. Sheng, Xue Li, and Sherali Zeadally. 2008. Enabling Next-Generation RFID Applications: Solutions and Challenges. IEEE
Computer 41, 9 (2008), 21–28.
Geetika Singla, Diane J Cook, and Maureen Schmitter-Edgecombe. 2010. Recognizing independent and joint activities among
multiple residents in smart environments. Journal of ambient intelligence and humanized computing 1, 1 (2010), 57–63.
Rashmi R Sinha and Kirsten Swearingen. 2001. Comparing Recommendations Made by Online Systems and Friends.. In DELOS
workshop: personalisation and recommender systems in digital libraries, Vol. 106.
Liang Sun, Shuiwang Ji, and Jieping Ye. 2008. Hypergraph spectral learning for multi-label classification. In Proceedings of the
14th ACM SIGKDD international conference on Knowledge discovery and data mining. ACM, 668–676.
Chiu C Tan, Bo Sheng, Haodong Wang, and Qun Li. 2010. Microsearch: A search engine for embedded devices used in pervasive
computing. ACM Transactions on Embedded Computing Systems (TECS) 9, 4 (2010), 43.
Cuong Truong, Kay Romer, and Kai Chen. 2012. Sensor similarity search in the Web of Things. In International Symposium on
World of Wireless, Mobile and Multimedia Networks (WoWMoM). IEEE, 1–6.
Haodong Wang, Chiu Chiang Tan, and Qun Li. 2008. Snoogle: A search engine for the physical world. In INFOCOM 2008. The
27th Conference on Computer Communications. IEEE.
Yanbo Wu, Quan Z. Sheng, Damith Ranasinghe, and Lina Yao. 2012. PeerTrack: a platform for tracking and tracing objects in
large-scale traceability networks. In Proceedings of the 15th International Conference on Extending Database Technology
(EDBT).
Shuang-Hong Yang, Bo Long, Alex Smola, Narayanan Sadagopan, Zhaohui Zheng, and Hongyuan Zha. 2011a. Like like alike: joint
friendship and interest propagation in social networks. In In Proceedings of the 20th International Conference on World Wide
Web (WWW 2011). ACM, 537–546.
Shuang-Hong Yang, Bo Long, Alexander J Smola, Hongyuan Zha, and Zhaohui Zheng. 2011b. Collaborative competitive filtering:
learning recommender using context of user choice. In Proceedings of the 34th International ACM SIGIR Conference on
Research and Development in Information Retrieval (SIGIR 2011). ACM, 295–304.
Lina Yao. 2012. A propagation model for integrating web of things and social networks. In Service-Oriented Computing-ICSOC
2011 Workshops. Springer, 233–238.
Lina Yao and Quan Z Sheng. 2011. Particle filtering based availability prediction for web services. In Service-Oriented Computing.
Springer, 566–573.
Lina Yao and Quan Z Sheng. 2012. Exploiting Latent Relevance for Relational Learning of Ubiquitous Things. In Proceedings of
the 21st ACM International Conference on Information and Knowledge Management (CIKM). 1547–1551.
Lina Yao, Quan Z. Sheng, Byron Gao, Anne H.H. Ngu, and Xue Li. 2013. A model for discovering correlations of ubiquitous things.
In Proceedings of IEEE International Conference on Data Mining (ICDM 2013).
Lina Yao, Quan Z Sheng, Anne HH Ngu, Helen Ashman, and Xue Li. 2014b. Exploring recommendations in internet of things.
In Proceedings of the 37th international ACM SIGIR conference on Research & development in information retrieval. ACM,
855–858.
Lina Yao, Quan Z Sheng, Anne. H. H Ngu, and Byron Gao. 2014a. Keeping You in the Loop: Enabling Web-based Things Management in the Internet of Things. In Proceedings of the 23rd ACM International Conference on Information and Knowledge
Management. ACM.
Dengyong Zhou, Jiayuan Huang, and Bernhard Sch¨olkopf. 2006. Learning with hypergraphs: Clustering, classification, and embedding. In Advances in Neural Information Processing Systems. 1601–1608.
Tinghui Zhou, Hanhuai Shan, Arindam Banerjee, and Guillermo Sapiro. 2012. Kernelized Probabilistic Matrix Factorization: Exploiting Graphs and Side Information.. In SDM. 403–414.
Xiaojin Zhu. 2006. Semi-supervised learning literature survey. Computer Science, University of Wisconsin-Madison 2 (2006).
ACM Transactions on Internet Technology, Vol. V, No. N, Article A, Publication date: January YYYY.
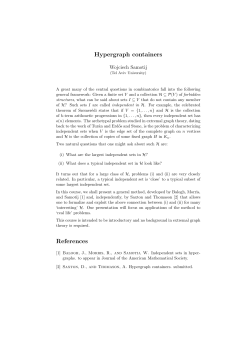


© Copyright 2026