
USING RATIO TABLES TO ENCOURAGE PROPORTIONAL
USING RATIO TABLES TO ENCOURAGE
PROPORTIONAL REASONING
____________
A Thesis
Presented
To the Faculty of
California State University, Chico
____________
In Partial Fulfillment
of the Requirements for the Degree
Master of Science
in
Mathematics Education
____________
by
© Rita M. Nutsch 2009
Fall 2009
USING RATIO TABLES TO ENCOURAGE
PROPORTIONAL REASONING
A Thesis
by
Rita M. Nutsch
Fall 2009
APPROVED BY THE INTERIM DEAN OF THE SCHOOL OF
GRADUATE, INTERNATIONAL, AND INTERDISCIPLINARY STUDIES:
Mark J. Morlock, Ph.D.
APPROVED BY THE GRADUATE ADVISORY COMMITTEE:
William B. Fisher, Ph.D., Chair
Nancy J. Carter, Ph.D.
Deborah Summers, Ph.D.
Kathryn T. Early, M.A.
PUBLICATION RIGHTS
No portion of this thesis may be reprinted or reproduced in any manner
unacceptable to the usual copyright restrictions without the written permission of the
author.
iii
DEDICATION
In loving memory of my mother and father, Leona and Edwin Nutsch, who
instilled in me a true love of learning and encouraged me, by example, to be a life-long
learner. Their work ethic and desire for knowledge were to be admired and emulated.
iv
ACKNOWLEDGMENTS
I would like to thank my graduate advisory committee members: Dr. Deborah
Summers, for the attention to detail and help with editing; Dr. Nancy Carter’s invaluable
assistance with the statistics; and a special thank you goes to Katy Early, not only for her
amazing editing ability, but the encouragement and friendship that blossomed along the
way.
Above all, a sincere thank you goes to my chair, Dr. William Fisher. Without
him, this thesis would not exist. Thank you for the support and especially for your belief
in me, even when I did not believe in myself. You are a true friend and mentor.
v
TABLE OF CONTENTS
PAGE
Publication Rights ......................................................................................................
iii
Dedication ..................................................................................................................
iv
Acknowledgments......................................................................................................
v
List of Tables .............................................................................................................
viii
List of Figures ............................................................................................................
ix
Abstract ......................................................................................................................
x
CHAPTER
I.
Introduction ..............................................................................................
1
Background ..................................................................................
Statement of Problem ...................................................................
Purpose of the Study ....................................................................
Limitations of the Study...............................................................
Definition of Terms......................................................................
1
2
2
3
4
II.
Review of Literature ................................................................................
5
III.
Methods....................................................................................................
10
Design of the Investigation ..........................................................
Sample..........................................................................................
Treatment .....................................................................................
Four Point General Mathematics Scoring Rubric ...............
Five Point Proportional Reasoning Scoring Rubric ............
Data Analysis Procedures ............................................................
10
15
16
17
17
19
vi
CHAPTER
IV.
PAGE
Results and Discussion ............................................................................
20
Presentation of the Findings.........................................................
General Mathematics Scoring Rubric Results ....................
Proportional Reasoning Scoring Rubric Results.................
Discussion of the Findings ...........................................................
Results of Student Interviews ......................................................
Selected Student Interviews ................................................
20
20
20
23
25
26
Summary, Conclusions, and Recommendations ......................................
37
References ..................................................................................................................
40
V.
Appendices
A.
B.
C.
D.
E.
F.
G.
Pretest and Posttest Questions .................................................................
Interview Protocol ....................................................................................
Lesson Plans for Unit on Ratio Tables ....................................................
Five Point Proportional Reasoning Scoring Rubric .................................
Parent Permission Letter ..........................................................................
Average Proportional Reasoning Level Before and After
Introduction of Ratio Tables ..................................................................
Average Proportional Reasoning Level by Problem Number .................
vii
44
48
51
63
65
68
70
LIST OF TABLES
TABLE
PAGE
1.
Paired Difference General Mathematics Rubric .........................................
21
2.
Paired Differences Proportional Reasoning Rubric ....................................
22
viii
LIST OF FIGURES
FIGURE
PAGE
1.
Ratio table examples ...................................................................................
8
2.
Lemonade problem .....................................................................................
11
3.
NAEP problem ............................................................................................
12
4.
CST problem ...............................................................................................
13
5.
Examples of student-generated ratio tables for
“3 is what percent of 40?”.........................................................................
14
6.
MF’s pretest work for problem 2 ................................................................
28
7.
MF’s posttest work for problem 2 ..............................................................
28
8.
DW’s pretest work for problem 2 ...............................................................
28
9.
DW’s posttest work for problem 2..............................................................
29
10.
DW’s pretest work for problem 5 ...............................................................
30
11.
DW’s posttest work for problem 5..............................................................
31
12.
KT’s posttest work for problem 5 ...............................................................
32
13.
NP’s pretest work for problem 5.................................................................
33
14.
NP’S posttest work for problem 5 ..............................................................
34
ix
ABSTRACT
USING RATIO TABLES TO ENCOURAGE
PROPORTIONAL REASONING
by
© Rita M. Nutsch 2009
Master of Science in Mathematics Education
California State University, Chico
Fall 2009
It is essential that proportional reasoning is developed at the middle-school
level to allow students access to higher mathematics. Because of the importance of proportional reasoning, every effort should be made to assure its careful development. A
quick scan of textbooks on the California state adoption list for middle schools shows
little emphasis placed on understanding proportionality beyond showing the use of the
cross-multiplication algorithm. Proportional reasoning is a sophisticated thinking process
that goes far beyond the ability to solve routine proportion problems using crossmultiplication.
The purpose of this study was to explore the relationship between student use
of ratio tables and their conceptual understanding of proportional reasoning. A ratio table
is a chart of two or more rows that is used as a tool to help record and organize equivalent
ratios. This study addressed the following questions: How does the use of ratio tables
affect the conceptual understanding of routine and non-routine proportional reasoning
x
problems? and How does the use of ratio tables influence the quality of verbalization,
written or oral, of a student’s proportional thinking?
All students were given a pretest and seven randomly chosen students were
interviewed to assess conceptual understanding of proportional reasoning. Each problem
required a written explanation of the student’s thinking while solving the problem. After
conducting a unit on proportional reasoning in which ratio tables were introduced as an
organization tool, a posttest and subsequent interviews were administered to the same
pre-algebra students to answer the stated research questions.
xi
CHAPTER I
INTRODUCTION
Background
National and statewide emphasis is being placed on algebraic reasoning.
Research shows a key prerequisite to algebraic reasoning is proportional reasoning (California Framework, 2000; National Council of Teachers of Mathematics [NCTM], 2000).
Ben-Chaim, Fey, Fitzgerald, Bendetto, and Miller (1998) claim “proportional reasoning
is at the heart of middle grade mathematics” (p. 249). Yet, my experience as a middleschool mathematics teacher and a professional development provider shows that students
and teachers alike have great difficulty with proportional reasoning concepts. The standardized California mathematics textbooks (California State Department of Education,
2000) for middle grade students do little to alleviate these misunderstandings; in fact, little emphasis is being placed on the understanding of proportionality beyond the use of the
standard cross-multiplication algorithm. However, research has shown this often taught
method only seems to confuse students and discourage their proportional reasoning. Further, students rarely, if ever, generate this method naturally in a problem solving situation
(Lesh, Post, & Behr, 1988). Lamon (1993) suggests tapping into middle grade students’
rich store of informal knowledge and common sense making tools to investigate
insightful methods of solving proportion problems rather than just applying an algorithmic solution. Patterning is part of an elementary student’s mathematical background
1
2
(California Framework, 2000). Ratio or pattern tables build on this prior conceptual
knowledge and could be a powerful tool to encourage proportional reasoning (Lanius &
Williams, 2003; Sharp & Adams, 2003).
Statement of the Problem
This study considered the value of solving routine and non-routine proportional reasoning problems using ratio or pattern tables as a tool to enhance conceptual
understanding of proportional reasoning.
Purpose of the Study
The purpose of this study was to explore the relationship between student use
of ratio tables and conceptual understanding of proportional reasoning. The ratio table
provides an alternative solution technique for proportion problems that can utilize both
additive and multiplicative strategies. It is a simple tool that organizes numbers and keeps
track of operations and results. After introducing students to ratio tables as an organizational tool, there will be an exploration of the following research questions.
1. How does the use of ratio tables affect students’ conceptual understanding of
routine and non-routine proportional reasoning problems?
• How does the use of ratio tables affect appropriate application of proportional reasoning as opposed to non-proportional reasoning or inappropriate use of
additive reasoning?
3
• Are ratio tables equally effective for students when applied to routine (missing-value proportional problems), and non-routine proportional problems (proportion problems using ratios as the critical factor in comparing quantities)?
• Do ratio tables confine students to solving only integer-based proportional
problems?
2. How does the use of ratio tables influence the quality of verbalization, written or
oral, of a student’s proportional thinking?
• What details are brought forth in written or oral descriptions of proportional
reasoning when there is evidence of use of a ratio table?
Answers to these research questions would prompt further consideration of the
use of ratio tables in the mathematics classroom to encourage proportional reasoning. The
time spent developing proportional reasoning in most mathematics textbooks does not
correspond to the importance of students’ understanding and development of this concept. Teaching of the cross product algorithm does not ensure a students’ ability to reason
proportionally. Neither does evaluating a student on his or her ability to correctly follow
the cross multiplication algorithm guarantee that a student is reasoning proportionally.
Therefore, this study could show that ratio tables are a beneficial method to be used as an
organizational tool to help students develop a stronger sense of proportional reasoning.
Limitations of the Study
The author was the only teacher conducting the study and it was conducted
with only one class. A single group of students from a small rural Northern California
4
middle school were involved in this study. This study had a testing threat due to multiple
administrations of the same test on the same population.
Definition of Terms
Cross multiplication algorithm: a/b=c/d; ⇒ ad=bc
Routine proportion problems: Routine questions may be viewed as those for which
students may be expected to execute a rehearsed procedure consisting of a limited number of steps. Routine proportion problems would have one given ratio and a second ratio
with one term missing.
Non-routine proportion problems: A non-routine problem cannot be solved immediately after selecting the appropriate algorithm. Proportion problems that cannot be classified as routine are considered non-routine.
Proportional reasoning: Proportional reasoning focuses on describing, predicting or
evaluating the multiplicative relationship between two quantities.
Ratio or pattern table: A table used to systematically organize work and where the
operations of multiplication, division, addition, and subtraction are combined to produce
equivalent ratios until some target quantity is achieved.
Standardized method of teaching proportional reasoning: Methods presented in
California standards-based textbooks which are limited to variations of the common cross
multiplication algorithm.
CHAPTER II
REVIEW OF LITERATURE
Proportional reasoning can very well be considered the capstone of elementary mathematics and the cornerstone of algebra and higher mathematics (Lesh et al.,
1988). It is essential that proportional reasoning is developed at the middle-school level
to allow students access to higher mathematics. Proportional reasoning is equally useful
in many everyday contexts including recipe conversions, gas consumption, map reading,
scale drawings, speed, scaling, comparison shopping, and monetary conversions.
Although the importance of proportional thinking and its many uses are easily confirmed,
only about one half of the adult population is competent in proportional reasoning
(Lamon, 1999).
Proportional reasoning is a complex thinking process that is difficult to define.
Piaget and Imholder (1975), identify proportional reasoning as a focus on describing,
predicting or evaluating the relationship between two quantities. Lesh, Post, and Behr,
(1988) continue the definition describing proportional reasoning as including the recognition of situations in which a proportional or multiplicative relationship is, or is not,
relevant. It involves the understanding that both component measures in a ratio may
change but in such a way that the original ratio relationship remains invariant. Proportional thinkers recognize differences between proportional versus non-proportional
5
6
situations (Lamon, 1999). In addition, proportional thinkers develop a wide variety of
strategies for solving proportions, most of which are based on informal strategies rather
than prescribed algorithms. Students need several years worth of opportunities to reason
in multiplicative ways before formalized introduction of algorithms (Van De Walle,
2007).
Although the National Council of Teacher of Mathematics Curriculum Standards confirmed the extreme importance of taking the time to develop proportional reasoning, state adopted middle-school math textbooks do little to enhance this understanding beyond the use of the cross-multiplication algorithm. A quick scan of the California
middle-school standardized textbooks (from the 2001 adoption list) will show only the
use of this cross-multiplication algorithm to solve proportional problems, encouraging
mechanical manipulation of symbols. Lamon (1995) noted that proportional reasoning
has typically been taught in a single chapter of the mathematical textbook, introducing
symbols before sufficient groundwork has been laid for student understanding. The California State Framework (2000), also, gives only examples of solving proportional problems using the cross multiplication algorithm. The majority of textbooks encourage the
use of formulas before building understanding, moving students to a rote manipulation of
symbols, which discourages proportional thinking (Larson, 2001). Formally setting up
proportions using variables and applying the cross-multiplication rule should be delayed
until students have had an opportunity to build on their informal knowledge and develop
an understanding of the essential components of proportional reasoning (Van De Walle,
2007).
7
Middle-grade students have a rich store of informal knowledge and common
sense. Lamon (1993) suggests investigating these insightful methods of solving proportion problems rather than just applying an algorithmic solution. Finding patterns is an
ability students have been encouraged to explore informally and formally throughout
their grade school mathematics classes (California Framework, 2000). A knowledge of
techniques to solve proportion problems, such as building patterns, can be very valuable
in developing generalized thought patterns (Post, 1987). Being able to generalize thought
patterns is a building block to the understanding of higher mathematics.
Ratio tables build on this prior conceptual knowledge; for this reason, they
can be a powerful tool to encourage proportional reasoning (Sharp & Adams, 2003;
Lanius & Williams, 2003). These tables appear to be a natural bridge between elementary
patterning concepts and generalized proportional thinking. Ratio tables are individualized
constructions that allow students to record their unique thought processes. Two examples
of ratio tables (Figure 1) are exhibited below to gain an understanding of the ideas
involved (Lamon, 1999). These tables allow students to construct efficient strategies at
their own pace, building an opportunity to create a more generalized conceptual understanding of proportional reasoning. As students’ reasoning develops, so too does their
ability to solve increasingly complex problems. Corresponding to their increasing ability
to solve difficult problems, students’ strategies for solving problems also get more complex and more mathematically sophisticated.
8
A party planning guide said that three pizzas will serve about seven
people. How many pizzas are needed for 350 people?
Figure 1. Ratio table examples.
Ratio tables can be described by the following five characteristics:
1. The table consists of two (or more) rows and two or more columns, with numbers
in the cells.
2. The rows have a label, indicating the meaning of the numbers and specifying, if
needed, the units used.
3. There is no preference on what to choose as the upper or lower row.
4. The ratio between the numbers in the columns is the same for all columns; this
can be used to calculate an empty place in a column.
5. To get the numbers of a column, the numbers of another column can be multiplied or divided by a certain number; proportionately adding or subtracting are possible as
well (Broekman, Van der Valk, & Wijers, 2000).
In summary, assuming that proportional reasoning is one of the most important building blocks of understanding of higher mathematics as many researchers claim,
9
there seems to be too little emphasis put on conceptual understanding of proportional
reasoning in the middle school. The author believes that ratio tables are a natural step
towards students’ understanding of proportionality. Construction of a ratio table may
compel students to slow down and analyze what they are doing, rather than mechanically
and sometimes randomly plugging numbers into the cross-multiplication algorithm.
While additive reasoning usually precedes multiplicative reasoning in development,
children (and adults) who do not possess proportional reasoning capability often inappropriately substitute additive for multiplicative processes (Baxter & Junker, 2001).
Although ratio tables are only one of many tools needed to help students develop proportional reasoning, they may help encourage students to think more clearly about making
comparisons based on a multiplicative relationship rather than just an additive one, which
is a primary element to reasoning proportionally.
CHAPTER III
METHODS
Design of the Investigation
The study began with a pretest designed by the author, combined with
selected student interviews that assessed further conceptual understanding of proportional
reasoning. The pretest and interviews took place in early October (2008), before any formal teaching of proportional reasoning from the seventh grade standardized California
textbook had taken place. The pretest included routine and non-routine proportional
problems. Each problem was selected for a specific reason. The problems and characteristics for which they were chosen follow:
• Missing Value Problem; integer valued:
1. Find the cost of 6 pieces of candy if 2 pieces cost 8 cents and if the price of
the candy is the same no matter how many are sold.
• Missing Value Problem; non-integer valued:
2. If 3 boxes of cereal are on sale for $6.90, and a daycare provider needs 17
boxes, how much will she pay? Explain your work.
• Percent problem taken from the California Standards Test Released Test Questions from the seventh grade California Department of Education (2001) STAR (Standardized Testing and Reporting) mathematics test:
10
11
3. A sweater originally cost $37.50. Last week Moesha bought it at 20% off.
How much was deducted from the original price?
A. $7.50
B. $17.50
C. $20.00
D. $30.00
• Missing value; integer valued; pictorial, used extensively in proportional reasoning research (as cited in Khoury, 2002).
4. Here is a picture of Mr. Tall and Mr. Short. (See picture on complete test in
Appendix A) Mr. Short is six paper clips in height. If he is measured in large buttons, he is four large buttons in height. Mr. Tall is similar to Mr. Short but is six
large buttons in height. Predict the height of Mr. Tall if you could measure him in
paper clips. Explain your response.
• Non-routine; Comparison of Quantities, used extensively in proportional reasoning research (as cited in Wachsmuth I., Behr M., & Post T., 1983) (Figure 2).
5. Which pitcher will have the strongest lemonade flavor or will they taste the
same? Explain.
Figure 2. Lemonade problem.
• Missing value, non-integer valued, taken from the California Standards Test
Released Test Questions from the seventh grade California Department of Education
(2001) STAR (Standardized Testing and Reporting) mathematics test.
12
6. The distance a spring stretches varies directly with the force applied to it. If
a 7-pound weight stretches a spring a distance of 24.5 inches, how far will the
spring stretch if a 12-pound weight is applied? Show all of your work.
A. 3.4 inches B. 19.5 inches C. 42 inches D. 294 inches
• Non-integer missing value problem with extensive national data available. This
problem was taken from the eighth grade NAEP (National Assessment of Educational
Progress, 2007) test (Figure 3).
7.
Figure 3. NAEP problem.
• Cross multiplication problem taken from the California Standards Test Released
Test Questions from the sixth grade California Department of Education (2001) STAR
(Standardized Testing and Reporting) mathematics test (Figure 4).
A complete copy of the test is available in Appendix A.
After all students took the pretest, the seven randomly chosen students were
interviewed. The interview was used to help establish the levels of proportional
13
8.
Figure 4. CST problem.
understanding, or lack of proportional understanding. The students were given the
opportunity to support their proportional thinking verbally during the interview. The
interview protocol can be found in the Appendix B.
A unit was then taught covering proportional reasoning introducing ratio
tables as an organizational tool. Ratio tables were used to encourage conversations about
equivalence and grew from informal student strategies to a more generalized model, and
as such, an important tool that students used to organize their proportional thinking.
An outline of the proportional reasoning unit that was taught can be found in
Appendix C in PowerPoint format. It is divided into eight days, although the days do not
have to be taught consecutively. Since percent problems are the first concept that is
taught in the seventh grade curriculum that is conducive to ratio tables, this is where ratio
tables are introduced.
14
The unit began with setting up ratios in a table format and finding equivalent
ratios. It then progressed into a percent problem, “3 is what percent of 40?” This is the
first time students experienced ratio tables, so tables were set up together with studentled interactions. After the idea of ratio tables was explained and demonstrated, two
examples of student-generated ratio tables for “3 is what percent of 40?” are shown in
Figure 5.
Figure 5. Examples of student-generated ratio tables
for “3 is what percent of 40?”
After allowing students to work and share a few more sample problems in
class, homework using missing value percent problems was assigned. The second day
was spent with students sharing and defending their methods and/or ratio tables in their
15
groups and as whole class presentations. This helped students see there are different paths
to the same outcome.
The third day, missing value problems were introduced with students generating tables and sharing answers. Each lesson had a set of homework problems for students
to complete, and the following day answers were shared and defended within small
groups and with the whole class.
Comparison problems were introduced next. One problem used from this section was, “I want to get some juice to take on my bike trip. I like both apple and orange.
The orange juice pack holds more (12 oz) and it costs $1.70. The apple juice pack costs
less, $1.10, but holds less (8 oz.). Which is the better deal?” This type of problems
requires students to use two ratio tables and to generate ratios that are easily compared.
The unit concluded with two days during which students worked on and discussed a
variety of proportional situation problems, as well as non-proportional situations.
At the conclusion of this proportional reasoning unit using ratio tables as an
organizational tool, the posttest was given to all pre-algebra students and the same seven
students were interviewed.
Sample
Twenty-one students from a pre-algebra class in a rural Northern California
school district participated in this study. They are heterogeneously grouped sixth- and
seventh-grade students, including gifted, resource, English-Language Learners, and
regular education program students. The classroom is arranged with students sitting in
cooperative learning groups, four students per group. Students in the study filled out all
16
applicable permission forms which were signed by student and parents (Appendix E).
The only teacher involved in the study was the researcher.
All students in the class participated in the pre/posttest part of the study, but
only seven were randomly chosen to participate in a more thorough case study involving
interviews. Of the seven students, four were females, three were in sixth grade, four were
Hispanic and three Caucasian, one was in the gifted program, one in an Individualized
Education Plan for Attention Deficit Disorder, and one was an English Learner (high
level). Randomly selected, these students typified this pre-algebra class.
Treatment
The pretests and posttests were each scored twice. First, each was scored
using a general mathematics rubric that the author has used for many years covering all
areas of mathematics. This rubric is used by the author in the daily scoring of student
mathematics work. The tests were scored a second time using a proportional reasoning
rubric. The proportional reasoning rubric was adapted from research. (Baxter & Junker,
2002; Khoury, 2002; Lamon, 1995, 2007; Steinthorsdottir, 2005; Van De Walle, 2007).
The criteria for determining the student’s level of general mathematical understanding for each problem was based on upon the following rubric levels.
17
Four Point General
Mathematics Scoring Rubric
Level 0: Response indicates no appropriate mathematical reasoning or no response
(nothing right)
Level 1: Response indicates some mathematical reasoning but fails to address the
item’s main mathematical ideas (something is right about the problem) or there is only an
answer with no work shown or described
Level 2: Response indicates some appropriate mathematical reasoning addressing
the item but is not clearly communicated
Level 3: Response is correct and the underlying reasoning process is appropriate but
not thoroughly and clearly communicated
Level 4: Response is correct and the underlying reasoning process is appropriate
and is clearly communicated
The criteria for determining the student’s level of proportional reasoning for
each problem was based on upon the following levels:
Five Point Proportional
Reasoning Scoring Rubric
Level 0: No response
Level 1: Non-proportional reasoning
• Guess
• Randomly uses numbers, operations, or strategies
• Early attempts at quantifying which involve constant additive differences
(i.e., a - b = c - d) rather than multiplicative relationships.
18
Level 2: Informal reasoning about proportional situations
• Uses pictures, models, or manipulatives to make sense of situations
• Makes qualitative comparisons
Level 3: Quantitative reasoning
• Still relies on counting up or down.
• Can only double, triple, halve, etc.
Level 4: Quantitative Reasoning/Multiplicative Reasoning
• Able to solve only problems that have an integer relationship between the
ratios.
• The numbers in the target ratio have to be bigger than the numbers in the
given ratio.
Level 5: Formal proportional reasoning
• Students are able to solve problems that involve both an integer and a noninteger relationship.
• Students recognize both between and within relationships in ratios
• Students are able to solve all three types of proportion problems:
-Missing Variable
-Numerical Comparison
-Qualitative Prediction/Comparison Problems
• Minor arithmetic errors may exist, but do not detract from the correctness of
the response or the reasoning (adapted from [Lamon, 1995, 2007; Steinthorsdottir,
2005; Baxter and Junker, 2002; Van De Walle, 2007; Khoury, H. 2002]).
19
Only seven students were randomly chosen to participate in a more thorough
case study involving interviews. Interviews were conducted after the pretest and after the
posttest. The interviews were used to help establish the levels of proportional understanding, or lack of proportional understanding and to gather information on how student
were able to verbalize their proportional thinking. The interview protocol can be found in
Appendix B.
Data Analysis Procedures
A paired difference t test was used to compare posttest levels of each problem
with pretest levels of the same problem for each student to determine whether significant
change had occurred. The test is one-tailed as the author is only looking for improvement
in levels of mathematical understanding and proportional reasoning. The data were tested
to ensure it had a normal distribution.
Reliability was estimated using internal consistency by grouping questions in
the test that measure the same type of proportional reasoning concept. This study has a
testing threat due to multiple administrations of the same test to the same population.
This has been controlled by creating a sufficient gap of time between the two administrations (the pretest was administered in October [(2008], the posttest at the end of April
[2009]).
CHAPTER IV
RESULTS AND DISCUSSION
Presentation of the Findings
General Mathematics
Scoring Rubric Results
The overall results indicated that there was a significant difference between
the posttest and pretest scores (posttest – pretest) in general mathematical understanding,
t(20) = 7.4171, p = .0001 and the confidence interval provides a 95% chance that the post
scores increased between 6.7 and 11.9 points (out of 28) from the pretest scores.
Table 1 shows the results from the general mathematics scoring rubric for
each individual problem. Problem 8 is purposely omitted from this chart and was
examined differently. The table shows there was a significant difference between problems 1 through 6, with a 95% confidence level. For problem 7, there is a significant difference less than 95% (94.7% confidence level).
Proportional Reasoning
Scoring Rubric Results
The overall results indicated that there was a significant difference between
the posttest and pretest scores (posttest – pretest) in proportional reasoning (t(20) =
8.4821, p ≤ 0.0001), and the confidence interval gives a 95% chance that the post scores
increased between 8.7 and 14.4 points (out of 35) from the pretest scores. Table 2
20
21
Table 1
Paired Difference General Mathematics Rubric
95% confidence interval of
difference (posttest score –
pretest score)
One tail
significance
level
Test
statistic
t
Df
Significance
(p-value)
1.3801
3.9704
20
0.0004
0.29481
1.70518
2.9580
20
0.0039
2.33333
1.78336
2.87830
8.9313
20
0.0001
4
0.52380
0.10121
0.94640
2.5826
20
0.0088
5
1.42857
0.79176
2.06537
4.6795
20
<0.0001
6
1.33333
0.54054
2.12612
3.5082
20
0.0011
7
0.52381
-0.00741
1.05502
2.0569
20
0.0265
Problem
#
Std. error
mean
Lower
1
0.22787
0.42492
2
1
3
Upper
shows the results from the proportional reasoning scoring rubric for each individual
problem. Problem 8 is purposely omitted from this chart and was examined differently.
The table shows there was a significant difference between problems 1 through 6, with a
95% confidence level. For problem seven, there is a significant difference with less than
95% confidence (78.62%).
Problem 8 was taken from a released question from the California State Testing program for sixth grade mathematics. It is a multiple-choice question, indicating
whether a student is capable of setting up a cross multiplication to solve the proportional
problem. Data were released from the state in relation to statewide student accuracy.
These data were used to compare the author’s students with the statewide average. On the
pretest, the author’s students had a 23% accuracy rate. On the posttest, they had a 52%
22
Table 2
Paired Differences Proportional Reasoning Rubric
95% confidence interval of
difference (posttest score –
pretest score)
One tail
significance
level
Test
statistic
Problem
#
Std. error
mean
Lower
Upper
t
Df
Significance
(p-value)
1
0.80952
0.20531
1.41137
2.7948
20
0.0056
2
1.71428
0.70520
2.72337
3.5437
20
0.0010
3
3.47619
2.87198
4.08040
12.0011
20
<0.0001
4
0.71429
0.11830
1.31028
2.5000
20
0.0106
5
2.19048
1.46189
2.91906
6.2714
20
<0.0001
6
2.23810
1.20104
3.27515
4.5018
20
0.0001
7
0.38095
-0.237781
0.99969
1.2843
20
0.1069
accuracy rate, compared to the state accuracy rate of 42%. Since this is a sixth grade state
standard, the students’ pretest results were compared to the statewide results. The results
indicated there was a 95% confidence level that the author’s students were significantly
lower than the statewide results (t(20) = -1.6889, p = 0.0496) on the pretest. The posttest
scores showed that although the author’s students were not significantly higher than the
state average, there was less than a 95% chance they are different (t(20) = -0.963,
p = 0.167).
Problem 3 was also taken from the released questions from the California
State Testing program, but was from the seventh grade mathematics test. It is a multiplechoice test on percentages. On the pretest, the author’s students had a 14% accuracy rate;
on the posttest, a 100% accuracy rate, compared to the state accuracy rate of 51%. The
23
results indicate that there was a significant difference between the author’s students’
posttest scores and the statewide percentages (t(20)=4.4918, p = 0.0000000). So there is
at least a 99.999% confidence level that the students in the study improved over the
statewide average.
Problem 7 was selected from the National Assessment of Educational
Progress (NAEP) test. It is an eighth-grade level problem. On the pretest, the author’s
students had a 19% accuracy rate, and on the posttest, a 47.6% accuracy rate, compared
to the national accuracy rate of 49%. The results indicate there was no significant difference between these students’ results and the national results (t(20) = -0.1266,
p = 0.89926).
Discussion of the Findings
One goal of the study was to test whether the use of ratio tables affect the conceptual understanding of routine and non-routine proportional reasoning problems. This
hypothesis was tested by comparing pretest and posttest scores using a proportional reasoning rubric, as well as interviewing the seven randomly selected students. The statistical analysis of research question 1, “How does the use of ratio tables affect the conceptual understanding of routine and non-routine proportional reasoning problems?” showed
student use of ratio tables as an organizational tool did increase their ability to reason
proportionally.
An in-depth item analysis of strategies students used to solve the problems
showed there was an increased use of higher level proportional reasoning. More level 3
(Quantitative Reasoning), level 4 (Quantitative Reasoning/Multiplicative Reasoning), and
24
level 5 (Formal Proportional Reasoning), and less level 1 (non-proportional) and level 2
(informal proportional) strategies were being used when students chose to use ratio tables
as a tool in their solutions. Approximately 30% of the answers were levels 3, 4, and 5
before ratio tables, over 70% were levels 3, 4, and 5 after the introduction of ratio tables
(Appendix D).
This study showed the use of a ratio table lessens the use of inappropriate
additive reasoning and increases multiplicative or appropriate proportional reasoning.
Results from problem 5, the lemonade problem, showed a noticeable decrease of incorrect additive reasoning and an increase in proportional reasoning. On the pretest, all but
five students used an inappropriate additive approach, thinking the lemonade would taste
the same because the difference between the water and lemonade in each pitcher was one
unit. Out of the five students who got a correct response, only one was able to verbalize
why the answer was correct. After the introduction of ratio tables, the posttest showed a
significant increase in how the students compared the flavors of the lemonade pitchers.
Fifteen students correctly answered the question, with 11 of those able to completely and
accurately verbalize their thinking process.
There were six missing values or routine-type proportional reasoning problems on the pre/posttest and two non-routine types of problems. This study shows that
ratio tables are equally effective in helping students reason proportionally, whether solving a routine or non-routine proportional problem. Students showed an increase in the
level of their proportional thinking on all problems, whether routine or non-routine
(Appendix G).
25
Some literature alluded to the fact that ratio tables confine students to integer
value proportional reasoning only, or problems that allowed students to use a building-up
method (Steinthorsdottir, 2005). This study has shown that was not the case with this prealgebra class. Students are capable of using a ratio table to solve both integer and noninteger proportional reasoning problems, as evidenced by their strategies and correct
answers on the first three problems. The first problem was an integer value problem,
while the second and third were non-integer value problems. All students except one
were able to solve both an integer and a non-integer value proportion problem using a
ratio table (Appendix D).
Results of Student Interviews
While the first research question was addressed more fully in the statistical
analysis, the interviews and written work helped to explore the answer to the second
research question, “How does the use of ratio tables influence the quality of verbalization, written or oral, of a student’s proportional thinking? What details are brought forth
in written or oral descriptions of proportional reasoning when there is evidence of use of
a ratio table?”
Problem 1 was a missing value problem with integer values. All but two of the
case study students correctly answered the question on both the pretest and the posttest.
Their pretest explanations were also fairly clear and most were easy to understand. Yet,
the clarity of their explanations did improve and most used a more precise one-step
method when they used a ratio table to organize their thoughts.
26
Selected Student Interviews
Problem 1 asked: Find the cost of 6 pieces of candy if 2 pieces cost 8 cents
and if the price of the candy is the same no matter how many are sold.
DJ was a sixth grade Hispanic female student. DJ’s pretest interview:
DJ:
It said two pieces cost eight cents, I thought, and both of them
were eight cents.
Teacher: So did you find the total cost?
DJ:
I put 16 cents. I don’t remember why.
DJ’s posttest interview:
DJ:
Two pieces cost eight cents, and another two pieces cost eight
cents, so that means four pieces cost sixteen cents and another two
pieces for eight cents added to that makes 6 pieces for twenty-four
cents.
MF was a seventh grade EL (English learner) Hispanic male student. MF’s
pretest interview:
MF:
At first, I figured out that two candies equal eight cents. Since we
want six pieces, I timed six times eight and that equal forty-eight
and that would be what I would get for how much it would cost,
and then I divided it by two because its two pieces of candy. Then
I got twenty-four.
MF’s posttest interview:
MF:
If two pieces cost eight cents, then I multiplied the number of
pieces by three and the cost by three and know that six pieces
would cost twenty-four cents.
Problem 2 was a missing value problem with non-integer values: If 3 boxes of
cereal are on sale for $6.90, and a daycare provider needs 17 boxes, how much will she
pay? Explain your work.
27
Only two of the interviewed students got the answer correct on the pretest. On
the posttest, five of the seven students arrived at the correct answer. All seven had a correct process, but two made multiplication errors. One of the students that arrived at a correct response both times was a gifted sixth grade male student named WB. While he was
able to get the answer correct both times, the organization of his thoughts and how he
described his procedure changed dramatically from the pretest to the posttest.
WB had work all over his paper and this is how he described his pretest work:
WB:
I got this answer by first dividing 17 by 3. Then I divided 6.90 by 3
to find how much each cereal box was because of the remainder.
Then I multiplied 6.90 by 5 to get part of the answer. I added 4.60
to the product of 6.90 and to get the answer of $39.10.
WB used a ratio table to set up his work and this is how he described his post-
test work:
WB:
3 boxes cost $6.90. I multiplied both by 5 and know that 15 boxes
cost $34.50. Therefore I know that 18 boxes would cost $41.40.
(WB showed adding two ratios). I divided the original price of 3
boxes for $6.90 by three and found the cost of 1 box was $2.30. I
subtracted the cost of one box from $41.40 and found 17 boxes
cost $39.10.
Two other interviewed students, both seventh graders, got an incorrect answer
and used an incorrect process on the pretest, but both were able to use a ratio table to correctly solve the same problem on the posttest. Their work is shown.
MF was a seventh grade EL (English learner) Hispanic male student. Figure 6
illustrates his pretest work.
28
Figure 6. MF’s pretest work for problem 2.
Figure 7 illustrates MF’s posttest work.
Figure 7. MF’s posttest work for problem 2.
DW was a seventh grade male Hispanic regular education student.
Figure 8 illustrates his pretest work.
Figure 8. DW’s pretest work for problem 2.
29
Figure 9 illustrates DW’s posttest work.
Figure 9. DW’s posttest work for problem 2.
Not only did DW get the answer correct on the posttest, he did it with a unitizing method, showing proportional reasoning at the highest level.
Problem 5, the lemonade comparison problem, showed the students’
flexibility in the use of ratio tables. Students set the table up using many different
approaches. Some used part-part and some part-whole and yet were still able to
appropriately use proportional reasoning to compare the strength of the lemonade. On the
pretest, none of the seven interviewed students was able to correctly answer the problem.
On the posttest, six of the seven correctly set up the proportion, but two of those six
incorrectly described their conclusions. (They struggled with which would be the stronger
solution.) In interviews, both of these students reached correct conclusions as they talked
about how they chose their answer. EM, a seventh grade Caucasian female student, was
30
the only one still unable to correctly solve this problem. She was also the only student
who chose not to use any ratio tables on her posttest.
DW’s pretest and posttest responses to this problem were compared. On the
pretest, he used an incorrect additive approach. On the posttest, he used a ratio table to set
up a part to part comparison, comparing water to lemonade. He incorrectly identified the
stronger mixture, but, in his interview, he corrected himself when he was trying to
explain how he chose the stronger solution. Figure 10 illustrates DW’s pretest work.
Figure 10. DW’s pretest work for problem 5.
DW’s pretest interview:
DW:
Because right here, in the first one, it has three lemonade mix and
the other one has four, and then this one has two lemonade and
three water. So you add four and two it equals six, and three and
three equals six. So six and six are equal.
31
Figure 11 illustrates DW’s posttest work.
Figure 11. DW’s posttest work for problem 5.
DW’s posttest interview:
DW:
So I put two different ratio tables for each one. Then I put water
and the lemonade mix on top and then I put how much there was
for the first jar. There was three water and two lemonade. Then
here there was four water and three lemonade. Then I tried to get
the same number right here to see which one would be greater in
the top. So then I multiplied by two and by three and that equals
six and six. Then I multiplied the top by the same number to and I
got eight and nine. And if there was six lemonade mixes, there
would be nine water and if there was six water mixes on this, there
would be eight waters, so this one would have more.
Teacher: So more water makes it stronger?
DW:
Oh yeah. Yeah. I think it was this one because it has less water and it
has the same amount of mix. [DW changed his answer to jar 2]
32
KT was a sixth grade Hispanic female student. She also used an incorrect
additive approach on the pretest, but then was able to compare using a part to part
(lemonade to water) comparison on the posttest. Her pretest interview:
KT:
They were the same because they each had one more cup of water
than they did of lemonade mix.
Figure 12 shows KT ‘s posttest work.
Figure 12. KT’s posttest work for problem 5.
KT’s posttest interview:
KT:
The lemonade, I put the lemonade mix on top and the water on the
bottom and it had two lemonade mix and then three waters, so I put
two over three. Then for No. 2, it had three lemonade mix and four
water, so I tried to get the same bottom number and I just times by
three, and then up here I times it by four, and I got 12. Then the
lemonade mix on No. 2 was nine, and on No. 1, it was eight. So
this one had more flavor. [She pointed to the second pitcher]
33
NP is a seventh grade Caucasian female enrolled in the regular education
program, but on an IEP (Individualized Education Plan) for ADD (Attention Deficit
Disorder). She also used an incorrect additive approach to the comparison problem on the
pretest, but, on the posttest, she used a part-to-whole comparison and was able to identify
the stronger mixture correctly. Figure 13 shows NP’s pretest work.
Figure 13. NP’S pretest work for problem 5.
NP’s pretest interview:
NP:
We had to find which cup of lemonade would be stronger, and I
said I thought they would be the same because in each glass, there
would be one more cup of water than the lemonade. So I thought
they would be the same.
34
Figure 14 shows NP’s posttest work.
Figure 14. NP’S posttest work for problem 5.
In the analysis of question 2, “How does the use of ratio tables influence the
quality of verbalization, written or oral, of a student’s proportional thinking?,” the study
found students using ratio tables have greater depth to their written or oral explanations.
Ratio tables appear to allow students to organize their thoughts in such a way that it is
easier for them to explain their proportional reasoning. Generally, the author recognized
that student interviews were necessary in attempting to understand student thinking on
the pretest work. When students organized their work into a ratio table on the posttest, for
the most part, their reasoning was clear and they were confident that the ratio table spoke
for itself; students felt there was not much to explain that was not self-evident in the
table. Students who were properly setting up a ratio table, taking time to read and analyze
35
where to put the numbers, and labeling, were more likely to correctly use proportional
reasoning.
Most of the students in the study showed that ratio tables significantly helped
them to reason proportionally. Pre- and posttest proportional reasoning levels were
assigned to each student by the author. Using the Proportional Reasoning Rubric
described earlier, students were assigned a level using a checklist of their proportional
reasoning skills. A level 5 indicated they had shown the ability to solve integer, noninteger, routine, and comparison proportional problems. At the end of the study, nine of
the 21 students were assigned level 5. Four students were between levels 4 and 5: while
they could solve both integer and non-integer proportion problems, they struggled with
the comparison problems. Six students were between levels 3 and 4, as their work
showed they still had some difficulties not only with the comparison problem, but also in
working with some of the non-integer problems. Only one student was lower than level 3,
and even she showed growth, moving from a level 1 proportional thinker on the pretest
(see chart in Appendix D).
The students in this study were able to outscore their peers when compared to
state and national averages. Although these students were not directly taught how to set
up the cross multiplication method of solving a proportion problem, when presented with
the state test problem (problem 8), which directly asked them to set up a crossmultiplication problem, they were still able to vie with the statewide average. On the
percent problem taken from the state test, these students significantly outscored their
36
statewide counterparts, having a 100% accuracy rate, compared to the statewide 51%
accuracy rate.
The average level of proportional reasoning on the five-point rubric before
ratio tables were introduced was about level 2: students were using informal reasoning
about proportional situations. After introduction of ratio tables, this level rose to almost
level 4, indicating that students had advanced to using quantitative multiplicative
reasoning. Every student’s proportional reasoning level increased (Appendix F).
CHAPTER V
SUMMARY, CONCLUSIONS,
AND RECOMMENDATIONS
Proportional reasoning is considered to be the capstone of elementary mathematics and the cornerstone of algebra and higher mathematics (Lesh et al., 1988). Most
mathematics textbooks place little emphasis on this important concept. The purpose of
this thesis was to examine whether introducing ratio tables would encourage students to
reason proportionally. The research was conducted in a rural middle school in Northern
California, in a pre-algebra classroom consisting of sixth and seventh grade students. A
pretest was given in the fall; two weeks of instruction and student-led discussions on ratio
tables followed in the spring, with a posttest given at the end of the unit. To gather more
in-depth understanding of students’ proportional thinking, student interviews were conducted with seven randomly chosen students from the pre-algebra class.
The results obtained offer convincing evidence that ratio tables do affect the
development of proportional thinking in pre-algebra students in a positive manner. Ratio
tables did help the students in this study reason proportionally. Ratio tables are a powerful tool for developing and encouraging proportional reasoning. While the majority of
textbooks only introduce proportions with cross multiplication, it should be pointed out
that premature use of rules encourages students to apply rules without thinking and, thus,
the ability to reason proportionally often does not develop (Van De Walle, 2007).
37
38
Therefore, ratio tables can and should be used as an organizational tool to foster students’
development of proportional reasoning.
This conclusion is based on a limited sample population. The data were collected from only 21 students. When the study was planned, the author had two prealgebra classes with over 60 students. The class schedule was changed over the summer
and only one pre-algebra class was available for the study. Thirty-two students were
given the initial pretest. At semester (in January), class schedules were changed so that
when the posttest was given, although there were still 32 students, only 21 were the same
students who had been given the pretest. A larger sample size might provide stronger
evidence or change the conclusion.
A recommendation would be to expand the study beyond the scope of this one
classroom. Another recommendation would be to give a follow-up test to the same
21students to find out how they scored after time had passed from the initial lesson on
ratio tables. From experience as a teacher using ratio tables for several years, students
seem to be able to recall how to set up a ratio table and solve a problem proportionally
much longer than they are able to remember how to set up a cross multiplication problem,
as was evidenced by the fact that not one student tried to use a cross multiplication
method on the pretest, although they were taught this method the previous year.
Proportional reasoning is a powerful mathematics topic that warrants more
emphasis in the middle school years. Ratio tables are a method that can easily be implemented into any classroom to encourage students to develop their proportional reasoning
39
ability. Any future studies which look at methods that are directed at helping students
reason proportionally are highly encouraged.
REFERENCES
REFERENCES
Baxter, G., & Junker, B. (2001). Designing cognitive-developmental assessments:A case
study in proportional reasoning. Paper presented at the annual meeting of the
National Council for Measurement in Education, Seattle, Washington.
Ben-Chaim, D., Fey, J., Fitzgerald, W., Benedetto, C., & Miller, J. (1998). Proportional
reasoning among 7th grade students with different curricular experiences.
Educational Studies in Mathematics, 36(3), 247-273.
Broekman, H., Van der Valk, T., & Wijers, M. (2000). Teacher knowledge needed to
teach ratio and proportion in secondary school mathematics. Paper presented
to the 25th ATEE conference, Barcelona, Spain.
California State Department of Education. (2000). Mathematics framework for the California public schools. Kindergarten through grade twelve. Sacramento:
Author.
California State Department of Education. (2001). California mathematics 2001 primary
adoption list. Retrieved
http://www.cde.ca.gov/ci/ma/im/math2001adopted.asp
California State Department of Education. (2001). Standardized testing and reporting.
Retrieved from http://www.starsamplequestions.org/
Karplus, E., & Karplus, R. (1970). Intellectual development beyond elementary school.
School Science and Mathematics, 70, 398-406.
Khoury, H.A., (2002). Classroom challenge. In B. Litwiller & G. Brights (Eds.), Making
sense of fractions, ratios, and proportion: 2002 Yearbook of the National
Council of Teachers of Mathematics (pp. 100-102). Reston, VA: National
Council of Teachers of Mathematics.
Lamon, S. (1993). Ratio and proportion: Connecting content and children’s thinking.
Journal for Research in Mathematics Education, 24(1), 41-61.
Lamon, S. (1995). The development of unitizing: Its role in children’s partitioning strategies. Journal for Research in Mathematics Education, 27(2), 170-93.
41
42
Lamon, S. (1999). Teaching fractions and ratios for understanding: Essential content
knowledge and instructional strategies for teachers. Mahwah, NJ: Lawrence
Erlbaum.
Lamon, S.J. (2007). Rational numbers and proportional reasoning. In F.K. Lester, Jr.
(Ed.), Second handbook of research on mathematics teaching and learning
(pp. 629-667). Charlotte, NC: Information Age Publishing.
Lanius, C., & Williams, S. (2003). Proportionality: A unifying theme for the middle
grades. Mathematics Teaching in the Middle School, 8(8), 392-396.
Larson, R., Boswell, L., Kanold, T., & Stiff, L. (2001). California middle-school mathematics: Concepts and skills course 2. Evanston: McDougal Littell.
Lesh, R., Post, T.R., & Behr, M.J. (1988). Proportional reasoning. In J. Heibert & M.
Behr (Eds.), Number concepts and operations in the middle grades. (pp. 93118). Reston, VA: National Council of Teachers of Mathematics.
National Center for Education Statistics. (2007). National assessment of educational
progress. Retrieved from
http://nces.ed.gov/nationsreportcard/itmrls/itemdisplay.asp
National Council of Teachers of Mathematics. (1989). Curriculum and evaluation standards for school mathematics. Reston, VA: Author.
National Council of Teachers of Mathematics. (2000). Principles and standards for
school mathematics. Reston, VA: Author.
Piaget, J., & Inhelder, B. (1975). The origin of the idea of chance in children. New York:
W.W. Norton.
Post, T. R. (Ed). (1987). Teaching mathematics in grades K-8. Research based methods.
Boston: Allyn and Bacon.
Post, T.R., Behr, M.J., & Lesh, R. (1998). Proportionality and the development of prealgebra understandings. In A. Shulte (Ed.), The ideas of algebra K-12 (pp. 7890). Reston, VA: National Council of Teachers of Mathematics.
Sharp, J. M., & Adams, B. (2003). Using a pattern table to solve contextualized proportion problems. Mathematics Teaching in the Middle School, 8(8), 432-239.
43
Steinthorsdottir, O.B. (2005). Girls journey toward proportional reasoning. In H.L. Chick
& J.L. Vincent (Eds.), Proceedings of the 29th conference of the international
group for the psychology of mathematics education, Vol. 4 (pp. 225-232).
Melbourne: Department of Science and Mathematics Education, University of
Melbourne.
Van De Walle, J.A. (2007). Elementary and middle school mathematics: Teaching developmentally. Boston: Pearson Education.
Wachsmuth I., Behr M., & Post T. (1983). Children’s perception of fractions and ratios in
grade 5. In R. Hershkowitz (Ed.), Proceedings of the international group for
the psychology of mathematics education VII (pp. 164-169). Rehovot, Israel:
Department of Science Teaching, The Weizmann Institute of Science.
APPENDIX A
PRETEST AND POSTTEST QUESTIONS
Missing Value Problems:
1. Find the cost of 6 pieces of candy if 2 pieces cost 8 cents and if the price of the
candy is the same no matter how many are sold. Show all of your work and
explain.
2. If 3 boxes of cereal are on sale for $6.88, and a daycare provider needs 17 boxes,
how much will she pay? Explain your work.
3.
4. Here is a picture of Mr. Tall and Mr. Short. Mr. Short is six paper clips in height.
If he is measured in large buttons he is four large buttons in height. Mr. Tall is
similar to Mr. Short but is six large buttons in height. Predict the height of Mr.
Tall if you could measure him in paper clips. Explain your response.
45
46
5. Which pitcher will have the strongest lemonade flavor or will they taste the same?
Explain
6. The distance a spring stretches varies directly with the force applied to it. If a 7pound weight stretches a spring a distance of 24.5 inches, how far will the spring
stretch if a 12-pound weight is applied? Show all of your work.
A 3.4 inches
B 19.5 inches
C 42 inches
D 294 inches
47
7.
8.
APPENDIX B
INTERVIEW PROTOCOL
This interview protocol will be used for both the pre and post interview. The
interview will be an additional tool, used after the test to help establish the levels 1
through 4 of proportional understanding, or lack of understanding. Students that have
missing written work, or written explanations that are hard to follow will be given the
opportunity to support their proportional thinking verbally by being interviewed.
Depending on what the student written work already shows, any or all of the
following questions may be used to get students to verbalize their thoughts about their
problem-solving process. To gain insights into students’ conceptualization, probing
questions will be ask without correcting computational or problem solving errors.
•
Tell me about the process you used when solving this problem.
•
Why did you start with _____ (multiplying, dividing, subtracting, or
whatever operation was first used)?
•
What were you thinking when you did this step?
•
What does that stand for?
•
Why did you pick this strategy to solve this problem?
•
Why did you change your mind?
•
How did the ratio table you used help you to solve the problem?
•
What patterns were you using?
•
How confident are you that your answer is correct?
49
50
These questions will be used to allow more accurate ratings of the student level of
proportional reasoning.
APPENDIX C
LESSON PLANS FOR UNIT ON RATIO TABLES
Slide 1
Using Ratio Tables to Encourage
Proportional Reasoning
A Unit to Help Teach Ratio Tables
Definition of ratio tables.
Slide 2
Ratio Tables Defined:
Ratio tables can be described by the following five characteristics:
1) The table consists of two (or more) rows and two or more columns,
with numbers in the cells.
2) The rows have a label, indicating the meaning of the numbers and
specifying, if needed, the units used.
3) There is no preference on what to choose as the upper or lower
row.
4) The ratio between the numbers in the columns is the same for all
columns; this can be used to calculate an empty place in a column.
5) To get the numbers of a column, the numbers of another column
can be multiplied or divided by a certain number; proportionately
adding or subtracting are possible as well.
(Broeckman, 2000)
Slide 3
Introduction of Ratio Tables
I have separated the lessons by days, but
the days do not need to be consecutive.
Although the homework discussion needs
to follow the day of the lesson.
DAY ONE:
• Introduction of Ratio Tables
• Using Ratio Tables to Find Missing
Values in Percent Problems.
Allow a few minutes for students to think
about how they would construct their own
ratio table. Then, as a class construct a
ratio table, allowing the student’s input to
guide the construction.
Slide 4
3 is what percent of 40?
7½%
÷2
x2
part
3
6
total
40
80
1
1
2
20
+
+
7
1
2
100
x2
÷2
If it doesn’t come up, show how
equivalent ratios could be added within the
table to generate other equivalent ratios.
For example, if a ratio table is being
constructed that needs 2 ½ times an
52
53
amount, sometimes for students it is easier
to multiply by 2 and then by ½ and then to
add the two ratios. Most students will be
able to do both of these operations
mentally, whereas multiplying by 2 ½ is a
more difficult task.
Slide 5
Let’s try another percent problem.
12 is what percent of 27?
part
12
total
27
100
Slide 6
One possible solution.
÷9
÷3
X 11
part
12
4
44
total
27
9
99
4
9
1
44
+
99
+
4
9
1
44
4
9
100
X 11
÷3
4
44 9 %
÷9
Slide 7
One more problem:
3 is what percent of 22?
÷22
÷2
x4
1
part
3
total
22
12
88
3
1
+ 2 + 22
+ 11 + 1
x4
÷2
÷22
7
11
100
13
Usually, I first introduce ratio tables with
percent problems. Seventh grade students
have been exposed to different strategies
to solve percent problems, although ratio
tables may be new to them.
It is very important to allow students the
opportunity to find their OWN path to the
answer. Part of the power of ratio tables
lies in the fact that students are generating
their own tables, using their own
strategies. Some strategies will definitely
be more advantageous than others. That is
why student sharing and discussion must
take place. Students will see other’s
methods and assimilate these strategies
with their own, hopefully arriving at an
efficient method.
54
Slide 8
Student Questions?
Click here
to jump to the properties
slides.
Slide 9
Homework Problems:
These problems need to be completed by
students for homework. Tell them to be
prepared to share and defend their
answers.
1) What percent out of 30 is 17?
2) 30 is what percent of 27?
3) 15% of 35?
Slide 10
DAY TWO:
• Students share and defend their
answers using the ratio tables
they generated for homework.
Slide 11
DAY THREE:
• Missing Value Proportion Problems
• Using Ratio tables to find missing
values in proportion problems.
Allow students to share within their groups
and then have students prepare
transparencies of their methods to share
with the whole class. Advantages to
certain strategies should be shared.
This would not have to be taught directly
after day 2, it is the third lesson in this
sequence of lessons.
55
Slide 12
Missing Value Proportion Problem:
If we measure Mr. Peterson’s height in basketballs, he
is 6 balls tall. He is also as tall as a pile of 15 boxes.
His son, Matt is as tall as 4 basketballs. How many
boxes will be as tall as Matt?
÷3
x2
basketballs
6
2
4
4
boxes
15
5
10
10
÷3
x2
Matt
Mr. Peterson
Matt’s height = 10 Boxes
Lamon (2005)
Slide 13
Missing Value Proportion Problem:
If it took Jane 3/4 hour to paint a wall that was 12 ft by
12 ft, how long will it take to paint another wall that is
15 ft by 16 ft?
x 1/3
x4
Square feet
3
1
+
¼
1¼
144
576
192
+
48
240
x4
16 ft
12 ft
12 ft
144240
square
square
feet
feet
÷3
¾
hours
Once again, allow the students to generate
the table and share their methods. Students
may set the table up in different fashions.
This example model is only ONE way to
set up the table. For example students
might generate a table comparing 6
basketballs to 4 basketballs, and 15 boxes
to ? boxes.
÷3
x 1/3
15 ft
1 ¼ hours
Lo (2004)
This problem will take a bit more effort for
students to set up. Even though this is a
missing value problem, more than three
values are given, forcing students to decide
which values will make up the ratios. This
problem requires students to think before
putting the numbers in the table.
First they will have to figure the area to
find out how long it takes to paint a square
foot. Plus they will have to work with a
fraction within a ratio,
or students might change hours to minutes
so they don’t have to work with a
fractional value.
There are numerous ways to solve this
problem. The discussion and student
interaction will be valuable.
Remember, the solution shown is only
ONE possible way to use a ratio table to
generate the answer.
Slide 14
Homework Problems:
1) In 3 weeks, a horse eats 10 pounds of
hay. How much will he eat in 5 weeks?
2) You watch TV for 12 ½ hours per week.
How much TV do you watch in a year?
3) If a box of detergent contains 80 cups of
powder and your washing machine
recommends 1 ¼ cups per load, how
many loads can you do with one box?
Explain your answers. Be prepared to defend and share
your answers.
Lamon (2005)
These problems need to be completed by
students for homework. Tell them to be
prepared to share and defend their
answers.
56
Slide 15
DAY FOUR:
• Students share and defend their
answers using the ratio tables
they generated for homework.
Slide 16
Allow students to share within their groups
and then have students prepare
transparencies of their methods to share
with the whole class. Advantages to
certain strategies should be shared.
I have separated the lessons by days, but
the days do not need to be consecutive.
Although the homework discussion needs
to follow the day of the lesson.
DAY FIVE:
• Comparing
• Using Ratio tables to compare
quantities.
Slide 17
Comparing Problem:
Which of the following cartons has more brown eggs?
Lamon (2005)
Students will need to set up two different
ratio tables and come up with values that
they are able to compare. These problems
will bring about a good opportunity to
discuss multiplication reasoning/additive
reasoning.
Students using additive reasoning will say
the carton of 18 contains more brown
eggs. Urge students to notice the fact that,
although one carton has less brown eggs, it
also has less eggs in the carton. Encourage
students to think beyond additive to
multiplicative reasoning.
Slide 18
Brown Egg Problem Continued:
# brown eggs
# eggs in carton
# brown eggs
# eggs in carton
6
12
7
18
6 out of 12 is exactly
half brown eggs, while
7 out of 18 is less than
half brown eggs,
therefore the first
carton has more
brown eggs.
Some students may stop after writing the
two ratios and notice that 7 out of 18 is
less than half, while the other carton has
exactly half brown eggs, therefore the
carton of 12 contains more brown eggs.
Others may change the first carton to 18
eggs, and be able to see that if both cartons
contained 18 eggs, the first carton would
have more brown eggs.
Still other students may change both to
cartons of 36 and compare.
57
Slide 19
Brown Egg Problem Continued:
# brown eggs
# eggs in carton
6
3
9
12
6
18
Some students may stop after writing the
two ratios and notice that 7 out of 18 is
less than half, while the other carton has
exactly half brown eggs, therefore the
carton of 12 contains more brown eggs.
9 brown out of 18 eggs
is greater than 7
brown out of 18 eggs.
# brown eggs
7
# eggs in carton
18
Others may change the first carton to 18
eggs, and be able to see that if both cartons
contained 18 eggs, the first carton would
have more brown eggs.
Still other students may change both to
cartons of 36 and compare.
Slide 20
Brown Egg Problem Continued:
# brown eggs
# eggs in carton
6
3
9
18
12
6
18
36
# brown eggs
7
14
# eggs in carton
18
36
Some students may stop after writing the
two ratios and notice that 7 out of 18 is
less than half, while the other carton has
exactly half brown eggs, therefore the
carton of 12 contains more brown eggs.
18 brown eggs out of
36 eggs is greater
than 14 brown eggs
out of 36 eggs.
Others may change the first carton to 18
eggs, and be able to see that if both cartons
contained 18 eggs, the first carton would
have more brown eggs.
Still other students may change both to
cartons of 36 and compare.
Slide 21
rB
tte
Be
I want to get some juice to take on my bike
trip. I like both apple and orange . The orange
juice pack hold more (12 oz) and it costs
$1.70. The apple juice pack costs less, $1.10,
but holds less (8 oz.). Which is the better
deal?
uy
!!
Comparing Problem:
X½
Cost $
$1.10
$0.55
$1.65
Ounces
8oz
4oz
12oz
Once again (like the egg problem) there
are many ways to accurately compare the
two units.
X½
Cost $
Students will need to set up two different
ratio tables and come up with values they
are able to compare. These problems will
bring about a good opportunity to discuss
multiplication reasoning/additive
reasoning.
$1.70
Ounces 12oz
Lamon (2005)
58
Slide 22
Homework Problems:
1) A car traveling at a speed of 65 mph and a truck was traveling
on the same road at a speed of 60 mph. They came to a hill
and both vehicles slowed down by 15 mph as they climbed the
hill. Which vehicle had a harder time maintaining its speed?
These problems need to be completed by
students for homework. Tell them to be
prepared to share and defend their
answers.
2) Jo has two snakes, String Bean and Slim. Right now, String
Bean is 4’ long and Slim is 5’ long. Jo knows that two years
from now, both snakes will be fully grown. At her full length,
String Bean will be 7’ long, while Slim’s length when he is fully
grown will be 8’. Over the next two years, will both snakes
grow the same amount?
Be prepared to explain and defend your answers.
Lamon (2005)
Slide 23
DAY SIX:
• Students share and defend their
answers using the ratio tables
they generated for homework.
Slide 24
Allow students to share within their groups
and then have students prepare
transparencies of their methods to share
with the whole class. Advantages to
certain strategies should be shared.
I have separated the lessons by days, but
the days do not need to be consecutive.
Although the homework discussion needs
to follow the day of the lesson.
DAY SEVEN:
• A variety of Proportional Reasoning
Situations.
Slide 25
Some problems to think about:
1) A 16 oz box of Bites cereal costs $3.36 and
a 12 oz box of Bits cost $2.64. If both
cereals are of equal quality, which cereal is
the better buy. Explain.
Lamon (2005)
Students will need to set up two different
ratio tables and come up with values they
are capable of comparing. These problems
will bring about a good opportunity to
discuss multiplication reasoning/additive
reasoning.
59
Slide 26
Some problems to think about:
2) The Science club has four separate
rectangular plots of land for experiments with
plants.
1 foot by 4 feet
7 feet by 10 feet
17 feet by 20 feet
27 feet by 30 feet
Which rectangular plot is most square? How do
you know your answer is correct?
(Van de Walle, 2007)
Slide 27
Some problems to think about:
3) A person who weighs 160 pounds on Earth will
weigh 416 pounds on the planet Jupiter. How
much will a person weigh on Jupiter who weighs
120 pounds on earth? Explain your work.
(Van de Walle, 2007)
4) At the local college, five out of every eight seniors
live in apartments. How many of the 30 senior
math majors are likely to live in an apartment?
Explain your answer.
(Van de Walle, 2007)
Slide 28
Some problems to think about:
Students should plan ahead and mentally
devise a plan to help them solve problem
number 5.
5) Cheese is $4.25 per pound. How much will 12.13
pounds cost. Explain how you solved this problem.
(Lamon, 1999)
6) 13% of 62 is what number? Show how you arrived
at your answer.
Slide 29
Homework Problems:
• Any problems not finished in class will become
homework problems to be discussed an presented
the following day.
• Be prepared to explain and defend your answers.
These problems need to be completed by
students for homework. Tell them to be
prepared to share and defend their
answers.
60
Slide 30
DAY EIGHT:
• Students share and defend their
answers using the ratio tables
they generated for homework.
Slide 31
It is understood that ratio tables are only
one tool of many tools needed to
encourage students’ proportional thinking.
Yet, while ratio tables are easy for teachers
to implement they may result in
encouraging powerful proportional
thinking.
Rest of Year:
Ratio tables will continue to be
presented throughout the rest of
the year whenever applicable.
This should be a reminder to seventh grade
students about the identity property.
Students should be familiar with the
identity property, but review is often
needed and valuable to do because this
property is such an important part of ratio
tables.
Slide 32
Property of 1
Ident it y Propert y
÷
a(1)=a
10
a ÷(1)=a
20
÷x
2
2
=
Some students strategies will become very
efficient, to the point of using two steps,
dividing to get a unit ratio, then
multiplying to get some known quantity,
similar to the cross multiplication
algorithm. Other students will continue to
build tables they may not be the most
efficient, but are generated with
understanding at their skill level. The
advantageous, efficient strategies need to
be pointed out and shared with the whole
class.
5
20
10
40
An equivalent ratio is found by
multiplying (or dividing) both parts by the
same number.
Slide 33
Adding Ratios Using Distributive Property
Why does
this work?
1
2
+
2
4
=
3
6
To be able to use ratio tables to their full
extent, it is useful to explore adding ratios
to get equivalent ratios. Allow students to
guess what the answer will be, then
discuss fraction addition versus ratio
addition.
61
Slide 34
Adding Ratios Using Distributive Property
(1) (1)
(2) (1)
+
(1) (2)
(2) (2)
(3) (1)
=
(3) (2)
(1 + 2)(1)
=1+2
=3
(1 + 2)(2)
=2+4
=6
Slide 35
=
1 out of 2 and 2 out of 4 are the same as 3 out of 6. So,
when the ratios are written using another notation it looks
like:
1 2 3
+ =
2 4 6
Slide 36
3 is what percent of 40?
x2
3
6
7½%
total
40
80
x2
÷2
1
1
2
20
+
+
7
For example: 1 out of 2 plus 2 out of 2 is
not equivalent to 3 out of 4. Or, ½ + 2/2
does not equal ¾ .
Allow a few minutes for students to think
about how they would construct their own
ratio table. Then, as a class construct a
ratio table, allowing the student’s input to
guide the construction.
Why is it useful to add ratios???
part
One way to explore this is to think about 3
out of 6 as being copies of 1 out of 2.
Instead of doing 3 copies of 1 out of 2
right away, we could do 1 copy and then 2
copies and add to get the same answer as if
we had made 3 copies right away. By
distributive property, we can show this to
be true. Seventh grade students should be
familiar with the distributive property.
Although adding equivalent ratios together
produce equivalent ratios, it might be
beneficial at this point to talk to students
about the misconception that adding a
value of one to a ratio will also produce an
equivalent ratio.
A Picture might help.
÷2
First, remind students they are adding
RATIOS, not fractions. Remind them a
ratio is a relation between two amounts.
1
2
100
If it doesn’t come up, show how
equivalent ratios could be added within the
table to generate other equivalent ratios.
For example, if a ratio table is being
constructed that needs 2 ½ times an
amount, sometimes for students it is easier
to multiply by 2 and then by ½ and then to
add the two ratios. Most students will be
able to do both of these operations
mentally, whereas multiplying by 2 ½ is a
more difficult task.
62
Slide 37
Multiplying by 2 ½ the first time.
X 2 1/2
1
2
part
3
7
total
40
100
X 2 1/2
We still get 7 ½ %
Slide 38
One more problem:
3 is what percent of 22?
÷22
÷2
x4
1
part
3
total
22
12
88
3
1
+ 2 + 22
+ 11 + 1
7
11
100
13
x4
÷2
÷22
Slide 39
Another way to think about the
addition:
1 3
11 3
14
7
1
12 + 1 +
13
13
12
22 22 = 22 = 11
+ 2 + 22 =
88 11 1
88 + 11 + 1
100
100
13
Slide 40
7%
11
To Return to DAY ONE
HOMEWORK, click here
Both methods will give the same answer.
This shows the power of ratio tables,
students are able to construct ratio tables at
their own pace, building at their own skill
level.
APPENDIX D
FIVE POINT PROPORTIONAL REASONING
SCORING RUBRIC
64
APPENDIX E
PARENT PERMISSION LETTER
October 10. 2008
Dear Parent / Guardian,
I am your students’ current mathematics teacher. For the past two summers I
have been working on a master’s degree in Mathematics Education at CSU Chico. As
part of my work I will be conducting a research study this year. I will be using
assessments of students’ proportional reasoning anonymously for a research study I am
doing in order to fulfill the requirements for a master’s degree at CSU Chico. There are
no anticipated risks or benefits to students resulting from this study, nor can anyone be
identified from their work. Although these assessments of students’ proportional
reasoning skills are required coursework, their participation in this research is voluntary
and confidential. Based on the results of their proportional reasoning assessments, some
students may also be asked to participate in an audio-recorded one-on-one interview with
me at school. The interview will take place during your students’ regular math class.
They can choose to opt out of the study with no penalty and without affecting their grade.
Thank you for your time and continued support.
Sincerely,
Rita Nutsch
66
67
Parent Permission
I, _____________________________, give my permission for: (Please check one or
both)
Parent / Guardian (please print)
My student’s results to be included in the research project described.
My student to participate in a one-on-one interview with Ms. Nutsch if chosen. I
understand that if my student is chosen for an interview I will be notified at least one
week prior to the interview and his/her identify will be protected in the study.
_________________________
Student’s Name
_________________________
Parent / Guardian’s Signature
__________
Date
Student Permission
I, _____________________________, give my permission for: (please check one or
both)
Student (please print)
My results to be included in the research project described.
Me to participate in a one-on-one interview with Ms. Nutsch if chosen. I understand
that if I am chosen for an interview I will be notified at least one week prior to the
interview and my identity will be protected in the study.
Please return this sheet to Ms. Nutsch and keep the first page for your records.
APPENDIX F
AVERAGE PROPORTIONAL REASONING LEVEL
BEFORE AND AFTER INTRODUCTION
OF RATIO TABLES
69
APPENDIX G
AVERAGE PROPORTIONAL REASONING
LEVEL BY PROBLEM NUMBER
71

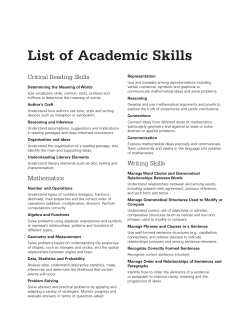


© Copyright 2026