
Risks of Metam Sodium Use to Federally Threatened Ambystoma californiense)
Risks of Metam Sodium Use to Federally Threatened California Tiger Salamander (Ambystoma californiense) (Central California Distinct Population Segment) and Federally Endangered Sonoma County and Santa Barbara County Distinct Population Segments of California Tiger Salamander Pesticide Effects Determinations PC Codes: 039003 (Metam Sodium) and 068103 (MITC) CAS Numbers: 144-54-7 (Metam Sodium) and 556-61-6 (MITC) Environmental Fate and Effects Division Office of Pesticide Programs Washington, D.C. 20460 29 December 2010 Primary Authors: Valerie Woodard, Ph.D., Biologist Gabe Rothman, M.S., Environmental Scientist Secondary Review: Mohammed Ruhman, Ph.D, Soil Scientist Keith Sappington, M.S., Senior Science Advisor Branch Chief, Environmental Risk Assessment Branch 5 Mah Shamim, Ph.D. 1 Table of Contents 1. EXECUTIVE SUMMARY ......................................................................................... 12 1.1. PURPOSE OF ASSESSMENT ....................................................................................12 1.2. SCOPE OF ASSESSMENT ........................................................................................12 1.2.1. Uses Assessed ............................................................................................12 1.2.2. Evaluation of Stressors of Concern............................................................13 1.2.3. Environmental Fate Properties of Metam Sodium and MITC...................14 1.3. ASSESSMENT PROCEDURES ..................................................................................14 1.3.1. Exposure Assessment.................................................................................14 1.3.2. Toxicity Assessment ..................................................................................16 1.3.3. Measures of Risk........................................................................................17 1.4. SUMMARY OF CONCLUSIONS ...............................................................................17 2. PROBLEM FORMULATION ................................................................................... 26 2.1. PURPOSE ..............................................................................................................26 2.2. SCOPE ..................................................................................................................27 2.2.1. Evaluation of Degradates...........................................................................28 2.2.2. Evaluation of Mixtures ..............................................................................28 2.3. PREVIOUS ASSESSMENTS .....................................................................................29 2.4. ENVIRONMENTAL FATE PROPERTIES ...................................................................30 2.4.1. Environmental Transport Mechanisms ......................................................37 2.4.2. Mechanism of Action.................................................................................38 2.5. USE CHARACTERIZATION.....................................................................................38 2.6. ASSESSED SPECIES ...............................................................................................46 2.7. DESIGNATED CRITICAL HABITAT .........................................................................49 2.8. ACTION AREA AND LAA EFFECTS DETERMINATION AREA .................................50 2.8.1. Action Area................................................................................................50 2.8.2. LAA Effects Determination Area ..............................................................50 2.9. ASSESSMENT ENDPOINTS AND MEASURES OF ECOLOGICAL EFFECT....................53 2.9.1. Assessment Endpoits .................................................................................53 2.9.2. Assessment Endpoints for Designated Critical Habitat .............................55 2.10. CONCEPTUAL MODEL ..........................................................................................56 2.10.1. Risk Hypotheses.........................................................................................56 2.10.2. Diagram......................................................................................................56 2.11. ANALYSIS PLAN ...................................................................................................59 2.11.1. Measures of Exposure................................................................................60 2.11.2. Measures of Effect .....................................................................................63 2.11.3. Integration of Exposure and Effects ..........................................................63 2.11.4. Data Gaps...................................................................................................63 3. EXPOSURE ASSESSMENT ...................................................................................... 65 2 3.1. AQUATIC EXPOSURE ASSESSMENT ......................................................................65 3.1.1. Modeling Approach for Surface Water......................................................65 3.1.2. Ground Water.............................................................................................70 3.1.3. Existing Water Monitoring Data................................................................72 3.2. TERRESTRIAL ANIMAL EXPOSURE ASSESSMENT..................................................72 3.2.1. Atmospheric Dispersion Modeling Approach ...........................................72 3.2.2. SCREEN3 Modeling Results.....................................................................73 3.2.3. Atmospheric Monitoring Data ...................................................................73 3.3. CHANGES IN EXPSOURE ASSESSMENT FROM RED-LEGGED FROG ASSESSMENT ..74 4. EFFECTS ASSESSMENT .......................................................................................... 75 4.1. ECOTOXICITY STUDY DATA SOURCES .................................................................75 4.2. TOXICITY OF MITC TO AQUATIC ORGANISMS .....................................................77 4.2.1. Toxicity to Freshwater Fish .......................................................................78 4.2.2. Toxicity to Freshwater Invertebrates .........................................................79 4.2.3. Toxicity to Aquatic Plants .........................................................................79 4.3. TOXICITY OF MITC TO TERRESTRIAL ORGANISMS ..............................................79 4.3.1. Toxicity to Birds and Terrestrial-Phase Amphibians.................................80 4.3.2. Toxicity to Mammals.................................................................................80 4.3.3. Toxicity to Terrestrial-Phase Amphibians .................................................81 4.3.4. Toxicity to Terrestrial Invertebrates ..........................................................81 4.3.5. Toxicity to Terrestrial Plants .....................................................................82 4.4. INCIDENT DATABASE REVIEW .............................................................................82 5. RISK CHARACTERIZATION.................................................................................. 86 5.1. RISK ESTIMATION ................................................................................................86 5.1.1. Exposures in the Aquatic Habitat ..............................................................86 5.1.2. Exposures in the Terrestrial Habitat ..........................................................92 5.1.3. Primary Constituent Elements of Designated Critical Habitat ..................94 5.2. RISK DESCRIPTION ...............................................................................................94 5.2.2. Modification of Designated Critical Habitat............................................111 5.2.3. Spatial Extent of Potential Effects ...........................................................111 5.3.1 CTS ..........................................................................................................114 5.3.2 Addressing the Risk Hypotheses .............................................................114 6. UNCERTAINTIES .................................................................................................... 115 6.1. EXPOSURE ASSESSMENT UNCERTAINTIES ..........................................................115 6.1.1. Uncertainty Associated with Maximum Use Scenario ............................115 6.1.2. Aquatic Exposure Modeling of Metam Sodium and MITC ....................115 6.1.3. Water Monitoring Data Limitations.........................................................117 6.1.4. Usage Uncertainties .................................................................................117 6.1.5. Terrestrial Exposure Models Limitations ................................................117 6.1.6. Terrestrial Air Monitoring Limitations....................................................119 3 6.2. EFFECTS ASSESSMENT UNCERTAINTIES .............................................................119 6.2.1. Age Class and Sensitivity of Effects Thresholds.....................................119 6.2.2. Use of Surrogate Species Effects Data ....................................................119 6.2.3. Sublethal Effects ......................................................................................120 6.2.4. Acute LOC Assumptions .........................................................................120 6.2.5. Acute-to-Chronic Ratio Assumptions......................................................120 6.2.6. Mixtures ...................................................................................................120 7. RISK CONCLUSIONS ............................................................................................. 122 8. REFERENCES........................................................................................................... 131 Appendices Appendix A Appendix B Appendix C Appendix D Appendix E Appendix F Appendix G Appendix H Appendix I Appendix J Appendix K Appendix L PRD/RD Use Description Memo: “Verification Memorandum for Metam Sodium for San Francisco Bay Species” Evaluation for Toxic Degradates of Concern Risk Quotient (RQ) Method and Levels of Concern (LOCs) Example Output from PRZM/EXAMS Evaluation of PRZM/EXAMS Volatility Algorithm Example Output from SCREEN3 Summary of Ecotoxicity Data Bibliography of ECOTOX Open Literature Accepted ECOTOX Data Table (sorted by effect) and Bibliography The HED Chapter for Metam Sodium Description of Spatial Analysis and Maps Showing the Overlap of the Initial Area of Concern and the Species Habitat and Occurrence Sections Metam Sodium Label Use Information System (LUIS) Report Attachments Attachment 1. Supplemental Information on Standard Procedures for Threatened and Endangered Species Risk Assessments on the San Francisco Bay Species Attachment 2: Status and Life History for the San Francisco Bay Species Attachment 3: Baseline Status and Cumulative Effects for the San Francisco Bay Species 4 List of Tables Table 1-1. Table 1-2. Table 1-3. Table 1-4. Table 2-1. Table 2-2. Table 2-3. Table 2-4. Table 2-5. Table 2-6. Table 2-7. Effects determination summary for effects of MITC on the CTS (all 3 DPSs). ........ 20 Effects determination summary for the Critical Habitat impact analysis................... 22 Use specific summary of the potential for adverse effects to aquatic taxa. ............... 24 Use specific summary of the potential for adverse effects to terrestrial taxa............. 24 Products containing multiple active ingredients......................................................... 29 Physical and chemical properties of Metam Sodium and MITC. .............................. 30 Summary of metam sodium environmental fate properties. ...................................... 31 Summary of MITC environmental fate properties. .................................................... 32 Description of MITC field volatility studies and volatile flux measurements. .......... 36 Metam sodium outdoor agricultural use information based on labels. ...................... 44 Summary of current distribution, habitat requirements, and life history information for the CTS................................................................................................................... 47 Table 2-8. Designated critical habitat PCEs for the CTS.. ........................................................... 49 Table 2-9. Taxa used in the analyses of direct and indirect effects for the CTS. ........................ 53 Table 2-10. Taxa and assessment endpoints used to evaluate the potential for MITC to result in direct and indirect effects to the CTS or modification of their critical habitat. ........... 54 Table 3-1. Summary of PRZM/EXAMS physical chemical properties and environmental fate data used for aquatic exposure estimation for MITC................................................... 66 Table 3-2. Crop management PRZM/EXAMS inputs used in aquatic exposure modeling. ....... 67 Table 3-3. Estimated aquatic concentrations for MITC expsoure in California.......................... 70 Table 3-4. SCI-GROW input parameters for MITC.................................................................... 71 Table 3-5. Estimated exposure concentrations of MITC in ground water................................... 71 Table 3-6. SCREEN3 inputs for MITC air exposure modeling................................................... 72 Table 3-7. SCREEN3 acute EECs in air...................................................................................... 73 Table 4-1. Aquatic toxicity profile for MITC.............................................................................. 77 Table 4-2. Categories of acute toxicity for fish and aquatic invertebrates. ................................. 78 Table 4-3. Categories of acute toxicity for avian and mammalian studies.................................. 80 Table 4-4. Acute toxicity of methyl isothiocyanate (PC Code 068103)...................................... 81 Table 4-5. Adverse aquatic incidents: metam sodium. ................................................................ 82 Table 4-6. Adverse terrestrial incidents: metam sodium. ............................................................ 84 Table 5-1. Acute and chronic MITC RQs for freshwater fish based on MITC soil incorporated application. ................................................................................................................... 87 Table 5-2. Acute RQs for freshwater fish Based on MITC surface application........................... 87 Table 5-3. Summary of acute and chronic RQs for freshwater invertebrates based on MITC soil incorporated application............................................................................................... 89 Table 5-4. MITC acute RQs for freshwater invertebrates based on surface application of MITC. ...................................................................................................................................... 89 Table 5-5. Summary of acute RQs for non-vascular aquatic plants based on MITC soil incorporated application............................................................................................... 90 5 Table 5-6. MITC acute RQs for freshwater nonvascular plants based on surface application for MITC............................................................................................................................ 90 Table 5-7. Summary of acute RQs for vascular aquatic plants based on MITC for soil incorporated applications. ............................................................................................ 91 Table 5-8. Summary of acute RQs for vascular plants Based on MITC using surface applications. ................................................................................................................. 92 Table 5-9. Terrestrial phase acute risk quotients for metam sodium applications and subsequent exposure to MITC. ....................................................................................................... 93 Table 5-10. Risk estimation summary for MITC - direct and indirect effects to the California Tiger Salamander. ........................................................................................................ 95 Table 5-11. Risk estimation summary for MITC – effects to designated critical habitat (PCEs) of California Tiger Salamander. ....................................................................................... 98 Table 5-12. Estimate of the chance of individual effect for direct effects from MITC using the fish as a surrogate for the CTS................................................................................... 104 Table 5-13. Estimate of the chance of individual effect for direct effects on the terrestrial Phase CTS using the rat as a surrogate................................................................................. 106 Table 5-14. Estimate of the chance of individual effect for indirect effects using the Daphnia as a surrogate. ................................................................................................................. 108 Table 7-1. Effects determination summary for effects of MITC on the CTS (all 3 DPSs). ...... 124 Table 7-2. Risk estimation summary for MITC – effects to designated critical habitat (PCEs) of California Tiger Salamander. ..................................................................................... 126 Table 7-3. Use specific summary of the potential for adverse effects to aquatic taxa. ............. 129 Table 7-4. Use specific summary of the potential for adverse effects to terrestrial taxa........... 129 6 List of Figures Figure 2-1. Estimated Agricultural Use of Metam Sodium in U.S. in 2002................................ 40 Figure 2-2. Estimated agricultural use of Metam Sodium in California by County (average use between 1998 – 2008). ................................................................................................. 42 Figure 2-3. Estimated agricultural use of Metam Sodium in California by crop (average use between 1998 – 2008). ................................................................................................. 43 Figure 2-4. Photograph showing flat fume or broadcast shank injection application followed by tarp covering. ............................................................................................................... 45 Figure 2-5. Photograph showing shank injection application to raised beds followed by tarp covering........................................................................................................................ 45 Figure 2-6. Photograph showing typical drip chemigation application in raised beds covered with tarps...................................................................................................................... 45 Figure 2-7. Photograph showing sprinkler chemigation application. .......................................... 46 Figure 2-8. California tiger salamander critical habitat and occurrence sections identified in Case No. 07-2794-JCS.......................................................................................................... 48 Figure 2-9. Initial area of concern, or “footprint” of potential use, for metam sodium............... 52 Figure 2-10. Conceptual Model Depicting Stressors, Exposure Pathways, and Potential Effects to Aquatic Organisms from the effects of MITC from metam sodium applications. .. 57 Figure 2-11. Conceptual Model Depicting Stressors, Exposure Pathways, and Potential Effects to Terrestrial Organisms from the effects of MITC from metam sodium applications. ...................................................................................................................................... 58 Figure 5-1. Map showing the metam sodium use overlap with the CTS critical habitat and occurrence sections identified by Case No. 07-2794-JCS. ........................................ 113 7 List of Commonly Used Abbreviations and Nomenclature µg/kg µg/L ºC AAPCO a.i. or ai AIMS Acc# amu BCB BCF BEAD bw CAM CARB CAW CBD CCR CDPR CDPR-PUR CFWS CI CL CTS CTS-CC CTS-SB CTS-SC DS EC Symbol for “micrograms per kilogram” Symbol for “micrograms per liter” Symbol for “degrees Celsius” Association of American Pesticide Control Officials Active Ingredient Avian Monitoring Information System Accession Number Atomic Mass Unit Bay Checkerspot Butterfly Bioconcentration Factor Biological and Economic Analysis Division Body Weight Chemical Application Method California Air Resources Board California Alameda Whipsnake Center for Biological Diversity California Clapper Rail California Department of Pesticide Regulation California Department of Pesticide Regulation Pesticide Use Reporting Database California Freshwater Shrimp Confidence Interval Confidence Limit California Tiger Salamander California Tiger Salamander Central California Distinct Population Segment California Tiger Salamander Santa Barbara County Distinct Population Segment California Tiger Salamander Sonoma County Distinct Population Segment Delta Smelt Emulsifiable Concentrate 8 EC05 EC25 EC50 ECOTOX EEC EFED e.g. EIM EPI ESU et al. etc. EXAMS FIFRA FQPA ft GENEEC HPLC IC05 IC50 i.e. IECV1.1 KABAM kg kJ/mole km KAW Kd KF KOA KOC KOW LAA 5% Effect Concentration 25% Effect Concentration 50% (or Median) Effect Concentration EPA managed database of Ecotoxicology data Estimated Environmental Concentration Environmental Fate and Effects Division Latin exempli gratia (“for example”) Environmental Information Management System Estimation Programs Interface Evolutionarily significant unit Latin et alii (“and others”) Latin et cetera (“and the rest” or “and so forth”) Exposure Analysis Modeling System Federal Insecticide Fungicide and Rodenticide Act Food Quality Protection Act Feet Generic Estimated Exposure Concentration model High Pressure Liquid Chromatography 5% Inhibition Concentration 50% (or median) Inhibition Concentration Latin for id est (“that is”) Individual Effect Chance Model Version 1.1 KOW (based) Aquatic BioAccumulation Model Kilogram(s) Kilojoules per mole Kilometer(s) Air-water Partition Coefficient Solid-water Distribution Coefficient Freundlich Solid-Water Distribution Coefficient Octanol-air Partition Coefficient Organic-carbon Partition Coefficient Octanol–water Partition Coefficient Likely to Adversely Affect 9 lb a.i./A LC50 LD50 LOAEC LOAEL LOC LOD LOEC LOQ m MA MATC m2/day ME mg mg/kg mg/L mi mmHg MRID MW n/a NASS NAWQA NCOD NE NLAA NLCD NMFS NOAA NOAEC NOAEL NOEC Pound(s) of active ingredient per acre 50% (or Median) Lethal Concentration 50% (or Median) Lethal Dose Lowest Observable Adverse Effect Concentration Lowest Observable Adverse Effect Level Level of Concern Level of Detection Lowest Observable Effect Concentration Level of Quantitation Meter(s) May Affect Maximum Acceptable Toxicant Concentration Square Meters per Days Microencapsulated Milligram(s) Milligrams per kilogram (equivalent to ppm) Milligrams per liter (equivalent to ppm) Mile(s) Millimeter of mercury Master Record Identification Number Molecular Weight Not applicable National Agricultural Statistics Service National Water Quality Assessment National Contaminant Occurrence Database No Effect Not Likely to Adversely Affect National Land Cover Dataset National Marine Fisheries Service National Oceanic and Atmospheric Administration No Observable Adverse Effect Concentration No Observable Adverse Effect Level No Observable Effect Concentration 10 NRCS OCSPP OPP OPPTS ORD PCE pH pKa ppb ppm PRD PRZM ROW RQ SFGS SJKF SLN SMHM TG T-HERPS T-REX UCL USDA USEPA USFWS USGS VELB WP wt Natural Resources Conservation Service Office of Chemical Safety and Pollution Prevention Office of Pesticide Programs Office of Prevention, Pesticides and Toxic Substances Office of Research and Development Primary Constituent Element Symbol for the negative logarithm of the hydrogen ion activity in an aqueous solution, dimensionless Symbol for the negative logarithm of the acid dissociation constant, dimensionless Parts per Billion (equivalent to µg/L or µg/kg) Parts per Million (equivalent to mg/L or mg/kg) Pesticide Re-Evaluation Division Pesticide Root Zone Model Right of Way Risk Quotient San Francisco Garter Snake San Joaquine Kit Fox Special Local Need Salt Marsh Harvest Mouse Tidewater Goby Terrestrial Herpetofaunal Exposure Residue Program Simulation Terrestrial Residue Exposure Model Upper Confidence Limit United States Department of Agriculture United States Environmental Protection Agency United States Fish and Wildlife Service United States Geological Survey Valley Elderberry Longhorn Beetle Wettable Powder Weight 11 1. Executive Summary 1.1. Purpose of Assessment The purpose of this assessment is to evaluate potential direct and indirect effects from metam sodium applications (PC code: 039003) and its principle degradate, methyl isothiocyanate (MITC) (PC code: 068103) on the California tiger salamander (Ambystoma californiense referred to hereafter as CTS) in its terrestrial and aquatic habitats arising from FIFRA regulatory actions regarding use of metam sodium on agricultural and non-agricultural sites. In addition, this assessment evaluates whether these actions can be expected to result in modification of designated critical habitat for CTS. Metam sodium is used as a carrier substance from which MITC forms. MITC is exclusively considered the primary stressor of concern in this risk assessment for both the aquatic and terrestrial-phase CTS given MITC’s mode of toxicity and persistence in the environment compared to metam sodium. See Sections 1.2.2 and 2.2.1 for further details. This assessment was completed in accordance with the U.S. Fish and Wildlife Service (USFWS) and National Marine Fisheries Service (NMFS) Endangered Species Consultation Handbook (USFWS/NMFS, 1998), procedures outlined in the Agency’s Overview Document (USEPA, 2004b), and consistent with a stipulated injunction ordered by the Federal District Court for the Northern District of California in the case Center for Biological Diversity (CBD) vs. EPA et al. (Case No. 07-2794-JCS). There are currently three CTS Distinct Population Segments (DPSs): the Sonoma County (SC) DPS, the Santa Barbara (SB) DPS, and the Central California (CC) DPS. Each DPS is considered separately in the risk assessment as they occupy different geographic areas. This assessment will include a spatial analysis of potential risk to the different habitat locations. The CTS-SB and CTS-SC were downlisted from endangered to threatened in 2004 by the USFWS, however, the downlisting was vacated by the U.S. District Court. Therefore, the SC and SB DPSs are currently listed as endangered while the CC DPS is listed as threatened. The CTS utilizes vernal pools, semi-permanent ponds, and permanent ponds, and the terrestrial environment in California. The aquatic environment is essential for breeding and reproduction and mammal burrows are also important habitat for aestivation. 1.2. Scope of Assessment 1.2.1. Uses Assessed Currently, metam sodium is used throughout the United States, mainly as a broad-spectrum soil fumigant to control soil-bourne pests such as weeds, diseases, and nematodes applied before planting a wide variety of crops. Since the Red Legged Frog Endangered Species Assessment (ESA) on Metam Sodium was submitted in July 2007, changes have been applied to all product labels collectively associated with a Reregistration Eligibility Decision (RED) on Soil Fumigant Pesticides issued by The Agency in May 2009. A memo from the Registration Division and 12 Pesticide Re-evaluation Division at the Office of Pesticide Programs dated August 12, 2010 (Appendix A) along with a cursory review of the labels verified adoption of these changes including the listing of specific crops eligible for soil fumigant use, the requirement of certain field management practices or, “Good Agricultural Practices,” in conjunction with fumigant use, as well as several protective measures concerning human worker and bystander exposure including but not limited to the requirement of buffer zones establishing a prohibition on entry from a distance from the edge of a treated field as well as a re-entry time interval. In addition metam sodium labels are expected to be further revised in 2011 addressing human health risk issues. However, these revisions are not expected to impact this risk assessment. The Label Use Information System (LUIS) report, received from the OPP’s Biolgical and Economic Analysis Division dated December 1, 2010 lists the following use groups for metam sodium: terrestrial food, terrestrial feed, terrestrial non-food, aquatic non-food, industrial, agricultural soils, nonagricultural soils, greenhouse non-food, and outdoor residential. There is also a Special Local Needs label for California in which metam sodium is used to sterilize animal waste. This use pattern is consistent with the memo from the Registration Division and Pesticide Re-evaluation Division at the Office of Pesticide Programs dated August 12, 2010 (Appendix A). The uses to agricultural soils are thought to result in the greatest risks to the CTS in its habitat, with the other uses not expected to contribute to adverse effects based on significant magnitudes or frequencies of exposure. In addition, metam sodium uses other than as an agricultural soil fumigant are minor each composing of less than only 1 percent of the overall use pattern in California (see Figure 2-3). These other uses include sewer root control treatments, telephone pole treatments, and structural fumigation which all occur indoors and are not directly released to the outdoor environment. Another use of metam sodium besides soil fumigation includes treatment to cover crops which is not expected to contribute to the overall risk to the CTS since it is a very minor use compared to the other crop scenarios evaluated in the risk assessment. Therefore, this assessment will exclusively consider the agricultural and nonagricultural (turf) soil fumigant uses although the federal action includes all labeled uses of metam sodium. Metam sodium is either surface applied to bare soil via a number of methods including ground sprinklers, center-pivot sprinklers, flooded applications, and drench applications, or incorporated in the soil via a shank injection approximately one month prior to planting. Please refer to Section 2.5 for further details on the specifics of the fumigant applications and management practices for the treated field. 1.2.2. Evaluation of Stressors of Concern Metam sodium is very unstable in the environment as suggested by numerous environmental fate characteristics such as rapid biodegradation and hydrolysis. Consequently, metam sodium exposure and resultant risk to the aquatic-phase and terrestrial-phase CTS is expected to be negligible. Methyl isothiocyanate (MITC), metam sodium’s principle degradate is the main stressor of concern. MITC is moderately persistent in the environment with half-lives ranging between 3.3 – and 51.6 days for biodegradation pathways under various environmental conditions. Thirdly, MITC generally appears to be of highest toxicological concern as compared 13 to other degradates. Besides MITC, the major degradates for metam sodium in the enivironment were identified as the following: methylamine, 1,3-dimethylthiourea (DMTU) 1,3 dimethylurea (DMU). Methylcarbamo (dithioperoxo) thioate (MCDT), syn-N-methylthioformamide anti-N-methylthioformamide Please refer to Section 2.4 for a complete characterization on the formation and decline of these degradates. Other than MITC, none of these major degradates have been identified as potentially of toxicological concern. Please refer to Appendix B for additional clarification and justification of this conclusion. 1.2.3. Environmental Fate Properties of Metam Sodium and MITC Aerobic soil metabolism and photodegradation in water studies suggest that metam sodium is very unstable (half-lives between 23 to 28 minutes) and degrades rapidly to methylisothiocyante (MITC) and other degradates. MITC persists longer than metam sodium in the environment and degradation of MITC in soil and water appears to be dependent on hydrolysis and microbiallymediated degradation and persist longer than metam sodium in the environment. The dissipation of MITC in aquatic and terrestrial environments appears to be predominantly dependent on volatilization and to a lesser extent on leaching and degradation. Photolytic degradation is the major dissipation route of MITC in the atmosphere. Please refer to Section 2.4 for a more descriptive discussion on the physical chemical and fate properties of metam sodium and degradate MITC. 1.3. Assessment Procedures A description of routine procedures for evaluating risk to the San Francisco Bay Species are provided in Attachment 1. 1.3.1. Exposure Assessment 1.3.1.a. Aquatic Exposures Given MITC’s high solubility, translocation of soluble MITC gas to water bodies via runoff is possible. The Tier-II aquatic exposure model, PRZM/EXAMS, is used to estimate upper-bound MITC acute and chronic exposure levels in aquatic habitats resulting from runoff and spray drift from different use patterns. Although soil fumigants are applied to bare soil, results of estimated environmental exposure concentrations (EECs) will vary by crop scenario due to the representative soil properties and meteorological conditions that are intrinsic to that scenario. The crop scenarios, which include representative soil and meteorological conditions, were 14 chosen based on a survey of metam sodium uses in California. Negligible MITC estimated concentrations for soil incorporated uses are expected as EECs ranged from < 0.001 µg/L (lettuce, melon, tomato and turf) to 1.71 µg/L (nursery). In contrast, surface applied MITC estimated concentrations for surface applications resulting from different uses ranged from 1.77 µg/L (melon) to 186 µg/L (strawberry). The above estimates are supplemented with analysis of available surface water and ground water monitoring data. No metam sodium or MITC detections in surface or ground water can be attributed to labeled pesticide applications. No metam sodium was found in any ground or surface water monitoring samples. MITC has not been detected in ground water in or outside of California. Please refer to Section 3.2.5 for further details on the results of available monitoring data for metam sodium and MITC. 1.3.1.b. Terrestrial Exposures Given MITC’s volatile propoerties, off-gasing is expected to occur in fields treated with metam sodium. To estimate MITC inhalation exposure to terrestrial species, the SCREEN3 model is used in conjunction with several field volatility flux studies conducted in California for various surface and soil-incorporated applications of metam sodium. The upper-bound MITC EECs in air for surface applications is 13,990 g/m3 and for soil incorporated applications such as shank injection, the upper-bound EEC is 3,667 g/m3. Since MITC is expected to be in the gas-phase and given its low affinity to bioaccumulate in fatty tissues as indicated by its low Kow, limited residues on food items and prey is expected. In addition, exposure will not exist from treated crops given the typical plant-back interval of 20 days for metam sodium applications. Therefore, no dietary exposure to MITC from metam sodium applications is anticipated for the CTS. The T-REX and T-HERPS models were not used because no dietary exposure is anticipated from the use of metam sodium. The TerrPlant model estimates the effect on plants from residue exposure via runoff and spray drift. However, TerrPlant was not used because the dominant exposure pathway is expected to be in the form of air exposure from metam sodium applications. However, no plant toxicity data are available to estimate the effects from air concentrations of MITC. Several air monitoring studies have been conducted in California to determine the concentrations of MITC in air adjacent to the metam sodium application sites associated with specific application methods as well as over ambient air. The highest MITC concentration in conjunction with metam sodium application was 2,450 g/m3. For ambient air in agricultural areas, the highest measured concentration for MITC was 10.41 g/m3 with as many as 75 percent of air samples with detectable levels of MITC in Kern County, CA. Please refer to Section 3.2.3 for additional information regarding air monitoring data. Chronic exposures from airborne MITC vapors can occur mainly due to repeat exposures from multiple treated fields where metam sodium is used in large quantities. However, chronic exposure in air is not evident by MITC’s high reactivity and low persistence in the air and the 15 low magnitude of the maximum ambient MITC concentratation, 10.41 g/m3, measured in Kern County where metam sodium is heavily used. In addition, MITC’s half-life of less than 2 days (in the range between 1.2 and 1.6 days) in the atmosphere suggests that long range transport or related bioaccumulation among terrestrial organisms will not be significant. In addition, soil-borne exposure is likely an important exposure pathway of concern for populations of burrowing CTS. This is the case given MITC’s role as a soil fumigant and its highly mobile characteristics in soil, which can contribute to the translocation and bioavailability of MITC residues off the treated field. Using the PRZM model, it was determined that up to 4,896 g of MITC may be available to translocate off treated fields determined from a worst-case scenario considering various dissipation pathways such as runoff and erosion. Characterization for this exposure scenario is presented in Section 5.2.1.b. Another potential exposure pathway for burrowing CTS populations is contact with contaminated ground water. The SCIGROW model is used to characterize the potential magnitude of MITC ground water exposure which may exist from metam sodium applications since MITC is highly mobile and results from high application rates of metam sodium. Modeling results indicate tha the upper-bound EECs in ground water are fairly small at 1.81 ppb. This analysis is presented in Section 3.1.2. 1.3.1.c. Changes from Metam Sodium Red-Legged Frog Assessment In this assessment, there are several changes in the aspects of the tools and data that were used as the basis of the California Red-Legged Frog risk assessment. Changes include: (1.) Crop scenarios for several of the PRZM runs supporting the aquatic-phase exposure assessment have been revised since the Red-Legged Frog assessment. (2.) The PRZM/EXAMS shell pe4 was used to in the California Red-Legged Frog risk assessment instead of the pe5 shell used in this assesment. Therefore, aquatic-phase EECs may be marginally different. (3.) SCREEN3 was chosen as the tool to evaluate terrestrial-phase exposure in air assessment. The Red-Legged Frog assessment used a screening version of the ISCST3 model which is equivalent to the SCREEN3 model. 1.3.2. Toxicity Assessment Consistent with the process described in the Overview Document (US EPA 2004b), this risk assessment uses a surrogate species approach in its evaluation for MITC. Toxicological data generated from surrogate test species, which are intended to be representative of broad taxonomic groups, are used to extrapolate the potential effects on a variety of species (receptors) included under these taxonomic groupings. Based on this approach, birds serve as surrogates for terrestrial-phase amphibians and reptiles and freshwater fish serve as surrogates for aquatic phase amphibians. 16 The assessment endpoints include direct toxic effects on survival, reproduction, and growth of individuals, as well as indirect effects, such as reduction of the food source and/or modification of habitat. Federally-designated critical habitat has been established for the CTS. Primary constituent elements (PCEs) were used to evaluate whether MITC from metam sodium applications has the potential to modify designated critical habitat. The Agency evaluated registrant-submitted studies and data from the open literature to characterize MITC toxicity. The most sensitive toxicity value available from acceptable or supplemental studies for each taxon relevant for estimating potential risks to the assessed species and/or their designated critical habitat was used. For the purpose of this assessment, most sensitive endpoints from the registrant-submitted guideline studies or open-literature studies for MITC as the identified stressor will be used. Section 4 summarizes the ecotoxicity data available on MITC. The ecotoxicity data for metam sodium is provided in Appendix G. MITC is very highly toxic to freshwater fish and invertebrates on an acute exposure basis. The primary terrestrial exposure route is anticipated to be inhalation. However, no acute or chronic inhalation data for amphibians or birds as surrogates for amphibians is available. Therefore, the acute rat inhalation study will be used to estimate the effect of MITC use. There are also no acceptable sub-chronic or chronic inhalation rat data available for MITC. Due to the herbicidal properties of metam sodium, plants, both aquatic and terrestrial, are expected to be sensitive to MITC. Data for both vascular and non-vascular aquatic plants is available. Although no terrestrial plant studies are available, a waiver has been received. The waiver was denied and modifications to the current plant protocols will be necessary to provide information on exposure from the gas. 1.3.3. Measures of Risk Acute and chronic risk quotients (RQs) are compared to the Agency’s Levels of Concern (LOCs) to identify instances where metam sodium use has the potential to adversely affect the assessed species or adversely modify their designated critical habitat. When RQs for a particular type of effect are below LOCs, the pesticide is considered to have “no effect” on the species and its designated critical habitat. When RQs exceed LOCs, a potential to cause adverse effects or habitat modification is identified, leading to a conclusion of “may affect”. If metam sodium use “may affect” the assessed species, and/or may cause effects to designated critical habitat, the best available additional information is considered to refine the potential for exposure and effects, and distinguish actions that are Not Likely to Adversely Affect (NLAA) from those that are Likely to Adversely Affect (LAA). 1.4. Summary of Conclusions 17 Based on the best available information, the Agency makes a May Affect, and Likely to Adversely Affect determination for CTS (all 3 DPSs) from the use of metam sodium. Additionally, the Agency has determined that there is the potential for modification of designated critical habitat for CTS (all 3 DPSs) from the use metam sodium and the resulting MITC stressor. Effect determinations were evaluated using RQs. RQs were estimated for both soil incorporated and surface applications for taxa with available data. The two types of application methods for MITC were evaluated separately for direct and indirect effects. Direct effects for the aquatic CTS were evaluated using the fish as a surrogate and resulted in an LAA determination supported by endangered species LOC exceedence and probit analysis for surface applications. Indirect effects for the aquatic CTS were indicated by the potential for reduction in prey from acute fish exposure and from acute and chronic aquatic invertebrate exposure from surface applications of metam sodium. No MITC RQs exceeded the endangered species, acute risk or chronic LOC for fish or aquatic invertebrates from soil incorporated applications of metam sodium. In addition to fish and aquatic invertebrates, aquatic nonvascular plants which serve as the diet of the CTS for the first six weeks after hatching. No effect from the stressor MITC for soil incorporated or surface applications of metam sodium is expected based on no LOC exceedence for any uses. Indirect effects for the aquatic CTS also include alterations in habitat from aquatic plants. There is no obligate relationship between the CTS and any aquatic plants, therefore the EC50 toxicity values were used to estimate risk. No effect is expected due to no MITC stressor RQs exceeding the plant LOC for either surface or soil incorporated applications. Direct effects to the terrestrial CTs were evaluated using the rat as a surrogate. The primary exposure route is through inhalation for both surface and soil incorporated applications. No effect is expected due to no MITC stressor RQs exceeding the acute LOC for direct effects through inhalation. No chronic exposure to the terrestrial CTS is expected as suggested by the highest MITC ambient air montoring concentration of 10.41 g/m3 measured in Kern County, CA. Soil incorporated and surface applications of metam sodium are not expected to alter the habitat by effecting small mammal burrows. No acute rat RQs exceed the inhalation LOC of 0.1, so metam sodium applications are not expected to have an adverse effect on mammals that create burrows for the CTS. No indirect effects from reduction of prey using the rat as a surrogate for amphians/frogs are expected. Indirect effects for the terrestrial CTS were indicated by the potential for reduction in prey. The diet of the CTS includes frogs and terrestrial invertebrates. No indirect effects are expected for reduction in frogs as prey. There was no LOC exceedence using the rat as a surrogate for inhalation exposure. Risk is expected for terrestrial invertebrates from both surface and soil 18 incorporated applications of metam sodium. No data are available to estimate the risk to terrestrial invertebrates, so risk cannot be precluded. Indirect effects to the terrestrial CTS also include effects to terrestrial plants that may contribute to the alteration of habitat. There is the potential for indirect effects based on the absence of data leading to a presumption of risk for terrestrial plants for both surface and soil incorporated applications. Habitat modification for the aquatic-phase CTS is expected based on analysis of reduction in prey for fish as a surrogate for amphibians and aquatic invertebrates for surface applications, with all uses except melon exceeding the listed species LOC. The diet of the CTS for the first six weeks after hatching is composed of algae. However, no effect to algae is expected due to no LOC exceedence. Reduction in prey for the terrestrial-phase CTS includes frogs and terrestrial inveterbates. No effect is expected through inhalation for the frog using the rat as a surrogate. No RQs exceeded the LOC for any uses. An effect is expected for terrestrial invertebrates for both surface and soil incoropration application methods based on persistence in runoff and the reactivity with the nucleophilic centers as the mode of action. Habitat modification also includes effects to aquatic and terrestrial plants that may alter the water quality or structural characteristics of the environment, in addition to reduction in prey. There is the potential from exposure to MITC in runoff and off-gassing which may result in effects to aquatic and terrestrial plants. Although no LOCs were exceeded for aquatic plants, there is a habitat modification potential based on the absence of data for terrestrial plants. A summary of the risk conclusions and effects determinations for each listed species assessed here and their designated critical habitat is presented in Table 1-1 and Table 1-2, respectively. Use-specific determinations are provided in Table 1-3 and Table 1-4. Further information on the results of the effects determination is included as part of the Risk Description in Section 5.2. Given the LAA determination for the CTS (all 3 DPSs) and potential modification of designated critical habitat for CTS (all 3 DPSs), a description of the baseline status and cumulative effects for CTS is provided in Attachment 2. 19 Table 1-1. Effects determination summary for effects of MITC on the CTS (all 3 DPSs). Species Overall Effects Determination California Tiger Salamander (Ambystoma californiense) May Affect and Likely to Adversely Affect (LAA) Basis for Determination Potential for Direct Effects Aquatic phase (Eggs, Larvae, and Adults): Based on freshwater fish endpoints as surrogate for the aquatic phase CTS, for surface applications, acute MITC stressor RQs exceeded the listed species risk LOC for all uses except melon, with an RQ of 0.03; MITC stressor RQs exceeding the LOC range from 0.05 for potato to 3.62 for strawberry. Probit analysis, which suggested that the probability of an individual effect is high (the chance of an individual effect at the RQ ranged from ~ 1 in 4.18E+08 for potato to ~ 1 in 1.01 for strawberry), confirm that direct effects to aquatic phase CTS (all 3 DPSs) are likely. No fish MITC stressor RQs exceeded the chronic LOC for surface applications of metam sodium. MITC stressor RQs ranged from 0.01for potato to 0.72 for strawberry uses. No acute or chronic MITC stressor RQs exceeded the LOC for soil incorporated applications. Acute RQs ranged from <0.01for lettuce, melon, onion, row crops, tomato and turf to 0.03 for nursery and strawberry uses. Chronic RQs ranged from <0.01 for lettuce, melon, onion, potato, row crops, tomato and turf to 0.01 for nursery and strawberry uses. Terrestrial phase: Using the rat as a surrogate for the CTS, no potential for adverse direct effects is expected. No MITC stressor RQs exceed the LOC from inhalation, with RQs <0.1. The impact on survival from a reduction in mammal burrows wsa reviewed because burrows provide refuge from predation and dessication. There is no potential effect expected from the loss of mammal burrows based on no LOC exceedence. Potential for Indirect Effects Aquatic prey items, aquatic habitat, cover and/or primary productivity The diet of the aquatic CTS consists of fish, tadpoles, aquatic invertebrates and larvae and algae. The potential for indirect effects of the stressor MITC on the CTS through reductions in prey items was determined by using fish as prey and as a surrogate for amphibians (as frogs comprise part of the diet for the CTS) as prey. MITC stressor RQs for acute exposure for lettuce, row crops, strawberry and tomato uses exceeded the acute risk LOC for surface applications. MITC stressor RQs ranged from for 0.71 20 Table 1-1. Effects determination summary for effects of MITC on the CTS (all 3 DPSs). Species Overall Effects Determination Basis for Determination tomato to 3.62 for strawberry uses. As described for direct effects on aquatic-phase CTS, surface applications of metam sodium resulted in endangered species LOC exceedences for acute exposure for all uses except melon, with MITC stressor RQs ranging from 0.05 for potato to 3.62 for strawberry uses. No fish RQs exceeded the chronic LOC for any uses for surface applications of metam sodium. Strawberry uses had the highest RQ of 0.71. No fish or amphibian MITC stressor RQs exceeded the acute risk, endangered species or chronic LOC for any uses for soil incorporated applications of metam sodium. Acute MITC stressor RQs ranged from <0.01for lettuce, melon, onion, row crops, tomato and turf to 0.03 for nursery and strawberry uses. Chronic MITC stressor RQs ranged from <0.01 for lettuce, melon, onion, potato, row crops, tomato and turf to 0.01 for nursery and strawberry uses. MITC stressor RQs for Daphnia for acute exposure for lettuce, row crops, strawberry and tomato uses exceeded the acute risk LOC for surface applications. MITC stressor RQs ranged from 0.66 tomato to 3.37 for strawberry uses. Both acute and chronic strawberry LOCs for surface applications were exceeded using Daphnia as a surrogate for reduction as aquatic invertebrate prey. The endangered species LOC for aquatic invertebrates was exceeded for all uses except melon, with MITC stressor RQs ranging from 0.05 for potato uses to 3.37 for strawberry uses for surface application. The probit analysis indicates that the probability of an individual effect is high (the chance of an individual effect at the RQ ranged from ~ 1 in 4.18E+08 for potato to ~ 1 in 1.01 for strawberry). In addition the chronic MITC stressor LOC for aquatic invertebrates was exceeded only for strawberry uses for surface application. The MITC stressor RQ for strawberry uses was 1.92. No RQs exceeded the acute risk, endangered species or chronic LOC for Daphnia for soil incorporated applications of metam sodium. The diet of the CTS for the first six weeks includes nonvascular plants. No RQs exceed the plant nonlisted LOC for nonvascular plants for any uses for either soil incorporated or surface applications of metam sodium. RQs ranged from <0.01 for lettuce, melon, onion, potato, row crops, strawberry, tomato and 21 Table 1-1. Effects determination summary for effects of MITC on the CTS (all 3 DPSs). Species Overall Effects Determination Basis for Determination turf to 0.01 for nursey. Based on an analysis of full toxicity data set, monitoring data, modeled EECs, incident data, and chance of an individual effect, indirect effects on aquatic prey items for CTS (all 3 DPSs) appear likely. Terrestrial prey items, riparian habitat The diet of the terrestrial CTS includes frogs, terrestrial invertebrates, snails and worms. The rat is used as a surrogate to estimate the effect of metam sodium use on frogs. No MITC stressor RQS exceeded the endangered species inhalation LOC value of 0.1for either soil incorporated or surface applications. Risk from soil incorporated and surface applications to terrestrial invertebrates could not be calculated as the available acute toxicity endpoints were not available for the honey bee as a surrogate. Metam sodium is used as a nematocide, but has the potential to kills other terrestrial soil invertebrates. The LAA determination applies to nontarget soil invertebrates on and off the field due to the direct exposure in the soil, potential run-off and the reactivity with nucleophiliccenters as the mode of action. Terrestrial plant risk for both soil incorporated and surface application methods is presumed based on the absence of toxicity data and known herbicidal properties of MITC. Therefore, indirect effects to CTS through altering habitat are likely. Table 1-2. Effects determination summary for the Critical Habitat impact analysis. Designated Critical Habitat for: CTS (all 3 DPSs) Effects Determination Habitat Modification Basis for Determination The diet of the aquatic CTS consists of fish,aquatic invertebrates and larvae and algae. The diet of the terrestrial CTS is composed of frogs, snails, worms and terrestrial invertebrates. Habitat modification is expected for both soil incorporated and surface applications from reduction in prey for fish, amphibians, aquatic invertebrates and terrestrial invertebrates. MITC may be transported off field through runoff in which vertebrates and invertebrates may be exposed. As summarized in Table 5-2, fish acute LOCs were exceeded for surface applications of metam sodium. No fish RQs for surface applications exceeded the chronic LOC for any uses. 22 Table 1-2. Effects determination summary for the Critical Habitat impact analysis. No acute risk, endangered species or chronic fish LOCs were exceeded for any use from soil incorporated applications. Acute and chronic risk LOCs were exceeded for freshwater invertebrate prey items of the aquatic phase CTS (all 3 DPSs). Surface application RQs for lettuce (1.07), row crops (1.42), strawberry (3.37) and tomato (0.66) exceed the acute risk LOC. RQs for all uses except melon (0.03), exceed the endangered species LOC. Strawberry was the only use that resulted in a chronic LOC exceedence from surface applications for aquatic invertebrates, with an RQ of 1.92. Acute risk, endangered species and chronic LOCS were not exceeded for any uses for soil incorporated applications. Plant LOCs were not exceeded for aquatic nonvascular plants. RQs ranged from <0.001 for lettuce, melon, onion, potato, row crops, strawberry, tomato and turf to 0.01 for nursery. Metam sodium converts into MITC and is not likely to remain in the soil for long periods of time due to the half-life in soil. No data is available to estimate the effect on terrestrial inverterbrates from metam sodium surface or soil applications. However, the label indicates that nematodes are a target. The determination is based on absence of data. Based on the absence of data and mode of action, MITC as the stressor may indirectly affect the CTS (all 3 DPSs) and/or affect their designated critical habitat by reducing or changing the composition of the food supply. Habitat Modification Alteration in upland habitat due to a change in terrestrial plants between the pond and the mammal burrows. Due to a complete lack of toxicity data for terrestrial plants, applications of metam sodium are presumed to result in risks of adverse effects on terrestrial plants as well as due to fate and transport properties. MITC may be transported off field through run-off leading to seedling plant exposure. Based on the absence of data and mode of action, MITCas the stressor may indirectly affect the CTS (all 3 DPSs) and/or affect their designated critical habitat by changing the composition of the terrestrial plant community. 23 Table 1-2. Effects determination summary for the Critical Habitat impact analysis. No Habitat Modification The CTS uses mammal burrows for shelter. No change in the availability of mammal burrows is expected from MITC as the stressor from the use of metam sodium. No RQs exceed the LOC for rats indicating no potential risk to mammals. MITC stressor RQs for acute exposure for lettuce, row crops, strawberry and tomato uses exceeded the acute risk LOC for surface applications. MITC stressor RQs ranged from for 0.71 tomato to 3.62 for strawberry uses. Table 1-3. Use specific summary of the potential for adverse effects to aquatic taxa. Uses Potential for Effects to Identified Taxa Found in the Aquatic Environment Freshwater Vertebrates2 Acute Chronic Freshwater Invertebrates3 Acute Chronic Vascular Plants Nonvascular Plants No All Uses Yes No Yes Yes No 1 Uses evaluated include, lettuce, melon, nursery, onion, potato, row crops, strawberry and turf 2 A yes in this column indicates a potential for direct and indirect effects to CTS from surface applications 3 A yes in this column indicates a potential for indirect effects to CTS potential for indirect effects for the CTSCC, CTS-SC, and CTS-SB for surface applications. Table 1-4. Use specific summary of the potential for adverse effects to terrestrial taxa. Potential for Effects to Identified Taxa Found in the Terrestrial Environment Uses All Uses Small Mammals2 Acute Chronic No No Small Birds3 Acute Chronic NA6 NA6 Invertebrates4 Acute Yes Dicots5 Monocots5 Yes Yes 1 Uses evaluated include, lettuce, melon, nursery, onion, potato, row crops, strawberry and turf A yes in this column indicates a potential for direct and indirect effects to CTS-CC, CTS-SC, and CTS-SB 3 No toxicity data are available for avian inhalation to evaluate the potential for direct and indirect effects to the CTS-CC, CTS-SC, and CTS-SB 4 A yes in this column indicates a potential for indirect effects to CTS-CC, CTS-SC, and CTS-SB 5 A yes in this column indicates a potential for indirect effects to CTS-CC, CTS-SC, CTS-SB; LOC exceedances are evaluated based on the absence of data for non-listed species 6 NA indicates that no toxicity data are available for calculating the RQ. 2 Based on the conclusions of this assessment, a formal consultation with the U. S. Fish and Wildlife Service under Section 7 of the Endangered Species Act should be initiated. 24 When evaluating the significance of this risk assessment’s direct/indirect and adverse habitat modification effects determinations, it is important to note that pesticide exposures and predicted risks to the listed species and its resources (i.e., food and habitat) are not expected to be uniform across the action area. In fact, given the assumptions of downstream transport (i.e., attenuation with distance), pesticide exposure and associated risks to the species and its resources are expected to decrease with increasing distance away from the treated field or site of application. Evaluation of the implication of this non-uniform distribution of risk to the species would require information and assessment techniques that are not currently available. Examples of such information and methodology required for this type of analysis would include the following: Enhanced information on the density and distribution of CTS life stages within the action area and/or applicable designated critical habitat. This information would allow for quantitative extrapolation of the present risk assessment’s predictions of individual effects to the proportion of the population extant within geographical areas where those effects are predicted. Furthermore, such population information would allow for a more comprehensive evaluation of the significance of potential resource impairment to individuals of the assessed species. Quantitative information on prey base requirements for the assessed species. While existing information provides a preliminary picture of the types of food sources utilized by the assessed species, it does not establish minimal requirements to sustain healthy individuals at varying life stages. Such information could be used to establish biologically relevant thresholds of effects on the prey base, and ultimately establish geographical limits to those effects. This information could be used together with the density data discussed above to characterize the likelihood of adverse effects to individuals. Information on population responses of prey base organisms to the pesticide. Currently, methodologies are limited to predicting exposures and likely levels of direct mortality, growth or reproductive impairment immediately following exposure to the pesticide. The degree to which repeated exposure events and the inherent demographic characteristics of the prey population play into the extent to which prey resources may recover is not predictable. An enhanced understanding of long-term prey responses to pesticide exposure would allow for a more refined determination of the magnitude and duration of resource impairment, and together with the information described above, a more complete prediction of effects to individual species and potential modification to critical habitat. 25 2. Problem Formulation Problem formulation provides a strategic framework for the risk assessment. By identifying the important components of the problem, it focuses the assessment on the most relevant life history stages, habitat components, chemical properties, exposure routes, and endpoints. The structure of this risk assessment is based on guidance contained in U.S. EPA’s Guidance for Ecological Risk Assessment (USEPA, 1998), the Services’ Endangered Species Consultation Handbook (USFWS/NMFS, 1998) and is consistent with procedures and methodology outlined in the Overview Document (USEPA, 2004b) and reviewed by the U.S. Fish and Wildlife Service and National Marine Fisheries Service (USFWS/NMFS/NOAA, 2004). 2.1. Purpose The purpose of this endangered species assessment is to evaluate potential direct and indirect effects on individuals of the California tiger salamander (Ambystoma californiense referred to hereafter as CTS) on agricultural and non-agricultural sites arising from FIFRA regulatory actions based on metam sodium uses in agricultural and for terrestrial non-food uses. Metam sodium is used on a wide variety of crops, with major usage on potatoes, peanuts, and carrots. In this assessment, direct and indirect effects to the CTS and potential modification to designated critical habitat for the CTS are evaluated in accordance with the methods described in the Agency’s Overview Document (USEPA, 2004b). The Santa Barbara and Sonoma County Distinct Population Segments (DPS) of the California tiger salamander [CTS] (Ambystoma californiense) are listed as endangered and the central population of the CTS is listed as threatened. The Santa Barbara County DPS of the CTS was listed as endangered on September 21, 2000 (65 FR 57241). The Sonoma County DPS of the CTS was listed as endangered on March 19, 2003 (68 FR 13497). On August 4, 2004, the CTS was listed as threatened throughout its range thereby downlisting the Sonoma and Santa Barbara County DPS of the CTS from endangered to threatened (69 FR 47212). Also on this date, the U.S. Fish and Wildlife Service (USFWS) finalized the 4(d) rule, which exempts existing routine ranching activities, for this species throughout its range. On August 19, 2005, the special rule exemption for existing routine ranching activities was upheld, but the downgrading of the Santa Barbara and Sonoma County DPS was vacated. As a result, the endangered species status for the Santa Barbara and Sonoma County DPS of the CTS was reinstated. The CTS is restricted to vernal pools and seasonal ponds in grassland and oak savannah plant communities in central California. In accordance with the Overview Document, provisions of the ESA, and the Services’ Endangered Species Consultation Handbook, the assessment of effects associated with registrations of metam sodium is based on an action area. The action area is the area directly or indirectly affected by the federal action, as indicated by the exceedance of the Agency’s Levels of Concern (LOCs). It is acknowledged that the action area for a national-level FIFRA regulatory decision associated with a use of metam sodium may potentially involve numerous areas throughout the United States and its Territories. However, for the purposes of this 26 assessment, attention will be focused on relevant sections of the action area including those geographic areas associated with locations of the CTS and their designated critical habitat within the state of California. As part of the “effects determination,” one of the following three conclusions will be reached separately for each of the assessed species regarding the potential use of metam sodium in accordance with current labels: “No effect”; “May affect, but not likely to adversely affect”; or “May affect and likely to adversely affect”. Additionally, for habitat and PCEs, a “No Effect” or a “Habitat Modification” determination is made. A description of routine procedures for evaluating risk to the San Francisco Bay Species is provided in Attachment 1. 2.2. Scope The end result of the EPA pesticide registration process (i.e., the FIFRA regulatory action) is an approved product label. The label is a legal document that stipulates how and where a given pesticide may be used. Product labels (also known as end-use labels) describe the formulation type (e.g., liquid or granular), acceptable methods of application, approved use sites, and any restrictions on how applications may be conducted. Thus, the use or potential use of metam sodium, in accordance with the approved product labels for California is “the action” relevant to this ecological risk assessment. Only registered uses of the active ingredient metam sodium will be assessed. Metam sodium converts to MITC which is assessed as the stressor in this risk assessment. Although MITC is an active ingredient in EPA registered products, other registered uses of MITC will not be evaluated in this assessment. Metam sodium is a widely used fumigant on agricultural and non-agricultural sites to control nematodes, soil-borne diseases, insects and weeds. Metam sodium is used on a wide variety of crops with major usage on potatoes, peanuts, and carrots. The end use products of metam sodium are formulated as solutions and emulsifiable concentrates and convert to MITC gas via hydrolysis and soil biodegradation processes and subsequent volatilization. A memo (Appendix A) from PRD updated the Label Use Information System (LUIS) report received from the OPP’s Biolgical and Economic Analysis Division dated December 10, 2010. The following use groups for metam sodium are identified in this memo: terrestrial food, terrestrial feed, terrestrial non-food, aquatic non-food, industrial, agricultural soils, nonagricultural soils, greenhouse non-food, and outdoor residential. There are approximately 35 different products containing metam sodium in concentrations ranging from 18-42% active ingredient. 27 Terrestrial non-food uses have the highest potential for risk of concern given the exposure scenario inherent with outdoor soil fumigant applications to CTS in their habitats and its wide use compared to other uses. Please read Section 2.5 for additional details regarding other uses of metam sodium and reasoning behind selection of only terrestrial non-food uses as the basis for this risk assessment. The most sensitive endpoints from the registrant-submitted guideline studies or open-literature studies for the identified stressor of concern, MITC, are used in this risk assessment. Although current registrations of metam sodium allow for use nationwide, this ecological risk assessment and effects determination addresses currently registered uses of metam sodium in portions of the action area that are reasonably assumed to be biologically relevant to the CTS and their designated critical habitat. Further discussion of the action area for the CTS and their critical habitat is provided in Section 2.6. 2.2.1. Evaluation of Degradates MITC is the principle degradate of metam sodium applications in soil, accounting for up to 83 percent of the material balance in aerobic soil metabolism from sandy soil in Washington State. Other major degradates of metam sodium in soil were identified as methylamine, 1,3dimethylthiourea (DMTU) and 1,3 dimethylurea (DMU), methylcarbamo (dithioperoxo) thioate (MCDT), syn-N-methylthioformamide, and anti-N-methylthioformamide. Methylamine was also a major degradate of MITC. Please refer to Section 2.4 for a complete characterization on the formation and decline of these degradates. Among these major degradates, no degradates have been identified as potentially of toxicological concern compared to MITC as suggested by ECOSAR, which is an EPA Office of Chemical Safety and Pollution Prevention (OCSPP) application relying on structure-activity relationships to characterize toxicity to of a chemical to specific taxa. Please refer to Appendix B for additional clarification and justification of this conclusion. Therefore, MITC is considered the stressor of concern in this risk assessment. 2.2.2. Evaluation of Mixtures The Agency does not routinely include, in its risk assessments, an evaluation of mixtures of active ingredients, either those mixtures of multiple active ingredients in product formulations or those in the applicator’s tank. In the case of the product formulations of active ingredients (that is, a registered product containing more than one active ingredient), each active ingredient is subject to an individual risk assessment for regulatory decision regarding the active ingredient on a particular use site. If effects data are available for a formulated product containing more than one active ingredient, they may be used qualitatively or quantitatively in accordance with the Agency’s Overview Document and the Services’ Evaluation Memorandum (U.S., EPA 2004b; USFWS/NMFS 2004). Table 2-1 shows currently available labeled multiple active ingredients for metam sodium. 28 As discussed in U.S. EPA (2000), a quantitative component-based evaluation of mixture toxicity requires data of appropriate quality for each component of a mixture. In this mixture evaluation, an LD50 with associated 95% CI is needed for the formulated product. The same quality of data is also required for each component of the mixture. Given that the formulated products with multiple active ingredients for metam sodium do not have LD50 data available, it is not possible to undertake a quantitative or qualitative analysis for potential interactive effects. Table 2-1. Products containing multiple active ingredients. PRODUCT LC 50 CI (mg/kg) (mg/kg) ADJUSTED FOR ACTIVE INGREDIENT LC50 (mg/kg) CI (mg/kg) PRODUCT/TRADE NAME EPA Reg.No. % Metam Sodium Busan 1016 1448-93 18 No Data No Data No Data No Data Roo-pru super tri pak 1015-72 32.7 No Data No Data No Data No Data Rout 64898-4 32.7 No Data No Data No Data No Data 2.3. Previous Assessments The most recent risk assessment supporting the Agency’s reregistration program, “Environmental Fate and Ecological Risk Assessment for the Existing Uses of Metam-Sodium”, was completed in August 2004 (USEPA, 2004c). Based on the 2004 assessment, the major concern with metam-sodium was the exposure of terrestrial and aquatic organisms to the degradate MITC. Based on an inhalation analysis using mammal inhalation data and both monitored and modeled EECs in air for MITC, there did not appear to be an acute risk concern for wild mammals given the current application and field management practices required on the label. However, acute aquatic LOCs were exceeded for both aquatic invertebrates and fish in all modeled scenarios except potatoes. A California Red-Legged Frog (CRLF) litigation risk assessment for metam sodium pesticide applications was also completed in June, 2007 (EPA, 2007). Soil incorporated and surface application methods were evaluated for potential adverse effects on the CRLF. The assessment evaluated risk from metam sodium use based on direct effects, indirect effects (reduction in prey), habitat alteration, and critical habitat modification for the aquatic phase and terrestrialphase CRLF. This assessment made a “likely to adversely affect” (LAA) determination for direct aquatic effects based on the fish as a surrogate using the surface application method. Reduction in prey (fish and aquatic invertebrates) for the aquatic phase CRLF resulted in an LAA determination for indirect effects. A “habitat modification” determination was indicated based on the reduction in prey for fish and aquatic invertebrates. Although there was a “no effect” determination for direct effects for the terrestrial-phase CRLF, the assessment noted that the potential for indirect effects based on reductions in prey could not 29 be precluded since there was an absence of honey bee data which is conventionally used as a surrogate for terrestrial invertebrates. In addition, alteration in habitat was indicated through potential effects on terrestrial plants. The potenital for decreased prey and alteration to habitat also resulted in a “habitat modification” determination for Critical Habitat for the CRLF. The assessment resulted in a ‘no effect” determination for any uses for soil incorporated applications for direct or indirect effects. 2.4. Environmental Fate Properties Metam sodium is stable in its dry, crystalline and concentrated aqueous solution and has a distinct pungent horse-radish like odor. Metam sodium is non-volatile and readily soluble (722 g/L @ 200C) in water and degrades very rapidly to MITC in soil (soil photolysis and aerobic degradation half lives range from 23 to 63 minutes) and in water (hydrolysis half-life = 2 days at pH 7). Unlike the parent compound, MITC has a high vapor pressure (19 mm Hg at 200C) and Henry’s Law Constant of 1.79 x 10⁻⁴ atm·m3/mol, which suggests that it will be volatilized from fields treated with metam sodium in a dry environment. However, the retention time of MITC may be longer in moist soils. Table 2-2 lists the physical-chemical properties of metam sodium and MITC. Table 2-2. Physical and chemical properties of Metam Sodium and MITC. Metam Sodium Property Value and units MITC MRID or Source Value and units EPISUITE Structure EPISUITE Chemical Formula C2H4NNaS2 Tomlin, 1997 (ed.) C2H3NS Molecular Weight 129.2 g/mol 45919401 73.12 g/mol Vapor Pressure (25°C) 4.53 x 10⁻⁹ torr Henry’s Law Constant 7.7 x 10⁻¹⁶ atm·m3/mol EPISuite (MPBPVP) Calculated from Vapor Pressure/Solubility Water Solubility (pH 7, 20°C) Octanol – water partition coefficient (log KOW) MRID or Source 19 torr Tomlin, 1997 (ed.) Tomlin, 1997 (ed.) Tomlin, 1997 (ed.) 1.79 x10⁻⁴ atm·m3/mol CDPR, 2002 722,000 mg/L Tomlin, 1997 (ed.) 7,600 mg/L Tomlin, 1997 (ed.) 0.46 EPISUITE 1.30 EPISUITE Aerobic soil metabolism, photodegradation in water, and hydrolysis studies suggest that metam sodium is very unstable and degrades rapidly to MITC and other minor degradates. However, for 30 MITC, the major metabolite of metam sodium, degradation in soil and water appears to be dependent on hydrolysis and microbially-mediated degradation, and MITC appears to persist longer than metam sodium in the environment. The dissipation of MITC in aquatic and terrestrial environments appears to be predominantly dependent on volatilization and to a lesser extent on leaching and degradation. Photolytic degradation is the major dissipation route of MITC in atmosphere (half-life of 1.21 – 1.60 days). Table 2-3 and Table 2-4 list the environmental fate properties of metam sodium and MITC, respectively. The open literature has been used to fulfill many outstanding data gaps related to the environmental fate, especially for MITC. Table 2-3. Summary of metam sodium environmental fate properties. Study 3 Value and unit Abiotic Hydrolysis t ½ = 2.0 days (pH 5) t ½ = 2.0 days (pH 7) t ½ = 4.5 days (pH 9) Aqueous Photolysis t ½ = 28 minutes Soil Photolysis Degradation t1/2 in air t ½ = 63 minutes No Data Aerobic Soil Metabolism t ½ = 23 minutes Anaerobic Soil Metabolism Aerobic Aquatic Metabolism Anaerobic Aquatic Metabolism Mobility, unaged leaching, adsorption/desorption and aged leaching soil column Volatility from Soil (Laboratory) Volatility from Soil (Field) No Data Terrestrial Field Dissipation Major Degradates MITC (pH 5 and 7) Methylamine (pH 5) MCDT (pH 9) DMTU (pH 9) MITC Synmethylthioformamide Antimethylthioformamide MITC DMU - MRID # or Citation Study Classification, Comment 41631101 Acceptable 41517701 Acceptable 42978701 NA Supplemental NA 40198502 Acceptable NA NA No Data - NA NA No Data - NA NA Koc = 4.04 ml/g - EPISUIT E NA No Data 1 - NA NA No Data 1 - NA NA MITC, DMU, Methylamine, Nmethylthioformamaide 42656602 Supplemental Metam Sodium residues were not detected after application 31 Table 2-3. Summary of metam sodium environmental fate properties. Study 3 Value and unit Major Degradates MRID # or Citation Bioconcentration Factor NA No Data 2 (BCF)- Species Name 1 -9 Metam sodium has a low vapor pressure of 4.53 x 10 torr, therefore no data are necessary. 2 Metam sodium’s Log Kow < 3. therefore no data are necessary. 3 All studies used metam sodium as the test substance. 4 Dashes mean no constituents found or measured. 5 NA means not applicable. Study Classification, Comment NA Table 2-4. Summary of MITC environmental fate properties. Study 2 Value and unit Abiotic Hydrolysis t ½ = 3.5 days (pH 5) t ½ = 20.4 days (pH 7) t ½ = 4.6 days (pH 9) Aqueous Photolysis t ½ = 51.6 days Soil Photolysis - Major Degradates Methylamine (pH 5, 7, and 9) MIC5 Methyl Isocyanide5 Sulfur Dioxide5 Hydrogen Sulfide5 Carbonyl Sulfur5 Nmethylthioformamide Methylamine5 MRID # or Citation Study Classification, Comment 00158162 Acceptable CALDPR, 2002 - Geddes et al., 1995 NA NA NA Degradation t1/2 in air 1.21 – 1.60 days Aerobic Soil Metabolism 3.3 – 9.9 days - Gerstl et al., 1997 NA No Data - NA NA No Data - NA NA 21 Days - 43596501 Supplemental Kd = 0.26 ml/g (mean value) - Gerstl et al., 1977 NA Anaerobic Soil Metabolism Aerobic Aquatic Metabolism Anaerobic Aquatic Metabolism Mobility, unaged leaching, adsorption/desorption and aged leaching soil column 32 Table 2-4. Summary of MITC environmental fate properties. Study 2 Value and unit Volatility from Soil (Laboratory) No Data Volatility from Soil (Laboratory) See Table 2-5 for field volatility study descriptions and volatile flux measurements MRID # or Citation Study Classification, Comment - NA NA - 45703702 45703704 47131601 47314301 Acceptable Acceptable Acceptable Acceptable Major Degradates Visalia, CA Terrestrial Field Dissipation t ½ < 24 hours MITC residues were not detected after 7 days from California soils - 42656602 Supplemental Bioconcentration NA NA No data 1 Factor (BCF)- Species Name 1 MITC’s Log Kow < 3, therefore no data are needed. 2 All studies used MITC as the test substance except for the field dissipation study where metam sodium was used. 3 Dashes means no constituents found or measured. 4 NA means not applicable. 5 Degradates detected in field volatility from Geddes et al., 1995. Limited information regarding material balance. Hydrolysis Metam sodium degrades rapidly due to hydrolysis, especially under acid and neutral conditions. The hydrolysis of metam sodium half-lives were 2 days at pH 5 and 7, and 4.5 days at pH 9 (Table 2-4). In the hydrolysis study, the degradates identified in all test solutions were MITC, methylamine, 1,3-dimithylthiourea (DMTU) and 1,3 dimethylurea (DMU). Methylcarbamo (dithioperoxo) thioate (MCDT) was identified in the pH 9 test solutions. The major degradate formed at pH 5 and 7 was MITC (18% to 60% respectively). At pH 9, two major degradates formed, with 20 % of MITC and 16% of MCDT. The formation of methylamine was favored under acidic conditions compared to neutral or alkaline conditions. MITC is moderately persistent with hydrolysis half-lives of 3.5 days at pH 5, 20.4 days at pH 7, and 4.6 days at pH 9 (MRID 00158162). Methylamine was the main degrade of MITC identified in all pHs. One other degradate, 1,3-dimethylthiourea was isolated in the pH 9 only, comprised a maximum 22.1% of the recovered at 13.04 days post-treatment. 33 Photolysis in Water The photodegradation of metam sodium in aqueous solution is very rapid with a half-life of 28 minutes (Table 2-4). Except for syn- and anti-N-methylthioformamide, the degradates identified in the photodegradation study were also identified in the hydrolysis study. Syn- and anti- Nmethylthioformamide were at a maximum concentration of 22.3% by the end of the study interval; methylamine increased to 17.5%, MITC increased to 16%, and MCDT increased to 14.1%. The placement of metam sodium below the soil surface (except surface applications), and rapid degradation of metam sodium in soil to volatile MITC suggest that photolysis on soil would be a negligible route of degradation. Microbial Degradation In an aerobic soil metabolism study (MRID 401985-02), metam sodium degrades very rapidly in soil with a half-life of 23 minutes (Table 2-4). The majority of the residues had been volatilized: 83% of the applied as MITC; 0.2% as other organic volatiles, and 0.9% as CO2. The major nonvolatile degradate was DMU at a maximum of 0.45 ppm at 3 and 7 days. The degradation rates of MITC in soils have been reported in number of studies (Ashley et al., 1963, Smelt and Leistra, 1974, Gerstl et al, 1977, Boisteen et al., 1989). These studies generally found that MITC degradation in soil was dominated by microbial processes and followed first-order degradation kinetics. Gerstl et al. (1977) demonstrated that metam sodium breakdown to MITC was rapid and generally less than 30 minutes at moisture contents below saturation. They also reported that MITC was found to persist longer than metam sodium, with half-lives ranging from 3.3 to 9.9 days depending on soil composition. Since MITC is a volatile compound, very little information is available on the metabolites of MITC degradation in soil. Smelt et al. (1989) investigated the accelerated decomposition rates of MITC in previously metam sodium treated soil and suggested that repeated application of metam sodium induced microbial adaptation, resulting in enhanced biotransformation of MITC. Dungan and Yates (2003) reported that the microorganisms responsible for enhanced degradation of MITC specifically target the isothiocyanate functional group. Several studies (Dungan and Yates, 2003; Warton and Metthiessen, 2000; Boesten et al., 1991) attributed that pesticidal efficacy of metam sodium was compromised due to the enhanced biodegradation. Mobility The soil adsorption coefficient (Koc) of metam sodium could not be estimated from the batch equilibrium study (MRID 152844) since rapid degradation of metam sodium prevents equilibrium of metam sodium in the study to be reached. The Koc of metam sodium was estimated using the EPA’s computer model PCKOCWIN v1.66 of EPISUITE. EPI's Koc estimations are based on the Sabljic molecular connectivity method. The estimated Koc of metam sodium is 4.04 ml/goc. Metam sodium’s high water solubility (722g/L) and low Koc of 4.04 ml/goc suggest its high mobility in the environment. Gerstl et al., 1977 determined that 34 MITC also possesses a highly mobile behavior was a soil-water partition coefficient measured of 0.26 ml/g Field Dissipation A supplemental terrestrial field dissipation study (MRID 42656602) was conducted in Visalia, California, applying metam sodium to bare fallow soil at a rate of 100 gallons of formulated material (32.7% a.i) per acre through chemigation with an overhead sprinkler system. Results suggest that metam sodium degrades rapidly to MITC and DMU in the terrestrial environment and both of the degradates were detected only at soil depth of 0-6 inches except one time when MITC was detected at 6-9 inches depth. In Vasilia, California, the maximum MITC concentration was 12-22 ppm at 0-6" depth immediately after treatment and decreased to 0.070.16 ppm by day 7. The maximum concentrations of DMU were 0.09-0.29 ppm observed at 4 hours to 7 days post treatment. No MITC (<0.02 ppm) and DMU (<0.02 ppm) were detected at 7-14 days and 32-91 days respectively in post treatment soil sampling. The calculated half-lives of MITC and DMU were less than 24 hours and 7 days respectively. Several other degradates of metam sodium identified in the laboratory studies were not monitored in these field dissipation studies. However, aerobic soil metabolism study suggests that only 4% constitute nonvolatile metabolites. Volatility There have been several field volatility studies conducted with metam sodium applications throughout the California Central Valley (MRID Nos. 45703702, 45703704, 47131601, and 47314301) using field management practices and application techniques discussed in Section 2.5. In all cases, metam sodium was applied to bare soil, and MITC concentrations were measured nearby the edge of the treated field, and emissions were back-calculated scaling ISCST3 first-guess flux rate modeled concentrations as compared to the monitored concentrations. Applications in most of the studies occurred in the morning with the exception of the Brawley, CA study which took place shortly after noon. In addition, most applications took place in the late spring or summertime portion of the year except for the Helm, CA study which was conducted during the winter. Studies were conducted using application shank injections to raised beds employing water seals and soil seals in Lost Hills and Helm, CA, respectively. In addition, two other studies were conducted with surface applications which included a ground sprinkler application with subsequent water sealing in Bakersfield, CA and a flooded application in Brawley, CA. There were several others that were not considered due to various deficiciencies related to raw data submissions. These include a sprinkler and shank injection study in Bakersfield (MRID 45703701), another shank injection study in Bakersfield (MRID 47956901), a sprinkler study at Mettler (MRID 46969601), a drip chemigation study in Irvine (MRID 45703708), and an additional USDA study for sprinkler and shank injection applications at Bakersfield, CA (no MRID). 35 In general, MITC flux rates were very small throughout each study as shown in Table 2-5. The MITC peak flux rate observed of 71.7 g/m2s occurred between 12 and 16 hours after the application in the Bakersfield, CA ground sprinkler application, accounting for only 4.22 percent of the applied amount of metam sodium. Cumulative emissions of MITC from the treated fields in the studies were slightly lower for soil incorporated applications ranging between 6.38 percent of applied metam sodium in the Helm shank injection study to 15.86 percent of applied metam sodium in the Bakersfield ground sprinkler study. The low flux values are most likely due to the water sealing field management practices that were applied during the studies consistent with the label requirements. Refer to Section 2.5 for further details regarding these label requirements. Table 2-5. Description of MITC field volatility studies and volatile flux measurements. Field Volatility Cumulative Maximum Peak Flux Mass Loss Study Conc. Rate 1 (Application Time Study (lb. Rate) Applied MRID Classification (g/m3) (g/m2s) MITC/A) Bakersfield, CA Sandy Loam Sprinkler Chemigation with water seal (320 lbs. a.i./A) August 21 5:00 am Lost Hills, CA Clay Loam Shank Injection to Raised Beds with water seal (320 lbs. a.i./A) Helm, CA Sandy Loam Shank Injection to Raised Beds with soil seal (297 lbs. a.i./A) Brawley, CA Flooded Application (320 lbs. a.i./A) June 13 6:50 am 45703702 Acceptable 168 71.7 (4.22 % percent mass loss) 45703704 Acceptable 181.5 36.3 (2.39 % mass loss) February 3 9:30 am 47131601 Acceptable 374.0 17.4 (1.11 % mass loss) September 15 12:05 pm 47314301 Acceptable 843.5 68.3 (4.53 % mass loss) 50.76 through 96 hours postapplication (15.86 % mass loss) 23.85 through 96 hours postapplication (7.45 % mass loss ) 18.95 through 72 hours postapplication (6.38 % mass loss) 46.86 through 68 hours postapplication (14.64 % mass loss) 1. Peak flux rate refers to the average over ~ 4 hours as per the sampling periods in the field volatility studies. 36 Degradation in Air MITC is the major volatile transformation product of metam sodium. Once MITC is volatilized into the atmosphere, it undergoes direct photolysis. Several studies suggest that MITC is modestly persistent in the atmosphere. Geddes et al. (1995) estimated the half-live of MITC in atmosphere ranged from 29 to 39 hours. Alvarez and Moore (1994) calculated a photolysis halflife of 39 hours for noontime condition of mid summer at 40° N latitude. The half-lives of MITC measured in each of these studies indicate that MITC has some potential for transport in the atmosphere on a regional scale. Several metabolites were identified that included methyl isocyanate (MIC), methyl isocyanide, sulfur dioxide, hydrogen sulfide, carbonyl sulfur, N-methylthioformamide, and methylamine (Geddes et al.,1995). They also reported that 7% of MITC can potentially degrade to MIC. MIC is known to be very reactive and can be acutely toxic to terrestrial animals. In California, ambient air concentrations of MIC were monitored following a ground injection of metam sodium and reported concentrations were 0.09 to 2.5 ppb (0.2-5.8 g/m3) in the first 72 hours (ARB, 1997). Bioconcentration Bioaccumulation of metam sodium residues are not expected to result from agricultural uses due to its rapid degradation in soil and water. In addition, bioaccumulation due to levels of MITC in the environment is not expected due to its low Log Kow value of 1.30. 2.4.1. Environmental Transport Mechanisms Potential transport mechanisms for MITC include pesticide surface water runoff, and secondary drift of volatilized or soil-bound residues leading to deposition onto nearby or more distant ecosystems. The physicochemical properties of the pesticide that describe its potential to enter the air from water or soil (e.g., Henry’s Law constant and vapor pressure), pesticide use, modeled estimated concentrations in water and air, and available air monitoring data from the Central Valley are considered in evaluating the potential for atmospheric transport of MITC from treated areas to habitat for the CTS. The transport of MITC in the air depends on its ability to be mobilized into air and its eventual removal through wet and dry deposition of gases/particles and photochemical reactions in the atmosphere. A number of studies for various persistent organic pesticides (other than MITC) have documented atmospheric transport and redeposition of pesticides from the Central Valley to the Sierra Nevada mountains (Fellers et al., 2004, Sparling et al., 2001, LeNoir et al., 1999, and McConnell et al., 1998). Prevailing winds blow across the Central Valley eastward to the Sierra Nevada mountains, transporting airborne industrial and agricultural pollutants into Sierra Nevada ecosystems (Fellers et al., 2004, LeNoir et al., 1999, and McConnell et al., 1998). Although there have been numerous detections of MITC within the 37 Central Valley airshed, it is unlikely that MITC emissions will be transported over long distances given its half-life of of 1.21 – 1.60 days. Air contaminants with half-lives greater than 2.0 days are considered to possess a significant potential for long range transport according to the Stockholm Convention Treaty on Persistent Organic Pollutants (POPs) ratified in 2006 (EPA, 2008). However, the high solubility (7.6 g L-1) of MITC in water and low adsorption in soil (mean and median Kd of 0.26 L Kg-1) suggest that leaching to groundwater may be a potential transport pathway under flooded and saturated conditions. MITC can also potentially move to surface water through runoff under a possible worst-case scenario, that is, if an intense rainfall and/or continuous irrigation occurs right after metam sodium application. 2.4.2. Mechanism of Action Metam sodium is a dithiocarbamate that converts readily to the isothiocyanate MITC (methyl isothiocyanate) upon application to soil. The rate of decomposition depends on the type of soil, soil moisture content and temperature. MITC is the chemical responsible for much of the toxicity to both target and non-target organisms. For example, MITC is highly reactive with the nucleophilic centers such as thiol groups in vital enzymes of nematodes, which appears to be its mechanism of toxic action (Cremlyn, 1991). 2.5. Use Characterization Analysis of labeled use information is the critical first step in evaluating the federal action. The current labels for metam sodium represent the FIFRA regulatory action; therefore, labeled use and application rates specified on the label form the basis of this assessment. The assessment of use information is critical to the development of the action area and selection of appropriate modeling scenarios and inputs. The Label Use Information System (LUIS) report, received from the OPP’s Biolgical and Economic Analysis Division dated December 1, 2010 and a memo from the Registration Division and Pesticide Re-evaluation Division at the Office of Pesticide Programs dated August 12, 2010 list the following use groups for metam sodium: terrestrial food, terrestrial feed, terrestrial non-food, aquatic non-food, industrial, agricultural soils, nonagricultural soils, greenhouse non-food, and outdoor residential. The U.S. Geological Survey (USGS) pesticide use map (Figure 2-1) shows regional scale patterns in use intensity within the United States. Metam sodium is a widely used fumigant on agricultural and non-agricultural sites to control nematodes, soil-borne diseases, insects and weeds. Metam sodium is used for a wide variety of crops, with major usage for potatoes, tomatoes, and carrots. The USGS pesticide maps are based on state-level estimates of pesticide use rates for individual crops, which have been compiled by the National Center for Food and Agricultural Policy (NCFAP) for 1995-1998, and on a 2002 Census of Agriculture for county crop acreage. There are approximately 35 different products containing metam sodium in concentrations ranging from 18-42% active ingredient. 38 According to the USGS’ national pesticide usage data, an average of 50.6 million pounds of metam sodium was applied nationally to agricultural use sites in the U.S. in 2002 (Figure 2-1). Of this, about 42 % of the total applied was used for carrot fields. Tomato and potato fields represented the second (19%) and third (12%), respectively major uses for metam sodium. Metam sodium uses other than as an agricultural soil fumigant are minor composing of less than only 8 percent of the overall use pattern in California. The known labeled uses other than metam sodium as a soil fumigant include foliar use on cover crops, use in telephone poles, use within sewer lines for root control, and structural fumigation. However, inspection of each of these uses from the CALPUR data reveals that these uses account for less than 1 percent of the average annual use of metam sodium each in California. These other uses include sewer root control treatments, telephone pole treatments, and structural fumigation which all occur indoors and are not directly released to the outdoor environment. Another use of metam sodium besides soil fumigation includes treatment to cover crops which is a very minor use compared to the other crop scenarios evaluated in the risk assessment. The Agency’s Biological and Economic Analysis Division (BEAD) provided an analysis from the California’s Department of Pesticide Regulation Pesticide Use Reporting (CDPR PUR) database 1 . CDPR PUR is considered a more comprehensive source of usage data than US Department of Agriculture’s National Agricultural Statistics Service (USDA-NASS) or EPA proprietary databases, and thus the usage data reported for metam sodium by county in this California-specific assessment were generated using CDPR PUR data. Nine years (1999-2008) of usage data were included in this analysis. Data from CDPR PUR were obtained for every pesticide application made on every use site at the section level (approximately one square mile) of the public land survey system. BEAD summarized these data to the county level by site, pesticide, and unit treated. Calculating county-level usage involved summarizing across all applications made within a section and then across all sections within a county for each use site and for each pesticide. The county level usage data that were calculated include: average annual pounds applied, average annual area treated, and average and maximum application rate across all eight years. The units of area treated are also provided where available. 1 The California Department of Pesticide Regulation’s Pesticide Use Reporting database provides a census of pesticide applications in the state. See http://www.cdpr.ca.gov/docs/pur/purmain.htm. 39 Figure 2-1. Estimated Agricultural Use of Metam Sodium in U.S. in 2002. (Source:http://water.usgs.gov/nawqa/pnsp/usage/maps/show_map.php?year=97&map=m1011 ) 40 The amount of metam sodium used in California has steadily increased in recent years, from an average of 5.5 million pounds in 1990 and 1991, to nearly 15 million pounds in recent years, accounting for approximately 30 percent of the national metam sodium use. Usage data are averaged together over the years 1998 to 2008 to calculate average annual usage statistics by county and crop for metam-sodium, including pounds of active ingredient applied and base acres treated. Figure 2-2 shows the average annual usage in various counties. Highest usage (>1 million lbs. of metam sodium) was reported in Kern, Fresno, and Imperial counties. Metam sodium data from California suggest that usage for carrots appear to have the most pounds applied overall with an average of estimated 5.4 million pounds from 1998 to 2008. Figure 2-3 shows that carrots, potatoes, tomatoes, pepper, cucurbits and leafy vegetables account for over 80% of the total usage of metam sodium. The uses considered in this risk assessment represent all currently registered uses according to a review of all current labels for outdoor agricultural uses. These types of applications represent greater than 92 percent of all uses in California and are relevant to this assessment. Any reported use other than currently registered uses represent either historic uses that have been canceled, mis-reported uses, or mis-use. Historical uses, mis-reported uses, and misuse are not considered part of the federal action and, therefore, are not considered in this assessment. There are no new uses for metam sodium pending at this time. Table 2-6 presents the current uses and corresponding application rates and methods of application derived from labels for metam sodium relevant to this risk assessment. 41 Figure 2-2. Estimated agricultural use of Metam Sodium in California by County (average use between 1998 – 2008). 4.50E+06 4.00E+06 3.50E+06 Metam Sodium (lbs.) 3.00E+06 2.50E+06 2.00E+06 1.50E+06 1.00E+06 5.00E+05 K e Fr rn es n I Lo mp o e s Sa An rial nt ge a B les ar ba R ra iv er si de M e rc Sa n V e Lu en d is tu O ra bi sp o K M in on gs te rr ey Y Si olo sk iy o M u St od an oc is D lau el s Sa No r n t B e en it Sa So o n lan Jo o Sa aq nt uin a C la r Tu a Sa la n re Sa D cr ieg am o en M to Sa ade ra n Sa Ma nt teo a C ru z O ra ng e Su tte r M on o 0.00E+00 County * Counties shown represent 99.5 percent of Metam Sodium average use in California between 1998 – 2008. 42 Figure 2-3. Estimated agricultural use of Metam Sodium in California by crop (average use between 1998 – 2008). 43 Table 2-6. Metam sodium outdoor agricultural use information based on labels. Uses Formulation1 Application Method2 Leafy Vegetables Melon, Nursery, Onion, Potato, Row Crops, Strawberry, Tomato, Turf EC Surface, Soil Incoporated Metam Sodium Maximum Single Application Rate (lb a.i./A) Maximum Number of Application s per Year (#) Maximum Seasonal Application Rate (lb ai/A) Application Interval3 320 1 320 NA (days) 1 Formulation codes: EC - Emulsifiable Concentrate; G - Granular; RTU – Ready to use Chemigation through ground sprinklers, center pivot sprinklers, or drip lines as well as flooded applications and drench applications are included in surface applications. 3 Not applicable due to single application 4 NA = Not applicable 2 Metam Sodium Application Methods and Field Management Practices An understanding of the application methods for fumigants is necessary before discussion of the exposure pathways and exposure analysis method. As suggested by numerous aerobic soil metabolism, hydrolysis, and field volatility studies, metam sodium will rapidly convert to MITC which does volalilize into a gas in the soil. Due to the diffusive nature of fumigants, the application methods are very unique and different from conventional pesticides. Fumigants for outdoor use are mostly applied as pre-plant treatments either at the surface or incorporated to bare soil as a solution in most cases. One way that metam sodium is applied is through injection into the soil via a shank chisel blade attached to a tractor rig. The shank injection application technique is often applied to bedded rows on the field or applied without beds for a broadcast application, or “flat fume”, type of an application. Other soil incorporated methods include chemigation through a buried drip line. Soil fumigants can also be applied at the surface via chemigation through drip lines often applied in beds. Surface applications also include chemigation through ground sprinklers or center pivot sprinkler systems. Other surface application methods for soil fumigants include drench and flooded methods. Figure 2-4, Figure 2-5, Figure 2-6, and Figure 2-7 show a shank injection flat fume application, a shank injection bedded application, a drip chemigation application to raised beds, and an overhead chemigation application, respectively. 44 Figure 2-4. Photograph showing flat fume or broadcast shank injection application followed by tarp covering. Figure 2-5. Photograph showing shank injection application to raised beds followed by tarp covering. Figure 2-6. Photograph showing typical drip chemigation application in raised beds covered with tarps. 45 Figure 2-7. Photograph showing sprinkler chemigation application. The Reregistration Eligibility Decision (RED) issued for the soil fumigants cluster (including metam sodium) on June 3, 2009 requires certain field management practices. These include the following: The field must be soil sealed (with 3 – 6 inches of soil) or water sealed (with a minimum of a half inch of water) immediately after application. Soil temperature must not exceed 90 degrees Fahrenheit. Soil moisture must be between 60 to 80 percent of field capacity by the start of application. Tarps are generally not required but if used, they must be installed immediately after the application and remain in place covering the field for a minimum of 4 days before being punctured and removed (this may vary by label). Tarps either cover the entire field for broadcast applications, as shown in Figure 2-4 or the raised beds alone for bedded applications, as shown in Figure 2-5 and Figure 2-6. There are a variety of tarps used to reduce emissions from the fumigated field. Low density polyethylene (LDPE) and high density polyethylene (HDPE) are most commonly used for tarping methods. Recently, high barrier impermeable films [e.g., virtually impermeable film (VIF) and totally impermeable film (TIF)] are becoming more widely available on the market to reduce emissions from the fumigated field. 2.6. Assessed Species Table 2-7 provides a summary of the current distribution, habitat requirements, and life history parameters for the listed species being assessed (CTS). More detailed life-history and distribution information can be found in Attachment 3. The distribution of CTS within California is presented in Figure 2-8. There are currently three CTS Distinct Population Segments (DPSs): the Sonoma County (SC) DPS, the Santa Barbara (SB) DPS, and the Central California (CC) DPS. Each DPS is considered separately in the risk assessment as they occupy different geographic areas. The main difference in the assessment will be in the spatial analysis. The CTS-SB and CTS-SC were downlisted from 46 endangered to threatened in 2004 by the USFWS, however, the downlisting was vacated by the U.S. District Court. Therefore, the Sonoma and Santa Barbara DPSs are currently listed as endangered while the CTS-CC is listed as threatened. CTS utilize vernal pools, semi-permanent ponds, and permanent ponds, and the terrestrial environment in California. The aquatic environment is essential for breeding and reproduction and mammal burrows are also important habitat for aestivation. Table 2-7. Summary of current distribution, habitat requirements, and life history information for the CTS. Assessed Species Size Current Range Habitat Type Designated Critical Habitat? Reproductive Cycle Diet California Tiger Salamander (CTS) (Ambystom a californiens e) 50 g CTS-SC are primarily found on the Santa Rosa Plain in Sonoma County. CTS-CC occupies the Bay Area (central and southern Alameda, Santa Clara, western Stanislaus, western Merced, and the majority of San Benito Counties), Central Valley (Yolo, Sacramento, Solano, eastern Contra Costa, northeast Alameda, San Joaquin, Stanislaus, Merced, and northwestern Madera Counties), southern San Joaquin Valley (portions of Madera, central Fresno, and northern Tulare and Kings Counties), and the Central Coast Range (southern Santa Cruz, Monterey, northern San Luis Obispo, and portions of western San Benito, Fresno, and Kern Counties). CTS-SB are found in Santa Barbara County Freshwater pools or ponds (natural or man-made, vernal pools, ranch stock ponds, other fishless ponds); Grassland or oak savannah communities, in low foothill regions; Small mammal burrows Yes Emerge from burrows and breed: fall and winter rains Eggs: laid in pond Dec. – Feb., hatch: after 10 to 14 days Larval stage: 3-6 months, until the ponds dry out, metamorphose late spring or early summer, migrate to small mammal burrows Aquatic Phase: algae, snails, zooplankton, small crustaceans, and aquatic larvae and invertebrates, smaller tadpoles of Pacific tree frogs, CRLF, toads; Terrestrial Phase: terrestrial invertebrates, insects, frogs, and worms 1 For more detailed information on the distribution, habitat requirements, and life history information of the assessed listed species, see Attachment 2. 47 Figure 2-8. California tiger salamander critical habitat and occurrence sections identified in Case No. 07-2794-JCS. 48 2.7. Designated Critical Habitat Critical habitat has been designated for the CTS. Risk to critical habitat is evaluated separately from risk to effects on the species. ‘Critical habitat’ is defined in the ESA as the geographic area occupied by the species at the time of the listing where the physical and biological features necessary for the conservation of the species exist, and there is a need for special management to protect the listed species. It may also include areas outside the occupied area at the time of listing if such areas are ‘essential to the conservation of the species. Critical habitat designations identify, to the extent known using the best scientific and commercial data available, habitat areas that provide essential life cycle needs of the species or areas that contain certain primary constituent elements (PCEs) (as defined in 50 CFR 414.12(b). Table 2-8 describes the PCEs for the critical habitats designated for the CTS. Table 2-8. Designated critical habitat PCEs for the CTS.. Species California tiger salamander PCEs Reference Standing bodies of fresh water, including natural and man-made (e.g., FR Vol. 69 No. stock) ponds, vernal pools, and dune ponds, and other ephemeral or 226 CTS, 68584, permanent water bodies that typically become inundated during winter rains 2004 and hold water for a sufficient length of time (i.e., 12 weeks) necessary for the species to complete the aquatic (egg and larval) portion of its life cycle2 Barrier-free uplands adjacent to breeding ponds that contain small mammal burrows. Small mammals are essential in creating the underground habitat that juvenile and adult California tiger salamanders depend upon for food, shelter, and protection from the elements and predation Upland areas between breeding locations (PCE 1) and areas with small mammal burrows (PCE 2) that allow for dispersal among such sites 1 These PCEs are in addition to more general requirements for habitat areas that provide essential life cycle needs of the species such as, space for individual and population growth and for normal behavior; food, water, air, light, minerals, or other nutritional or physiological requirements; cover or shelter; sites for breeding, reproduction, rearing (or development) of offspring; and habitats that are protected from disturbance or are representative of the historic geographical and ecological distributions of a species. 2 PCEs that are abiotic, including, physical-chemical water quality parameters such as salinity, pH, and hardness are not evaluated because these processes are not biologically mediated and, therefore, are not relevant to the endpoints included in this assessment. More detail on the designated critical habitat applicable to this assessment can be found in Attachment 2. Activities that may destroy or adversely modify critical habitat are those that alter the PCEs and jeopardize the continued existence of the species. Evaluation of actions related to use of metam sodium that may alter the PCEs of the designated critical habitat for the CTS form the basis of the critical habitat impact analysis. As previously noted in Section 2.1, the Agency believes that the analysis of direct and indirect effects to listed species provides the basis for an analysis of potential effects on the designated critical habitat. Because MITC is expected to directly impact living organisms within the action area, critical habitat analysis for metam sodium use is limited in a practical sense to those PCEs of critical habitat that are biological or that can be reasonably linked to biologically mediated processes. 49 2.8. Action Area and LAA Effects Determination Area 2.8.1. Action Area The action area is used to identify areas that could be affected by the Federal action. The Federal action is the authorization or registration of pesticide use or uses as described on the label(s) of pesticide products containing a particular active ingredient. The action area is defined by the Endangered Species Act as, “all areas to be affected directly or indirectly by the Federal action and not merely the immediate are involved in the action” (50 CFR §402.2). Based on an analysis of the Federal action, the action area is defined by the actual and potential use of the pesticide and areas where that use could result in effects. Specific measures of ecological effect for the assessed species that define the action area include any direct and indirect toxic effect to the assessed species and any potential modification of its critical habitat, including reduction in survival, growth, and fecundity as well as the full suite of sublethal effects available in the effects literature. It is recognized that the overall action area for the national registration of metam sodium is likely to encompass considerable portions of the United States based on the large array of agricultural and non-agricultural uses. However, the scope of this assessment limits consideration of the overall action area to those portions that may be applicable to the protection of the CTS and their designated critical habitat within the state of California. For this assessment, the entire state of California is considered the action area. The purpose of defining the action area as the entire state of California is to ensure that the initial area of consideration encompasses all areas where the pesticide may be used now and in the future, including the potential for off-site transport via spray drift and downstream dilution that could influence the San Francisco Bay Species. Additionally, the concept of a state-wide action area takes into account the potential for direct and indirect effects and any potential modification to critical habitat based on ecological effect measures associated with reduction in survival, growth, and reproduction, as well as the full suite of sublethal effects available in the effects literature. It is important to note that the state-wide action area does not imply that direct and/or indirect effects and/or critical habitat modification are expected to or are likely to occur over the full extent of the action area, but rather to identify all areas that may potentially be affected by the action. The Agency uses more rigorous analysis including consideration of available land cover data, toxicity data, and exposure information to determine areas where CTS and designated critical habitat may be affected or modified via endpoints associated with reduced survival, growth, or reproduction. 2.8.2. LAA Effects Determination Area A stepwise approach is used to define the Likely to Adversely Affect (LAA) Effects Determination Area. An LAA effects determination applies to those areas where it is expected that the pesticide’s use will directly or indirectly affect the species and/or modify its designated critical habitat using EFED’s standard assessment procedures (see Attachment 1) and effects endpoints related to survival, growth, and reproduction. This is the area where the “Potential Area of LAA Effects” (initial area of concern + drift distance or downstream dilution distance) 50 overlaps with the range and/or designated critical habitat for the species being assessed. If there is no overlap between the potential area of LAA effects and the habitat or occurrence areas, a no effect determination is made. The first step in defining the LAA Effects Determination Area is to understand the federal action. The federal action is defined by the currently labeled uses for metam sodium. An analysis of labeled uses and review of available product labels was completed. Some of the currently labeled uses are special local needs (SLN) uses not specified for use in California or are restricted to specific states and are excluded from this assessment. In addition, a distinction has been made between food use crops and those that are non-food/nonagricultural uses. For those uses relevant to the assessed species, the analysis indicates that, for metam sodium, the following agricultural uses are considered as part of the federal action evaluated in this assessment: Leafy Vegetables (e.g., lettuce) Melon Nursery Onion Potato Row Crops (e.g. carrots) Strawberry Tomato In addition, the following non-food and non-agricultural uses are considered: Turf Following a determination of the assessed uses, an evaluation of the potential “footprint” of metam sodium use patterns (i.e., the area where pesticide application may occur) is determined. This “footprint” represents the initial area of concern, based on an analysis of available land cover data for the state of California. The initial area of concern is defined as all land cover types and the stream reaches within the land cover areas that represent the labeled uses described above. For metam sodium, these land cover types include cultivated (e.g., lettuce, melon, nursery, onion, row crops, strawberry, tomato, and potato), orchard/vineyard (for pre-plant treatments), developed open space (bare ground and golf course applications), low/medium/high developed (e.g., turf). A map representing all the land cover types that make up the initial area of concern for metam sodium is presented in Figure 2-9. 51 Figure 2-9. Initial area of concern, or “footprint” of potential use, for metam sodium. Metam-sodium Potential Use Sites 52 Once the initial area of concern is defined, the next step is to define the potential boundaries of the Potential Area of LAA Effects by determining the extent of offsite transport via runoff where exposure of one or more taxonomic groups to the pesticide will result in exceedances of the listed species LOCs. An evaluation of usage information was conducted to determine the area where use of metam sodium may impact the assessed species. This analysis is used to characterize where predicted exposures are most likely to occur, but does not preclude use in other portions of the action area. A more detailed review of the county-level use information was also completed. These data suggest that metam sodium have historically been used on a wide variety of agricultural and non-agricultural uses. 2.9. Assessment Endpoints and Measures of Ecological Effect 2.9.1. Assessment Endpoits A complete discussion of all the toxicity data available for this risk assessment, including resulting measures of ecological effect selected for each taxonomic group of concern, is included in Section 3 of this document. Table 2-9 identifies the taxa used to assess the potential for direct and indirect effects of MITC on the CTS. The specific assessment endpoints used to assess the potential direct and indirect effects to CTS are provided in Table 2-10. For more information on the assessment endpoints, see Attachment 1. Table 2-9. Taxa used in the analyses of direct and indirect effects for the CTS. Listed Species California tiger salamander Birds Mammals Direct Direct Terr. Plants Indirect (habitat) Terr. Inverts. Indirect (prey) FW Fish Direct FW Inverts. Indirect (prey) Aquatic Plants Indirect (food/ habitat) Indirect Indirect (prey/ (prey) habitat) Abbreviations: n/a = Not applicable; Terr. = Terrestrial; Invert. = Invertebrate; FW = Freshwater 53 Table 2-10. Taxa and assessment endpoints used to evaluate the potential for MITC to result in direct and indirect effects to the CTS or modification of their critical habitat. Taxa Used to Assess Direct and Indirect Effects to CTS and/or Modification to Critical Habitat 1. Freshwater Fish and Aquatic phase Amphibians Assessed Listed Species Assessment Endpoints Direct Effect – - California Tiger Salamander Survival, growth, and reproduction of individuals via direct effects 2. Freshwater Invertebrates Indirect Effect (prey) - CA Tiger Salamander Survival, growth, and reproduction of individuals or modification of critical habitat/habitat via indirect effects on aquatic prey food supply (i.e., freshwater invertebrates) 5. Aquatic Plants (freshwater/marine) Indirect Effect (food/habitat) - CA Tiger Salamander Survival, growth, and reproduction of individuals or modification of critical habitat/habitat via indirect effects on habitat, cover, food supply, and/or primary productivity (i.e., aquatic plant community) 6. Birds/Mammals Direct Effect - CA Tiger Salamander Survival, growth, and reproduction of individuals via direct effects Survival, growth, and reproduction of individuals or modification of critical habitat/habitat via indirect effects on terrestrial prey (mammals) 7. Mammals Indirect Effect (prey/habitat from burrows/rearing sites) - CA Tiger Salamander Survival, growth, and reproduction of individuals via direct effects Survival, growth, and reproduction of individuals or modification of critical habitat/habitat via indirect effects on terrestrial prey (mammals) and/or burrows/rearing sites 54 Measures of Ecological Effects 1a. Most sensitive fish acute LC50 (MRID 45919420): Rainbow Trout LC50 = 51.2 µg ai/L 1b. Most sensitive fish chronic NOAEC : None available 1c. Most sensitive fish early-life stage NOAEC (guideline or ECOTOX): None available 2a. Most sensitive freshwater invertebrate EC50 (MRID418193-02): Water flea EC50 = 55 µg ai/L 2b. Most sensitive freshwater invertebrate chronic NOAEC: None available 5a. Vascular plant acute EC50 (MRID 459194-21): Duckweed EC50 = 590 µg ai/L 5b. Non-vascular plant acute EC50 (MRID 44588903): Algae EC50 =254 µg ai/L 6a. Most sensitive mammal, bird or terrestrial-phase amphibian acute LC50: Acute Rat Inhalation LC50=0.54 mg ai/kg 6b. Most sensitive bird or terrestrial-phase amphibian chronic NOAEC: None available 7a. Most sensitive laboratory mammalian acute LC50 (MRID 0015523): Acute Rat Inhalation LC50 = 0.54 mg ai/kg 7b. Most sensitive laboratory mammalian chronic NOAEC : Table 2-10. Taxa and assessment endpoints used to evaluate the potential for MITC to result in direct and indirect effects to the CTS or modification of their critical habitat. Taxa Used to Assess Direct and Indirect Effects to CTS and/or Modification to Critical Habitat Assessed Listed Species Assessment Endpoints 8. Terrestrial Invertebrates Indirect Effect (prey) - CA Tiger Salamander 9. Terrestrial Plants Indirect Effect (food/habitat) (non-obligate relationship) - CA Tiger Salamander Survival, growth, and reproduction of individuals via direct effects Survival, growth, and reproduction of individuals or modification of critical habitat/habitat via indirect effects on terrestrial prey (terrestrial invertebrates) Survival, growth, and reproduction of individuals or modification of critical habitat/habitat via indirect effects on food and habitat (i.e., riparian and upland vegetation) Measures of Ecological Effects None available 8a. Most sensitive terrestrial invertebrate acute EC50 or LC50: None available 8b. Most sensitive terrestrial invertebrate chronic NOAEC (guideline or ECOTOX): None available 9a. Distribution of seedling emergence EC25 for monocots: None available 9b. Distribution of seedling emergence EC25 for dicots: None available Abbreviations: SF=San Francisco *The most sensitive fish species across freshwater environments is used to assess effects for this species because they may be found in freshwater environments. **Birds are usually used as a surrogate for terrestrial-phase amphibians and reptiles. However, no bird data are available, therefore rat data are used in the assessment. 2.9.2. Assessment Endpoints for Designated Critical Habitat As previously discussed, designated critical habitat is assessed to evaluate actions related to the use of metam sodium that may alter the PCEs of the assessed species’ designated critical habitat. PCEs for the assessed species were previously described in Section 2-6. Actions that may modify critical habitat are those that alter the PCEs and jeopardize the continued existence of the assessed species. Therefore, these actions are identified as assessment endpoints. It should be noted that evaluation of PCEs as assessment endpoints is limited to those of a biological nature (i.e., the biological resource requirements for the listed species associated with the critical habitat) and those for which MITC effects data are available. Assessment endpoints used to evaluate potential for direct and indirect effects are equivalent to the assessment endpoints used to evaluate potential effects to designated critical habitat. If a potential for direct or indirect effects is found, then there is also a potential for effects to critical habitat. Some components of these PCEs are associated with physical abiotic features (e.g., presence and/or depth of a water body, or distance between two sites), which are not expected to be measurably altered by use of pesticides. 55 2.10. Conceptual Model 2.10.1. Risk Hypotheses Risk hypotheses are specific assumptions about potential adverse effects (i.e., changes in assessment endpoints) and may be based on theory and logic, empirical data, mathematical models, or probability models (USEPA, 1998). For this assessment, the risk is stressor-linked, where the stressor is the release of MITC from metam sodium applications to the environment. The following risk hypotheses are presumed in this assessment: The labeled use of metam sodium within the action area may: directly affect CTS by causing mortality or by adversely affecting growth or fecundity; indirectly affect CTS and/or modify their designated critical habitat by reducing or changing the composition of food supply; indirectly affect CTS and/or modify their designated critical habitat by reducing or changing the composition of the aquatic plant community in the species’ current range, thus affecting primary productivity and/or cover; indirectly affect CTS and/or modify their designated critical habitat by reducing shelter provided by mammal burrowsor changing the composition of the the plant community in the species’ current range; indirectly affect CTS and/or modify their designated critical habitat by reducing or changing aquatic habitat in their current range (via modification of water quality parameters, habitat morphology, and/or sedimentation). 2.10.2. Diagram The conceptual model is a graphic representation of the structure of the risk assessment. It specifies the MITC release mechanisms, biological receptor types, and effects endpoints of potential concern. The conceptual models for CTS and the conceptual models for the aquatic and terrestrial PCE components of critical habitat are shown in Figure 2-10 and Figure 2-11, respectively. Although the conceptual models for direct/indirect effects and modification of designated critical habitat PCEs are shown on the same diagrams, the potential for direct/indirect effects and modification of PCEs will be evaluated separately in this assessment. Exposure routes shown in dashed lines are not quantitatively considered because the contribution of those potential exposure routes to potential risks to CTS and modification to designated critical habitat is expected to be negligible. Due to MITC’s high mobility and solubility, leaching to groundwater is possible in small amounts. MITC concentrations in ground and irrigation water are expected to be lower than those in surface water. In addition, given MITC’s volatile properties, terrestrial organisms may be exposed due to exposure to MITC gas in the air. Furthermore, environmental transport on a regional scale for agricultural emissions of MITC is possible given that MITC’s half-life in air is not much less than 2 days. Spray drift associated with metam sodium applications is negligible. Soil incorporated applications do not involve spray through an air space. In addition, the ground application methods for metam sodium are 56 not of concern for spray drift given the downward orientation of spray nozzles as verified by Spray Drift Task Force studies regarding sprinkler system nozzles (SDTF, 1997). Direct CTS dietary exposure to metam sodium residues are not expected since metam sodium is expected to be unstable in the environment, and exposure to MITC is expected to be low given the typical plant-back interval of 20 days for metam sodium applications. Indirect dietary exposure from CTS prey is not expected either do to the low potential for MITC to bioaccumulate due to its expected gaseous state and its low octanol-water partion coefficient. Figure 2-10. Conceptual Model Depicting Stressors, Exposure Pathways, and Potential Effects to Aquatic Organisms from the effects of MITC from metam sodium applications. (Dotted lines indicate exposure pathways that have a low likelihood of contributing to ecological risk) MITC pre-plant soil fumigation from metam sodium applied to leafy vegetables, melon, nursery, onion, potato, row crops, strawberry, tomato and turf Stressor Source Spray drift Exposure Media Runoff Surface water/ Sediment Uptake/gills or integument Uptake/cell, roots, leaves Aquatic Animals Invertebrates Vertebrates Aquatic animals Invertebrates Vertebrates **Piscivorous mammals and birds Attribute Individual organisms Change Reduced survival Reduced growth Reduced reproduction Atmospheric transport Wet/dry deposition Uptake/gills or integument Receptors Leaching to Groundwater Soil Ingestion Riparian plants terrestrial exposure pathways see Figure 2-11 Aquatic Plants Non-vascular Vascular Ingestion Food chain Reduction in algae and vascular plants Reduction in prey Modification of PCEs related to prey availability Habitat integrity Reduction in primary productivity Reduced cover Community change Modification of PCEs related to habitat ** Route of exposure includes only ingestion of fish and aquatic invertebrates 57 Figure 2-11. Conceptual Model Depicting Stressors, Exposure Pathways, and Potential Effects to Terrestrial Organisms from the effects of MITC from metam sodium applications. (Dotted lines indicate exposure pathways that have a low likelihood of contributing to ecological risk) MITC pre-plant soil fumigation from Metam Sodium applied to leafy vegetables, melon, nursery, onion, potato, row crops, strawberry, tomato and turf Stressor Source Direct application Exposure Media & Receptors Off-gassing Inhalation Leaching to Irrigation Groundwater water Dermal uptake/Ingestion Inhalation Terrestrial plants Terrestrial grasses/forbs, fruit, seeds (trees, shrubs) inverts Runoff Atmospheric transport Soil Root uptake/contact Wet/dry deposition Ingestion Ingestion Ingestion Ingestion Terrestrial Vertebrates Terrestrial vertebrates Attribute Change Individual organisms Reduced survival Reduced growth Food chain Reduction in prey and food Modification of PCEs related to prey availability 58 Habitat integrity Reduction in primary productivity Reduced cover Community change Modification of PCEs related to habitat 2.11. Analysis Plan In order to address the risk hypothesis, the potential for direct and indirect effects to the assessed species, prey items, and habitat is estimated based on a taxon-level approach. In the following sections, the use, environmental fate, and ecological effects from metam sodium applications to pre-plant treated fields and subsequent exposure to MITC as the stressor of concern are characterized and integrated to assess the risks. New labels were stamped April 2010 and that label language will be incorporated into this assessment. Additional label changes are expected to be approved in 2011 but those changes address issues related to human health and are not expected to impact this assessment. The toxicity data for the aquatic-phase CTS will incorporate the freshwater fish as a surrogate for direct and indirect effects and Daphnia as a surrogate for indirect dietary effects. Indirect effects to habitat will be compared to estimated environmental concentrations (EECs) from PRZM/EXAMS. Due to the applications of metam sodium on bare ground surfaces and within the soil, related MITC exposure is expected in aquatic water bodies from translocation in the form of gas-phase diffusion and dissolved MITC gases in runoff. PRZM/EXAMS will be used to arrive at surface water EECs. Exposure concentrations will be estimated using the maximum label rate of 320 lb a.i./A, physical chemical properties, and MITC biotic and abiotic degradation rates. The PRZM volatility routine will also be utilized to account for MITC loss from fields after applications. In addition, field management practices such as water sealing and irrigation practices after applications and resulting incorporation of the metam sodium are taken into account. The labels allow tarped and untarped uses, but estimates of risk will be evaluated using a non-tarped scenario which is more conservative (i.e., results in higher EECs). However, additional characterization will be provided for the potential impacts on EECs and risk from broadcast tarp coverings on the field. Since MITC in the soil is expected to biodegradade, a minimum reduction factor can be applied to EECs using the rate constant derived from the aerobic soil metabolism study and the required minimum amount of four days that is required for a tarp to remain on the field. For aerobic soil metabolism, the following reaction rate equation for first-order degradation can be used to estimate the reduction factor of MITC loadings after 4 days: MITC t e kt MITC 0 where [MITC ]t represents the concentration or loading of MITC after 4 days, [MITC]0 represents the initial concentration or loading of MITC, t is the time period of interest (4 days), and k is the rate constant which is equal to the following equation for first-order degradation: ln 2 k half life The application of the computed reduction factor in loadings to aquatic EECs is considered conservative since application dates are not modified in this exercise. Therefore, additional contributions to aquatic EECs due to runoff which would normally not occur under broadcast applied tarps are not considered. Loss through volatilization through tarps is expected to be minimal and is therefore not considered. This characterization is provided in Section 5.2.1.a. 59 One expected route of MITC exposure for terrestrial organisms is from inhalation in air, and the SCREEN3 model is used to arrive at inhalation EECs for birds, mammals and terrestrial plants. The routine models used to estimate dietary risk will not be used because no dietary exposure is expected. The routine model to estimate terrestrial plant effects in the CTS habitat will not be used because no terrestrial plant toxicity data are available. Due to the absence of amphibian toxicity data, data from bird studies would routinely be used to assess the effects of MITC to amphibians. However, no avian inhalation data are available and insufficient data are available to convert the rat data into an estimate for the bird. Therefore rat inhalation data will be used to address direct and indirect reduction in prey effects in this assessment. Another route of exposure which exists for the terrestrial-phase CTS and its prey is dermal contact and inhalation in the soil media. Dermal contact with MITC may occur on and off the treated field in soil, and inhalation may occur in burrows used for shelter by the CTS. At this time, there is no model currently implemented to evaluate dermal and inhalation exposures in the soil. Regarding runoff and erosion of MITC from treated sites, the PRZM model is used to evaluate a high end exposure scenario. The integration between exposure and toxicity is accomplished using a risk quotient (ratio of exposure concentration to effects concentration) approach to quantitatively determine risk. Although risk is often defined as the likelihood and magnitude of adverse ecological effects, the risk quotient-based approach does not provide a quantitative estimate of likelihood and/or magnitude of an adverse effect. However, as outlined in the Overview Document (USEPA, 2004b), the likelihood of effects to individual organisms from particular uses of metam sodium is estimated using the probit dose-response slope and either the level of concern (discussed below) or actual calculated risk quotient value. Descriptions of routine procedures for evaluating risk to the San Francisco Bay Species are provided in Attachment 1. 2.11.1. Measures of Exposure Although metam sodium is the active ingredient applied to soil, CTS exposure to MITC is only considered in this risk assessment since MITC is the principle degradate of metam sodium and metam sodium is rapidly converted to MITC. Measures of exposure of MITC to the aquaticphase and terrestrial-phase CTS are derived from the utilization of fate and transport models for soil and surface water media and soil, air, and ground water media, respectively. Sections 2.11.1.a and 2.11.1.b describe the exposure estimation methodology in surface water and soil for the aquatic-phase CTS and soil, air, and ground water for the terrestrial-phase CTS. 2.11.1.a. Estimating Exposure in the Aquatic Environment PRZM (v3.12.2, May 2005) and EXAMS (v2.98.4.6, April 2005) are screening simulation models coupled with the input shell pe5.pl (Aug 2007) to generate daily exposures and 1-in-10 year EECs of MITC that may occur in surface water bodies adjacent to application sites receiving MITC through runoff. PRZM simulates pesticide application, movement and transformation on an agricultural field and the resultant pesticide loadings to a receiving water body via runoff, erosion and spray drift. EXAMS simulates the fate of the pesticide and 60 resulting concentrations in the water body. The standard scenario used for ecological pesticide assessments assumes application to a 10-hectare agricultural field that drains into an adjacent 1hectare water body, 2-meters deep (20,000 m3 volume) with no outlet. PRZM/EXAMS was used to estimate screening-level exposure of aquatic organisms to MITC. The measure of exposure for aquatic species is the 1-in-10 year return peak or rolling mean concentration. The 1-in-10 year peak is used for estimating acute exposures of direct effects to the aquatic phase CTS, as well as indirect effects to the CTS through effects to potential prey items and the food chain, including: algae and aquatic invertebrates. The 1-in-10-year 60-day mean is used for assessing chronic exposure to the aquatic phase CTS; the 1-in-10-year 21-day mean is used for assessing chronic exposure for aquatic invertebrates, which are the chief prey items of the aquatic phase CTS. The standard scenario used in this assessment assumes standardized “geometry” (field size, pond depth and size, etc), and the soil, hydrogeologic, meteorological conditions, and agronomic practices utilized data specific to the crop and location being modeled. Therefore the scenarios for use in this assessment may not represent the highest exposure sites for MITC outside of California. This analysis is presented in Section 3.1.1. The downstream extent of MITC that exceeds the LOC for the effects determination is also considered and is presented in Section 5.2.3 and Appendix K. 2.11.1.b. Estimating Exposure in the Terrestrial Environment No dietary exposure is expected for metam sodium or MITC to wildlife given the current uses of metam sodium as a pre-plant soil fumigant, rapid formation of metam sodium to MITC, and rapid diffusion of MITC. It is expected that exposure to plants can occur either from exposure to airborne MITC gases or runoff of soluble MITC gas. However, there is no plant toxicity that addresses either exposure route. Therefore the T-REX and T-HERPS models will not be used. For modeling purposes, direct exposures of the CTS to MITC through inhalation are estimated using the EECs from SCREEN3. Although birds are usually used as surrogates for the terrestrial-phase CTS, no bird inhalation data are available. Therefore, rat inhalation data will be used to determine the effect of MITC on the terrestrial phase CTS. However, amphibians are poikilotherms (body temperature varies with environmental temperature) while birds/mammals are homeotherms (temperature is regulated, constant, and largely independent of environmental temperatures). Therefore, amphibians tend to have much lower metabolic rates than birds or mammals. The use of mammal inhalation allometric equation as a surrogate for amphibians is likely to result in an over-estimation of exposure and risk for reptiles and terrestrial-phase amphibians. The SCREEN3 atmospheric dispersion model (version 96043) from the EPA Office of Air Quality Planning and Standards provides an estimate for inhalation intake from airborne MITC vapors (USEPA, 1995). SCREEN3 is the same model as the screening version of the ISCST3 model used in the CRLF risk assessment for metam sodium. The maximum peak flux rate, or MITC emissions per unit area, measured from field volatility studies is used in tandem with worst-case meteorological conditions (light winds with air stangnation) to arrive at a worst-case air EEC. The air exposure analysis is presented in Section 3.2.1. For further details about the SCREEN3 model, please refer to Appendix F. 61 Ground water contamination given MITC’s mobile and soluble properties may also affect the terrestrial-phase CTS. Therefore, ground water EECs are calculated using the SCIGROW model (v2.3, Jul. 29, 2003). SCIGROW is a screening model which incorporates a pesticide’s maximum application rate, number of application per year, aerobic soil metabolism half-life, and soil-water partition coefficient to estimate ground water EECs. Another degree of conservatism is added to this assessment through utilizing SCIGROW since loss from volatility is not taken into account. The ground water exposure analysis is presented in Section 3.1.2. In addition, terrestrial-phase CTS dermal and inhalation exposure to MITC may occur off-site from translocated MITC via runoff and erosion. A worst-case runoff scenario was identified from the PRZM crop scenarios selected in in Section 3.1.1. The pesticide mass in runoff water and erosion was determined as an indicator of the exposure level that can be bioavailable to burrowing terrestrial-phase CTS off of the treated field. This is described in the risk characterization section (Section 5.2.1.b). 62 2.11.2. Measures of Effect Data identified in Section 4 are used as measures of effect for direct and indirect effects. Data were obtained from registrant submitted studies or from literature studies identified by ECOTOX. More information on the ECOTOXicology (ECOTOX) database and how toxicological data are used in EPA’s ecological risk assessments is available in Attachment 1. 2.11.3. Integration of Exposure and Effects Risk characterization is the integration of exposure and ecological effects characterization to determine the potential ecological risk from agricultural uses of metam sodium, and the likelihood of direct and indirect effects to the assessed species in aquatic and terrestrial habitats. The exposure and toxicity effects data are integrated in order to evaluate the risks of adverse ecological effects on non-target species. The risk quotient (RQ) method is used to compare exposure and measured toxicity values. EECs are divided by acute and chronic toxicity values. The resulting RQs are then compared to the Agency’s levels of concern (LOCs) (USEPA, 2004b) (see Appendix C). More information on standard assessment procedures is available in Attachment 1. 2.11.4. Data Gaps There are many data gaps in the environmental fate database for both metam sodium and MITC. Much of the environmental fate data used as the basis for this risk assessment were retrieved from open literature sources to address these data gaps or unresolvable issues which arose in supplemental studies submitted by the registrant. The most notable data gaps include the lack of an aerobic aquatic metabolism study for MITC necessary to support the assessment for the aquatic-phase CTS. In addition, there are several use patterns that were not addressed in field volatility studies that are not available in California which are necessary to support the assessment for the terrestrial-phase CTS. Therefore, these studies were not considered in the risk assessment. Field volatility data are not available in California for broadcast shank injection or drench applications. A field volatility study was submitted for drip irrigation applications in California but the Agency has not received a full submittal of raw data for this study. There are no field volatility data for center pivot applications available at this time. In addition, there are no field volatility data accompanied with tarped applications. Please see Section 6.1.5 for further details regarding these data gaps and the justification for how these use patterns are accounted in the existing analysis plan. Ecological effects data gaps were also identified for metam sodium and MITC in this assessment. Although estuarine/marine toxicity tests were identified as data gaps in the RED, those studies will not be necessary for the CTS assessment because the CTS inhabits a freshwater environment. No studies of acute or chronic exposure effects on amphibians were identified in the open literature. Therefore, toxicity data on acute fish (which serve as surrogate species for aquatic phase amphibians) would routinely be used to estimate direct and indirect effects to CTS (all 3 DPSs). No chronic toxicity data for fish are available. Toxicity data on birds are usually used to estimate direct effects on amphibians; however no inhalation data for birds is 63 available. Rat inhalation data are available to estimate direct and indirect effects on the CTS from the use of metam sodium. Indirect terrestrial dietary effects would usually be estimated from the honey bee study as a surrogate for other terrestrial invertebrates. Several aquatic plant studies have been reviewed, but the RED requested freshwater studies including the Selenastrum capricornutum (a unicellular algae), Anabaena flos-aquae (a freshwater Blue-Green bacterium), and Navicula pelliculosa (a freshwater pinnate diatom). The waiver submitted for the terrestrial plant studies was denied, and the data gap for these studies remains. 64 3. Exposure Assessment The only registered form of metam is an emulsifiable concentrate. Metam sodium is applied before planting to bare soil. Broadcast surface applications include flooded, drench, and chemigation techniques using ground sprinklers or center pivot sprinklers. Raised bedded surface applications include drip chemigation. Soil incorporated applications include broadcast or raised bedded shank injection, or chemigation through drip lines. Various label amendments and mitigations were implemented for metam sodium registered uses as a result of the reregistration process. The Reregistration Eligibility Decision (RED) issued for the soil fumigants cluster (including metam sodium) on June 3, 2009 require moist soil conditions between 60 to 80 percent of field capacity at the start of application as well as by post-application sealing via the use of water, soil, or tarp. All other label changes addressed human health issues and are not applicable to this risk assessment. No known future label changes that could affect the effects determination in this assessment were identified for metam sodium. Both the terrestrial-phase and aquatic-phase modeling accounted for these field management practices. 3.1. Aquatic Exposure Assessment 3.1.1. Modeling Approach for Surface Water Aquatic-phase EECs (Estimated Environmental Concentrations) are calculated using the EPA Tier II PRZM (Pesticide Root Zone Model) and EXAMS (Exposure Analysis Modeling System) with the EFED Standard Pond environment. PRZM is used to simulate pesticide transport as a result of runoff and erosion from an agricultural field, and EXAMS estimates environmental fate and transport of pesticides in surface water. Aquatic exposure is modeled for the metam sodium and for MITC in two separate PRZM/EXAMS runs. The most recent PRZM/EXAMS linkage program (PE5, PE Version 5, dated Nov. 15, 2006) was used for all surface water simulations. Linked crop-specific scenarios and meteorological data were used to estimate exposure resulting from use on crops and turf. Since these are all pre-plant applications, the crops themselves are not expected to impact environmental concentrations of metam sodium and MITC. However, results in EECs will vary by crop scenario due to the representative soil and meteorological conditions that are intrinsic to that scenario. Considering this fumigant type of use, an additional refinement accounting for volatilization was considered to account for MITC loss from the soil. However, the validation of this component of the PRZM model has not been completed. Despite this, given the volatile nature of MITC, the PRZM volatility algorithm is used in accounting for the MITC residues available to runoff resulting in surface water EECs. Additional chemical specific physical parameters such as vapor phase diffusion coefficient (DAIR) and enthalpy of vaporization (ENPY) are activated during the PRZM/EXAMS simulation accounting for volatilization. The volatilization routine used assumes that temperature in the soil does not change over time. Therefore, temperaturedependent variables that may influence volatile flux rates from the soil such as Henry’s Law 65 Constant and soil degradation rates remain constant. This methodology is consistent with historical risk assessments with other fumigants up through this time. A verification evaluation was performed comparing the modeled loss rates from soil due to volatilization to measured data from the various field volatility studies available in California. This analysis is presented in Appendix E. 3.1.1.a. Model Inputs The appropriate PRZM and EXAMS input parameters for MITC were selected from the environmental fate data submitted by the registrant and obtained from literature and in accordance with US EPA-OPP EFED water model parameter selection guidelines, Guidance for Selecting Input Parameters in Modeling the Environmental Fate and Transport of Pesticides. Version 2.1, October 22, 2009 and PE5 User's Manual, (P)RZM (E)XAMS Model Shell, Version (5), November 15, 2006. Input parameters are grouped by physical-chemical properties and environmental fate data, application information, and use scenarios. Physical chemical properties and environmental fate data relevant to assess the behavior of metam sodium and MITC in the environment is presented in Table 3-1. Example PRZM/EXAMS model output are shown in Appendix D. Table 3-1. Summary of PRZM/EXAMS physical chemical properties and environmental fate data used for aquatic exposure estimation for MITC. PRZM/EXAMS Input Input Value and Unit Source Parameter Tomlin, 1997 (ed.) Molecular Weight 73.12 g/mol MRID 00158162 Hydrolysis (t1/2) 20.4 days at pH 7 90th percentile of values from Aerobic soil metabolism (t1/2) 9.61 days Aerobic aquatic metabolism (t1/2) Anaerobic aquatic metabolism (t1/2) Vapor Pressure at 25 ºC Solubility in Water at 25ºC Soil-Water Partition Coefficient (Kd) Henry’s Law Constant Enthalpy of Vaporization Vapor Phase Diffusion Coefficient Aqueous Photolysis (t1/2) 1. Gerstl et al., 1977 (3.3 – 9.9 days) EFED Input Parameter Guidance for Data Gap (9.61 x 2 days) 19.2 days Stable Conservative Assumption 19 torr 7,600 mg/L 0.26 mL/g CDPR, 2002 1 Tomlin, 1997 (ed.) Mean of values from Gerstl et al., 1977 1.79 x 10⁻⁴ atm·m3/mol 8.91 kcal/mol 8,227 cm2/day CDPR, 2002 1 Chickos and Acree, 2003 Fuller et al., 2006 51.6 days CDPR, 2002 1 CDPR – California Department of Pesticide Regulation 66 Table 3-2 shows the crop management input parameters and corresponding values used in the PRZM/EXAMS aquatic exposure modeling. Field management practices for all of the assessed uses of metam sodium were modeling including application rates, number of applications per year, application intervals, and the first application date for each use. The application rate for MITC loadings in soil was determined by multiplying the ratio of the molecular weights between MITC to metam sodium by 83 percent (the maximum percent of MITC material balance from applied metam sodium in the aerobic soil metabolism study) and also by the maximum application rate of metam sodium. The date of first application was developed based on the crop emergence date specified in the PRZM crop scenario allowing for the typical plant-back interval of 20 days with an additional 10 days until germination. PRZM/EXAMS modeling was conducted to represent the surface applications and soil incorporated applications mimicing the application methods associated with soil fumigation. Fumigants are generally used to treat the top 5 to 10 inches of the soil. There is a general understanding that surface applications such as flooded and drench applications, or chemigation via drip lines or ground sprinklers will result in a certain incorporation depth given the volatile nature of the fumigants and water sealing methods that are required on the labels for field applications of fumigants which are generally highly soluble, analgous to a top-down application. Therefore, to mimic the incorporation of a surface applied fumigant with a water seal, the Chemical Application Method parameter (CAM) of 4 (uniformally applied from the surface to the incorporation depth) is selected to an incorporation depth of 25 cm. For fumigants incorporated into the soil such as via shank injection, a CAM of 8 (entire distribution is applied at the incorporation depth) is selected at an incorporation depth of 25 cm (Overman et al., 1987 and Gilreath and Santos, 2004). The shank injection method is consistent with a bottom-up approach to soil fumigation as the chemical’s volatility causes the fumigant gas to move upwards in the soil column. In this manner, the chemical may become available to runoff in the extraction zone due to diffusion. Table 3-2. Crop management PRZM/EXAMS inputs used in aquatic exposure modeling. PRZM/EXAMS Input Value and Unit Comment Input Parameter Application Rate 168.35 kg a.i./ha at one application Equivalent application rate for and Interval per season MITC [358.4 kg a.i./ha x (73.12 g mol-1/129.2 g mol-1) x 0.83] where 0.83 is the fraction of MITC formation from MRID # 40198502 Crop Scenarios Leafy Vegetables Assumed 30 days prior to and (CA Lettuce - February 15) crop emergence as specified Application Date in PRZM crop scenarios Curcurbits (Cucumbers and Melons) (CA Melon - May 15) 67 Table 3-2. Crop management PRZM/EXAMS inputs used in aquatic exposure modeling. PRZM/EXAMS Input Value and Unit Comment Input Parameter Outdoor Ornamentals (CA Nursery – February 15) Bulb Crops (CA Onion – December 15) Tuber Crops (CA Potato – February 15) Row Crops (Carrots and Peppers) (CA Row Crops – December 15) Berries (CA Strawberry – December 15) Fruiting Crops (CA Tomatoes – February 15) Turf and Golf Courses (CA Turf – December 15) Chemical Application Method and (Incorporation Depth) Application Efficiency Surface Applications (Overhead Sprinkler Chemigation, Drip Chemigation, Flooded Applications, and Drench Applications): CAM = 4 soil applied, uniform over incorporation depth (25.0 cm) Based on fumigation of top 5 10 inches of soil from Gilreath and Santos, 2007 and Overman et al., 1987. Soil Incorporated (Shank Injection): CAM = 8 soil applied, entirely at incorporation depth (25.0 cm) MITC is assumed to generate in the soil column in a manner consistent with the Metam Sodium application method. No spray drift is associated with flooded applications and surface or buried drip tape. Surface Applications (Overhead Sprinkler Chemigation, Drip Chemigation, Flooded Applications, and Drench Applications): 1.0 Soil Incorporated (Shank Injection): 1.0 68 No spray drift is associated with overhead chemigation applications per SDTF, 19971 Table 3-2. Crop management PRZM/EXAMS inputs used in aquatic exposure modeling. PRZM/EXAMS Input Value and Unit Comment Input Parameter Spray Drift Surface Applications (Overhead Fraction Sprinkler Chemigation, Drip Chemigation, Flooded Applications, and Drench Applications): 0.0 Soil Incorporated (Shank Injection): 0.0 1 SDTF = Spray Drift Task Force 3.1.1.b. Results Table 3-3 shows that peak MITC concentrations for surface applications ranged from 1.77 g/L (melon) to 185.56 g/L (strawberry). The 21-day average concentrations ranged from 0.32 g/L (melon) to 48.0 g/L (strawberry). The 60-day average concentrations ranged from 0.11 g/L (melon) to 16.80 g/L (strawberry). Peak MITC concentrations for soil incorporated applications ranged from < 0.001 g/L (lettuce, melon, tomato, and turf) to 1.71 g/L (nursery). The 21-day average concentrations ranged from 0 g/L (lettuce, melon, tomato, and turf) to 0.40 g/L (nursery). The 60-day average concentrations ranged from < 0.001 g/L (lettuce, melon, tomato, and turf) to 0.14 g/L (nursery). 69 Table 3-3. Estimated aquatic concentrations for MITC expsoure in California. 1-in-10 year Surface Water EECs (g/L) Surface Applications (Overhead or Drip Chemigation, Flooded Applications, and Drench Soil Incorporated Applications Applications) (Shank Injection) Crop Scenarios Averaging Periods Averaging Periods PRZM Crop Crop Group Scenario Peak 21-day 60-day Peak 21-day 60-day Leafy Vegetables Curcurbits (Melons and Cucumbers) Outdoor Ornamentals California Lettuce 59.0 15.0 5.32 < 0.001 < 0.001 < 0.001 1.77 0.32 0.113 < 0.001 < 0.001 < 0.001 22.1 4.97 1.76 1.71 0.40 0.14 7.07 1.69 0.615 0.25 0.08 0.03 Tuber Crops California Melon California Nursery California Onion California Potato 2.55 0.75 0.276 0.51 0.13 0.05 Row Crops (Carrots and Peppers) California Row Crops 78.1 18.5 6.49 0.02 0.01 0.002 186 48.0 16.8 1.40 0.37 0.13 36.5 8.62 3.09 < 0.001 < 0.001 < 0.001 21.1 4.56 1.60 < 0.001 < 0.001 < 0.001 Bulb Crops Berries Fruiting Crops Turf and Golf Courses 1 California Strawberry California Tomato California Turf Maximum EECs shown in bold. 3.1.2. Ground Water Metam sodium ground water contamination is not expected given its labile behavior in the environment. However, leaching and potential ground water contamination of its principle degradate, MITC, is possible given its highly soluble and mobile characteristics. Cases of ground water contamination may especially occur in areas over and around aquifers where water tables may be shallow and recharging of ground water may occur. Therefore, MITC may reach ground water regardless of tarp cover. The Tier I model Screening Concentration in Ground Water (SCI-GROW v2.3, Jul. 29, 2003) is used to calculate acute and chronic MITC EECs in ground water. Ground water concentrations generated by SCI-GROW are based on the largest 90-day average estimated during the sampling period. Since there is relatively little temporal variation in ground water concentrations 70 compared to surface water, the model predicted value can be considered to represent both the acute and chronic values. Input parameters for the SCI-GROW model appear in Table 3-4. These inputs are determined in accordance with current divisional guidance. The mean of aerobic soil metabolism half-lives from Gerstl, 1977 is used. In addition, the median of two reported soil –water partition coefficients are selected. This is used in lieu of the organic carbon soil-water partition coefficient since individual soil-water partition coefficients are not found to be well correlated with the organic carbon content of the particular soils tested. All inputs in the model are determined from individual samples of physical chemical and environmental fate parameter values shown in Tables 2-2 and 2-3. Table 3-4. SCI-GROW input parameters for MITC. Input Parameter Value Comments Application Rate (lbs a.i./A) 150.32 lbs a.i./A Maximum proposed single application rate for all uses. Applications per Year 1 Maximum proposed number of applications per year at the maximum Product Labels proposed single application rate. 0.26 Mean Kd value Soil-Water Partition Coefficient normalized to Organic Carbon (Koc) (L/kg) Aerobic Soil Metabolism Half-life (days) 6.45 Source Equivalent application rate for MITC [320 lbs ai/A x (73.12 g mol1 /129.2 g mol-1) x 0.83] where 0.83 is the fraction of MITC formation from MRID # 40198502 Gerstl et al., 1977 Gerstl et al., 1977 Mean value This model simulation represents impacts to ground water from a single application at the maximum application rate of 320 lbs. metam sodium/A and resulting MITC exposure. However, despite the high application rate, Table 3-5 shows that MITC predicted ground water EECs are very low. This is likely due to the relatively short half-life of MITC residues in the soil. Volatilization is not accounted for in this model further justifying this EEC as upper-bound. Table 3-5. Estimated exposure concentrations of MITC in ground water. Use (modeled annual rate) All uses shown in Table III-1 (320 lbs. a.i./A, single application) 71 Acute (ppb) Chronic (ppb) 1.81 1.81 3.1.3. Existing Water Monitoring Data A critical step in the process of characterizing EECs is comparing the modeled estimates with available surface water monitoring data. Surface water monitoring data from the United States Geological Survey (USGS) NAWQA (http://water.usgs.gov.nawqa) and the California Department of Pesticide regulation (CDPR) programs were accessed and downloaded. At present time, metam sodium or MITC is not included in the USGS-NAWQA and CDPR Pesticide monitoring survey. Based on non-targeted survey data, no MITC has been detected in 14,864 ground water samples collected from 45 states over several years for Pesticides in Ground Water Data Base (PGWDB). However, MITC was detected in surface water coincidental with one incident potentially due to a metam sodium agicultural application and another incident related to a train derailment which resulted in the release of metam sodium into a river. These are presented in the incidents sections of this risk assessment (Sections 4.4 and 5.2.1.c) 3.2. Terrestrial Animal Exposure Assessment 3.2.1. Atmospheric Dispersion Modeling Approach The maximum peak of MITC measured field volatility flux data from four studies with a range of application methods are input into the SCREEN3 model for acute air EECs. These field volatility studies, described in Table 2-5 and Section 2.4, account for soil or water sealing field management requirements on the label. The field volatility studies used for the basis of the SCREEN3 modeling encompasses metam sodium applications at Bakersfield with overhead sprinkler chemigation, Lost Hills with shank injection, Helm with shank injection, and Brawley with flooded applications. The maximum peak flux rate from these studies were input into SCREEN3 and run concurrently with worst-case meteorological conditions (e.g., light winds under stagnate conditions) to obtain peak EECs, for a 1-hour averaging period. The input parameters for the SCREEN3 model are shown in Table 3-6. All field flux in SCREEN3 is assumed to originiate from an 80 acre field, which is an upper-bound scenario considering typical fumigation associated with the application methods used in the studies. Table 3-6. SCREEN3 inputs for MITC air exposure modeling. Input Parameter Option/Value Source Type Area Averaging Period 1-hour Surface Applications (Overhead or Drip Chemigation, Flooded Applications, and Drench Applications)1 = 71.7 g/m2s 2 Flux Rate (g/m s) Soil Incorporated Applications (Shank Injection)2 = 36.3 g/m2s Source Height (m) Length of Large Sides of Source (m) 0 (Ground-level) 569 (80-acre square field) 72 Table 3-6. SCREEN3 inputs for MITC air exposure modeling. Input Parameter Option/Value Length of Smaller Sides of 569 (80-acre square field) Source (m) Downwind Distance Range 0 – 1 km Receptor Height (m) 0 (Ground-level) Wind Speed = 1 m/s (minimum) Meteorological Conditions Stability Class = 6 (stagnate conditions) 1 2 Based on Bakersfield overhead chemigation field volatility study (MRID 45703702). Based on Lost Hills shank injection field volatility study (MRID 45703704). 3.2.2. SCREEN3 Modeling Results The SCREEN3 modeling results shown in Table 3-7 are presented in terms of the application method groupings consistent with the aquatic exposure modeling results presented in Section 3.1.3. This modeling addresses the flux measured from various surface or soil incorporated applications using various sealing techniques (e.g. soil or water sealing). The maximum EEC is 13,990 g/m3 occuring due to surface applications. Example SCREEN3 modeling output values are shown in Appendix F. Table 3-7. SCREEN3 acute EECs in air. Application Scenario Surface Applications (Overhead or Drip Chemigation, Flooded Applications, and Drench Applications) Soil Incorporated Applications (Shank Injection) Maximum SCREEN3 EEC (g/m3) Distance From Edge of the Field Modeled Field Size (m) (Acres) 13,990 0 80 3,667 0 80 3.2.3.Atmospheric Monitoring Data There are many MITC air monitoring studies which have been conducted concurrent with applications of metam sodium in the close vicinity of treated fields. Air monitoring studies in California are available from registrants and from the California Department of Pesticide Regulation. In registrant field volatility studies, maximum air concentrations were 843.43 g/m3 in the Brawley flooded study, 374 g/m3 in the Helm shank injection study, 181.5 g/m3 in the Lost Hills flooded study, and 168 g/m3 in the Bakersfield, CA sprinkler chemigation study. These samples were measured along the edge of the treated fields. The air samples generally reflect 4hour average air concentrations. An air monitoring study has also been conducted by the California Deparment of Pesticide 73 Regulation to determine the concentrations of MITC in air adjacent to sites on which metam sodium was applied by specific application methods. Wofford et al., (1994) conducted a study in August 1993 in Kern County, California to measure the concentrations of MITC in air associated with a sprinkler application of metam sodium. Sixty percent of air samples had detectable MITC residues. The highest MITC concentration occurred primarily during the application and immediately following the watering-in referred as soil sealing periods. Concentration during application ranged from 78.3 to 2,450 g/m3 at 5 meters from the field edge and 11.7 to 1,320 g/m3 at 150 meters from the field edge. Recognized transformation products of MITC in air were also detected after metam sodium applications nearby treated fields. Hydrogen sulfide gas (H2S) was detected at 3-76 g/m3 during application and 3-8 g/m3 22 hours post application. These concentrations gradually decreased to non-detect over the course of the study (72 hours). No carbon disulfide (CS2) was detected above the detection limit of 4 g/m3. A separate air monitoring study was conducted in Kern County, California to measure the MITC and MIC residue in air associated with soil injected application of metam sodium (ARB, 1997). Measurable MITC residues were detected in all samples ranging from 0.21 to 84 g/m3 (0.24 to 250 g/m3). MIC concentrations were ranging from 0.09 to 2.5 g/m3 (0.2-5.8 g/m3). These studies suggest that the metam sodium application methods affect the volatility rates of MITC and consequently dictate the ambient residue of MITC in the air samples. Several studies were performed to determine the concentrations of MITC in the ambient air samples. These air sampling studies do not necessarily coincide with application of metam sodium in the area. However, these studies were carried out in high use areas of California. MITC concentrations measured in the ambient air were considerably lower than the concentrations monitored at the application sites. Seiber et al. (1999) reported the MITC concentrations in ambient air samples from indoor (residential) and outdoor in Kern County, California. This study was conducted during the summer of 1997 and the winter of 1998. Approximately 75 percent of the samples in summer of 1997 and 67 percent of air samples in winter 1998 had detectable concentrations of MITC. The reported MITC concentrations in the air samples collected during the summer of 1997 ranged from “not detected” to 6.02 g/m3 for indoor air samples and “not detected” to 10.41 g/m3 for the outdoor air samples. The MITC concentration for winter 1998 air samples for both indoor and outdoor were very similar and had MITC concentrations less than 1.36 g/m3. The study authors concluded that the proximity to the treated fields, timing of the metam sodium application, and prevailing wind directions seemed to be contributing factors with respect to detectable MITC residue in the ambient air samples. Another air monitoring study was conducted at five locations in Lompoc, California. The concentrations of MITC and other pesticides in ambient air samples were monitored from August 31 through September 13, 1998 within the Lompoc City limits adjacent to the agricultural fields. The concentrations of MITC ranged from “not detected” to 0.34 g/m3. 3.3. Changes in Expsoure Assessment from Red-Legged Frog Assessment In this assessment, there are several changes in the aspects of the tools and data that were used as the basis of the California Red-Legged Frog risk assessment. First, it should be noted the the crop scenarios for several of the PRZM runs supporting the aquatic-phase exposure assessment have been revised since the Red-Legged Frog assessment. In addition, the PRZM/EXAMS shell 74 pe4 was used in the California Red-Legged Frog risk assessment; the pe5 shell used in this assesment. Therefore, aquatic-phase EECs are marginally different. Secondly, SCREEN3 was chosen as the basis for the terrestrial exposure assessment which is equivalent to the screening version of the ISCST3 model used in the Red-Legged Frog assessment. 4. Effects Assessment This assessment evaluates the potential for MITC to directly or indirectly affect CTS or modify their designated critical habitat. Assessment endpoints for the effects determination for each assessed species include direct toxic effects on the survival, reproduction, and growth, as well as indirect effects, such as reduction of the prey base or modification of its habitat. In addition, potential modification of critical habitat is assessed by evaluating effects to the PCEs, which are components of the critical habitat areas that provide essential life cycle needs of each assessed species. Inhalation is considered to be the only relevant route of terrestrial exposure due to the rapid degradation of metam sodium to MITC. Both aquatic and terrestrial exposure is expected to be largely, if not entirely, to MITC. Metam sodium converts rapidly to MITC upon application in the field, as discussed in Section 2.4. The effects assessment summary focuses on MITC as does the risk assessment. Acute (short-term) and chronic (long-term) toxicity information is characterized based on registrant-submitted studies and a comprehensive review of the open literature on MITC. Chronic aquatic exposure will be evaluated. However, no chronic terrestrial exposure is anticipated given the low ambient air monitored concentrations of 10.41 g/m3 observed in Kern County where the highest use volume of metam sodium occurs. The most sensitive acute toxicity reference values associated with MITC exposure to aquatic organisms are summarized in the following sections. Direct effects to the aquatic phase CTS are based on toxicity information for freshwater fish. The risk assessment assumes that avian toxicity would be protective for the terrestrial phase CTS, therefore the avian toxicity test results would usually be used to represent that life cycle of the CTS. However, data for metam sodium and MITC, while relatively extensive for mammals, are very limited otherwise. Due to the lack of inhalation data on avian toxicity tests, mammal data are utilized in this assessment. 4.1. Ecotoxicity Study Data Sources Toxicity endpoints are established based on data generated from guideline studies submitted by the registrant, and from open literature studies that meet the criteria for inclusion into the ECOTOX database maintained by EPA/Office of Research and Development (ORD) (USEPA, 2004a). Open literature data presented in this assessment were obtained from registrantsubmitted studies as well as ECOTOX information obtained on 27 September 2010. In order to be included in the ECOTOX database, papers must meet the following minimum criteria: (1) (2) the toxic effects are related to single chemical exposure; the toxic effects are on an aquatic or terrestrial plant or animal species; 75 (3) (4) (5) there is a biological effect on live, whole organisms; a concurrent environmental chemical concentration/dose or application rate is reported; and there is an explicit duration of exposure. Open literature toxicity data for ‘target’ terrestrial plant species, which include efficacy studies, are not currently considered in deriving the most sensitive endpoint for terrestrial plants. Efficacy studies do not typically provide endpoint values that are useful for risk assessment (e.g., NOAEC, EC50, etc.), but rather are intended to identify a dose that maximizes a particular effect (e.g., EC100). Therefore, efficacy data and non-efficacy toxicological target data are not included in the ECOTOX open literature summary table provided in Appendix H. The list of citations including toxicological and/or efficacy data on target plant species not considered in this assessment is provided in Appendix I. Data that pass the ECOTOX screen are evaluated along with the registrant-submitted data, and may be incorporated qualitatively or quantitatively into this endangered species assessment. In general, effects data in the open literature that are more conservative than the registrantsubmitted data are considered. The degree to which open literature data are quantitatively or qualitatively characterized for the effects determination is dependent on whether the information is relevant to the assessment endpoints (i.e., survival, reproduction, and growth) identified in Appendix C. For example, endpoints such as behavior modifications are likely to be qualitatively evaluated, because quantitative relationships between modifications and reduction in species survival, reproduction, and/or growth are not available. Although the effects determination relies on endpoints that are relevant to the assessment endpoints of survival, growth, or reproduction, it is important to note that the full suite of sublethal endpoints potentially available in the effects literature (regardless of their significance to the assessment endpoints) are considered, as they are relevant to the understanding of the area with potential effects, as defined for the action area. Citations of all open literature not considered as part of this assessment because they were either rejected by the ECOTOX screen or accepted by ECOTOX but not used (e.g., the endpoint is less sensitive) are included in Appnedix I. Appendix I also includes a rationale for rejection of those studies that did not pass the ECOTOX screen and those that were not evaluated as part of this endangered species risk assessment. A detailed spreadsheet of the available ECOTOX open literature data, including the full suite of lethal and sublethal endpoints is presented in Appendix I. In addition to registrant-submitted and open literature toxicity information, other sources of information, including use of the acute probit dose response relationship to establish the probability of an individual effect and reviews of ecological incident data, are considered to further refine the characterization of potential ecological effects associated with exposure to MITC. A summary of the available aquatic and terrestrial ecotoxicity information and the incident information for MITC are provided in Sections 4.1 through 4.4. 76 Available toxicity of stressors of concern are summarized for each taxa in the appropriate sections for the taxa. Toxicity values for MITC are summarized in Appendix G. 4.2. Toxicity of MITC to Aquatic Organisms Table 4-1 summarizes the most sensitive MITC aquatic toxicity endpoints, based on an evaluation of both the submitted studies and the open literature, as previously discussed. A brief summary of submitted and open literature data considered relevant to this ecological risk assessment for the CTS is presented below. All endpoints are expressed in terms of MITC as the active ingredient (a.i.) stressor unless otherwise specified. Table 4-1. Aquatic toxicity profile for MITC. Assessment Endpoint Acute/ Chronic Freshwater fish (surrogate for aquatic phase amphibians) Acute Freshwater invertebrates Species TGAI/TEP % a.i. Rainbow Trout (Onchorynchu s mykiss) Acute Bluegill sunfish Lepomis macrochirus2 TGAI Acute Water flea Daphnia magna Chronic Aquatic plants Toxicity Value Used in Risk Assessment Citation or MRID # (Author, Date)1 Comment 96-hr LC50 = 51.2 µg ai/L 95% CI = 32-178.4 µg ai/L NOEC=30 µg ai/L No slope reported MRID 459194-20 Supplemental Very highly toxic 96-hr LC50=94 µg ai/L 95% CI(78-131 µg ai/L No slope reported 96-hr LC50 = 142 µg ai/L 95% CI = 88-251 µg ai/L NOEC=88 µg ai/L MRID 445234-13 Acceptable MRID 445234-12 Acceptable Highly toxic MRID 418193-02 Acceptable Very highly toxic No slope reported 48 hr EC50 =55µg ai/L (based on immobilization) 21 day NOEC=25 µg ai/L MRID 456340-01 Supplemental. #live young/#live adults based on nominal concentrations. Vascular Duckweed Lemna gibba TGAI 99.6% 7 day EC50 = 590 µg ai/L (560-620 µg ai/L) NOEC=90 µg ai/L MRID 459194-21 Acceptable Most sensitive endpoint is reduction in frond density Nonvascular Green alga Pseudokirchneriell a subcapitata 4 day EC50 =254 µg ai/L (218-296 µg ai/L) NOEC=125 µg ai/L MRID 445889-03 Supplemental Reduction in cell growth is the affected endpoint TGAI 95.7% 77 Toxicity to fish and aquatic invertebrates is categorized using the system shown in Table 4-2 (USEPA, 2004b). Toxicity categories for aquatic plants have not been defined. Table 4-2. Categories of acute toxicity for fish and aquatic invertebrates. LC50 (mg/L) < 0.1 > 0.1 – 1 > 1 – 10 > 10 – 100 > 100 Toxicity Category Very highly toxic Highly toxic Moderately toxic Slightly toxic Practically nontoxic 4.2.1. Toxicity to Freshwater Fish Submitted Studies Given that no acceptable toxicity data are available for aquatic phase amphibians, freshwater fish toxicity data for MITC will be used as a surrogate to estimate direct acute and chronic risks to the CTS and indirect effects to the CTS via reduction in available vertebrate food/prey items. A summary of acute and chronic freshwater fish data, including data from the open literature, is provided below. Two MITC freshwater fish studies, one on rainbow trout (Onchorynchus mykiss) and one on bluegill sunfish (Lepomis macrochirus), as shown in Table 4-1, are available to document the acute exposure effects of MITC on freshwater fish. Based on these studies, the acute 96-hour median lethal toxicity thresholds (i.e., LC50s) for MITC ranged from 51.2 for rainbow trout (MRID 459194-20) to 14.2 (bluegill sunfish) g ai/L. Therefore, MITC is classified as very highly toxic to freshwater fish on an acute exposure basis. Sublethal effects on freshwater fish noted in acute exposure tests include swimming on the bottom of the chamber only for the measured concentration of 70 g/L past the 24 hour observation period. No swimming on the bottom or mortality was observed in either the negative control or 30 g/L measured concentrations. The two highest concentrations (420 and 900 g/L) recorded 100% mortality at 24 hours, with no sublethal effects noted. Potental chronic exposure to MITC is expected from the use of metam sodium based on the fate properties of MITC. However, no chronic toxicity data for freshwater fish were submitted to the Agency for metam sodium, MITC and/or its formulated products. Open Literature Studies No valid studies were located in the open literature that reported endpoints on freshwater fish that are lmore sensitive than the selected measures of effect summarized in Table 4-1. Therefore, the rainbow trout 96-hour LC50 of 51.2 g ai/L (MRID 459194-20) will be used to calculate RQs that determine acute direct effects and indirect effects to aquatic phase CTS. . 78 4.2.2. Toxicity to Freshwater Invertebrates Submitted Studies The diet of the CTS includes snails, small crustaceans and aquatic larvae, therefore freshwater aquatic invertebrate toxicity data were used to assess potential indirect effects of MITC to the CTS via reduction in available food/prey items. Acute and chronic toxicity data are available to estimate the effects from MITC to the CTS. Registrant-submitted toxicity tests (MRID 41819302) show that MITC (LC50 = 55 g ai/L) are very highly toxic to daphnids (Daphnia magna) on an acute basis (Appendix G, Table 4-1). A chronic toxicity study on Daphnia magna reported a 21 day NOAEC value of 25g/l (Appendix G, Table 4-1). The 21-day study compared the responses of Daphnia magna to MITC and established the most sensitive endpoint for MITC (MRID# 456340-01). Parameters evaluated included length, longevity, days to first brood, broods per female, and number of young per female. The most sensitive parameter was number of live young/number of live adults. Open Literature Studies Although acute (E#96927) and chronic (E#11456) metam sodium studies were identified in open literature, no metam sodium open literature toxicity values were used in the assessement because the stressor is MITC, not metam sodium. Therefore, the registrant submitted MITC data will be used to calculate RQs for this assessment. 4.2.3. Toxicity to Aquatic Plants Aquatic plant toxicity studies are used as one of the measures of effect to evaluate whether MITC may affect primary production. Aquatic plants may also serve as dietary items of CTS. In addition, freshwater vascular and non-vascular plant data are used to evaluate a number of the PCEs associated with the critical habitat impact analysis. Based on a review of the registrant-submitted and open literature studies, registrant-submitted guideline studies provided more sensitive endpoints, and these were used in the assessment. For MITC, EC50 values for non-vascular plants ranged from 254 g/L (green algae, Scenedesmus subspicatus) to 590 g/L for vascular plants represented by Lemna gibba (Appendix G, Table 4-5). Based on the available data, green algae appear to be most sensitive to the effects of MITC. No aquatic plant studies were available from ECOTOX. 4.3. Toxicity of MITC to Terrestrial Organisms Table 4-3 summarizes the most sensitive terrestrial toxicity endpoints, based on an evaluation of both the submitted studies and the open literature. A brief summary of submitted and open 79 literature data considered relevant to this ecological risk assessment is presented below. Additional information is provided in Appendix H. Avian toxicity data would normally be used to assess potential direct effects of MITC to the terrestrial-phase CTS. Terrestrial invertebrate (prey), vertebrate (mammalian prey), and plant (habitat) data are used to assess indirect effects to the terrestrial-phase CTS. Given that no acceptable toxicity data are available for amphibians or birds for MITC, toxicity data on rats will be used as a surrogate to estimate direct acute and chronic risks to the terrestrial-phase CTS. A waiver for the honey bee study was granted. No acceptable toxicity data are available to estimate indirect effects to the CTS from MITC exposure to terrestrial plants. Acute toxicity to terrestrial animals is categorized using the classification system shown in Table 4-3 (USEPA, 2004b). Toxicity categories for terrestrial plants have not been defined. Table 4-3. Categories of acute toxicity for avian and mammalian studies. Toxicity Category Very highly toxic Highly toxic Moderately toxic Slightly toxic Practically non-toxic Oral LD50 Dietary LC50 < 10 mg/kg 10 - 50 mg/kg 51 – 500 mg/kg 501 - 2000 mg/kg > 2000 mg/kg < 50 mg/kg-diet 50 - 500 mg/kg-diet 501 - 1000 mg/kg-diet 1001 - 5000 mg/kg-diet > 5000 mg/kg-diet 4.3.1. Toxicity to Birds and Terrestrial-Phase Amphibians Inhalation is expected to be the primary route of exposure for MITC. Dietary exposure is not expected with MITC or metam sodium. There are no acute or chronic registrant submitted dietary or inhalation bird studies available. A review of the open literature identified no acute or chronic bird studies available that are acceptable for quantitative or qualitative use in this risk assessment. 4.3.2. Toxicity to Mammals A summary of acute and chronic mammalian data, including data published in the open literature, is provided below in Sections 4.3.2.a. A complete analysis of toxicity data to mammals is available in Appendix I which is a copy of the Health Effects Division (HED) chapter prepared in support of the reregistration eligibility decision completed in 2005. 80 Table 4-4. Acute toxicity of methyl isothiocyanate (PC Code 068103). Guideline No. Study Type MRID #(S). Results Toxicity Category 81-1 Acute Oral-Rat 162331 LD50 = 82 mg/kg (male) 55 mg/kg (female) II 81-2 Acute Dermal-Rat 16233042442501 LD50 = 136-436 mg/kg (male) 181 mg/kg (female) I 81-3 Acute Inhalation-Rat 45919410 4 h LC50 = 0.54 mg/L II 81-4 Primary Eye Irritation 162328 corrosion of the cornea and conjunctivae I 81-5 Primary Skin Irritation 162329 all animals died within one hour I 81-6 Dermal Sensitization 4.3.2.a. Not available Mammals: Acute Exposure (Mortality) Studies Due to the absence of bird inhalation data, a terrestrial mammal was used to identify the risk of inhalation to the CTS. Mammalian toxicity data (reviewed by HED) indicate that MITC has an acute oral LD50 of 55 mg/kg in female rats and an acute inhalation LC50 of 0.54 mg/L. The MITC NOAEL based on a 28-day subchronic rat inhalation study, classified as non-guideline, is 5.4 mg/kg/day. Based on the above results of an acute oral toxicity study in rats, EFED considers MITC to be highly toxic to mammals. The most sensitive endpoint, acute inhalation, is used for the inhalation analyses rather than the non-guideline 28-day study. 4.3.3. Toxicity to Terrestrial-Phase Amphibians No terrestrial-phase amphibian studies, based on acute or chronic exposure, were located for MITC from the open literature. 4.3.4. Toxicity to Terrestrial Invertebrates MITC from metam sodium applications is used to kill terrestrial invertebrates. However, there are no available guideline insect toxicity tests for metam sodium or MITC. A waiver has been granted for the honey bee toxicity test. There may be some uses which result in exposure to terrestrial invertebrates, which are part of the diet for the CTS (worms, soil invertebrates). In addition to submitted studies, open literature is reviewed. No open literature studies were identified that would be acceptable for quantitative or qualitative use regarding the effects of MITC on terrestrial invetebrates. 81 4.3.5. Toxicity to Terrestrial Plants Impacts to riparian and upland (i.e., grassland, woodland) vegetation may result in indirect effects to CTS, as well as modification to designated critical habitat PCEs via increased sedimentation, alteration in water quality, and reduction in of riparian habitat that provides shade and predator avoidance. No acceptable plant studies have been submitted nor were any found in the open literature. A waiver for the terrestrial plant studies has been submitted and denied. 4.4. Incident Database Review A review of the Ecological Incident Information System (EIIS, version 2.1), the Aggregate Summary Module (ASM) (v.1.0) of Office of Pesticide Program’s Incident database maintained by the Information Technology and Resource Management Division, and the Avian Monitoring Information System (AIMS) for ecological incidents involving MITC from metam sodium applications was completed on 10 October 2010. The results of this review for terrestrial, plant, and aquatic incidents are discussed below. Incidents from the EIIS Database: Incidents are reported separately for MITC in the EIIS database. Metam sodium use has been linked to six reported adverse ecological incidents in aquatic systems from the EIIS system, which included mortality (Table 4-5). Amphibians are not among the reported mortalities; however, this does not necessarily mean that they have not occurred. No aquatic or terrestrial incidents for MITC were reported in the EIIS database. Table 4-5. Adverse aquatic incidents: metam sodium. Magnitude of EIIS Species Effect Location Incident (number of Affected No. (Date) organisms) I006515001 (01 June 1991) I005525016 (July 17 1991) Sacremento River, CA Sacremento River,CA Fish Trout, suckers, squawfish and sculpin and other 1,000 Incident Summary A railroad tank car spill in which thousands of fish (as well as most insects and some plants) were killed in a 42-mile stretch of the Sacramento River in California in 1991. While not representative of agricultural applications, this incident shows clearly that metam-sodium has the ability to kill large numbers of aquatic organisms if the chemical gets into water in large quantities. This incident report is a summary report only, but cites the death of over 1000 fish, including trout, suckers, squawfish, and sculpin in Siskiyou and Shasta counties in 1,000 82 Certainty Index (3) Probable Table 4-5. Adverse aquatic incidents: metam sodium. Magnitude of EIIS Species Effect Location Incident (number of Affected No. (Date) organisms) fish I012648001 (Nov 1 1994) St Johns, FL Fish Unknown I008259001 (December 23 1998) Hastings, FL Bass 2,700 I008275003 (Nov 30 1998) NR Fish NR I011162001 (Jan 6 2001) Hastings, FL Bass >400 Incident Summary California in 1991. It very likely refers to the same railroad tank car spill cited above. It provides the additional information of fish species involved. This incident report involved a phone call in which a Florida fish farm representative claimed that the use of metam-sodium nearby resulted in several fish kills from 1994 - 2001. Certainty Index (2) Possible This incident report under 6(a)(2) (from a registrant) cites a claim from a Florida fish farm owner that 2700 hybrid bass were killed after metam-sodium was applied within 300 feet of the fish tanks. The owner suspected that drift occurred (i.e., of MITC, the toxic degradate of metam-sodium that off-gasses) and that his aeration system picked it up and re-dissolved it into the fish tanks. Also cited in the report is a pump malfunction that apparently interrupted water and oxygen circulation. This incident report under 6(a)(2) (from a registrant) cites a reported pond contamination and a fish kill following metam-sodium application. There was no report of application method or if there was a misapplication. Very few details were provided, although it states that USFWS was notified when the incident occurred. (2) Possible This incident report under 6(a)(2) (from a registrant) cites a claim from a Florida fish farm owner that approximately 400 striped bass were killed after metam-sodium was applied within about 600 feet of the fish tank. Although reportedly most of the tanks receive air from a common source, mortality was reported in only one of 94 tanks (1) Not probable (2) Possible The aquatic incidents reported in this assessment include agriculture applications based on the conceptual model. The incidents I012648-001 and I008259-001 report applications to adjacent areas with drift impacting fish. The distances reported vary from 300 feet to ¼ mile. These reports were assigned an uncertainity index of possible (2 out of 4). Both of these reports fail to provide sufficient information to exclude other causes for the fish mortality and therefore are not used in the assessment. I005525-016, the tank car spill incident was not considered in this assessment as it does not reflect an agricultural labeled use or method of application. Incident 83 I008275-003 was not included in this assessment due to the lack of information provided in the report. The county or state was not identified, and the number of dead fish and the application method or if this was a misapplication was not reported. Incident I011162-001 was not used in this assessment due to the certainity index assigned, of 1, indicating a classification of not probable. In addition, a recent newpaper article in the Tribune Weekly Chronicle (October 5, 2010) reported that small levels of MITC were detected in a canal in the Sonoran Desert town of Holtville, CA. Additional details were provided by Nelosn Perez of the County of Imperial Office of the Agriculture Commissioner (Personal Communication).The levels of MITC were attributed to cases of human exposure and a fish kill in the area possibly associated with metam sodium applications in the region which occurred throughout late September and early October 2010. MITC was detected at a level of 1.62 µg/L (Nelson Perez, County of Imperial Office of the Agriculture Commissioner, Personal Communication). The resulting RQ=0.03 for both fish and Daphnia would indicate a “No Effect” determination. There is uncertainty regarding when measurements were taken relative to the suspected application and in the distance from the source of release to the measurement site. This incident report is not available in the EIIS database at this time. Table 4-6 shows five terrestrial incidents reports involving metam sodium included in the agency’s Ecological Incident Information System (EIIS) database. They have certainty indices ranging from 1 (unlikely) to 4 (highly probable). Table 4-6. Adverse terrestrial incidents: metam sodium. EIIS Incident No. (Date) Location Species Affected Magnitude of Effect I011510-001 (12 November 1999) Bullard, TX I011838-056 (22 May 2001) Robersonville River, NC Peanuts 80 acres I012457-005 (22 May 2001) Robersonville River, NC Peanuts 120 acres I014405-002 (23 May 1996) Grant County, WA Potato NR 30 acres Pine 84 Incident Summary This incident report under 6(a)(2) (from a registrant) cites an incident in which 30 acres of pine seedlings in Texas were alleged to be damaged by drift (presumably of MITC) from a metam-sodium application in which no water seal was used. This incident report under 6(a)2 cites an incident in which 80 acres of peanuts were damaged in North Carolina. Metam sodium was one of five products applied This incident report under 6(a)(2) (from a registrant) cites an incident in which 120 acres of peanuts were damaged in North Carolina. Metam-sodium was apparently one of two pesticides applied. This incident reported in the Washington State Department of Health 1997 Annual Report. Misapplication of metam sodium damaged potatoe crop. Complaint was withdrawn. Certainty Index (3) Probable (2) Possible (2) Possible (2) Possible Table 4-6. Adverse terrestrial incidents: metam sodium. EIIS Incident No. (Date) I016107-001 (23 September 2004) Location Broad Brook,CT Species Affected Spruce and Cherry trees Magnitude of Effect Several Incident Summary A complaint was received by the State of Connecticut Department of Environmental Protection citing damage to spruce trees as well as a cherry tree. Certainty Index (2) Possible Incident I016107-001 reported application on according to label instructions with a certainity index of 2 (possible). This demonstrates the possible adverse effect of MITC exposure from metam sodium applications to vegetation or crops off-site treated fields. No distance off the treated field was reported, the application rate of metam sodium used and the concentration of MITC was not reported, and no other pesticide use was reported. Incidents I011510-001 and I014405-002 were not used in this assessment due to misapplication of metam sodium. Both I011838-056 and I012457-005 reported use of multiple pesticides. No percentages of the mixture were reported. Incidents from the AIMS Database: Bird incidents for metam sodium and MITC were reviewed in the Avian Incident Monitoring System (AIMS). No avian incidents for metam sodium or MITC were reported in the AIMS database. 85 5. Risk Characterization Risk characterization is the integration of the exposure and effects characterizations. Risk characterization is used to determine the potential for direct and/or indirect effects to the CTS or for modification to their designated critical habitat from the use of metam sodium in CA. The risk characterization provides an estimation (Section 5.1) and a description (Section 5.2) of the likelihood of adverse effects; articulates risk assessment assumptions, limitations, and uncertainties; and synthesizes an overall conclusion regarding the likelihood of adverse effects to the assessed species or their designated critical habitat (i.e., “no effect,” “likely to adversely affect,” or “may affect, but not likely to adversely affect”). In the risk estimation section, risk quotients are calculated using standard EFED procedures and models. In the risk description section, additional analyses may be conducted to help characterize the potential for risk. 5.1. Risk Estimation Risk is estimated by calculating the ratio of exposure to toxicity. This ratio is the risk quotient (RQ), which is then compared to pre-established acute and chronic levels of concern (LOCs) for each category evaluated (Appendix C). For acute exposures to the listed aquatic animals, as well as terrestrial invertebrates, the LOC is 0.05. For acute exposures to the listed birds (and, thus, terrestrial-phase amphibians) and mammals, the LOC is 0.1. The LOC for chronic exposures to animals, as well as acute exposures to plants is 1.0. Acute and chronic risks to aquatic organisms are estimated by calculating the ratio of exposure to toxicity using 1-in-10 year MITC EECs in surface water presented in Table 3-3 based on the label-recommended metam sodium usage, MITC fate properties, and the appropriate aquatic toxicity endpoint from Table 4-1. Acute and chronic risks to terrestrial animals are estimated based on MITC exposures resulting from applications of metam sodium (Table 3-7) and appropriate toxicity endpoint from Table 4-3. 5.1.1. Exposures in the Aquatic Habitat 5.1.1.a. Freshwater Fish and Aquatic phase Amphibians Acute risk to aquatic phase CTS is based on 1-in -10 year peak EECs in the standard pond and the lowest acute toxicity value for freshwater fish. Chronic risk is based on the 1-in -10 year 60day EECs. In the absence of chronic toxicity data for fish, an estimated value is calculated using the acute-to-chronic ratio method. This method results in an acute to chronic ratio of 2.2 for Daphnia, with an acute toxicity value of 55 µg/L and a chronic toxicity value of 25 µg/L. The acute fish toxicity value (51.2 µg/L) is then divided by the ratio, resulting in an estimated chronic toxicity value of 23.2 µg/L. The estimated chronic toxicity value is divided into the EEC to calculate an RQ for each use. Risk quotients for freshwater fish based on MITC toxicity values are shown in Table 5-1 and Table 5-2. Freshwater fish RQs are used to estimate direct acute and chronic risks to the aquatic phase CTS (all 3 DPSs) due to lack of acceptable toxicity data for amphibians. Freshwater fish RQs will also be used to assess potential indirect effects of MITC to the aquatic phase CTS via reduction in available prey items. 86 Table 5-1. Acute and chronic MITC RQs for freshwater fish based on MITC soil incorporated application. Lettuce <0.001 60-day Average EEC (µg/L) <0.001 Melon <0.001 <0.001 < 0.01 <0.01 Nursery 1.71 0.14 0.03 0.01 Onion 0.25 0.03 < 0.01 < 0.01 Uses (Application Method) Species for Acute Toxicity Species for Chronic Toxicity Peak EEC (µg/L) Acute RQ* Chronic RQ** < 0.01 < 0.01 0.51 0.05 0.01 < 0.01 Row Crops 0.02 < 0.001 < 0.01 <0.01 Strawberry 1.40 0.13 0.03 0.01 Tomato < 0.001 < 0.001 < 0.01 < 0.01 Turf < 0.001 < 0.001 < 0.01 < 0.01 Potato Rainbow Trout = LOC exceedances (acute RQ > 0.05; chronic RQ > 1.0) are bolded and shaded; *Acute RQ = use-specific peak EEC / 51.2 µg/L **Chronic fish toxicity is estimated using the acute-to-chronic ratio with Daphnia toxicity values. Acute-to-chronic ratio = 2.2 No RQs exceeded the acute risk LOC≥0.05 based on the soil incorporation application method. RQs ranged from 0.01 for potato uses to 0.03 for nursery and strawberry uses. No RQs estimated with a chronic toxicity value calculated using the acute-to-chronic ratio exceeded the chronic LOC≥1 for any soil incorporated uses. RQs ranged from < 0.01 for onion and potato to 0.01 for nursery and strawberry uses. Table 5-2. Acute RQs for freshwater fish Based on MITC surface application. Uses (Application Method) Lettuce Melon Nursery Onion Potato Row Crops Species for Acute Toxicity Rainbow trout Rainbow trout Rainbow trout Rainbow trout Rainbow trout Rainbow trout Species for Chronic Toxicity Rainbow trout Rainbow trout Rainbow trout Rainbow trout Rainbow trout Rainbow trout Peak EEC (µg/L) 60-day Average EEC (µg/L) Acute RQ* Chronic RQ** 58.98 5.32 1.15 0.23 1.77 0.11 0.03 0.05 22.1 1.76 0.43 0.08 7.07 0.61 0.14 0.03 2.55 0.28 0.05 0.01 78.2 6.49 1.53 0.28 87 Table 5-2. Acute RQs for freshwater fish Based on MITC surface application. Species Species for 60-day for Peak EEC Chronic Chronic Average Acute RQ* Acute (µg/L) RQ** Toxicity EEC (µg/L) Toxicity Rainbow Rainbow 186 16.8 0.72 3.62 Strawberry trout trout Rainbow Rainbow 36.5 3.08 0.13 0.71 Tomato trout trout Rainbow Rainbow 21.1 1.6 0.07 0.41 Turf trout trout = LOC exceedances (acute RQ > 0.05; chronic RQ > 1.0) are bolded and shaded. * Acute RQ = use-specific peak EEC / 51.2 µg/L] **Chronic toxicity values estimated using the acute-to-chronic ratio with Daphnia toxicity data. Acute-to-chronic ratio =2.2. Uses (Application Method) Acute RQs exceeded the listed or non-listed (including restricted use) species LOC for all surface application uses except melon (Table 5-2). RQs exceeding the acute LOC> 0.05 ranged from 0.05 for potato to 3.62 for strawberry uses. The moderately persistent properties of MITC indicate the potential for chronic exposure to freshwater fish. No RQs estimated with a chronic fish toxicity value calculated using the acute-to-chronic ratio exceeded the chronic LOC≥1 for any surface uses. RQs ranged from 0.01 for potato to 0.72 for strawberry uses. Therefore, MITC has the potential to directly affect the aquatic phase CTS (all 3 DPSs) or indirectly affect CTS (all 3 DPSs) through prey reduction. 5.1.1.b. Freshwater Invertebrates Acute risk to freshwater invertebrates is based on 1 in 10 year peak EECs in the standard pond and the lowest acute toxicity value for freshwater invertebrates. Chronic risk is based on 1 in 10 year 21-day EECs and the lowest chronic toxicity value for freshwater invertebrates. Risk quotients for freshwater invertebrates based on MITC are shown in Table 5-3 for soil incorporated and Table 5-4 for surface applications. Freshwater invertebrate RQs will be used to assess potential indirect effects of MITC to the aquatic phase CTS (all 3 DPSs) via reduction in available prey items. 88 Table 5-3. Summary of acute and chronic RQs for freshwater invertebrates based on MITC soil incorporated application. Lettuce < 0.001 21-day Average EEC (µg/L) < 0.001 Melon < 0.001 < 0.01 < 0.01 < 0.01 < 0.001 Nursery 1.71 0.40 0.03 0.02 Onion 0.25 0.08 < 0.01 < 0.01 0.51 0.13 0.01 < 0.01 Row Crops 0.02 0.1 < 0.01 < 0.01 Strawberry 1.40 0.37 0.02 0.01 Tomato < 0.001 < 0.001 < 0.01 < 0.01 Turf < 0.001 < 0.001 < 0.01 < 0.01 Uses (Application Method) Potato Species for Acute Toxicity Species for Chronic Toxicity Daphnid Peak EEC (µg/L) Acute RQ* Chronic RQ** < 0.01 = LOC exceedances (acute RQ > 0.05; chronic RQ > 1.0) are bolded and shaded. * Acute RQ = use-specific peak EEC / 55 µg/L **Chronic RQ=use specific 21-day EEC/25 µg/L Table 5-4. MITC acute RQs for freshwater invertebrates based on surface application of MITC. Lettuce 59.0 21-day Average EEC (µg/L) 15.0 Melon 1.77 0.32 0.03 0.01 Nursery 22.1 4.97 0.40 0.20 Onion 7.07 1.69 0.13 0.07 2.55 0.75 0.05 0.03 78.2 17.5 1.42 0.70 Strawberry 186 48.0 3.37 1.92 Tomato 36.5 8.61 0.66 0.34 Turf 21.1 Uses (Application Method) Potato Species for Chronic Toxicity Daphnid Row Crops Species for Acute Toxicity Peak EEC (µg/L) Acute RQ* Chronic RQ** 1.07 0.60 4.56 0.38 = LOC exceedances (acute RQ > 0.05; chronic RQ > 1.0) are bolded and shaded. * Acute RQ = use-specific peak EEC / 55 µg/L **No chronic toxicity data are available to estimate chronic RQs. **Chronic RQ=use specific 21-day EEC/25 µg/L 89 0.18 The data in Table 5-3 indicate that no acute or chronic RQs exceed LOC for soil incorporated application of MITC. However, a review of surface applications indicates that acute RQs for all use scenarios except melon equal or exceed the acute risk LOC =0.05 (Table 5-4). RQs that exceeded the acute LOC ranged from 0.05 for potato to 3.37 for strawberry uses. The only surface use that exceeded the chronic LOC was for strawberry, with an RQ of 1.92. 5.1.1.c. Non-vascular Aquatic Plants Risk to aquatic non-vascular plants is based on 1-in-10 year peak EECs in the standard pond and the lowest acute toxicity value. Risk quotients for non-vascular plants based on the MITC for soil incorporated and surface applications are shown in Table 5-5 and Table 5-6, respectively. Aquatic non-vascular plant RQs will be used to assess potential indirect effects of MITC to the CTS (all 3 DPSs) via reduction in available prey items or habitat modification. Table 5-5. Summary of acute RQs for non-vascular aquatic plants based on MITC soil incorporated application. Uses (Application Method) Peak EEC (µg/L) Non-Listed Species RQ* Lettuce < 0.001 < 0.01 Melon < 0.001 < 0.01 Nursery 1.71 0.01 Onion 0.25 < 0.01 Potato 0.51 < 0.01 Row Crops 0.02 < 0.01 1.40 < 0.01 < 0.001 < 0.01 < 0.001 Turf LOC exceedances (acute RQ > 1) are bolded and shaded. * Acute RQ = use-specific peak EEC / 254 µg/L < 0.01 Strawberry Tomato Table 5-6. MITC acute RQs for freshwater nonvascular plants based on surface application for MITC. Uses (Application Method) Lettuce Melon Nursery Onion Potato Row Crops Peak EEC (µg/L) NonListed Species RQ* 58.98 1.77 22.12 7.07 2.55 78.16 < 0.01 90 < 0.01 0.01 < 0.01 < 0.01 < 0.01 Table 5-6. MITC acute RQs for freshwater nonvascular plants based on surface application for MITC. Uses (Application Method) Peak EEC (µg/L) NonListed Species RQ* 185.56 36.45 21.07 < 0.01 Strawberry Tomato Turf LOC exceedances (acute RQ > 1) are bolded and shaded. *non-listed Acute RQ = use-specific peak EEC / 254 µg/L < 0.01 < 0.01 Based on peak EECs for aquatic nonvascular plants there was no non-listed plant LOC exceedence for any use for the soil incorporated or surface application method. Since there is no obligate relationship to non-vascular plant for the CTS, only the RQs estimated using the EC50 value are considered in the determination in this risk assessment. Therefore, since no aquatic non-vascular plant risk quotients for non-listed plants from any uses exceed the LOC for MITC exposure, there is no potential for indirect effects to CTS (all 3 DPSs) that rely on non-vascular aquatic plants for food and habitat during at least some portion of their life-cycle. 5.1.1.d. Aquatic Vascular Plants Risk to aquatic vascular plants is based on 1-in-10 year peak EECs in the standard pond and the lowest acute toxicity value. Risk quotients for MITC are shown in Table 5-7 and Table 5-8, respectively. Aquatic vascular plant RQs will be used to assess potential indirect effects of MITC to the CTS (all 3 DPSs) via reduction in available prey items or habitat modification. Table 5-7. Summary of acute RQs for vascular aquatic plants based on MITC for soil incorporated applications. Uses (Application Method) Peak EEC (µg/L) NonListed RQ* Lettuce < 0.001 < 0.01 Melon < 0.001 < 0.01 Nursery 1.71 < 0.01 Onion 0.25 < 0.01 Potato 0.51 < 0.01 Row Crops 0.02 < 0.01 Strawberry 1.40 < 0.01 Tomato < 0.001 < 0.01 Turf < 0.001 < 0.01 91 *LOC exceedances (RQ > 1) are bolded; RQ = use-specific peak EEC / 590 µg/L **LOC exceedences (RQ≥1) are bolded; RQ = use-specific peak/ 90 µg/L Table 5-8. Summary of acute RQs for vascular plants Based on MITC using surface applications. Uses (Application Method) Peak EEC (µg/L) 58.98 1.77 22.12 7.07 2.55 78.16 185.56 36.45 21.07 Lettuce Melon Nursery Onion Potato Row Crops Strawberry Tomato Turf *LOC exceedances (RQ > 1) are bolded; RQ = use-specific peak EEC / 590 µg/L **LOC exceedences (RQ≥1) are bolded; RQ = use-specific peak/ 90 µg/L Nonlisted RQ* 0.10 < 0.01 0.04 0.01 < 0.01 0.13 0.31 0.06 0.03 Only non-listed plant RQs were used in the determination due to the CTS having no obligate relationship with aquatic plants. Based on peak EECs for aquatic vascular plants there was no LOC exceedence for any use for the soil incorporated applications, with all RQs <0.01. There was also no LOC exceedence for surface applications with RQs ranging from from < 0.01 for melon and potato uses to 0.31 for strawberry uses. 5.1.2. Exposures in the Terrestrial Habitat 5.1.2.a. Mammals (Surrogate for Terrestrial-phase CTS) As previously discussed in Section 2, potential for direct effects (i.e., inhalation exposure only) to the terrestrial-phase CTS are assessed based on direct acute effects to rats (as surrogate) as amphibian and bird toxicity data are not available. Potential direct risks to the terrestrial-phase CTS are evaluated using the SCREEN3 dispersion model and acute and chronic toxicity data for the most sensitive rat toxicity values for which data are available. EECs are divided by the toxicity value to estimate acute and chronic dose-based RQs as shown in Table 5-9. 92 Table 5-9. Terrestrial phase acute risk quotients for metam sodium applications and subsequent exposure to MITC. Application Scenario Maximum SCREEN3 EEC (g/m3) Acute Inahlation LC50 1 (g/m3) Acute Risk Quotient Surface Applications (Overhead or Drip Chemigation, 13,900 540,000 0.03 Flooded Applications, and Drench Applications) Soil Incorporated Applications 3,667 540,000 < 0.01 (Shank Injection) 1. Acute inhalation LC50 value based on mammalian inhalation toxicological value of 0.54 mg/l from rat study (MRID No. 16232742365605). The results for inhalation exposure are shown in Table 5-9. RQs from both surface applications (0.03) and for soil incorporated (0.01) applications resulted in no acute risk or acute listed LOC exceedence for direct effects to the CTS. 5.1.2.b. Mammals as a Surrogate for Indirect Effects Potential for indirect effects to the terrestrial-phase CTS may result from direct effects to mammals, which serve as prey to the terrestrial-phase CTS. Potential indirect effects to the CTS may also result from direct effects to mammals due to effects on habitat or a reduction in rearing sites due to the use of mammal burrows for shelter. RQs for indirect effects are calculated in the same manner as those for direct effects. An acute inhalation 4-hour LC50 value based on mammalian inhalation toxicological value of 0.54 mg/l from the rat study (MRID No. 16232742365605) was used to estimate the effect of air exposure to MITC. RQs ranging from 0.01-0.03 for all uses for reduction in prey represented by mammals are presented in Table 5-9. Those RQs did not exceed the LOC=0.1 for mammals routinely used in EFED’s risk assessments. No toxicity data was available to estimate the chronic effect of MITC on mammals. No chronic terrestrial exposure is anticipated given the low ambient air monitored concentrations of 10.41 g/m3 observed in Kern County where the highest use volume of metam sodium occurs (see Section 3.2.3). This ambient concentration is equivalent to a background air concentration and represents a concentration for chronic exposure. Therefore, there is no potential for indirect effects to the terrestrial-phase CTS (all 3 DPSs) that rely on mammals for prey and habitat during its life-cycle. 5.1.2.c. Terrestrial Invertebrates Potential for indirect effects to the terrestrial-phase CTS may result from direct acute effects to terrestrial invertebrates due to a reduction in prey. RQs for indirect effects are calculated in the 93 same manner as those for direct effects. In order to assess the risks of MITC to terrestrial invertebrates, the honey bee is usually used as a surrogate for terrestrial invertebrates. No honey bee study has been submitted, however a waiver for the bee study has been granted. No toxicity data was available to estimate the chronic effect of MITC in air. However, no chronic terrestrial exposure is anticipated given the low ambient air monitored concentrations of 10.41 g/m3 observed in Kern County where the highest use volume of metam sodium occurs. 5.1.2.d. Terrestrial Plants Potential indirect effects are expected to occur on CTS (all 3 DPSs) due to direct effects from metam sodium uses on terrestrial plants as these plants provide habitat to the species. Generally, for indirect effects, potential effects on terrestrial vegetation are assessed using RQs from terrestrial plant seedling emergence and vegetative vigor EC25 data as a screen. No terrestrial plant studies have been submitted for review. Therefore no RQs can be calculated. 5.1.3. Primary Constituent Elements of Designated Critical Habitat For metam sodium uses, the assessment endpoints for designated critical habitat PCEs involve the same endpoints as those being assessed relative to the potential for direct and indirect effects to the listed species assessed here. Therefore, the effects determinations for direct and indirect effects are used as the basis of the effects determination for potential modification to designated critical habitat. 5.2. Risk Description The risk description synthesizes overall conclusions regarding the likelihood of adverse impacts leading to a preliminary effects determination (i.e., “no effect,” “may affect, but not likely to adversely affect,” or “likely to adversely affect”) for the assessed species and the potential for modification of their designated critical habitat based on analysis of risk quotients and a comparison to the Level of Concern. The final No Effect/May Affect determination is made after the spatial analysis is completed at the end of the risk description, Section 5.2. In Section 5.2.3.b, a discussion of any potential overlap between areas where potential usage may result in LAA effects and areas where species are expected to occur (including any designated critical habitat) is presented. If there is no overlap of the species habitat and occurrence sections with the Potential Area of LAA Effects a No Effect determination is made. If the RQs presented in the Risk Estimation (Section 5.1) show no direct or indirect effects for the assessed species, and no modification to PCEs of the designated critical habitat, a preliminary “no effect” determination is made, based on metam sodium’s use within the action area. However, if LOCs for direct or indirect effect are exceeded or effects may modify the PCEs of the critical habitat, the Agency concludes a preliminary “may affect” determination for the FIFRA regulatory action regarding metam sodium/MITC. A summary of the risk estimation results are provided in Table 5-10 for direct and indirect effects to the listed species assessed here and in Table 5-11 for the PCEs of their designated critical habitat. 94 Although no direct effects to the aquatic phase CTS are expected from soil incorporated applications, effects for surface applications for all uses except melon with an MITC stressor RQ=0.03 are expected. Because the diet of the CTS includes amphibians, indirect effects for reduction in prey are also expected only for surface applications. The diet also includes aquatic invertebrates. Soil incorporated application MITC stressor RQs for both acute and chronic exposure do not exceed the listed or non-listed LOCs for any uses. Reduction in prey for aquatic invertebrates is expected due to the LOC exceedence for surface applications for all uses (MITC stressor RQs ranging from to 0.05 to 3.37) except melon (RQ=0.03) for acute exposure and for strawberry uses for chronic exposure (RQ=1.92). Indirect effects also include effects to aquatic plants. No indirect effects for aquatic plants are expected due to no LOC exceedence for any uses for either soil incorporated or surface applications. The highest MITC stressor RQ for nonvascular plants was 0.01 for nursery uses from soil incorporated and surface applications. The highest MITC stressor RQ for vascular plants from soil incorporated applications was < 0.01 for all uses. The highest MITC stressorRQ was 0.31 for strawberry uses from surface applications. No direct effects for the terrestrial phase CTS are expected from air concentration based on no LOC exceedence using the rat as a surrogate for the CTS. The diet for the terrestrial phase CTS includes amphibians, and based on no LOC exceedence, no risk is expected for prey reduction indirect effects. Although no MITC stressor RQs for soil incorporated and surface applications could be calculated for terrestrial invertebrates, risk is expected based on absence of data and the intended use of metam sodium to kill nematodes, which are soil inverterbates. Indirect effects include effects to terrestrial plants that may alter the habitat due to the absence of data for both soil incorporated and surface applications. Table 5-10. Risk estimation summary for MITC - direct and indirect effects to the California Tiger Salamander. Taxa LOC Exceedances (Yes/No) Non-listed and Listed Species (No: soil incorporated) Freshwater Fish and Aquatic phase Amphibians Description of Results of Risk Estimation Acute risk quotients exceeded LOC for none of the registered MITC uses for soil incorporated applications for nonlisted and listed species. RQs ranged from <0.01for lettuce, melon, onion, tomato and turf to 0.03 for nursery and strawberry. The chronic effect was estimated from the ACR=2.2. RQs ranged from <0.01 for lettuce, melon, onion, potato, row crops, tomato and turf to 0.01 for strawberry. 95 Assessed Species Potentially Affected Direct and Indirect Effects: CTS (all 3 DPSs) (prey) Table 5-10. Risk estimation summary for MITC - direct and indirect effects to the California Tiger Salamander. Taxa LOC Exceedances (Yes/No) Non-listed Species (Yes: acute surface applications) Description of Results of Risk Estimation Assessed Species Potentially Affected Acute risk quotients for lettuce, row crops, strawberry and tomato exceeded the non-listed LOC for surface applications with RQs ranging from 0.71 for tomato to 3.62 for strawberry uses. The chronic effect was estimated from the ACR=2.2. RQs ranged from 0.01 for potato to 0.72 for strawberry. Listed Species (Yes: acute surface applications) Acute risk quotients for lettuce, nursery, onion, potato, row crops, strawberry, tomato, and turf exceeded the endangered species LOC for surface applications. RQs ranged from 0.05 for potato uses to 3.62 for strawberry uses. The acute risk quotient for melon (0.03) did not exceed the listed LOC for surface applications. Listed and Non-listed Species (No: soil incorporated) Non-listed Species (Yes: Surface) Freshwater Invertebrates The chronic effect was estimated from the ACR=2.2. RQs ranged from 0.01 for potato to 0.72 for strawberry. Risk quotients for acute and chronic effects did not exceed LOC for any of the registered MITC uses for soil incorporated applications for nonlisted and listed species. RQs ranged from <0.01-0.03. Acute risk quotients for lettuce, nursery, onion, potato, row crops, strawberry, tomato, and turf exceeded the listed LOC for surface applications. RQs ranged from 0.66 for tomato to 3.37 for strawberry uses. The acute risk quotient for melon did not exceed the listed LOC for surface applications. Chronic effects were indicated through LOC exceedence for strawberry uses 96 Indirect Effects: CTS (all 3 DPSs) (prey) Table 5-10. Risk estimation summary for MITC - direct and indirect effects to the California Tiger Salamander. Taxa LOC Exceedances (Yes/No) Description of Results of Risk Estimation Assessed Species Potentially Affected only, with an RQ=1.92. Non-listed Species (No) Vascular Aquatic Plants Non-listed Species (No) NonVascular Aquatic Plants Birds, Reptiles, and TerrestrialPhase Amphibians (Rat as surrogate) Listed Species (No) Listed Species (No) Mammals Terrestrial Invertebrates Terrestrial Plants – Monocots Terrestrial Plants – Dicots Listed Species (Not Calculated ) Non-listed Species (Not Calculated) Aquatic vascular plant RQs did not exceed LOC = 1for any of the uses for soil incorporated applications, with RQs <0.01for all uses or surface applications with RQs ranging from <0.01for melon and potato to 0.31 for strawberry. Aquatic non-vascular plant RQs did not exceed LOC = 1 for any of the uses for either soil incorporated or surface applications. RQs ranged from <0.01 for lettuce, melon, onion, row crops, strawberry, tomato and turf to 0.1 for nursery for both soil incorporated and surface applications. MITC air concentration RQs for acute rat inhalation did not exceed the endangered species LOC=0.1 for any use patterns for both soil incorporated and surface applications. RQs ranged from 0.01 to 0.03. MITC air concentration RQs for acute rat inhalation did not exceed the endangered species LOC=0.1 for any use patterns for both soil incorporated and surface applications. RQs estimated using the SCREEN3 model resulted in an RQ=< 0.01 for soil incorporated applications and 0.03 for surface applications. Risk for both soil incorporated and surface applications could not be calculated as no toxicity values are available to calculate RQs. Indirect: CTS (all 3 DPSs) (alteration in shelter/cover) Indirect: CTS (all 3 DPSs) (diet and alteration in plants available to lay eggs) Direct and Indirect:CTS (all 3 DPSs) (prey) Direct and Indirect: CTS (all 3 DPSs) (prey) and shelter/cover from mammal burrows Indirect:CTS (all 3 DPSs) (prey) Risk for both soil incorporated and surface applications could not be calculated as no toxicity values are available to calculate RQs. Although no direct effects to the aquatic phase CTS are expected from soil incorporated applications, effects for surface applications for all uses except melon with an MITC stressor 97 RQ=0.03 are expected. Because the diet of the CTS includes amphibians, indirect effects for reduction in prey are also expected only for surface applications. The diet also includes aquatic invertebrates. Soil incorporated application MITC stressor RQs for both acute and chronic exposure do not exceed the listed or non-listed LOCs for any uses. Reduction in prey for aquatic invertebrates is expected due to the LOC exceedence for surface applications for all uses (RQs ranging from to 0.05 to 3.37) except melon (RQ=0.03) for acute exposure and for strawberry uses for chronic exposure (RQ=1.92). Indirect effects also include effects to aquatic plants based on reduction in food and alteration in availability of plants for reproduction sites. No indirect effects for aquatic plants are expected due to no LOC exceedence for any uses for either soil incorporated or surface applications. The highest MITC stressor RQ for nonvascular plants was 0.01 for nursery uses from soil incorporated and surface applications. The highest MITC stressor RQ for vascular plants from soil incorporated applications was <0.01 for all uses. The highest MITC stressor RQ was 0.31 for strawberry uses from surface applications. No direct effects for the terrestrial phase CTS are expected from air concentration based on no LOC exceedence using the rat as a surrogate for the CTS. The diet for the terrestrial phase CTS includes amphibians, and based on no LOC exceedence, no risk is expected for prey reduction indirect effects to amphibians using the rat as a surrogate. Although no MITC stressor RQs for soil incorporated and surface applications could be calculated for terrestrial invertebrates, risk is expected based on absence of data and the intended use of metam sodium to kill nematodes, which are soil inverterbates. The effect on mammals was evaluated because the CTS uses small mammal burrows for shelter. Indirect effects for reduction in shelter or cover from effects to mammals are not expected based on no LOC exceedence. Indirect effects include effects to terrestrial plants that may alter the habitat due to the absence of data for both soil incorporated and surface applications. Table 5-11. Risk estimation summary for MITC – effects to designated critical habitat (PCEs) of California Tiger Salamander. Taxa LOC Exceedances (Yes/No) Soil incorporated Applications Non-listed and Listed Species (No) Freshwater Fish and Aquatic phase Amphibians Surface Applications Non- Description of Results of Risk Estimation Acute risk quotients exceeded LOC for none of the registered MITC uses for soil incorporated for non-listed and listed species. MITC stressor RQs ranged from 0.03. The chronic effect was estimated from the ACR=2.2. MITC stressor RQs ranged from <0.01 for lettuce, melon, onion, potato, row crops, tomato and turf to 0.01 for strawberry. Acute risk quotients for lettuce, 98 Assessed Species Potentially Affected Inidirect:CTS (all 3 DPSs) Table 5-11. Risk estimation summary for MITC – effects to designated critical habitat (PCEs) of California Tiger Salamander. Taxa LOC Exceedances (Yes/No) listed Species (Yes) Description of Results of Risk Estimation Assessed Species Potentially Affected row crops, strawberry and tomato exceeded the non-listed LOC for surface applications. MITC stressor RQs range from 0.71 for tomato uses to 3.62 for strawberry uses. The MITC stressor RQ for melon was 0.03, which did not exceed the acute risk LOC=0.05. Surface Applications Listed Species (Yes) The chronic effect was estimated from the ACR=2.2. MITC stressor RQs ranged from 0.01 for potato to 0.72 for strawberry. Acute risk quotients for lettuce, nursery, onion, potato, row crops, strawberry, tomato, and turf exceeded the listed LOC for surface applications. MITC stressor RQs ranged from 0.05 for potato to3.62 for strawberry. The acute risk quotient for melon, 0.03, did not exceed the non-listed or listed LOC for surface applications. Freshwater Invertebrates Soil incorporated Applications Non-listed and Listed Species (No) Surface applications Non-Listed Species (Yes) No toxicity data are available to estimate chronic effects. Acute risk quotients exceeded LOC for none of the registered MITC uses for soil incorporated applications for non-listed and listed species. Acute risk quotients for lettuce, nursery, onion, potato, row crops, strawberry, tomato, and turf exceeded the listed LOC for surface applications. MITC stressor RQs range from 0.66 for tomato to 3.37 for strawberry. No chronic RQs exceeded the LOC=1 for any uses. RQs range from 0 to 0.02. 99 Indirect: CTS (all 3 DPSs) (prey) Table 5-11. Risk estimation summary for MITC – effects to designated critical habitat (PCEs) of California Tiger Salamander. Taxa LOC Exceedances (Yes/No) Surface applications Listed Species (Yes) Description of Results of Risk Estimation Assessed Species Potentially Affected Acute risk quotients for lettuce, nursery, onion, potato, row crops, strawberry, tomato, and turf exceeded the listed LOC for surface applications. RQs range from 0.05 for potato to 3.37 for strawberry uses.The acute risk quotient for melon did not exceed the listed LOC for surface applications, with an RQ=0.03. Chronic risk is expected due to the LOC exceedence for strawberry uses only, with an RQ=1.92. Soil incorporated and Surface Applications Non-listed Species (No) Vascular Aquatic Plants Non-Vascular Aquatic Plants Soil incorporated and Surface Applications Nonlisted Species (No) Soil incorporated and Surface Applications Listed Species (No) Birds, Reptiles, and TerrestrialPhase Amphibians Mammals Soil incorporated and Surface Applications Listed Species (No) Aquatic vascular plant MITC stressor RQs did not exceed LOC = 1for any of the uses for either soil incorporated, with all uses having MITC stressor RQs <0.01 or surface applications with RQs ranging from <0.01for melon and potato to 0.31 for strawberry. Aquatic non-vascular plant RQs did not exceed LOC = 1 for any of the uses for either soil incorporated or surface applications.MITC stressor RQs ranged from <0.01 to 0.1 for nursery. Rat inhalation data was used to evaluate the risk from MITC. MITC air concentration RQs for acute rat inhalation did not exceed the endangered species LOC=0.1 for any use patterns for surface applications. An RQ=0.03 was estimated for surface applications and < 0.01 for soil incorporated applications using the SCREEN3 model. MITC air concentration RQs for acute rat inhalation did not exceed the endangered species LOC=0.1 for any use patterns for sprinkler applications. An RQ=0.03 was estimated for surface applications 100 Indirect: CTS (all 3 DPSs) Reduction in available plants for egg laying Indirect: CTS (all 3 DPSs) (prey) Indirect: CTS (all 3 DPSs) (prey) Table 5-11. Risk estimation summary for MITC – effects to designated critical habitat (PCEs) of California Tiger Salamander. Taxa LOC Exceedances (Yes/No) Description of Results of Risk Estimation Assessed Species Potentially Affected and 0.01 for soil incorporated applications using the SCREEN3 model. Terrestrial Invertebrates Terrestrial Plants – Monocots Soil incorporated and Surface Applications Listed Species (NA) Soil incorporated and Surface Applications Non-listed Species (NA) Only non-listed LOCs would be evaluated because CTS does not have an obligate relationship with terrestrial monocots and dicots Risk could not be calculated as no toxicity values are available to calculate RQs. Indirect: CTS (all 3 DPSs) (prey) Indirect: CTS (all 3 DPSs) (prey) Risk could not be calculated as no toxicity values are available to calculate RQs. Following a preliminary “may affect” determination, additional information is considered to refine the potential for exposure at the predicted levels based on the life history characteristics (i.e., habitat range, feeding preferences, etc.) of the assessed species. Based on the best available information, the Agency uses the refined evaluation to distinguish those actions that “may affect, but are not likely to adversely affect” from those actions that are “likely to adversely affect” the assessed species and its designated critical habitat. The criteria used to make determinations that the effects of an action are “not likely to adversely affect” the assessed species or modify its designated critical habitat include the following: Significance of Effect: Insignificant effects are those that cannot be meaningfully measured, detected, or evaluated in the context of a level of effect where “take” occurs for even a single individual. “Take” in this context means to harass or harm, defined as the following: Harm includes significant habitat modification or degradation that results in death or injury to listed species by significantly impairing behavioral patterns such as breeding, feeding, or sheltering. Harass is defined as actions that create the likelihood of injury to listed species to such an extent as to significantly disrupt normal behavior patterns which include, but are not limited to, breeding, feeding, or sheltering. Likelihood of the Effect Occurring: Discountable effects are those that are extremely unlikely to occur. Adverse Nature of Effect: Effects that are wholly beneficial without any adverse effects are not considered adverse. 101 A description of the risk and effects determination for each of the established assessment endpoints for the assessed species and their designated critical habitat is provided in Sections Sections 5.2.1.a through 5.2.3. Each will start with a discussion of the potential for direct effects, followed by a discussion of the potential for indirect effects. A summary of the chance of an individual effect will also be provided for direct and indirect effects. These discussions do not consider the spatial analysis. For those listed species that have designated critical habitat, the section will end with a discussion on the potential for modification to the critical habitat from the use of metam sodium and subsequent exposure to MITC. Finally, in Section 5.2.3, a discussion of any potential overlap between areas of concern and the species (including any designated critical habitat) is presented. If there is no overlap of the species habitat and occurrence sections with the Potential Area of LAA Effects a No Effect determination is made. 5.2.1.a. Direct Effects to the Aquatic phase CTS The aquatic phase CTS inhabits freshwater pools or ponds. Direct effects to the aquatic phase CTS are estimated based on acute and chronic toxicity data from freshwater fish. The aquatic phase considers life stages of the CTS that are obligatory aquatic organisms, including eggs and larvae. It also considers submerged terrestrial-phase juveniles and adults, which spend a portion of their time in water bodies that may receive runoff containing metam MITC. Based on the registrant-submitted studies, the median lethal concentration for freshwater fish ranged from 51.2 (rainbow trout) to 14 (bluegill sunfish) µg ai/L. Model-estimated peak environmental concentrations resulting from different MITC uses ranged from 1.77 for melon to 185.56 μg/L for strawberry. The EEC is divided by the toxicity value to provide a risk quotient (RQ). This RQ is compared to a level of concern for each species. Although no risk for acute exposure is indicated for soil incorporated applications, risk is expected for suface applications for fish (Table 5-1 and Table 5-2). The risk is further refined using probit analysis to estimate the chance of an individual effect. Use of Probit Slope Response Relationship to Provide Information on the Endangered Species Levels of Concern Generally, available toxicity data provides an LC50 or an EC50, (the concentration at which 50% of the test population exhibits the designated endpoint, usually mortality). Because the Endangered Species Act (ESA) requires determination of potential effects at an individual level, this information must be extrapolated from existing data. The Agency uses the probit dose response relationship as a tool for providing additional information on the potential for acute direct effects to individual listed species and aquatic animals that may indirectly affect the listed species of concern (U.S. EPA, 2004b). As part of the risk characterization, an interpretation of the acute LOC for listed species (or specific RQ) is discussed. This interpretation is presented in terms of the chance of an individual event (i.e., mortality or immobilization) should exposure at the LOC (or for a specific RQ) actually occur for a species with sensitivity to MITC on par with the acute toxicity endpoint selected for RQ calculation. To accomplish this interpretation, the Agency uses the slope of the dose response relationship (where available) from the toxicity study used to establish the acute toxicity measures of effect for each taxonomic group that is relevant to this assessment. The individual effects probability associated with the LOC (or specific RQ) 102 is based on the mean estimate of the slope and an assumption of a probit dose response relationship. In addition to a single effects probability estimate based on the mean, upper and lower estimates of the effects probability are also provided to account for variance in the slope, if available. The upper and lower bounds of the effects probability are based on available information on the 95% confidence interval of the slope. A statement regarding the confidence in the estimated event probabilities is also included. Studies with good probit fit characteristics (i.e., statistically appropriate for the data set) are associated with a high degree of confidence. Conversely, a low degree of confidence is associated with data from studies that do not statistically support a probit dose response relationship. In addition, confidence in the data set may be reduced by high variance in the slope (i.e., large 95% confidence intervals), despite good probit fit characteristics. In addition to a single effects probability estimate based on the mean, upper and lower estimates of the effects probability are also provided to account for variance in the slope (Urban and Cook, 1986), if available. Individual effect probabilities are calculated based on an Excel spreadsheet tool IECV1.1 (Individual Effect Chance Model Version 1.1) developed by the U.S. EPA, OPP, Environmental Fate and Effects Division (June 22, 2004). The model allows for such calculations by entering the mean slope estimate (and the 95% confidence bounds of that estimate) as the slope parameter for the spreadsheet. In addition, the acute RQ is entered as the desired threshold. 103 Table 5-12. Estimate of the chance of individual effect for direct effects from MITC using the fish as a surrogate for the CTS. Uses (Application Method) Soil incorporated and Surface applications Chance of Individual Effect At LOC-0.05 Slope =4.5:~ 1 in 4.18E+08 Upper and lower boundaries slope=2 ~ 1 in 2.16E+02 slope=9 ~ 1 in 1.75E+31 Soil incorporated Applications Chance of Individual Effect At RQ Surface applications Chance of Individual Effect at RQ RQ=0 ~ 1 in 1.81 RQ=0 ~ 1 in 2.76E+11 ~ 1 in 2.76E+11 RQ=0 ~ 1 in 2.73 ~ 1 in 8.86E+18 RQ=0 ~ 1 in 4.18E+08 ~ 1 in 1.01 Tomato ~ 1 in 2.76E+11 RQ=0 Turf RQ=0 ~ 1 in 3.41E+01 Lettuce Melon Nursery Onion Potato Row Crops Strawberry ~ 1 in 2.99E+04 ~ 1 in 1.33 ~ 1 in 4.80 The chance of an individual effect was calculated at the LOC for both soil incorporated and surface applications. The chance of an individual effect on the aquatic phase CTS for direct effects using the rainbow trout as a surrogate was estimated using the default slope =4.5 and the bounded slopes = 2 and 9 at the LOC and RQ for both soil incorporated and surface applications for each use. The estimate for the chance of individual effect at the LOC was calculated to be ~ 1 in 4.18E+08 with the listed species LOC as the threshold. The upper and lower bounds were estimated to be ~ 1 in 2.16 x 10² and ~ 1 in 1.75 x 1031. The chance of an individual effect at the RQ was estimated for nursery, potato and strawberry uses for soil incorporated applications. The other uses resulted in an RQ=0. At the slope default=4.5 the chance of an individual effect for nursery and strawberry uses was ~ 1 in 2.76 x 10¹¹. The chance for an individual effect for potato use was ~ 1 in 8.86 x 10¹⁸. Probit analysis was also used to estimate the chance of an individual effect for surface applications of metam sodium. The chance of an individual effect for surface applications ranged from ~ 1 in 2.76E+11for melon to ~ 1 in 1.01 for strawberry uses. Given the high probability of an individual mortality occurrence based on acute exposure for surface applications and in view of acute RQs that are above LOCs for freshwater fish, MITC is likely to cause direct adverse effects to the aquatic phase CTS (all 3 DPSs). A total of 6 fish incidents were reported for metam sodium in the EIIS database. The information from the incident reports is not used in the assessment due to lack of information to exclude other causes (3), incidents that do not reflect agricultural uses (2) or incidents that are classified as not probable based on information contained in the report (1). More details on the fish incidents can be found in Table 4-5. 104 In summary, as the listed and non-listed species LOCs were exceeded for MITC and the probability of an individual mortality is high, there is a potential for MITC to cause direct effects to the aquatic phase CTS (all 3 DPSs). These exposure occurrences supporting the risks to aquatic species can be attributed to the high application rate of metam sodium, and high solubility and mobility of MITC. These are applicable to any treated fields open to rainfall infiltration and resulting runoff off of the treated field including bare soil and bedded tarped applications. For broadcast tarped applications, 26 percent of MITC can be lost due to aerobic soil meatabolism over the 4 day required time duration of tarp covering according to first-order degradation as expressed in equations presented in Section 2.11. However, due to the high toxicity of MITC to aquatic organisms, this reduction due to soil biodegradation below the tarp may not be enough to mitigate the risk for direct effects to freshwater fish on an acute basis for strawberry and row crops, for aquatic invertebrates on an acute and chronic basis for strawberry, and row crops, and freshwater vascular and nonvascular plants on an acute basis for strawberry crops. However, this does not take into account the fact that less MITC may be available to rainfall as application dates in PRZM/EXAMS simulations were not changed to account for the four day tarp covering time interval. Direct effects are not expected to soil incoporated applications since the majority of MITC residues are expected to remain below the runoff extraction zone given the water or soil sealing practices required on the label. 5.2.1.b. Direct Effects to the Terrestrial-Phase CTS Potential for direct effects to the terrestrial-phase CTS are assessed based on direct acute and chronic toxicity effects to the rat as surrogate. There is not an established LOC threshold expressly for the interpretation of RQs calculated for inhalation exposure risks. However, if the existing LOC values for acute mammalian wildlife risk were used to evaluate such RQs, the analysis for inhalation exposure based on modeling using SCREEN3 at the edge of an 80-acre field (risk quotient of 0.03 for surface applications) would suggest that exposures to MITC in air would not exceed the terrestrial acute endangered species LOC (0.1). The modeling is based on a 320 lb a.i./A maximum application rate. The risk to terrestrial-phase CTS and to terrestrial animal prey items of the CTS is expected to largely depend on inhalation exposure to off-gassed MITC from treated sites. Birds are routinely used to evaluate the effect on amphibians; however no avian inhalation data are available. Rat inhalation data are available; therefore the rat will be used as a surrogate for the CTS. With an acute mammal inhalation LC50 of 0.54 mg/L (540,000 µg/m3), the risk quotient for this modeled concentration is 0.03 (13,900 μg/ m3 /540,000 μg/ m3), below the 0.1 endangered species LOC. Based on the above analysis with mammals, it appears that terrestrial phase CTS as well as vertebrate prey of the CTS would not be acutely adversely affected by MITC. The above assessment is limited to acute effects and exposure windows. Terrestrial-phase CTS as well as its vertebrate prey (i.e., small mammals) may have home ranges in the treatment area and may be exposed more than once as the result of metam sodium use on multiple fields over 105 multiple days in a geographic area. However, multiple fields may be treated in an area over a number of days. Therefore, there still exists a potential that terrestrial phase CTS and/or its vertebrate prey within an area of multiple treated fields may be exposed to MITC emissions on a repeated basis over time. The above analysis is based on mammalian toxicity data for the inhalation route. Birds are considered to be surrogates for amphibians, including the CTS. A similar analysis could be performed for birds, if the avian toxicity were available. However, no inhalation toxicity data for MITC are available for birds. If acute toxicity by the oral route were available for both mammals and birds, an evaluation of the relative sensitivity via the oral route might be extrapolated to the inhalation route to estimate an acute inhalation endpoint for birds. However, no acute oral LD50 data for MITC are available for birds. Therefore, an assumption of equivalent sensitivity between birds and mammals for exposure through inhalation is being employed. This interspecies extrapolation may underestimate the risk to birds, given higher respiration rates for birds versus mammals, and physiological differences in the avian lung that would tend to favor higher diffusion rates across the lung membrane when compared to mammals. Therefore, inhalation analyses that suggest a potential for adverse effects in mammals would also suggest potential risks to birds via the inhalation route, but analyses not indicating risk to wild mammals would not necessarily be true for birds also. Because of generally lower metabolism of amphibians relative to birds, they may be less sensitive than birds to inhaled toxicants; however, they are less mobile than adult birds and gas exchange can occur through the skin (and respiratory membranes could possibly be damaged by MITC), and thus amphibians may be at similar or greater risk overall. Table 5-13. Estimate of the chance of individual effect for direct effects on the terrestrial Phase CTS using the rat as a surrogate. Uses (Application Method) Chance of Individual Effect At LOC-0.1 Slope =4.5:~ 1 in 2.94E+05 Upper and lower boundaries slope=2 ~ 1 in 4.40E+01 slope=9 ~ 1 in 8.86E+18 All Uses Chance of Individual Effect at RQ Using Soil incorporated Aplication Slope =4.5:~ 1 in 8.86E+18 Upper and lower boundaries slope=2 ~ 1 in 3.16E+04 slope=9 ~ 1 in 1.03E+72 Chance of Individual Effect at RQ Using Surface Aplications Slope =4.5:~ 1 in 2.76E+11 Upper and lower boundaries slope=2 ~ 1 in 8.62E+02 slope=9 ~ 1 in 2.14E+42 The chance of an individual effect on the terrestrial phase CTS for direct effects using the rat as a surrogate was estimated using the default slope =4.5 and the bounded slopes = 2 and 9 at the LOC and RQ =0.03 for the soil incorporated and surface application methods. The estimate for the chance of individual effect was calculated to be ~ 1 in 2.94E+05 with the listed species LOC as the threshold and 1 in 2.76E+11 at the RQ level. Given the low probability of an individual mortality occurrence based on acute exposure and in view of acute RQs that do not exceed LOCs for the rate as a surrogate, MITC is not likely to cause direct adverse effects to the terrestrial phase CTS (all 3 DPSs) for either soil incorporated applications or surface applications. The 106 limited risk can be attributed to the very low peak MITC volatile flux rates observed in field volatility studies, accounting for up to only 4.53 percent of applied metam sodium on a massbalance basis. Water sealing methods required on the label and applied accordingly during the field studies is one possible reason flux rates were minimized, as MITC’s relatively low Henry’s Law Constant for a fumigant prevented higher volatilization rates due in the moist soil. As mentioned Section 1.3.1.b, there is the potential for soil bourne MITC dermal and inhalation exposure to burrowing CTS off-site fields treated with metam sodium. A qualitative analysis is presented here which demonstrates the potential for the bioavailablity of MITC off-site treated fields. A worst-case sceario was identified considering all of the crop scenarios simulated for the surface water exposure analysis. The worst case scenario was identified from the assumption that the most intense runoff event results in the most efficient transport of MITC off of the treated field. This event was identified from the California Strawberry crop scenario. It was determined that up to 4,896 g of MITC can be bioavailable off of a 10 ha treated field based on the PRZM predicted edge of the field runoff concentration given the highly mobile characteristics of MITC. 5.2.1.c. Indirect Effects The diet of the aquatic phase CTS is comprised of algae, snails, zooplankton, small crustaceans, and aquatic larvae and invertebrates, smaller tadpoles of Pacific tree frogs, CRLF, toads. The terrestrial-phase CTS feeds on terrestrial invertebrates, insects, frogs, and worms. i.a. Potential Loss of Prey to CTS Fish and Amphibians: Fish data are used to estimate the risk to both fish and amphibians. There is no evidence in the literature that the aquatic phase CTS consumes fish. Table 5-1 and Table 5-2 present the MITC stressor RQs for fish as a surrogate for amphibians as loss of prey for the CTS. Non-listed species LOCs were exceeded for freshwater fish for surface applications of lettuce, row crops, and strawberry and tomato uses. The listed species LOC exceedence for surface applications of metam sodium indicates potential risk from all uses of metam sodium except melon. The acute risk is further fined by estimating the chance of an individual effect using the probit analysis. The probit results for the fish are found in Table 5-12 with a discussion in Section 5.2.1.a. No chronic fish toxicity data were available to evaluate the effect of metam sodium use. Freshwater Invertebrates: Table 5-3 and Table 5-4 present the MITC stressor RQs for Daphnia as a surrogate for aquatic invertebrates to evaluate loss of prey for the CTS. The LOC exceedence for surface applications of metam sodium indicates potential risk from the use metam sodium. The risk is further fined by estimating the chance of an individual effect using the probit analysis. The probit results for the aquatic invertebrates are found in Table 5-14 with a discussion in Section 5.2.1.a. 107 Table 5-14. Estimate of the chance of individual effect for indirect effects using the Daphnia as a surrogate. Uses (Application Method) Lettuce Chance of Individual Effect At LOC-0.05 Slope =4.5:~ 1 in 4.18E+08 Upper and lower boundaries slope=2 ~ 1 in 2.16E+02 slope=9 ~ 1 in 1.75E+31 Soil incorporated Applications Chance of Individual Effect at RQ RQ < 0.01 Surface Application Chance of Individual Effect at RQ RQ < 0.01 ~ 1 in 1.65 ~ 1 in 2.76E+11 ~ 1 in 4.41E+19 ~ 1 in 2.02E+01 Onion RQ < 0.01 ~ 1 in 1.64E+04 Potato RQ < 0.01 ~ 1 in 4.18E+08 Row Crops RQ < 0.01 ~ 1 in 1.25 Strawberry ~ 1 in 8.86E+18 ~ 1 in 1.01 Tomato RQ < 0.01 ~ 1 in 3.97 Turf RQ < 0.01 ~ 1 in 2.46E+01 Melon Nursery The chance of an individual effect was calculated at the LOC for both soil incorporated and surface applications. The chance of an individual effect on the aquatic phase CTS for indirect effects using the Daphnia as a surrogate was estimated using the default slope =4.5 and the bounded slopes = 2 and 9 at the LOC and MITC stressor RQ for each use. The estimate for the chance of individual effect at the LOC was calculated to be ~ 1 in 4.18E+08 with the listed species LOC as the threshold. The upper and lower bounds were estimated to be ~ 1 in 2.16E+02 and ~ 1 in 1.75E+31. The chance of an individual effect at the RQ was estimated for nursery and strawberry uses for soil incorporated applications. The other uses resulted in an RQ=0. At the slope default=4.5 the chance of an individual effect for nursery and strawberry uses was ~ 1 in 4.41E+19 and ~ 1 in 8.86E+18, respectively. Probit analysis was also used to estimate the chance of an individual effect for surface applications of metam sodium. The chance of an individual effect for surface applications ranged from ~ 1 in 2.76E+11 for melon to ~ 1 in 1.01 for strawberry uses. The RQ=1.92 for strawberry use was the only use that exceeded the chronic LOC =1 for surface applications. Probit analysis is not used for chronic determinations. Given the high probability of an individual mortality occurrence based on acute exposure for surface applications and in view of acute RQs that are above LOCs for freshwater invertebrates, MITC is likely to cause indirect adverse effects to the aquatic phase CTS (all 3 DPSs). Terrestrial Invertebrates: The terrestrial-phase CTS feeds on terrestrial invertebrates, insects, and worms. 108 The honey bee is used as a surrogate for terrestrial invertebrates. Risk quotients were not calculated for terrestrial invertebrates as the available toxicity endpoints were not available evaluating the effects from either soil incorporated or surface applications. A waiver has been submitted. No other terrestrial invertebrate data were available on MITC. Based on the data from labels, risk to terrestrial invertebrates appears likely as metam sodium is labeled for the control of soil invertebrates. Mammals: An evaluation of reduction in prey indirect effects to the terrestrial-phase CTS are due to a diet that includes frogs as well as the CTS’ use of mammal burrows for shelter. None of the acute inhalation RQs exceeded the listed species LOC for mammals (Table 5-9). There was also a low probability of an individual effect as estimated using probit analysis (Table 5-13). It is unlikely that mammals would be affected by MITC. No toxicity data was available to estimate the chronic effect of MITC in air. However, no chronic terrestrial exposure is anticipated given the low ambient air monitored concentrations of 10.41 g/m3 observed in Kern County where the highest use volume of metam sodium occurs. i.bPotential Modification of Habitat Both reduction in prey and reduction in shelter are evaluated for habitat modification. Effects on reduction in prey for the aquatic phase CTS are indicated for fish as a surrogate for amphibians for surface applications of all uses except melon (Table 5-2). In addition all uses except melon for surface applications indicate risk to aquatic invertebrates (Table 5-4). Habitat modification includes potential risk for terrestrial invertebrates due to the absence of toxicity data as well as labeled uses to kill nematodes. Habitat modification involves alteration to shelter or modification of plants that may reduce structure or refuge as well as reduction in prey. No potential risk is indicated for mammals from the use of either soil incorporated or suface applications based on no LOC exceedence. Aquatic Plants: Aquatic plants serve several important functions in aquatic ecosystems. Non-vascular aquatic plants are primary producers and provide the autochthonous energy base for aquatic ecosystems. Vascular plants provide structure, rather than energy, to the system, as attachment sites for many aquatic invertebrates, and refugia for juvenile organisms, such as fish and frogs. Emergent plants help reduce sediment loading and provide stability to near-shore areas and lower stream banks. In addition, vascular aquatic plants are important as attachment sites for egg masses of aquatic species. Presence of pesticides with herbicidal properties in the water bodies supporting the CTS (all 3 DPSs) could reduce populations of sensitive vascular and non-vascular plants, and/or cause a shift in phytoplankton community dynamics. Typically, aquatic plant populations are relatively 109 dynamic, and the presence of herbicides in the water may result in an overall reduction of biomass, and/or a shift in community composition as more sensitive species are eliminated. Pesticides with herbicidal properties may also modify timing of maximum plant growth. Potential indirect effects to the CTS based on impacts to habitat and/or primary production are assessed using RQs from freshwater aquatic vascular and non-vascular plant data. Since there is no obligate relationship between the CTS and aquatic plants, and plant LOCs for vascular and non-vascular plants were not exceeded for any metam sodium uses for either soil incorporated or surface applications. Therefore, it is not expected that MITC exposure from metam sodium uses would elicit adverse impacts on other vascular and non-vascular plants resulting in indirect effects to CTS via direct habitat-related impacts to non-vascular and vascular plants. Terrestrial Plants: Terrestrial plants serve several important habitat-related functions for the CTS. In addition to providing habitat and cover for invertebrate and vertebrate prey items of the listed assessed species, terrestrial vegetation also provides shelter and cover from predators while foraging. Upland vegetation including grassland and woodlands provides cover during dispersal. Riparian vegetation helps to maintain the integrity of aquatic systems by providing bank and thermal stability, serving as a buffer to filter out sediment, nutrients, and contaminants before they reach the watershed, and serving as an energy source. In a healthy riparian system, there is often a three-tier vegetation system, with trees as an overstory, shrubs as an understory, and grasses and forbs forming the ground cover. Aquatic phase CTS may occupy waterbodies with dense riparian vegetation. Upland habitat for the terrestrial-phase CTS includes shrubs. It is reasonable to presume that the shrub species in both types of habitats will intercept some of the MITC which might otherwise be deposited on the more sensitive herbaceous species. Additionally, in a natural system, senescent plants, fallen leaves, and other debris often provide a litter layer which might also serve to protect newly emerging herbaceous plants. Areas of bare soil in the CTS habitat are expected to be relatively small in comparison to the total habitat area. Thus, effects in a natural system are likely to be more closely approximated by the vegetative vigor endpoints than the seedling emergence endpoints. No seedling emergence or vegetative vigor MITC stressor RQs for terrestrial plants were estimated due to the absence of plant toxicity values. A waiver for the terrestrial plant studies has been submitted but was denied. Incidents An additional line of evidence is based on a review of incident reports from the EIIS data base were reviewed. Five terrestrial plant incidents were reported, but two were misapplications, two reported multiple pesticides and one indicated a misapplication. The fifth incident report was classified as possible, but lacked information on the amount of metam used or if any other pesticides were used. Therefore the reported incidents are not used to support the risk determination. 110 In summary, terrestrial plant determinations were based on uncertainty due to the absence of toxicity data. Therefore, upland and riparian vegetation may be affected. Given that both upland and riparian areas are comprised of a mixture of both non-sensitive woody (trees and shrubs) and sensitive grassy herbaceous vegetation, CTS may be indirectly affected by adverse effects to herbaceous vegetation which provides habitat and cover for the CTS and its prey. Therefore, MITC exposure from metam sodium uses has the potential to indirectly affect CTS (all 3 DPSs). Several water monitoring studies were conducted following the derailment of a railroad car north of Dunsmuir, California on July 4, 1991, when approximately 19,000 to 27,000 kg of metam sodium spilled into the Sacramento River. MITC concentrations in water samples collected following the spill, reach a maximum of 5,500 µg/L three days after the spill at the northern most inlet of Shasta Lake, and decreased to 8 µg/L six days later. None of the degradates of metam sodium in water samples analyzed were detected 1 week after the spill (del Rosareo et al., 1994 and Segawa et at., 1991). A news report of a fish kill reported detecting a concentration =1.62µg/L of MITC in a California incident. That concentration is higher than all the estimated uses except nursery for soil incorporated applications and lower than all estimated uses for surface applications. The RQ=0.03 for both fish and Daphnia using the EEC=1.62µg/L results in a “No Effect” determination. There is uncertainty regarding when measurements were taken relative to the suspected application and in the distance from the source of release to the measurement site. This incident report is not available in the EIIS database at this time. 5.2.2. Modification of Designated Critical Habitat Based on the weight-of-evidence, there is a potential for the modification of designated critical habitat for CTS based on freshwater invertebrate prey loss due to changes in the composition of food supply. Aquatic plants are not at risk from metam sodium uses. However, risk to terrestrial plants is based on the absence of toxicity data for estimating effects and reported incidents in the EIIS database. As a result of potential risk to terrestrial plants, CTS (all 3 DPSs) will be impacted due to effects such as changes in primary productivity, modification of water quality parameters, habitat morphology, and/or sedimentation. 5.2.3. Spatial Extent of Potential Effects Since LOCs are exceeded, analysis of the spatial extent of potential LAA effects is needed to determine where effects may occur in relation to the treated site. If the potential area of usage and subsequent Potential Area of LAA Effects overlaps with CTS habitat or areas of occurrence and/or critical habitat, a likely to adversely affect determination is made. If the Potential Area of LAA Effects and the CTS habitat and areas of occurrence and/or critical habitat do not overlap, a no effect determination is made. To determine this area, the footprint of metam sodium’s use pattern is identified, using corresponding land cover data. For metam sodium uses, these land cover types include cultivated, orchard/vineyard, developed open/developed low/developed medium/ developed 111 high, and turf. Actual usage is expected to occur in a smaller area as the chemical is only expected to be used on a portion of the identified area. The spatial extent of the effects determination also includes areas beyond the initial area of concern that may be impacted by runoff (Use Footprint + distance down stream or down wind from use sites where organisms relevant to the assessed species may be affected). The determination of the downstream dilution for spatial extent of the effects determination is described below. 5.2.3.a. Downstream Dilution Analysis The downstream extent of exposure in streams and rivers where the EEC could potentially be above levels that would exceed the most sensitive LOC is calculated using the downstream dilution model. To complete this assessment, the greatest ratio of aquatic RQ to LOC was estimated. Using an assumption of uniform runoff across the landscape, it is assumed that streams flowing through treated areas (i.e., the Initial Area of Concern) are represented by the modeled EECs; as those waters move downstream, it is assumed that the influx of non-impacted water will dilute the concentrations of MITC present. The highest RQ/LOC ratio and the land cover class (cultivated crop) are used as inputs into the downstream dilution model. The downstream dilution analysis is based on the greatest ratio of aquatic RQ to LOC, which was calculated to be 72.4 for MITC based on direct acute effects. This value was estimated using the LC50 value for the most sensitive fish species (Rainbow trout) of 51.2 ppb and peak average EECs from MITC surface applications to Strawberries of 186 ppb. The downstream dilution approach is described in more detail in Appendix K. This value has been input into the downstream dilution model and results in a distance of 52.1 kilometers which represents the maximum continuous distance of downstream dilution from the edge of the Initial Area of Concern where LOCs may be exceeded in the aquatic environment. 5.2.3.b. Overlap of Potential Areas of LAA Effect and Habitat and Occurrence of CTS The downstream dilution analyses help to identify areas of potential effect to the CTS from registered uses of metam sodium. The Potential Area of LAA Effects on survival, growth, and reproduction for the CTS from for MITC exposure in runoff from metam sodium applications has an area of potential LAA effects that extends up to 285 km downstream from the site of application. When this distance is added to the footprint of the Initial Area of Concern (which represents potential metam sodium use sites) and compared to CTS habitat, there are several areas of overlap (Figures 5-1 and 5-2). The overlap between the areas of LAA effect and CTS habitat, including designated critical habitat, indicates that metam sodium use in California has the potential to affect the CTS (all 3 DPSs). More information on the spatial analysis is available in Appendix K. 112 Figure 5-1. Map showing the metam sodium use overlap with the CTS critical habitat and occurrence sections identified by Case No. 07-2794-JCS. 113 5.3. Effects Determinations 5.3.1 CTS A comprehensive look at the available evidence suggests that direct effects to the aquatic phase CTS are likely. Indirect effects to CTS are possible due to adverse effects on aquatic and terrestrial prey which may provide food as well as terrestrial plants which provide habitat for the species. Therefore, the Agency makes a may affect, and likely to adversely affect determination for the CTS (all 3 DPSs) and a habitat modification determination for their designated critical habitat based on the potential for direct and indirect effects and effects to the PCEs of critical habitat. 5.3.2 Addressing the Risk Hypotheses In order to conclude this risk assessment, it is necessary to address the risk hypotheses defined in Section 2.10.1. Based on the conclusions of this assessment, the hypothesis that MITC may directly affect the terrestrial-phase CTS (all 3 DPSs) may be rejected. The hypothesis that MITC may indirectly affect the CTS (all 3 DPSs) and affect their designated critical habitat by reducing or changing the composition of the aquatic plant community in the species’ current range can also be rejected. However, the other hypotheses listed below cannot be rejected: MITC may directly affect the aquatic phase CTS (all 3 DPSs). MITC may indirectly affect the aquatic phaseCTS (all 3 DPSs) and/or affect their designated critical habitat by reducing or changing the composition of the available prey in the species’ current range. MITC may indirectly affect their designated critical habitat by reducing or changing the composition of the terrestrial food supply based on mammals and soil invertebrates as the surrogate for amphibians can be rejected. 114 6. Uncertainties Uncertainties that apply to most assessments completed for the San Francisco Bay Species Litigation are discussed in Attachment 1. This section describes additional uncertainties specific to this assessment. 6.1. Exposure Assessment Uncertainties Overall, the uncertainties inherent in the exposure assessment tend to result in over-estimation of exposures. This is apparent when comparing modeling results with monitoring data. Surface water monitoring data are over an order of magnitude less than the maximum estimated 90th percentile surface water EECs predicted by PRZM/EXAMS or the peak air concentration predicted by SCREEN3. In general, the monitoring data should be considered a lower bound on exposure, while modeling represents an upper bound. 6.1.1. Uncertainty Associated with Maximum Use Scenario The screening-level risk assessment focuses on characterizing potential ecological risks resulting from a maximum use scenario, which is determined from labeled statements of maximum application rate. The frequency at which actual uses approach this maximum use scenario may be dependant on pest resistance, timing of applications, cultural practices, and market forces. 6.1.2. Aquatic Exposure Modeling of Metam Sodium and MITC The standard ecological water body scenario (EXAMS pond) used to calculate potential aquatic exposure to pesticides is intended to represent conservative estimates, and to avoid underestimations of the actual exposure. The standard scenario consists of application to a 10hectare field bordering a 1-hectare, 2-meter deep (20,000 m3) pond with no outlet. Exposure estimates generated using the EXAMS pond are intended to represent a wide variety of vulnerable water bodies that occur at the top of watersheds including prairie pot holes, playa lakes, wetlands, vernal pools, man-made and natural ponds, and intermittent and lower order streams. As a group, there are factors that make these water bodies more or less vulnerable than the EXAMS pond. Static water bodies that have larger ratios of pesticide-treated drainage area to water body volume would be expected to have higher peak EECs than the EXAMS pond. These water bodies will be either smaller in size or have larger drainage areas. Smaller water bodies have limited storage capacity and thus may overflow and carry pesticide in the discharge, whereas the EXAMS pond has no discharge. As watershed size increases beyond 10-hectares, it becomes increasingly unlikely that the entire watershed is planted with a single crop that is all treated simultaneously with the pesticide. Headwater streams can also have peak concentrations higher than the EXAMS pond, but they likely persist for only short periods of time and are then carried and dissipated downstream. The Agency acknowledges that there are some unique aquatic habitats that are not accurately captured by this modeling scenario and modeling results may, therefore, under- or over-estimate exposure, depending on a number of variables. For example, salamanders travel from estuarine to lotic habitats and the exposure may not be accurately reflected by the EXAMS pond. The 115 Agency does not currently have sufficient information regarding the hydrology of these aquatic habitats to develop a specific alternate scenario for the salamander. The EXAMS pond is assumed to be representative of exposure to the aquatic-phase salamander. In addition, the Services agree that the existing EXAMS pond represents the best currently available approach for estimating aquatic exposure to pesticides (USFWS/NMFS 2004). Since metam sodium is applied as a carrier pre-cursor to a fumigant, there are some uncertainties in the modeling given the nature of the anticipated dissipation route which is influenced by volatility of the MITC by-product. First, the quality assurance process for the volatilization algorithm used in the PRZM model has not been completed. In addition, changes in temperature depending on seasons when metam sodium is applied may influence the resulting volatilization rates of MITC. Changes in temperature are not accounted for in the current version of the volatility algorithm. However, given all of these uncertainties, an analysis shown in Appendix E shows that there are comparable results to field volatility studies. In addition, the impact of tarp sealing methods were not assessed in this assessment. However, since metam sodium labels do not specify tarps as the required sealing method, the modeling scheme developed reflecting water sealing methods should be representative of the upper-bound scenario as MITC can be expected to translocate off-site via runoff. Furthermore, there is some uncertainty in the distribution of MITC within the top soil immediately following application. The PRZM/EXAMS modeling a constant distribution of MITC in the soil (CAM = 4) since it was assumed that MITC would be distributed uniformally in irrigation water seals which are used in many cases. However, it is possible that a linearly decreasing distribution of MITC in the soil (equivalent to CAM = 6 in the modeling) can occur in some cases given the volatile nature of the chemical. An initial evaluation using the CAM = 6 scenario revealed that EECs in surface water were both higher and lower than the CAM = 4 scenario. Uncertainties associated with each of these individual components add to the overall uncertainty of the modeled concentrations. Additionally, model inputs from the environmental fate degradation studies are chosen to represent the upper confidence bound on the mean values that are not expected to be exceeded in the environment approximately 90 percent of the time. Mobility input values are chosen to be representative of conditions in the environment. The natural variation in soils adds to the uncertainty of modeled values. Factors such as application date, crop emergence date, and canopy cover can also affect estimated concentrations, adding to the uncertainty of modeled values. Factors within the ambient environment such as soil temperatures, sunlight intensity, antecedent soil moisture, and surface water temperatures can cause actual aquatic concentrations to differ for the modeled values. In order to account for uncertainties associated with modeling, available monitoring data were considered and compared to PRZM/EXAMS estimates of peak EECs for the different uses. The only monitoring data available for MITC are associated with incidents. Most recently, MITC was detected at 1.6 ppb around the Holtville, CA area in a canal in close proximity to expected metam sodium applications. However, this concentration is over an order of magnitude lower 116 than the upper-bound EEC from PRZM/EXAMS, which suggests that the model produces conservative results. 6.1.3. Water Monitoring Data Limitations The surface water monitoring data were available for one instance, possibly associated with a pesticide application. Therefore, the monitoring data most probably do not represent the highest concentrations in surface water. Furthermore, the monitoring data may not capture peak concentrations. Therefore, given the very limited monitoring dataset for MITC, the maximum concentrations in the monitoring data most probably underestimate the actual peak concentration in the canal which may have occurred due to the metam sodium application. 6.1.4. Usage Uncertainties County-level usage data were obtained from California’s Department of Pesticide Regulation Pesticide Use Reporting (CDPR-PUR) database. Eight years of data (1999 – 2008) were included in this analysis because statistical methodology for identifying outliers, in terms of area treated and pounds applied, was provided by CDPR for these years only. No methodology for removing outliers was provided by CDPR for 2001 and earlier pesticide data; therefore, this information was not included in the analysis because it may misrepresent actual usage patterns. CDPR PUR documentation indicates that errors in the data may include the following: a misplaced decimal; incorrect measures, area treated, or units; and reports of diluted pesticide concentrations. In addition, it is possible that the data may contain reports for pesticide uses that have been cancelled. The CPDR PUR data does not include home owner applied pesticides; therefore, residential uses are not likely to be reported. As with all pesticide usage data, there may be instances of misuse and misreporting. The Agency made use of the most current, verifiable information; in cases where there were discrepancies, the most conservative information was used. 6.1.5. Terrestrial Exposure Models Limitations For the terrestrial exposure analysis of this risk assessment, a generic bird or mammal was assumed to occupy either the treated field or adjacent areas receiving a treatment rate on the field. Actual habitat requirements of any particular terrestrial species were not considered, and it was assumed that species occupy, exclusively and permanently, the modeled treatment area. In addition, there are several uncertainties associated with SCREEN3 model. These include the following elements: There are several use patterns which have not been accounted for, which may influence MITC volatilization rates, due to the unavailability of field volatility data in California. These include chemigation applications through center pivot irrigation equipment, drip chemigation applications, broadcast shank injection applications, and drench applications, and the use of tarps associated with all applications. However, MITC peak flux rates in the four field volatility studies which incorporated water and soil sealing methods ranged between 1.11 percent (Helm shank injection study) and 4.53 percent 117 Second,SCREEN3 does not address exposure durations less than one hour. Peak EECs predicted by SCREEN3 may actually be higher on these time scales especially during periods with temperature inversions. Such conditions are often associated with light and variable wind speeds and highly stagnant air with poor mixing within plume elements and may exist over only portions of one hour. Therefore, peak air concentrations may be underestimated by SCREEN3 since plume elements on and off the treated field may be more concentrated at sub-hourly time scales rather than at hourly time scales. However, it is not expected that these conditions would significantly impact the expected frequency of exposure events since these conditions may only occur within a few hours of some days after fumigant applications. An 80-acre field is used for in the modeling rather than a 10-hectare area in the PRZM/EXAMS modeling. The Georgia Farm Pond exposure scenario for the PRZM/EXAMS modeling assumes that a 10-hectare watershed is the upper-bound exposure scenario for aquatic organisms. However, exposure in an open system such as air will be determined by the field size treated. The metam sodium RED document identifies that 10 – 60 acres field sizes can be treated. However, an 80-acre field size was chosen since additional areas may be treated when multiple cultivating soil fumigant application equipment. The selection of field size is especially sensitive in the air modeling since the modeling assumed that the entire mass coming off the field is transported directly downwind to a point resulting in the worst-case concentration, which in many cases is along the edge of the field. In addition, there are some uncertainties with groundwater estimated concentrations using SCIGROW. First, volatilization is not taken into account. Since no loss of MITC from groundwater is accounted for, this particular uncertainty contributes conservatively to concentration estimates. In addition, the mean Kd is used for the soil-water partion coefficient value. However, EFED guidance for SCIGROW actually indicates that the median Koc should be used. There should not be any large differences between the appropriate inputs and the values used given that Kd and Koc values should not differ along with median and mean values given that MITC’s high mobility as a gas. In addition, the appropriate bounds of SCIGROW was established for Koc values between 32 mg/L and 180 mg/L and aerobic soil half-lives between 13 and 1,000 days. Therefore, there may be uncertainty with SCIGROW’s EECs in groundwater since the model was not calibrated for mobile and reactive constituents such as MITC. 118 6.1.6. Terrestrial Air Monitoring Limitations Several MITC air monitoring studies are available through registrant field volatility studies and California Department of Pesticide Regulation air monitoring studies. In registrant field volatility studies, maximum air concentrations ranged from between 843.43 g/m3 in the Brawley flooded study, 374 g/m3 in the Helm shank injection study, 181.5 g/m3 in the Lost Hills flooded study, and 168 g/m3 in the Bakersfield, CA sprinkler chemigation study. These samples were measured along the edge of the treated fields concurrent with metam sodium applications. Overall, SCREEN3 EECs for surface and soil incorporated applications were larger than the monitored values with respect to application type. There are a couple of reasons accounting for the difference. First, air samples reflect 4-hour average air concentrations whereas 1-hour average air concentrations are generated in SCREEN3. Secondly, worst-case meteorological conditions are considered in the modeling as opposed to monitoring concentrations which are only representative of the the meteorological conditions during the time of sampling. In addition, the ambient monitored MITC air concentrations of 10.43 g/m3 observed in Kern County may also result from dazomet pesticide applications since dazomet is also a MITCgenerating active ingredient. The MITC ambient concentration from metam sodium applications may actually be lower , and use of the 10.43 g/m3 value as justification for limited chronic exposure is conservative since this concentration can at least in part be a signature of dazomet applications in the air shed. 6.2. Effects Assessment Uncertainties 6.2.1. Age Class and Sensitivity of Effects Thresholds It is generally recognized that test organism age may have a significant impact on the observed sensitivity to a toxicant. The acute toxicity data for fish are collected on juvenile fish between 0.1 and 5 grams. Aquatic invertebrate acute testing is performed on recommended immature age classes (e.g., first instar for daphnids, second instar for amphipods, stoneflies, mayflies, and third instar for midges). Testing of juveniles may overestimate toxicity at older age classes for pesticide active ingredients that act directly without metabolic transformation because younger age classes may not have the enzymatic systems associated with detoxifying xenobiotics. In so far as the available toxicity data may provide ranges of sensitivity information with respect to age class, this assessment uses the most sensitive life-stage information available as measures of effect for fish and aquatic invertebrates. 6.2.2. Use of Surrogate Species Effects Data Guideline toxicity tests on metam sodium or MITC are not available for aquatic phase amphibian; therefore, freshwater fish are used as surrogate species for aquatic phase CTS. There were no available open literature information on MITC toxicity for aquatic phase amphibians. Therefore, endpoints based on freshwater fish ecotoxicity data are assumed to be protective of 119 potential direct effects to aquatic phase CTS. An extrapolation of the risk conclusions from the most sensitive tested species to the aquatic phase CTS is likely to overestimate the potential risks to those species. Efforts are made to select the organisms most likely to be affected by the type of compound and usage pattern; however, there is an inherent uncertainty in extrapolating across phyla. In addition, the Agency’s LOCs are intentionally set very low, and conservative estimates are made in the screening level risk assessment to account for these uncertainties. 6.2.3. Sublethal Effects When assessing acute risk, the screening risk assessment relies on the acute mortality endpoint as well as a suite of sublethal responses to the pesticide, as determined by the testing of species response to chronic exposure conditions and subsequent chronic risk assessment. Consideration of additional sublethal data in the effects determination t is exercised on a case-by-case basis and only after careful consideration of the nature of the sublethal effect measured and the extent and quality of available data to support establishing a plausible relationship between the measure of effect (sublethal endpoint) and the assessment endpoints. However, the full suite of sublethal effects from valid open literature studies is considered for the characterization purposes. Sublethal effects, including behavioral effects, have been linked to MITC. Where quantitative data existed, these effects were considered in the assessment, and appear to occur at concentrations higher than the frank effects used as assessment endpoints. Thus, based on data available at the time of this assessment, risk conclusions in the assessment are anticipated to be adequately protective in regards to sublethal effects. 6.2.4. Acute LOC Assumptions The risk characterization section of this assessment includes an evaluation of the potential for individual effects. The individual effects probability associated with the acute RQ is based on the assumption that the dose-response curve fits a probit model. It uses the mean estimate of the slope and the LC50 to estimate the probability of individual effects. 6.2.5. Acute-to-Chronic Ratio Assumptions 6.2.6. Mixtures The California tiger salamander and various components of their ecosystem may be exposed to multiple pesticides, introduced into its environment either via a multiple active ingredient formulated product, a tank mixture, or transport from independently applied active ingredients. Multiple pesticides may act in an additive, synergistic, or antagonistic fashion. Quantifying reasonable environmental exposures and establishing reasonable corresponding toxicological endpoints for the myriad of possible situations is beyond the scope of this document, and in some cases, beyond the current state of ecotoxicological practice. Mixtures could affect the CTS in ways not addressed in this assessment. Exposure to multiple contaminants could make organisms 120 more or less sensitive to the effects of MITC, thus the directional bias associated with environmental mixtures is unknown, and may vary on a case-by-case basis. 121 7. Risk Conclusions In fulfilling its obligations under Section 7(a)(2) of the Endangered Species Act, the information presented in this endangered species risk assessment represents the best data currently available to assess the potential risks of MITC to CTS and their designated critical habitat. Based on the best available information, the Agency makes a “May Affect” determination for the CTS. Additionally, the Agency has determined that there is the potential for modification of the designated critical habitat for the CTS from the use of the chemical. Spatial analysis is available to support the determinations. Maps are generated to indicate boundaries for species habitat and to indicate pesticide use sites. The GIS maps indicate that there is overlap for the three CTS species habitat and pesticide uses. Effect determinations were evaluated using MITC stressor RQs. RQs were estimated for both soil incorporated and surface applications for taxa with available data. The two types of application methods for MITC were evaluated separately for direct and indirect effects. Direct effects for the aquatic CTS were evaluated using the fish as a surrogate and resulted in an LAA determination supported by endangered species LOC exceedence and probit analysis for surface applications. Potential risk is indicated for acute exposure for fish from surface applications. Lettuce (1.15), row crops (1.53), strawberry (3.62) and tomato (0.71) use MITC stressor RQs exceeded the acute risk LOC. The RQs for fish exceeded the endangered species LOC for all uses except melon (0.03) for surface applications. The analysis was refined using the probit analysis to estimate the chance of an individual effect. There is a high probability of an individual effect for lettuce, row crops and strawberry uses with probabilities ranging from ~1 in 1.65 for row crops to ~1 in 1.01 for strawberry. Chronic toxicity is estimated using the ACR method, with a ratio of 2.2 using Daphnia toxicity data. The RQs for fish do not exceed the chronic LOC from surface applications. The MITC stressor RQs ranged from 0.01 for potato to .72 for strawberry uses. No MITC stressor RQs exceeded the acute risk, endangered species or chronic LOC for any uses for soil incorporated applications. RQs for acute exposure from MITC ranged from <0.01 for lettuce, melon, onion, row crops, tomato and turf uses to 0.03 for nursey uses. The resulting chronic RQs range from <0.01 for potato to 0.01 for nursery and strawberry uses for soil incorporated applications. Based on no chronic LOC exceedence, no adverse effects are expected due to the low EECs for the use patterns. Indirect effects for the aquatic CTS were indicated by the potential for reduction in prey for acute fish exposure and from acute and chronic aquatic invertebrate exposure from surface applications of metam sodium. The LAA for acute exposure for the fish as a surrogate for amphibians and for both acute and chronic exposures for Daphnia is supported through LOC exceedence and refined 122 through the use of probit analysis. All acute surface application exposures for fish except melon, with an RQ of 0.03, exceeded the listed species LOC, but only lettuce, row crops, strawberry and tomato exceeded the acute risk LOC. Probit analysis at the listed species RQ indicated a high probability of an individual effect for lettuce, nursery, row crops and strawberry uses, with probabilities ranging from ~1 in 2.73 for nursery to ~1 in 1.01 for strawberry. No surface application RQs exceeded the chronic LOC for fish. No RQs exceeded the endangered species, acute risk or chronic LOC for fish from soil incorporated applications of metam sodium. Acute fish RQs ranged from <0.01 for lettuce, melon, onion, row crops, tomato and turf to 0.03 for nursey and strawberry uses. Chronic RQs ranged from <0.01 for melon uses to 0.01 for nursery and strawberry uses. No RQs exceeded the endangered species, acute risk or chronic LOC for aquatic invertebrates from soil incorporated applications. Acute RQs ranged from <0.01 for lettuce, melon, onion, row crops, tomato and turf uses to 0.03 for nursery uses.Chronic RQs ranged from <0.01 for lettuce, melon, onion, potato, row crops, tomato and turf uses to 0.02 for nursery uses. Indirect effects for the aquatic CTS also include alterations in prey reduction and habitat from aquatic plants. There is no obligate relationship between the CTS and any aquatic plants, therefore the EC50 toxicity values were used to estimate risk. No RQs exceed the plant LOC for either surface or soil incorporated applications. No effect from soil or surface applications of metam sodium is expected for aquatic non-vascular plants which is composed of the diet of the juvenile CTS for the first 6 weeks after hatching. Direct effects to the terrestrial CTS were evaluated using the rat as a surrogate. The primary exposure route is through inhalation for both surface and soil incorporated applications. No MITC stressor RQs exceeded the acute LOC for direct effects through inhalation. The CTS uses mammal burrows for shelter and protection from predation/survival so the mammal RQs are also used to evaluate reduction in shelter for direct and indirect effects. No acute rat RQs exceed the inhalation LOC of 0.1, so metam sodium applications are not expected to have an adverse effect on mammals that create burrows for the CTS. No indirect effects from reduction of prey using the rat as a surrogate for amphians/frogs are expected. No chronic exposure to the terrestrial CTS is expected as suggested by the highest MITC ambient air montoring concentration of 10.41 g/m3 measured in Kern County, CA. Indirect effects for the terrestrial CTS were indicated by the potential for reduction in prey for terrestrial invertebrate exposure from both surface and soil incorporated applications of metam sodium. No data are available to estimate the risk to terrestrial invertebrates, so risk cannot be precluded. Indirect effects to the terrestrial CTS also include effects to terrestrial plants that may alter the habitat. There is the potential for indirect effects based on the absence of data leading to a presumption of risk for terrestrial plants for both surface and soil incorporated applications. 123 Habitat modification is expected based on analysis of reduction in prey for fish as a surrogate for amphibians and aquatic invertebrates for surface applications, with all uses except melon exceeding the listed species LOC. Reduction in prey is also expected for terrestrial invertebrates for both surface and soil incoropration application methods based on persistence in runoff and the reactivity with the nucleophilic centers as the mode of action. Habitat modification also includes effects to aquatic and terrestrial plants that may alter the water quality or structural characteristics of the environment, in addition to reduction in prey, Although no LOCs were exceeded for aquatic plants, there is a habitat modification based on the absence of data for terrestrial plants. There is also uncertainty due to potential run-off exposure to terrestrial plants. A summary of the risk conclusions and effects determinations for the CTS and their critical habitat, given the uncertainties discussed in Section 6, are presented in Table 7-1 and Table 7-2. Use specific effects determinations are provided in Table 7-3 and Table 7-4. Table 7-1. Effects determination summary for effects of MITC on the CTS (all 3 DPSs). Taxa Freshwater Fish and Aquatic phase Amphibians Effects Determinations Description of Results of Risk Estimation Listed and Non-listed Species (No Effect: soil incorporated applications for acute and chronic effects) Acute risk quotients exceeded LOC for none of the registered MITC uses for soil incorporated applications for non-listed and listed species. Chronic risk to fish estimated using the ACR method. No RQs exceeded the LOC ≥1 for any surface uses. RQs ranged from 0 for melon to 0.72 for strawberry uses. 124 Assessed Species Potentially Affected Direct and Indirect Effects: CTS (all 3 DPSs) (prey) Table 7-1. Effects determination summary for effects of MITC on the CTS (all 3 DPSs). Taxa Effects Determinations Non-listed Species (LAA: acute surface applications) Listed Species (LAA: acute surface applications) Description of Results of Risk Estimation Acute risk quotients for lettuce, row crops, strawberry and tomato exceeded the non-listed LOC for surface applications with RQs ranging from 0.71for tomato to 3.62 for strawberry. Acute risk quotients for lettuce, nursery, onion, potato, row crops, strawberry, tomato, and turf exceeded the listed LOC for surface applications. RQs ranged from 0.05 for potato to 3.62 for strawberry. The acute risk quotient for melon (0.03) did not exceed the non-listed or listed LOC for surface applications. Listed and Non-listed Species (No Effect: soil incorporated applications) Non-listed Species (LAA: Surface applications ) Listed Species (LAA: Surface applications) Freshwater Invertebrates Chronic risk to fish estimated using the ACR method. No RQs exceeded the LOC ≥1 for any surface uses. RQs ranged from 0 for melon to 0.72 for strawberry uses. Risk quotients for acute and chronic effects did not exceed LOC for any of the registered MITC uses for soil incorporated applications for nonlisted and listed species. Acute risk quotients for lettuce, row crops, strawberry and tomato exceeded to acute risk LOC for invertebrates. RQs ranged from 0.66 for tomato to to 3.37 for strawberry. Acute risk quotients for lettuce, nursery, onion, potato, row crops, strawberry, tomato, and turf exceeded the listed LOC for surface applications. RQS ranged from 0.05 for potato to 3.37 for strawberry. The acute risk quotient for melon (0.03) did not exceed the listed LOC for surface applications. Chronic effects were indicated through LOC exceedence for strawberry uses only. 125 Assessed Species Potentially Affected Table 7-1. Effects determination summary for effects of MITC on the CTS (all 3 DPSs). Taxa Vascular Aquatic Plants NonVascular Aquatic Plants Birds, Reptiles, and TerrestrialPhase Amphibians (Rat as surrogate) Effects Determinations Non-listed Species (No Effect) Non-listed Species (No Effect) Listed Species (No Effect) Listed and Non-listed Species (No Effect) Mammals Listed Species (LAA) Terrestrial Invertebrates Terrestrial Plants – Monocots Non-listed Species (LAA) Terrestrial Plants – Dicots Description of Results of Risk Estimation Aquatic vascular plant RQs did not exceed LOC for any of the uses for either soil incorporated or surface applications. Aquatic non-vascular plant RQs did not exceed LOC for any of the uses for either soil incorporated or surface applications. MITC air concentration RQs for acute rat inhalation did not exceed the endangered species LOC=0.1 for any use patterns for both soil incorporated and surface applications. Assessed Species Potentially Affected Indirect Effects Indirect Effects Direct and Indirect Effects MITC air concentration RQs for acute rat inhalation did not exceed the endangered species LOC=0.1 for any use patterns for both soil incorporated and surface applications. Indirect effect risk is presumed for soil invertebrates on the field. Risk for both soil incorporated and surface applications could not be calculated as no toxicity values are available to calculate RQs. Direct and Indirect Effects Risk is presumed based on the absence of toxicity data. Risk for both soil incorporated and surface applications could not be calculated as no toxicity values are available to calculate RQs. Indirect Effects Indirect Effects Indirect Effects Table 7-2. Risk estimation summary for MITC – effects to designated critical habitat (PCEs) of California Tiger Salamander. Taxa Freshwater Fish and Aquatic phase Amphibians LOC Exceedances (Yes/No) Soil incorporated applications Non-listed and Listed Species (No) Description of Results of Risk Estimation Acute risk quotients exceeded LOC for none of the registered MITC uses for soil incorporated applications for non-listed and listed species. 126 Assessed Species Potentially Affected CTS (all 3 DPSs) Table 7-2. Risk estimation summary for MITC – effects to designated critical habitat (PCEs) of California Tiger Salamander. Taxa LOC Exceedances (Yes/No) Surface Applications Nonlisted Species (Yes) Description of Results of Risk Estimation Chronic risk to fish estimated using the ACR method. No RQs exceeded the LOC ≥1 for any surface uses. RQs ranged from 0 for melon to 0.72 for strawberry uses. Acute risk quotients for lettuce, row crops, strawberry and tomato exceeded the non-listed LOC for surface applications with RQs ranging from 0.71for tomato to 3.62 for strawberry. Acute risk quotients for lettuce, row crops, strawberry and tomato exceeded the listed LOC for surface applications. RQs ranged from for 0..05 for tomato to 3.62 for strawberry. Surface Applications Listed Species (Yes) Chronic risk to fish estimated using the ACR method. No RQs exceeded the LOC ≥1 for any surface uses. RQs ranged from 0 for melon to 0.72 for strawberry uses. Acute risk quotients for lettuce, nursery, onion, potato, row crops, strawberry, tomato, and turf exceeded the listed LOC for surface applications. The acute risk quotient for melon did not exceed the non-listed or listed LOC for surface applications. Freshwater Invertebrates Soil incorporated applications Non-listed and Listed Species (No) Chronic risk to fish estimated using the ACR method. No RQs exceeded the LOC ≥1 for any surface uses. RQs ranged from 0 for melon to 0.72 for strawberry uses. Acute risk quotients exceeded LOC for none of the registered MITC uses for soil incorporated applications for non-listed and listed species. 127 Assessed Species Potentially Affected Table 7-2. Risk estimation summary for MITC – effects to designated critical habitat (PCEs) of California Tiger Salamander. Taxa LOC Exceedances (Yes/No) Surface Applications Listed Species (Yes) Description of Results of Risk Estimation Acute risk quotients for lettuce, nursery, onion, potato, row crops, strawberry, tomato, and turf exceeded the listed LOC for surface applications. The acute risk quotient for melon did not exceed the listed LOC for surface applications. Chronic risk is expected due to the LOC exceedence for strawberry uses only. Vascular Aquatic Plants Soil incorporated and Surface Applications Non-listed Species (No) Non-Vascular Aquatic Plants Soil incorporated and Surface Applications Nonlisted Species (No) Birds, Reptiles, and TerrestrialPhase Amphibians Mammals Soil incorporated and Surface Applications Listed Species (No) Soil incorporated and Surface Applications Non-listed Species (No) Soil incorporated and Surface Applications Listed Species (NA) Terrestrial Invertebrates Aquatic vascular plant RQs did not exceed LOC for any of the uses for either soil incorporated or surface applications. Aquatic non-vascular plant RQs did not exceed LOC for any of the uses for either soil incorporated or surface applications. MITC air concentration RQs for acute rat inhalation did not exceed the endangered species LOC=0.1 for any use patterns for sprinkler application. MITC air concentration RQs for acute rat inhalation did not exceed the endangered species LOC=0.1 for any use patterns for sprinkler application. The diet of the terrestrial phase CTS includes terrestrial soil invertebrates. Risk is presumed for soil invertebrates on the field due to the mode of action for MITC. Risk could not be calculated as no toxicity values are available to calculate RQs. Although mortality is expected for all terrestrial invertebrates present on the field at the time of application, fate and transport properties of MITC indicate a low probability of risk off the field. 128 Assessed Species Potentially Affected Table 7-2. Risk estimation summary for MITC – effects to designated critical habitat (PCEs) of California Tiger Salamander. Taxa LOC Exceedances (Yes/No) Terrestrial Plants – Monocots Soil incorporated and Surface Applications Non-listed Species (Yes) Only non-listed LOCs would be evaluated because CTS does not have an obligate relationship with terrestrial monocots and dicots Terrestrial Plants – Dicots Description of Results of Risk Estimation Assessed Species Potentially Affected Risk is presumed based on the absence of data. Risk could not be calculated as no toxicity values are available to calculate RQs. Although mortality is expected for all terrestrial plants present on the field at the time of application, fate and transport properties of MITC indicate a low probability of risk off the field. Table 7-3. Use specific summary of the potential for adverse effects to aquatic taxa. Uses Potential for Effects to Identified Taxa Found in the Aquatic Environment Freshwater Vertebrates1 Acute Chronic Freshwater Invertebrates2 Acute Chronic Vascular Plants Nonvascular Plants No All Yes No Yes Yes No Uses 1 A yes in this column indicates a potential for direct and indirect effects to CTS 2 A yes in this column indicates a potential for direct and indirect effects to CTS potential for indirect effects for the CTS-CC, CTS-SC, and CTS-SB Table 7-4. Use specific summary of the potential for adverse effects to terrestrial taxa. Potential for Effects to Identified Taxa Found in the Terrestrial Environment Uses Small Mammals1 Acute5 Chronic No NA Small Birds2 Acute Chronic NA NA Invertebrates3 Acute Yes Dicots4 Monocots4 All Yes Yes Uses 1 A yes in this column indicates a potential for direct and indirect effects to CTS-CC, CTS-SC, and CTS-SB 2 No toxicity data are available for avian inhalation to evaluate the potential for direct and indirect effects to the CTS-CC, CTS-SC, and CTS-SB 3 A yes in this column indicates a potential for indirect effects to CTS-CC, CTS-SC, and CTS-SB 4 A yes in this column indicates a potential for indirect effects to CTS-CC, CTS-SC, CTS-SB; LOC exceedances are evaluated based on the absence of data for non-listed species 5 The rat is a surrogate for the CTS Based on the conclusions of this assessment, a formal consultation with the U. S. Fish and Wildlife Service under Section 7 of the Endangered Species Act should be initiated. 129 When evaluating the significance of this risk assessment’s direct/indirect and adverse habitat modification effects determinations, it is important to note that pesticide exposures and predicted risks to the listed species and its resources (i.e., food and habitat) are not expected to be uniform across the action area. In fact, given the assumptions of downstream transport (i.e., attenuation with distance), pesticide exposure and associated risks to the species and its resources are expected to decrease with increasing distance away from the treated field or site of application. Evaluation of the implication of this non-uniform distribution of risk to the species would require information and assessment techniques that are not currently available. When evaluating the significance of this risk assessment’s direct/indirect and adverse habitat modification effects determinations, it is important to note that pesticide exposures and predicted risks to the species and its resources (i.e., food and habitat) are not expected to be uniform across the action area. In fact, given the assumptions of drift and downstream transport (i.e., attenuation with distance), pesticide exposure and associated risks to the species and its resources are expected to decrease with increasing distance away from the treated field or site of application. Evaluation of the implication of this non-uniform distribution of risk to the species would require information and assessment techniques that are not currently available. Examples of such information and methodology required for this type of analysis would include the following: Enhanced information on the density and distribution of CTS life stages within the action area and/or applicable designated critical habitat. This information would allow for quantitative extrapolation of the present risk assessment’s predictions of individual effects to the proportion of the population extant within geographical areas where those effects are predicted. Furthermore, such population information would allow for a more comprehensive evaluation of the significance of potential resource impairment to individuals of the assessed species. Quantitative information on prey base requirements for the assessed species. While existing information provides a preliminary picture of the types of food sources utilized by the assessed species, it does not establish minimal requirements to sustain healthy individuals at varying life stages. Such information could be used to establish biologically relevant thresholds of effects on the prey base, and ultimately establish geographical limits to those effects. This information could be used together with the density data discussed above to characterize the likelihood of adverse effects to individuals. Information on population responses of prey base organisms to the pesticide. Currently, methodologies are limited to predicting exposures and likely levels of direct mortality, growth or reproductive impairment immediately following exposure to the pesticide. The degree to which repeated exposure events and the inherent demographic characteristics of the prey population play into the extent to which prey resources may recover is not predictable. An enhanced understanding of long-term prey responses to pesticide exposure would allow for a more refined determination of the magnitude and duration of resource impairment, and together with the information described above, a more complete prediction of effects to individual species and potential modification to critical habitat. 130 8. References A bibliography of ECOTOX references, identified by the letter E followed by a number, is located in Appendix H. Altig, R. and R.W. McDiarmid. 1999. Body Plan: Development and Morphology. In R.W. McDiarmid and R. Altig (Eds.), Tadpoles: The Biology of Anuran Larvae.University of Chicago Press, Chicago. pp. 24-51. Alvarez, R. and C.B. Moore. 1994. Quantum yield for production of CH3NC in the photolysis of CH3NCS. Science263: 205-207. Alvarez, J. 2000. Letter to the U.S. Fish and Wildlife Service providing comments on the Draft California Red-legged Frog Recovery Plan. ARB, 1997. Ambient air monitoring for MIC and MITC after a soil injection application of metam sodium in Kern County during August 1995. Test Report No. C94-046, May 20, 1997. Air Resources Board, Sacramento, CA. Ashley, M.G., B.L. Leigh, and L.S. Llyod. 1963. The action of metam sodium in soil. II. Factors affecting removal of methyl isothiocyanate residues. J. Sci. Food Agric. 14: 153-161. Barry TA; Segawa R; Wofford P; Ganapathy C. 1997. Off-site air monitoring following methyl bromide chamber and warehouse fumigations and evaluation of the Industrial Source ComplexShort Term 3 Air Dispersion Model. Chapter 14 in Fumigants: Environmental Fate, Exposure and Analysis, ACS Symposium Series 652. Editors JN Seiber et al. American Chemical Society: Washington D.C., pp. 178 - 88. Birch, W. X. and Prahlad, K. V. (1986). Effects of Nabam on Developing Xenopus laevis Embryos: Minimum Concentration, Biological Stability, and Degradative Products. Arch.Environ.Contam.Toxicol. 15: 637-645. California Natural Diversity Data Base (CNDDB). 2001. Natural Heritage Division. California Department of Fish and Game. Natural Heritage Division, Sacramento, California. http://www.dfg.ca.gov/bdb/html/cnddb_info.html CDPR (California Dept. of Pesticide Regulation). 2002. Evaluation of Methyl Isothiocyanate as a Toxic Air Contaminant, Part A-Environmental Fate. California Environmental Protection Agency, Sacramento, CA. Carousel, R.F., Imhoff, J.C., Hummel, P.R., Cehplick, J.M., Donigian, A.S., and Suárez, L.A. 2005. PRZM-3, A Model for Predicting Pesticide and Nitrogen Fate in the Crop Root and Unsaturated Soil Zones: User’s Manual for Release 3.12.2. U.S. Environmental Protection Agency, Research Triangle Park, NC. 131 Crawshaw, G.J. 2000. Diseases and Pathology of Amphibians and Reptiles in: Ecotoxicology of Amphibians and Reptiles; ed: Sparling, D.W., G. Linder, and C.A. Bishop. SETAC Publication Series, Columbia, MO. Cremlyn, R.J. 1991. Agrochemicals: Preparation and Mode of Action. p. 283-307. John Wiley and Sons. New York, NY. del Rosario, A., J. Remoy, V. Soliman, J. Dhaliwal, J. Dhoot, and K. Perera. 1994. Monitoring for selected degradation products following a spill of Vapam into the Sacramento River. J. Environ. Qual. 23: 279-286. Dungan, R.S. and S.R. Yates. Degradation of fumigant Pesticides. 2003. 1,3-Dichloropropane, methyl isothiocyanate, and methyl bromide. Vodose Zone Jour. 2: 279-286. Ecological Planning and Toxicology, Inc. 1996. Toxicity Extrapolations in Terrestrial Systems submitted to the Office of Environmental Health, Hazard Assessment, Reproductive and Cancer Hazard Assessment Section, of the California EPA. Ecological Planning and Toxicology, Inc. Corvallis, Oregon. p. 4 EPISUITE. The EPI (Estimation Program Interface) SuiteTM is a Windows® based suite of physical/chemical property and environmental fate estimation models developed by the EPA’s Office of Pollution Prevention Toxics and Syracuse Research Corporation SRC. http://www.epa.gov/opptintr/exposure/docs/updates_episuite_v3.11.htm Fellers, Gary M. 2007. Personal communication. Biological Resources Division, U.S. Geological Survey. Fellers, Gary M. 2005a. Rana draytonii Baird and Girard 1852. California Red-legged Frog. Pages 552-554. In M. Lannoo (ed.) Amphibian Declines: The Conservation Status of United States Species, Vol. 2: Species Accounts. University of California Press, Berkeley, California. xxi+1094 pp. (http://www.werc.usgs.gov/pt-reyes/pdfs/Rana%20draytonii.PDF) Fellers, Gary M. 2005b. California red-legged frog, Rana draytonii Baird and Girard. Pages 198201. In L.L.C. Jones, et al (eds.) Amphibians of the Pacific Northwest. xxi+227. Fellers, G.M. and G. Guscio. 2004. California red-legged frog surveys of lower Redwood Creek, Golden Gate National Recreation Area. Prepared for the National Park Service. 65pp. (http://www.werc.usgs.gov/pt-reyes/pdfs/Redwood%20Creek%20Report.pdf) Geddes, J.D., G.C. Miller, and G. E. Taylor Jr. 1995. Gas phase photolysis of methyl isothiocyanate. Environ. Sci. Technol. 29:2590-2594. Gerstl, Z., U. Mingelgrin, B. Yaron. 1977. Behavior of Vapam and Methylisothiocyanate in soils. Soil Sci. Soc. Am. J. 41: 545-548. Gilreath, J. P., Jones, J. P., Santos, B. M., and Overman, A. J. (2004). Soil Fumigant Evaluations 132 for Soilborne Pest and Cyperus rotundus Control in Fresh Market Tomato. Crop Prot. 23: 889893. Haendel, M, et. al. 2004. Developmental toxicity of the dithiocarbamate pesticide sodium metam in zebrafish. ToxSci Advance Access. June 16, 2004. Hayes, M.P. and M.R. Jennings. 1988. Habitat correlates of distribution of the California redlegged frog (Rana aurora draytonii) and the foothill yellow-legged frog (Rana boylii): Implications for management. Pp. 144-158. In Proceedings of the symposium on the management of amphibians, reptiles, and small mammals in North America. R. Sarzo, K.E. Severson, and D.R. Patton, (technical coordinators). USDA Forest Service General Technical Report RM-166. Hayes, M.P. and M.M. Miyamoto. 1984. Biochemical, behavioral and body size difference between Rana aurora aurora and R.a. draytonii. Copeia 1984(4):1018-1022. Hayes, M.P. and M.R. Tennant. 1985. Diet and feeding behavior of the California red-legged frog. The Southwestern Naturalist 30(4): 601-605. Jennings, Mark R. 1988. Natural history and decline of native ranids in California. Pp. 61-72. In Proceedings of the conference on California herpetology. H.F. DeLisle, P.R. Brown, B. Kaufman, and H.M. McGurty (eds). Southwestern Herpetologists Society Special Publication (4): 1-143. Jennings, M.R. and M.P. Hayes. 1994. Amphibian and reptile species of special concern in California. Report prepared for the California Department of Fish and Game, Inland Fisheries Division, Rancho Cordova, California. 255 pp. Jennings, M.R., S. Townsend, and R.R. Duke. 1997. Santa Clara Valley Water District California red-legged frog distribution and status – 1997. Final Report prepared by H.T. Harvey & Associates, Alviso, California. 22 pp. Karvonen, T., Koivusalo, H., Jauhiainen, M., Palko, J. and Weppling, K. 1999. A hydrological model for predicting runoff from different land use areas, Journal of Hydrology, 217(3-4): 253265. Keehner, D. Jul.1999. Memorandum dated 7-1-99 to Environmental Fate and Effects Division/OPP/EPA concerning the interim policy on data requirements for nontarget plant testing. Kupferberg, S. 1997. Facilitation of periphyton production by tadpole grazing: Functional differences between species. Freshwater Biology 37:427-439. Kupferberg, S.J., J.C. Marks and M.E. Power. 1994. Effects of variation in natural algal and detrital diets on larval anuran (Hyla regilla) life-history traits. Copeia 1994:446-457. 133 LeNoir, J.S., L.L. McConnell, G.M. Fellers, T.M. Cahill, J.N. Seiber. 1999. Summertime Transport of Current-use pesticides from California’s Central Valley to the Sierra Nevada Mountain Range,USA. Environmental Toxicology & Chemistry 18(12): 2715-2722. McConnell, L.L., J.S. LeNoir, S. Datta, J.N. Seiber. 1998. Wet deposition of current-use pesticides in the Sierra Nevada mountain range, California, USA. Environmental Toxicology & Chemistry 17(10):1908-1916. McDonald M.A.1; Healey J.R.; Stevens P.A. 2002. The effects of secondary forest clearance and subsequent land-use on erosion losses and soil properties in the Blue Mountains of Jamaica. Agriculture, Ecosystems & Environment, Volume 92, Number 1: 1-19. Martyn, P. 2004. 7/27/04 Letter to Metam-Sodium Docket. County Sanitation Districts of Los Angeles County. NatureServe: An online encyclopedia of life [web application]. 2000. Version 1.2 . Arlington, Virginia, USA: Association for Biodiversity Information. Available: http://www.natureserve.org/. (Accessed: March 28, 3901 ). URL: http://www.natureserve.org Okisaka S.; Murakami A.; Mizukawa A.; Ito J.; Vakulenko S.A.; Molotkov I.A.; Corbett C.W.; Wahl M.; Porter D.E.; Edwards D.; Moise C. 1997. Nonpoint source runoff modeling: A comparison of a forested watershed and an urban watershed on the South Carolina coast. Journal of Experimental Marine Biology and Ecology, Volume 213, Number 1: 133-149. Pesticides in Groundwater Database USEPA 1992. Pesticides in Groundwater Database. A compilation of monitoring studies: A national Summery. p. NS-163. Phuong V.T. and van Dam J. Linkages between forests and water: A review of research evidence in Vietnam. In: Forests, Water and Livelihoods European Tropical Forest Research Network. ETFRN NEWS (3pp). Rathburn, G.B. 1998. Rana aurora draytonii egg predation. Herpetological Review, 29(3): 165. Reis, D.K. Habitat characteristics of California red-legged frogs (Rana aurora draytonii): Ecological differences between eggs, tadpoles, and adults in a coastal brackish and freshwater system. M.S. Thesis. San Jose State University. 58 pp. Reiss, R. and Griffin, J. 2006. User’s Guide for the Probablistic Exposure and Risk Model for FUMigants (PERFUM), Version 2. Arysta LifeScience North America Corporation. Cary, North Carolina. Scheringer, M., Macleod, M.,Wegmann, F., and Zurich, E.T.H. 2008. The OECD Pov and LRTP Screening Tool Version 2.1. The Orgnaisation for Economic Co-operation and Development. Paris, France. Seale, D.B. and N. Beckvar. 1980. The comparative ability of anuran larvae (genera: 134 Hyla, Bufo and Rana) to ingest suspended blue-green algae. Copeia 1980:495-503. Segawa, R.T., S.J. Marade, N.K. Miller, and P.Y. Lee. 1991. Monitoring of the Cantara metamsodium spill. Environmental Hazards Assessment Program, Report Number EH 91-09. Department of Pesticide Regulation. Sacramento, CA. Seiber, J.N., J.E. Woodrow, R.I. Krieger, and T. Dinoff. 1999. Determination of ambient MITC residues in indoor and outdoor air in townships near fields treated with metam sodium. June 1999. Amvec Chemical Corporation, Newport Beach, CA. Sparling, D.W., G.M. Fellers, L.L. McConnell 2001. Pesticides and amphibian population declines in California, USA. Environmental Toxicology & Chemistry 20(7): 1591-1595. SDTF 1995. A summary of Chemigation Application Studies. Spray Drift Task Force. Macon, Missouri. Available on-line: http://www.agdrift.com/PDF_FILES/Chem.pdf. Accessed October 2010. Storer, T.I. 1925. A synopsis of the amphibia of California. University of California Publications in Zoology 27:1-342. Tomlin, C.D.S. (ed.) 1997. The Pesticide Manual. Eleventh Ed. P 335-339. British Crop Protection Council, Surrey, GU9 7PH, UK Turner, D.B. 1970. Workbook of Atmospheric Dispersion Estimates. Revised, Sixth printing, Jan. 1973. Office of Air Programs Publication No. AP-26. Urban, D.J. and J.N. Cook. 1986. Ecological Risk assessment. Hazard Evaluation Division Standard Procedure. Washington, D.C. Office of Pesticide Programs. U.S. Environmental Protection Agency. EPA 54019-83-001. USEPA, 1995. SCREEN 3 Model User’s Guide. EPA-454/B-95-004. EPA Office of Air Quality Planning and Standards, Research Triangle Park, NC. U.S. EPA 1998. Guidance for Ecological Risk Assessment. Risk Assessment Forum. EPA/630/R-95/002F, April 1998. U.S. EPA 2000. Supplementary guidance for conducting health risk assessments of chemical mixtures. EPA/630/R-00/002. Risk Assessment Forum. U.S. Environmental Protection Agency, Washington DC. 20460. U.S. EPA 2004a. ECOTOX Database. Office of Research and Development. Available on-line: http://cfpub.epa.gov/ecotox/. Accessed November 2010. U.S. EPA 2004b. Overview of the Ecological Risk Assessment Process in the Office of Pesticide Programs. Office of Prevention, Pesticides, and Toxic Substances. Office of Pesticide Programs. Washington, D.C. January 23, 2004. 135 U.S. EPA. 2004c. Environmental Fate and Ecological Risk Assessment for the Existing Uses of Metam Sodium. Office of Pesticide Programs. Washington, D.C. U.S. EPA 2004d. FIFRA Science Advisory Panel Meeting Minutes - Fumigant Bystander Exposure Model Review: Probabilistic Exposure and Risk Model for Fumigants (PERFUM) Using Iodomethane as a Case Study. Available at http://www.epa.gov/scipoly/sap/meetings/2004/august1/august2425minutes.pdf (Accessed Novermber 2010) U.S. EPA (United States Environmental Protection Agency). 2004e. HED’s Draft Chapter on Metam Sodium: Occupational and Residential Exposure Assessment for the RED document. August 2004. U.S. EPA. 2007. Risks of Metam Sodium Use to Federally Listed Threatened California Red Legged Frog. Office of Pesticide Programs. Washington, D.C. U.S. EPA 2008. FIFRA Science Advisory Panel Meeting Minutes - Selected Issues Associated with the Risk Assessment Process for Pesticides with Persistent, Bioaccumulative, and Toxic Characteristics. Available at http://www.epa.gov/scipoly/sap/meetings/2008/october/ sap_pbt_whitepaper_final_Oct_7_08d.pdf (Accessed December 2010) U.S. EPA. 2009. Amended Reregistration Eligibility Decision (RED) for the Methyldithiocarbamate Salts (Metam sodium, Metam-potassium) and Methyl Isothiocyanate (MITC). Office of Pesticide Programs. Washington, D.C. USEPA 2010. “Estimation Tool Interface (EPI) Suite. Office of Pollution Prevention and Toxic Substances. Washington, DC. <Avaialable on-line: http://www.epa.gov/oppt/exposure/pubs/episuite.htm>. Accessed March 2010. U.S. Fish and Wildlife Service (USFWS). 1996. Endangered and threatened wildlife and plants: determination of threatened status for the California red-legged frog. Federal Register 61(101):25813-25833. U.S. Fish and Wildlife Service (USFWS) and National Marine Fisheries Service (NMFS). 1998. Endangered Species Consultation Handbook: Procedures for Conducting Consultation and Conference Activities Under Section 7 of the Endangered Species Act. Final Draft. March 1998. U.S. Fish and Wildlife Service (USFWS). 2002. Recovery Plan for the California Red-legged Frog (Rana aurora draytonii). USFWS, Region 1. Portland, Oregon. viii + 173 pp. (http://ecos.fws.gov/doc/recovery_plans/2002/020528.pdf) USFWS/NMFS. 2004. 50 CFR Part 402. Joint Counterpart Endangered Species Act Section 7 Consultation Regulations; Final Rule. FR 47732-47762. 136 USFWS/NMFS. 2004. Letter from USFWS/NMFS to U.S. EPA Office of Prevention, Pesticides, and Toxic Substances. January 26, 2004. (http://www.fws.gov/endangered/consultations/pesticides/evaluation.pdf) USFWS/NMFS 2004. Memorandum to Office of Prevention, Pesticides, and Toxic Substances, U.S. EPA conveying an evaluation by the U.S. Fish and Wildlife Service and National Marine Fisheries Service of an approach to assessing the ecological risks of pesticide products. USFWS. Website accessed: 30 December 2006. http://www.fws.gov/endangered/features/rl_frog/rlfrog.html#where U.S. Fish and Wildlife Service (USFWS). 2006. Endangered and threatened wildlife and plants: determination of critical habitat for the California red-legged frog. 71 FR 19244-19346. Wassersug, R. 1984. Why tadpoles love fast food. Natural History 4/84. Wofford, P.L., K.P. Bennett, J. Hernandez and P. Lee. 1994. Air monitoring for methyl isothiocyanate during a sprinkler application of metam sodium. Environmental Hazards Assessment Program, Report EH 94-02, California EPA Department of Pesticide Regulation DataBases and Models The California Department of Pesticide Regulation’s Pesticide Use Reporting database provides a census of pesticide applications in the state. See http://www.cdpr.ca.gov/docs/pur/purmain.htm. Pesticides in Groundwater DataBase (PGWDB) http://www.epa.gov/oppefed1/models/water http://www.epa.gov/scram001/tt22htm#isc Doane (www.doane.com; the full dataset is not provided due to its proprietary nature) United States Depart of Agriculture (USDA), National Agricultural Statistics Service (NASS) Chemical Use Reports provide summary pesticide usage statistics for select agricultural use sites by chemical, crop and state. See http://www.usda.gov/nass/pubs/estindx1.htm#agchem. USGS NAWQA. http://water.usgs.gov.nawqa References for GIS Maps Crop Maps 137 ESRI, 2002. Detailed Counties, ESRI data and maps. (1:24,000) www.esri.com GAP. Gap Analysis. National Biological Information Infrastructure. www.nbii.gov NASS, 2002. USDA National Agriculatural Statistics Service. www.nass.usda.gov MRLC, 2001. Multiresolution Land Characteristics (MRLC) www.mrlc.gov Habitat Maps US FWS 2010 Final Critical Habitat for California tiger salamander CNDDB Occurrence Sections – California Natural Diversity Database http://www.dfg.ca.gov/bdb/html/cnddb.html ESRI, 2002. Detailed Counties, ESRI data and maps. (1:24,000) www.esri.com Arnot, J. A., & Gobas, F. A. P. C. 2004. A food web bioaccumulation model for organic chemicals in aquatic ecosystems. Environmental Toxicology and Chemistry, 23(10), 2343-2355. Fellers, G. M., McConnell, L. L., Pratt, D., & Datta, S. 2004. Pesticides in Mountain YellowLegged Frogs (Rana Mucosa) from the Sierra Nevada Mountains of California. Environmental Toxicology and Chemistry, 23(9), 2170-2177. LeNoir, J. S., McConnell, L. L., Fellers, G. M., Cahill, T. M., & Seiber, J. N. 1999. Summertime Transport of Current-use pesticides from California’s Central Valley to the Sierra Nevada Mountain Range, USA. Environmental Toxicology and Chemistry, 18(12), 2715-2722. Majewski, M. S., C. Zamora, W. T. Foreman, & C. R. Kratzer. 2005. Contribution of Atomospheric Depostion to Pesticide Loads in Surface Water Runoff. U.S. Geological Survey, Open-File Report 2005-1307. http://pubs.usgs.gov/of/2005/1307/ McConnell, L. L., LeNoir, J. S., Datta, S., & Seiber, J. N. 1998. Wet deposition of current-use pesticides in the Sierra Nevada mountain range, California, USA. Environmental Toxicology and Chemistry, 17(10), 1908-1916. Prueger, J. H. and J. L. Hatfield. 1999. Field-Scale Metolachlor volatilization flux estimates from broadcast and banded application methods in central Iowa J. Environ Qual 28: 7581 Sparling, D. W., Fellers, G. M., & McConnell, L. L. 2001. Pesticides and amphibian population declines in California, USA. Environmental Toxicology and Chemistry, 20(7), 15911595. 138 USEPA. (1998). Guidelines for Ecological Risk Assessment, United States Environmental Protection Agency (USEPA). Washington, D.C.: Government Printing Office. Available at http://cfpub.epa.gov/ncea/cfm/recordisplay.cfm?deid=12460 (Accessed June 19, 2009). USEPA. (2004b). Overview of the Ecological Risk Assessment Process in the Office of Pesticide Programs, United States Environmental Protection Agency (USEPA). Washington, D.C.: Government Printing Office. Available at http://www.epa.gov/espp/consultation/ecoriskoverview.pdf (Accessed June 19, 2009). USEPA. (2007). Risks of Metam Sodium Use to Federally Threatened California Red-legged Frog (Rana aurora draytonii). Available at http://www.epa.gov/oppfead1/endanger/litstatus/ effects/redleg-frog/metamsodium/analysis.pdf (Accessed June 16, 2010). USFWS/NMFS. (1998). Endangered Species Consultation Handbook: Procedures for Conducting Consultation and Conference Activities Under Section 7 of the Endangered Species Act. Final Draft, United States Fish and Wildlife Service (USFWS) and National Marine Fisheries Service (NMFS). Washington, D.C.: Government Printing Office. Available at http://www.fws.gov/endangered/consultations/s7hndbk/s7hndbk.htm (Accessed June 19, 2009). USFWS/NMFS/NOAA.2004. 50 CFR Part 402. Joint Counterpart Endangered Species Act Section 7 Consultation Regulations; Final Rule. Federal Register Volume 69. Number 20.Pages 47731-47762. August 5, 2004. 139


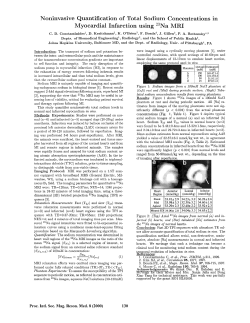


© Copyright 2026