
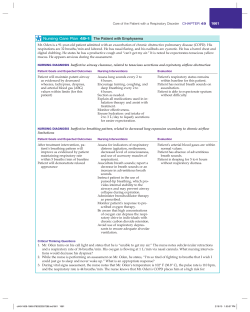
Performance Comparison of 4 Portable Oxygen Concentrators
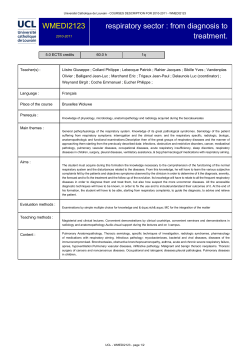
Performance Comparison of 4 Portable Oxygen Concentrators
Robert L Chatburn RRT-NPS FAARC and Thomas J Williams MBA RRT
BACKGROUND: Several portable oxygen concentrators (POCs) have become available in the
United States. Technical trade-offs are made in designing POCs, so their performance is expected
to differ. METHODS: We tested 4 POC models (Invacare XPO2, Respironics EverGo, AirSep
FreeStyle, and Inogen One) for oxygen delivery as a function of respiratory rate. We measured
oxygen volume per pulse, pulse duration, trigger sensitivity, oxygen concentration in the gas delivered by the POC (measured with a ceramic-based oxygen sensor), and relative fraction of
inspired oxygen (relative FIO2), measured with a setup that included an adult nasal cannula, a model
nares, and a lung simulator that has a built-in oxygen sensor. We studied respiratory rates of 15,
20, 25, 30, and 35 breaths/min, at a tidal volume of 500 mL. RESULTS: The XPO2 had the highest
pulse flow, and FreeStyle had the lowest, which corresponded to the highest and lowest pulse
volumes (40.8 mL and 18.2 mL respectively) at POC setting 2, at 15 breaths/min. The range of
oxygen purity was 91.9 –94.4% (P ⴝ .36). The Inogen had the shortest pulse-delivery time, and the
XPO2 had the longest (132 ms vs 281 ms, P < .001). The FreeStyle had the highest trigger sensitivity,
and the Inogen the lowest (0.15 cm H2O vs 0.21 cm H2O, P < .001). At the maximum settings, with
all 4 POCs, relative FIO2 decreased as respiratory rate increased (relative FIO2 range 28.6 –31.4% at
15 breaths/min, 23.0 –25.3% at 30 breaths/min). CONCLUSIONS: These 4 POC models have
markedly different performance, which emphasizes the need to adjust the POC setting to meet the
specific patient’s needs at rest and with activity. Key words: oxygen; oxygen concentrator; nasal
cannula; low flow oxygen therapy. [Respir Care 2010;55(4):433– 442. © 2010 Daedalus Enterprises]
Introduction
The first portable oxygen concentrator (POC) that
weighed less than 4.5 kg (LifeStyle, AirSep, Buffalo, New
York) was introduced to the United States long-term-oxygen-therapy market in 2002. Originally POCs were mar-
Robert L Chatburn RRT-NPS FAARC is affiliated with the Respiratory
Institute, Cleveland Clinic, and with the Department of Medicine, Lerner
College of Medicine, Case Western Reserve University, Cleveland, Ohio;
and with Strategic Dynamics, Scottsdale, Arizona. Thomas J Williams
MBA RRT is affiliated with Strategic Dynamics, Scottsdale, Arizona.
This research was partly supported by a grant from Invacare. The authors
have disclosed no other conflicts of interest.
Mr Chatburn presented a version of this paper at the OPEN FORUM of the
54th International Respiratory Congress of the American Association for
Respiratory Care, held December 13-16, 2008, in Anaheim, California.
Correspondence: Robert L Chatburn RRT-NPS FAARC, Respiratory Institute, M-56, Cleveland Clinic, 9500 Euclid Avenue, Cleveland OH
44195. E-mail: [email protected].
RESPIRATORY CARE • APRIL 2010 VOL 55 NO 4
keted for short-term ambulation and travel applications only.
Since then, at least 6 different POCs have become commercially available in the United States, and at least one manufacturer has marketed their POC as a “single source solution”
for patients and suggested it can be used at all times, during
travel, rest, or sleep. Other POC manufacturers market both a
POC and a stationary oxygen concentrator as a “system.”
They typically recommend that the stationary concentrator be
used while the patient is sleeping or sedentary and the POC
be used to ambulate around the home and while traveling.
Because all oxygen concentrators operate from essentially the
same engineering and design principles, some technical and
performance trade-offs have to be made in the design of a
POC to produce various specifications and features. The limitations of current battery and compressor technologies force
a compromise between size, weight, and the amount of oxygen delivered per minute (oxygen minute volume),1 so POC
performance specifications differ markedly among brands and
models.
The purpose of this study was to measure oxygen delivery as a function of respiratory rate with 4 POCs from
433
PERFORMANCE COMPARISON
OF
4 PORTABLE OXYGEN CONCENTRATORS
different manufacturers. Some POCs deliver a constant
pulse volume of oxygen, independent of respiratory rate
(fixed pulse volume), so the average fraction of inspired
oxygen (FIO2) per breath remains relatively constant as
respiratory rate increases. Other POCs deliver a constant
volume of oxygen per minute (fixed oxygen minute volume), so the pulse volume per breath decreases as respiratory rate increases, and increases as respiratory rate decreases. With these devices the FIO2 per breath is expected
to decrease as respiratory rate increases (assuming that
tidal volume remains constant), but at a rate that depends
on the POC design.
Methods
This study was funded by Invacare (Elyria, Ohio),
through a consulting contract with Strategic Dynamics
(Scottsdale, Arizona). The protocol was designed and conducted by one of the authors (RLC) as a consultant to
Strategic Dynamics. Data were collected and analyzed in
the Strategic Dynamics laboratory. This paper was written
entirely by the 2 named authors.
The 4 POCs tested were:
• XPO2, Invacare, Elyria, Ohio
• EverGo, Respironics, Murrysville, Pennsylvania
• FreeStyle, AirSep, Buffalo, New York
• Inogen One, Inogen, Goleta, California
The 3 main measured variables were oxygen pulse characteristics (pulse flow waveform, volume per pulse, pulse
delay, pulse duration, and trigger sensitivity), oxygen concentration of the gas delivered by the POC, and relative
FIO2 expressed as the volumetric percentage of oxygen in
the steady-state simulated lung volume. Measurements
were made at respiratory rates of 15, 20, 25, 30, and
35 breaths/min with the XPO2 and the EverGo, and at 15,
20, 25, and 30 breaths/min with the FreeStyle and the
Inogen One. The maximum trigger rate of the Inogen One
is 30 breaths/min. The FreeStyle can trigger at 35 breaths/
min, but alarms for low oxygen production.
We measured pulse characteristics with an automated
testing system for oxygen-conserving devices (1130 series, O2 Conserver Test System, Hans Rudolph, Shawnee,
Kansas), which includes a pressure sensor, a flow sensor,
data-acquisition hardware, signal-processing software, and
an audio speaker that can be controlled by the software to
generate a pressure signal to trigger the oxygen pulse from
the POC. The software can plot and save trigger pressure
and oxygen flow waveforms and calculate various performance variables. Flow-time data were sampled every 2 ms
and exported to an ASCII file, which we used to construct
pulse-flow waveforms.
434
Fig. 1. Experimental setup.
Pulse volume was determined by triggering the POC
with a sharp square-wave vacuum signal to ensure triggering. The trigger signal is turned off when flow or pressure begins to rise in response to the triggered oxygen
pulse. The flow signal is integrated over the pulse duration
to give the pulse volume. Pulse volume was calculated as
the mean of 3 random breaths. We made measurements at
various respiratory rates and at all the available POC settings, because pulse volume varies with respiratory rate.
Pulse duration and pulse delay were measured at
15 breaths/min. Results are expressed as mean values of 3
random breaths at each POC setting, and coefficient of
variation (standard deviation expressed as percent of mean
value). Pulse duration was calculated as the time from the
beginning of the pulse flow to the time that flow begins to
fall after the peak. Pulse delay was calculated as the time
from the beginning of the negative pressure signal to the
time that the pulse flow begins. Total pulse-delivery time
was defined as the sum of the pulse delay and the pulse
duration.
Trigger pressure was measured by generating a negative
trigger pressure ramp until the POC triggered a pulse. The
negative pressure just before flow began was recorded as
the trigger pressure and interpreted as the POC sensitivity.
Trigger sensitivity was measured at 15 breaths/min. Results are expressed as mean values of 3 random breaths at
each POC setting, and coefficient of variation (standard
deviation expressed as percent of mean value).
We measured the oxygen purity of the gas produced by
the POC at the POC’s output port, with a ceramic-based
oxygen sensor, calibrated with 96%, 85%, and 73% certified oxygen gas.
Figure 1 shows a schematic of the experimental setup.
To measure pulse volume the POC was triggered by the
oxygen-conserving-device tester. Oxygen pulses were accumulated in a manifold fitted with a latex rubber glove, to
keep the sampling pressure relatively constant to the oxygen sensor. Measurements were recorded when the oxygen
concentration stabilized after each setting change. Stability
was defined as an oxygen-concentration change of ⱕ 0.5%
for 60 s. The recorded oxygen concentration was the mean
of the high and low values recorded for approximately
60 s.
Oxygen minute volume was calculated as the product of
oxygen concentration, pulse volume, and respiratory rate,
with each POC setting.
RESPIRATORY CARE • APRIL 2010 VOL 55 NO 4
PERFORMANCE COMPARISON
OF
4 PORTABLE OXYGEN CONCENTRATORS
would contain alveolar gas and thus have a slightly lower
oxygen concentration than gas from the simulator that does
not consume oxygen. Thus, relative FIO2 in the simulator
should be very slightly higher than FIO2 during oxygen
therapy in a human. Nevertheless, studies in the literature
have assumed equivalence of relative FIO2 and FIO2 in a
patient.2,3
All measurements of relative FIO2 were performed with the
lung simulator, which has a paramagnetic oxygen sensor with
an error range of ⫾ 0.5% and 90% response time of less than
350 ms, with oxygen concentrations from 21% to 100%.
The lung simulator was set to model the breathing pattern of an average resting adult, using the volume pump
mode with a sinusoidal volume waveform and a tidal volume of 500 mL. This resulted in a cosine flow waveform.
The high initial inspiratory flow helped to ensure triggering of the oxygen-conserving devices built into the POCs.
The lung simulator’s uncompensated residual volume was
500 mL. Table 1 shows the lung model settings as a function of respiratory rate. Figure 3 shows typical pressure,
volume, and flow signals.
Data are presented as mean values and coefficient of
variation, which is standard deviation as a percentage of
the mean value, used to compare data variability for different types of performance characteristics. We averaged
the data for total pulse-delivery time, trigger sensitivity,
and oxygen concentration across settings for each POC (at
15 breaths/min), and compared the mean values across
different POCs with one-way analysis of variance for repeated measures. Differences associated with P values
⬍ .05 were considered significant.
Fig. 2. Model nares and nasal cannula.
The relative FIO2 measurements were made by connecting the POC to a standard adult nasal cannula attached to
a model nares machined from a block of aluminum (Fig. 2),
which was attached to a lung simulator that has a built-in
oxygen sensor (ASL 5000 IngMar Medical, Pittsburgh,
Pennsylvania). The model nares were each 1.0 cm in diameter and 5 cm long. The 2 nares emptied into a common
chamber, which was attached to the lung simulator. The
volume of the model nares was 51 mL. The volume of the
connecting tubing was 80 mL. The total dead space (measured via water displacement) was 131 mL. Steady-state
measurements of the oxygen concentration inside the lung
simulator (relative FIO2) were calculated as the mean of
20 breaths after a stabilization period of at least 50 breaths,
and the standard deviation of each 20-breath set was always less than 0.2%.
We coined the term relative FIO2 to indicate a quantitative value used to compare the relative oxygen delivery
rates of the tested POCs. We do not have data to state how
this relative FIO2 compares to actual FIO2 in a human. However, the steady-state oxygen reading inside the lung model
should be quite close to the FIO2 for a given breath in a
human, as the dilution of the oxygen pulse with room air
in a single inspiration by a human should be the same as
the steady-state dilution of oxygen delivered by the POC
with the minute volume of air pumped by the lung simulator. The only difference would be that in a human the
first portion of inspiration, from the anatomic dead space,
Table 1.
Results
Pulse Waveforms
Figure 4 shows representative pulse flow waveforms at
POC setting 2 and respiratory rate of 15 breaths/min. The
XPO2 had the highest pulse flow, and the FreeStyle had
the lowest, which corresponded to the highest and lowest
pulse volumes, respectively.
Lung Model Settings
Respiratory Rate (breaths/min)
Inspiratory volume (mL)
Inspiratory time (s)
Inspiratory/expiratory ratio
Peak oxygen pulse flow (mL/s)
Mean oxygen pulse flow (mL/s)
15
20
25
30
35
502
1.2
0.51
706
406
501
0.9
0.51
915
541
501
0.7
0.52
1,112
679
502
0.6
0.52
1,301
817
501
0.5
0.51
1,500
958
RESPIRATORY CARE • APRIL 2010 VOL 55 NO 4
435
PERFORMANCE COMPARISON
OF
4 PORTABLE OXYGEN CONCENTRATORS
Fig. 3. Waveforms produced by the lung simulator for determining relative fraction of inspired oxygen.
Pulse Volume
The XPO2 and the Inogen One have POC settings
from 1 to 5. The EverGo has settings from 1 to 6. The
FreeStyle has settings from 1 to 3. All the POCs displayed the same trend of increasing pulse volume as the
POC setting was increased. At a given setting, pulse
volume decreased with respiratory rate with the XPO2
and the Inogen One. The FreeStyle held pulse volume
constant as respiratory rate changed. The EverGo showed
a mixed response (both fixed pulse and fixed oxygen
minute volume); at POC settings 1 and 2 the pulse
volume remained constant as respiratory rate increased.
At setting 3 the pulse volume remained constant up to a
respiratory rate of 25 breaths/min, and then decreased at
30 and 35 breaths/min. At settings 5 and 6 the pulse
volume decreased with each respiratory rate increase.
Figure 5 shows the relationship of pulse volume and
resultant oxygen minute volume to respiratory rate. Figure 6 compares all the maximum pulse volumes, and
clearly shows wide differences between the POCs at
each respiratory rate.
436
Fig. 4. Representative pulse flow waveforms with 4 portable oxygen concentrators, each at POC setting 2 and respiratory rate
15 breaths/min.
RESPIRATORY CARE • APRIL 2010 VOL 55 NO 4
PERFORMANCE COMPARISON
OF
4 PORTABLE OXYGEN CONCENTRATORS
Fig. 5. Oxygen pulse rate versus oxygen pulse volume and total oxygen delivered per minute (oxygen minute volume).
Pulse Timing Variables
Table 2 summarizes the timing variables results. Pulse
duration tended to increase with POC setting with all the
RESPIRATORY CARE • APRIL 2010 VOL 55 NO 4
POCs. The Inogen One had the shortest average total pulsedelivery time, and the XPO2 had the longest (132 ms vs
281 ms, P ⫽ ⬍ .001). The differences were small relative
to the total breath cycle time (1,238 ms), which suggests
437
PERFORMANCE COMPARISON
OF
4 PORTABLE OXYGEN CONCENTRATORS
that these 4 POCs deliver the entire oxygen pulse very
early in the breath, so this performance difference may not
be clinically important.
Sensitivity
There were slight differences in trigger sensitivity (Table 3). The FreeStyle had the highest sensitivity, and the
Inogen One had the lowest (0.15 cm H2O vs 0.21 cm H2O,
P ⬍ .001). As with the pulse-timing results, the sensitivity
differences may not be clinically important.
Oxygen Purity at the Portable Oxygen Concentrator
Output Port
Fig. 6. Maximum oxygen pulse volume versus pulse rate.
All the POCs delivered comparable oxygen purity at
15 breaths/min (P ⫽ .36, Table 4).
Table 2.
Oxygen Pulse Timing Variables With 4 Portable Oxygen Concentrators*
XPO2
Mean
EverGo
CV (%)
Mean
Pulse Time (ms)
POC Setting
1
220
6
91
2
208
10
150
3
228
0
212
4
229
1
221
5
229
1
236
6
NA
NA
317
Mean
223
204
Pulse Delay (ms)
POC Setting
1
53
13
40
2
63
6
39
3
63
6
39
4
54
9
37
5
58
4
39
6
NA
NA
41
Mean
58
39
Total Time to Deliver Pulse (pulse time ⫹ pulse delay) (ms)
POC Setting
1
273
15
131
2
271
12
189
3
291
6
251
4
283
9
257
5
286
4
275
6
NA
NA
357
Mean
281
244
FreeStyle
Inogen
CV (%)
Mean
CV (%)
Mean
CV (%)
3
3
1
2
1
3
103
167
229
NA
NA
NA
166
2
2
8
NA
NA
NA
57
93
117
131
154
NA
110
5
4
4
3
6
NA
5
11
3
3
11
3
62
62
61
NA
NA
NA
62
3
3
4
NA
NA
NA
21
21
22
21
21
NA
21
6
5
0
5
6
NA
6
11
3
4
11
4
165
229
291
NA
NA
NA
228
4
4
9
NA
NA
NA
78
115
139
152
175
NA
132
8
7
4
6
8
NA
* At 15 breaths/min.
CV ⫽ coefficient of variation
POC ⫽ portable oxygen concentrator
NA ⫽ not applicable
438
RESPIRATORY CARE • APRIL 2010 VOL 55 NO 4
PERFORMANCE COMPARISON
Table 3.
OF
4 PORTABLE OXYGEN CONCENTRATORS
Trigger Sensitivity With 4 Portable Oxygen Concentrators*
Trigger Sensitivity (cm H2O)
POC Setting
XPO2
EverGo
FreeStyle
Inogen
Mean
CV (%)
Mean
CV (%)
Mean
CV (%)
Mean
CV (%)
0.20
0.18
0.18
0.18
0.18
NA
0.18
8
3
1
1
2
NA
0.15
0.16
0.16
0.16
0.16
0.15
0.16
10
3
2
3
2
3
0.14
0.15
0.15
NA
NA
NA
0.15
3
3
6
NA
NA
NA
0.22
0.21
0.20
0.22
0.22
NA
0.21
3
2
5
2
3
NA
1
2
3
4
5
6
Mean
* At 15 breaths/min.
NA ⫽ not applicable
Table 4.
Oxygen Purity From 4 Portable Oxygen Concentrators*
Oxygen Purity at the Concentrator’s Output Port (%)
POC Setting
XPO2
EverGo
FreeStyle
Inogen
15 breaths/min 35 breaths/min 15 breaths/min 35 breaths/min 15 breaths/min 30 breaths/min 15 breaths/min 30 breaths/min
1
2
3
4
5
6
Mean
94
93
94
93
93
NA
93.5
95
95
95
95
96
NA
91
92
93
93
92
92
91.9
93
92
92
92
91
92
93
94
94
NA
NA
NA
93.6
95
92
92
NA
NA
NA
93
93
95
95
95
NA
94.4
93
94
95
95
95
NA
* At 15 breaths/min.
NA ⫽ not applicable
Table 5.
Oxygen Minute Volume* With 4 Portable Oxygen Concentrators
Oxygen Minute Volume (mL/min)
POC Setting
XPO2
EverGo
FreeStyle
Inogen
15 breaths/min 35 breaths/min 15 breaths/min 35 breaths/min 15 breaths/min 30 breaths/min 15 breaths/min 30 breaths/min
1
2
3
4
5
6
319
571
641
759
904
NA
355
456
608
790
878
NA
155
302
450
624
765
895
386
710
903
877
881
882
126
255
372
NA
NA
NA
256
430
508
NA
NA
NA
149
294
437
617
756
NA
146
291
433
600
738
NA
* Oxygen minute volume is calculated as the product of pulse volume (mL), oxygen concentration (%), and respiratory rate (breaths/min).
NA ⫽ not applicable
Oxygen Minute Volume
Because the oxygen purities of the tested POCs were
similar, the oxygen minute volume reflected mainly the
RESPIRATORY CARE • APRIL 2010 VOL 55 NO 4
pulse volume rather than other variables (Table 5). Note
that, for any given POC setting, the oxygen minute volume
differed markedly among these POCs. The effect of the
pulse volume versus respiratory rate characteristic is illus-
439
PERFORMANCE COMPARISON
OF
4 PORTABLE OXYGEN CONCENTRATORS
reported that constant flow at 6 L/min yielded FIO2 of
about 33% and 39% at respiratory rates of 30 breaths/min
and 15 breaths/min, respectively, with a tidal volume of
500 mL. Our experimental setup yielded FIO2 values of
33% and 40% with that breathing pattern. This observation
tends to validate our results.
Figure 10 compares the relative FIO2 values at POC
setting 2, which is perhaps the most common setting in the
home environment. Note that the relative amount of oxygen inspired differs among these POCs. At setting 2 and
with this ventilatory pattern, none of them delivers oxygen
equivalent to that at a constant flow of 100% oxygen at
2 L/min.
Discussion
Fig. 7. Relative fraction of inspired oxygen (relative FIO2) versus
constant flow setting.
trated by comparing the XPO2 and the EverGo. For example, at POC setting 2, the XPO2 produced more oxygen
per minute than the EverGo because it produced a higher
oxygen purity and a larger pulse volume. However, the
XPO2’s pulse volume decreases as respiratory rate increases, whereas the EverGo’s pulse volume remains constant. At respiratory rates of 25–35 breaths/min, the EverGo produces more oxygen per minute than the XPO2
and hence delivers a lower relative FIO2 than the XPO2 up
to a rate of 20 breaths/min, and then a higher relative FIO2
from 25 to 35 breaths/min (see below).
Relative FIO2
The lung simulator measured the room-air oxygen concentration as 20.8%. For reference, Figure 7 shows the
relative FIO2 with a standard nasal cannula connected to an
oxygen tank (ie, 100% oxygen). As expected, relative FIO2
increases with the flow setting and decreases with the
respiratory rate. Figure 8 shows the relative FIO2 versus the
POC setting.
Figure 9 shows the maximum relative FIO2 as a function
of respiratory rate for all the POCs tested. There was a 6%
difference (P ⬍ .001) between the highest relative FIO2
(EverGo) and the lowest relative FIO2 (FreeStyle) at
15 breaths/min. Note that the data in Figure 9 are less than
those reported by McCoy,4 who did not explain the experimental setup he used, so we are unable to explain the
differences between these data sets. However, Bliss et al5
440
To our knowledge this study provides the first objective
evidence published in a peer-reviewed journal that the
performance of different POCs differs greatly at a given
setting. The maximum difference in relative FIO2 between
POCs at setting 3 and continuous flow at 3 L/min ranged
from 6.6% (at 15 breaths/min) to 7.9% (at 20 breaths/min).
This observation may not be clinically important, because
many variables affect FIO2 in a spontaneously breathing
patient using a nasal cannula (of which only one set were
tested in this experiment). A low-flow nasal cannula inherently produces highly variable FIO2.6
At 15 breaths/min the 2 highest relative FIO2 values were
with the EverGo and XPO2 (at settings 5 and 6, respectively), but they differed by only 1.7% (31.4% vs 29.7%).
However, there was a 6.5% difference between the EverGo and the FreeStyle in maximum relative FIO2 at that
respiratory rate.
The large differences among the tested POCs highlights
the importance of understanding POCs’ performance characteristics and titrating the POC setting to the patient’s
requirements. Our results are consistent with previous studies of pulse-dose oxygen devices, and support the American Association for Respiratory Care recommendations.7
With all the tested POCs, pulse volume increased with
POC setting, as expected, although the EverGo reached a
maximum pulse volume at POC setting 3 at 35 breaths/
min. There 2 possible design goals for a POC in terms of
oxygen output as a function of respiratory rate: (1) maintain a constant oxygen minute volume (ie, pulse volume
decreases as respiratory rate increases, similar to a constant-flow nasal cannula), or (2) maintain a constant pulse
volume (ie, oxygen minute volume increases as respiratory
rate increases). Figure 5 shows that the EverGo and the
FreeStyle are constant-oxygen-minute-volume POCs, and
the Inogen One and XPO2 are constant-pulse-volume POCs.
Note, though, that the EverGo could only increase oxygen
minute volume up to about 970 mL/min and had a constant
output at POC setting 6.
RESPIRATORY CARE • APRIL 2010 VOL 55 NO 4
PERFORMANCE COMPARISON
OF
4 PORTABLE OXYGEN CONCENTRATORS
Fig. 8. Relative fraction of inspired oxygen (relative FIO2) versus setting on the portable oxygen concentrator.
Pulse timing and peak pulse flow differed among the
tested POCs. The XPO2 had the highest pulse flow, but the
Inogen One had the shortest pulse duration and pulse delay. All of the tested POCs had total pulse-delivery times
that were less than 70% of the inspiratory time (ie, the
critical window for delivering the oxygen pulse, to avoid
wasting oxygen in the anatomical dead space) with respiratory rates less than 35 breaths/min. None of the total
pulse-delivery times were long enough to adversely affect
the relative FIO2 under normal breathing conditions. Even
at a high respiratory rate there may be no effect. For example, at 35 breaths/min the total cycle time is 1.7 s, at
which most people would have an inspiratory/expiratory
ratio of 1:1 (vs the 1:2 we used in this simulation), and the
inspiratory time would be 857 ms. If we assume that 30%
of the inspiratory time is wasted in delivering volume to
the dead space, that leaves a critical window of about
600 ms of inspiratory time for the POC to deliver the
oxygen pulse. Even the XPO2, which has a large pulse
RESPIRATORY CARE • APRIL 2010 VOL 55 NO 4
volume and the longest total pulse-delivery time, delivers
the entire pulse within that 600-ms window.
Trigger sensitivity seemed adequate in all cases for awake
patients, and differed only slightly among the tested POCs.
The key question is whether the trigger sensitivity is adequate during sleep. Most clinicians believe that continuous flow is required during sleep, but several studies suggest that that may be incorrect.8-12 Until further clinical
studies are conducted, we believe that clinicians and homemedical-equipment providers who are concerned that a
patient may desaturate during sleep should check the patient’s nocturnal blood oxygen saturation via oximetry before choosing a specific POC.
Perhaps our most important finding, from the standpoint
of clinical application, is that relative FIO2 is respiratoryrate dependent, to varying degrees, depending on the POC.
This would be relevant, for example, to a patient with
chronic obstructive pulmonary disease during exercise or
an exacerbation, or a patient with pulmonary fibrosis, a
441
PERFORMANCE COMPARISON
OF
4 PORTABLE OXYGEN CONCENTRATORS
rapid respiratory rate, and a high inspiratory flow. Such
patients may need to increase the POC setting under certain circumstances.
The fact that relative FIO2 decreased as respiratory rate
increased is not surprising. Because tidal volume was held
constant in our experiments, as oxygen minute volume
increased with respiratory rate, the ratio of oxygen from
the POC to entrained air decreased, thus decreasing relative FIO2.
Conclusions
The 4 POC models we tested had markedly different
performance characteristics. They all provided lower relative FIO2 than does constant-flow 100% oxygen via nasal
cannula, which emphasizes the need to adjust the POC
setting to meet the patient’s need, both during rest and
activity.
REFERENCES
Fig. 9. Maximum relative fraction of inspired oxygen (relative FIO2)
versus respiratory rate, with a tidal volume of 500 mL and an
inspiratory/expiratory ratio 1:2.
Fig. 10. Relative fraction of inspired oxygen (relative FIO2) versus
respiratory rate, at portable-oxygen-concentrator setting 2, tidal
volume 500 mL, and inspiratory/expiratory ratio 1:2.
442
1. Williams TJ, Chatburn R. Respiratory: the business of breathing.
HME Today 2007;Feb:26-30.
2. Bliss PL, McCoy RW, Adams AB. A bench study comparison of
demand oxygen delivery systems and continuous flow oxygen. Respir Care 1999;44(8):925-931.
3. Bliss PL, McCoy RW, Adams AB. Characteristics of demand oxygen delivery systems: maximum output and setting recommendations. Respir Care 2004;49(2):160-165.
4. McCoy RW. Portable oxygen concentrators’ performance variables
that affect therapy. AARC Times 2007;31(9):36-42.
5. Bliss PL, McCoy RW, Adams AB. A bench study comparison of
demand oxygen delivery systems and continuous flow oxygen. Respir Care 1999;44(8):925-931.
6. Casaburi R. Assessing the dose of supplemental oxygen: let us compare methodologies. Respir Care 2005;50(5):594-595.
7. American Association for Respiratory Care. AARC Clinical Practice
Guideline. Oxygen therapy in the home or alternate site health care
facility: 2007 revision and update. Respir Care 2007;52(1):1063-1068.
8. Stegmaier JP, Chatburn RL, Lewarski JS. Determination of an appropriate nocturnal setting for a portable oxygen concentrator with
pulsed-dosed delivery (abstract). Respir Care 2006;51(11):1305.
9. Gay PC. Chronic obstructive pulmonary disease and sleep. Respir
Care 2004;49(1):39-51.
10. Cuvelier A, Muir J, Czernichow P, Vavasseur E, Portier F, Benhamou D, Samson-Dolfuss D. Nocturnal efficiency and tolerance ofa
demand oxygen delivery system in COPD patients with nocturnal
hypoxemia. Chest 1999;116(1):22-29.
11. Kerby GR, O’Donahue WJ, Romberger DJ, Hanson FN, Koenig GA.
Clinical efficacy and cost benefit of pulse flow oxygen in hospitalized patients. Chest 1990;97(2):369-372.
12. Bower J, Brook C, Zimmer K, Davis D. Performance of a demand
oxygen saver system during rest, exercise and sleep in hypoxemic
patients. Chest 1988;94(1):77-78.
RESPIRATORY CARE • APRIL 2010 VOL 55 NO 4


© Copyright 2026