
Nã¼STEP REPãRT Nãã¼ 29
\ −_
V、‡ウノ
N IS T E P R E P O R T N o .2 9
THEPRESENTSTATEOFJAPANESECORPORATl0NS,
STRATEGICR&DMANAGEMENTSYSTEMS
DeCember1993
MasaakiSawada,
SatoshiTanaka,HiroyukiTomizawa,
MasaruTsukamoto,H坤meNagahama
SecondPoIicy一〇rientedResearchGroup
SecondTheory−OrientedResearchGroup
NationalhlStituteofScienceandTechnol0gyPolicy
(NISTEP)
ScienceandTechnoIogyAgency
JAPAN
Translationfrom
Japaneseversion
CONTENTS
IIntroduction……………………………………………………………………………………………………………....l
II AimandAssumptions…………………………………………………………………………………………………3
III ConductoftheSurvey………………………………..………………………………………………………………5
1.SurveyMethod
2.CompaniesSurveyed
3・CompaniesandRespondent’sPosition
1.OutlineofR&DActivities
7
1−1 BreakdownofR&DActivities
7
ト2 AllocationofR&DPersonnel
8
1−3 ResearchFormat
8
1−4 StandardResearchPeriod
9
1−5 R&DBudgetAllocationtoNewResearchThemes
9
1−6 FrequencyofNewTechnology
1T7 NeedforChangeinProductLine
9
2・GrowlngAwarenessoftheNeedfbrStrategicR&DManagementSystems
2−1SeparateDivisionsforR&DStrategyPlannlng
10
11
11
2T2 PositionwithinCompanyOftheR&DDivisionHead(Compahng1981
.
13
ImprovlngtheEfhciencyofR&DActivities
15
EvaluatingR&DfromtheViewpolntOfInvestmentEffectiveness..
17
3
2
and1991)
−
4
2
.
5
2
InfIuenceofDivisionsonMattersAffectingthePerformanceofthe
OverallCompany
19
1
2
3
2
′
3−2 PreparationofCompanyResearchPlans
l
2
3.CurrentStateofStrategicR&DManagementSystems
3−1MethodsofFormulatingR&DBudgetPlans
0
0
2
ノ
3 3 4
2 3 0
4 4 4
3 3 5
3−4 ConsiderationsintheFormulationofR&DStrategy
2
3−3 FormulationofCompanyResearchStrategy
3−5 ReviewofR&DStrategyinResponsetoChangesintheR&D
Environment
3−6 ResearchConsortia
3−7 TechnologyTransfbr
4.ContactBetweenR&DDivisionandOtherDivisions
4−1DegreeofContact
4−2InnuenceofOtherDivisionsintheFormulationofR&DStrategy
5.CompanyEmploymentConditionsbrandAttitudesTowardsResearchersand
4 4 5
5 5 5
Engineers
5−1EmploymentConditionsbrResearchersandEngineers
5−2 AttitudesTowardsResearchersandEngineers
6.R&DPerformance
6−1 RatioofNewProductsandRatioofSalesforNewProducts
V SummaryofSurveyResults…………………‥.…………………………………………………………….;....64
VI ConcIusion……………………………………………………………………………………………………………….66
Bibliography………………………………………………………………………………………………………………….68
Annexl.Questionnaire
Annex2・SimpleAggregateTables
Annex3.ListofSurveyedCompanies
ii
IIntroduction
In recent years the extent to which R&D directlyinnuences business results within the
manufacturlngindustryhassteadilylnCreaSed,andviewssuchasHbusinessexpanSioncannotbe
achievedwithoutbuildingupR&DcapabilitiesHandHcompaniesthatcontroIR&Dcontrolthe
market”havebecomefirmlyestablishedamongtheseniormanagementechelonsatcompanies・
Thecurrentsluggishbusinessenvironmentsuffersfromintenseinternationaltechnological
COmpetitiveness,thedownturninprofitsbroughtaboutbythematurationoftechnology,PrOducts
andmarkets,thediversincationofmarketneedsandtheexpanSionofoperationalrangethrough
businessdiversi丘cation・ThisismakinglteXtremelydifncultfbrthemanufacturlngindustryto
breakthoughthepresentbamiererectedbytechnologythathasreachedmatuntyandbecome
Stagnant・COmPanieswithintheindustryarenowbeingfbrcedtochoosespecincthemesonwhich
tofbcusbcauseofthegrowlngdiversltyofnewtechnologyseedsandbasictechnologleS,andthe
SharpriseintheamountofR&DinvestmentandtheincreaslngreSearChtimerequiredtoobtain
resultsfromR&D・ThusthereisanintensifyingneedfbrtheJapanesemanufacturlngindustryto
Placegreaterimportanceon=strategyHand=strateglCmanagementのinordertodealwithsucha
Chaoticandhighlyuncertainbusinessenvironment.
DuringJapan’shigheconomicgrowthperiodcompanieshadrelativelyclearideasaboutwhat
they shouldmanufacture and how,andthere was no presslngneedfbrseniormanagement to
emphasizethesettingofgoalstothisend・Individualemployeesstrovetoimprovethequalityand
perfbrmanCeOfwhatevertheyweremanufacturlngWiththecommonaimofHexpandingbusiness
bymass−PrOducingbetterqualityproductsinshorterperiodsatacheapercost=・Needlesstosay,
thelong−eStablishedstructurewasefncientandplayedanabsolutelyvitalroleintherealizationof
thisaim.
During thisperiod pnvate−SeCtOr COmPanies asslgned most oftheir business resources to
PrOduct development and manufacture,While their research effbrt fbcused mainly on applied
researchaimedatimprovingproductqualityorperfbrmance,SOR&Dthenwasperhapscloserto
“R&D”inits generallack ofbalance.This research−development−PrOduction process was an
extremelyefncientmeanstoachievethemissionmentionedaboveinashortperiod・
Companies that strengthenedtheirbusiness fbundations during the higheconomic growth
periodpoured considerable effbrtinto R&D during the series ofboomsin establishing central
researchinstitutionsin an effbrt to enhancetheir technologicalcapabilities,andthrough this,
COntinuedtoexpandandbecamehighlycompetitiveinintemationalmarkets・Duringthisprocess,
researchanddevelopmentbyJapanesecompaniessteadilytookonamuchmorebalancedemphasis,
Changlngfromtheone−SidedHR&DHtothemoreproportional‘‘R&DH・
AscompaniescontinuetochangeHfromproducingtothinkingorganizations,,1,itisbecomlng
increaslnglylmPOrtantfbrthemtoclarifytheirstrategleS bywayofadirectionthatemployees
Shouldfbllowandgoalsatwhichemployeesshouldaim,thatis,Hwhattheyshouldmanufacture
andhow”and“whattheyshoulddotoachievethis=・htoday,ssocietyweareconstantlytxBing
inundatedwithinfbrmation,SOthereisagrowlngneedforsystemswhichenableustochooseonly
thatinfbrmation whichis of use to us,Which facilitate the timely vertical,lateraland
1RefbrenceDocument:NISTEPREPORTNo・15・一FromProducingtoThinkingOrganisations”
ー1−
interdepartmentalflow ofinbrmation,and which promote strategic R&D managementthatis
mindfulofdifferentiationandtheallocationofpri0rities.
IfJapanesecompanieswerepressedtochooseorganizationalrefbrm(toadynamicandwe11−
COOrdinatedsystem)orformulationandexecutionofstrategiesorbothtodealwithtoday’shighly
uncertainenvironment,thenwhatkindofactionwouldtheytake?
ThisreportbringstogethertheresultsofasurveyOfJapanesecompaniesthatfbrmsapartofa
WidersurveyWhichseekstocomparetheR&DmanagementsystemsofJapanese,UnitedStates
andEuropeancompanies・
WeshouldliketotakethisopportunltytOeXPreSSOurSincereappreciationfbrtheinvaluable
guidance we received丘.om Dr・Ikujiro Nonaka,Directorin thelst Theory−0rientedResearch
Group,NISTEP,andbrthemanyextremelyhelpfulsuggestionswereceivedh’OmDr・KinjiGonda,
Directorin the2nd Theory−0riented Research Group,and Dr.Masahiro Kawasaki,Executive
DirectoroftheJRDC(fbrmerdirector一generalofNISTEP)whenplanninganddrawingupthe
SurVeyandprepanngthisreport.
July1993
MasaakiSawada,Researcher,2ndPolicy−0rientedResearchGroup
SatoshiTanaka,formerlySeniorResearcher,2ndPolicy−0rientedResearchGroup
(CurrentlynrstsecretaryattheEmbassyofJapaninCanada)
HiroyukiTomizawa,Researcher,2ndTheory−0rientedResearchGroup
MasaruTsukamoto,Director,2ndPolicy−0rientedResearchGroup
HajimeNagahama,fbrmerlyDirector,2ndPolicy−OrientedResearchGroup
(Currentlyprofbssor,DepartmentofEconomics,ShinshuUniversity)
−2−
IIAimandAssumptions
Ahighlyuncertainbusinessenvironmenthasbeencausedrecentlybyintenseinternational
technologlCalcompetitiveness,the downturnin profits due tothe maturation of technology,
productsandmarkets,thediversincationofmarketneedsandtheexpanSionofoperationalrange
throughbusinessdiversi伝cation,grOWlngdiversltyOfnewtechnologyseedsandbasictechnologleS,
andthesharpriseintheamountofR&DinvestmentandtheincreaslngreSearChtimerequiredto
ObtainresultsfromR&D・Inconductingthisresearch,WeWOrkedontheassumptlOnthatwithinthe
Japanese
manufacturlngindustry
thereis
anintensifying
need
for“strategleS”and“strateglC
management”todealwiththisenvironment.
Theaimofthisresearch,basedonawide−ranglngqueStionnaire,istoverifythattheJapanese
manufacturlngindustryisbecomlngmOreaWareOftheimportanceofstrategicR&Dmanagement
SyStemS,andtoascertainwhattypicalmanufacturlngCOmPanies,thedrivingfbrceofprivate−SeCtOr
R&DinJapan,aredoingorintendtodotoensurethattheirR&Doperationsareeffbctiveand
ef丘cientinresponsetothehighlyuncertainbusinessenvironmentdescribedabove・Throughthis
research,Wealsoaimedatuslngtheresultsofthequestionnairetopresentanumberofgeneral
SuggeStionsfbrefftctiveandefncientR&Dmanagementsystemsthatwouldbeofbene6tnotJuSt
toprlVate−SeCtOrCOmPanies,buttoallinstitutionsthatconductresearchanddevelopment.
Ascompaniescontinuetochange‖fromproducingtothinkingorganizations日,itisbecomlng
increaslnglylmPOrtantfbrthemtoclarifytheirstrategleSbywayofadirectionthatemployees
Shouldfbllowandgoalsatwhichemployeesshouldaim,thatis,“Whattheyshouldmanufacture
andhow”and“whattheyshoulddotoachievethis”.Inthisresearchweassumedthatifthereisa
needfbrstrateglCmanagementthatismindfulofdifferentiationandtheallocationofprioritiesto
dealwiththeuncertaintyinthebusinessenvironment,itthenfbllowsthattherewouldbeseparate
divisions fbrR&D strategy plannlng Within companies to devise and execute“strategleS”as a
COnCreteinternalmeasuretodealwithsuchatrend.Wealsoassumedthatseparatedivisionsfor
R&Dstrategyplannlngfu1丘llthefunctionofcoordinatlnglnterdepartmentalviewswhendevising
andexecutlng“StrategleS”bychooslngfromthevastrangeofbusinessinformationavailablefrom
Varioussourcesonlythatwhichisofusetotheirowncompany,andbyprocessing(Creating)and
PreSentlngthisinfbrmationinafbrmthatisusablewithinthecompany.
On the basis ofthese assumptlOnS andfrom the viewpolnt Ofwhether the company had
established a Separate division for R&D strategy plannlng Or nOt,We attemPted to graspthe
CharacteristicsofR&DmanagementwithintheJapanesemanufacturingindustrythroughthetrends
forresponsestoindividualitemsaboutR&Dmanagementsystems,SuChas“changeintheposition
WithincompanyoftheR&Ddivisionhead”,“methodoffbrmulatingR&Dbudgetsplans”,“COntaCt
betweenR&D divisionand otherdivisions”,“emPloymentconditions fbrand attitudes towards
researchersandtechnicians”and“consortia”.
To avoid any misunderstanding,it should be polnted outthat the existence ofa separate
divisionfbrR&DstrategyplannlngdoesnotautomaticallymeanthatastrategicR&Dmanagement
SyStemisinplace・Theexistenceofsuchadivisionwastakenupmerelyasanindicationofthe
growlnglmPOrtanCe
Of“strategy”and
the
extent
introduced.
−3−
to
which“strateglC
management”had
been
Inthisresearchwehavede伝ned“strategy”and“strateglCmanagement”asfbllows.
Strategy: AvisionformulatedfortheloglCalandapproprlatedistributionofthe
COmpany’s
resources
based
on
an
analysis
of
the
business−related
environmentwithinandoutsidethecompany.
Strategicmanagement:The drawing up and execution ofimplementation measures(tactics),
keeplnglnminddiffbrentiationandtheallocationofpri0ritiesinlinewith
thefbrmulated“strategy”.
Moreover,inourview,“Strategy”isnotahostileconcepteveninwell−COOrdinatedsystems
thathaveahighregardfortheindependenceofmembersoftheorganization・
−4−
III ConductoftheSurvey
l.SurveyMethod
Forthesurvey,queStionnairescompnslng38R&D−relatedquestionsweresentbymailtothe
COmPaniesbeingsurveyed.ThequestionnaireisattachedasAnnex1.
2.CompaniesSurveyed
Companieswithresearchexpenditureinexcessoftenbillionyenwereselectedfbrthesurvey
OnthebasisoftheviewthatsincethelevelofR&DexpenditurereflectsthescaleofR&Dactivities,
itis possible to compare R&D management systems at companies whose R&D expenditureis
above a setlevel.Moreover,thisis notunrelated to the factthatthe surveyisalsoaimed at
presentinggeneralsuggestions(thatgobeyondindustrialpeCuliarities)abouttheconductofR&D.
We chose fbr the survey149companies whose nscal1990R&D expenditure was atleast ten
billionyenaccordingtotheQuarterlyJapancompanyHandbook,publishedbyToyoKeizaiInc.
(TheOrientalEconomist).Wedid,however,includetwelvecompanieswhoseR&Dexpenditure
WaSless than ten bil1ion yenin order topermit comparisonamOng diffbrentindustries・The
minimumexpenditureinthesecaseswas7.5billionyen,andtheaveragewasninebillionyen.
WecheckedtheR&DdivisionheadsorofncersresponsiblefbrR&Dinthesecompaniesin
thecompanyStaffListpublishedbyDiamondCo・Ltd・,andmailedthequestionnairestothese
OfncersinearlyDecemberl991.Inthecovennglettertothequestionnaire,WeaSkedthatthe
questionnairetxm1edinbyastaffmemberwhocouldgiveresponsesaboutthecompany’sR&D
Strategy,R&Dmanagementsystemandtheoverallmanagementenvironmentbasedono叫ective
data.
3.CompaniesandRespondent,sPosition
ResporlSeSWerereCeivedfrom1260fthe149companiestowhichquestionnairesweresent
(responserateof84.6%).Thecompaniesthatrespondedaccountfbr64・4%ofR&Dexpenditure,
38.4%ofsales,32.2%ofemployees and55.3%ofresearchers amongJapanese pnvate−SeCtOr
COmPanies2・
Abreakdownofrespondents’positionsisshowninFigurel(N=numberofrespondents;Q=
questionnumber).
Figure2showsthesectionswheretherespondentsareinvoIvedinR&Dstrategydevelopment・
2DatashownherearepercentagesoftotalfiguresforJapaneseprlVate−SeCtOrCOmPaniesobtainedfromManagement
andCoordinationAgencystatistics(1991ScienceandTechnologySurveyReport:Dataoncompaniesthatare
conductingresearchfromallindustries,eXCludingpubliccorporations)・R&Dexpenditureisexpenditurewithinthe
company,andthenumberofresearchersisthenumberofemployeeswhoarePrlmarilyengagedinresearchwork・
−5−
Figurel PositionofRespondents[Q.1]
Executiveo餌cer45(35.7%)
Figure2SectionsWhereRespondentsareInvoIvedinR&DStrategyDevelopment[Q.2]
Unclear2(1.6%)
0vemllcompany73(57.9%)
ー6−
IV SurveyResults
l. OutIineofR&DActivities
l.1BreakdownofR&DActivities
Weaskedthecompaniestoshowabreakdownoftheirresearcheffbrtaccordingtothenumber
Ofresearchthemes undereach ofthelistedresearchcategories andto the numberofperSOnnel
allocatedtoeachoftheresearchcategories.Thehguresfbreachoftheresearchcategoriesinthe
effectiveresponseswereaddedup,thenasimpleaveragewasobtained・
The breakdown according to the number ofresearch themes was basic research−11.3%,
researchconcernlngmainoperations−46.4%,reSearChrelatedtomainoperations−24.1%,reSearCh
COnCerningnewfieldsofoperations−16.8%,andotherresearchcategories−1.4%(Figure3).The
perCentage R)r basic research shown hereis higher than thelO%listedin Management and
COOrdinationAgencystatistics,butthiscanprobablybeattributedtothefhctthatthecompanies
SurVeyedinthisstudyareallm鋤OrCOmpanies.
Figure3BreakdownofR&DActivitieslQ.22]
(AccordingtoNumberofResearchThemes)
16.8% 1.4%
11.3% 46.4% 24.1%
ーブ▼
’ノ
:ー
ー
ハ
.
ポ
、、く
・
軋
ー
托
ー
1 デド
牒
・▼
′
ー聖
ニ
、、ノ.さ
.よ
.・、
ぺ
、、Y
′
N=116
=
腰1°B肺鉗h園2’還血田3‘雷雲霊霊S国憲誌ns□5蓋S
Asfbr the breakdown according to allocation ofperSOnnel:basic research sub−CategOries
(1)academicresearch−3・3%and(2)researchonnewtechnology−9.7%,aPPliedresearchsub−
CategOries(1)researchconcerningthe developmentofnewproducts−40.8%and(2)research
COnCernlngthemodificationofexistlngPrOducts−26・3%,reSearChconcernlngthedevelopmentof
new manufactunng methods−9・5%,reSearCh concernlngtheimprovement ofmanufacturlng
PrOCeSSeS−8・5%,andotherresearchcategories−1.9%(Figure4).
Figure4JlreakdownofR&DActivities[Q.26]
(AccordingtoAllocationofPersonnel)
3.3% 9.7% 40.8% 26.3% 9.5% 8.5%1.9%
鰹圏二…∴二∴∴二∴二_∴、:
慮1・(1)AcadのC柁測肺一因1・(2)臓W虹h鴫y Eヨ2・去霊ご10卿ばnew図2・(2?削i丘のd
exIS血g画ucb
m血加。g匹。鵬 □5・仙併陀甜Ch
m慧霊㌫sEヨ4・叫Ⅶeー㌫間口霊鐙
−7−
N=115
1.2 AIlocationofR&DPersonneI
For
this
question,We
divided
researchinto
fbur
categories−reSearChwithin
one’s
own
COmPany,reSearCh fbllowlng theintroduction of new technology,trialS,and other research
CategOries−andaskedthecompaniestoindicatetheperCentageOftheirR&DperSOnnelallocatedto
eachcategory.Thenguresfbreachoftheresearchcategoriesintheeffbctiveresponseswereadded
up,thenasimpleaveragewasobtained.Resultswere:reSearChwithinone’sowncompany−79.6%,
researchfollowlngtheintroductionofnewtechnology−9・0%,trials−10・0%,andotherresearch
CategOries−1.4%(Figure5)・
Figure5AIlocationofR&DPersonnel[Q.24]
79.6% 9.0%10.0%1.4%
調1・禁霊Wi抽肺own 国2忠霊霊霊加1。訂 ロ3個S[]4霊品慧狐h
1−3 ResearchFormat
Forthisquestion,Wedividedresearchinto six fbrmats−individualresearch,COOperative
research(Withindividuals什om other groups),grOuP reSearCh,eXternal research prqiects,
commissionedresearch,andotherresearchfbrmats−andaskedthecompaniestoindicatetheextent
towhicheachformatisusedasaperCentage・The伝guresforeachoftheresearchformatsinthe
effbctiveresponseswereaddedup,thenasimpleaveragewasobtained・Resultswere:individual
research−7.9%,COOPerativeresearch胃9.8%,grOupreSearCh−66・9%,eXternalresearchprqjects−
6.6%,COmmissionedresearch−8.1%,andotherresearchfbrmats−0・7%(Figure6)・
Figure6ResearChFormatbyThemelQ・23]
66.9%
錮1・hdiddualres∽h
4.Extemの記紀∬Ch
prqeCは
国2・C叩ra前e記紀訂Ch ロ3・伽up陀S鵬h
□5・慧S血の □6・濫榔h
−8−
6.6% 8.1%0.7%
1.4 StandardResearChPeriod
Weaskedcompaniestoindicatehowlongtheygenerallyspendonaslngleresearchtheme;1−2
years,3years,5years,andlOyearsorlonger・Morethanhalf(52・0%)respondedwith3years,
whilell.6%said1−2years,32.3%Said5years,and4・2%saidlOyearsorlonger(Figure7)・
Figure7StandardResearehPeriod[Q・21]
11.6% 52.0% 32.3% 4.2%
く
ノ
、
ベベへ
ー
壷∴
..… . −
.
ジ.
Y′A
テ嵩 蓑
N=121
嵩
由1ト2ye訂S 図2・3ye訂S 閻3・5y耶l[コ4・10ye邪αlon辞r
1・5R&DBudgetAIIocationtoNewResearChThemes
WethenaskedthecompanieswhatperCentageOftheirannualR&Dbudgetisspentonnew
researchthemes.ResponseswerereceivedfromlOIcompanies,andthesimpleaverageoftheir
responsescameto21.7%.
1・6FrequencyofNewTechnology
WeaskedthecompaniestoindicatethefrequencywithwhichtheylntrOducenewtechnology
totheirmainmarketofoperationsonascaleranglngh’OmVerylowthroughtoveryhigh.Figure8
Showstheresultsclassi丘edbythem句Orindustrialgroups3 Fromthetable,WeCanSeethatthe
machinery−relatedmanufacturlngindustriesintroduce new technology morefrequently than the
Otherindustries.
3Industrialclassifications
ConstruCtion:Construction
Consumptl0n−relatedmanufactunngindustries:Food,teXtiles
Materia1−relatedmanufhctunngindustries‥ChemicalS,Pharmaceuticals,PalntS,OtherchemicalS,PetrOleum,rubber,
glass,miscellaneousceramics,generalsteel,nOn−fbrrousmetalS,electricwire
Machinery−relatedmanufhcturlngindustries:Industrialmachinery,Othermachinery,heavyelectricequlpment,
COmmunicationsequlPment,domesticelectricalappliancesandcomponentparts,meterlnglnStrumentS,Otherelectrical
equlPment,Ship−building,mOtOrVehicles,preCisionmachinery
Othermanufactunngindustries:Othermanufactunngindustries
Communicationsandpublicutilities‥Broadcastlngandcommunications,electricpower,gaS
−9−
Figure8FrequencyofNewTechnoIogylQ.10]
1.6% 3.2%18.3%
32.5%
23.0% 9.5% 5.6% 6.3%
0verall
Average
N=126 4.31
50.0% 50.0%
Construction
Consumption−related
N=4 3.50
12.5% 37.5% 25.0% 25.0%
manu触turingindustries
N=8 3.50
2.2% 23.9% 37.0%
MaleriaトreIated
21.7% 4.3% 2.2% 8.7%
N=46 4.10
manufもcturinginduslries
3.6% 10.7% 30.4%
16.1% 8.9% 3.6%
Machinery・related
N=56 4・70
manufacturingindustries
33.3% 33.3%
Othermamu伽turing
N=3 5.(カ
industries
11.1% 11.1% 11.1% 22.2% 11.1% 11.1% 22.2%
Communicationsand
N=9 3.71
publiculilities
篭1・Ⅶ車ow 巨ヨ2 国3 □4Mdiuu n5
日6・■7V町痺 □8Unck訂
1−7NeedforchangeinProductLine
Weaskedthecompaniestoindicatewhethertheyfbelthereisaneedfbrachangeintheir
PrOductlineonascalerangingfromverylowthroughtoveryhigh(Figure9).Abouthalfofthe
COmPaniesfbelthatthereisarelativelyhighneedfbrachangeintheirproductline.
Figure9Needn)rChangeinProductLinelQ.11]
2.4%9.5%7.9% 28.6% 27.0% 17.5% 3.2%4.0%
Average
0verall
N=126 4.39
lロlVのylow E∃2 国3 [ヨ4Mdium E]5・
田6 ■7Ⅵ町叫か □8仙clear
ー10−
2.GrowingAwarenessoftheNeedfbrStrategicR&DManagementSystems
2・l SeparateDivisionsfbrR&DStrategyPlannlng
Tocon丘rm thatthereis agrowlngaWareneSSamOngJapanese companies ofthe needfbr
StrategicR&Dmanagementsystems,WeaSkedthesurveyedcompaniestoindicatewhetherthey
haveaseparatedivisionspeCiallyresponsiblefbrR&Dstrategy・Leokingupontheexistenceor
non−eXistence of such a division as oneindication ofhow awarethe companylS about the
importanceofHstrategyHandtheextenttowhichithasintroducedHstrateglCmanagement”,We
usedthisclassificationinouranalysisofresponsestosubsequentquestionsinthissection.Figure
lOshowsthenumberofcompaniesthathaveandthenumberthatdonothaveaseparatedivision
forR&Dstrategyplanning.Ofthe126companiesthatresponded,82(65・1%)havesuchadivision,
While42(33.3%)do not.Figurell shows the sections to which these divisions belong;the
division comes underthe ofnce ofthe presidentin49companies(59・8%),underthe business
headquartersin18companies(22.0%),andundertheresearchlaboratoryin8companies(9・8%).
Wewereunableto丘ndacorrelationt光tWeentheexistenceofaseparatedivisionfbrR&Dstrategy
PlanningononehandandthelevelofR&Dspendingandthetypeofindustryontheother(Figures
l2and13).
Asseenintheresponses,490fthe126companieshaveadivisionspeCiallyresponsiblefbr
R&Dstrategyunderthedirectcontrolofthepresident・Thesecompanies,Webelieve,arefully
awareoftheimportanceof“strategy”and“strateglCmanagement”.Wecansaythattheother26
COmpamieswith the division arealso conscious ofthe need fbr a strategicR&D management
SyStem,andaretacklingwiththeinternalandexternalR&Denvironmentinacoordinatedway.
FigurelO ExistenceofaSeparateDivisionfbrR&DStrategyPlanning[Q.5]
−11−
Figurell SectiontoWhiehtheSeparateDivisionBeIongslQ.5]
Figure12ExistenceofSeparateDivisionn)rR&DStrategyPlanning[Q.5]
(ClassifiedbylevelofR&Dspending)
65% 33% 2%
0veraI題
N=126
67% 33%
・・10billionyen
N=12
53% 47%
N=30
一一15billionyen
・−20billiollyen
N=19
65% 35%
・−3ebillionyeIl
N=26
72% 22% 6%
N=18
…50billionyen
75% 25%
Hl00billionyen
N=8
67% 33%
N=3
一一200hi11ionyen
78% 22%
morelhan200billiohyen
N=9
AHave ロmnothave [⊃Unclear
ー12一
Figure13ExistenceofSeparateDivisionsfbrR&DStrategyPIaning[Q・5]
(Classinedbyindustry)
65% 33% 2%
0verall
N=126
Construction
N=4
Consumption−related
manufacturingindustries
N=8
61% 35% 4%
Maleriaトrelaled
N=46
manufacturingindustries
63% 38%
Machinery−related
N=5(l
manufaeturingindustries
Othermanufacturing
industries
N=3
89% 11%
Communications
N=9
andpublicutilities
セ票票霊− E瑠慧霊禁 □U血
2・2PositionwithinCompanyoftheR&DDivisionHead(COmparingl981and1991)
Consideringthe fhctthatthesedays seniormanagementinmanufacturingcompanies place
greaterimportanceonR&Dthaninthepast,WeaSkedcompaniestoindicatethepositionoftheir
R&Ddivisionheadin1991andin1981inanefforttogalnaStatisticalverincationofthistrend,
andalsotocon丘rmthattherelativeinfluenceoftheR&Ddivisionwithinseniormanagementhas
infactincreasedoverthisten−yearPeriod(Figure14).
−13−
Figure14PositionoftheR&DDivisionHead[Q.13]
(1)PositionoftheR&DDivisionHead−1981
1.6%7.1%19.0% 34.9%
0verall
Companieswith
21.4% 14.3%1.6%
1・2%8・5%18.3% 36.6% 23.2% 12.2%
Separatedivision
Companieswithout
SeparatediYision
(2)PositionoftheR&DDivisionHead−1991
4.0%15.9% 22,2%
31.7% 15.9% 8.7%1.6%
Companieswith
Separatedivision
7,1% 19.0% 9.5% 33.3% 19.0% 11.9%
Companieswithout
Separatedivision
田1・Pmsident 圏2・Vi叩Sldent 団3孟霊代 q4豊悪ng
田5・DlreCtOr Eヨ6・GeneralManager □Unclear
For the question,Welisted six positionsin descending rank order,and compared each
COmpany’sR&Ddivisionhead’spositionin1981andin1991・Figure15showstheperCentageOf
COmPaniesinwhichthepositionwithincompanyoftheR&Ddivisionheadwasupgraded,WaS
downgradedandremainedthesamebetweenthosetenyears.
From the hgure we can see that,al1inal1,the position ofR&D division head has txBen
upgradedinthetenyearsbetween1981and1991・
Thisupgradingofthepositioncangenerallybeattributedto:
(a)anincreaseintherelativeinfluenceoftheR&Ddivisionwithinsemiormanagement,
(b)astrengtheningofthecompany’sbroadstrategicresponsetoR&D,and
(C)astrengtheningoftheverticalchainofcommandwithintheR&Ddivision.
−14−
Figure15ChangeinthePositionoftheR&DDivisionHead[Q・13]
(Comparisonbetweenl981and1991)
43.5% 42.7% 13.7%
▼
1
ン
′
・
1
0verall
41.5% 47.6% 11.0%
CompanieSWithSeparate
division
47.6% 33.3% 19.α‰
Companieswithout
… .F .
一
一
.
Separatedivision
雛
鳥
‡鷺
∴
Jミ
ー′
.
1.
・′
、・
・ − ‥ ・ 一 一
. ・ ・ ・・
八・
・
・ 一
一
二… 一 ・
一 一二 一
・
∴・
−
r・
・
mpositimupgraded [⊃慧On陀rrnlnedhe田posltlCndowngraded
Adiffbrenttrendwas seenbetweencompanies withaseparate divisionforR&D strategy
Plannlngandthosewithout.The丘gureshowsthattheperCentageOfcompamiesthatupgradedor
downgraded the position waslower an10ng the companies with a separate division fbr R&D
StrategyPlannlngthanamongthecompanieswithout,WhiletheperCentageOfcompaniesinwhich
thepositionremainedthesamewashigheramongthosewiththespeCialdivisionthanamongthose
Without・Itcanbeseenthat缶・Omtheearlystages,Seniormanagementatcompanieswithdivisions
SpeCiallyresponsiblefbrR&DstrategyhaverecogmizedtheimportanceofR&D,andhavebeen
pursulngmeaSureStOenhancetheiroverallR&Dstrategy・
Wecanalso seethat amongthe companies withoutanR&D strategy division,thosethat
upgradedthepositionwithincompanyoftheR&DdivisionheadconstitutedthelargeStperCentage,
indicatlngthathere,tOO,SteadyprogresshasbeenmadeinthetacklingofR&Doverthisten−year
I握のod.
2・3ImprovingtheEfriciencyofR&DActivities
Unti1veryrecently,OreVenStilltoday,tOSeniormanagement,R&Dhasbeenaveritableblack
boxwhoseoutputrelativetothemanagementresourcesinvestedisimpossibletogauge.
Asthe environment surrounding R&D grows more severe and uncertaintyrises,business
managersarebecomlngmOreCOnVincedthatR&Disabafflingdeviceofobscureinternalworkings,
butatthesametime,theyhaveastrongdesiretosomehowraisetheefnciencyofthatdevice・All
COmPaniesinthesurveyreSPOndedthattheyftelthereisaneedtoimprovetheefficiencyofR&D
(Figure16).
−15−
Figure16NeedtoImproveR&DEmeiencylQ.12]
Weaskedthecompaniestoindicatethemeasureormeasurestheybelieveshouldbetakento
raisetheefnciencyofR&Dfromthoselistedinthequestion.Theywereabletochoosemorethan
OnemeaSurefromthelist,andinthesecases,theywereaskedtolistthemeasuresinpnorltyOrder.
Them呵OntyOfcompaniesgavethehighestpnorltytO“limltlngreSearCh伝eldsinwhichresources
Willbeinvested”(Figure17).
Figure17MeasurestoImproveR&DEfTiciencylQ.12]
19.0% 20.6% 55.6% 0.8%0.8%3.2%
ミl S
0verall
l
く‘
え
・
一
、
N=126
、
こ
こ
、・
19.5% 19.5(‰ 56.1% 1.2% 3.7%
Companieswith
.
‘
手
ノ
Separatedivision
19.0% 23.8% 52.4% 2.4%2.4%
Companies
Withoutseparate
division
・
ド
ジ
‘
.
r・
田:STgteClm01ogy[]Limitingresearchnelds
因怨霊慧Sfq E]otbrmeasures []U血
−16−
Thisresultreflectstoday,sharshbusinessenvironmentinwhichcompaniesaJTebeingpressedto
increasefundsforR&DoperationsandextendtheperiodforeachR&Dtheme・Thefactthatmany
listed=facilitatlngthetechnologytransferfromresearchthroughdevelopmenttoproduction”as
theirsecondpriontywasinitiallyasurpnslngreSPOnSefromJapanesecompanies,Whicharesaidto
haveadetailedknowledgeaboutpushingmanufacturedproductsontothemarketinashortperiod
atlowcost,butconsideringthatJapanesecompanieshaveonlyrecentlybeguntoseriouslytackle
researchonafullscale,thisresponsecanbeprobablybeseenasaresultoftheirfbcuslngOnthe
SmOOthflowoftechnologyfromtheresearchstagetothevariousotherstages・
ComparedtocompanieswithoutaseparatedivisionforR&Dstrategyplannlng,COmPanies
with such a division recorded alowerperCentage OfI℃SPOnSeS glVlng highest pnorlty tO
=facilitatlngteChnologytransftrHbutahigherperCentageOfresponsesglVlnghighestpnontyto
“limltlngreSearCh丘elds”.
2・4EvaluatingR&DfromtheViewpointofInvestmentE恥ctiveness
Fromthesurvey,ltSeemSthatcompanymanagersrealizetheyarenotabletomanagetheR&D
divisioninthesamewayastheymanagetheotherdivisions・Asmentionedearlier,managerSare
notabletofbrecasttheeffectivenessofR&Dinvestment,SOtOthemtheR&Ddivisionisablack
box・SomemanagersassertthatitiswrongtoexpeCtefficiencyinR&D,andthateffbctively
managedR&Disthekey(i.e.,COmPaniesshouldtackleresearchhtomalong胃termViewpointwhile
SeekingtoignltethecreativltyOfindividualresearchers,ratherthanfbcusonshort−termreVenue
andexpenditure).Certainly,thereisnoargumentthatthisshouldbetheunderlyingtoneinthe
management ofR&D.Even though managers realize that they have torun theirR&D effbrt
effbctively,theyalsowanttOSOmehowraisethecostefficiencyoftheirR&D.Figure18showsthe
COmpanies’responses to the question on evaluatlng theinvestment efficiency of their R&D
OPerations・Overall,23companies(18.3%)responded”itisimpossible to evaluateinvestment
efhciency”,86companies(68・3%)responded“currentlyexaminingtheintroductionofaefftctive
evaluationmethod”,and14companies(11.1%)responded“alreadyhaveaneffbctiveevaluation
SyStCm”.
Amongthecompaniesthatresponded“itisimpossibletoevaluateinvestmentefnciency”,We
believetherearesomethatby”impossible”mean“theuseobtained丘.omtheevaluationwouldnot
beworththetimeandeffortspentincarrylngitout”.Thismayalsobeinthebackofthemindsof
SOme
Ofthe
companies
that
responded“currently
examlnlng
theintroduction
ofan
efftctive
evaluationmethod”and“alreadyhaveaneffbctiveevaluationsystem”,butitgoeswithoutsaylng
thattheaccumulationofquantifiableo旬ectivedataisthe丘rststeptointroducingastrategicR&D
managementSyStem.Inthis sense,We Can Say that80%ofallcompanies thatrespondedare
evaluatlngOreXamlnlngWaySOfevaluatlngtheefnciencyofR&Dinvestmentwitharealizationof
theimportanceofstrategicR&DmanagementSyStemS.
Wealsoobservedaslightdifferenceintheresponsetrendsbetweencompaniesthathaveand
thosethatdonothaveaseparatedivisionforR&Dstrategyplanning(Figure18).
ー17一
Figure18EvaluatingInvestmentE恥ctivenessofR&D[Q.9]
18・3% 68.3% 11.1%2.4%
0verall
■l
N=126
12.2%1.2%
17.1% 69.5%
Companieswith
弊 骨 詳
叛淳’
▼
1
Separatedivision
N=82
芋亙ー
薄板苅
21.4% 69.0% 9.5%
Companies
.′
1
ノ
Withoutseparate
division
葦苫 ;
ComparedtocompanieswithoutaseparatedivisionfbrR&Dstrategyplannlng,COmPamies
Withsuch
a
division
efnciency”responses
recorded
but
a
higherperCentage
alowerperCentage
Of“itisimpossible
Of“already
reSpOnSeS・
ー18−
have
an
to
effbctive
evaluateinvestment
evaluation
system”
2・5InfluenceofDivisionsonMattersAfrbctingthePerhrmanceoftheOverallCompany
ToascertainthelevelofinfluencethatR&Ddivisionshaveonseniormanagement,WeaSked
thecompaniestoindicatetherelativedegreeofinnuenceeachdivisionhasonmattersthataffbct
theperformanCeOfthecompanyonascalefromonetonve(1−“littleornoinfluence”;2−“SOme
influence”;3−“COnSiderableinfluence”;4−“greatdealofinnuence”;5−“eXtremelyhighdegreeof
innuence”).
Figure19showsthedegreeofinnuenceel勺Oyedbyeachofthedivisionsonmattersafftcting
the overall perfbrmanCe Of the company as an average of the responSe scale values
((1xa+2xb+3xc寸4xd+5xe)/(a+b+C+d+e):numbersrepresentresponseValues,lettersa−erePreSent
numberofcompanies).Inthengure,thehighertheaveragevalue,thegreatertheinfluence.As
Canbeseen,thesalesandmarketingdivisionhasthegreatestinnuencewithanaveragevalueof
4・18,followedbythemanufactunngdivisionwith3・67,theR&Ddivisionwith3.61,thepresident’s
Ofnceandplannlngdivisionwith3・59,thennanceandaccountlngdivisionwith3.32,thesupplies
and purchasing division with2.69,andthe generalaffairs,perSOnnel,andlabor management
divisionswith2.62.
Figure19InnuenceofEachDivisiononMattersthatA恥ctOverallCompanyPerfbrmance
[0.16]
R&Ddivision
軋m触S血ow中山e軸Ire胱theaver喝eVdueso蝕eresponses(N=124)
fromthefollowlngSCale
1 2
LittIeorno Someinnuence
innuence
3
Considerable
inrluence
−19−
4
Gltatdealer
innuence
5
Extreme】yhigh
degl℃eOf
innuemce
Asanaside,theR&Ddivision丘nishedsecondbehindthesalesandmarketingdivisioninthe
OVerallnumber ofcompanies that gave the division a5grading(extremely high degree of
innuence).
DivisionswithincompaniesthathaveaseparatedivisionfbrR&Dstrategyplannlnggenerally
tendtohavegreaterinnuencethandivisionswithincompaniesthatdonothaveaseparatedivision
fbrR&Dstrategyplanning(Figure20).Averagevaluesbrcompanieswithaseparatedivisionfor
R&DstrategyplannlngarehigherthanthosefbrcompanieswithoutaseparatedivisionfbrR&D
StrategyPlannlngbyO.19fbrtheR&Ddivision,0.17fbrthesalesandmarketingdivision,0・16for
themanufacturing division,0.22fbr the且nance and accountlng division,0.23for the general
affairs,perSOnnel,andlabormanagementdivisions,0・40fbrthepresident’sofnceandplannlng
division,andO.20forthesuppliesandpurchasingdivision・
Figure20InnuenceofEachDivisiononMattersthatA恥ctOveralICompanyPern)rmanCe
[0.16]
Salesandmarketingdivisioれ
Manufacturingdivision
R&D division
President▼sofficeand
planningdivision
Financeandaccounting
division
Suppliesandpurchasing
division
Generalaffairs,perSOnnel,and
labormanagementdivisions
1 2 3 4 5
Bythis,itappears thatcornpanieswithaseparate division fbrR&D strategyplannlng
generallyhaveagreatertendencytoabsorbinformationandoplnionsfromthevariousdivisions,
and
reflectthatinforrnation
and
those
oplnionsin
management・
−20−
the
decision一making
processes
ofsenior
3.CurrentStateofStrategicR&DManagementSystems
3・l MethodsofFormuIatingR&DBudgetPlans
TodeterminethecurrentstateofstrategicR&Dmanagementsystems,WeaSkedthecompamies
tochooseoneofthe伝velistedmethodsthatmostcloselyresembleshowtheyfbrmulatetheirR&D
budgetplan.The伝rstlistedmethod−“eaChresearchgroupcalculatesitsownbudgetrequlrementS
basedontheinitialresearchplan”−indicatestousthatbudgetfbrmulationislargelydecentralized
andthereisnostrategicmanagementsystem;thesecond−Heachresearchgroupcalculatesitsown
budgetrequlrementS,afterwhichtheresearchmanagementdivisionunifbrmlyincreasesorreduces
theamountrequestedbythegroupsbasedontheoverallbudgetframework”−indicatesthatthe
R&Dmanagementsystemlacksastrategicoutlook;thethird−“eaChresearchgroupcalculatesits
OWnbudgetrequlrementS,afterwhichtheresearchmanagementdivisionmakesslightaqjustments,
andappropriatesadditionalfundsunderaseparateframeworkfbrresearchregardedasimportant”−
indicatesthattheR&DmanagementsystemhasastrateglCOutlooktoadegree;thefourth−“the
R&D management division evaluates needs considering a broad range of o旬ective data and
PreVious years’results,and allocates funds based on pnorities”−indicates that the R&D
management system has a strateglC Outlook;While the nfth−“the R&D management divisiorl
evaluates needs considering a broad range ofo叫ective data and previous years’results,and
alIocatesfundsbasedonprlOrities,buttheviewsofthemarketingdivisionaregreatlyrenectedin
theformulationofthebudgetplan”−indicatesthattheR&DmanagementsystemhasastrateglC
Outlook,andalsothat,COnSCiousofparallelswithU.S.andEuropeancompanies,thecompanylS
influencedconsiderablybytheviewsofthemarketingdivision.Ofthe126companiesthatgave
effbctiveresponses,Sixcompanies(4・8%)chosemethodone,28companies(22.2%)chosemethod
two,74companies(58.7%)chosemethodthree,and15compamies(11.9%)chosemethod four.
Noneofthecompanieschosemethodnve(Figure21).FromthiswecanSeethatmorethan70%of
thecompanieschosemethodsthreeandfour.Webelievethatthesecompanieshavearelatively
advancedstrategicR&DmanagementSyStem.
ー21−
Figure21MethodsofFormulatingR&DBudgetPIanslQ.37]
4.8% 22.2% 58.7% 11.9%2.4%
一 幸
十
五
∵
キ
0veraIl
・.′・′ 、 ,.′・ィ 、
’
.挽
_ .
N=126
. .. くここ.
・たこ▼、
Companieswith
SeParatedivision
%
2
/0
2
9.5%
52.4% 11.9%
Companieswithout
Separatedivision
ウ
シ、
℡Ehchresealt:hgroupcalculatesitsownbudgetrequlrementSbasedon血einitial
researchplan
Ehchresearchgroupcalculatesitsown budgetrequlrementS,aflerwhich the
research management division uniformlyincreases or reduCeS the amount
requestedbythegroupsbasedontheoverallbudget丘.amework
Eachresearchgroupcalculatesitsown budgetrequlrementS,afterwhichthe
research management division makes slight a句usments,and appropnates
additionalfundsunderaseparateframeworkforresearchregardedasimportant
TheR&Dmanagementdivisionevaluatesneedsconsideringabroadrangeof
O句ective data and previous years’TeSults,andallocatesfunds basedon
pnoddes
[]Un血
Adifftrenceintheresponseresultswasevidentbetweencompanieswithaseparatedivision
fbrR&D strategy plannlng and thosewithout.Compared to companieswithoutthe separate
divisionforR&Dstrategyplannlng,COmPanieswiththedivisionrecordedalowerperCentageOf
responsesformethodl“eachresearchgroupcalculatesitsownbudgetrequlrementSbasedonthe
initialresearchplan”andmethod2“eachresearchgroupcalculatesitsownbudgetrequlrementS,
afterwhichtheresearchmanagementdivisionuniformlyincreasesorreducestheamountrequested
bythegroupsbasedontheoverallbudgetframework”,butahigherperCentageOfresponsesbr
method3“eachresearchgroupcalculatesitsownbudgetrequlrementS,afterwhichtheresearch
managementdivisionmakesslightaqjustments,andappropnatesadditionalfundsunderaseparate
ー22−
frameworkfbrresearchregardedasimportantH・Webelievethisshowsthatintheformulationof
R&Dbudgetplans,thecompanieswithaseparatedivisionfbrR&Dstrategyplannlngfo110waset
Strategyinbudgetallocationandaqustment,andinthisregard,areWellaheadofthecompanies
WithoutthedivisioninapplyingstrateglCmanagementtOR&D・
3・2PreparationofCompanyResearchPIans
Inthisquestionweaskedthecompanieswhethertheyprepareacompanyresearchplan,What
periodtheplancovers,Whoisresponsibleforpreparationoftheplan,andwhoapprovestheplan・
Hereweassumedthatthecompanyresearchplanisimplementedbythecompanyasawholein
accordancewiththecompanyStrategyOVeralongerperiodthanthenormalresearchplan・
Ofthe126companiesthat gave ef缶ctive responses,102(81・0%)indicated thatthey do
PrePareCOmPanyreSearChplans,While19companies(15.1%)indicatedthattheydonot(Figure
22).
Figure22CompanyResearchPlanlQ.6]
81.0% 15.1%4.0%
84.1% 12.2%3.7%
Companies前th
N=82
Separatedivision
l
76.2% 21.4% 2.4%
∴
Companieswithout
Separatedivision
N=42
AscanbeseeninFigure23,OfthelO2companiesthatprepareaplan,thehighestnumber,50
(49・0%),rePliedthattheirplanscovernveyears,41companies(40.2%)repliedthreeyearS,andten
COmpanies(9・8%)repliedtenyears.
Asforresponsibilityforplanpreparation,33companies(32.4%)replied“headoftheresearch
managementdivision”,Whilethesamenumberreplied“researchmanagementdirector”(Figure24).
ー23−
Figure23PeriodofCompanyResearchPlanlQ.6]
40.2% 49.0% 9.8%1.0%
0verall
■■■≡≡三雲
N=102
40.6% 49.3% 10.1%
Companies前th
Separatedivision
40.6% 50.0% 9.4%
Companieswithout
Separatedivision
■こ、∴tl、、、∴ハ∴、・パ、1〕、ド∴…ド、− し\
Figure24ResponsibiIityfbrPreparationofCompanyResearchPlan[Q.6]
1.0% 27.5% 4.9% 32.4% 32.4% 2.0%
麻J 軋 蒸e
0verall
荘J 軋 極上 紅J
バ尽、
・ご
・
昔・
ご
′
く
爪
L 一
斗 .
く
ー
、
ノダ・
ノし
こ
車嵩
帝
豊
′
−
’
ン
N=102
ノ′
・
工
、
ハ
、
シ′
′
一、
、ド′
’
・
、ベガ ノ 蕪 J ーガ 、
24.6% 5.8% 33.3% 36.2%
漸
Companieswith
Separatedivision
′
‘
聾
聾
繁
梁
鸞
嘉
、
・
,
′く漁 こ1〝ジ タブ、
こ
壷′
一、
′
隷 ′、
,
ン
・
、′
㌻ ・
峯ー華 顎 謙
一嶺 さ嶺 こ
:
ー
湾
澄
一一一一一
一一一
蒔
t′
、‘.、1 ン真 一
こ
ベ
,
ヽー
撼 一㌔
賛 ソ 相
卒
器
語
語 道
転 凰 ニ
’
聖
や
嵩
糸
欒
・
為
溝
や
薔 正
高
嵩
 ̄ ̄ ̄
 ̄  ̄ ̄
燐
、
. ノ
p
1く
ノ 1く
11 ノ
・
ド ゥ さ寸 .
・′
ヽヱ
Companieswithout
Separatedivision
−24−
・
こ
ヽ
く
・
t J .′
ー
1如 .
Asfbrtheapprovingauthorityfbrthecompanyresearchplan,58companies(56.9%)replied
“responsibledirector”,and36companies(35.3%)replied“companyPreSident”(Figure25)・
Asshownin Figure22,theperCentage Of companies which repliedthat they prepare a
COmPanyreSearChplanwashigheramongcompanieswithaseparatedivisionfbrR&Dstrategy
Plannlngthanamongcompanieswithoutthedivision.
Nodiffbrencewasobservedtx:tWeenthetwogroupsofcompaniesintheperiodoftheresearch
plan(FiguTe23).
Regardingresponsibilityforplanpreparation,amOngthecompanieswithaseparatedivision
fbrR&DstrategyplannlngthehighestperCentagerePlied“researchmanagementdirector”,Whereas
the highestperCentage Ofcompanies withoutthe division repliedthelowerranking position of
“researchleader”・Anoveralltrendwhichdidappearwasthatcompanieswiththeseparatedivision
forR&Dstrategyplannlngtendedtoallocateresponsibilityforcompanyresearchplanpreparation
toahigherrankingpositioncomparedtothecompanieswithoutthedivision(Figure24).
AsshowninFigure25,theperCentageOfcompanieswhichrepliedthatthecompanypresident
approvesthecompanyresearchplanwasloweramongcompanieswithaseparatedivisionforR&D
StrategyPlannlngthanamongcompanieswithoutthedivision.
Figure25ApprovingAuthorityfbrCompanyResearChPlanlQ.6]
35.3% 56.9% 2.0%5.9%
0verall
N=102
33.3% 59.4% 1.4%5.8%
Companieswith
Separatedivision
37.5%
Companieswithout
Separatedivision
53.1% 3.1%6.3%
超纏宅巨三三二頂
−25−
Insummary,ahigherperCentageOfcompanieswithaseparatedivisionfbrR&Dstrategy
PlannlngprePareCOmPanyreSearChplansthancompanieswithoutthedivision,COmpanieswiththe
divisiontendtoallocateresponsibilityfbrprepanngtheplantoahigherpositioninviewofits
Slgni丘canceandimportance,andreflectingashifttowardsthedelegationofauthority,ahigher
perCentageOfcompaniesrepliedthattheapprovingauth0rityis“responsibledirector”thanreplied
“companypresident”.
3・3FormulationofCompanyResearchStrategy
InthisquestionweaskedthecompanieswhethertheybrmulatecomparlyreSearChstrategy,
Whatperiod the strategy covers,Whois responsible for formulation ofthe strategy,and who
approvesthestrategy.
Ofthe126companies that gave efftctive responses,95(75・4%)indicated thatthey do
formulateacompany research strategy,While23companies(18.3%)indicatedthat theydo not
(Figure26).
Figure26FormulationofCompanyResearchStrategy[Q・7]
75.4% 18.3% 6.3%
Companieswith
Separatedivision
Companieswithout
Separatedivision
Ofthe95companies that fbrmulate company research strategy,the highest number,41
(43.2%),rePliedthattheirstrategyperiodis伝veyears,and33companies(34・7%)repliedtenyears
(Figure27).
Asfor responsibility fbr strategy fbrmulation,51companies(53・7%)replied“research
managementdirector”,and31companies(32・6%)replied“headoftheresearchmanagement
division”(Figure28)・
ー26−
Figure27PeriodofCompanyResearchStrategylQ.7]
18.9% 43.2% 34.7% 1.1%2.1%
0verall
21.9% 35.6% 39,7% 1.4%1.4%
Companieswith
SeParatedivision
9.5% 71.4% 19.0%
Companieswithout
SeParatedivision
B3ye椚 Eヨ5yem □10ye椚 田15ye椚OrmO柁□Uncled
Figure28ResponsibiIityn)rFormulationofCompanyResearChStrategy[Q.7]
6.3(施3.2% 32.6% 53.7% 2.1%2.1%
0verall
.ヽ
バ
・ヽ
こ,X
・ノー
5.5%2.7% 34.2% 54.8% 2.7%
Companieswith
Separatedivision
.
・ト
ドジ
9.5%4.8% 28.6% 52.4% 4.8%
Companieswithout
Separatedivision
田Re紀肌h肋 国慧荒。t。踊∝r日豊霊霊S.。。
u慧宗nt。u鵬,Pcompanypresldent □UncleN
−27−
Asfbrtheapprovingauthorityforcompanyresearchstrategy,52companies(54・7%)replied
“companypresidentH,and39companies(41・1%)repliedHresearchmanagementdirectorH(Figure
29).
Figure29ApprovingAuthorityfbrCompanyResearchStrategylQ.7]
54.7% 41.1% 1.1%2.1%1.1%
0verall
54.8(払 42.5% 2.7%
Companieswith
Separatedivision
52.4% 38.1% 4.8%4.8%
Companieswithout
Separatedivision
圏companyp陀Sldent E]Res。。nSlbled聡。。,Eコoherd駅d。r
田慧霊霊sl。。□U血
Thepercentageofcompanieswhichrepliedthattheyformulatecompanyresearchstrategywas
Slgni且cantlyhigheramongcompanieswithaseparatedivisionforR&Dstrategyplannlngthan
amongcompanieswithoutthedivision(Figure26).
Aconsiderabledifferencewasobservedbetweenthetwogroupsofcompaniesintheperiod
COVeredbytheresearchstrategy(Figure27)・CompanieswithaseparatedivisionfbrR&Dstrategy
Plannlng Were fairlyevenly spread amongHthree yearsH,日伝ve yearsH and Hten yearsHin their
responses,Whereas morethan70%ofcompanieswithout the division responded‖nve yearsH・
Even though companies with a separate division fbr R&D strategy plannlng fbrmulate
COmPrehensiveresearchstrategleSthatbroadlycovertheshort,medium−andlong−term,theywere
limitedtoone response onlylnthisquestion,SO this,Webelieve,PrObablyexplains whytheir
responseswereasevenlyspreadastheywere.AnotherreasoncouldbethediffbrenceintheR&D
periodaccordingtoindustrytype,fbrthereweremanymorecompanieswiththedivision(72)than
Withoutthedivision(21)andtheycoveredamuchbroaderrangeofindustries.Moreover,PrOduct
lifb−CyClesvarydependingontheindustry,andthisispossiblyreflectedintheperiodcoveredby
theresearchstrategy・Althoughtheresponseswerefairlyevenlyspread,mOrethan40%ofthe
COmpanieswithaseparatedivisionfbrR&DstrategyplannlngrePliedthattheirresearchstrategy
COVerStenyearSOrmOre,andconsideringthefactthatthehighestperCentageOfcompanies(50%)
repliedthattheircompanyresearchplanscoverafiveTyearperiod,WeCanSaythatcompanieswith
一28−
thedivisionhaveamorecorrectunderstandingofthemeanlngOfthetermsHstrategyMandHplanH
asde丘nedinthissurvey.
Therewerenodiffbrencesbetweenthetwogroupsofcompaniesintheirresponsesonthe
perSOnreSPOnSiblefbrformulatingcompanyresearchstrategy・however,bothofthetwocompanies
thatreplied”companypresident”haveaseparatedivisionfbrR&Dstrategyplanning(Figure28)・
Therewerealsonodiffbrencesbetweenthetwogroupsofcompaniesintheirresponsesonthe
perSOnreSPOnSibleforapprovingcompanyresearchstrategy(Figure29)・
3・4ConsiderationsintheFormulationofR&DStrategy
WeaskedthecompaniestoindicatetherelativeweighttheyglVeCertainitemsinformulating
R&Dstrategyonascalefromoneto伝ve(1−“Veryimportant”;2−“important”;3−“CannOtSay
eitherway”;4−“nOtVeryimportant”;5−“nOtimportant”)(Figure30)・
TheitemtowhichcompaniesattachgreatestimportanceintheformulationofR&DstrategylS
=importanceofthetechnologyfbrthecompany,SfutureHwithanaverageresponsevalueofl・45,
fbllowedby“marketneeds”withl.56,and“capabilityoftheR&Ddivision”withl・63・
Theitemtowhichleastimportanceisattachedis=trendsinnationalandinternationalprq)eCtS”
Withanaverageresponsevalueof2・67,fbllowedbyHexistenceoflimitationsinthetechnology”
With2.63,and“resourcesspendingrelativetothatofthecompetltOrS”with2・63・
ThereisnoquestionaboutthetopthreeitemsintermSOfimportance・Itwouldalsoseemto
Standtoreasonthatthesecondleastimportantitem,Hexistenceoflimitationsinthetechnology”,
Should be given such alow grading,COnSidering the fact that technologicallimitations are
incidentaltoR&D.Thepositionofthethirdleastimportantitem,“reSOurCeSSPendingrelativeto
thatofthecompetltOrS”,WaSuneXPeCted.Wecansurmisethatitisdifnculttoobtaininfbrmation
aboutthecompetitors,but,eSSentially,WeWOuldhavethoughtthatthisconsiderationisvitaltoa
COmPany’sR&Dstrategyfbrmulation.
Overall,COmPanies with a separate division fbr R&D strategy plannlng attaChed greater
importancethanthecompanieswithoutthedivisiontoallitems(theaveragevalueofthediffbrence
OfaveragevaluesisO.20;Figure31).ComparedtocompanieswithoutaseparatedivisionforR&D
StrategyPlannlng,COmPanies
withsuch
adivision
attachedmuch
greaterimportance
on”costs
requiredtoachieveabreakthrough”(difftrenceofaveragevalues=0.40),“trendsinnationaland
intemationalprqjects”(0.33),and“productcostcompetitiveness”(0.33).Thetopthreechoicesfbr
bothgroupsofcompanies(thosewithaseparate divisionfbrR&Dstrategyplanningandthose
Without)were
the
same
as
the
overallresult:“importance
ofthe
technology
future”,followedby“marketneeds”and“capabilityoftheR&Ddivision”.
ー29−
fbrthe
company’S
Figure30ConsiderationsintheFormulationofR&DStrategy[Q.19]
58% 女)偽 2%1%
ImportallCeOrthe
Average
N=124 1.45
technology
48% 48%
4%−.
Marketneeds
N=124 1.56
J1
47%
CapabilityortheR&D
divisioll
46%
4%3偽l
ⅢnⅢⅢⅢⅢⅢは旺巾表6醸
園直ココ
34% 51%
.12% 3%l
Productcost
N=126 1.63
N=125 1.85
COmpetitiveness
27% 疎)% 13% 1%
Socialresponsibilily
N=124 1.88
68%
22%
Tretldsorcompetitors
10%1%
紅==二日N=1乃 欄
23% 65%
ノ 9% 4%l
N=124 1.%
Costandperiodrequired
′ 18% 13%−
Researchers,enthusiasm
N=124 1.98
13% 67% 15% 5%
N=125 2,12
Productiontechnology
14% 63%
18啄 3%.2%
Possibilityof’achieving
N=125 2.16
abreakthrough
19% ′伊あり
Positioninindustrial
N=124 2.18
l
Circles
13% 55%
遜% 3%1解
Product)ine
N=124 2.24
2% 一 ′ 50%  ̄ 34% 一1つ% 1偽
Costsrequiredtoachieve
abreakthrough
N=125 2.咲)
38% 10% 3触
5%、 44%
Resourcesspendingrelative
N=125 2.63
10thatorthecompetitors
4%. ㊥% 嶋% 10%岬
Limitationsinthe
lechnoIogy
N=125 乙63
43% ノ13%11%
4%1 39%
Trendsirlnalionaland
internationalprqiects
一30−
Figure31ConsiderationsintheFormulationofR&DStrategylQ.19]
(ClassifiedbyExistenceofseparateDivisionfbrR&DStrategyPlaning)
Aver喝e
65% 32% 1%1%
l.38
Importanceorthe
1.60
technology
1.54
Marketneeds
1.62
1.57
Capabilityofthe
R&D diYision
1.74
1.74
Productcost
2.07
COmpetilivene鵬
1.81
Socialresponsibilily
2.02
1.87
Trendsorcompeti10rS
1.93
1.85
Costand陣riodrequired
2.12
1.93
Researchers,enthusiasm
2.07
2.09
ProductionIechno10gy
2.19
Possibilityorachievinga
2.09
breakthrough
2.31
PositioninindusIrial
2.17
CirCles
2.21
2.19
2.36
7% 52%
38% 2%
Costsrequiredtoachieve
2.46
abreakthrough
2、86
Resourcess匹ndingrelatiYe
tothatorthecompetitors
2.55
2.81
Limilationsinthe
technology
Trendsinnationaland
2.56
2.79
2% 31%
55% 10% 2%
6% 41% 39% 1I%
2.55
internationalpr可ects
2.88
−3ト
FromthiswecanseethatcompanieswithaseparatedivisionforR&Dstrategyplannlngare
morecloselyexaminlngthevariouselementsthatmakeuptheinternalandexternalenvironment
WhenfbrmulatingthecompanyR&Dstrategythanarethecompanieswithoutthedivision・
3L5ReviewofR&DStrategyinResponsetoChangesintheR&DEnvironment
ToascertaintheextenttowhichstrategicR&Dmanagementsystemsareinplace,WeaSked
thecompaniestoindicatewhichdivision(Orindividualasthecasemaybe)reviewsR&Dstrategy
duringitsimplementationin response to changesin the R&D environment(trendsin other
COmPanies,marketscale,riseofaltemativetechno10gies).
Ofthe126companiesthatgaveefftctiveresponses,39companies(31.0%)choseresponse
number4,“the research management division and marketing division review R&D strategy
together”,28companies(22.2%)choseresponsenumber3,“theresearchmanagementdivision
givesappropriateinstruCtions”,19companies(15.1%)choseresponsenumber5,“reViewcarried
Outunderinstructions ofseniormanagement”,Whileonly one company(0.8%)chose response
numberl,“reSearCher reviews at hisnler OWn discretion”,and14companies(11.1%)chose
responsenumber2,“reSearChgroupleaderreviewsathisherowndiscretion”(Figure32)・
Figure32Responsibilityn)rReviewofR&DStrategylQ.30]
0.8% 11.1% 22.2% 31.0% 15.1% 14.3% 5.6%
25.6% 35.4% 15.9% 9.8% 4.9%
Companieswith
Separatedivision
Companieswithout
Separatedivision
1.h血vidudre鑑肺転
2.Rc駁げChgrouplc血
3,Research
manag田lent
dvision
日5・票霊霊忠霊卵 臼6伽S □U血
ー32−
4.RGe訂Chmanagcmcnt心vision訂d
matketingdivisionreviewR&D
S打叙e訂tOgC血er
Forthisquestionweassumedthatresponsenumber3indicatesthatthecompanyisdealing
withchangesintheR&Denvironmentsystematicallytoadegree,reSPOnSenumber4indicatesthat
the companyis dealing withchanges systematica11yand strategically,andresponse number5
indicatesthatseniormanagementdecidesuponthereviewofR&Dstrategybasedonsystematic
datacollectionandanalysis(thecompaniessurveyedwereallrelativelylarge,SOWethinkitwould
beimpossible fbr senior management to grasp and make anindependent judgment onall
OutStandingissues).Theresultsshowthatalmost70%ofcompaniesaredealingwithchangesin
theR&Denvironmentsystematicallyandstrategicallytoacertainextent.
AmuchgreaterperCentageOfcompanieswithaseparatedivisionfbrR&Dstrategyplannlng
replied“the
research
management
division
glVeS
aPPrOPrlateinstructions’’and“theI℃SearCh
management division and marketing division review R&D strategy together”compared to the
COmPanieswithoutaseparatedivisionforR&Dstrategyplannlng,indicatlngagreatertendencyto
dealwithchangessystematicallyandstrategically.
3・6ResearchConsortia
hthissectionweaskedthecompaniesaboutresearchconsortia.Consortiainthiscontext
refbrsonlytopnvate−SeCtOrCOnSOrtia,andexcludesgovernment−initiatedconsortiaorconsortia
establishedwithpublicfunding・Weaskedthecompanieswhethertheyfbelresearchconsortiaare
necessary,Whethertheyhaveparticipatedinaresearch consortium,andifso,in atypicalcase,
WhatmotivatedthemtoparticIPate,WhatthenationalitiesoftheotherparticlpatlngCOmPanieswere,
andwhethertheconsortiumwassuccessfulornot.
(1)NecessityorConsortia
Of the126companies which responded,83(65.9%)fbel that research consortia were
necessary,While39compamies(31・0%)donotfbelthattheyarenecessary(Figure33).
Figure33NecessityofConsortia[Q.14]
(ClassinedbyExistenceofSeparateDivisionfbrR&DStrategyPlaning)
65.グ‰ 31.α‰ 3.2%
74.4% 23.2% 2.4%
Companieswith
亮字.‥+
Separatedivision
50.0% 47.6% 2.4%
Companieswithout
SeparatediYision
■− ‥._二
ー33−
Forrefbrence,Figure34showsabreakdownofthesefiguresbythescaleofR&Dexpenditure,
andFigure35showsabreakdownbyindustrytype・
AsshowninFigure33,amuChhigherperCentageOfcompanieswithaseparatedivisionR)r
R&DstrategyplanningrepliedthattheyfbelresearchconsortiaareneCeSSary(74.4%,Or61
COmPanies)comparedtocompanieswithoutthedivision(50・0%,Or21companies).
Figure34NecessityofConsortialQ.14]
(ClassifiedbyScaleofR&DExpenditure)
66% 31%
3%
ロ回田狂===コ
・・10biIlionyen
・・15billionyen
68% 32%
・・20biIlionyen
閣癖櫨■錮匿
・・30biIlionyen
・・50billionyen
=100billionyen
‥200billionyen
morethan200
biIlionyen
瞳N伽S町□Notn∝eSS野口u血
−34−
Figure35NecessityofConsortia[Q・14]
(Classi丘edbyIndustryType)
66% 31% 3%
∴一二
0verall
N=126
Construction
75% 25%
Consumption−rt!lated
mamuractudng
industries
暮由江
Matedal一柁Iated
manuractuljng
industries
Machinery−related
manufacturing
industries
Othermanuf’acturing
industries
− − − − − − − − − − − − − − − −
89% 11%
Commurlicationsand
pubIicutiIities
〃\ご、J、、・・・・さ ∵\・:・こご、ご“こ÷ l
(2)ParticipationinConsortia
Overall,47・6%(60companies)repliedthattheyhaveparticipatedinaresearchconsortium,
While47・6%(60companies)repliedthat they have not(Figure36).Figure37shows a
breakdown ofthese ngures bythe scale of R&D expenditure,and Figure38shows a
breakdownbyindustrytype.
一35−
Figure36ParticipationinConsortialQ.14]
(ClassinedbyExistenceofSeparateDivisionfbrR&DStrategyPlaning)
47.6% 47.6% 4.8%
0verall
N=126
52.4% 45.1%
Companieswith
Separatedivision
38.1% 54.8%
Companieswithout
Separatedivision
Figure37ParticipationinConsortialQ・14]
(ClassifiedbyScaleofR&DExpenditure)
48% 48%
5%
0verall
N=126
25% 67%
一肩10billionyen
37% 60%
…15billionyen
58% 42%
=20billionyen
覇PEEロbl耳.._三:
58% 35%
…30billionyen
61% 39%
一一50billionyen
一一100billionyen
67% 33%
=200billionyen
44% 11%
morethan200billionyen
−36−
Figure38ParticipationinConsortialQ.14]
(Classi且edbyIndustryType)
48% 48% 5%
0verall
N=126
75% 25%
Construction
− − − − − − − − − − − − −
38% 63%
Consumption−related
manufacturingindustries
48% 48% 4%
Materialィelated
、
u シ
ーノ
manufacturingindustries
45% 48% 7%
こ
、
′
・
・
ブ
・
.
Machillery−related
manufacturingindustries
Othermanufhcturing
industries
Communicationsand
publicutilities
Haveparticipated
Havenotpamicipued□Unclear
MorethanhalfofthecompanieswithaseparatedivisionbrR&DstrategyplannlngrePlied
thattheyhavepartlCIPatedinaresearchconsortium,Whereasonlyabout40%ofcompanies
Withoutthedivisiongavethesameresponse(Figure36)・
Thefbllowingsections(3)一(5)refbrtocompanieswhichhaveparticipatedinaconsortium.
(3)MotivationtoParticipateinConsortia
WeaskedthecompaniesthathavepartlCIPatedinaconsortiumtoselectatypiCalcaseand
indicate what motivated them to participate.Overall(Of the60companies that have
Participated),61.7%(37compamies)chose“toexpandthecompany’sR&Dcapability”asthe
motivatingfactor,25%(15companies)chose“independentresearchistooexpenSive”,While
“to establish an operationalbase overseas”and“others”were chosen by only3.3%(two
COmPanies)each(Figure39)・ThusadesiretoexpandtheirownR&DcapabilitywaSthemain
factorthatmotivatedthecompaniestopartlClpateinaconsortium・
ー37−
Figure39MotivationtoParticipateinConsortia[Q.14]
61,7% 25.0% 3.3% 3.3%6.7%
0verall
N=60
正).5% 27.9% 2.3%2.3%7.0%
Companieswith
N=43
Separatedivision
62.5% 18.8% 6.3% 6.3%6.3%
Companieswithout
Separatedivision
hdependentresearch
Tbe甲md血e
ktooe卿lVe
COmpany’s R&D
Capの地y
Tbestのhshan
畢mdondbase
OVerSeaS
O血ers
TheperCentageOfcompanieswithaseparatedivisionfbrR&Dstrategyplannlngthatchose
“independentresearChistooexpenSive”(27・9%)wasalmosttenperCentagePOintshigherthan
thecorrespondingperCentage fbrcompanieswithoutthedivision(18.8%),andfromthiswe
Caninftrthatcompanieswiththedivisionareslightlymoresensitivetohighresearchcosts.
Therewasvirtuallynodiffbrencebetweenthetwocompanygroupsintheresponseratefbr“to
expandthecompany’sR&Dcapability”.
(4)NationaIitiesofParticipatingCompanies
Wethenaskedthecompaniestoindicatethenationalitiesofthecompanieswithwhichthey
participatedintheconsortium,againinatypicalcase;50・0%(31companies)repliedthatthe
COnSOrtium was amongJapanese companies,While45.2%(28companies)repliedthat the
COnSOrtiumincludedatleastoneoverseascompany(Figure40).
−38−
Figure40NationalitiesofParticipatingCompanieslQ・14]
50.0% 11.3% 4.8% 8.1%1.6%l17.7% 1.6% 4.8%
OYerdl
錮Ei._._; ̄’.置認 ̄ ̄ ̄ ̄I.j
41.卯も 11,6% 7.0% 9.3% 2.3% 23.3% 2.3% 2.3%
Companieswilh
Separatedivision
−FE.; ̄__週 ̄王___._Il
Sl.3% 12.5% 6,3%
Companieswithout
SeparatediviSion
ロコ且ロコ駈ヨ
Onetrendthatdoesstandoutinthe伝gureisthatcompanieswithaseparatedivisionfbrR&D
StrategyPlannlngtendtopartlCIPateinconsortiawithcompaniesthatcoveramuchbroader
rangeofnationalitiescomparedtocompanieswithoutthedivision・AmuchhigherperCentage
OfcompanieswithaseparatedivisionforR&DstrategyplannlnglistedEuropeancompanies
andNorthAmericanandEuropeancompaniesasthe otherpartlCIPatlngCOmPaniesinthe
COnSOrtiumcomparedtothosewithoutthedivision・Fromthiswecaninferthatthecompanies
With the divisionare aCtively tackling the construction ofa globalnetwork,Whereasthe
COmPanieswithoutthedivisionhave yetto developastronglntemationaloutlookintheir
R&D.
(5)SuccessorConsortia
We then asked the companies toindicate whether thetyPical consortium they selected
SuCCeeded or not.Overall,50.0%(30companies)replied’that the consortium succeeded,
While8.3%(丘ve companies)replied that the consortium did not succeed;41・7%(25
COmpanies)didnotreply,andwerelistedas“unclear”(Figure41)・
一39−
Companieswith
Separaledivision
31.3% 12.5% 56.3%
Companieswithout
.し
′
ー
こ
Separatedivision
TherewasadifftrencebetweentheresponsesbycompanieswithaseparatedivisionforR&D
StrategyPlannlngandtheresponsesbythosewithout・Amuchhigherpercentageofcompanies
WithaseparatedivisionfbrR&Dstrategyplanningrepliedthattheconsortiumsucceeded(24
0fthe43companies,Or55.8%)comparedtocompanieswithoutthedivision(伝veofthel6
COmpanics,Or31.3%).
Fromtheoverallresultsofthissectiononcompanies’awarenessofresearchconsortia,itcan
be seenthatcompanieswith aseparate divisionfbrR&D strategyplannlngare POSitively and
efftctivelylnCOrPOratlng the consortiumintotheir business strategy to a greater degree than
COmPanieswithoutthedivision,i.e..theyhaveastrongtendencytoapproachresearchconsortiaas
ameansofreducingtheimpactofincreaslngreSearChcosts,andtheyareactivelyconstruCtlng
globalnetworksthroughtheseresearchconsortia.
3・7TechnologyTransfbr
Hereweaskedthecompaniestoindicatewhetherseverallisteditemsare applicabletothe
PrOCeSSeSunderwhichresearchresultsflowtothedevelopmentproductionstages,OnaSCalefrom
OnetO伝ve(1−“VeryapPlicable”;2−“mOreOrlessapplicable”;3−“CannOtSayeitherway”;4−
“notveryapplicable”;5−“nOtapPlicable”)・
Forthisquestion,WeaSSumedthatitemnumberl“theresearchersteershisnlerOWnreSearCh
through
the
developmentandproduction
stages”is
atypicalexample
oftheJapanese
style
of
technology;ltemnumber2HresponsibilityfbrthetechnologylSPaSSedontoadiffbrentperSOnat
ー40−
eachstageofresearch,developmentandproduction”isatypicalexampleoftheflowatEuropean
andAmericancompanies,WhichpromotethedivisionofworkresponsibilitiesandspeCialization;
itemnumber3“theviewsofthedevelopment,marketingandsalesdivisionsarefu11yrenectedin
the
selection
ofresearchthemes
to
fhcilitate
technology
transfbrthrough
each
stage”indicates
highlystrategy−0rientedmanagement;Whileitem4“ampletimear)dcloseliaisonisnecessaryfbr
the
smoothhand−OVer
Ofthe
technology
btween
stages”indicates
the
companies’level
of
awarenessabouttheneed丘)rSuf丘cienttimeandcloseliaisonintechnologytranSftr.
Fromtheresultswecanseethatthecompanieshavegenerallyadoptedthedivisionofwork
responsibilities
style
to
agreaterdegreethan
the
style
ofitemnumberl“the
researchersteers
hisPlerOWnreSearChthroughthedevelopmentandproductionstages”,andthattheyhaveavery
highawarenessabouttheneedfbrsufncienttimeandcloseliaisonwhentechnologyishandedover
betweenstages(Figure42).
Figure42TechnoIogyTransfbrBetweenStageslQ.33]
Theresearchersteershis/herownresearch
2% 34% 33% 21% 10%
3.01
throughthedevelopmentandproduction
StageS
Responsibilityn)rthetechnologylSpaSSedon
toadi抒erentpersonateachstage
Theviewsofthedevelopment,marketingand
Avemgev血e
2.65
7%・ 39% 35% 、15%5魂
SalesdivisionsarefulIyreflectedinthe
selectionofresearchthemestofhcilitate
ジ
ー
.
Y
technologytransfbrthrougheachstage
2.71
36%、 41% 18%、、5%
AmpIetimeandcloseIiaisonisnecessaryfbr
thesmoothhand−OVerOfthetechnology
1.93
betweenstages
表1・叫叩plicable 圏2・芸完霊SS □3霊豊
田4NotveryappllCable巨ヨ5Notapplicの1e N:126
Adiffbrencein theresults was seen betweencompanieswithaseparate divisionfbrR&D
Strategyplanningandthosewithout(Figure43).
−41−
Figure43TechnoIogyTransfbrBetweenStageslQ.33]
(ClassinedbyExistenceofSeparateDivisionfbrR&DStrategyPlaning)
2% 30% 29% 27% 11%
Avemgevdue
TheresearchersIeershis/herownresearch
一
.
−ヰジ ー
throughlhedeYe10pmenlandproduCtion
Slages
3.13
2.76
2% 43% 38% 10%7%
ResponsibilitybrthetechnologylSpaSSed
OntOadi恥rentpersonateachstage
33% 10%5%
10% 43%
Theviewsofthedevelopment,marketing
’
ブ
シ
.
′
andsalesdivisionsarefu11yre鋼ectedinIhe
Selectionorresearchthemesto蝕cilitate
・
ン
.
H
J′
.
リ
、
、
2% 29% 39% 24% 5%
technologytrans飴rthrougheachsbge
Amplelimeanddoseliaisonisnecessary飴r
lhesmoothhand−0VerOrlhetechno]ogy
belweensbges
The average value ofresponses to“the researcher steers his佃er ownresearch through the
development and production stages”is3・13for companies with a separate division forR&D
StrategyPlannlngand2・76fbrcompanieswithoutthedivision,indicatlngthatthisstyletendsto
applymoretothecompanieswithoutthedivision.
Theaveragevalueofresponsesto“responsibilityfbrthetechnologylSPaSSedontoadiffbrent
perSOnateaChstage”is2・54fbrcompanieswithaseparatedivisionfbrR&Dstrategyplannlngand
2・86forcompanieswithoutthedivision,indicatlrlgthatthisstyleappliesmoretothecompanies
withthedivision.
The
average
value
of
responses
to“the
views
of
the
development,marketing
and
sales
divisions arefullyrenectedinthe selection ofresearchthemes to facilitate technologytransfbr
througheachstage”is2・57fbrcompanieswithaseparatedivisionfbrR&Dstrategyplannlngand
3・00fbr companies without the division,indicatlng that thisis much more applicable tothe
COmPanieswiththedivision.
胃42−
TheaveragevalueofresponsestoHampletimeandcloseliaisonisnecessaryforthesmooth
hand−OVerOfthetechnologybetweenstagesHisl・85fbrcompamieswithaseparatedivisionfbr
R&Dstrategyplannlngand2・15fbrcompanieswithoutthedivision,indicatingthatthistendstobe
moreapplicabletothecompanieswiththedivision・
Fromtheresults,WeCaninfbrthatthecompanieswithaseparatedivisionfbrR&Dstrategy
PlannlngarePurSulngadivisionofworkresponsibilitiesinthetechnologytranSfbrprocessandare
COnSideringwaystofhcilitatetheflow oftheresearchresultsthroughthevariousstageswhen
selectlngreSearChthemes,andalsohaveahighawarenessoftheneedtolistentoandcoordinate
theoplnionsofthedifftrentdivisions・Inthesecompanieswecanseethetendencyskillfu11yto
incorporate and blend the merits of the European and American style of dividing work
responsibilitiesandthemeritsofthetraditionalJapaneSeStyleinwhichresearchresultsmovewith
theindividual.
4.ContactBetweenR&DDivisionandOtherDivisions
4・l DegreeorContact
hthisquestion,WeaSkedthecompaniestoindicatehowoftentheR&Ddivisioncomesinto
COntaCtWiththeotherdivisions,OnaSCalefromonetonve(1−“1ittleornocontact”;2−“meetings
heldhalf−yearly”;3−“meetlngSheldmonthly”;4−“meetingsheldweekly”;5−“COntaCtOnadaily
basis”).ThroughthisquestionwesoughttoclarifytherelativedegreeofcontactbetweentheR&D
divisionand otherdivisionsin the company(Sales and marketing;manufacturing;伝nance and
accountlng;generalaffhirs,perSOnnel,andlabormanagement;PreSident’s
ofnce
and
plannlng;
SuPPliesandpurchasing).
Figure44shows the degree of contact between the R&D division and other divisions
accordingtotheaveragevaluesofresponses.Inthefigure,thehighertheaveragevalue,thegreater
thedegreeofcontactbetweenthedivisions.ThedivisionthathasthemostcontactwiththeR&D
divisionisthemanufacturlngdivisionwithanaverageresponsevalueof3.51,followedbythesales
andmarketingdivisionwith3.24,thepresident’sofnceandplannlngdivisionwith3.14,general
affhirs,perSOnnel,andlabormanagementdivisionswith2.55,the伝nanceandaccountlngdivision
With2.11,andthesuppliesandpurchasingdivisionwith2.11.
一43−
Figure44DegreeofContaetBetweenR&DDivisionandOtherDivisionslQ.17]
Sak:Sandmarketing
Suppliesandpurchasi喝
Manufhctunng
President’so疏ceandplannl喝
FiIlanCeandaccounnng
Ger紀血血S,匹rSOnnel,mdl加rmana㌍me鴎
豊霊霊悪霊器禁avemgevdueso軸e 脚24)
1 2 3 4 5
Littleorno MeeIingsheld Meetingsheld MeeIings Contactona
contact
halr−yearly
monthIy
heldweek]y
dai】ybasis
Responseresultsvarieddependingonwhetherthecompanyhasordoesnothaveaseparate
division forR&D strategy plarlnlng.According to the average values ofresponses,the R&D
divisionincompanieswithaseparatedivisionforR&Dstrategyplannlngmaintainsclosercontact
Withall other divisions except thefinance and accountlng division and the general affairs,
perSOnnel,andlabormanagementdivisions,COmparedtotheR&Ddivisionincompanieswithouta
SeParatedivisionfbrR&Dstrategyplannlng・Inparticular,theR&Ddivisionincompanieswitha
SeParatedivisionfbrR&Dstrategyplannlngmaintainsamuchclosercontactwiththepresident’s
Ofnce and plannlng division compared to the R&D divisionin companies without a separate
divisionfbrR&Dstrategyplanning(diffbrenceinaveragevaluesofO.37).Ontheotherhand,the
R&D divisionin companies without a separate division for R&D strategy plannlng tends to
maintainclosercontactwiththe丘nanceandaccountlngdivisionandespeCiallythegeneralaffairs,
perSOnnel,andlabormanagementdivisions(difftrenceinaveragevaluesofO・28),COmParedtoits
COunterPartincompanieswithaseparatedivisionfbrR&Dstrategyplanning(Figure45)・
一44−
Figure45DegreeofContactBetweenR&DDivisionandOtherDivisionslQ・17]
(ClassifiedbyExistenceofSeparateDivisionfbrR&DStrategyPlaning)
Manuhcturing
Salesandmarketing
President■somceandpIannlng
Generalafrhirs,perSOnnel,and
labormanagement
Suppliesandpurchasing
Financeandaccounting
4 5
1 2 3
4・2InnuenceofOtherDivisionsintheFormulationofR&DStrategy
Weaskedthecompaniestoindicatethedegreeofinfluenceotherdivisionshavewhenthe
COmpanyfbrmulatesR&DstrategywithrespeCttOthefourspeci丘cexamPlesof(1)establishing
researchfacilities,(2)hiring new graduates,(3)selecting research domains,and(4)preparing
researchbudgetplans,OnaSCalefromonetofive(1−“littleornoinnuence”;2−“SOmeinnuence”;
3−“COnSiderableinfluence”;4−“greatdealofinfluence”;5−“eXtremelyhighdegreeofinfluence”).
Figures46−53show the degree ofinnuence that each division has as an average ofthe
responsevalues.Inthengures,thehighertheaveragevalue,thegreatertheinfluenceheldbythe
division.
(1)EstabIishmentofResearChFacilities
Overall,the
president’s
ofnce
and
plannlng
division
has
the
mostinfluence
on the
establishmentofresearchfhcilitieswithanaverageresponsevalueof3.75,fbllowedbythe
丘nanceandaccountlngdivisionwith2.94,generalaffairs,perSOnnel,andlabormanagement
divisionswith2.62,themanufacturlngdivisionwith2.25,the salesandmarketingdivision
with2.20andthesuppliesandpurchasingdivisionwithl.55(Figure46).Ascanbeseenin
Figure47,the
president’s
ofnce
and
plannlng
一45−
division
has
the
mostinfluence
on
the
establishment ofresearCh facilities bothat companies with and at companies without a
SeParate division fbr R&D strategy plannlng,butitsinfluenceis much greater atthe
COmPanieswitha separate division fbr R&D strategy plannlng than at those withoutthe
division,withadiffbrenceinaveragevaluesofO.58,thelargestgaptxtweenthetwogroupsof
COmPanies.The nextlargest gap between the two groupsisintheinnuence of the
manufacturingdivision,WhichismuchgreateratcompanieswithaseparatedivisionfbrR&D
StrategyPlannlngthanatcompanieswithoutthedivisionbyO.40.
Figure46InfIuenceofOtherDivisionsintheFormuIationofR&DStrategy[Q・18]
(1)EstablishmentofResearchFacilities
Salesandmafketing
General血irs,perSOnnel,andl血management
NurhbersshowTinthe6gurearetheaveragevaluesoftheresponses(N=124)
fromthefollowlngSCale
1 2
Littleorno Someinnuence
inrluence
3
ConsiderabIe
influence
一46−
4
5
Gl℃atdealor
Extremelyhigh
innuence
degreeof
influence
Figure47InfluenceofOtherDivisionsintheFormuJationofR&DStrategylQ・18]
(1)EstablishmentofResearchFacilities
(Classi丘edbyExistenceofSeparateDivisionforR&DStrategyPlaning)
PresidenピsotTice
andplanmlng
Financeand
accounting
Generala恥irS,
personnel,andlabor
management
Manufacturing
Salesand
marketing
Suppliesand
PurChasimg
1 2 3 4 5
(2)HiringofNewGraduates
Overall,the general affairs,perSOnnel,andlabor management divisions have the most
influenceonthehiringofnewgraduateswithanaverageresponsevalueof4.20,fbllowedby
thepresident’sofnceandplannlngdivisionwith3.09,themanufacturingdivisionwith2.28,
the伝nanceandaccountlngdivisionwith2.13,thesalesandmarketingdivisionwith2.00and
thesuppliesandpurchasingdivisionwithl.28(Figure48)・AscanbeseeninFigure49,the
generalaffairs,perSOnnel,andlabormanagementdivisions have the mostinnuence onthe
hiringofnewgraduatesbothatcompanieswithandatcompanieswithoutaseparatedivision
−47−
fbrR&Dstrategyplannlng,buttheinnuenceismuchgreateratthecompanieswithaseparate
divisionforR&Dstrategyplannlngthanatthosewithoutthedivision,Withadifferencein
averagevaluesofO・31・Significantdiffbrencesbetweenthetwogroupsofcompaniescanalso
beseenintheinnuenceofthepresident’sof丘ceandplannlngdivisionandtheinnuenceofthe
manufactunngdivision,Whichare muchgreateratcompanieswithaseparate division fbr
R&DstrategyplannlngthanatCOmPanieswithoutthedivisionbyO.55andO.51,reSpeCtively.
Figure48InfLuenceofOtherDivisionsintheFormulationofR&DStrategylQ.18]
(2)HirirlgOfNewGraduates
Salesandmal七eting
Generalairairs,perSOnnel,andlabormanagement
NurntmshowTinthengureaJetheaveragevaluesoftheresponses(N=124)
hT)mthefollowlngSCale
1 2
Littleorno Someinrluence
inrluence
3
4
5
Considerable
Greatdealor
Extremelyhigh
inrluence
inrlucnce
deg柁eOf
inr]uence
−48−
Figure49InnuenceofOtherDivisionsintheFormulationofR&DStrategylQ・18]
(2)HiringofNewGraduates
(ClassinedbyExistenceofSeparateDivisionbrR&DStrategyPlaning)
Generalaffairs,
PerSOnnel,andlabor
management
Presidenゼsornce
andplannlng
Manufacturing
Finamceand
accounting
Salesand
marketing
Suppliesand
purchasing
1 2 3 4 5
(3)SelectionofResearChDomains
Overall,thepresident,sofnceandplannlngdivisionhasthemostinnuenceontheselectionof
researchdomainswithanaverageresponsevalueof3・18,fbllowedbythesalesandmarketing
divisionwith3.05,themanufactunngdivisionwith2.73,the伝nanceandaccountlngdivision
Withl・47,thegeneralaぬirs,perSOnnel,andlabormanagementdivisionswithl・44andthe
SuPPliesandpurchasingdivisionwith1.27(Figure50).Ascanbe seeninFigure51,the
PreSident,sofnceandplannlngdivisionhasthemostinfluenceontheselectionofresearch
domains both at companies withand at companies without a separate division fbrR&D
ー49−
Strategyplannlng,buttheinfluenceismuchgreateratthecompanieswithaseparatedivision
fbrR&Dstrategyplannlngthanatthosewithoutthedivision,withadiffbrenceinaverage
ValuesofO.27.Signincantdiffbrencesbetweenthetwogroupsofcompaniescanalsobeseen
intheinnuenceofthemanufacturlngdivisionandtheinnuenceofthesalesandmarketing
division,Whichare much greaterat companies with aseparate division fbrR&D strategy
PlannlngthanatcompanieswithoutthedivisionbyO・45andO・27,reSPeCtively・
Figure50InnuenceofOtherDivisionsintheFormuIationorR&DStrategy[Q・18]
(3)SelectionofResearchDomains
Salesandma止eting
GeneralaffmiS,perSOrnel,andlabormanagement
Nurh肺sshowTinthe6gurearetheaveragevaluesoftheresponses(N=124)
fromthefollowlngSCale
1 2
Littleorno Someinnuence
innuence
3
4
CorISiderable
Greatdealor
innuence
inrluence
−50−
5
Extreme]ybigh
deg柁eOr
influence
Figure51InnuenceofOtherDivisionsintheFormulationofR&DStrategylQ・18]
(3)SelectionofResearchDomains
(ClassifiedbyExistenceofSeparateDivisionfbrR&DStrategyPlaning)
Presidenピso什ice
andplannlng
Salesand
marketing
Malluhcturing
Financeand
aCcOunting
Generalarrairs,
personnel,and
labormanagement
Suppliesand
purchasing
1 2 3 4 5
(4)PreparationofResearchBudgetPlans
Overall,thepresident’sofnceandplannlngdivisionhasthemostinfluenceonthepreparation
Ofresearchbudgetplanswithanaverageresponsevalueof3・48,followedbythe且nanceand
accountlngdivisionwith3・44,thesalesandmarketingdivisionwith2・19,themanufacturlng
divisionwith2.11,thegeneralaffhirs,perSOnnel,andlabormanagementdivisionswithl・78
andthesuppliesandpurchasingdivisionwithl・30(Figure52)・AscanbeseeninFigure53,
the president,s ofnce andplannlng division has the mostinfluence on the preparation of
researChbudgetplansatcompanieswithaseparatedivisionfbrR&Dstrategyplannlng,While
the丘nanceandaccountlngdivisionhasthemostinnuenceatcompanieswithoutaseparate
ー51−
division br R&D strategy plannlng.Signincant diffbrences between the two groups of
COmPaniescanbeseenintheinfluenceofthepresident’sofnceandplannlngdivisionandthe
innuenceofthemanufacturlngdivision,Whicharemuchgreateratcompanieswithaseparate
divisionforR&DstrategyplannlngthanatcompanieswithoutthedivisionbyO.40andO・39,
respeCtively.
Figure52InfluenceofOtherDivisionsintheFormuIationofR&DStrategy[Q.18]
(4)PreparationofResearchBudgetPlans
Salesandmalkting
Generalaffairs,perSOnnel,andlabormanagement
Nun血.sshowTinthe丘gurearetheaveragevaluesoftheresponses(N=124)
fromthefbllowlngSCale
1 2
Littleorno Someillnuence
innuence
3
4
5
Considerahle
G陀atdealor
Extremelyhigh
innuence
inrluence
degreeor
influence
ー52−
Figure53InnuenceofOtherDivisionsintheFormulationofR&DStrategylQ・18]
(4)PreparationofResearchBudgetPlans
(ClassifiedbyExistenceofSeparateDivisionforR&DStrategyPlaning)
Presidentlsoffice
andplannlng
Financeand
accounting
Salesand
marketing
Manuracturing
Generala肋irs,
personnel,and
labormanagement
Suppliesand
purchasimg
1 2 3 4 5
Generally,thepresident’sofnceandplannlngdivisionandthemanufacturingdivisionhavea
greaterinfluenceonthefbrmulationofresearchstrategyatcompanieswithaseparatedivisionfbr
R&DstrategyplannlngthatatcompanieswithoutaseparatedivisionfbrR&Dstrategyplannlng.
Moreoverthe overallinfluenceofthe various divisionsis greateratcompanies witha separate
divisionfbrR&Dstrategyplannlng,indicatlng,Webelieve,thattheoplnlOnSOfthesedivisionsare
reflectedtoagreaterdegreeintheformulationofR&Dstrategy.
−53−
5・CompanyEmpIoymentConditionsn)randAttitudesTowardsResearchers
andEngineers
5・lEmpIoymentConditionshrResearchersandEngineers
InthisquestionweaskedthecompaniestochosefromfburdescrlPt10nStheonewhichismost
applicabletotheemploymentconditionsfbrtheirresearchersandenglneerS;1−”thecompany
PlacesresearchersandenglneerSunderthesameperSOnnelstreamasadministrativestafP,,2−日the
COmPanyhasestablishedspeCialistpositionsforresearchers andenglneerSqulte distinctfrom
managerialpositions,SuChas
chiefresearcherandseniorresearcherH,3−日the
company
haS
establishedspeCialistpositionscorrespondingtoseniorexecutives,SuChasthoseseenintheIBM
ResearchFbllowshipsystem”,4−“Others”・Figure54showsthat,OVeral1,54companies(42.9%)
Choseresponsel,65companies(51・6%)choseresponse2,fburcompanies(3.2%)choseresponse
3,andtwocompanies(1.6%)choseresponse4.
WebelievethatamOngthecompaniesthatchoseresponse2−日thecompanyhasestablished
SpeCialistpositionsfbrresearChersandenglneerSquitedistinctfrommanagerialpositionsM−are
COmPaniesthatsubstantiallyplacetheirresearchersandenglneerSunderthesameperSOnnelstream
asadministrativestaff,SOinthissense,itwouldappearthat,aSisqulteOflensaid,theemployment
COnditionsfbrresearchersandenglneerSarenOtaSgOOdastheyperhapsshouldbe・
AdifftrenceintheresultswasseenbetweencompanieswithaseparatedivisionfbrR&D
StrategyPlanningandthosewithout・AsshowninFigure54,reSPOnSel(”thecompanyplaces
researchersandengineersunderthesameperSOnnelstreamasadministrativestafr’)waschosenby
ahigherperCentageOfcompanieswithoutaseparatedivisionfbrR&Dstrategyplannlng,While
response2(”thecompanyhasestablishedSpeCialistpositionsforresearchersandengineersquite
distinctfrom
managerialpositions”)was
chosen
by
a
higherperCentage
Ofcompanies
with
a
SeParatedivisionfbrR&Dstrategyplanning・Allfourcompanieswhichchoseresponse3(”the
COmPanyhaSestablishedspeCialistpositionscorrespondingtoseniorexecutives,SuChasthoseseen
intheIBMResearchFellowshipsystem”)haveaseparatedivisionfbrR&Dstrategyplanning.
While we cannot say that companies with a separate division forR&D strategy plannlng
unifbrmlyhaveestablishedfavorableemploymentconditionsfbrtheirresearchersandenglneerS,it
Can beinfbrredfrom the above that they are atleast glVlng COnStruCtive thought to their
employmentconditionsandhowtheycanbeimproved.
−54−
Figure54EmploymentConditions・fbrResearchersandEngineerslQ・34]
42.9% 51.6% 3.2%1.6%0.8%
36.6% 54.9% 4.9%2.4%1.2%
Companieswith
SeparatediYision
重書誌Illll主
52.4% 47.6%
Companieswithout
SeParatedivision
 ̄11−− −1
1.Theconpamyplacesrescqchers
anden伊neCBunder血es甜ne
匹r弧nnelsけC抑1おadmbis甘atiYC
Sta汀
4.0血crs
2.Thecompanyhasestablished
S匹Cialistposltionsfbrresearchers
andenglneerSquitedistincth)m
managerialEX)Siticns,SuChaschief
researcherandseniorreseaJCher
3.ThecoTlpanyhasestd)1ished
SpeCialist匹SltlOnS
COrreS卿dingtosenior
ex的Itives.suchasthoseseenin
血eIBMRcsc融℃h托llows振p
野Sはm
Toensureeffbctiveandef伝cientR&Doperations,itisessentialk)rCOmPaniestomaintaina
positive R&D environment for researchers and englneerS,thatis,a Well struCtured work
environment and good conditions of employment,including appropriatelevels of pay.
Unfortunately,ltSeemSthatJapanesecompaniesstillhavemuchtodointhisregard.
5・2AttitudesTowardsResearChersandEngineers
Wethenaskedthecompaniestoindicatetheirattitudestowardsresearchandresearchersinthe
managementofR&Dbymarkingtheapplicabilityofaseriesofstatementsonascalefromoneto
丘ve(1−”veryapplicable”;2−“mOreOrlessapplicable”;3−“CannOtSayeitherway”;4−“nOtVery
applicable”;5−“nOtaPPlicable”)・
ー55−
Figure55shows the resultsin descending orderofapplicability according to the average
responsevalue(thelowertheaveragevalue,themoreapplicablethestatement).
Figure55AttitudesTowardsResearchersandEngineerslQ.35]
9% A泥呵詳
36% 56%
Inordertoachieveinnovativeresearch,it
isimportantforthecompanytoglVe
researchersarreehand
■− 1
Researchersmustensurethattheyadhere
totheannualplan
Umdergroundresearchshouldbeaccepted
positively
8% 50%
ResearchersthemselYeSShouldcollectthe
datanecessaryfbrtheresearchplan
Thecompanydoesnotconcernitselrwith
theresearchprocessesaslongasgood
resultsa代rOrthcomi噂
Researchersshouldbeclear,y
distinguished什omenglneeT’Sand
empl0ymentCOnditiorlSShouldrefIectthis
2% 25%
Supervisionofresearchersimpedestheir
abilitytodevel0pneWideasandcollceptS
Researchersmustadheretosetworking
hours
Researchersshouldproduceexcellent
researchresultsregardlessorhowIongit
takes
Researchersshou】dbelnanagの‖nthe
samewayasadministrativestafT
−56一
29% 12%1%
Companiesfhcethedilemmathateventhoughtheyhaveaconceptualunderstandingthat“in
Ordertoachieveinnovativeresearch,itisimportantfbrthecompanytoglVereSearChersa丘eehand”,
in reality,Organizationalconstraints meanthat they are simply not able to glVe reSearChers
COmPlete
h.eedomin
their
research,and
thisis
reflectedin
the
results
fbr“supervision
of
researchersimpedestheirabilitytodevelopnewideasandconcepts”.
Althoughmorethan40%ofcompaniesindicatedintheprecedingsectionthat“thecompany
PlacesresearchersandenglneerSunderthesameperSOnnelstreamasadministrativestaff”,thevery
negative
response
to
the
statement“researchers
should
be
managedin the
same
way
as
administrativestaff”indicatesthatthereisqulteagaPbetweentheidealandreality.
From the responses toallofthe statements we can see that companies are groplng fbra
balance
between
the“management”ofresearchers
and“maintalnlng
a
highlevelof
research
丘eedom”.
Therewereconsiderabledifftrencesintheresponsestothestatementslistedbelowbetween
COmpanieswithaseparatedivisionfbrR&Dstrategyplanningandthosewithout(Figure56).
−57−
Figure56AttitudesTowardsResearChersandEngineerslQ.35]
(Classi丘edbyExistenceofSeparateDivisionfbrR&DStrategyPlaning)
Inordertoachieve
38% 59% 4%Average
innovativeresearCh,itis
importamtbrthecompany
to癖veresearchersafree
19%
hand
11%1%
Researchersmustensure
thattheyadheretothe
24% 67% 10%
annualplan
23% 46% 27% 4%
Undergroundresearch
ShouldbeaeCepted
38% 10%
positively
Researchersthemselves
Should collectthedab
necessaryfortheresearch
28% 15% 1%
10% 46%
29% 7%
5%
plan
15% 1%
5% 39%
Thecompanydo鴎nOt
concernitselrwiththe
researchprocessesas10ngaS
33% 10%
12%
goodresu圧sareb柁hcomlng
Researchersshould be
15%
2% 30%
clearlydistinguishedrrum
engllleerSandemployment
conditionsshouldreflectthis
10%
7% 31%
12% 2%
2% 24%
Supervisionofresearchers
impedestheirabiIityto
developnewideasand
50%
concepts
40% 41%
19% 2%
7%
Researchersmustadhereto
SetWOrkinghours
14% 26% 57% 2%
1%5% 45% 37% 12%
ResearchersshouIdproduce
excellent research results
regardIessorhowlongit
takes
2%5% 40%
1% 21%
Researchersshouldbe
managedinthesamewayas
administrativestaff
5% 27%
−58−
CompanieswithaseparatedivisionforR&Dstrategyplannlnggenerallygaveamorepositive
responsetoHundergroundresearchshouldbeacceptedpositivelyHwithanaverageresponsevalue
of2・14comparedtocompanieswithoutthedivisionwithanaverageresponsevalueof2・45,a
diffbrenceofO.31.
Similarly,COmPanieswithaseparatedivisionforR&Dstrategyplannlnggenerallygavea
morepositiveresponsetoHinordertoachieveinnovativeresearch,itisimportantfbrthecompany
toglVereSearChersafreehand”withanaverageresponsevalueofl・66comparedtocompanies
Withoutthedivisionwithanaverageresponsevalueofl・86,adiffbrenceofO・20・
Incontrast,COmPanieswithaseparatedivisionforR&Dstrategyplannlnggenerallygavea
morenegativeresponseto“thecompanydoesnotconcernitselfwiththeresearchprocessesaslorlg
asgoodresultsarefbrthcomlng”withanaverageresponsevalueof2・72comparedtocompanies
Withoutthedivisionwithanaverageresponsevalueof2.41,adifftrenceofO.31.
Companies
withthe
divisionalsogaveamorenegativeresponseto”researchers
shouldbe
managedinthesamewayasadministrativestaff”withanaverageresponsevalueof4・02compared
tocompanieswithoutthedivisionwithanaverageresponsevalueof3.81,adifferenceofO.21.
Aswehavedescribed,thereisaconsiderabledifftrencebetweencompanieswithaseparate
divisionfbrR&Dstrategyplannlngandcompanieswithoutthedivisionintheirresponsestothese
fbur statements,and whilethese results andin factthe results ofal1responsesindicate that
COmPanieswiththedivisionglVehighconsiderationtothenotionofindependencefbrindividual
researchers,theyalsoshowthatthesecompanieshaveagreatertendencytohavetheirresearchers
WOrkwithinthebasicorganizationalframeworkofthecompanythancompanieswithoutaseparate
divisionforR&Dstrategyplannlng.Itcanpossiblybearguedthatasaresultofrepeatedtrialand
errortonndefnciencyinthemanagementofR&Doperations,COmPanieswithaseparatedivision
fbrR&DstrategyplannlnghavereachedtheconclusionthatitisimportanttoglVehighregardto
researchers’creativityandraisetheirlevelofindependenceinordertofbsterinnovativeresearch.
6.R&DPern)rmanCe
6・l RatioofNewProductsandRatioofSaIesfbrNewProducts
Thenumberofpaperspublishedandthenumberofapplicationsforpatentsareoftenusedto
gaugetheperformanceofR&Doperations・Thesefocusonりquantlty”,Whereasinthisreportwe
havetriedtofbcusonthe“quality”ofresearch,thatis,theextenttowhichR&Dhascontributedto
thebusinessshowlngOfthecompany,andtothisend,WehavetriedtoevaluateR&Doperations
throughtheratioofnewproductsandratioofsalesfbrnewproducts,Whicharegenerallyusedas
StrateglCindicatorsofR&Dinthemanufacturlngindustry.
We de丘ne new products as products that contain new technologleS,and the ratio ofnew
products,eXPreSSedasaperCentage,isthengureobtainedwhenthenumberofnewproducttypeS
isdividedbythetotalnumberofproducttypesproducedbythecompany・Theratioofsalesfbr
newproductsistheperCentagethatsalesofnewproductsaccountsfbrinthecompany,stotalsales
amount.
WeexpeCtedtheretobeadiverserangeofdennitionsfbrnewproducts,deepenlngOnthe
industrytypeandthecompany,butherewetookituponourselvestolookattheresultsonthe
greatestcommonmeasurelevelandbaseourcomparisonsonthat.AsexpeCted,therewerevarious
−59−
definitionsfornewproducts・Mostcompaniesintheassembly−typeindustryde丘nenewproducts
asproducts thathavebeenonthemarketfbruptothreeyears(4−5yearSforthe automobile
industry,Whichde且nesnewproductsasacompletemodelchange),andmostcompaniesinthe
material−typeindustryde6nethemasproductsthathavebeenonthemarketfbrupto丘veorten
years・Forthefiscal1990data,49companies(OutOf126)providedtheirratioofnewproducts,
and57companiesprovidedtheirratioofsalesfbrnewproducts;atOtalof41companiesprovided
bothratioofnewproductsandratioofsalesfbrnewproducts・Mostofthecompaniesthatdidnot
respond to this question commented that they could not determine the ngure because ofthe
massivenumberofdiffbrentproducttypeS.
Whilewecantakethelinethatthehighertherati00fnewproducts,thegreaterthefruitfrom
R&Doperations,herewehaveconsideredthatavalueofmorethanonewhentheratioofsalesfor
new productsis divided by the ratio ofnew productsindicates that the R&D operations are
efncient・ByevaluatlngR&DperfbrmanCeinthislight,WebelievethatindustrialcharacteriStics
inherentin the伝gures fbr ratio ofnew products and ratio ofsales fbr new products can be
disregarded,thereby enabling us to compare the R&Dperfbrmance ofcompaniesin difftrent
industries・Evenwheretherati00fnewproductsishigh,ifthesaleofnewproductsmakesonlya
Smallcontributiontooverallproductsales,thatis,theratioofsalesfornewproductsislow,the
R&DoperationsarenotreallyglVlngagOOdretumontheinvestment.Theperformanceofvarious
divisionsinthecompany,includingmarketingcapabilityaSWellasR&Dcapability(technological
advantageofthenewproduct),greatlyaffbctstherati00fsalesfbrnewproducts,SOinthecontext
OfcreatlngneWteChnologleSandnewproducts thatcancontributetooverallproductsales,We
believe that the ratio ofsales fbr new products byitselfis an acceptable yardstickforR&D
performanceinabroadsense・
Unfbrtunately,becauseofthelimitedamountofdata,itwouldnothavebeenreasonabletouse
therati00fsalesfbrnewproducts/ratioofnewproductsequationasastandardfbrdefiningan
excellentcompanywithef伝cientR&Doperations・Forreference,Wehaveshowntherati00fnew
productsandratioofsalesfbrnewproductsdataobtainedfromthe41companiesfbrfiscal1990in
Figure57.
一60−
Figure57CorreIationBetweenRatio・OfNewProductsandRatioofSalesfbrNewProducts
[Q.4]
(Fiscal1990Data)
[⊃
︵辞︶S︶UnpOhd≧0己︼丘∽OtdS−00焉錮
b=3.5
ニ
a=0.9g
7
︵
y=aX+b
/
(t=1
/
./
/
/
/
/ y=CX+d
/ C=0.67(t=3.23)
/ d=4.3(t=0.79)
/
./ノ
一一■一
Comp壷cswi血scparaledvisbn
(N=26,が=0.6824)
−ロー
Comp卸jcswi血Ml比p訂地division
(N=14,が=0.4643)
0
020 40 60 80 100
Ratioofnewproducts(%)
Usingthisdata,WethencomparedtheresponsesglVenbycompanieswithaseparatedivision
fbrR&Dstrategyplannlngandcornpanieswithoutthedivision.Asmentionedinsection2−1,We
WereunabletonndacorrelationbetweentheexistenceofaseparatedivisionforR&Dstrategy
PlannlngOnOnehandandthelevelofR&Dspendingandthetypeofindustryontheother,nOr
COuldwenndanycorrelationbetweentheexistenceofthedivisionandindustrytypeamongthe41
COmPanieswhichprovidedthedata.
Ofthe41companies,26haveaseparatedivisionforR&Dstrategyplannlngand15donot.
InFigure57,theblacksquaresrepresentcompanieswithaseparatedivisionforR&Dstrategy
plannlng,andthewhite squares representthosewithout the division.Theunbrokenline−is a
regressionlineforcompanieswithaseparatedivisionforR&Dstrategyplannlng,andthebroken
line−−−isaregressionlinefbrcompanieswithoutthedivision.Thecompanypositionedatpoint30,
93stands out considerably,and upon checking their calculation methods,We fbund that their
Calculationstandardswerequitediffbrentfromtheothercompanies.Wethereforeconcludedthat
Wehad to treat the ngures forthat company as anomalous and decided to exclude them when
COmPilingtheregressionlinefbrcompanieswithoutaseparatedivisionforR&Dstrategyplannlng.
ー61t
Companngthedistributionofcompanieswithandcompanieswithoutaseparatedivisionfor
R&D strategy plannlng through theirrespeCtive regressionlines,We CannOtice a slgnincant
diffbrence betweenthe two groups ofcompanies・Theinclination ofthe regressionline fbr
COmPanies with the divisionis O.98(t check1%signi伝cance),Whereas theinclination fbr
COmPanieswithoutthedivisionisO・67(tcheck1%signincance),reVealingthatcompanieswith
thedivisiontendtohaveahigherratioofsalesfbrnewproducts/ratioofnewproducts.
Wealsoanalyzedthesefigures accordingtoindustry・Theindustriesweanalyzedarethe
materia1−relatedmanufacturingindustries4(16samples)andthemachinery−relatedmanufacturing
industries5(21SamPles).Here,tOO,We eXCluded the data for the company atpoint30,93
(material−relatedmanufacturingindustries)asanomalous.
Table52showsthesimpleaverageofratioofsalesfornewproductsandTable53showsthe
Simpleaverageofrati00fsalesfornewproducts/ratioofnewproductsfbrcompanieswitha
SeParatedivisionforR&Dstrategyplannlng,COmPanieswithoutthedivision,andoverall,broken
downinto material−related manufacturingindustries and machinery−related manufactunng
industries.Although Table52shows thatirl the material−related manufacturlngindustries,
COmPanieswithoutthedivisionwentagalnStthetrendandreturnedaslightlybetterresultinthe
rati00fsales fbr new products than companies withthe division,Table53shows thatin all
Classincations,COmpanieswiththedivisionreturnedabetterresultintheratioofsalesfornew
PrOducts/ratioofnewproductsthancompanieswithoutthedivision,indicatingthat,aSSurveyed,
theperfbrmanceofthecompanieswiththedivisiontendstobebetterthanthatofthecompanies
withoutthedivision.
Table52SimpleAverageofRatioofsalesfornewproducts(Q・4)
O veIa ll
M ater
i alィe lated
M achin ery−
related
M a ter
i al−
re lated plus
m an ufactun n g in du str
i es
m anufac tu n n g ind usb ies
m aCh in ery Trelated
0 verall
N o .of com p anie s
N o.o f com p anic s
N o.o f com p anies
N o .of c om pan ies
13 .
9
26 .
5
2 1.
3
20.
5
15
21
36
40
C om p a
n ies w ith
13 .
8
29 .
5
2 2.
4
2 1.
1
SeP arate division
10
12
22
26
C o m pan ics w itb ut
14 .
0
22.
5
19 .
5
19 .
5
Se Parate d iv
i sion
5
9
14
14
(Dataforcompanyat30,93arenotincluded)
4Thematerial−relatedmanufacturingindustriesare一・chemicalS一・(Sixsamples),・・pharmaceuticals一・(負vesamples),
”otherchemicals’一(OneSamPle),’’petrOleum’’(OneSamPle),”glass.’(onesample),and’’generalsteel”(twosamples)fbr
atotalofsixindustrytypesand16samples・
5ThemachineryLrelatedmanufhcturingindustriesare・・industrialmachinery・・(threesamples),”heavyelectric
equipment’’(OneSample),r.communicationsequipment..(onesample),’.domesticelectriCalapprancesandcomponent
partS’l(Sixsamples),’10therelectricalequipment.’(threesamples),”motorvehicles”(sixsamples),and.’precision
machinery”(onesample)foratotalofsevenindustrytypesand21samples・
−62−
Table53SimpleAverageofRatioofSalesforNewProducts/RatioofNewProducts(Q.4)
M ater
i a l−
relate d
M achinery −
related
M atの 山一
柁1atcd plus
m an ufactu rln g indu str
i es
m anufactun n g indu str
i es
m ach inery −
related
N o.
of com p anie s
N o.
o f com p anie s
N o.
o f com p anie s
N o.
o f com p anie s
1.
64
1.
10
1.
32
1.
33
15
21
36
40
C o m p anies w
i th separate
1.
76
1.
25
1.
48
1.
47
d visio n
10
12
22
26
C o m panies w
i tho ut
1.
38
0.
89
1.
07
1.
07
SeP arate d ivisio n
5
9
14
14
O vcrall
O vcm 11
Pataforcompanyat30,93arenotincluded)
Fromtheabove,WeCanSeethataccuratemarketfeedbackisreachingtheR&Ddivisionat
COmPanieswithaseparatedivisionforR&Dstrategyplannlng,andthisisenablingthemto丘)CuS
OnR&Doperationsfbrnewproductsthatcancontributetotheiroverallsaleseffort・
Althoughtheaboveresultsdonotallowustosaydefinitelythat“theR&Dperfbrmanceof
COmPanieswithaseparatedivision brR&Dstrategyplannlngisbetterthanthatofcompanies
Withoutthedivision”,theyarenonethelessinterestlng.Thefhctthattherelativelylargecompanies
Whichrespondedtothissurveyhaveagraspoftheirratioofnewproductsandratioofsalesfbr
newproductsasquantitativedata,andusethesedataaseffectivestrateglCindicatorsfbrtheirR&D
OPerationsitselfis a strongindication ofa highly strategy−0rientedmanagement struCture and
aWareneSS.
_63−
V SummaryorSurveyResults
Inthisresearchwewereabletoverifythrougho句ectivedataobtainedh.omawide十ranglng
questionnaire that companiesin the prlVate SeCtOr are becomlnglnCreaSlngly aware ofthe
importanceofR&D,andoftheneedfbr”strategy”andstrateglCmanagementSyStemStOenhance
theirR&Doperations・Wewerealsoabletoconnrmthatnotonlydothesecompanieshaveahigh
awareness,buttheyhavetranslatedthisawarenessintoactionandarecarrylngOuthighlystrategy−
0rientedR&Datthepracticallevel・ManufacturlngindustriesinJapanhavesteadilyshiftedfroma
generallyunbalanced“R&D”withgreateremphasisondevelopmenttoamorebalancedR&Dwith
generallyequalemphasis on researchand development,and this hasledto agreaterneed br
“strategy”and“strateglCmanagement”・Tothisend,COmPaniesinthemanufacturlngindustryare
COntinuallytrylngtOimprovetheirR&Dmanagementsystemsthroughtrialanderrorinaneffbrtto
raisetheef缶CtivenessandefnciencyoftheirR&Doperations・
Be10WWehavesummarizedtheresultsdetailedinchapterIV・
l・AscanbeseeninthegeneralupgradingoftheR&Ddivisionhead,spositionandtheincrease
intherelativeinfluenceoftheR&Ddivisionwithinthecompanyoverthepasttenyears,the
importanceofR&DintheJapanesemanufactunngindustrylSgreaterthanithaseverbeen・
2・(1)Sixty−nVeperCentOfcompaniesthatrespondedtothesurveyhaveestablishedaseparate
divisionforR&Dstrategyplannlng.
(2)Allcompaniesrespondedthattheyfeelthereisaneedtoimprovetheefficiencyoftheir
R&Doperations.
(3)EightyperCentOfcompaniesgaveapositiveresponseaboutevaluatingtheefnciencyof
R&Dinvestment.
(4)SeventyperCentformulateastrategicR&Dbudget.
(5)Seventy一伝vepercentfbrmulateacompanyresearchstrategy.
(6)CompaniesareseekingtoexpandtheirR&Dcapabilityandreducetheburdenofrising
R&DcostsbypartlCIPatlnglnreSearChconsortia.
(7)CompaniesaregenerallyincorporatingthestrongpointsofbothAmericanandEuropean
methodsandJapanesemethodsintotheflowoftechnologythroughthediffbrentstages・
Fromtheabove,WeCanCOnCludethattheneedbrustrategyMand=strateglCmanagementHin
theJapanesemanufacturlngindustrylSCOntinulngtOgrOW,andthatcompaniesarecarrylng
Outhighlystrategy−OrientedR&Datthepracticallevel.
3・Companiesareveryawarethatastheypursueefficiencylnabroadsense,theymustimprove
employment conditions br researchers and englneerS and their generalattitudes towards
researchersandenglneerSinordertobringoutthecreativltyOfindividualresearCherstoits
fullest.
4・General1y,COmpared to companies without a separate division fbrR&D strategy plannlng,
COmPanieswiththedivision(820fthe126companies)tendtobemorestrategy−0rientedin
theirresearchmanagement,forexample theirpositive efforts to construct globalnetworks
throughpartlCIPationinconsortia;tendtocoordinatetheviewsofthevariousdivisionsinthe
COmPanyandgivegreatermarketftedbackto theR&Ddivision;andtendtohaveatntter
R&Dperformanceintermsofthecorrelationbetweentheratioofnewproductsandtherati0
0f sales for new products・Theyalso tend to have a greater understanding about R&D
ー64−
managementandhowtoimprovetheresearchenvironment,includingtheiroveralltredtmentof
theirresearchersandenglneerS,SOthatthemostefftctiveandefncientR&Doperationscanbe
achieved.
−65−
VI Conclusion
ArecompaniestodayshowingatendencytoreducetheirR&Dspendinglnaneffbrttocut
COStS andimprovetheir short−term management・efnciency asthe recession andthe growlng
SeVerityofthebusinessenvironmentfbllowingtheburstingoftheeconomicbubblecontinueto
Chipawayattheiroperatlngmargin?Throughthisresearch,atleast,Wefbundthattheenthusiasm
fbrR&DintypicalcompaniesinJapan,smanufactunngindustrylSnOtSOShallowthatitcouldbe
PuShedasidefbrtheperceptlOnOfshort−termefnciency,rather,itflowsverydeeply・Evenwhere
R&Dspendinghasbeenreduced,thecuthasbeenminimal,andoverthelongterm,Webelievethat
R&Dspendingwillonlyeverincrease,itwillneverdecrease.
Japanesecompaniesarefullyawareoftheneedfor”strategyMandHstrateglCmanagement”in
theireffbrtstousetheirmanagementresourcesasefftctivelyaspossibletocopeWiththegrowlng
uncertaintyinthebusinessenvironment・Althoughmanagementhasadeeply−rOOteddesiretoraise
theefnciencyofR&Doperations,itwouldappeartheyhavebeguntorealizeinthefhceofrepeated
trialanderrorthatinnovativeresultsarebeyondreachiftheirnrstconsiderationistochaseafter
efnciencyofinvestment(input)andresearchresults(Output).
Throughthisstudy,WeCanSuggeStthatthefbllowlngthreepolntSfbrmthekeytoeffbctive
andefncientR&Doperations・
1.Companies should placeimportance on clarifying strategleS by way of a direction that
employeesshouldfbllowandgoalsatwhichemployeesshouldaim,thatis,“Whattheyshould
manufactureandhow”and“whattheyshoulddotoachievethis”.
2.Companies should establish systems fbr strategic R&D management which emphasize
differentiationandtheallocationofprioritiesandwhichfacilitatethetimelyvertical,1ateral
andinterdepartmentalnowofinbrmation,andtheselectionandstorageofusefulo叫ective
datawhenbrmulatingeffbctive“strategy”.
3.Insteadoftryingtostrictlysuperviseresearchersandengineers,COmPaniesshouldsuperviseat
theminimumleveltheyrequireasmembersoftheorganization,delegatingauthoritytothe
researchunitandgivingresearchersas丘eeahandaspossiblesothattheycanproceedfreely
Withtheirresearchandachieveinnovativeresults.
The
thirdis
based
on
the
companies’responses
on
employment
conditions
fbr
and
their
thoughtsaboutresearchers andenglneerS,butthereis stillconsiderablescopeforcompaniesto
improveemploymentconditionsfbrresearChersandenglneerS,improvetheR&Denvironment,and
reviewtheirbasicR&Dmanagementstructure.Onreflection,itappearsthathereinliesthekeyto
effbctiveandefncientR&Doperations.Evenifcompanieshaveabroadconceptualunderstanding
Ofthispolnt,itislikelythattheywillhavesomehesitationaboutputtlngitintoefftct,Simply
because there are no data to supportits effectiveness.Itis hopedthe fhct that we noticed a
tendencyfbrcompanieswithaseparatedivisionforR&DstrategyplannlngtObemoreprogressive
in their basic attitudes towardsthe R&D environment and R&D management and to display
generallyabetterR&DperfbrmancethancompanieswithoutaseparatedivisionfbrR&Dstrategy
plannlngWillbecomethefoundationuponwhichcompaniescanimprovetheirR&Denvironment・
Fromthe
surveyWe
discoveredthatthereis
agrowlngneedfbr“strategy”and“strateglC
managementHamongJapaneSeCOmPanies,andthat70%ofcompamieshaveestablishedaseparate
ー66−
division speCially responsible fbrR&D strategy・The survey Shows that companies generally
appeartobedealingwithtoday’shighlyuncertainenvironmentbyadoptlngtheirownstrateglC
POliciesandoperations.AstheestablishmentofaseparatedivisionfbrR&DstrategyplannlngCan
be regarded as organizationalrefbrmin a broad sense,the fact that the m句Orlty OfJapanese
COmpanies have establishedaseparate division fbrR&D strategy plannlngCan be viewedas a
broad−basedtransitionalmeasureleadingtowardsahighlycoordinatedcorporatestructurethatcan
dealpreciselywiththevariousuncertaintiesoftoday.Unfbrtunately,inthisstudywewerenotable
to丘ndouttheactualfunctionsoftheseparatedivisionsfbrR&Dstrategyplannlngindetail.This,
andtheactualmeasuresbeingadoptedtodealwiththeenvironmentaluncertainties,areareaSthat
WeShouldliketotackleinafutureresearchprqject.
AsstatedinchapterI,thisreportbringstogethertheresultsofasurveyOfJapanesecompanies
thatfbrmS aPartOfawidersurveyWhich seeks to compare theR&Dmanagement systems of
Japanese,United States and European companies.We are currently movlng tOWardsthe
implementationofsurveysofEuropeanandUnitedStatescompanies,andoncethesesurveyshave
beencompletedandtheresults analyzed,We Shallbe able torevise ourpresent suggestions or
fbrmulateentirelynewsuggestionsasrequired.
一67−
Bibliography
ANSOFF,H.I.CoTPOrateStrategy1965,McGraw−HillInc.
ANSOFF,H.I.StrategicManagement1978,TheMacMillanPublishers,U.K.
Burgelman,R.A.AModelQftheInteraction qfStrategicBehavior,CoTPOrate Context&the
ConcqptdStrategyl983,AcademyofManagementReview8:61−70.
CHANDLER,A.D.Jr.GiantEnteTPrlSe1964,Prefacep.xii.
CHANDLER,A.D.Jr.Strategy&Structurel966,NewYork,DoubledayAnchorBooks Edn.,
U.S.A.
COOMBS,R.,SAVIOrrTI,P.&WALSH,V.Economics&TbchnologlCalChangel987,The
MacMillanPublishers,U.K.
DERTOUZOS,M.etal.MadeinAmerica.
FUKUI,T.KenkyuKaihatsuBumon noJidiShinsenryakulNewPersonnelStrategiesfbrthe
R&DDivision]NihonKeizaiShimbun,1989
HEDLAND,G.TheHypermodernMNC−AHeterarchy?1986,HumanResourceManagement,
Vol.25−1.
Kodama,F.NISTEPREPORTNO・15 FromProducing to77unking Organizations National
InstituteofScienceandTechnologyPolicy,ScienceandTechnologyAgency,1991
MARK,H.,&LEVINE,A.771eManagementdResearchInstitutionsl984,ScientincTechnical
InfbrmationBranCh,NASA,U.S.A.
NONAKA,I・&KAGONO,T.etal.StrateglCVSEvolutionaryManagement1985,North−Holland,
Netherlands
NONAKA,I・KigyoShinkaron[TheoryofCompanyEvolution]NihonKeizaiShimbun,1985
NONAKA,I・ChishikiSozo no Keiei[Management ofKnowledge Creation]Nihon Keizai
Shimbun,1990
ROUSSEL,P.,SAAD,K.,&ERICKSON,T.ThirdGenerationR&D1991,Harvard Business
SchooIPress,U.S.A.
SAKAKIBARA,K.&WESTNEY,D.E.Co〝parative Study d the77・aining,Careers &
OrganizationdEngineersintheCo〝甲uterIndustryintheU.S.&Jqpan1985,Hitotsubashi
JoumalofCommerce&Management,Vol・20,No・1,Decemberl985,PP.1−20・
QuarterlyJapanCo叩anyHandbook,ToyoKeizaiInc.(TheOrientalEconomist),1991
771eCompanyStqList,DiamondCo.Ltd.,1991
−68−
Annexes
AnnexIQuestionnaire
JNTERNATl0NALCOMPARISONSTUDYOF
R&DMANAGEMENTSYSTEMS
ScienceandTechnologyAgency
MSTEP
1 We hopeyOu are Willing to participateinthis research study that seeks to compare
Japanese,American,and European R&D management systems・The questions seek
infbrmation about your company−s R&D strategy,R&D management system,and
managementsituation.Becausewewouldliketocollectaccuratedata,Pleasehavethis
questionnairem1edoutbysomeonewhocanglVeSu句ectiveresponses−ifpossible,bythe
headof伝ceroftheR&Ddepartment.
Weunderstandthatthisinformationisconndential,andaretakingeveryprecautionto
PrOteCtyOuandyourcompany・Theresponsestothisquestionnairewil1bereportedonly
instatistiCalreportS,therebyprotectlngindividualresponses.
2 Upon丘nishingthisquestionnaire:
(1)Pleaseusetheenclosedenvelopetoreturnthequestionnaire.
(2)Pleaseretumthisquestionnaireby*****
ThankyouinadvanCefbryourcooperation.
Y our C om pany
TEL (
)
Y our
D epartm ent
Y our N am e
Q・l Yourpositioninyourcompany?
3.0血ers
1・Ofncer 2.Generalmanager
□
Q・2 InwhichsecdonofyourcompanyareyouinvoIvedinR&Dstrategydeve10Pment?
1・Overallcompany 2.Department
3.Division 4.Laboratory
ー71−
[=]
Q・3 WhichofthefbllowingpatternSdoseyourcompany.sR&Dmanagementsystem
bllow?
Pleasechoosethenumberofthepattem・IfyoucannotfindtheanSWerChoicesasin
approprlate,Pleasedescritx,yOurCOmPany▼spattemintheblankspace・
[:コ
1・IndependentSingleLaboratorySystem 2・IndependentR&DDepartment
ResearchManagementSec
ResearchManagementSec.
(− planningSec.)
(ResearchPlanningSec.)
President−Lab.
GeneralAffairsDiv.
GeneralAffairsDiv.
Develop.
Headquart
President
ResearchDiv.
Lab・−⊂
ResearchDiv.
(DevelopmentDiv.)
(DevelopmentDiv.)
3・IndependentMultipleLaboratorySystem 4・IndependentR&DDepartmentwith
∝
S
g
n
Slr V
,
ぬ
D
A
h
C
訂 〃ケ
a
r
e
e
n
e.Ⅳ eS
R
GD
ノシ
(DevelopmentDiv.)
P
President−Dev.Hdqrs.
ク
二 址芸
ResearchDiv.
△△Lab.
Man喝ement
m
紅 訂 ヽ ノ
□□Lab.
GeneralAffairsDiv.
Ch の u
ResearchManagementSec.
00Lab.
竺甜 ∞ m血DeV。
(ResearchPIanningSec.)
Preside山
控仁山巨ヒ
MultipleLaboratories
n
5.BusinessDepartmentControlling
6.BusinessDepartmentControlling
ParallelLaboratorySystem
薫
LaboratorySystem
esearchMan喝ementS∝.
Bus.Dep.− Lの.
esearchPlannlngSec.
Bus.Dcp.胃 Lab.
GeneralAffairsDiv.
R&DDep机汀ICnt
h℃Sident
∴三一
△△ Lab.
Bus.Dcp.− Lの.
RescarchDiv.
DevelopmentDiv. 2
7・IndependentCompanySystem
◎◎Bus・Dep・胃◎◎Lab・
◇◇B岨Dcp・−◇◇Lab・
8.0therSystemS
▽▽Bus.Dep.−▽▽Lab.
Notel:Thoseinparenthesesdonotnecessarilyexist.
Note2:Thenamesbreachsection(department,division)aremadetorepresentjobsofeach.
Note3:”DivisionT.refbrstogroupsinvoIvedintaskenforcement,and.’section”refbrstogroups
invoIvedinstaffmanagement.
−72−
Q.4 Whataretheapproximatevaluesofyourcompanyrsproceeds,therateofordinary
PrO6ts,R&Dexpenditure,numberofemployees,numberofresearchers,therateof
new products,the rate ofproceeds for new products,number ofpatent requests,
numberofdissertationpresented.
1985
1990
Proceeds
R.
ofordina
r y PrO蝕S
R &D expenditure
Em ployees
Researchers
R,
Ofnew products*
R.
ofproceedsfor N P
Patentrequests
D issertat
i ons
*Therateof
newproducts=
N.ofvadety
newproducts
N.ofv訂iety
allproducts
(”Newproducts’’refbrstoproducts
that requirenewtechnology・)
InthecasewhereyourcompanyalreadyhasaspeCialaccountlngmethod,Pleasecalculate
theabovedatauponexplanationofthemethod・
AIso,Pleasedescribewhattheterm”newproducts’’meansinyourcompanybelow・
−73−
Q.5 DoesyourcompanyhaveaseparatedivisionthatdealsonlywithR&Dmanagement
Strategy?
1.YES 2.NO
畔Orthosewhoanswered’’NO’.,PleasegoontoquestionNo.6.)
[コ
SQ.lHowisthatdivisionrefbrredto?
SQ.2Whatsectiondoesthatdivisionbelongto?
1.C.E.0. 2.BusinessHdqrs. 3.BusinessDiv. 4.Lab.
□
SQ.3Pleasedescribethehistoryofthisdivisioninchronologicalbelow.
SQ.4How many employees workin this division.AIso,how has the budget brthis
divisionchanged?
1980
1990
Employees
Budget
−74−
Q.6 Istheresearchplandevelopedfbrthewholecompany?
1.YES 2.NO
⊂]
(Thosewhoanswered’.NO.一,PleasegoontoQ・7・)
SQ.lIngeneral,apPrOXimatelyhowlongdoesyourcompanyresearchplanCOVer?
1.3years 2.5years 3.10years 4.Morethan15years
[=]
SQ.2Whoisthemainpersoninchargeoftheresearchplandevelopmentprocess?
1.Researcher 2.Researchleader 3.Managerofresearchmanagement
4.Headofthedivisionofresearchmanagement
5.0fncerinthedivisionofresearchmanagement
6.C.E.0
SQ.3Whohasthepowertomakethefinaldecisionovertheresearchplan?
1.President 2.Officerinthedivision 3.Otherofncer
4.Headofthedivisionofresearchmanagement
Q.7 Istheresearchstrategydevelopedfbrthewholecompany?
1.YES 2.NO
(ThosewhoansweredrlNOr.,PleasegoontoQ.8.)
=
SQ.lIngeneral,aPprOXimatelyhowlongdoesyourcompanyresearchplancover?
1.3years 2.5years 3.10years 4.Morethan15yeal’S
[コ
SQ.2Whoisthemainpersoninchargeoftheresearchplandevelopmentprocess?
1・Researcher 2・Researchleader 3.Managerofresearchmanagement
4.Headofthedivisionofresearchmanagement
5.0fncerinthedivisionofresearchmanagement 6.C.E.0.
SQ.3Whohasthepowertomakethennaldecisionovertheresearchplan?
1.C.E.0. 2.0庁icerinthedivision 3.Othero]脱cer
4・Headofthedivisionofresearchmanagement
Q・8 WhatpercentageoftheR&Dactivitybudgetisusedfbrthenewthemebudget?
=
−75−
Q・9 UponexaminingR&Dactivitiesintermsofefnciencyofinvesting,Whichofthebelow
appliestoyourcompany?
1.Itisimpossibletoratethee仔iciencyofinvestments.
2.0urcompanylSCurrentlyexaminlnganeffbctivemethodforcheckingthee栴ciencyof
investments.
3.0urcompanyalreadyhasasystemdevelopedfbrcheckingtheefnciencyofinvestments.
(Pleasedescribethemethodbrieflyinthespaceklow.)
⊂コ
Q.10Inthemainmarketthatyourcompanyserve,howmuchisthefrequencyperannumOf
newproductgenerally?
㌣
l
ow
l
l
um
medi
Vel
Y
1 2 3 4 5 6 7
[コ
Q.ll Doyoufeelthelineupofproductshandledbyyourcompanyshouldbechanged?
け
1
0W
l
l
um
medi
Very
1 2 3 4 5 6 7
ー76−
=
Q.12DoyouftelthatitisnecessarytochecktheefnciencyofR&D?
□
1.YES 2.NO
Forthosewhoanswered’’YES”forQ.12.
SQ.1Pleasechoosein orderofimportance,Whichsteps shouldbe taken to checkthe
efnciencyofR&D?
(YourmaychoosemorethanoneanSWer・)
1.Strengtheningevaluationofthemarketabilityoftheresearchtheme・
2.Checkingthesmoothnessoftechnologicaltransftrbetweentheresearch,
development,andmanufacturingdepartments・
3.Limitlngthefieldinwhichresourceswillbeinvested・
4・SettingdeadlinesforresearchprqJeCtS.
5.Other[
Q・13 Pleasechoosefrombelowwhich status applies totheposition ofthe headofR&D
CurrentlyandlOyearsago.
1.C.E.0 2.President
3.VicePresident
4・ExecutiveDirector 5・ManaglngDirector
6.Director 7.GeneralManager
10 y.
NOW
−77−
Q・14DoyoufbelitisnecessarytoholdconsortiaconcemingR&D?
(Excludethosethataresponsoredbygovernmentfunds.)
1.YES 2.NO
⊂]
SQ・1HaveyoueverattendedaconsortiumconcerningR&D?
Ifpossible,PleasewritethenameoftheprqJeCt.
1.YES NanleOfprqJeCt
2.NO
[:]
Tothosewhoanswered’’YES”:
SQ.2WastheparticipatingcompanyJqpaneseorEuropeaパAmerican?
(Iftherewerevariousconsortiaheld,pleasedescribethemosttypicalone.)
豊eSe;霊erican:霊e弧,.。ther □
SQ.3Whatwasthemotivation?Pleasechoose缶.ombelowintheorderofsignincance.
(MultipleanSWerSarePOSSible・)
1.Itcostsenormousamountofmoney.
2.Toexpandthecompany’sR&Dcapability・
3.Tomakeconnectionsoverseas.
4.Other [ ]
SQ.4DidtheprQjectsucceed?
1,YES
Thereasonitsucceededwas.‥
2.NO Thereasonitfailedwas...
一78−
Q.15 Towhatextentdoeseach
statementlistedbelow
correctlydescribeyourcompany’s
StrategleSandunderlyingvalueandbelief?Pleasecircletheapproprlatenumber.
de丘の記ly
de丘mtely
はue
hco汀eCty
1 2 3
4 5
1 2 3
4 5
1 2 3
4 5
1 2 3
4 5
5・Yourcompanycompeteshead−OnWithcompetitors
1 2 3
4 5
6.Yourcompanydoesnothesitatetodivestfrom
1 2 3
4 5
1 2 3
4 5
1 2 3
4 5
9・Yourcompanyhasbeenactivelydevelopingforelgn
markets.
1 2 3
4 5
10.Strategyformulationinyourcompanyisbased
1 2 3
4 5
1 2 3
4 5
1 2 3
4 5
1.Yourcompanyconsistentlyseekshighmarket
Shareandtriestotakeadvantageofcostefnciencies
ineverymarket.
2・Yourcompanyexploitstheadvantageofbeinga
..fbllower’.andtriestoreducerisksonthe
developmentofnewproductsand/ormarkets.
3.Yourcompanyconcentratesresourcesinafbw
StrateglCmarketsegments.
4・Thepursuitofstockholderbenentsisthoughttobe
themostirnportantsocialresponsibilitiesofyour
COmPany・
questionablebusinesses.
7.ThediversifiCationtargetsarereStrictedtothose
PrOductlineswhichhaveclosecommonalitywith
theexistlngteChnologicalbase.
8・YourcompanySelectsthemarketsegmentsin
Whichithasadvantageousandpursuescoexistence
Withcompetitors.
uponsystematicresearchdataand sophisticated
analyticalmethods.
11・Yourcompanyisalwaysaninnovatorwhich
activelytakesrisksonthedevelopmentofnew
PrOductand/ormarket.
12・Yourcompanyhasactivelyacquirednew
businesses.
−79−
血n血蛤Iy
hcorrecty
13・Therecruitmentofmanagerialpersonneland
technologiCalexpertsarebaseduponlong−range
perSOnnelplannlngratherthanimmediateneeds.
14.Thediversi抗cationtargetsarerestrictedtothose
PrOductlinesinwhichexistlngStrengthsin
marketingcanbeapplied.
15.Informationissoughtextensivelyevenonmarkets
unrelatedbusinesses.
16.Yourcompanyaimstoproducehighquality
PrOductswithhighvalueaddedtorelyonnon−PrlCe
marketingstrategy.
17・Yourcompanyemphasizesaccumulatingdiverse
baseofknow−howmorethanmakingbetteruseof
existingknow−how.
18.The basicstrategyofyourcompanylSinseparable
丘omtheunlqueValuesandbelief ofthepresent
C.E.0.ortheoriginalfounder.
19.Thefulnllmentofvarioussocialresponsibilitiesis
Clearlybuiltintothecorporatestrategyofyour
COmpany・
20・Yourcompanyhasbeenactivelyinvestlngln
foreignproductionsubsidiaries・
21.Voluntaryrecommendationsmadebylower−1evel
managersare録equentlyfollowedbysenior
executlVeS.
22.Theintuitivejudgmentofexperiencedexecutive
Playsam呵OrrOleinformulatingstrategy・
ー80−
5
Q.16Ingeneral,howmuchinfluenceandsaydoeseachofthefbllowingdepartmenthave
when makingJOlnt decisions that may determine the overallperformance ofyour
COmpany・
1itl1eorno
SOrIleのnuence
hnuence
qulteabil0f
hnuence
a伊eatdealof aveけ騨Catdeal
innuence ofinnuencC
1.R&D
l
2 3
4 5
2.Sales・Marketing
l
2 3
4 5
3.Production
l
2 3
4 5
4.Finance・Accountlng
l
2 3
4 5
5.Personnel・Laborrelations
l
2 3
4 5
6.CorporateplannlngStaff
l
2 3
4 5
7.Procurement・Purchasing
l
2 3
4 5
Q.17 Howof[endoestheR&Ddept.haveameetingwith thefollowingdept.?
nolatall fourtimesayear onceamonth onceaweek almostdaily
1.Sales・Marketing
2 3
4 5
2.Production
2 3
4 5
3.Finance・Accountlng
2 3
4 5
4.Personnel・Laborrelations
2 3
4 5
5.CorporatePlannlngStaff
2 3
4 5
6.Procurement・Purchasing
2 3
4 5
Q・18IndeterminingthefollowingsectionsoftheR&Dstrategy,howmuchinfluenceand
Saydothefbllowlngdept.have?
(1)Aboutthesettingresearchfacilities
littleorno sαne
innuence innuence
qulleabitof agreatdealof aveけ訂eatdeal
innuence innuence ofinfluence
1.Sales・Marketing
2 3 4 5
2.Production
2 3 4 5
3.Finance・Accountlng
2 3 4 5
4.Personnel・Laborrelations
2 3
4 5
5.CorporatePlannlngStaff
2 3
4 5
6.Procurement・Purchasing
2 3
4 5
ー81−
(2)Abouttheemploymentofnewemployees(OutOfcollege)
1ittleorno me
innuence innuence
qulteabitof agreatdealof averygreatdeal
hnuence のnuenCe Orif血uence
1.Sales・Marketing
1 2
3 4 5
2.Production
1 2
3 4 5
3.Finance・Accountlng
1 2
3 4 5
4.Personnel・Laborrelations
1 2
3 4 5
5.CorporatePlannlngStaff
1 2
3 4 5
6.hocuTement・Purchasing
1 2
3 4 5
(3)AboutdeterminingthedomainofresearCh
litlleorno so汀肥 quiteabitof agreatdealof averygreatdeal
innuence innuence innuence
innuence ofinnuence
1.Sales・Marketing
1 2 3
4 5
2.Production
1 2 3
4 5
3.Finance・Accountlng
1 2 3
4 5
4.Personnel・Laborrelations
1 2 3
4 5
5.CorporatePlanningstaff
1 2 3
4 5
6.Procurement・Purchasing
1 2 3
4 5
(4)Aboutdevelopingtheresearchbudget
littleorno so汀Ie
influence influence
甲lteabitof agreatdealof ave㌣許eatdeal
innuence innuence ofinnuence
1.Sales・Marketing
1 2
3 4 5
2.Production
1 2
3 4 5
3.Finance・Accountlng
1 2
3 4 5
4.Personnel・Laborrelations
1 2
3 4 5
5.CorporatePlannlngStaff
1 2
3 4 5
6.Procurement・Purchasing
1 2
3 4 5
一82−
Q.19HowmuchdothefollowingfhctorsweighinconstruCtionofR&Dstrategy?
most
sound
can’tsay
notreally
imFK)rtant imp・ Which imp・
1.ThecapabilityoftheR&Ddepartment
1 2 3 4
2・Theimportanceoftechnologyforyour
1 2 3 4
COmpany’Sfuture
3.Theexistenceoflimitationin
1 2 3 4
technologiCalknow−how
4.Costsrequiredforbreakthrough
1 2 3 4
5.Thepossibilityofbreakthrough
1 2 3 4
6.RelativeR&Dresourcesspendingln
COmParisonwithrivalcompanies
1 2 3 4
7.Competitionovercostofproducts
1 2 3 4
8.Timesandexpensesrequired
1 2 3 4
9.Willingnessoftheresearcher
1 2 3 4
10.TrendsofriValcompanies
1 2 3 4
11.Trendsingovernmental,international
1 2 3 4
prqJeCtS
12.Productline
1 2 3 4
13.Manufhctunngtechnology
1 2 3 4
14.Statesinthebusinesscircle
1 2 3 4
15.Marketneeds
1 2 3 4
16.Societalresponsibility
1 2 3 4
(environmentalproblems)
−83−
Q.20 Abouttheevaluationoftheresultsofyourresearch:
HowisthequalityOrquantltyOftheresearchevaluated,andhowoftenisitdone?
Q.21Howlongistheaverageperiodoftimeyourcompanyspendsononeresearchtheme?
□
1.one−tWOyearS 2.3years 3.5years 4.10years−
Q.22 Uponanalyzing
the
struCture
Of
your
company’s
research
themes,Whatis
perCentageOfeachtopicbelow?
1.Basicresearch
1
%
2.Researchconcernlngmainoperations
2
%
3.Researchrelatedtomainoperations
3
%
4.ResearchconcernlngneWtOPICS
4
%
5.OtheT[
5
%
T.
−84−
100 %
the
Q.23 Concerningthefbrmatofresearchfbreachtopic:WhatperCentageOfthefbllowing
fbrmatsisusedinyourcompany?
1.Individualresearch
1
%
2
%
3.Groupresearch
3
%
4.PrQjectdoneoutofyourcompany
4
%
5
%
6
%
2.Cooperativeresearch
(withindividualsinothergroups)
5.Researchcompletelydependentonoutsidesources
(tl・uStreSearCh)
6.Other[
T.
100 %
Q・24WhatpercentageofeachofthefollowingisinvoIvedintheprocessofR&D?
1.Researchwithincompany
1
%
2.Researchdonebytechnologicalintroduction
2
%
3.Trid
3
%
4.Other[
4
%
T.
100 %
Q・25IftheresearChthemescanbedividedintothe.’seeds”typeand’’needs’’type,Whatis
thepercentageofeachinyourcompany?
(Themescomeunder/Allthemes)
Percen tage
S eeds typ
e (
developed 丘om theory)
%
N eeds typ e (
due to m arketdem and)
%
T otal
100 %
ー85−
Q・26 UsingthespreadofemployeeSasarefbrence,WhatperCentageOftheR&Dactivityis
devoted to basic research,aPPlied research(development of new products,
modification of existing products),development of new production methods,
improvementofmanufacturingprocess?
1.Basic (1)AcademicResearchResearch
1
(2)Researchonnewtechnology
2.Applied(1)ResearchconcerningtheResearch
developmentofnewproducts
2
(2)Researchconcerningthe modincation
OfexistingprOducts
(
1)
%
(
2)
%
(
1)
%
(
2)
%
3.Innovationofproducttechnology
3
%
4.ImprovementofthemanufacturlngprOCeSS
4
%
5.Other [
5
%
T.
100 %
Q.27WhatperCentageOfeachofthefbllowinghavebeeninvoIvedinproposingnewtopics
fbrtheresearchhandledcurrently?
1.Theresearcherhimsel研IerSelf
1
%
2.Theresearchleader
2
%
3.Theresearchgroup
3
%
4.R&Dmanagingdepartment
4
%
5.R&Dheadofncer
5
%
6.Salesdepanment
6
%
7.Marketingdepartment
7
%
8.President
8
%
T.
10 0 %
Q.28Concerningtheresearchthemes:Whatisthenumberoftotalpropositionsandactually
fbl10Wedresearchthemes?
1.Annualtotalresearchthemepropositions
2.Actuallyhandledresearchthemes
−86−
Q.29Concerningthechoicesofresearchthemes,howdoyougraspthetechnologytrends
unknownfromopenPatentSOrdocuments?
Q.30In order to adopt to changesin the domain(rivalcompany trends,Size ofmarket,
emergence of alternative technology),does your company re−eXamineit.s R&D
Strategy?IfsowhatorwhichdepartmentisinvoIved?
1.TheresearcherprlVatelyre−eXaminesthestrategy.
2.Theresearchgroupleaderpnvatelyre−eXaminesthestrategy.
3.TheresearchmanagementdepartmentglVeSaPPrOPnateOrders.
4.TheresearchmanagementdepLandmarketingdept.re−eXaminethestl’ategytOgether.
5.Re−eXaminationorderscomefromthetop.
6.Other [
[=]
Q・31Doesyourcompanyrelyon sourcesoutsideofthecompanyfbrthedesigningofthe
researchstrategy?
1・Relyonoutside 2.Relyonassociated 3.Neverrelyon
SOurCeS
COmPanies
outsidesources
□
WhattypeofR&Dstrategiesdoyoudependonoutsidesourcestodesign?
1・AllofthecompanyR&Dsn’ategy
2・LongtermcompanyR&Dstrategy
3・R&DstrategyconcernlngneWfieldsofresearch
4・R&DstrategyconcernlngOVerSeaSPOlntS
ー87−
二
.
〓
SQ.lTothosewhoansweredlor2.
Q・32Isthereadatabasesystemsetupinyourcompanythathasintellectualabilitydata
(dissertation,Patentandsoon)abouteachresearchers?
morethan
Su抗ciel
n
u
y
S
e
t
u
p
Sufnciently
not
t
u
p
S
e
S
e
t
⊂コ
1 2 3 4 5 6 7
Q・33TowhatextentdoeseachstatementlistedbelowcorrectlydescritxBthetransitionfrom
researchresultstodevelopmentandproductionstages?
Pleasecircletheappropnatenumber.
Absolutely
true
1・Theresearcherveershis佃erownthesisthrough
moreo町 Can’tsay
less
much
not
really
doesnot
apply
1 2 3 4 5
developmentandproduction.
2・Eachstageishandledbyonepersonincharge,
1 2 3 4 5
andthenfollowedupbyanOtherforthenext
Stage.
3.Asystemissetupforsmoothtransitionbetween
1 2 3 4 5
eachstagebytakinglnCOnSiderationthe
OPlnlOnSOftheR&D,Marketingandsalesdept.
4.Sufncienttimefortransfbrofcontrol,andclose
1 2 3 4 5
COmmunicationbetweenthestagesare
neCeSSary・
Q・34 AboutthetreatmentofyourcompanyreSearChersandengineers:Whichofthebelow
appliestoyoursituation?
1.ResearchersandenglneerSaretreatedthesameasofnceemployees.
2.ResearchersandenglneerSarehandleddiffbrentlyfromthoseinofncepositionsbysettlnguPthe
SPeCialpositionsuchasheadresearchersandchiefresearchers.
3.ResearchersandenglneerSaretreatedastopexecutivesare,aSSpeCialtiesasseeninthecaseof
IBM.sResearchFellowshipSystem.
4.Other[
[=]
ー88−
Q.35Aboutyourcompany’sattitudetowardstheresearChers:Howmuchdothefbllowing
Statementapplytoit・Pleasecircleappropnatenumber・
Absolulely
true
moreor
lcss
can’tsay
much
no 血氾SnOt
really apply
1 2 3
4 5
1 2 3
4 5
1 2 3
4 5
1 2 3
4 5
1 2 3
4 5
1 2 3
4 5
1 2 3
4 5
1 2 3
4 5
9.Researchersmustadheretoregularworking
hours.
1 2 3
4 5
10.ResearchersandofBceworkersshouldbe
1 2 3
4 5
1.Everyresearchermustmakeithis/herjobto
adheretotheannualresearchplan.
2.Inordertoconductinnovativeresearch,
grantlngindependencetoaresearcheris
VerylmPOrtant・
3.Aslongaswecangetgoodresearchresults,
WeWillnotcaretheresearchprocess.
4.Under−grOundresearchshouldbedone
aggressively.
5.ItisimportanttOgeteXCellentresearch
results,eVenifittakesalongtlme.
6.Itisthejoboftheresearchertogather
informationrelatedtohis/herappointed
researChplan.
7.ResearchersandenglneerSaredifferent
PrO缶ssionandthereforeshouldbehandled
diffbrently.
8.Supervisionoverresearchersimpedesthe
abilitytothinkupcleverideas・
SuPerVisedinthesamemanner・
Q.36 Pleasedescribetheevaluadonsystemusedfbrselectingthemesbygivingexamplesof
themeschoseninthepast.
−89−
Q・37Inyourcompany,howistheR&Dbudgetplanned?PleasechoosetheanSWerthat
appliesbestfrombelow.
1・FollowingtheresearChplanusedontheoutset,eaChresearchgroupappropriatestheirownbudget.
2・Eachresearchgroupappropnatestheirownbudget,andthenR&Dmanagementdept・reducesor
increasesexpendituresaccordingtothesetbudget・
3・Aftereachresearchgroupappropriatestheirbudget,theR&Dmanagementdept.adjustseach
Subtlety,andfurther,increases thefundsforespeCiallyimportantreSearCh・
4,TheR&Dmanagementdept.takesintoregardsu叫ectivedataaccruedover theyears,andthen
distributesthemoneytoeachresearchgroup.
5・TheR&Dmanagementdoesthesameasabove,butisgreatlyinnuencedbytheopln10nOfdleSales
のpt・
⊂コ
Q・38 UponcomparingyourcompanyandWesternCOmPanyR&Dmanagement,ifyouhave
SeenanydiffbrencesinthetreatmentofR&Dmanagementbytopmanagement,Please
Sharethemwithusinthespacebelow.
Againlthankyouvery muchfbryourthoughtfulcooperation・
一90−
Annex2SimpleAggregateTables
Tablel PositionofRespondents(Q.1)
(
f ig u re l )
0 verall
Total
(
%)
126
1(
X)
E xecutive
Of6 cer
45
35.
7
G eneral
m an ager
57
4 5.
2
O lhers
U ncIcar
24
19.
0
0
0.
0
Table2SectionsWhereRespondentsarelnvoIvedinR&DStrategyDevelopment(Q.2)
(
F ig u re 2 )
O verall
Total
(
%)
126
l仙
0 verall
COm pany
73
57.
9
D epartm ent
D ivision
L ab ratory
U nclear
16
12.
7
2
1.
6
33
26.
2
2
1.
6
Table3BreakdownofR&DActivities(AccordingtoNumberofResearchThemes)(Q.22)
(
F ig u re 3 )
1
0 verall
T otal
(
%)
126
100 .
0
N o.
of
reSpOnSeS
116
9 2.
1
B asic research
11.
3
2
3
R esearch
R esearch
CO nCem lng
m ain
Operations
4 6.
4
related to
m ain
OI光ration s
24.
1
4
5
Research for
O therresearc
new fields of
CategOries
0p
e rations
1(
5.
8
U nclear
1.
4
10
7.
9
Table4BreakdownofR&DActivities(AccordingtoAllocationofPersonnel)(Q.26)
(
f ig u re 4 )
1(
1)
0 verall
T otal
(
%)
12(
i
l(
X)
.
0
N o of
reSPOn SeS
1 15
9 1.
3
1(
2)
A cadem i、
C
research
N
eW
techn ol0gy
3.
3
9.
7
2(
1)
2(
2)
3
4
5
D evelopm ent Im provem en t
D eve10pm en l M odification
O ther
f neW
O 0f
Ofnew
Of existlng
research
prd ucts
PrOducts m m 扉acturlng m anufactun n
Calegon es
m e山d s
prOCeSSeS
40 .
8
26.
3
9.
5
8.
5
1.
9
Table5AllocationofR&DPersonnel(Q.24)
(
f ig u re 5 )
l
O Yerall
Total
(
%)
126
1(
X)
.
0
2
R esearch
R ese訂Ch
b llow lng
W i血in one’
s introduction
Ofnew
N o.
of OW n COm pan y
technolo gy
reSpOnSeS
115
79 .
6
9.
0
91.
3
3
T rials
10.
0
4
0 therresearc
CategOr
i es
U nclear
1.
4
11
8.
7
3
4
5
Table6ResearchFormatbyTheme(Q.23)
(
f ig u re 6 )
1
0 verの1
T otal
(
%)
126
1㈱ .
0
N o.
of
reSpOnSeS
113
89.
7
2
lnd ividual
research
C ooperative
research
G roup
research
E xtem al
research
p叫 ecIs
7.
9
9.
8
66.
8
6,
6
4
10 yeaB Or
longer
6
C om m
i ssion−0 血er researc
ed research
form ats
8.
1
0.
7
Table7StandardResearchPeriod(Q.21)
(
f ig u re 7 )
0 verall
1
2
3
T olal
(
%)
ト2 years
3 yeaB
5 years
126
1(
X)
.
0
14
11.
1
63
50 .
0
39
3 1.
0
T a b le 8 P erce n tag e o f A n n u a l R e se arc h B u d g e t A
T otal
O verall
(
%)
12(
i
1(
泊.
0
N o.of
reSp )
n£eS
(
%)
10 1
80.
2
U nclear
A verage
(
%)
25
19.
8
(
%)
2 1.
7
5
4.
0
U n clear
5
4.
0
llocatedtoNewResearchThemes(Q.8)
ー91−
U nclear
13
10.
3
U nclear
11
8.
7
Table9FrequencyofNewTechnology(ClassinedbyIndustryType)(Q.10)
岬igure8)
Y −a X is
X −a X is
l
I n d u s tr y ty p e
In d u s tけ ty P e
lO ta l
10 ta l
V e ry
m 勾 O r C a te g o r y
Su b c a te g o r y
(% )
(% )
lo w
0 v e r a ll
O v e r a ll
12 6
1 26
2
4
23
4 1
29
1 (X ).
0
1 (X ).0
1.
6
3 .
2
1 8 .3
32 .
5
2 3、
0
C o n s tm c t io n
C o n s m lC [io n
4
4
0
0
2
2
0
0
0
0
3 .2
1 0 0 .0
0 .
0
0 .
0
50 .
0
50 .
0
0 .
0
0 .
0
0 .
0
0 .
0
in d u s はy
Food
C o n s u m p l10 m 一
r e l a le d
m an u fac n の n g
T e x tile s
in d u s t d e s
S u b −10 ta l
C h e mi
c a ls
P h a r m a c e u t ic a Is
M a te r ia l−
P a i n ts a n d
O th e r c h e mi
c a ls
P e tm le u m
re la t e d
a n d r u b t把 r
m a n u h c tu n n g
in d u s t ri e s
6
7
V e ry
U n−
h ig h
C le a r
ag e
12
7
8
4 .3 1
9 .5
5.
6
6 .3
u m
4
4
1
0
3
0
0
0
0
0
3.
2
1 (X ).0
2 5 .0
0 .0
75 .
0
0 .
0
0 .0
0 .
0
0 .0
0 .
0
4
4
0
0
0
2
2
0
0
0
3.
2
1 (X ).0
0 .
0
0 .
0
0 .0
5 0 .0
50 .
0
0 .
0
0 .0
0 .
0
8
8
1
0
3
2
6 .3
1 (X ).0
12 .
5
0 .0
3 7 .5
2 5 .0
2
2 5 .0  ̄
0
0
0
0 .0
0 .0
0 .
0
15
15
0
1
5
6
1
0
0
2
11.
9
1 (X ).0
0 .
0
6 .
7
33 .
3
4 0 .0
6 .7
0 .
0
0 .0
13.
3
10
10
0
0
1
3
4
1
1
0
7 .9
1 (X ).0
0 .0
0 .0
1 0 .0
3 0 .0
4 0 .0
1 0 .0
1 0 .0
0 .
0
3
3
0
0
0
1
2
0
0
0
2 .4
1 (泊 .0
0 ,0
0 .
0
0 .0
3 3 .3
6 6 .7
0 .
0
0 .0
0 .
0
5
5
0
0
1
2
0
1
0
1
4 .0
1 0 0 .0
0 .0
0 .0
2 0 .0
4 0 .0
0 .0
2 0 .0
0 .0
2 0 .0
3
3
0
0
0
1
2
0
0
0
1 (沿 .0
0 .
0
0 .
0
0 .0
3 3 .3
6 6 .7
0 .
0
0 .0
0 .
0
u s m e la l s
S u b −to ta l
5
5
0
0
3
1
0
0
0
1
4 .0
1 (X ).0
0 .0
0 .
0
6 0 .0
2 0 .0
0 .0
0 .0
0 .0
2 0 .0
5
5
0
0
1
3
1
0
0
0
4 .
0
1 (X ).0
0 .
0
0 .
0
20 .
0
6 0 .0
20 .
0
0 .
0
0 .0
0 ′
0
46
46
0
1
11
17
10
2
1
4
36 .
5
1 (X ).0
0 .
0
2 .
2
2 3 .9
3 7 .0
2 1 .7
4 .3
2 .2
8 .
7
l n d u s け i山 a n d o u le r
8
8
0
2
0
3
2
1
0
0
汀 は C h in e r y
6 .3
1 (X ).0
0 .
0
2 5 .0
0 .0
3 7 .5
2 5.
0
1 2 .5
0 ,0
0 .
0
M a c h in e r y −
H e a v y e l e c tT ic a l
6
6
0
0
1
2
0
1
0
2
e q u lp m e n t
4 .
8
1 0 0 .0
0 .
0
0 .
0
16 .
7
3 3 .3
0 .0
1 6 .7
0 .0
33.
3
C o m m u n i c a tio n s
4
4
0
0
l
1
0
1
1
0
e q u lP m e n t
3 .2
1 (X ).
0
0 .
0
0 .
0
25.
0
25.
0
0 .
0
25.
0
25.
0
0 .
0
D o m e s tic a p p li a n c e s
an
d c o m p o n e n t p a r ts
10
10
0
0
0
2
5
1
2
0
7 .
9
l (X ).
0
0 .
0
0 .
0
0 .0
2 0 .0
50 .
0
10 .
0
20 .
0
0 .
0
M e te r ln g a n d o th e r
5
5
0
0
0
2
1
2
0
0
e le c tri c a l e q u lp m e n t
4 .
0
1 (X ).
0
0.
0
0 .
0
0 .
0
40 .
0
20 .
0
40.
0
0 .
0
0 .
0
S h ip −b u ild in g
ind u s血 e s
M o to r v e h ic le s
P r e c is io n m a c h in e r y
S u b −tO ta l
O th e r m a n u f a c tu r ln g
tu n n g in d u s tr ie s
3
3
0
0
0
2
0
1
0
0
2.
4
1 (X ).
0
0 ,
0
0 .
0
0 .
0
66 .
7
0 .
0
3 3 .3
0 .
0
0 .
0
14
14
0
0
4
5
4
0
1
0
1 1 .1
1(泊 .
0
0 .0
0 .
0
2 8 .6
35.
7
2 8 .6
0 .
0
7 .1
0 .0
6
6
0
0
0
0
3
2
1
0
4 .8
1 (敗 0
0.
0
0 .
0
0 .
0
0 .
0
50.
0
3 3 .3
1(
3 .7
0 .
0
5 (i
56
0
2
6
17
15
4 4 .4
1 (泊 .0
0 .0
3 .6
1 0 .7
30.
4
2 6 .8
9
1 (i.1
5
2
8 .9
3 .6
3
3
0
0
0
1
1
1
0
0
2 .4
1(X ).
0
0 .0
0 .
0
0 .
0
3 3 .3
3 3 .3
3 3 .3
0 .0
0 .0
C o m m u n ic a tio n s B r o a d c a s tin g ,C O r n J rru n i−
9
a n d p u b li c u til itie s c a tio n s ,e le c tr ic p o w e r ,g a S
7 .1
U n c le a r
5
2 .4
a n d e le c tr ic w ir e
O th e r m a n u f a c −
4
M ed ト
G lass an d
N o n 一缶 m
m a n u f a c tu ri n g
3
O th e r c e r a m ic s
G e n e r a l s te e l
re la te d
2
9
1 (泊 .0
1
1
1
2
1
0
1
2
1 1 .1
1 1 .1
1 1 .1
2 2 .2
1 1 .1
0 .0
1 1 .1
2 2 .2
0
0
0
0
0
0
0
0
0
0
0 .0
0 .0
0 .0
0 .0
0 ,0
0 .0
0 .0
0 .0
0 .0
0 .0
−92−
A v e r一
3 .5 0
2 .5 0
4 .5 0
3.
50
3 .5 4
4 .
80
4 .
67
4 ,
2 5
4 .6 7
3.
2 5
4 .
(沿
4 .1 0
4 .
(X )
4 .
2 5
5.
00
5 .3 0
5.
(X )
4 .6 7
4 12 1
5 .6 7
4 .7 0
5 .(氾
3 .7 1
0 .(
X )
Table10NeedfbrChangeinProductLine(Q.1り
(Figure9)
O v e ra ll
l
V ery
10 W
2
T o lal
(% )
126
1(
X)
.
0
3
2.
4
12
9.
5
3
4
M e d i−
5
6
um
10
7.
9
30
28.
6
34
27.
0
22
17 .
5
Tablell ExistenceofSeparateDivisionfbrR&DStrategyPlanning(Q・5)
(FigurelO)
T otal (
%)
O v e ra ll
12 6
1(
拇
H av e
D o not
h a ve
U n c lea r
82
6 5 .1
42
3 3.
3
2
1.
6
Table12SectiontoWhichtheSpecialR&DStrategyDivisionBelongs(Q.5)
(Figurell)
T o lal
(倦)
0 v e ra ll
126
1(
X)
N ot
A p p li−
O fn c e or
a pp lic ab le
(% )
C a b le
(
%)
th e
p resid e n t
82
49
59.
8
44
34.
9
65 .1
1(
X)
B u siIle SS
h e ad −
R ese arc h
la の ra to ry
U n cle ar
18
8
7
22.
0
9.
8
8.
5
q u an e rS
Table13ExistenceofSpecialR&DStrategyDivisions(Q.5)
(Figure12) (ClassinedbylevelofR&Dspending)
Y −aX is
to ta l (% )
0 v era 11
−10 b il.y en
1 0 −1 5 b il.ye n
1 5 −20 b il.ye n
2 0 −30 b il.ye n
3 0 −50 b il.y e n
5 0 −10 0 b il.ye n
1(
泊−
2(
泊 b illio n y en
m o re 血 an 2 (
氾 b il.y e n
U n c le ar
Ⅹ−
a Xis
to tal (% )
H av e
D o not
have
U n cle ar
12(
i
12 6
82
42
2
10 0 .
0
1(
X)
.
0
6 5 .1
33.
3
1.
6
12
12
8
4
0
9_
5
1(
X I.
0
66 .
7
33.
3
0.
0
30
30
16
14
0
23.
8
1(
X)
.
0
53.
3
4 6.
7
0 ,
0
19
19
13
6
0
15 .
1
1(
X)
.
0
68.
4
31.
6
0.
0
26
2(
5
17
9
0
20.
6
1(
沿.
0
65.
4
34.
6
0.
0
18
18
13
4
1
14.
3
1(
X)
.
0
72.
2
22.
2
5.
6
8
8
6
2
0
6 .
3
1∝ )
.
0
75.
0
25.
0
0 .
0
3
3
2
1
0
2,
4
1∝ )
.
0
66.
7
33.
3
0 .
0
9
9
7
2
0
7 .
1
1(
X )
.
0
77.
8
22,
2
0 .
0
1
1
0
0
1
0 .
8
1(
X )
.
0
0.
0
0.
0
1α )
.
0
ー93−
7
V e ry
h ig h
4
3.
2
Un−
C lea r
5
4.
0
A ve ト
ag e
4.
39
Table14ExistenceofSeparateDivisionsforR&DStrategyPlanning(Q.5)
(Figure13) (Classifiedbyindustry)
In d u stry ly 匹
Su b −
C ate gO ry
Y −
a X is to ta l
(
啄)
Ⅹ−
a X is to tal
(
%)
H ave
D o n o t h av e
m 句O T Categ O ry
In d u str y typ
e
Se p alate d iv isi。
n
S ep a ra te d ivisio n
0 v era ll
O v erall
126
10 0 .
0
12(
i
1(
X)
.
0
82
65.
1
42
33 .
3
2
1.
6
C o n stru Ction
in d uslけ
C on stm Clio n
4
3.
2
4
1(
X)
.
0
2
50.
0
2
50 .
0
0
0.
0
Food
4
3.
2
4
1(
X)
.
0
2
50.
0
2
50 .
0
0
0.
0
relate d
m an uねC tu n n g
T ex tile s
4
3.
2
4
1(
X)
.
0
4
1(
X)
.
0
0
0.
0
0
0.
0
in d u s虹ies
Sub−
lo tal
8
6.
3
8
1 00 .
0
6
75.
0
2
25 .
0
0
0.
0
C h e m ic als
15
1 1.
9
15
1(
X)
.
0
9
60.
0
5
33.
3
1
6.
7
P h a m ac eu tlCa ls
10
7.
9
10
1(
X)
.
0
6
60.
0
4
40.
0
0
0.
0
P a in ts an d
0 山e r c h em ica ls
3
2,
4
3
1(
X)
.
0
1
33.
3
2
66 .
7
0
0.
0
relate d
P e tro le u m
and r
u b b er
5
4.
0
5
1(
X)
.
0
1
20.
0
3
60 .
0
1
20.
0
m a n uねCtu n n g
G lass a n d
O th er c eram lCS
3
2.
4
3
1(
X)
.
0
3
10 0 .
0
0
0.
0
0
0.
0
C c n era l stee l
5
4.
0
5
1∝)
.
0
4
80 .
0
1
20 .
0
0
0.
0
N o n イe 汀O u S m e ta ls
an d e le ctric w ire
5
4.
0
5
1(
X)
.
0
4
80 .
0
1
20.
0
0
0.
0
Sub−
tO ta l
46
36.
5
46
1(
X)
.
0
28
60 .
9
16
34.
8
2
4.
3
In d u strlal an d o d le r
m ac h in ery
8
6.
3
8
1(
X)
.
0
4
50 .
0
4
50.
0
0
0.
0
H e av y e lec td c al
6
4.
8
6
1(
沿.
0
4
66.
7
2
33.
3
0
0.
0
eq 山p m e n t
4
3.
2
4
10 0 .
0
3
75.
0
1
25,
0
0
0、
0
re la tcd
D o m estic a p p lian c es
an d c o rnp o n en t p arts
10
7.
9
10
1(
X)
.
0
6
60.
0
4
40.
0
0
0.
0
m an uねCtu n n g
M ete n n g an d o th e r
ele ctric al e q u lp m e n t
5
4.
0
5
1(
X)
.
0
2
40.
0
3
60 .
0
0
0.
0
S h ip −
b u ild in g
3
2.
4
3
1(
X)
.
0
3
10 0 .
0
0
0.
0
0
0.
0
M o to r v eh ic le s
14
1 1.
1
14
10 0 .
0
10
7 1.
4
4
28.
6
0
0.
0
汁の sio n m ach in e け
6
4.
8
6
1(
X)
.
0
3
50 .
0
3
50.
0
0
0.
0
Sub−
tO ta l
56
44 .
4
56
1(
X)
.
0
35
62.
5
21
37.
5
0
0.
0
O th e r m an uf ac −
tu n n g in d u str ies
O th e r m an u ねc tun n g
3
2.
4
3
10 0 .
0
3
10 0 .
0
0
0.
0
0
0.
0
C o m m u n ic a tio n s
an d p u b lic u tilitleS
B ro ad c astユ
ng ,
C O m m u n i−
C atlO n S ,
e lec tn c p o w er,g a S
9
7.
1
9
1 00 .
0
8
88.
9
1
1 1.
1
0
0.
0
0
0.
0
0
0.
0
0
0.
0
0
0.
0
0
0.
0
C o n su In p tlO n −
M ate rlal−
in d u slrie s
eq u lP m e n t
C o m m u n ic atio n s
M ach in e ry 一
in du sはies
U n c lea r
−94−
U n c le ar
Table15PositionoftheR&DDivisionHead−1981(Q.13)
(
F ig u r e 14 (1 ))
G e n era l
T o td (
%)
P re sid e n t
V ic eTp re Sid en t
E x ec u tiv e
d ire c to r
M an a g ln g
d ire c to r
12 6
1(
X)
.
0
2
1.
6
9
7.
1
24
19 .
0
34 .
9
27
21.
4
18
14.
29
2
1.
59
C o m p an ie s w ilh
Sep a rate d iv isio n
82
1(
X)
.
0
1
1.
2
7
8.
5
15
18 .
3
30
3(
5.
6
19
23.
2
10
12.
20
0
0.
(
X)
C o m p an ies w iu 10 u t
Se pa rate d iv isio n
42
1(
X)
.
0
1
2,
4
2
4.
8
9
2 1.
4
14
33 .
3
8
19 .
0
8
19 ,
05
0
0.
(
X)
U n cle ar
2
0
0
0
0
0
0
E xe cu tiv e
d irec to r
M a n ag ln g
d ire cto r
D ire c10 r
0 v e ra ll
44
D irec to r
m an ag er
U n c le ar
2
Table16PositionoftheR&DDivisionHead−1991(Q.13)
t P lg u re ll叫 ∠〃
G e n eral
U n c le ar
T o ld (
%)
P re sid en t
V ice −
P re Sid en t
0 v crall
1 26
1(
X)
.
0
5
4.
0
20
15 .
9
28
2 2.
2
40
31.
7
20
15.
9
m an ag e r
11
8.
73
C o m p a血 es w i血
Se p ara te d iv isio n
82
1(
X)
.
0
2
2.
4
12
14 .
6
24
29 .
3
26
31.
7
12
14.
6
6
7.
32
0
0.
(
X)
C o m p a n ies w ith o u t
Se P ara te d iv isio n
42
1(
敗0
3
7.
1
8
19 .
0
4
9.
5
14
33.
3
8
19 .
0
5
1 1,
90
0
0.
(
X)
U n clear
2
0
0
0
0
0
0
Table17ChangeinthePositionoftheR&DDivisionHead(Comparisonbetweenl981and1991)(Q・13)
(Figure15)
T o tal (% )
P o sitio n
P o silio n
u p g rad e d
re m ain ed u le
Sa m e
P o sitio n
d o w n g ra de d
U n c le ar
0 v erall
126
1(
X)
.
0
54
42.
9
53
4 2 .1
17
13.
5
2
1.
6
C o m p an ie s w ith
Se p ara te d iv is io n
82
1(
X)
.
0
34
4 1,
5
39
47.
6
9
11.
0
0
0.
0
C o m p a n ie s w i血Ou t
Se P ara te d iv is io n
42
1(
X)
.
0
20
47.
6
14
33 .
3
8
19 .
0
0
0.
0
U n c lea r
2
0
0
0
2
Table18NeedtoImproveR&DEfficiency(Q.12)
(
F i2 u re 1 6 )
T o tal (
%)
n e re is a
T h ere is n o
n e ed
n ee d
U n cle ar
O v erall
126
1(
X)
,
0
12 6
1(
敗0
0
0.
0
0
0.
0
C o m p an ie s w
i th
Se p ara te d iv is io n
82
10 0 .
0
82
1α)
.
0
0
0.
0
0
0.
0
C o m p a n ies w iぬo u t
Se P ara te d iv isio n
42
1∝)
.
0
42
1α)
.
0
0
0.
0
0
0.
0
U n clea r
2
2
0
0
Table19MeasurestoImproveR&DEfnciency(Q.12)
(F ig u re 1 7 )
E v alu a tin g
T o tal (
%)
m ark e lab ility
Of resc arch
th em e s
F ac ilita tln g
S e t血 g tim e −
tec h n o lo g y
けan s托r
L im itl喝
1im ils b r
0 血e r
rese arch fie ld s
re sea rc h
p rq leC tS
m e aSu reS
U n c lear
O v cra11
1 2(
i
1(
敗0
24
19.
0
26
20.
6
70
55.
6
1
0.
8
l
0.
8
4
3.
17
C o m p 揖lies w i血
SeP a rate d iv isio n
82
1(
沿.
0
16
19 .
5
lb
19 .
5
4(
i
56.
1
1
1.
2
0
0.
0
3
3.
66
C o m p a血c s w i也o u t
Sep a rate d iY isio n
42
1(
X)
.
0
8.
19 .
0
10
23.
8
22
52.
4
0
0,
0
1
2.
4
1
2.
38
U nc le a∫
2
0
2
0
0
0
0
−95−
2
1.
59
0
Table20EvaluatingInvestmentEfkctivenessofR&D(Q.9)
(
F ig u r e 1 8 )
E x am in ln £
1m 匹)
S Sib le
to eY a lu ate
e ffec tive
ev a lu atio n
m e th o d
A lre ad y
have an
U n c le ar
O ve rall
126
1(
沿.
0
23
18 .
3
86
68.
3
e ffec tive
ev 山u atio n
Sy Stem
14
1 1.
1
C o m p an ies w ith
82
10 0 .
0
14
17 .
1
57
69.
5
10
12 .
2
1
1,
2
Sep a ra te d iv isio n
42
1∝I.
0
9
21.
4
29
69.
0
4
9.
5
0
0.
0
U n c le ar
2
0
0
0
2
T om l
(
%)
Se p arate d iv isio n
C o m p an ie s w
i ulO u l
3
2.
4
Table21InnuenceofEachDivisiononMattersthatAffbctOverallCompanyPerformanCe(Q.16)
(
P ig u re s l 9 & 2 0 )
l
D iv
i sion
0 v erall
S ales a nd
m 訂k etin g
M an u fa ctu rm g
R &D
T o ta l
(
%)
12 6
1(
X)
.
0
2
3
C o n sid −
4
L ittle o r n o
in flu en c e
Som e
in fLu en c e
0
0.
0
2
1,
6
20
15.
9
56
44 .
4
e ra b le
irln u en C e
5
E xtfe m ely
G re at d e al
h igh d e g re e
O f influ e n ce
O f in flu e n ce
U n c lea r
A v e rag e
47
37.
3
1
0.
8
4.
18
C o m p an le S W i血
Se p ara te d iv isio n
82
1α)
.
0
0
0.
0
0
0.
0
12
14.
6
38
46.
3
32
39.
0
0
0.
0
4.
24
C om pa
n ie s w ith ou t
Se P ara te d iv isio n
42
1∝)
,
0
0
0.
0
2
4.
8
8
17
40.
5
15
35.
7
0
0.
0
4.
07
19.
0
U n c lea r
2
0
0
0
1
0
1
0 v erall
12 6
1(
X)
.
0
0
0.
0
13
10 .
3
37
29.
4
48
38.
1
23
18.
3
5
4.
0
3.
67
C o m p むlie s w ith
Se p ara te d iv isio n
82
1(
泊.
0
0
0.
0
5
26
31.
7
32
39.
0
15
18 .
3
4
4.
9
3.
73
6.
1
C o m p a n ies w
i th ou t
Se p arate d iv isio n
42
1α)
.
0
0
0.
0
8
19 .
0
10
23.
8
16
38.
1
8
19.
0
0
0.
0
3.
57
U n c lea r
2
0
0
1
0
0
1
0 v er山1
12 6
1α)
.
0
2
1.
6
20
15,
9
32
25.
4
41
32.
5
29
23.
0
2
1.
6
3.
顔)
C o m p a n ie s w
i th
Se P arate d iv isio n
82
1(
X)
.
0
0
0.
0
13
15.
9
23
28.
0
23
28.
0
22
26.
8
1
1.
2
3.
67
C om pa
n ies w
i th ou t
Se P arate d iv isio n
42
1(
X)
.
0
2
4.
8
7
16.
7
9
21.
4
17
40.
5
7
16 .
7
0
0.
0
3.
48
U n c lea r
2
0
0
0
1
0
1
O v erall
12 6
1(
X)
.
0
4
3.
2
15
11.
9
32
25.
4
50
39.
7
23
18.
3
2
1.
6
3.
59
C o Il甲a血e s w i血
8
Se P ara te d iv isio n
82
1(
Ⅹ)
.
0
1
1.
2
9.
8
20
24.
4
37
45.
1
16
19 .
5
0
0.
0
3.
72
P reside n ピs o fn c e
a n d p lan n in g
C o m p an ie s w i血ou t
Se P ara te d iv isio n
42
1(
X)
.
0
3
7.
1
7
1(
5.
7
12
28.
6
12
28.
6
7
16 .
7
1
2.
4
3.
32
U n c lea r
2
0
0
0
1
0
1
O v erall
12 6
1(
X)
.
0
0
0.
0
23
18.
3
48
38.
1
45
35.
7
9
7.
1
1
0.
8
3.
32
C o m p an ie s w ith
Se p ara te d ivisio n
82
1(
X)
.
0
0
0.
0
14
17.
1
30
36.
6
30
36.
6
8
9.
8
0
0.
0
3.
39
C o m p an ie s w ith o u t
Se p ara te d ivisio n
42
1∝)
,
0
0
0.
0
9
21.
4
18
42.
9
14
33.
3
1
2.
4
0
0.
0
3.
17
U n c le ar
2
0
0
0
1
0
1
O v era ll
12 6
1(
X)
.
0
7
5.
6
53
42.
1
39
31.
0
22
17 ,
5
3
2.
4
2
1.
6
2.
69
F in a
n Ce a
n d
acc o u n 血 g
S u p p lie s a
n d
C o m p an ies w 抽
82
4
32
27
15
Sep a ra te d iv isio n
1(
X l.
0
4.
9
39.
0
32.
9
18 .
3
3
3.
7
1
1.
2
2.
77
p urc h asi喝
C o m p a山es w i血o u t
SeP a rate d iv isio n
42
1(
X)
.
0
2
4.
8
21
50.
0
12
28.
6
7
16 .
7
0
0.
0
0
0.
0
2.
57
G en e ra l atfaifS,
匹 B O nn e l,ガ山
1a b r m an 喝e m en t
U n cle ar
2
1
0
0
0
0
1
0 v er all
126
1 ∝)
.
0
11
8.
7
4(
う
3(
5.
5
51
40.
5
14
1 1.
1
3
2.
4
1
0.
8
2.
62
C o m p a 山es w 仙
Sc p am te d iY isio n
82
1㈱ .
0
6
7.
3
26
3 1.
7
37
45.
1
12
14 .
6
1
1.
2
0
0.
0
2.
71
C o m p an ies w
i th o u t
Se p arate d iv isio n
42
1(
X)
.
0
4
9.
5
20
47.
6
14
33.
3
2
4.
8
2
4.
8
0
0.
0
2.
48
U n clear
2
1
0
0
0
0
1
ー96−
Table22MethodsofFormulatingR&DBudgetPlans(Q・37)
(
F ig u re 2 1)
A dditional
funds
E ach
Total
(
%)
N eeds
evd uated
based on
rese訂Ch
apprOprト
grOup
U nifonu ly ated un der 0句ectivc
Calculates increased o
data and
a Separate
its ow n
fram ew ork
funds
reduced
budget
for researc
allocated
requlre一
reg ad ed as according
m ents
im 匹)
rtan t to prlOrlties
74
6
28
15
4.
8
22.
2
58 .
7
11.
9
V iew s of
m ∬keling
division are
greatly
U ncleaf
renected in
rund s
allocalion
0
0.
0
3
2.
4
9
11.
0
0
0.
0
2
2.
4
22
52.
4
5
11.
9
0
0.
0
0
0
1
0
0.
0
0
D o not
U n cle ar
10 y e ars
15 y ea rs o r
U n clear
O verall
126
1∝)
.
0
C om panies w ith
SeParate div
i sion
82
1(
X I.
0
2
2.
4
17
20.
7
52
63.
4
C o m panies w idlOut
Separate divisjon
42
1(
X)
.
0
4
9.
5
11
2(
i.
2
U nclear
2
0
1
Table23CompanyResearchPlan(Q.6)
(
F ig u re 2 2 )
T o tal
(
%)
R e p are a
p l乱
n
O v e ra ll
126
1∝)
.
0
10 2
8 1.
0
19
15 .
1
5
4.
0
C o m p an k s w 仙
SeP a rate divisio n
82
1(
X l.
0
69
84.
1
10
12 .
2
3
3.
7
C o m p an ie s w
i d lO u t
Sep a rate d iv isio n
42
1(
X)
.
0
32
76.
2
9
2 1.
4
1
2.
4
U llC lea r
2
1
0
1
p re p are a
p lan
Table24PeriodofCompanyResearchPlan(Q.6)
(
F i2 u re 2 3 )
T otal
A pp lica b le
(
%)
3 y e ars
5 y e ars
m O re
N Ot
ap p lica b le
0 v e ra ll
12 6
10 2
1(
X)
.
0
41
40.
2
50
49 .
0
10
9.
8
0
0.
0
1
1.
0
24
C o m p aのe s w i血
Sep ar ate d iv isio n
82
69
1(
X )
.
0
28
40.
6
34
49.
3
7
10 .
1
0
0.
0
0
0.
0
13
C o m p an ie s w
i th o u t
Sep a rate divisio n
42
32
1(
泊.
0
13
40.
6
16
50 .
0
3
9.
4
0
0.
0
0
0.
0
10
U n c le ar
2
1
0
0
0
0
1
1
Table25ResponsibilityfbrPreparationofCompanyResearchPlan(Q.6)
(
F ig u r e 2 4 )
T o tal
0 v era li
126
A p p lica b le R e se arc he r
(
%)
R e sea rc h
lea d er
R e se afC h
H e a d of
R e se arc h
C o m p an y
m an ag e−
m en t
0 什ic er
re sea rc h
m an ag e 一
m en t
d irec to r
P reSide n t
m a n ag e −
m en t
d iv isio n
U n c lear
N ol
ap p lica b le
24
10 2
1
28
33
0
2
1.
0
27 .
5
5
4.
9
33
1榊 .
0
32.
4
32.
4
0.
0
2.
0
C o m p an ie s w ith
Sep ar ate d ivisio n
82
69
1(
X)
.
0
0
0.
0
17
24 .
6
4
5.
8
23
33.
3
25
36,
2
0
0.
0
0
0.
0
13
C o m p an ie s w i血o u t
42
32
1(
X )
.
0
1
3.
1
11
34 .
4
l
3.
1
10
31.
3
8
25.
0
0
0.
0
1
3.
1
10
Sep ar ate d ivisio n
U n c le ar
2
1
0
0
0
0
0
0
1
1
H e a d of
re se∬C h
U n cle ar
N ot
ap p lic ab le
Table26ApprovingAuthorityforCompanyResearchPlan(Q.6)
(
F ig u r e 2 5 )
T o tal
A p p lica b le
(
%)
C om pany
R e s匹)
n Si−
p re sid en l b le d irec to r
O th e r
d irec to r
m an ag e −
m en t
d iv isio n
0 v era ll
1 26
102
100 .
0
36
35.
3
58
56.
9
2
2.
0
6
5.
9
0
0.
0
24
C o m p a n ie s w ith
Se P ara te d iv ision
82
69
1(
X)
.
0
23
33.
3
41
59.
4
1
1.
4
4
5.
8
0
0.
0
13
C o m p a n ie s w i血o u t
Se p ara [
e d iv ision
42
32
1∝)
.
0
12
37.
5
17
53.
1
1
3.
1
2
6.
3
0
0.
0
10
U IICle ar
2
1
1
0
0
0
0
1
胃97−
Table27FormulationofCompanyResearchStrategy(Q.7)
(Figure26)
D o not
fo rm u la le
To[
d
(
%)
F o rm u la te
0 v eTa ll
12(
i
1(
X)
.
0
95
75.
4
23
18 .
3
8
6.
3
C o m p an ie s w i血
SeP ara te d iv ision
82
1 α)
.
0
73
89.
0
7
8.
5
2
2.
4
Sはate gy
U n c le ar
Sはate g y
C o m p a n ie s w 油 o u t
42
21
Se p arate d lV isio n
1(
X)
.
0
50 .
0
lh
38.
1
5
1 1.
9
U n c lea r
2
1
0
1
Table28PeriodofCompanyResearchStrategy(Q.7)
(Figure27)
T b ta l
A p p lica b le
(
%)
3 ye ars
5 y ea rs
10 y ea rs
15 y ea rs o r
m O re
U n cle ar
N ot
ap p lica ble
O v erall
126
95
1(
X)
.
0
18
18 .
9
41
43.
2
33
34.
7
1
1.
1
2
2.
1
31
C o m p a n ie s w
i th
Se p ara le d iv isio n
82
73
1(
相.
0
16
2 1.
9
26
35 −
6
29
39 .
7
1
1.
4
1
1.
4
9
C o m p a 血e s w i血o u t
42
21
10 0 .
0
2
9.
5
15
7 1.
4
4
19 .
0
0
0.
0
0
0.
0
21
2
1
0
0
0
0
1
1
Se p aIa le d iv isio n
U n c lea r
Table29ResponsibilityforFormulationofCompanyResearchStrategy(Q.7)
(Figure28)
R e se arch
T o td
A p p lica b le
(
%)
H e ad o f
R e sea rc h er
R e se arc h
le ad er
m an ag e −
m en l
O fric er
re sea rc h
m an ag e −
m en t
d iv is io n
R ese arch
m an a ge −
m ent
d ire cto r
C o m p an y
pre sid en l
U n c le ar
N ol
a p p lic ab le
O v e ra ll
12 6
95
1 00 .
0
0
0.
0
6
6.
3
3
3.
2
31
32.
6
51
53.
7
2
2.
1
2
2 .1
31
C o m p a肺 S W i血
SeP a rate d iv isio n
82
73
10 0 .
0
0
0.
0
4
5.
5
2
2.
7
25
34.
2
40
54.
8
2
2.
7
0
0.
0
9
C o m p an ie s w ith o u l
Sep ar a[
e d iv isio n
42
21
1(
敗0
0
0.
0
2
9.
5
1
4.
8
6
28.
6
11
52.
4
0
0.
0
1
4.
8
21
U n clear
2
1
0
0
0
0
0
0
1
1
U n c le ar
N ot
a p p lic ab le
Table30ApprovingAuthorityforCompanyResearchStrategy(Q・7)
(Figure29)
H e ad o f
T o tal
A p p lic ab le
(
%)
C o m p an y
P reSide n t
R esp o n si−
b le d ire c l0 r
O th er
d ire ctor
rese arch
m an a g e−
m en t
d ivisio n
0 v erall
126
95
1 00 .
0
52
54.
7
39
4 1.1
1
1.
1
2
2 .1
1
1.1
31
C o llp a n ies w ith
Sep arate d iv ision
82
73
1 00 .
0
40
54.
8
31
42.
5
0
0.
0
2
2.
7
0
0.
0
9
C o m p a n ie s w idlOu t
Se p arate d iv ision
42
21
100.
0
り
52.
4
8
1
4.
8
0
0.
0
1
4.
8
21
3 8 .1
U n c lear
2
1
1
0
0
0
0
1
−98−
Table31ConsiderationsintheFormulationofR&DStrategy(1)(Q.19)
(Figures30&31)
3
4
5
Im p o rtan t
C a n n o t sa y
e i血er w ay
N o I v ery
im p o rt卸 t
N ot
im p o rla血
U n L:
le ar
A r e
Ve ag
72
5 7 .1
49
38.
9
2
1.
6
1
0.
8
0
0.
0
2
1,
6
1.
45
82
1(
X)
.
0
53
64.
6
26
3 1.
7
1
1.
2
l
1.
2
0
0.
0
1
1.
2
1.
38
42
1(
X)
、
0
18
42.
9
23
54.
8
1
2.
4
0
0.
0
0
0.
0
0
0.
0
L 60
1
T o tal
(%)
V ery
in lP )n an l
0 v era ll
12(
i
l(
X)
.
0
C o m p an ie s wi th
Se P ara te d iv isio n
C o m p an ie s w ith o tlt
Se p ara te d iv isio n
Ite m
Im F )
rtan C e O r
te ch n o lo g y
M ar ke t n ec d s
2
U n c le ar
2
1
0
0
0
0
1
O v e ra ll
12 (
)
100 .
0
59
46.
8
60
47.
6
5
4.
0
0
0.
0
0
0.
0
2
1.
6
1.
5(
i
C o m p an ie s wi th
SeP a ra te d ivi sio n
82
10 0 .
0
41
50.
0
3(
)
43.
9
4
4.
9
0
0.
0
0
0.
0
1
1.
2
l.
54
C o m p 乱n ie s w ith o u l
Sep a ra te d iv isio n
42
1(
X)
.
0
17
40.
5
24
5 7 .1
1
2.
4
0
0.
0
0
0.
0
0
0.
0
1.
62
1
U n c le ar
2
1
0
0
0
0
0 v era ll
12 6
59
57
5
4
0
l
1(
X)
.
0
4(
1.
8
45.
2
4.
0
3.
2
0.
0
0.
8
1.
63
C a p ab ility o f
C o m p an ie s w ith
Se p ara te d iv isio n
82
l(
X)
.
0
42
5 1,
2
35
42.
7
3
3.
7
2
2.
4
0
0.
0
0
0.
0
1.
57
R &D d iv isio n
C o m p 乱n ic s w ith o u t
SeP a rate d iv isio n
42
10 0 .
0
17
40.
5
21
50.
0
2
4.
8
2
4.
8
0
0.
0
0
0.
0
1.
74
U n c le ar
2
0
1
0
0
0
1
0 v era ll
126
1(
X)
.
0
42
33.
3
64
50.
S
15
11.
9
4
3.
2
0
0.
0
0.
g
1
1.
85
P ro d u c t co St
C o m p am ie s w ith
Se p a ra te d iv isio n
82
10 0 .
0
32
39.
0
42
5 1.
2
5
6.
1
3
3.
7
0
0.
0
0
0.
0
1.
74
C O m pe tltiv en ess
C o m p an ie s w ith o u t
Se p ara te d ivisio n
42
1(
X)
,
0
9
2 1.
4
22
52.
4
10
23.
8
1
2.
4
0
0.
0
0
0.
0
2.
07
S o c ial
re sp on sib ility
T ren d s o f
CO m p C tito rs
C o st an d
pe riod req u ire d
R e se arc h ers ’
en th u s iasm
U llC le ar
2
1
0
0
0
0
1
O v era ll
126
35
74
2
26.
2
58.
7
1
0.
8
0
100 .
0
16
12.
7
0.
0
1.
6
82
100 .
0
26
3 1.
7
44
53.
7
11
13.
4
0
0.
0
0
0.
0
1
1.
2
1.
81
S ep a ra te d ivisio n
C o m p an ie s w ilh o u t
Se p ara te d ivisio n
42
1(
沿.
0
6
14 .
3
30
7 1.
4
5
11.
9
1
2.
4
0
0.
0
0
0.
0
2.
02
C o m p a血 e s w ith
1,
88
U n c lea r
2
1
0
0
0
0
1
0 v era ll
126
10 0 .
0
27
2 1.
4
85
67.
5
12
9.
5
1
0.
8
0
0.
0
1
0.
8
】.
90
C o m pan ie s w ith
Se P ara te d ivision
82
1(
X)
.
0
18
22.
0
58
70.
7
5
6.
1
1
1.
2
0
0.
0
0
0.
0
1.
87
C o m p an ie s w iulO u t
Se p ara te d ivisio n
42
10 0 .
0
9
2 1.
4
27
64.
3
6
14.
3
0
0.
0
0
0.
0
0
0.
0
1.
男
U n c le ar
2
0
0
1
0
0
1
O v erall
126
1(
X I、
0
28
22.
2
80
63.
5
11
8.
7
5
4.
0
0
0.
0
2
1.
6
1.
94
C o m p am e s w ith
Se p ara te d iv isio n
82
10 0 .
0
21
25.
6
53
64 .
6
5
6.
1
2
2.
4
0
0.
0
1
1.
2
1.
85
C o m p an ie s w ith o u t
Se P ara te d ivi sion
42
100 .
0
7
16.
7
26
61.
9
6
14.
3
3
7.
1
0
0.
0
0
0.
0
2 .12
U n c le ar
2
0
1
0
0
0
0 v era ll
126
100 .
0
32
25.
4
66
52.
4
22
17.
5
4
3.
2
0
0.
0
2
1.
6
1.
98
C o m p a n ies w ith
82
1(
敗0
23
28.
0
44
53.
7
13
15.
9
2
2.
4
0
0.
0
0
0.
0
1.
93
Se P ara te d ivi sio n
C o m p a山 es w ilh o 融
Se p arate d iv isio n
42
1(沿.
0
9
21.
4
22
5 2.
4
8
19 .
0
2
4.
8
0
0.
0
1
2.
4
2.
07
U n clear
2
0
0
1
0
0
1
−99−
1 .
Table32ConsiderationsintheFormulationofR&DStrategy(2)(Q.19)
(
F ig u r e s 3 0 & 3 1 )
l
lec h n o lo g y
3
4
5
C 机 n O t Sa y
N ol
im I的ru n t
U n c le ar
eith e r w a y
N o t v e ry
i叫 耕 地 11
A v erag e
19
15 .
1
6
4.
8
0
0.
0
】
0.
8
2.
12
0
0
2.
09
0.
0
0.
0
V e ry
im p o 爪an t
O ve rall
12 (
i
1(
X)
.
0
10
12 .
7
C o m p an ie s w ith
Sep a ra te div isio n
82
1(
X)
.
0
13
54
10
5
15 .
9
65.
9
12 .
2
6.
1
C o m p an ie s w ith o u t
Sep ara te d iv isio n
42
1α)
.
0
3
7.
1
29
69.
0
9
21.
4
l
2.
4
0
0.
0
0
0.
0
Ile m
P ro d u c tio n
2
T o lal
(
%)
1m F )
山肌 [
84
66 .
7
U n c le ar
2
0
1
0
0
0
1
0 v era ll
12 6
1(
X I.
0
17
13 .
5
79
62.
7
23
4
2
1
18 .
3
3.
2
1.
6
0.
8
P o ssib ility o f
2.
19
2.
16
ach ie v ln g
C o m p an ie s w ith
10
12 .
2
57
69.
5
2
15 .
9
2.
4
0
0.
0
0
0.
0
2.
09
SeP a ra te d iv isio n
82
1(
X)
.
0
13
a b re ak th ro ug h
C o m p an ie s w 仙 o u t
Se p ara te d ivisio n
42
1(
X)
.
0
7
16 .
7
21
50.
0
10
23.
8
2
4.
8
2
4.
8
0
0.
0
2.
31
P o sition in
ind u sth al c ircle s
P r(
d uc t lin e
U n c lea r
2
0
1
0
0
0
1
0 v e ra ll
12 6
1(
X)
.
0
17
13 .
5
76
60.
3
23
18 .
3
8
6.
3
0
0.
0
2
1.
6
2.
18
C o m p an ie s w ilh
Se p a ra te d iv isio n
82
1(
X)
.
0
9
1 1.
0
54
65.
9
13
15.
9
5
6.
1
0
0.
0
1
1.
2
2.
17
C o m p an ie s w
i th o u t
Se p ara te d ivisio n
42
1(
泊.
0
7
1(
i.
7
22
52.
4
10
23.
8
3
7.
1
0
0.
0
0
0.
0
2.
21
U n c le af
2
l
0
0
0
0
1
0 v e ra ll
12 6
1(
X)
.
0
10
12 .
7
68
54.
0
35
27.
8
4
3.
2
l
0.
8
2
1.
6
2.
24
C o m p an ie s w ilh
Se P a ra te d iv isio n
82
10 0 .
0
13
15 .
9
45
54.
9
19
23.
2
3
3.
7
1
1.
2
1
1.
2
2.
19
C o m p an ie s w i血o u l
Se p a ra te d iv isio n
42
1(
X)
.
0
3
7.
1
22
52.
4
lb
38.
1
1
2.
4
0
0.
0
0
0.
0
2.
36
0
1
1
U n cle ar
2
0
1
0
0
0 ve rall
12 6
3
62
43
16
1(
X)
.
0
2.
4
49 .
2
34.
1
12 .
7
1
0.
8
0.
8
2.
60
C o sts re q u ire d to
C o m p an ie s w ith
SeP a ra te div isio n
82
1(
粕.
0
3
3.
7
45
54.
9
27
32.
9
7
8.
5
0
0.
0
0
0.
0
2.
46
ac h ie v e
a brca k 血m u gh
C o m p an ie s w ith o u t
Sep a rate d iv isio n
42
1(
X)
.
0
0
0.
0
17
40 .
5
15
35.
7
9
2 1.
4
1
2.
4
0
0.
0
2.
86
U nc le ar
2
0
0
1
0
0
1
O v e ra ll
12 6
1(
X)
.
0
6
4.
8
55
43.
7
47
37.
3
13
1
0.
8
2.
63
10 .
3
4
3.
2
82
1(
X)
.
0
5
6.
1
1h
43.
9
33
40.
2
7
8.
5
1
1.
2
0
0.
0
2.
55
14
33.
3
6
14 .
3
3
7.
1
0
2.
81
0.
0
R es ou rce s
Spe n d in g
C o m p an ie s w ith
re la tiv e to
SeP a ra te d iv isio n
th at o r th e
C om pa
n ie s w
i th o u t
42
1
18
C O m p e tito rs
SeP a rate d iv isio n
1(
X)
.
0
2.
4
42 .
9
U nc le ar
2
0
1
0
0
0
l
O ve rall
12 6
1(
X I.
0
5
4.
0
50
39 .
7
57
45.
2
12
9.
5
1
0.
8
1
0.
8
2.
63
2.
56
L im
i tatio n s in
C om pa
n ie s w ith
82
4
36
34
8
0
0
[
e Ch n o lo g y
SeP a ra te div isio n
1(
X)
.
0
4.
9
43 .
9
4 1.
5
9.
8
0.
0
0.
0
C om pa
n ies w ith o u t
Se P arate d iv isio n
42
1(
X)
.
0
1
2.
4
13
31.
0
23
54.
8
4
9.
5
1
2.
4
0
0.
0
U n cle ar
2
0
1
0
0
0
1
0 v erall
12 6
10 0 .
0
5
4.
0
49
38 .
9
54
42 .
9
16
12 .
7
1
0.
8
1
0.
8
2.
67
C o m p an ies w ith
Se p ara te d iv isio n
82
1(
泊.
0
5
6.
1
3(
I
43.
9
32
39 .
0
9
11.
0
0
0.
0
0
0.
0
2.
55
C o m p an ies w
i th o u t
Se p ara te d iv ision
42
1(
泊.
0
0
0.
0
13
31.
0
22
52 .
4
6
14 .
3
1
2.
4
0
0.
0
2.
88
U n c lea r
2
0
0
0
1
0
1
T re n d s in
n a tio n al an d
in te m a tio n al
P rく
わ∝ B
ー100−
2.
79
Table33ResponsibilityforReviewofR&DStrategy(Q.30)
畔igure32)
R e se arch
In d iv id u al
R e sea rc h
rese arch e r
gro u p le ad er
R e se arch
m a n ag e m e n t
d iv isio n
T o la l
(% )
m an 喝 em e n t
d iv isio n an d
m ark etin g
d iv ision
re vie w R & D
Slra teg y
to g eth e r
R e v iew
C a汀ie d o u t
u n d er
in st u c tio n s o l−
O th ers
U n clear
3e llio r
m an a g en le n t
O v erall
126
1(
敗 0
1
0.
8
14
11.
1
28
22 .
2
39
31.
0
19
15 .1
18
14 .
3
7
5.
6
C o m p an ie s w ith
Se p ara te d iv is io n
82
1(
X)
.
0
0
0.
0
7
8.
5
21
25 .
6
29
35.
4
13
15 .
9
8
9.
8
4
4.
9
C o m p a n ies wi th o u t
Se P arate d iv isio n
42
1(
X)
.
0
1
2.
4
7
16.
7
7
16 .
7
10
23.
8
6
14 .
3
10
23.
8
l
2.
4
U n c lear
2
0
0
0
0
0
0
2
N e ce ssa ry
N o t n ec essa 丹
U n c le ar
83
Table34NecessityofConsortia(Q.14)
(Figure33)
T o td
(
%)
O v erall
126
1(
X)
.
0
65.
9
39
31.
0
4
3.
2
C o m p an ie s w ith
Se P arate d iv iざ
io n
82
10 0 .
0
61
74.
4
19
2 3.
2
2
2.
4
C o m p a n ies w
i th o u t
Se p arate d iv is io n
42
1(
X)
.
0
21
50.
0
20
47 .
6
1
2.
4
U n c lea r
2
1
0
1
Table35NecessityofConsortia(Class摘edbyScaleofR&DExpenditure)(Q.14)
畔igure34)
0 v e r a ll
−1 0 b il .y e n
1 0 −1 5 b il.y e n
1 5 −2 0 b il.y e n
2 0 −3 0 b 丑 y e n
3 0 −5 0 b il.y e n
5 0 −1 (氾 b il.y e n
1 ㈱ −2 (氾 b illio n y e n
m o re th 礼n 2 ∝ )b il .y e n
U n c le a r
Y −a X i s to ta l
X −a X is to ta l
(% )
(% )
N ec e ss訂 y
N o t n e c e ss ar y
U n c le a r
12 6
1 2 (5
83
39
4
1(
X ).0
1 (X ).0
6 5 .9
31.
0
3 .2
12
12
9
2
1
9 .5
1(
X ).0
7 5.
0
16 .
7
8 .3
30
30
23
7
0
2 3 .8
1 (X ).0
7 6 .7
2 3 .3
0 .0
19
19
13
6
0
1 5 .1
1 (X ).
0
6 8 .4
31.
6
0 .0
26
2 (i
14
11
1
2 0 .6
1 ∝ I.0
5 3 .8
4 2 .3
3 .8
18
18
13
5
0
1 4 .3
1 (泊 .
0
7 2 .2
2 7 .8
0 .0
8
8
5
3
0
6 .
3
1 (敗 0
6 2 .5
3 7 .5
0 .0
3
3
2
1
0
2 .4
1 ∝ ).
0
6 6 .7
3 3 .3
0 .0
9
9
4
4
1
7 .1
1 α ),
0
4 4 .4
44 .
4
1 1 .1
1
1
0
0
1
0 .
8
1(
泊 .
0
0 .0
0 .0
1 ∝ ).0
ー101−
Table36NecessityofConsortia(ClassinedbyIndustryType)(Q・14)
(Pigure35)
ln d u stけ ty p e
Sub −
C ate gO 丹
Y −
aX is b tal
(
%)
X −
aX is tO tal
(
%)
N ec e ss ∬y
N 。t n e Ce SS訂y
U n c le ar
m a lO r C a teg O ry
In d uぷtry ty 匹
O v e ra ll
O ve rall
12 6
100.
0
12 (
i
llX )
.
0
83
65.
9
39
3 1.
0
4
3.
2
C o n stru ction
in du slけ
C o n stru c tio n
4
3.
2
4
1(
敗0
4
1(
X)
.
0
0
0.
0
0
0.
0
F o od
4
3.
2
4
1(
X)
.
0
2
50.
0
2
50.
0
0
0.
0
re late d
m an ufa ctu d n g
T ex tiles
4
3.
2
4
l(
X)
.
0
4
10 0 .
0
0
0.
0
0
0.
0
in d u stries
S ub胃
tO tal
8
6.
3
8
1(
X)
.
0
6
75.
0
2
25 .
0
0
0.
0
C h e m ic als
15
11.
9
15
1(
X)
,
0
7
46.
7
8
53 .
3
0
0.
0
P h afm aCe u tic als
10
7.
9
10
1α)
.
0
6
60.
0
3
30 .
0
1
10.
0
M a ted aト
P ain ts an d
0 血er c he m lC als
3
2.
4
3
1(
X)
.
0
3
10 0 .
0
0
0.
0
0
0.
0
relate d
P eは0 1eu m
廻ld n lb be r
5
4.
0
5
1(
X)
.
0
3
60.
0
1
20.
0
1
20.
0
m an ufa ctu rln g
G la ss Ⅲld
O th er ce ra m
i cs
3
2.
4
3
1(
X)
,
0
2
66.
7
1
33.
3
0
0.
0
in d u stries
G en e ral ste e l
5
4.
0
5
1(
X)
.
0
4
80.
0
1
20.
0
0
0.
0
N o n Tfe rro u s m e ta ls
an d e le c trlC W ire
5
4.
0
5
1(
X)
.
0
4
80.
0
1
20.
0
0
0.
0
Sub−
tO ld
4(
)
36 .
5
46
l∝)
.
0
29
63.
0
15
32 .
6
2
4.
3
In d u strial a n d o th er
m ach in ery
8
6.
3
8
1(
X)
.
0
5
62.
5
3
37.
5
0
0.
0
H e av y elcctric a l
e q u lp m en t
6
4.
8
6
10 0 .
0
5
83.
3
1
16 .
7
0
0.
0
C o n m un ica tio n s
e q u lp m en t
4
3.
2
4
1(
X)
.
0
3
75.
0
1
25.
0
0
0.
0
relate d
D o m estic a p p lian c e s
an d c o m p o n en tp ar ts
10
7.
9
10
1(
氾.
0
5
50.
0
4
40.
0
1
10.
0
m an u fa ctu n n g
M e te rln g an d o 血er
e le ctr
i c al e q u ip m e n t
5
4.
0
5
1α)
.
0
0
0.
0
4
80.
0
1
20 .
0
S h ip −
b u ild in g
3
2.
4
3
10 0 .
0
2
66.
7
1
33.
3
0
0.
0
M o to r ve h ic le s
14
1 1.
1
14
1(
X)
.
0
9
64 .
3
5
35.
7
0
0.
0
P re cision m ach in ery
6
4.
8
6
1(
X)
.
0
5
83.
3
1
16 .
7
0
0.
0
S ub −
tO tal
56
44.
4
56
1(
X)
.
0
34
60 .
7
20
35.
7
2
3.
6
O th e r m an u fac turln g
3
2.
4
3
1∝ )
.
0
2
66.
7
1
33.
3
0
0.
0
9
7.
1
9
1(
X)
.
0
8
88.
9
1
1 1.
1
0
0.
0
0
0.
0
0
0.
0
0
0.
0
0
0.
0
0
0.
0
C o n su m p lio n 一
M ac h in ery −
in d u stries
0 山e r m an u fac 一
tu∫1n g in du strleS
C o m m u n ic atio n s
B ro ad c astin g ,
C O In m u n i−
a n d p ub lic u tilitie s Ca tio n s,e lec tric p o w er,g aS
U n c le ar
−102−
Table37ParticipationinConsortia(Q.14)
(Figure36)
T o lal
(% )
H av e
P artic ip ated
H av e n o t
p a爪ic ip a ted
U n cle ar
0 v erall
12 6
1(
X)
.
0
60
47 .
6
60
4 7.
6
6
4.
8
C o m p a n ie s w ith
Se p arate d iv isio n
82
1(
X)
.
0
43
52.
4
37
45.
1
2
2.
4
C o m p an ie s w i血ou t
Se p arate d iv isio n
42
1(
X)
.
0
lb
38.
1
23
54.
8
3
7.
1
U n c le ar
2
1
0
1
Table38ParticipationinConsortia(Classi缶edbyScaleofR&DExpenditure)(Q.14)
(Figure37)
0 v erall
−1 0 b i l.y e n
1 0 −1 5 b il .y e n
1 5 −2 0 b il .y e ll
2 0 −3 0 b il .y e n
3 0 −5 0 b il .y e n
5 0 −1 (
氾 b i l.y e n
1 m )−
2 0 0 b iIl io n y e n
m o r e th an
2 0 0 b il .y e n
U n c le a r
Y −a X is to la l
X −
a X is to ta l
H a ve
(% )
(
% )
p a 血 c IP a te d
H ave not
P a r tic ip a te d
U n c le a r
12 6
1 26
60
60
6
1(
X)
.
0
1(
泊 .
0
47.
6
47.
6
4.
8
12
12
3
8
1
9.
5
10 0 .
0
25.
0
6(
3.
7
8.
3
30
30
11
18
1
2 3.
8
1 (粗 0
36.
7
60.
0
3.
3
19
19
11
8
0
15 .
1
1 ∝ ).
0
57.
9
42.
1
0.
0
26
2 6
15
9
2
20 .
6
1(
沿.
0
57.
7
34.
6
7.
7
18
18
11
7
0
14 .
3
1(
X)
.
0
61.
1
38.
9
0.
0
8
8
3
5
0
6.
3
1(
X)
.
0
37 .
5
62.
5
0.
0
3
3
2
1
0
2.
4
1(
X)
.
0
66.
7
33.
3
0.
0
9
9
4
4
1
7 .1
10 0 .
0
44 .
4
44 .
4
1 1 .1
1
l
0
0
1
0.
8
1α )
.
0
0 .
0
0 .
0
10 0 .
0
−103−
Table39ParticipationinConsortia(Classi丘edbyIndustryType)(Q.14)
(Figure38)
In d u stけ ty pe
Su h c a teg o ry
Y −
a X is to ta l
(
%)
X −aX is to tal
(%)
H av e
p artic ip ated
H a ve n o t
p an ic lp ated
U n c lea r
m 叫O r C ate g O ry
ln d u sけy ty p e
O ve rall
O v e ra ll
126
1(
X ).
0
126
1(
X)
.
0
60
47.
6
60
47 .
6
6
4.
8
C on stru C tio n
in d u sけy
C o n stru ctio n
4
3.
2
4
1∝ )
.
0
3
75.
0
1
25 .
0
0
0.
0
Foの
4
3.
2
4
1(
X)
.
0
2
50.
0
2
50 .
0
0
0.
0
re la ted
m an 扉 ac tun ng
T e xtile s
4
3.
2
4
1(
X)
.
0
1
25.
0
3
75 .
0
0
0.
0
in d u stri e s
Sub−
tO tal
8
6.
3
8
1(
泊.
0
3
37 .
5
5
62 .
5
0
0.
0
C he m lC als
15
11.
9
15
1(
泊.
0
5
33 .
3
10
66 .
7
0
0.
0
P h 訂 m aC eu tica ls
10
7.
9
10
1(
X)
.
0
5
50.
0
4
40 .
0
1
10 .
0
M a teria L
P a in ts an d
O th e r c h em ic a ls
3
2.
4
3
1(
X)
.
0
2
66.
7
1
33.
3
0
0.
0
re late d
P e tro leu m
an d n lb b r
5
4.
0
5
1(
X ).
0
2
40.
0
2
40 ,
0
1
20.
0
m 姐 d actu n n g
G la ss an d
O th er ce ram ic s
3
2.
4
3
1(沿.
0
1
33 .
3
2
66 .
7
0
0.
0
in d u stri e s
G en e ra l ste e l
5
4.
0
5
1(
X)
.
0
4
80.
0
1
20 ,
0
0
0.
0
N o n −fe rro u s m e ta ls
a nd e lec けic w ire
5
4.
0
5
1 α).
0
3
60.
0
2
40 .
0
0
0.
0
S u b −tO ta l
46
36.
5
46
1 ∝)
.
0
22
47.
8
22
47 .
8
2
4.
3
In d u slの山 an d o uler
m ac h in eけ
8
6.
3
8
1(
X)
.
0
1
12 .
5
6
75.
0
1
12 .
5
H e a v y e lec tric al
eq u lp m en t
6
4.
8
6
1(
泊.
0
6
10 0 .
0
0
0.
0
0
0.
0
C o n u u u n ic atio n s
eq u lp m en t
4
3.
2
4
1(
X)
.
0
1
25.
0
3
75.
0
0
0.
0
re la tcd
D o m e stic ap p lian c es
an d co m p o n e n t p an s
10
7.
9
10
1(
X)
.
0
5
50 .
0
4
40.
0
1
10 .
0
m an u fac tu rln g
M e ten n g an d oth er
e lec tric al e q u lp m en t
5
4.
0
5
1(
X)
.
0
0
0.
0
4
80.
0
1
20.
0
S h ip −bu ild in g
3
2.
4
3
1∝)
.
0
2
6(
i.
7
1
33.
3
0
0.
0
M o to r v e h ic les
14
1 1.
1
14
1(
X ).
0
7
50.
0
7
50.
0
0
0.
0
P re cision m ac h in ery
6
4.
8
6
1(
X)
.
0
3
50.
0
2
33.
3
1
16 .
7
S ub −tO tal
5(
i
44.
4
56
l(
X ).
0
25
44.
6
27
48.
2
4
7.
1
O th er m an u fac tu rln g
3
2.
4
3
1(
X)
.
0
2
66.
7
1
33 .
3
0
0.
0
9
7.
1
9
1(
X)
.
0
5
55.
6
4
44 .
4
0
0.
0
0
0.
0
0
0.
0
0
0.
0
0
0.
0
0
0.
0
C o n su m p tlO n 一
M a ch in e け−
in du s 雨 es
0 [
h er m an ufa c−
tの I唱 in d u s山 es
C oⅠ
n m u n ic a tio n s
B ro ad c astln g ,C O m m u n i−
an d p u b lic u tilitie s C atio n s,e lec tri c p o w er,g a S
U n c le ar
−104−
Table40MotivationtoParticipateinConsortia(Q・14)
(Figure39)
T o tal
To
T o e xp an d In d ep e n −
de n t
th e
estab lish
A pp lica b l
CO m p an y ’
s re sea rc h
an O I杷ra −
(
%)
R &D
is to o
tio n al b a se
O th ers
U n cle ar
N ot
a p p lic ab le
4
66
C aP ab ility
ex p
e n Siv e
O V e rSe aS
60
37
15
1(
X)
.
0
61.
7
25.
0
2
3.
3
2
3.
3
6.
7
82
43
1(
X)
.
0
26
60 .
5
12
27.
9
1
2.
3
1
2.
3
3
7.
0
39
C o m p an ie s w 軸h o u t
Sep a ra te d iv isio n
42
16
1(
X)
.
0
10
62.
5
3
18 .
8
1
6.
3
1
6.
3
1
6.
3
2(
)
U n c le ar
2
1
1
0
0
0
J ap an e se
&
Jap a n e se ,
A m eric an
&
E u fO p e an
O th e rs
U n c lea r
O v era ll
C o m p Ⅲlie s w i血
12 6
Sep a ra te d iv isio n
0
1
Table41NationalitiesofParticipatingCompanies(Q.14)
(Figure40)
A m eric an
J ap an e se
&
E uro p e an
O v e rall
126
60
1(
X)
.
0
31
51.
7
7
1 1.
7
3
5.
0
5
8.
3
1
1.
7
11
18 .
3
1
1.
7
1
1.
7
66
C o m p an ie s wi th
Sep afate d iv isio n
82
43
1(
敗0
18
4 1.
9
5
1 1.
6
3
7.
0
4
9.
3
1
2.
3
10
23,
3
1
2.
3
1
2.
3
39
C o m p 孔nie s w i血o u t
Sep a rate d iv isio n
42
10
1 ∝)
,
0
13
81.
3
2
12 .
5
0
0.
0
0
0.
0
0
0.
0
1
6.
3
0
0.
0
0
0.
0
26
U n cle ar
2
0
0
0
1
0
0
0
0
1
T o ta l
A p p lic ab l
(
%)
Ja p a ne se
A m eri c an
E u ro p ea n
Table42SuccessofConso血a(Q.14)
(Figure41)
T o ta l
A p p lic ab l
S u cc ee d ed
(
%)
D id no t
Su C Ce ed
U n clea r
N ot
ap p liC ab le
66
O ve rall
126
60
1(
X)
.
0
30
50.
0
5
8.
3
25
4 1.
7
C o m p an ieS W 血
SeP a rate d iv isio n
82
43
1(
X)
.
0
24
55.
8
3
7.
0
16
37.
2
39
C o m p an ie s w i血o u l
Sep a rate d iv isio n
42
26
U nc le ar
2
16
5
2
9
1 α)
.
0
31.
3
12.
5
56.
3
1
1
0
0
一105−
1
N ot
ap p lic ab le
Table43TechnologyFlowBetweenStages(Q.33)
(Figures42&43)
2
l
Item
h is血 er o w n rese arch
an d p rod u c tio n stag e s
血e te ch n o lo g y lS
pe rSO n at e aC h sta g e
3 .珊 e view s o f 血e
re flec te d in ule Se lec tio n
O f re sea rc h th em es to
fac ilitate tec h n o lo g y flo w
血ro u g h ea ch sta g e
4
5
N o I ve ry
N ot
e i也e r w ay
坤 p lic ab le
ap p lic ab le
U n clea r
A v e rag e
12
9.
5
1
0.
8
3.
01
22
26 .
8
9
11 .
0
O
0.
0
3 ,13
4
9.
5
3
7.
1
0
0.
0
2.
76
0 ve rall
1 2(i
1 00 .
0
3
2.
4
43
3 4 .1
41
32.
5
26
20 .
6
C o m p an ie s w ith
Sep a rate d iv isio n
82
100 ,
0
2
2.
4
25
30.
5
24
29 .
3
C o m p an ie s w ith o u t
SeP a rate d iv isio n
42
100.
0
1
2.
4
18
42.
9
16
38 .
1
ap p lica b le
U nc le ar
2
0
0
1
0
0
l
0 ve rall
12(
i
13
49
3:
l
29
10.
3
38.
9
26 .
2
2 3.
0
1
0.
8
1
0.
8
2,
65
1(
泊.
0
C o m p an ies wi th
Sep arate d ivi sio n
82
100 .
0
10
12.
2
36
43.
9
18
2 2.
0
18
22.
0
0
0.
0
0
0.
0
2.
54
C o m p an ie s w ith o u t
SeP arate d iv isio n
42
100 .
0
3
7 .1
13
3 1.
0
14
33.
3
11
2()
.
2
1
2.
4
0
0.
0
2.
86
U n cle ar
2
0
0
1
0
0
0 ve rall
12 6
1 00 .
0
9
7 .1
48
3 8 .1
43
34 .
1
18
14 .
3
C o m p an ies wi th
Sep a rale d iY isio n
82
100 .
0
8
9.
8
35
42.
7
27
32 .
9
C o m p an ies wi th o u l
Sep aIale d iv isio n
42
100.
0
1
2,
4
12
28.
6
d e v elo p m en t,m ark e lin g
an d s ale s d iv isio n s are fu lly
3
C an n o t sa y
ap p lic a b le
2 .R e sp o n sib ility k )
r
P aS Se d o n to a d ifferen t
M o re o r
1e ss
T o ta l
(%)
1 .T h e rese arch e r s lee rS
lh ro u g h 也e d ev elop m en t
V ery
1
6
4.
呂
2
1.
6
2.
71
8
9.
8
4
4.
9
0
0.
0
2.
57
16
3 8.
1
10
23.
8
2
4.
8
1
2.
4
3.
00
0
0
1
0
5
U n cle ar
2
0
1
0
0 v erall
12 6
43
50
22
10 0 .
0
3 4 .1
39.
7
17.
5
6
4.
8
0.
0
4.
0
4 .A m p le tim e an d c lo se
1.
93
liaiso n is n e ce ssary
C o m p an ies w ith
Sep arate d iv isio n
82
10 0 .
0
33
40.
2
30
36.
6
15
18.
3
3
3.
7
0
0.
0
1
1.
2
1.
85
fo r th e s m oo th h an d TO Ve r
O f th e tec hn o lo g y
C o m p 肺 es w itho u t
Se p afa te d iv is io n
42
10 0 .
0
10
23 .
S
19
4 5.
2
7
16.
7
3
7.
1
0
0.
0
3
7.
1
2.
08
U n c lea r
2
0
1
0
0
0
1
k tw e en stag e s
−106−
Table44DegreeofContactBetweenR&DDivisionandOtherDivisions(Q.17)
(Figures44&45)
l
D iv isio n
T o tal
(% )
0 v e rall
CO ntaC t
2
3
4
5
M ee 血 g s
h eld
h a lf−y Ca rly
M ee tin g s
h e ld m o n lh ly
M ee lin g s
he ld w ee k ly
C o n lact o n a
d a ily b asis
U n c le ar
A ve rag e
12 6
8
18
42
9
43
6.
3
14.
3
33.
3
7.
1
3 4 .1
6
4.
8
3.
51
1(
X)
.
0
82
1(
X)
.
0
3
3.
7
14
17.
1
27
32 .
9
5
6.
1
29
35.
4
4
4.
9
3.
55
SeP a ra te d iv isio n
C o ln p 乱nie s w ith o u t
SeP a ra te d iv isio n
42
10 0 .
0
5
11.
9
4
9−
5
15
35 .
7
4
9.
5
13
3 1,
0
1
2.
4
3.
39
C o m p an ie s w ith
M an l止ac lurln g
L ittle o r n o
U n c le ar
2
0
0
0
0
1
1
O ve rall
12 (
i
1(
X)
.
0
14
11.
1
24
19.
0
39
31.
0
10
7.
9
10
28.
6
3
2.
4
3.
24
C o m p an ie s w ith
Sep a ra te div isio n
82
1(
X)
.
0
10
12 .
2
16
19 .
5
24
29 .
3
7
8.
5
24
29.
3
l
1.
2
3.
23
C o m p an ie s w ith o u t
Sep a ra te d iv isio n
42
1(
X)
.
0
4
9.
5
8
19 .
0
15
35 .
7
3
7.
1
11
26.
2
1
2.
4
3.
22
U n cle ar
2
0
0
0
0
1
1
0 v e rall
12 (
う
1(
X)
.
0
8
6.
3
38
30 .
2
38
30 .
2
5
4.
0
33
2(
う.
2
4
3,
2
3 .14
P re sid e n ピS
C o m p an ie s w ith
SeP a ra te d iv isio n
82
10 0 .
0
4
4.
9
25
30 .
5
25
30 .
5
3
3.
7
25
30.
5
0
0.
0
3.
24
0 路 c e an d
p la Im ln g
C o m p an ie s w ith o u t
Se p a ra te d iv isio n
42
1(
犯.
0
4
9.
5
13
3 1.
0
13
3 1.
0
2
4.
S
7
16.
7
3
7.
1
2,
87
S a le s むId
m ∬k e 血 g
U nc le ar
2
0
0
0
0
1
1
0 v e ra ll
12 6
20
57
23
5
18
3
1(
沿.
0
15 .
9
4 5.
2
18 .
3
4.
0
14.
3
2.
4
C o m p an ie s w ith
SeP a ra te d iv isio n
82
100.
0
12
14 .
6
41
50 .
0
17
20 .
7
3
3.
7
8
9.
8
1
1.
2
2.
43
C om p an ie s wi th o u t
SeP a ra te d iv isio n
42
10 0 .
0
8
19 .
0
16
3 8.1
6
14 .
3
2
4.
8
9
21.
4
1
2.
4
2.
71
G en e ral
誠fairs,
匹 rSO n ne l,
餌ld lab o r
m an ag e Il鳩n t
S u p p lie s an d
p u rch asin g
F im an ce an d
ac co u n tln g
2.
54
U nc le ar
2
0
0
0
0
1
1
0 v e ra ll
12 6
1 ∝)
.
0
52
4 1.
3
36
6
4.
8
12
9.
5
3
2.
4
2 .1 1
28 .
6
17
13 .
5
C o m p an ie s w ith
Sep a ra te d iv isio n
82
1㈱ .
0
34
4 1.
5
24
29 .
3
10
12 .
2
3
3.
7
10
12.
2
1
1.
2
2 .15
C o m p an ie s wi th o u t
Sep a ra te divi sio n
42
10 0 .
0
17
40 .
5
12
2 8.
6
7
16 .
7
3
7.
1
2
4.
8
1
2.
4
2.
05
U n c le ar
2
1
0
0
0
0
1
O v e ra ll
12 6
1(
X)
.
0
31
24.
6
65
5 1.
6
16
12 .
7
4
3.
2
7
5.
6
3
2.
4
2 .1 1
C o m p an ie s w ith
Sep a ra te d iv isio n
82
1 00 .
0
21
25 .
6
45
54 .
9
9
11.
0
3
3.
7
4
4.
9
0
0.
0
2.
07
C o m p an ie s wi th o u t
Scp a ra te div isio n
42
1∝)
.
0
10
23 .
8
20
47 .
6
7
16 .
7
1
2.
4
2
4.
8
2
4.
8
2 .13
U n c le ar
2
0
0
0
0
1
1
−107−
Table451nnuenceofOtherDivisionsintheFormulationofR&DStrategy(Q.18)
(Figures46&47) (1)EstablishmentofResearchFacilities
1
2
3
4
T o la l
(
%)
L ittle o r n o
illn u en C e
Som e
in n u en ce
0 v e rall
12(
i
1(
X)
.
0
6
4.
8
11
8.
7
23
18 .
3
49
38 .
9
C o m p an ie s w ilh
Sep a ra te d iv isio n
82
1(
X)
.
0
3
3.
7
6
7.
3
9
1 1.
0
C o m p an ie s w
i th o u t
Se p ara te d ivisio Jl
42
1(
X)
.
0
3
7.
1
4
9.
5
U n c le ar
2
0
O v e rall
12 6
1(
X)
.
0
F in a n ce ぉld
C o m p an ie s w i山
ac co u n tin g
SC p ara tC d iv isio n
C o m p an ie s w ith o u t
Se p ara te d iv isio n
D ivisio n
P res id en ピS
Ofn ce an d
p lan n l喝
U n cle ar
0 v e rall
G e n eral
5
E x t∫em e ly
C o n side rab le G rea t d e al o r
h ig h d e gree
inLlu e nc e − inn u e n ce
O f in n u en c e
U n c le ar
A v era g e
33
26.
2
4
3.
2
3.
75
3(
I
4 3.
9
27
32.
9
1
1.
2
3.
96
14
33 .
3
11
31.
0
6
14.
3
2
4.
8
3.
38
1
0
0
0
1
13
10 .
3
29
23.
0
42
33.
3
32
25.
4
8
6.
3
2
1.
6
2.
94
82
1(
X)
.
0
9
1 1.
0
20
24 .
4
22
26 ,
8
24
29 .
3
6
7.
3
1
1.
2
2.
98
42
1(
X)
.
0
4
9.
5
9
2 1.
4
20
47.
6
8
19 .
0
1
2.
4
0
0.
0
2.
83
2
0
0
0
0
1
1
12
46
40
24
1
3
1(
X)
.
0
9.
5
36 .
5
31.
7
19 .
0
0.
8
2.
4
12 (
う
2.
64
薗raiB ,
C o m p an ie s w ith
Se p a ra te d iv isio n
82
1㈱ .
0
6
7.
3
30
36 .
6
24
29 .
3
20
24 .
4
0
0.
0
2
2.
4
2.
73
匹 rSO nn el,
C o m p an ie s w ith o u t
Se p ara te d iv isio n
42
100.
0
6
14 .
3
16
38 .
1
15
3 5.
7
4
9.
5
1
2.
4
0
0.
0
2.
48
U n cle ar
2
0
0
1
0
0
1
a n d lab r
正岨n a g em e n t
O v e rall
12 6
36
40
26
19
1
4
1(
X)
.
0
28 .
6
31.
7
20 .
6
15 .
1
0.
8
3.
2
82
1(
X)
.
0
17
20 .
7
31
37 .
8
16
19 .
5
14
17.
1
1
1.
2
3
3.
7
2.
38
Sep a rate div isio n
C o m p an ies w i山o u t
Se P arate d iv isio n
42
1∝)
.
0
19
45.
2
9
21.
4
10
23.
8
4
9.
5
0
0.
0
0
0.
0
1.
98
U n clea r
2
0
0
0
1
0
1
O v erall
126
1(
X)
.
0
44
34 .
9
36
28.
6
23
17
4
2
18.
3
13 .
5
3.
2
1.
6
C o m p an ies w ith
M an u fac tum
g
2.
25
2.
20
S ale s an d
C o m p 礼nies w ith
Sep arate d iv isio n
82
1(
X)
.
0
28
34 .
1
25
30 .
5
16
19 .
5
9
11 .
0
3
3.
7
1
1.
2
2.
19
m ark e ti喝
C o n 坤a n ies w i血o u t
Se P arate d iv isio n
42
1(
X)
.
0
16
38.
1
10
23.
8
7
16.
7
8
19 .
0
1
2,
4
0
0.
0
2.
24
U n clear
2
0
1
0
0
0
1
0 v erall
12 6
1(
X)
.
0
71
56 .
3
38
30 .
2
12
9.
5
2
1.
6
0
0.
0
3
2.
4
1.
55
S u p p lie s an d
C o m p an ies w ith
Sep arate d iv isio n
82
1(
泊.
0
49
59 .
8
24
29 .
3
6
7.
3
2
2、
4
0
0.
0
1
1.
2
1.
52
P ufC h as in g
C o m p a n ies w ith o u t
Se p arate d iv isio n
42
1(
X)
.
0
21
50 .
0
14
33.
3
6
14 .
3
0
0.
0
0
0.
0
1
2.
4
1.
63
U n clea r
2
1
0
0
0
0
1
ー108−
Table46InfluenceofOtherDivisionsintheFormulationofR&DStrategy(Q.18)
(Figures48&49) (2)HiringofNewGraduates
T o ta l
(
%)
D iv isio n
O ve rall
G e n era l
薗rairs ,
C o m p an ies w ith
p erso n n e l,
Se P arate d iv isio n
an d la b o r
C o m p an ies w
i th o u t
m a n ag e m e nt
Se p ara le d iY isio n
l
2
L ilu e o r−
nO
inn u en c e
Som e
in flu e nc e
3
4
5
E x trem e ly
C t)
n Sid erab le G re at d e al o f
h ig h d e gree
inn u e n ce
inn ue n ce
O f in n u en ce
9
54
52
U n c lear
A v e ra g e
2
4.
20
126
0
9
1(
X I.
0
0.
0
7.
1
7.
1
4 2.
9
4 1.
3
1.
6
82
10 0 .
0
0
0.
0
3
3.
7
7
8.
5
33
4 0.
2
38
46.
3
1
1.
2
4.
31
42
10 0 .
0
0
0.
0
6
14 .
3
2
4.
8
20
47.
6
14
33.
3
0
0.
0
4.
(
X)
1
U n clea r
2
0
0
0
0
1
0 v erall
126
15
23
30
4(
〉
9
3
10 0 .
0
11 .
9
18 j
23.
8
36.
5
7.
1
2.
4
3.
09
P resid en ピS
C o m p an ies w
i th
Se P arate d iv isio n
82
1(
X)
.
0
7
8.
5
14
17 .
1
17
20.
7
35
4 2.
7
8
9.
8
l
1.
2
3.
28
O fn ce an d
P lan n ln g
C o m p an ies w ith o u t
SeP arate d iv isio n
42
1(
X)
.
0
8
19 .
0
8
19 .
0
13
3 1.
0
11
2(
)
.
2
1
2.
4
1
2.
4
2.
73
U n clea r
2
0
1
0
0
0
1
0 v erall
126
33
44
25
15
4
5
1(
X)
.
0
2(
i.
2
34.
9
19 .
8
11.
9
3.
2
4.
0
82
10 0 .
0
17
20.
7
27
32.
9
18
22.
0
13
15 .
9
3
3.
7
4
4.
9
2.
46
Se p arate d iv isio n
C o m p a nies w ith o u t
SeP arate d iv isio n
42
10 0 .
0
16
38.
1
16
38.
1
7
16 .
7
2
4.
8
1
2.
4
0
0.
0
1.
95
C o m p a nies w ith
M an u fac tu rln g
U n clea r
2
0
1
0
0
0
1
O v erall
126
51
40.
5
26
20.
6
28
22.
2
18
14.
3
1
0.
8
2
1.
6
1∝)
.
0
2.
28
2.
13
F in an ce an d
C om pa
n ies w
i th
82
Sep arate d iv isio n
1(
X)
.
0
35
42.
7
15
18 .
3
18
22.
0
13
15.
9
0
0.
0
1
1.
2
2.
11
aC CO u n tln g
C o m p an ies w ith o u t
Sep arate d iv isio n
42
1(
沿.
0
16
38.
1
11
2(
う
.
2
9
2 1.
4
5
11.
9
1
2.
4
0
0.
0
2,
14
U n clear
2
0
0
1
0
0
1
0 ve rall
126
45
46
23
8
2
2
1(
沿.
0
35.
7
36.
5
18 .
3
6.
3
1.
6
1.
6
2.
00
S a le s an d
C o m p an ies w ith
Sep a rate d iv isio n
82
1α)
.
0
31
37 .
8
2(
i
3 1.
7
17
20.
7
6
7.
3
1
1.
2
1
1.
2
2.
01
m ark e tin g
C o m p an ie s w ith o u t
SeP a rate d iv isio n
42
1(
X)
.
0
14
33.
3
19
45.
2
6
14 .
3
2
4.
8
1
2.
4
0
0.
0
1.
98
S u p p lie s an d
p urc h asi喝
U n cle ar
2
0
1
0
0
0
1
0 ve rall
12 6
1(
X)
.
0
95
7 5.
4
25
19.
8
2
2
2
1.
6
1.
6
0
0.
0
1.
6
C o m p an ie s w ith
SeP a ra te d iv isio n
82
1(
X)
.
0
63
76 .
8
15
18.
3
2
2.
4
1
1.
2
0
0.
0
1
1.
2
1.
27
C o m p an ie s w ith o u t
Sep a ra te d iv isio n
42
1(
相.
0
31
7 3.
8
10
23.
8
0
0.
0
1
2.
4
0
0.
0
0
0.
0
1.
31
U nc le ar
2
1
0
0
0
0
1
一109−
1.
28
Table47InnuenceofOtherDivisionsintheFormulationofR&DStrategy(Q.18)
(Figures50&51) (3)SelectionofResearchDomains
D iv is io n
l
2
3
T o は1
L ittle o r no
Som e
C o n side rab le
(
啄)
in n u en c e
in flu e nc e
ilⅡlu en c e
4
G re al d e al o l
iIlll ue n ce
5
E x はem e ly
h lg h d e gree
U n c lea r
A v e ra g e
3.
18
U r in n u en c e
O v erall
126
14
19
38
35
17
3
10 0 .
0
1 1.
1
15 .
1
30.
2
27 .
8
13 ,
5
2.
4
P re sid en t’
S
C o m p a11ies w i血
82
7
15
22
25
13
0
O fric e a n d
Se P ara te d iv isio n
10 0 .
0
8.
5
18 .
3
2(
1.
8
30.
5
15.
9
0.
0
p la n n ln g
C o m p a n ie s w ilho u t
Se P ara te d iv isio n
42
7
4
1(
Ⅲ.
0
lf)
.
7
9.
5
38.
1
1(
)
10
4
1
2 3.
8
9 .
5
2.
4
0
2
U n clea r
2
0
0
0
0
0 v erall
126
10
30
36
42
7
1
10 0 .
0
7.
9
23,
8
28.
6
3:
3.
3
5.
6
0.
8
S ale s an d
C o rn p an ies w ith
82
3
23
20
32
4
0
m ark e tin g
SeP arate d iv isio n
10 0 .
0
3.
7
2g.
0
24.
4
39 .
0
4 .
9
0.
0
C o m p a n ies w i血O u t
42
7
7
16
9
3
0
Se p ara te d iv isio n
10 0 ,
0
1丘7
16 .
7
38.
1
2 1.
4
7 .
1
0.
0
0
1
U n clea r
2
12(
う
0 v erall
10 0 .
0
C om pa
n ies w
i
M an u fac tu n n g
th
Se P ara te d iv isio n
C o m p an ies w
i
tho u t
Se p ara te d iv isio n
0
0
0
1
20
32
36
29
5
4
】
5.
9
25.
4
28.
6
2 3.
0
4 .
0
3.
2
82
10
20
23
23
4
2
10 0 .
0
12 .
2
24.
4
28.
0
28.
0
4 .
9
2.
4
4 2
10
11
13
6
1
1
10 0 ,
0
23,
8
26.
2
3 1.
0
14 .
3
2.
4
2.
4
1
U n c lea r
2
0
1
0
0
0
O v erall
12 6
80
33
10
2
0
1
10 0 .
0
63.
5
26.
2
7.
9
1.
6
0 .
0
0.
8
F in an c e an d
C o m p an ie s w
i th
82
52
24
4
2
0
0
a CC O u n tln g
Se P a ra te d iv isio n
1(
X )
.
0
63.
4
29.
3
4.
9
2.
4
0 .
0
0.
0
C o m p an ie s w ith o u l
42
28
9
5
0
0
0
Se p a ra te d iY isio n
10 0 .
0
6(
う
.
7
2 1.
4
1 1.
9
0 .
0
0 .
0
0.
0
U n c le ar
2
0
0
1
0
0
1
0 v erall
12 6
79
37
6
2
0
2
10 0 .
0
62、
7
29 .
4
4 .
8
1.
6
0 .
0
1.
6
G en e ral
affairs,
C o n叩 an ie s w ith
82
52
25
4
1
0
0
p e rson n el,
Se P a ra le d iv isio n
100 .
0
63,
4
30 .
5
4 .
9
1.
2
0.
0
0.
0
訂ld lab o r
C o m p m ie s w ith ou t
42
27
12
2
1
0
0
m an a g em e n t
Se p a ra te d iv isio n
100 .
0
64.
3
2 8.
6
4 .
8
2.
4
0.
0
0.
0
2
U n c le ar
2
0
0
0
0
0
0 v erall
126
96
25
3
l
0
1
100 .
0
7(
)
.
2
19 .
8
2 .
4
0.
8
0.
0
0.
8
S up p lie s an d
C o m p an ie s w ith
82
64
15
2
1
0
0
p u rch asin g
Se P a ra te d iv isio n
1 00 .
0
78.
0
18 .
3
2 .
4
1.
2
0.
0
0.
0
C om pa
n ie s w
i
42
3 1
10
1
0
0
0
Se p a ra te d iv isio n
th o u t
100 .
0
73.
8
23.
8
2 .
4
0.
0
0.
0
0.
0
U n c le ar
2
1
0
0
0
0
1
−110−
3.
27
3.
00
3.
05
3.
13
2.
86
2.
73
2.
89
2.
44
1.
47
1.
46
1.
45
1.
44
1.
44
1.
45
1.
27
1.
27
1.
29
Table48InfluenceofOtherDivisionsintheFormulationofR&DStrategy(Q.18)
(Figures52&53) (4)PreparationofResearchBudgetPlans
l
T o tal
D ivisio n
(
啄)
0 v e rall
3
2
L ittle o r n o
Som e
inn u e n c e
in n u en c e
4
5
C o n sid e rab le G rea t d ea l 0 f
in n u en c e
in n u en c e
E x tfe m e ly
h ig h d e g re e
U nc le ar
A v erag e
3.
48
O f in n u en ce
12 6
8
20
25
47
24
2
1(
X)
.
0
6 .
3
15.
9
19 .
8
37.
3
19 .
0
1.
6
P re sid e n ピS
C o m p an ies w ith
82
4
14
11
33
20
0
O ffice ぉld
SeP a rate d iv isio n
1(
X )
.
0
4 .
9
17.
1
13 .
4
40.
2
24 .
4
0 .
0
p lan n ln g
C o m p an ies w ith o u t
42
4
5
14
14
4
1
Sep arate d iv isio n
10 0 .
0
9 .
5
11 .
9
33.
3
33.
3
9 .
5
2.
4
U n cle ar
2
0
1
0
0
0
1
0 v e rall
12 6
10
15
30
50
20
1
10 0 .
0
7 .
9
11.
9
23.
8
39.
7
15 .
9
0 .
8
F in an ce an d
C o m p an ies w ith
82
6
10
19
33
14
0
aC CO u n tm g
SeP a rale d iv isio n
1(
X )
.
0
7 .
3
12.
2
23.
2
40.
2
17 .
1
0 .
0
C o m p an ies w ith o u t
42
4
5
11
17
5
0
SeP a rate d iv isio n
1(
X )
.
0
9 .
5
11.
9
2(
)
.
2
40.
5
1 1.
9
0 .
0
U n cle ar
2
0
0
0
0
1
1
0 v er all
12 6
40
43
25
12
5
1
100 .
0
3 1.
7
34.
1
19 .
8
9.
5
4 .
0
0 ,
8
S a les の1d
C o m p an ie s w ith
82
25
27
18
9
3
0
m ark e tin g
SeP a rate d iv isio n
1(
X)
.
0
30 .
5
32.
9
22.
0
1 1,
0
3 .
7
0 .
0
C o m p am e s w ith o u t
42
15
15
7
3
2
0
SeP a ra te d iv isio n
10 0 .
0
35 .
7
35.
7
16 .
7
7.
1
4 .
8
0 .
0
U nc le af
2
0
1
0
0
0
1
0 v er all
12 6
36
26
12
3
3
2 8.
6
20 .
6
9.
5
2.
4
2 .
4
4(
)
1(
X)
.
0
M a n u factu rln g
3(
)
.
5
C om pa
n ie s w ith
82
28
20
19
10
3
2
Se p a ra te d iv isio n
1 α)
.
0
34.
1
24 .
4
23.
2
12 .
2
3.
7
2.
4
C o m p an ie s w ith o u t
42
17
lb
7
2
0
0
Se p a ra te d iv isio n
100 .
0
40.
5
38 .
1
16.
7
4.
8
0.
0
0.
0
U n c le ar
2
1
0
0
0
0
1
12 (
i
58
46
13
7
1
1
1 00 .
0
46.
0
36.
5
10 .
3
5.
6
0.
8
0.
8
0 v era ll
G en e ral
a什airs,
C o m p an ie s w ith
82
38
30
9
4
1
0
P e rSO n n e l,
Se P ara te d iv isio n
10 0 .
0
46.
3
36.
6
1 1.
0
4.
9
1.
2
0.
0
an d la h
r
m an ag e m en t
C o m p a n ie s w ith ou t
4 2
20
15
4
3
0
0
Se P ara te d iv is io n
10 0 .
0
47.
6
35.
7
9 .
5
7.
1
0 .
0
0.
0
U n clea r
2
0
1
0
0
0
1
0 v erall
126
93
27
4
1
0
1
10 0 .
0
73.
8
2 1.
4
3 .
2
0 .
8
0 .
0
0.
8
S u p p lies an d
C o m p a n ies w i血
82
64
14
3
1
0
0
p u rch a sin g
Se p ara te d iv isio n
1∝)
.
0
78.
0
17 .
1
3.
7
1.
2
0 .
0
0.
0
C o In p 飢 ies w 仙 o u t
42
28
13
1
0
0
0
SeP arate d iv isio n
1(
X)
.
0
66.
7
3 1.
0
2.
4
0.
0
0 .
0
0.
0
U n clear
2
1
0
0
0
0
1
3.
62
3.
22
3.
44
3.
48
3.
3二
I
2.
19
2.
24
2.
10
2.
11
2.
25
1.
86
1.
78
1.
78
1.
76
1.
30
1.
28
1.
3(
i
Table49EmploymentConditionsfbrResearchersandEngineers(Q.34)
(Figure54)
T h e co m p a n y h a s
T h e co m p an y p lace s
T o tal
(%)
e stab lishe d Spe Cia lisl
u le CO m p an y h aS
rese arc h ers an d en g lne erS
P O Sitio n s fo r rese arch e rs
e sla b lish ed spe Cialisl
u n d e r th e sa m e p erso n n e l an d en g ln eerS q u ite d istin c t
fro m m an ag eri a l po sitio n s , p o s itio n s co rresp o n d in g Lo
Stre am a S ad m in istrative
Se n lO r e X eC u tlV e S
Sta仔
Su Ch a s ch ie f re se arch e r an
0 山e rs
Se nior rese arch e r
12 (
i
54
65
4
2
1(
X)
.
0
42.
9
5 1.
6
3.
2
1.
6
C om panies w ith
Scparale d viSion
82
1(
敗0
30
45
54 .
9
4
2
C om p anleS W i血0融
SeParale dlYision
42
U nclear
O verd l
U nc le ar
36.
6
0.
8
1.
2
4.
9
2.
4
20
0
0
1 α).
0
22
52.
4
47 .
6
0.
0
0.
0
0.
0
2
2
0
0
0
0
−111−
Table50AttitudesTowardsResearchersandEngineers(Q.35)
rF ig u re s 5 5 & 5 6 1
l
Q u estio n ite m s
T o ta l
O v erall
In o rd er to a ch ie v e
(
%)
12 (
i
ap p llC ab le
M o re o r
le ss
ap p lic ab le
3
4
5
C an n o t sa y
N o t v e ry
ap p lica b le
N ot
a p p lic ab le
0
0.
0
0
0.
0
0
0.
0
1.
66
0
1.
8(
i
e仙 erw ay
45
70
11
1α)
.
0
35,
7
55.
6
8.
7
31
37.
8
48
58.
5
3
0
3.
7
0.
0
in n o v a tiv e re se訂C h ,it is
C o 叫 坤 lie s w i[
h
82
i叫 抑止a n H o r 山e
SeP a ra te d iv isio n
1(
X )
.
0
CO m p a n y lo glV e
re se a rc h ers a free h an d
C o m p an ie s w
i lh o u t
42
1(
X)
.
0
Se p ara te d iv isio n
2
V e ry
U n cle ar
A v era ge
0
0
1.
73
0.
0
0.
0
14
20
8
0
47 .
6
2
19 .
0
0.
0
0
0.
0
U n c le ar
2
33.
3
0
0
0
0
0.
0
0
O v erall
12 6
10 0 .
0
36
28.
6
74
58.
7
14
11 .
1
0
0.
0
1
0.
8
1
0.
8
1.
85
C o n 叩 an ie s w ith
Se P ara te d iv isio n
82
1(
X)
.
0
25
30 .
5
46
56 .
1
9
11.
0
0
0.
0
1
1.
2
1
1.
2
1.
84
C o m p 肌 ie s w ith o u t
Se p ara le d iv isio n
U n c le ar
42
1(
X)
.
0
2
10
23.
8
28
66,
7
4
9.
5
0
0.
0
0
0.
0
0
0−
0
1.
8(
)
1
0
1
0
0
0
O v erall
12 6
10 0 .
0
25
19 .
8
55
4 3.
7
39
31.
0
7
5.
6
0
0.
0
0
0.
0
2.
22
U n d erg ro un d re se訂C h
C o rnp an ie s w
i けl
Se p ara te d iv isio n
82
10 0 .
0
19
23.
2
38
46.
3
22
26.
8
3
3.
7
0
0.
0
0
0.
0
2.
11
Sh o uld b e ac ce p te d
F )
Sitiv e ly
C o m p an ies w ith o u t
Se p ara te d iv is ion
U n c lea r
42
1(
X)
.
0
5
11.
9
17
40.
5
16
38 .
1
4
9.
5
0
0.
0
0
0.
0
2.
45
2
1
0
1
0
0
0
0 v erall
12 6
1(
X)
.
0
10
7.
9
63
50 .
0
37
29 .
4
15
11 .
9
1
0.
8
0
0.
0
2.
48
C o m p 乱n ies w k h
Se p arate d iv ision
82
1(
X)
.
0
8
9.
8
38
46.
3
23
28 .
0
12
14.
6
1
1.
2
0
0.
0
2.
51
C om p 乱
n ies w ith o u l
Se p ara te d iv is io n
42
1(
X)
.
0
2
4.
8
25
59 .
5
12
28.
6
3
7.
1
0
0.
0
0
0.
0
2.
38
R e searc h ers m u st
e n su re th a t th ey a dh e re
to 血e a n nu al p la n
R e se arc he rs th e m s elv e s
Sh o u ld c o llec t
th e d ala ne ce ssa 坪 b r
血e rese arch p lan
U n c lear
2
0
0
2
0
0
0
O v erall
12 (
う
l(
X)
.
0
9
7.
1
51
40 .
5
49
38.
9
10
12.
7
1
0.
8
0
0.
0
2.
60
C om p 礼
n ie s w ith
Se p ara te d iv isio n
82
10 0 .
0
4
4.
9
32
39 .
0
3:
I
40 .
2
12
14 .
6
1
1.
2
0
0.
0
2.
68
C o m p an ies w
i th o u t
Se p ara te d iv is io n
U n c le ar
42
1(
X)
.
0
2
5
1 1.
9
0
19
45 .
2
0
14
33.
3
2
4
9.
5
0
0.
0
0
0.
0
2.
40
0
0
0
O v erall
12 6
1α)
.
0
5
4.
0
38
30 .
2
67
53.
2
ld
12 ,
7
0
0.
0
0
0.
0
2.
75
C o m p a n ie s w ith
Se p ara te d iv is io n
82
1(
X)
.
0
2
2.
4
25
30 .
5
43
52.
4
12
14.
6
0
0,
0
0
0.
0
2,
79
fro m e n g ln ee rS an d
e m p 10 y m e n t C On d itio n s
Sh o u ld re fle c‖h is
C o m p an ie s w ith o u t
Se p ara le d iv
i sio n
42
10 0 .
0
3
7.
1
13
31.
0
22
52.
4
4
9.
5
0
0.
0
0
0.
0
2.
64
T he c om p 従
n y d o es
n o t c on ce m itself w id l
th e re se arc h pro C eSSe S
a s lo n g 鮎 g (
X 畑 re su lts
are ねr山c o n u n g
R ese afCh e rs sh o u ld b e
C le arly d istin g u ish ed
U n c le ar
2
0
0
2
0
0
0
O v erall
12 6
1(
X)
.
0
2
1.
6
32
25.
4
70
55.
6
19
15 .
1
3
2.
4
0
0.
0
2.
91
rese ∬Ch er s i叫匹 d e s
th e ir ab ility to d e v e lo p
C om p an ie s w ith
Se p ara te d iv isio n
82
10 0 .
0
2
2.
4
20
24 .
4
48
58.
5
10
12 .
2
2
2.
4
0
0.
0
2.
88
n e w id ea s an d c on c ep ts
C o叫 )
an ies w
i th o u t
Se p ara te d iv isio n
42
1(
X)
.
0
0
0.
0
12
28.
6
21
50 .
0
8
19 −
0
1
2.
4
0
0.
0
2.
95
S u 匹 rVision o f
R ese arch e rs m u st ad h e re
b Se t W O rkln g h o u fS
U n c le ar
2
0
0
1
1
0
0
O v era 11
12 6
1(
X)
.
0
1
0.
8
14
11.
1
45
35.
7
59
46.
8
7
5.
6
0
0.
0
3.
45
C om p a
n ie s w ith
Sep 証a k d iv isio n
82
1(
X)
.
0
1
1.
2
8
9.
8
33
40.
2
34
4 1.
5
6
7.
3
0
0.
0
3.
44
C o m p 姐 ie s w ith o u t
SeP a ra te d iv isio n
42
1(
X)
.
0
0
0.
0
6
14.
3
11
26.
2
24
57 .
1
1
2.
4
0
0.
0
3.
48
U n c le ar
2
0
0
1
1
0
0
O v era ll
12 6
1(
泊.
0
2
1.
6
6
4.
8
54
42.
9
48
38 .
1
16
12.
7
0
0.
0
3.
56
C o m p an ie s w ith
Sep a ra tc d iv isio n
82
1(
X)
.
0
1
1.
2
4
4.
9
37
45.
1
30
36 .
6
10
12.
2
0
0.
0
3.
54
C o m p an ie s w ith o u t
Sep a ra le d iv isio n
U n cle ar
42
1(
X)
.
0
1
2.
4
2
4.
8
17
40.
5
17
40 .
5
5
11.
9
0
0.
0
3.
55
2
0
0
0
1
1
0
O ve rall
12 6
1(
X)
.
0
0
0.
0
3
2.
4
28
22.
2
66
52 .
4
28
22.
2
1
0.
8
3.
95
C o m p an ies w ith
82
1(
X)
.
0
0
0.
0
1
1.
2
17
43
21
0
4.
02
Sep 訂ale div isio n
20 .
7
52 .
4
25.
6
0.
0
C o m p an ies w ilho u t
Se p ara te d iv isio n
42
1(
沿.
0
0
0.
0
2
4,
8
11
26.
2
21
50 .
0
1
2.
4
U n clea r
2
0
0
0
2
7
16 .
7
0
R ese arch e rs sho u ld
P rO d u c e e x ce lle n t
re se arc h re su lts l
re g ad le ss o f h o w
lo n g it tak es
R e se a rc h ers sh ou ld
t光 m m a g d in 由e
Sa ll杷 W ay aS
ad m inistra[
ive sta 汀
一112−
0
3.
80
.
Table51CorrelationBetweenNewProductRatioandNewProductsSalesRati0(Q.4)
(
F i変u r e 5 7 )
(F is c a l 1 9 9 0
D a ta )
h d u stけ ty p e
E x isten c e o r
m aJO r C ateg O ry
SeP a rate d iv isio n
*
F isca l lg 9 0 ra tlO O f sa le s
O f ne w p r。d u cts
h r n e w p ro d u cts
A l
14 .
2
8.
4
A 2
18 .
0
15 .
0
A 3
2.
2
15 .
3
*
A 4
10 .
0
5.
5
A 5
29 .
1
5.
8
A 6
27 .
0
27.
0
A 7
10 .
0
30.
0
A 8
10 .
0
30.
0
A 9
10 .
3
9.
0
A lO
2.
3
1.
6
A ll
30 .
0
93.
0
15 .
5
*
related
*
m a nu fa ctu rln g
*
in d u str
i es
*
*
A 12
16.
9
Å13
5.
0
10 .
0
A 14
16.
0
20.
0
*
A 15
3.
0
5.
0
*
A 16
10 .
0
10 .
0
36.
0
*
B l
36.
0
B 2
15 .
0
6.
0
B 3
10 .
0
10 .
0
*
B 4
20 .
0
25.
0
*
B 5
70 .
0
80.
0
*
*
*
relate d
F isc al 19 9 0 ratio
*
M a ted aト
M ac h in ery −
C o m p a n y n am e
B 6
30 .
0
40.
0
B 7
43.
0
43.
0
B 8
30 .
0
30.
0
B 9
45.
0
40.
0
B lO
30 .
0
34.
0
B ll
32.
0
17 .
0
7.
0
20.
0
15 .
0
m a nu fa ctu rln g
*
B 12
B 13
20 .
0
in d u str ies
*
B 14
20 .
0
10 .
0
*
B 15
20 .
0
20.
0
B 16
25.
0
25.
0
B 17
25 .
0
10 .
9
8 18
20 .
0
50.
0
*
B 19
30 .
0
35.
0
*
B 20
2.
0
0.
3
B 21
5.
0
10 .
0
20 .
0
*
O th e rs
*
C l
5.
0
*
C 2
30 .
0
10 .
0
*
C 3
0.
9
0 .
3
*
C 4
28 .
0
25.
0
*:Companieswi山aseparatedivision
Table52SimpleAverageofRati00fSalesforNewProducts(Q.4)
M a teria lィelate d
m a
n u fa cturln g in d u stfie s
M ach in ery −
re late d
m an u fac tu ring in d u str ie s
M a ter
i a 1−
relate d p lu s
m ach in ery −
re late d
O v e rall
No.
o f co m p an ies
N o.
o r c o m p an ie s
N o .o f c o m p an ies
No.
o f co m p an ie s
O v erall
13.
9
15
26.
5
21
2 1.
3
36
20 .
5
40
C om p 乱
n ie s w 血
Se P arate d iv isio n
13 .
8
10
29.
5
12
22.
4
22
21.
1
26
C o m p a n ies w 仙 o u t
Se p arate d iv ision
14 .
0
5
22.
5
9
19 .
5
14
19 .
5
14
Nole:DataforcompanyAllinTable51arenotincluded.
Table53SimpleAverageofRati00fSalesforNewProducts/Rati00fNewProducts(Q.4)
M ate rial−
reIa ted
m an u fa ctu rln g in d u stfie s
M ach in e ry −
rela te d
m a n u fa ctun n g in d u s tn e s
M ate rlal−
rela te d p lu s
m a ch in e ry −
re la ted
O v e ra ll
N o .o f c o m p an ie s
No.
o f co m p an ie s
N o.
o f co m p an ic s
N o .o r c o m p an ies
0 ve rall
1.
64
15
1.
10
21
1.
32
36
1.
3二
3
40
C o m p an ies w i血
1,
76
10
1.
25
1.
48
Sep a rate d iv isio n
12
22
1.
47
26
C o m p an ie s w
i th o u t
Sep a raは d iv isio n
1.
38
5
0.
89
9
1.
07
14
1.
07
14
Note:DataforcompanyAllinTable51afenOtincluded.
−113−
Thefbllowlngtablesshowsimpleaggregateresultsofquestionswhosecharacterwasslightlydiffbrentfromthose
analysedinthisreportandwerethereforerl0tincluded(refbrAnnexI Questionnaire).Alldataobtained丘omthe
questionnaireareslgnincantsowehaveincludedthesetablesforreference・
Q・3R&DOrganization(ClassinedbyScaleofR&DExpenditure)
In d ep e n d en t
Ind e p en d en t
Sin g le
1a bo ra to ry
T o tal
Sy Stem
Ind e p en d e n t
R &D
D e p an m e n t
R &D
d e p a珪m e n t
m u ltip le
1ab o rato ry
d e p artm e nl
CO IltrO llin g
p aralle l
Sy Ste nl
−
1 0 b il.ye n
10 −15 b il・y en
15 −
2 0 b il.ye n
20−
3 0 b il.y en
30胃
5 0 b il.y en
50−
1(
氾 b il.y en
1∝)
−
2 咲)b il.y en
W ith
m u ltip le
lab o ra10 d e s
(
孫)
O v e ra ll
B u sin ess
ln d ep en de n t
la 加)
ra tO ry
Sy Ste m
B u sin ess
de p artm en t
in d ep e n de n t
CO n trO llln g
C O nlp an y
lab o ral。り
Sy Sle m
0 山e r
U nc le ar
Sy Stem S
Sy Sten l
12 6
8
10
20
20
33
1
0
29
5
10 0 .
0
6.
3
7.
9
15 .
9
15 .
9
2(
i,
2
0.
8
0.
0
2 3.
0
4 .
0
12
1
1
2
2
3
0
0
2
1
9.
5
0.
8
0.
8
1.
6
1.
6
2.
4
0.
0
0.
0
1.
6
0 .
8
30
4
4
5
3
7
0
0
6
1
23.
8
3.
2
3.
2
4.
0
2,
4
5.
6
0.
0
0.
0
4 .
8
0.
8
19
1
0
3
4
5
1
0
5
0
15 .
1
0 .
8
0.
0
2.
4
3 .
2
4 .
0
0.
8
0.
0
4 .
0
0.
0
2(
i
0
1
6
5
9
0
0
5
0
20 .
6
0 .
0
0.
8
4 .
8
4 .
0
7.
1
0.
0
0.
0
4 .
0
0.
0
18
1
3
1
2
5
0
0
4
2
14 .
3
0.
8
2.
4
0 .
8
1.
6
4.
0
0.
0
0 .
0
3、
2
1.
6
8
0
0
1
2
2
0
0
3
0
6.
3
0.
0
0 .
0
0 .
8
1.
6
1.
6
0 .
0
0 .
0
2.
4
0.
0
3
0
0
1
2
0
0
0
0
0
2.
4
0.
0
0 .
0
0 .
8
1.
6
0.
0
0 .
0
0.
0
0.
0
0.
0
m o re は1an
9
1
1
1
0
2
0
0
4
0
2 ∝)b il.y en
7.
1
0.
8
0.
8
0.
8
0.
0
1.
6
0 .
0
0.
0
3 .
2
0 .
0
U n cle ar
1
0
0
0
0
0
0
0
0
1
0.
8
0.
0
0.
0
0.
0
0.
0
0 .
0
0.
0
0.
0
0 .
0
0 .
8
ー114−
Q.15BusinessandR&DStrategies
l
T O la l
(
冤1)
15 −
1 Y o ur co m p an y p ursue s h igh m arke tshare and c ost
e 爪cien cy
15 −
2 Y o ur co m p an y [
ak es ad va ntage of bein g a m ark et
’
‘
fo llo w er”
15 −
3 Y o ur eo m p any co nce nlrates its m a nage m en treso urc es in
a rew k ey m ark ets
1 5−
4 Y o ur co m p any p ursu es p ro fit for its sh areh olders
1 5−
5 Y o ur co m p any co m pe tes h ead−
On W ith co m p eLitors
1 5−
6 Y o ur co m p any d oes no tb csita tc to d ivest 鉦。m PO Or
bu sin ess are as
COn neC ted l∝hn olog leS
1 5−
8 Y o ur co m p any seek s co existence w ith co m pe titors
1 5A9 Y o ur co m p any ac tiv ely cu ltiv ates o verse as nlarkets
1 5−
10 Y ou r com pan y form u lates strateg leS O n the b asis o f
0句ec tive an aly sIS
1 5−
11 Y ou r com pany see ks to be an inn o vator
1 5r12 Y ou r com pan y actively lm Plem ents M &A
ap p lic ab le
3
M o re o r
C an n o t
1e ss
Say e i血e r
ap p lica b le
W ay
4
5
N o t v e ry
N ot
U nc le ar
12 (
う
20
50
24
25
5
2
15 .
9
39.
7
19 .
0
19 .
8
4 .
0
1.
6
12 (
)
0
11
33
56
24
2
10 0 .
0
0.
0
8.
7
2(
)
.
2
44 .
4
19 .
0
1.
6
12 6
2
40
35
40
7
2
100 .
0
1.
6
3 1.
7
27 .
8
31.
7
5.
6
1.
6
12 6
8
28
46
36
5
3
10 0 .
0
6.
3
22 .
2
3(
3.
5
28 .
6
4 .
0
2.
4
12 (
i
14
4(
う
40
20
4
2
100 .
0
1 1.
1
36 .
5
31.
7
15.
9
3.
2
1.
6
12 (
)
3
32
52
32
4
3
2.
4
25 .
4
4 1.
3
25 .
4
3.
2
2.
4
12 6
6
5 1
3 1
3 二
I
2
3
10 0 .
0
4.
8
40 .
5
24 .
6
26 .
2
1.
6
2.
4
12 6
8
53
46
15
2
2
10 0 .
0
6.
3
42 .
1
3(
う
.
5
11.
9
1.
6
1.
6
12 6
35
53
22
11
3
2
10 0 .
0
27.
8
42 .
1
17 .
5
8.
7
2.
4
1.
6
12 (
う
3
50
47
23
1
2
10 0 .
0
2.
4
39 .
7
37 ,
3
18 .
3
0 .
8
1.
6
12 6
11
48
37
27
1
2
10 0 .
0
8.
7
38 .
1
29 .
4
21.
4
0 .
8
1.
6
12 (
)
100,
0
3
19
38
49
15
2
2.
4
15 .
1
30 .
2
38 .
9
11.
9
1.
6
12 (
う
14
69
30
11
0
2
p lan s
100 .
0
1 1.
1
54.
8
23 .
8
8 .
7
0 .
0
1.
6
15 −
14 Introd uction o f ne w p ro duc ts is b ased on m ark eting
C aP ab ility
12 (
う
4
50
4 1
24
4
3
1(
X )
.
0
3.
2
39.
7
32.
5
19 .
0
3.
2
2.
4
15 −
13 P ersonn elrecn l血 len t is basd
o n lo昭 一
ten n perSO nn el
15 −
15 Y o ur com p any collects w id eィang lng d ata on u nre lated
m ark ets
15 −
16 Y o ur com p any pursues r)
O n−
P rice m arkelin g strategleS
15−17 Y o ur co m p any cm ph asises accum u latlO n O r diverse
tec bn olog lCalk n ow −
b ow
15−
18 Y o ur co m p any ’
s basic stra te gy lS in se parably related
to the un lqu e id eas o f the p resent or form er presiden t
15−
19 F u lfilm en to f so cial ob ligatiotlS is incorpo rated in to y our
C Om p any ’
s bu sine ss po licie s
15−
20 Y o ur co m p any activ ely ln VeStS in o verse as prod uctio n
Su bsidian c s
15−
2 1 Y o ur co m p any regu larly ad op ts the su gge stio ns o f loca l
m anag erS
15−
22 Y o ur co m p any p laces im po rtan ce o n the in tuitive jud g胃
m e nt of e xperienced m an agers w he n for
m
12 (
i
6
53
36
26
3
2
100 .
0
4.
8
42.
1
28.
6
20 .
6
2.
4
1.
6
12 6
10
50
3二
3
26
3
4
1 00 .
0
7.
9
39.
7
26.
2
20.
6
2.
4
3.
2
12 6
4
57
5 1
10
0
4
1(
X)
.
0
3.
2
45.
2
40.
5
7.
9
0.
0
3.
2
12 6
35
52
26
7
4
2
1 00 .
0
27.
8
41.
3
20.
6
5.
6
3.
2
1.
6
12(
)
1(
X )
.
0
u latlrLg Strateg le S
67
44
13
0
0
2
53.
2
34.
9
10 .
3
0.
0
0.
0
1−
6
126
22
53
3 1
13
3
4
1 00 .
0
17.
5
42.
1
24.
6
10 .
3
2.
4
3.
2
126
23
65
3 1
5
0
2
1(
X )
.
0
18.
3
51.
6
24.
6
4.
0
0.
0
1.
6
12 6
4
41
58
17
4
2
1(
粕.
0
3.
2
32.
5
46.
0
13.
5
3.
2
1.
6
−115−
A ve rag e
ap p lica b le ap p lica b le
100 .
0
1α)
.
0
1 5−
7 Y o ur co m p any re sb.
icts pr(
通uct div ersin catio ll tO
V ery
2
2.
5(
)
3.
75
3,
08
3.
02
2.
63
3.
02
2.
79
2.
60
2.
15
2.
75
2.
67
3.
44
2.
31
2.
79
2.
7 3
2.
69
2 .
55
2.
14
1.
56
2.
3(
1
2.
15
2.
8 1
Q .
25
B re a k d o w n o f R e se ar ch T he m e s b y “S e ed s T y p e”a nd
O vera11
T otal
(
%)
No.
or
reS匹n SeS
Seeds
type
N eeds
type
126
1(
X)
.
0
118
93.
7
33.
8
66.
2
“NeedsType”Research
U nclear
8
6.
3
Q.
2
7 Br
ea
kdownofRe
s
ea
r
chThemesb
yPr
opos
e
r
1
2
3
4
5
R&
D
R&
D
No
.
o
r l
n
d
i
v
i
d
u
a
l Re
s
e
a
r
c
h Re
s
e
a
r
c
h ma
n
a
g
e
一
d
i
v
i
s
i
o
n
e
s
e
a
r
c
h
e
r l
e
a
d
e
r
To
t
a
l r
e
S
匹
nS
e
Sr
g
r
O
u
p
me
n
t
d
i
r
e
c
t
o
r
(
%
)
di
v
i
s
i
o
n
0v
e
r
a
l
l
1
2
6
1
0
0.
0
1
0
4
8
2
.
5
1
5
.
5
3
0.
1
2
7.
7
6
.
9
4
.
8
6
7
8
S
a
l
e
s Ma
r
k
e
t
i
n
g Co
mp
a
n
y
Un
c
l
e
a
r
d
i
v
i
s
i
o
n d
i
v
i
s
i
o
n p
r
e
s
i
d
e
n
l
8
.
3
5
.
8
1
.
0
U llClear
A verage
0
0.
0
2.
97
0.
28 Res
ea
r
c
hThe
mes−
Numbe
rPr
opos
e
da
ndNu
mbe
rAd
An
n
u
a
l
umkro
r Nu
No.
o
f n
mb
e
r
r
e
s
e
a
r
c
h
r
e
S
P)
nS
e
S t
a
d
o
p
t
e
d
h
e
me
To
t
a
l
(
%
)
p
r
o
p
o
s
a
l
s
0v
e
r
a
l
l
1
26
1
(
泊
.
0
8
2
6
5
.
1
2
2
5
.
9
1
5
4.
7
Un
c
l
e
a
r
4
4
3
4.
9
Q.
31 Commi
s
s
i
oni
ngofRes
ear
c
hSt
r
at
e yFor
mu
l
at
i
onOut
SideofCompany
l
2
3
Co
mms
−
Co
mmi
s
−
Don
o
l
S
i
o
n
S
i
o
nt
o
c
l
e
a
r
C
O
m S
−Un
To
t
a
l
f
nl
i
a
t
e
d
O
u
t
S
i
d
e a
S
i
o
n
(
%
) C
O
mp
a
ny C
O
mp
a
ni
e
s
0v
e
f
a
l
l
1
2
6
1
α
)
.
0
1
3
1
0
,
3
0
0
.
0
1
1
2
8
8
.
9
1
0
.
8
Q .
31−
S Q I T y p e o f S trate gy C o m m issio n ed
3
4
Strategy
S trategy
Strategy
On n eW
research
rields
related to
establish−
m entof’
0VerSeaS
R &D b ase
1
3
7
1
1
100 .
0
7.
7
2 3.
1
53 .
8
7.
7
7.
7
1
1
2
l
8
100.
0
7.
7
7.
7
15 .
4
7.
7
6 1.
5
0
0
2
l
10
1(
沿.
0
0.
0
0.
0
15.
4
7.
7
76.
9
0
1
0
0
12
0.
0
7.
7
0.
0
0.
0
9 2.
3
l
A llR &D
Strategy
T otal
(
%)
Pd ority order l
Prior
i ty order2
汁iority order 3
R io血y order 4
N ot
applicable A pplicable
(
%)
(
%)
126
113
l二
3
1餅)
.
0
89 .
7
10.
3
126
113
13
100 .
0
89.
7
10.
3
126
1 13
13
1(
X)
.
0
89.
7
10.
3
126
113
13
1(
敗0
89.
7
10 .
3
100 .
0
Q .
32
2
L o喝−
tem
R &D
U n cleaf
E stab lish m e n t o f a D a ta B a se C o v e rin g In tellec tu a l A ch ie v e m e n ts
l
0 17eTall
2
3
4
5
6
7
T otal
(
%)
F ully
A d equatel
N ot
eslablished
established
established
126
1(
X)
.
0
19
15.
1
39
31.
0
23
18.
3
26
20.
6
−116−
11
8.
7
7
5.
6
1
0.
8
2
2
1
7
.
5
Annex3ListofSurveyedCompanies
The fbllowlnglS alist,in alphabetical order,Of the126companies whose responses to the
questionnaireformedthebasisofthisreport.Weshouldagainliketoexpressoursincereappreciation
tothesecompaniesfortheircooperation.
AishinSeikiC0.,Ltd.
KirinBreweryCo.,Ltd.
AjinomotoCo.,Ltd.
KobSteelLtd.
AlpsElecのcCo.,Ltd.
KokusaiElectricCo.,Ltd.
Komatsu,Ltd.
AsahiChemicalIndustl’yCo.,Ltd.
AsahiGlassCo.,Ltd.
KonicaCorporation
BridgestoneCorporation
KubotaCorporation
BrotherIndustries,Ltd.
KurarayCo.,Ltd.
CalsonicCorporation
KurehaChemicalIndustryCo.,Ltd.
CanonInc.
KyoseraCorporation
ChubuElectricPowerCo.,Ltd.
KyushuElectricPowerCo.,Inc.
DaiNipponnintingCo.,Ltd.
KyushuMatsushitaElectricCo.,Ltd.
Daihatsu MotorCo.,Ltd.
MatsushitaCommunicationIndus打ialCo.,Ltd.
DaiichiSeiyakuC0.,Ltd.
MatsushitaElectricIndustrialC0.,Ltd.
DaikinKogyoCo.,Ltd
MatsushitaElec廿icWo正S,Ltd.
DainipponInkandChemicals,Inc.
MazdaMotorCorporation
DainipponScreenMfg.Co.,Ltd.
MeijiSeikaKaisha,Ltd.
DenkiKagakuKogyouK.K.
MinoltaCameraCo.,Ltd.
EbaraCorporation
MitsubishiMaterialCorporation
EisaiCo.,Ltd.
MitsubishiMotorsCorporation
FujiElectricCo.,Ltd.
MitsubishiElec打icCorporation
FujiHeavyIndusbies,Ltd.
MitsubishiHeavyIndustriesLtd.
FujisawaPharmaceuticalCo.,Ltd.
MitsubishiChemicalIndustriesLtd.
FujitsuLtd.
MitsubishiPeb・OChemicalCo.,Ltd.
FurukawaElectricCo.,Ltd.,The
MitsuiPetrochemicalIndustries,Ltd.
HinoMotors,Ltd.
MitsuiToatsuChemicals,Inc.
HitachiCable,Ltd.
MurataMfg.Co.,Ltd.
HitachiConstruCtionMachineryCo.,Ltd.
NEcCorporation
Hitachi,Ltd.
NikonCorporation
HondaMotorCo.,Ltd.
NipponKayakuCo.,Ltd.
IshikawaJlma−HarimaHeavyIndustriesCo.,Ltd.
NipponMiningCo.,Ltd.
JapanRadioCo.,Ltd.
NipponOilCo.,Ltd.
JapanSyntheticRubberCo.,Ltd.
NipponTelegraphandTelephoneCorporation
KajimaCorporation
NipponSheetGlassCo.,Ltd.
KanegafuchiChemicalIndustryCo.,Ltd.
NippondensoC0.,Ltd.
KansaiElecbicPowerCo.,Inc.
NissanDieselMotorCo.,Ltd.
KaoCorporation
NissanMotorC0.,Ltd.
KawasakiHeavyIndus仕ies,Ltd.
NisshinSteelCo.,Ltd.
KawasakiSteelCorporation
ObayashiCorporation
KDD
OkiElectricIndusb’yCo.,Ltd.
ー117−
01ympusOpticalCo.,Ltd.
TohokuElectricPowerCo.,Inc.
OmronCorporation
TokuyamaSodaCo.,Ltd.
OnoPharmaceuticalCo.,Ltd.
TokyoElectricCo.,Ltd.
OsakaGasCo.,Ltd.
TokyoGasCo.,Ltd.
PioneerElectronicCorporation
TokyoElectricPowerCo.,Inc.,The
SankyouCo・,Ltd・
TonenSekiyuKagakuK.K.
SekisuiChemicalCo.,Ltd.
ToppanPrintingCo.,Ltd.
ShalT)Corporation
TorayIndustries,Inc.
ShimadzuCorporation
ToshibaCorporation
ShimizuCorporation
TosohCorporation
Shionogi&Co.,Ltd.
TotoLtd.
ShiseidoCo.,Ltd.
TdyoboCo,,Ltd.
SonyCorporation
ToyodaAutomaticLoomWorks,Ltd.
SumitomoChemicalCo.,Ltd.
ToyodaGoseiC0.,Ltd.
SumitomoHeavyIndustries,Ltd.
ToyotaMotorCorporation
SumitomoElectricIndustries,Ltd.
Tumura&Co.
SumitomoMetalIndustries,Ltd.
UbeIndustries,Ltd.
SumitomoRubberIndustries,Ltd.
VictorCompanyOfJapan,Ltd・
SuntⅣLtd・
YamahaCorporation
SuzukiMotorCorporation
YamahaMotorCo.,Ltd.
TaiseiCorporation
YamanouchiPharmaceuticalCo.,Ltd.
TakedaChemicalIndus打ies,Ltd.
Yamatake−HoneywellCo.,Ltd.
TanabeSeiyakuCo.,Ltd
YokohamaRubberCo.,Ltd.,The
TDKCorporation
ー118−
NoteofAppreciation
We shouldlike to take this opportunity to express our sincere appreciation fbr theimmense
COOPerationwereceivedfromvariouspeOPleinNISTEP,eSpeCiallyDr.AkiyaNagatafromthelst
Theory−0rientedResearch Group,Dr・MasatoshiMatsudafrom the2nd Theory−0rientedResearch
Group,Mr.Akitoshi Seike,Mr.Terutaka Kuwahara,Ms・Hiroko Sato,Mr.Taro Yuasa and Mr・
HidenobuAnanfromthe2ndPolicy−0rientedResearchGroup,throughouttheimplementationofthe
SurVeyandpreparationofthisreport.
We should alsoliketothankMr.KenInoue andMr.Yoshihiro Obikane fromI3Service fbrtheir
assistanceinthecomputlngOfthequestionnaireresults.
AndourspeCialthanksgoto thepeOplefrom thevarious companies whoactually且11edinthe
questionnaire・Withoutyourcooperationthissurveyandreportwouldnothavebeenpossible.Thank
youverymuch.
ForinqulneSPleasecontact:
MasaakiSawadaorMasaruTsukamoto
2ndPolicy−0rientedResearchGroup
NationalInstituteofScienceandTechnologyPolicy(NISTEP)
ScienceandTechnologyAgency
1−11−39Nagatacho,Chiyoda−ku,TokyolOO
Tel:(03)3581−2392
Fax:(03)3503−3996
−119−
徹や叫紳一一胃.級
唱4.1.5
【■ ̄ ̄ーニー {■■■■■■■−■㌢=昌一■−ノ
冊Ⅲ皿Ⅲll
OllOlOZ92◎


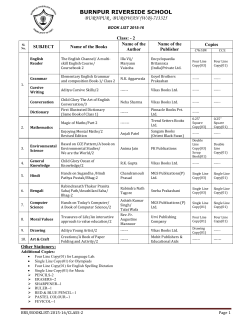
© Copyright 2026