
Living with Parkinson's Disease – update
Living with
Parkinson's Disease –
update
Parkinson's Australia
October 2011
Living with Parkinson's Disease - update
Contents
Acknowledgement ..................................................................................................................... i
Glossary .................................................................................................................................... ii
Executive Summary.................................................................................................................. iv
1
Background ..................................................................................................................... 9
2
PD in Australia............................................................................................................... 10
3
4
5
2.1
What is PD? .................................................................................................................... 10
2.2
What causes PD? ............................................................................................................ 10
2.3
2.4
Symptoms of PD.............................................................................................................. 10
Prognosis ........................................................................................................................ 11
2.5
2.6
Current treatment pathways ........................................................................................... 11
Recent medical advances ................................................................................................ 15
Prevalence and mortality of PD ..................................................................................... 18
3.1
Introduction.................................................................................................................... 18
3.2
3.3
3.4
Prevalence of PD ............................................................................................................. 18
Incidence of PD ............................................................................................................... 23
PWP residing in aged care facilities.................................................................................. 24
3.5
Deaths due to PD ............................................................................................................ 24
3.6
Projections...................................................................................................................... 28
Updating economic costs .............................................................................................. 30
4.2
Incidence and prevalence approaches ............................................................................. 32
4.3
Discount rates ................................................................................................................. 33
Health system costs ...................................................................................................... 35
5.2
Cost components ............................................................................................................ 36
5.3
Health system costs by disease stage .............................................................................. 39
5.4
Additional health system costs ........................................................................................ 39
5.5
Deep brain stimulation .................................................................................................... 42
5.6
Summary of health costs ................................................................................................. 42
6
Productivity costs .......................................................................................................... 47
7
Informal care and other financial costs .......................................................................... 52
7.1
Number of carers of PWP ................................................................................................ 52
7.2
Time spent caring for PWP .............................................................................................. 52
7.3
Updating the cost of informal care .................................................................................. 52
7.4
7.5
Out-of-pocket expenses .................................................................................................. 53
Government programs .................................................................................................... 54
7.6
7.7
Funeral expenses ............................................................................................................ 56
Summary ........................................................................................................................ 57
8
Transfers ....................................................................................................................... 58
8.1
Financial support for PWP ............................................................................................... 58
8.2
8.3
8.4
Financial support for carers of PWP ................................................................................. 59
Lost taxation revenue...................................................................................................... 60
Deadweight losses .......................................................................................................... 60
9
Burden of disease ......................................................................................................... 62
10
Total economic cost of PD ............................................................................................. 66
11
Sensitivity analyses ....................................................................................................... 73
12
11.1
11.2
Prevalence and incidence ................................................................................................ 73
Health system costs ........................................................................................................ 73
11.3
Deadweight Losses.......................................................................................................... 75
Conclusions ................................................................................................................... 77
References .............................................................................................................................. 79
Limitation of our work ............................................................................................................... 83
Charts
Chart 3.1 : Prevalence of PD by age, 2005 & 2011 ................................................................... 22
Chart 3.2 : Estimated PWP in aged care facilities by disease stage, 2011 ................................. 24
Chart 3.3 : Underlying cause of death idiopathic PD and secondary PD, 2000 to 2009 ............. 25
Chart 3.4 : PD Deaths, Females, 2011 ...................................................................................... 26
Chart 3.5 : PD Deaths, Males, 2011 ......................................................................................... 26
Chart 3.6 : Estimated deaths due to PD, 2011 vs. 2005, males (a) ............................................ 27
Chart 3.7 : Estimated deaths due to PD, 2011 vs. 2005, females (a) ......................................... 27
Chart 3.8 : Projected PD prevalence, 2011-2031...................................................................... 28
Chart 3.9 : Projected deaths due to PD, 2011-2031 ................................................................. 29
Chart 4.1 : 10-year Australian Government bond yields, daily; % ............................................. 34
Chart 5.1 : Health system cost components, 2011 .................................................................. 38
Chart 5.2 : Health system costs per person, component and age, 2011 .................................. 38
Chart 5.3 : Total health system costs by age ($m), 2011 ......................................................... 43
Chart 5.4 : Total health system costs per PWP, by age, 2011 .................................................. 44
Chart 5.5 : Total health system costs per PWP, by disease stage, 2011 ................................... 44
Chart 5.6 : Health System Costs by Cost Component, 2011 ..................................................... 45
Chart 5.7 : Health system costs, by who bears the cost, 2011 .................................................. 46
Chart 6.1 : Productivity costs per PWP ($), by age and sex ....................................................... 49
Chart 6.2 : Productivity costs per PWP ($), by disease stage, 2005 & 2011 (nominal) ............... 50
Chart 6.3 : Distribution of Productivity costs, 2011 .................................................................. 51
Chart 7.1 : Indirect costs per PWP ($), by disease stage ........................................................... 57
Chart 9.1 : Total DALYs, by age, 2011 ...................................................................................... 63
Chart 9.2 : DALYs per PWP, by age, 2011 ................................................................................. 64
Chart 9.3 : Total DALYs, by disease stage, 2011 ....................................................................... 64
Chart 9.4 : DALYs per PWP, by disease stage, 2011 .................................................................. 65
Chart 10.2 : Financial costs of PD, by bearer of cost, 2011 ....................................................... 67
Chart 10.3 : Financial cost of PD per PWP, by cost type, 2005 and 2011 (nominal) .................. 68
Chart 10.4 : Burden of Disease per PWP, 2005 and 2011 (nominal) ......................................... 69
Chart 10.5 : Net value of the burden of disease per PWP, by age ($), 2005 and 2011 (nominal)70
Chart 10.6 : Financial cost per PWP, by age ($), 2005 and 2011 (nominal) ............................... 70
Chart 10.7 : Net value of the burden of disease per PWP, by disease stage ($), 2005 and 2011
(nominal) ................................................................................................................................ 71
Chart 10.8 : Financial costs per PWP, by disease stage ($), 2005 and 2011 (nominal)............... 72
Tables
Table 3.1 : Estimated prevalence of PD in Australia, 2005 ....................................................... 19
Table 3.2 : Estimated prevalence rates and cases of PD, 2011 ................................................. 22
Table 3.3 : Incidence of PD, 2011 ............................................................................................ 23
Table 4.1 : Schema for cost classification ................................................................................. 31
Table 5.1 : Health system costs, 2000-01 ................................................................................ 36
Table 5.2 : Health system costs, 2011 ..................................................................................... 36
Table 5.3 : Health system costs per PWP, by disease stage, 2011 ........................................... 39
Table 5.4 : Hospital admissions PWP ...................................................................................... 40
Table 5.5 : Additional health system costs ($), 2011 ................................................................ 41
Table 5.6 : Additional health system costs per PWP 2011, by age and sex .............................. 42
Table 5.7 : Additional health system costs per PWP, by disease stage, 2011 ........................... 42
Table 6.1 : Summary of productivity costs in 2011 and 2005 (nominal), $m ............................. 48
Table 6.2 : Real and nominal earnings growth 2005-11, by age group ..................................... 49
Table 7.1 : Estimating the cost of informal care, 2005 & 2011 (nominal) ................................. 53
Table 7.2 : Additional use of aids and modifications due to PD (by disease stage) and average
cost of aids in 2011 ................................................................................................................. 54
Table 7.3 : Assumptions maintained from 2007 report ............................................................ 55
Table 7.4 : Government expenditure on selected community care programs (2009-10), $m.... 56
Table 7.5 : Other financial costs of PD ($m), 2005 and 2011 (nominal) .................................... 57
Table 8.1 : Additional DSP payments to PWP, 2011 ................................................................. 59
Table 8.2 : Income support to carers, 2010-11 ........................................................................ 59
Table 8.3 : Summary of transfers and deadweight losses, 2011 ............................................... 61
Table 9.1 : Estimating the burden of PD in 2011, by disease stage ........................................... 62
Table 10.2 : The total cost of PD by cost type and bearer of cost ($m), 2011 .......................... 68
Table 11.1 : Analysis using upper and lower bound prevalence estimates, 2011 ...................... 73
Table 11.2 : Health system expenditure .................................................................................. 74
Table 11.3 : High health expenditure scenario sensitivity analysis ........................................... 75
Table 11.4 : High and low DWL scenarios sensitivity analysis ................................................... 76
Figures
Figure 2.1 : Management of early Parkinson’s disease............................................................. 13
Figure 2.2 : Treatment of advancing Parkinson's disease and non-motor complications .......... 14
Figure 4.1 : Incidence and Prevalence Approaches to Measurement of Annual Costs .............. 33
Figure 10.1 : Financial costs of PD, by cost type, 2011 ............................................................. 66
Living with Parkinson's Disease - update
Acknowledgement
This report was prepared by Deloitte Access Economics for Parkinson’s Australia, partly
funded by a generous grant from Abbott Australia, who had no part in the directions and
findings contained in the report.
Deloitte Access Economics
i
Glossary
ABS
Australian Bureau of Statistics
ADL
activity of daily living
AEM
Access Economics Macroeconomic Model
AIHW
Australian Institute of Health and Welfare
ATO
Australian Taxation Office
BEACH
Bettering the Evaluation and Care of Health
BOD
Burden of Disease
CACP
Community Aged Care Program
CPI
Consumer Price Index
DBS
Deep Brain Stimulation
DALY
disability-adjusted life year
DCIS
Disease Costs and Impact Study
DAE
Deloitte Access Economics
DAE DEM
Deloitte Access Economics Demographic Model
DOHA
Department of Health and Ageing
DSP
disability support pension
DWL
deadweight loss
EACH
Extended Aged Care Program
GP
General Practitioner
HACC
Home and Community Care Program
HSE
Health and Safety Executive
MRI
magnetic resonance imaging
NHPAC
National Health Priority Action Council
NINDS
National Institute of Neurological Disorders and Stroke
NPV
net present value
NRCP
National Respite for Carers Program
OBPR
Office of Best Practice Regulation
PA
Parkinson’s Australia
PBS
Pharmaceutical Benefits Scheme
PC
Productivity Commission
PD
Parkinson’s disease
FAHCSIA
Department of Families, Housing, Community Services and
Indigenous Affairs
PWP
People with Parkinson’s disease
VHC
Veterans Home Care Program
VSLY
value of a statistical life year
YLD
years of healthy life lost due to disability
YLL
years of life lost due to premature death
Executive Summary
Parkinson’s disease (PD) is the second most common neurological condition in Australia
but remains one of the least understood in terms of its cause. There is a lack of awareness
in the health and general community of the challenges and needs of those suffering from
this complex and disabling condition, as well as community stigma and constraints in the
delivery of health and social support services. As a result, Australia needs to develop a
greater, more positive public awareness and understanding of PD among the general
community.
Since the 2007 Access Economics report ‘Living with Parkinson’s disease: Challenges and
positive steps for the future’ was published, limited progress has been made in relation to
the recommended ‘positive steps’. This updated report highlights that a growing number
of Australians are living with PD, and that PD will continue to be associated with significant
and growing health system, lost productivity and other costs.
Key findings
PD is a chronic, progressive, incurable, complex and disabling neurological condition. PD
sufferers and their carers are confronted with major issues of disability including tremor
(trembling in hands, arms, legs, jaw and face), rigidity and stiffness of limbs and trunk,
sudden slowness and loss of spontaneous movement and impaired balance and
coordination. However, in many cases, PD results in impaired speech and various mental
health issues, such as depression and anxiety arising from both the impacts of the disease
on individuals, the pathology of the disease and the side effects of medications. Other
symptoms include sleep disruptions, difficulty with chewing and swallowing and urinary
and constipation problems.
Incidence, prevalence and mortality
It is conservatively estimated that in 2011 1 over 64,000 Australians were living
with PD, of which, 52% were male and 48% were female. This equates to 283
per 100,000 in the total Australian population, or 857 per 100,000 among the
population aged over 50. Based on these estimates, approximately one in
every 350 people in Australia lives with PD.
The proportion of people with PD (PWP) is related to the size of the older population.
As such, it is expected to grow with population ageing.
Over 80% of PWP are aged over 65 years. However, people are diagnosed as young as
30 years. This report estimates that in 2011 there were over 2,000 PWP aged in their
30s and 40s.
More than 12,000 Australians of working age (15-64) are estimated to be living with PD,
comprising 19% of PWP.
1
Throughout the report, ‘2011’ refers to the financial year 2010-11 (i.e. June 2010 – June 2011.
An estimated 10,500 new cases of PD were diagnosed in 2011, equivalent to nearly 30
new diagnoses every day.
The median time from onset to death is 12.2 years, though many PWP live with the
disease for well over 20 years.
In 2011, an estimated 6,600 PWP are residing in aged care facilities, of which 188 are
aged younger than 65 years (equal to 1.6% of all PWP aged younger than 65 years).
PD is a surprisingly prevalent condition – in 2005, estimated prevalence was higher than
a number of diseases and injuries considered National Health Priority Areas (NHPAs)
including:
•
Some cancers, such as prostate cancer, lymphoma and leukaemia, kidney and
bladder cancer, and uterine, cervical, and ovarian cancer (and breast cancer,
colorectal, stomach, liver and pancreatic cancer for people aged over 55
years).
•
Injuries such as homicide and violence, suicide and self-inflicted injuries, fires,
burns and scalds, and machinery accidents.
Compared to other neurological conditions, in 2005, PD had the second highest prevalence
and number of deaths (exceeded only by dementia).
Costs
The total financial cost of PD per annum in 2011 was approximately $775.4
million.
In addition, there were $35.9 million of transfer payments – lost tax revenue and welfare
payments. These payments change the distribution of who bears the costs, and are also
associated with smaller real efficiency losses from reallocation of resources, called
‘deadweight losses’ (DWL).
Health system costs were by far the largest component of the financial costs of PD ($478.5
million, 62%). For every hospital admission directly due to PD, there were at least two
additional admissions due to complications that were coded to a different disease or injury
(Temlett and Thompson, 2006).
Deadweight losses represented the next greatest cost ($121.3 million, 16%), followed by
costs relating to lost productivity for PWP ($107.3 million, 14%). Productivity costs were
higher for males aged 50-59 (largely reflecting their higher earnings profile).
The estimated cost of informal care provided to PWP more than doubled between 2005
and 2011 ($11.2 million vs. $5.4 million). This measures income in a formal work
environment foregone by carers. The growth reflects the additional PWP and higher
average earnings in the workforce.
The average financial cost per PWP in 2011 was around $12,000, an increase of 48% since
2005. However, financial costs in relation to PD are incurred for many years. Although the
median years lived with PD is 12.2 years, many people live with the disease for well over 20
years. For someone living with PD for 12 years, the average lifetime financial cost is
around $144,000, which is on par with the lifetime cost of cancer ($165,000 2).
In addition to financial costs, the burden of disease – the suffering and premature death
experienced by people with PD – is estimated to cost an additional 46,069 Disability
Adjusted Life Years (DALYs) (years of healthy life lost), with 76% due to disability and the
remaining 24% due to premature death. The net value of the burden of disease was
$7.6 billion in 2011.
The total economic cost3 of PD in 2011 was $8.3 billion.
Growth in prevalence and costs
It is estimated that by 2031 there will be 115,300 PWP, equating to average growth in
prevalence of 4% per annum over the next 20 years.
There were an additional 9,300 PWP in 2011 compared to 2005, equating to growth of
17% over the 6-year period.
The incidence of PD (i.e. the number of new cases each year) increased at an average
rate of 3% per year over the 6-years to 2011.
The financial cost of PD increased by 48% since 2005, largely due to the growth in
health system costs and productivity costs.
The estimated value of the burden of disease increased by 21% from the 2005
estimate.
Overall, the total economic cost of PD per annum has increased by 23% since 2005.
2
Based on 2007 cost of $114,500 from Access Economics (2007b)
3
The net value of the burden of disease plus the financial cost of PD
Chart i: Estimated cost of PD ($m), 2005 and 2011 (nominal)
8,000
7,564.2
7,000
6,262.7
6,000
Cost ($m)
5,000
4,000
3,000
2,000
1,000
775.4
524.1
0
Financial costs
Burden of Disease
2005
2011
Positive steps – progress since 2007 and the way forward
Overall, there has been limited progress regarding government actions and policies relating
to PD and the “Positive Steps” identified in the 2007 report. Some positive developments
include:
the development of an online education program for GPs which is widely used;
approval of some new medications; and
the establishment of a Neurological Alliance.
A major challenge facing advancement in reducing the burden of PD is the lack of
government funding for services focussed specifically on PD. PD is not formally recognised
as a chronic disease under the Australian Government National Chronic Disease Strategy,
and is therefore not able to access funding under that Strategy. Over a lifetime, PWP
experience greater disability than people with any of the conditions that are recognised as
chronic (including cancer, diabetes, heart disease, stroke and vascular disease).
There remains a lack of awareness in the general community and in many parts of the
health services community, of the challenges and needs of PWP, their families and carers.
This often results in sub-optimal care, amplifying suffering and leading to higher associated
costs. This is exacerbated for people with early onset PD, who often have additional needs
(e.g. forming relationships, children and financial planning), and for whom dedicated
services are currently very limited.
A lack of synthesis in the approach to tackling PD has resulted in many effective treatments
being too expensive. For example, a medication may be listed on the Pharmaceutical
Benefits Scheme (PBS), but the consumables required to administer it may not be.
A key positive step for the future relates to funding for the education of specialist
Parkinson’s nurses. In Australia in 2011, there are 33 specialist Parkinson’s nurses,
compared with 264 in the UK, none of whom are funded by the Australian Government
(based on advice from the Movement Disorders Faculty of the Royal College of Nursing).
Based on evaluation undertaken in the UK, a single Parkinson’s nurse can save
approximately $60,000 in consultant appointments, $105,000 in avoided hospital
admissions and $194,000 in hospital bed days per annum (Parkinson’s UK, 2011). The
potential benefits are stark in the context of growing numbers of PWP and significant and
growing health system and other financial costs in Australia going forward.
Deloitte Access Economics
October 2011
Living with Parkinson's Disease - update
1 Background
The purpose of this report is to provide an update to the 2007 report, ‘Living with
Parkinson’s Disease’. It is not the intention to replace that report, rather, to update
information where necessary.
The report is structured as follows:
In section 2, there is a description of PD, its impact on the individual, and treatment
pathways, covering major recent advances from research since the original Access
Economics report was released.
Prevalence and mortality of PD in Australia, with twenty years of projections
(2011-2031) are presented in section 3. This includes analysis of prevalence by disease
stage, the number of people with PD residing in aged care facilities and deaths due to
PD. The updates are based on current demographic data. A literature scan was
undertaken to search for any new epidemiological data, and this is described in section
3.
Estimates are presented of the economic impacts of PD over a twenty-year forecast
period (2011-2031) on:
•
•
health system costs in chapter 5;
productivity in chapter 6;
•
•
informal care costs and other financial costs in chapter 7; and
efficiency losses from transfers (income support and taxation foregone) in
chapter 8.
The burden of disease is presented in chapter 9.
The total economic impact of PD in Australia is summarised in chapter 10.
Sensitivity analysis is presented in chapter 11.
Conclusions, highlighting progress in policy and programs are outlined in chapter 12.
Deloitte Access Economics
9
Living with Parkinson's Disease - update
2 PD in Australia
2.1 What is PD?
PD is a disease of the central nervous system, affecting in particular the autonomic nervous
system. Degeneration of nerve cells, or neurons, that normally produce dopamine impairs
the transmission of signals within the brain resulting in a reduced ability to control muscle
activity. For details on different types of PD, see Access Economics (2007a).
2.2 What causes PD?
The cause of PD is essentially unknown. Many risk factors have been proposed, however,
scientific evidence has not been found to support a large effect. Possible causes identified
include (NINDS, 2005:
Accelerated ageing — PD may be an acceleration of the normal, age-related
deterioration of neurons.
Oxidative damage – Free radicals are unstable and potentially damaging molecules
generated through normal chemical reactions in the body.
Environmental toxins – an external or internal toxin which destroys the neurons.
Genetic predisposition – 15% to 20% of PWP have a close relative who has also
experienced PD symptoms.
Further details of these factors and other potential risks are described in Access Economics
(2007a).
2.3 Symptoms of PD
Symptoms of PD are varied, however, the four major symptoms of PD are (NINDS, April
2005b):
Tremor – trembling in hands, arms, legs, jaw or face. Tremor usually, but not always,
begins in a hand and affects only one part or side of the body – especially during the
early stages, although in later stages it may become more general. Tremor usually
disappears during sleep or improves with intentional movement.
Rigidity – stiffness of the limbs and trunk. The basic principle of movement is that all
muscles have an opposing muscle – thus movement is enabled when one muscle is
activated and the opposing muscle is relaxed. Rigidity occurs when, due to brain
signals, the opposing muscle remains contracted when one muscle becomes active.
Facial expression may also become rigid and inflexible.
Akinesia and Bradykinesia – slowness or loss of spontaneous movement that is
unpredictable in when it occurs and can be the most disabling symptom as it can
severely impact on simple, every-day activities – thus reducing independence.
Postural Instability – postural instability, impaired balance and coordination. Postural
instability can cause PWP to have a stooped posture. PWP may develop a forward or
Deloitte Access Economics
10
Living with Parkinson's Disease - update
backward lean and can fall easily – which can sometimes result in injury. In later stages
walking may be affected – PWP may halt in mid-stride or may walk with a series of
quick, small steps as if hurrying forward to keep balance.
Further information on other symptoms can be found in Access Economics (2007a).
2.4 Prognosis
PD is a chronic and progressive disease with substantial disability. The stages of PD were
described in Access Economics (2007a). The majority of PWP remain in the early stages of
the disease for a considerable period of time before moving to the next stages of the
disease or dying. PWP do not necessarily progress from one stage to the next, but can drop
down a stage during treatment or experience accelerated progression. The median time
from disease onset to death is 12.2 years.
2.5 Current treatment pathways
There is no definitive test for PD – diagnosis is often based on medical history and the
presence of the classic symptoms and signs of PD. Sometimes people are given anti-PD
drugs to see if they respond, or other tests may be performed, such as MRI and CAT scans,
to rule out other disorders with similar symptoms. The presence of other diseases, such as
dementia and general ageing can obscure PD symptoms and reduce the chance of an
accurate diagnosis. Consequently, many PWP in Stage I are often under- or misdiagnosed
and the time from disease onset to diagnosis can be substantial.
Currently there is no cure for PD. Figure 2.1 and Figure 2.2 show the current guidelines for
treating PD. The main treatment for PD is a selection of drugs that attempt to temporarily
replenish or mimic dopamine in the brain. Drug treatment regimes are complex, with
continual and slight adjustments in dosages, timing and combinations of drugs to reduce
symptoms. Consequently adequate medication management is an important contributor
towards reducing unnecessary disease burden.
Commonly prescribed medication includes:
Dopaminergic or Related Therapies
•
Levodopa is the main drug used to treat PD. Nerve cells can use this drug to
produce additional dopamine (dopamine cannot be used directly as it does
not cross the blood-brain barrier). However it can have significant side
effects including nausea, vomiting, low blood pressure, involuntary
movements (dyskinesia), restlessness and confusion. The ability for levodopa
to reduce the symptoms of PD wears off over time and the level of symptoms
may also change suddenly during the day due to responses to the drug –
called the “on-off” effect.
•
Carbidopa or benserazide is often added to levodopa to delay its conversion
to dopamine until it reaches the brain thus improving its effectiveness. It
also reduces the side effects of levodopa by allowing PWP to have fewer and
smaller doses. It also reduces the “wearing-off” effect.
Selegiline, also known as deprenyl, inhibits the enzyme monoamine oxidaseB (MAO-B) which metabolises dopamine in the brain. This delays the need
•
Deloitte Access Economics
11
Living with Parkinson's Disease - update
for levodopa in the early stages of PD by 8 to 12 months (Rubenstein, 2001:
740) and can be used to boost levodopa (to reduce wearing off and on-off
effects). Side effects include nausea, orthostatic hypotension and insomnia.
Dopamine Agonists
• Bromocriptine, pergolide, pramipexole, cabergoline and ropinirole mimic
dopamine in the brain and can be used as an alternative4 (in the early stages)
or to boost levodopa (to reduce wearing off and on-off effects) – thus
delaying the start of levodopa therapy and the associated side effects. Alone
these drugs are less effective than levodopa and their side effects include
paranoia, hallucinations, confusion, dyskinesia, nightmares, nausea and
vomiting. PBAC had recommended the listing of ropinirole on the PBS for PD
in December 1997, but it was never listed as the sponsor decided not to
proceed with the listing. In March 2006 PBAC rejected listing of ropinirole for
the treatment of restless legs syndrome (Department of Health and Ageing
2006).
•
Apomorphine, given subcutaneously, is a very potent dopamine agonist
(works within 3-20 minutes of injection), however it has a brief duration (half
an hour to an hour) and must be taken with domperidone (an antiemetic) to
counteract nausea (Chaudhuri, 1998). It is often used as a rescue drug for
PWP who have found that the effectiveness of oral medications has reduced
and their “on-off” fluctuations have increased, but is also effective as a
continuous daytime subcutaneous infusion.
Catechol-O-Methyltransferase (COMT) inhibitors
•
Tolcapone and entacapone extend the duration of the effectiveness of
levodopa by inhibiting the enzyme COMT from degrading levodopa. Studies
have shown that they have allowed a reduction of total daily levodopa
dosage by 30% and reduce motor fluctuations and the end of dose “wearing
off” effect (Rubenstein, 2001: 743). Entacapone is now available in a single
medication with levodopa and carbidopa. However tolcapone was deregistered with the TGA due to liver side-effects in 1999.
•
Anticholinergic agents, or muscarinic antagonists, block acetylcholine, the
effects of which become more pronounced when dopamine levels fall. They
are less effective than dopamine and dopamine agonists but can help to
control tremor and rigidity. Side effects include dry mouth, constipation,
urinary retention, hallucinations, memory loss, blurred vision, changes in
mental activity and confusion. Agents include trihexyphenidyl hydrochloride,
benztropine mesylate, procyclidine and ethopropazine hydrochloride.
Amantadine is an antiviral drug which reduces symptoms of PD, although the
impact wears off after a couple of months. Used in the early stages or to
boost levodopa or anticholinergics. Side effects include mottled skin,
oedema, confusion, blurred vision and depression (NINDS, April 2005b).
•
4
Dopamine agonists can delay levodopa therapy by 2 to 3 years (Rubenstein 2001: 741).
Deloitte Access Economics
12
Living with Parkinson's Disease - update
Figure 2.1: Management of early Parkinson’s disease
Source: Neurology Expert Group (Therapeutic Guidelines Limited) 2007.
Deloitte Access Economics
13
Living with Parkinson's Disease - update
Figure 2.2: Treatment of advancing Parkinson's disease and non-motor complications
Source: Neurology Expert Group (Therapeutic Guidelines Limited) 2007.
Other therapies for PD include:
Surgery – Surgery is often reserved for PWP whose symptoms can no longer be
managed medically.
Procedures include neuro-stimulation, thalamotomy and
pallidotomy, where a probe is inserted and destroys a small part of the brain
(lesioning).
Deloitte Access Economics
14
Living with Parkinson's Disease - update
Physiotherapy – Physiotherapy or muscle-strengthening exercises are often used to
help improve mobility (especially balance), gait problems, flexibility, general fitness,
and muscles used in speech and swallowing.
Speech Therapy – PD can significantly reduce an individual’s ability to communicate
with others through the combination of speech disorders (dysarthria) and the reduction
in visual cues, such as facial expressions and hand gestures. This causes difficulties in
using a telephone or talking to strangers, thus increasing social isolation and
depression. Speech therapists can assist in reducing dysarthria through behavioural
treatment techniques (drills and exercises) focusing on pitch, volume, respiration, voice
production and intelligibility (Deane, 2001a). Therapists can also provide careful
assessment and diagnosis of swallowing problems (dysphagia) and advise on
swallowing technique, exercise and may offer dietary alternatives and advise on food
consistency to reduce the risks of ill health (such as an increased chance of pneumonia)
and promote safety and comfort in swallowing (Deane, 2001b).
Occupational Therapy – Occupational therapists can help maintain self-care, work and
leisure activity for as long as possible, thus maximising independence, and ensure that
the home and workplace are safe environments, thus minimising the likelihood of
injuries. Interventions may include support in organising the daily routine, learning
new skills for alternative or adaptive ways to carry out activities, or providing and
advising on specialist equipment or resources, for example, mobility aids, home or car
modifications (Deane, 2001c).
Education, Counselling and Social Support – These programs are very important for
chronic disease management and can have significant impacts on quality of life
through: increasing the understanding of PD; improving coping skills; developing
problem-solving strategies; improving health confidence; encouraging the PWP to
remain physically and socially active; and optimising medical treatment and compliance
rates (Montgomery, 1994). In addition to helping PWP, some of these programs focus
on assisting carers learn how to take care of PWP directly or take on new roles within
the family unit, such as learning to perform household chores or home/vehicle
maintenance.
2.6 Recent medical advances
2.6.1
Deep brain stimulation
Deep brain stimulation involves implanting an electrode on the brain. This is used to
deliver high frequency stimulation and block electrical signals targeted to areas of the brain
that control movement blocking the abnormal nerve signals that cause tremor and PD
symptoms. Generally, these targets are the ventrointermedialis nucleus of the thalamus
(VIM), subthalamic nucleus (STN), and globus pallidus pars interna (GPi).
Before the procedure, a neurosurgeon uses an MRI, CAT scanning or microelectrode
recording to identify and locate the exact target in the brain generating the PD symptoms.
The DBS system consists of three components:
The lead (also called an electrode)—a thin, insulated wire—is inserted through a small
opening in the skull and implanted in the brain. The tip of the electrode is positioned
within the targeted brain area.
Deloitte Access Economics
15
Living with Parkinson's Disease - update
The extension is an insulated wire that is passed under the skin of the head, neck, and
shoulder, connecting the lead to the neurostimulator.
The neurostimulator (the "battery pack") is usually implanted under the skin near the
collarbone, chest or abdomen.
Once the system is in place, electrical impulses are sent from the neurostimulator up along
the extension wire and the lead and into the brain. These impulses interfere with and block
the electrical signals that cause PD symptoms (NINDS, April 2005c).
DBS mimics the effects of surgical destruction but has:
a markedly reduced risk of permanent side effects;
the ability to reverse the procedure if a better treatment is developed in the future;
and
the amount of stimulation is easily adjustable—without further surgery—if the
condition changes.
At present, this procedure is only available for PWP whose symptoms can no longer be
managed medically. While most PWP still need to take medication after undergoing DBS,
many PWP are able to greatly reduce the amount of medication taken.
In 2006, the Australian Government agreed to fund deep brain stimulation for Parkinson’s
disease (MSAC, 2006). In 2006-07, 91 DBS procedures were administered to PWP and in
2009-10 there were 224.
DBS can be administered to both sides of the brain (bilateral) or to one side of the brain
(unilateral). Around 90% of the procedures administered in 2009-10 (199 procedures) were
bilateral. The total cost to the government for all DBS procedures for PWP in 2009-10 was
$792,428.
2.6.2
Improved diagnosis
Researchers from the Prince of Wales Medical Research Institute, the Royal North Shore
Hospital, and the University of Würzburg, Germany, developed a new blood test with
improved diagnostic accuracy for the early diagnosis of PD. The test focuses on the death
of neuromelanin-containing pigmented brain cells, which may be identified through a blood
test for a new protein created by the body’s immune response. The test is currently being
refined and a multicentre, international study is being conducted to determine the
usefulness of the test to objectively and sensitively diagnose PD in clinical practice.
Researchers from the Prince of Wales Medical Research Institute and the University of
Saarland, Germany, are also examining the use of ultrasound imaging to improve the
diagnostic accuracy of PD (POWMRI 2007).
Similar research is also being conducted by researchers from the Howard Florey Institute,
The University of Melbourne and The Mental Health Research Institute of Victoria.
Deloitte Access Economics
16
Living with Parkinson's Disease - update
2.6.3
Improved drug delivery
Clinical trials of transdermal patches for the delivery of PD drugs (namely the dopamine
agonist rotigotine) are currently underway. The continuous delivery may prove to be
superior to oral delivery due to a reduced occurrence of the “on-off” effect (Moyer 2004).
2.6.4
Stem cell research
Stem cells are unspecialized cells that consistently have the ability to produce an identical
copy of themselves when they divide and can be induced to become cells with special
functions, such as dopamine producing cells.
Adult stem cells are derived from numerous sources, including the umbilical cord, placenta,
bone marrow, nose, blood and other places in the human body. Most adult stem cells are
multipotent and thus can develop only into closely related cells – for example, red and
white blood cells). The main advantage of using adult stem cells from the same patient is
that they do not carry the same risk of immune rejection and hence there is no need to use
anti-rejection drugs.
Several studies have been successful in using adult stem cells to treat PD (Australian
Government, 2005):
Pre-Clinical Trials: differentiation of various adult stem cells to dopaminergic neurones
and transplantation in mice/rats led to increased dopamine production.
Clinical Trials: A phase 2 trial is in progress in the US with cultured retinal pigment
epithelial cells (68 patients).
Embryonic are stem cells derived from the inner cell mass of a blastocyst (an early stage
embryo approximately 4 to 5 days old). Embryonic stem cells are pluripotent and thus can
develop into all or many of the different cells contained in the body (but not the whole
organism).
Deloitte Access Economics
17
Living with Parkinson's Disease - update
3 Prevalence and mortality of PD
3.1 Introduction
This chapter reviews the prevalence and mortality estimates for PD in Australia from the
2007 Access Economics study. Projections for cases of PD are provided over a twenty year
time horizon, 2011 to 2031. The analysis is therefore based on epidemiological estimates
from the 2007 study, updated to reflect current demographic data and population
projections.5 PubMed/Medline6 was scanned for updated prevalence and mortality
literature and relevant information is included in the discussion. Section 3.2 provides
updated projections of PD prevalence by disease stage and the number of people with PD
residing in aged care facilities, while Section 3.5 focuses on updating projections of
mortality related to PD.
3.2 Prevalence of PD
3.2.1
2007 Summary
There is (and was in 2007) no data for confirmed PD diagnosis that may be used to estimate
prevalence. This is because there is no definitive test to confirm diagnosis of PD, which
results in a potential for under-diagnosis and misdiagnosis. The approach adopted in the
2007 Access Economics study to estimate PD prevalence was derived from analysis of
Pharmaceutical Benefits Scheme (PBS) data. That is, data for prescriptions commonly
involved in the treatment of PD.7 A full discussion of the methodology was provided in
Section 3 of the 2007 Access Economics study.
The 2007 Access Economics study found that PD was a, “Surprisingly prevalent condition –
with higher prevalence than a number of diseases and injuries considered National Health
Priority Areas”. It was, “conservatively estimated that in 2005 over 54,700 Australians had
5
Definitions used in this report are the same as in the 2007 AE study – i.e. “a broad definition of PD is used that
incorporates both primary and secondary PD as all these people experience similar symptoms and treatments”
(p. 15).
6
US National Library of Medicine, National Institutes of Health, http://www.ncbi.nlm.nih.gov/pubmed/
(accessed 5 July 2011).
7
The risks with this approach were identified as follows:
“Overestimation of prevalence may occur due to some non-PD conditions being misdiagnosed as PD and
because medications used to treat PD can be used for the treatment of other diseases (especially Restless
Legs Syndrome, schizophrenia, some types of dystonia in adults and children, pituitary tumours and bladder
problems); and
Underestimation of prevalence may occur due to under-diagnosis of PD or the misdiagnosis of PD as nonPD, as this may result in non-medicated cases or the use of other drugs to treat misdiagnosed PD.
Furthermore, some cases may be deliberately un-medicated due to:
•
having low levels of disability and the wish to temporarily delay the use of medication (which falls
in effectiveness over time);
•
suffering significant side effects; or
•
no longer responding to the available medications.” (p. 16).
Deloitte Access Economics
18
Living with Parkinson's Disease - update
PD”. Approximately 8,900 new cases were estimated to have occurred in 2005 (p. i). The
estimates by disease stage and demographic segment are set out in Table 3.1. PD
prevalence estimates increased considerably with age – ranging from 290 per 100,000
people aged 55-64, up to 2,940 per 100,000 for people aged over 85 years. In terms of the
whole Australian population, this equated to approximately 270 PWP per 100,000 in 2005.
Table 3.1: Estimated prevalence of PD in Australia, 2005
Age
Prevalence rates
(% of population)
M
F
Total
Cases, 2005
M
F
Cases per 100,000
population, 2005
Total
M
F
Total
0-4
0.00
0.00
0.00
0
0
0
0
0
0
5-14
0.00
0.00
0.00
0
0
0
0
0
0
15-24
0.00
0.00
0.00
0
0
0
0
0
0
25-34
0.02
0.00
0.01
244
0
244
17
0
9
35-44
0.03
0.01
0.02
477
173
651
32
11
22
45-54
0.14
0.06
0.10
1,957
805
2,762
141
57
99
55-64
0.34
0.25
0.29
3,712
2,695
6,407
337
248
293
65-74
1.22
0.99
1.10
8,335
7,096
15,431
1,223
992
1,105
75-84
2.33
1.92
2.10
9,621
10,374
19,994
2,328
1,924
2,099
85+
Total
3.69
0.28
2.59
0.26
2.94
0.27
3,738
5,497
9,234
26,600
54,700
2,587
260
2,944
28,100
3,691
278
269
Note: Rows and columns may not sum due to rounding.
Source: Access Economics, 2007, p. 20.
3.2.2
New information from the literature since the 2007 Access
Economics study
PubMed/Medline8 was scanned for literature published since the 2007 Access Economics
study. The focus was on PD prevalence in Australia and other developed countries. A
number of studies were identified, including one from Australia. Different methodologies
for estimating prevalence make comparisons difficult. International comparisons are
further complicated by differences in methodologies, diagnosis rates, healthcare services
and survival rates between countries. Where relevant new information was identified, it is
reviewed in this section.
Mehta et al, (2007) used cross-sectional and longitudinal data on PD as part of a
comprehensive survey of an older Australian community. The study focused on individuals
aged 49 and over, estimating prevalence rates by age group, and utilised detailed
examination by specialist medical practitioners to assess and confirm PD diagnosis9. Ten8
US National Library of Medicine, National Institutes of Health, http://www.ncbi.nlm.nih.gov/pubmed/
(accessed 5 July 2011).
9
The baseline survey of non-institutionalised permanent residents aged 49 or over in the Blue Mountains area
of Sydney was conducted over 1992-94, with follow-up in 1997-99 (5 years) and 2002-04 (10 years). The initial
survey included 3,654 participants (82.4% of those eligible). 2,335 of these were re-examined after 5 years and
a further 1,378 individuals were identified as eligible – 1,174 of these participated. After 10 years, only
Deloitte Access Economics
19
Living with Parkinson's Disease - update
year incidence was estimated at 0.84% among those aged 49 and over (projecting 38,000
additional cases in Australia by 2011). The overall prevalence estimated, for primary PD
only, was 362 per 100,000 people (0.46%, 95% confidence interval 183-541) among
Australians aged 50 and over in 2001 (104 per 100,000 among all Australians). This is not
directly comparable to the result of the 2007 Access Economics study, which also included
secondary PD (without breaking down results by primary and secondary), estimating
prevalence of approximately 800 per 100,000 people aged 50 and over in 2005.
The different methodological approaches utilised in the two studies (in addition to
definition of PD) further complicates comparisons10. The Mehta et al, study examined
3,654 initial participants, 16 of whom were identified as having PD (none aged under 60), in
two post code areas in the Blue Mountains11. The 2007 Access Economics study looked at
Pharmaceutical Benefits Scheme data for all of Australia.
Three other Australian studies were noted in the Mehta et al, study. One in Sydney (Chan
et al, 2005) estimated prevalence of PD at approximately 780 per 100,000, using a broader
definition than Mehta et al, including, “subjects with features suggestive of parkinsonism”.
Two Queensland studies (McCann et al, 1998 and Peters et al, 2006), estimated a
prevalence of between 146 and 415 per 100,000 people. This highlights the degree of
variation between estimates.
A number of international studies were published since the 2007 Access Economics study,
using different approaches to estimate PD prevalence. Relevant examples, summarised by
approach, include:
Population surveys – ranging from once-off, door to door surveys (see Seijo-Martinez
et al, 2011, Yamawaki et al, 2009, and Wada-Isoe et al, 2009) to the longitudinal
approach of Mehta et al, (2007), described above. Medical records for individuals
identified as having PD were frequently confirmed by a neurologist.
Service-based epidemiological studies – ranging from surveys of local health services
(see Walker et al, 2010, Lix et al, 2010, Wickremaratchi et al, 2009, Morgante et al,
2008) to more detailed studies, e.g. recruiting patients through health services to have
PD diagnosis confirmed by a specialist neurologist (see Osaki et al, 2010).
Prescription database search for PD medications – e.g. within primary care databases,
combined with medical record review to confirm PD diagnosis (see Newman et al,
2009a).
In many cases, more than one of these approaches was used to confirm results (see
Wermuth et al, 2008).
Some further insights were provided in the following studies, summarised below:
Lix et al, (2010) found a greater burden of PD in low-income areas in Manitoba, Canada.
participants from the original cohort were re-examined – 1,952 of these participated (76.5% of survivors).
Participants were screened for medications associated with PD, and if positive, their medical practitioners were
contacted to confirm PD diagnosis (GP and neurologist).
10
Mehta et al. was also based on 2001 data, whereas the AE 2007 study was on 2005 data, however this is
unlikely to affect the prevalence rate significantly.
11
Mehta et al. conceded that prevalence may have been underestimated, as institutionalised people were not
included in the study.
Deloitte Access Economics
20
Living with Parkinson's Disease - update
Newman et al, (2009b) found that, “At least 1 in every 20 patients taking medication for
PD is misdiagnosed” (p. 2379).
Yamawaki et al, (2009) studied, ‘Changes in prevalence and incidence of PD in Japan
during a quarter of a century’, finding, “The prevalence of PD had increased, primarily
because the population had aged” (p. 263).
The 2007 Access Economics study also considered rates of misdiagnosis and underdiagnosis. It was assumed that these would offset each other. There is no evidence in the
recent literature to contradict this assumption.
The wide range of methodological approaches to estimating prevalence of PD
makes comparisons between studies difficult. A number of studies have been
published since the 2007 Access Economics study, however these do not
provide sufficient rationale to adjust prevalence estimates in this updated
report.
3.2.3
Prevalence of PD in 2011
Table 3.2 summarises the prevalence rates estimated for the previous Access Economics
report,12 and — based on these prevalence rates — the numbers of PD cases in Australia in
2011, updated to reflect population growth since 2005. This shows a 17% overall increase
in the number of PD cases since 2005 (approximately 10,000 additional cases). The
increase reflects the ageing of the Australian population.
There were an estimated 64,044 PWP in 2011, approximately 9,300 more than
in 2005. This equates to 283 per 100,000 in the total Australian population, or
857 per 100,000 among the population aged over 50.
12
The derivation of prevalence rates and methodology are described in Section 3 of the 2007 Access Economics
study.
Deloitte Access Economics
21
Living with Parkinson's Disease - update
Table 3.2: Estimated prevalence rates and cases of PD, 2011
Age
Prevalence rates (%)
Males Females Total
Cases, 2011
Males Females Total
Additional cases, 2005-11
Males Females
Total
0
0
0
0-4
0.00
0.00
0.00
0
0
0
5–14
0.00
0.00
0.00
0
0
0
0
0
0
15–24
0.00
0.00
0.00
0
0
0
0
0
0
25–34
0.02
0.00
0.01
256
0
256
12
0
12
35–44
0.03
0.01
0.02
501
180
681
24
7
30
45–54
0.14
0.06
0.10
2,139
886
3,025
182
81
263
55–64
0.36
0.25
0.30
4,586
3,318
7,903
874
623
1,496
65–74
1.22
0.98
1.10
10,043
8,428
18,470
1,708
1,332
3,039
75-84
2.32
1.93
2.11
10,569
10,670
21,239
948
296
1,245
85+
Total
3.69
2.59
2.97
5,422
33,515
7,048
30,529
12,470
64,044
1,684
1,551
3,236
5,415
3,929
9,344
Source: Access Economics, 2007. Note: Rows and columns may not sum due to rounding.
Chart 3.1 shows prevalence of PD by age group in 2005 and 2011. Just over half (52%) of
PWP were males, broadly unchanged since 2005. The prevalence of PD increased
substantially with age. People of working age (15-64 years) comprised 19% of PWP in 2011,
although this group represented approximately 67% of the total population.
Chart 3.1: Prevalence of PD by age, 2005 & 2011
25,000
Number of cases of PD
20,000
15,000
10,000
5,000
0
0-4
5–14
15–24
25–34
35–44
45–54
55–64
65–74
75-84
85+
Age group
Prevalence 2011
Deloitte Access Economics
Prevalance 2005
22
Living with Parkinson's Disease - update
3.3 Incidence of PD
Incidence refers to the number of new cases of PD. The 2007 Access Economics study
estimated the incidence in 2005 using a similar methodology to Begg et al, (2007), based on
estimated prevalence rates, remission rates (assumed to be zero) and the relative risk of
mortality. The 2007 Access Economics study estimated approximately 8,900 new cases of
PD in 2005. Applying 2011 demographic data to the incidence rates estimated in the 2007
report yields an estimated incidence of PD in 2010-11 of approximately 10,500. This is
summarised in Table 3.3.
Table 3.3: Incidence of PD, 2011
Age
Incidence rates (%)
Males
Females
New cases, 2011
Total
Males
Females
Total
0-4
0
0
0
0
0
0
5–14
0
0
0
0
0
0
15–24
0
0
0
0
0
0
25–34
0
0
0
0
0
0
35–44
0.01
0
0
158
0
158
45–54
0.01
0.01
0.01
151
155
306
55–64
0.05
0.04
0.05
643
524
1,297
65–74
0.16
0.12
0.14
1,322
1,028
2,357
75-84
0.42
0.25
0.32
1,912
1,381
3,225
85+
Total
1.10
0.65
0.79
1,616
1,771
3,312
5,802
4,859
10,497
Source: Access Economics, 2007. Note: Rows and columns may not sum due to rounding.
3.3.2
Prevalence by disease stage
The 2007 Access Economics study estimated the number of people in each disease stage by
applying the proportion of time spent in each disease stage to the prevalence rates
(reproduced in Table 3.2). It also assumed a median time from onset to death of 12.2 years
(see section 2.4 of Access Economics, 2007).
Applying this methodology to the updated demographic data, 2011 estimates are as
follows:
51,723 PWP in the initial stages of PD (Stages I to III) – compared with 44,300 in 2005;
8,441 PWP in the intermediate of PD (Stage IV) – compared with 7,100 in 2005; and
3,880 PWP in the end stage of PD (Stage V) – compared with 3,300 in 2005.
Deloitte Access Economics
23
Living with Parkinson's Disease - update
3.4 PWP residing in aged care facilities
The number of PWP residing in aged care facilities was estimated using a similar
methodology to that employed in the 2007 Access Economics study. Relative risk ratios of
nursing home admission for Stages IV to V by age group were applied to the rate of
admission in the general population (see Chart 3.2). In 2011, an estimated 6,600 PWP are
residing in aged care facilities, of which 188 are aged younger than 65 years (equal to 1.6%
of all PWP aged younger than 65 years). The majority of PWP aged younger than 65 years
who are residing in aged care facilities are in Stages IV or V (this accounts for 12.9% of PWP
aged younger than 65 years).
Chart 3.2: Estimated PWP in aged care facilities by disease stage, 2011
3,500
2,958
3,000
2,500
1,967
2,000
1,500
1,000
500
509
567
615
I
II
III
0
IV
V
Disease stage
Source: Access Economics, 2007.
3.5 Deaths due to PD
Chart 3.3 shows ABS data on PD recorded as underlying cause of death over the period
2000 to 2009 (latest data available). In 2009, there were 1,194 people who died whose
underlying cause of death was identified as idiopathic PD and 12 people who died whose
underlying cause of death was secondary PD. The number fell from 2008, when 1,283
people who died had an underlying cause of idiopathic PD and 8 people secondary PD. The
trend over the period 2000 to 2009 showed numbers of deaths with an underlying cause of
death identified as idiopathic or secondary PD increasing at 5% per year on average.
Deloitte Access Economics
24
Living with Parkinson's Disease - update
Chart 3.3: Underlying cause of death idiopathic PD and secondary PD, 2000 to 2009
1,400
1,200
1,000
800
600
400
200
0
2000 2001 2002 2003 2004 2005 2006 2007 2008 2009
Idiopathic PD
Secondary PD
Source: ABS 2011.
The 2007 Access Economics study found that ABS data for underlying cause of death was
likely to understate actual deaths, because a death may be attributed to another cause on
the death certificate (excluding PD). The 2007 Access Economics study addressed this issue
by deriving age-sex specific mortality rates, from an analysis of associated causes of death
from the literature and specially requested ABS data. This calculation, marked “associated
cause” in Chart 3.4 to Chart 3.7, represents the upper bound of the estimate. The updated
2011 estimate is 1,692. The lower bound estimate of 1,299 reflects revised mortality rates,
in line with the latest (2009) ABS cause of death data. This is marked “underlying cause” in
the Chart 3.4 to Chart 3.7. It was assumed that the same proportions of deaths in each
age/sex group applied as in 200413, as disaggregated down data was not available for 2009.
In 2011, deaths due to PD were estimated at between 1,299 and 1,692.
Chart 3.5 and Chart 3.4 show the updated estimates of deaths due to PD in 2011 for males
and females. The differences in these estimates compared to the 2005 estimates are
shown in Chart 3.6 and Chart 3.7. Of particular note is the higher number of estimated
deaths among both males and females aged 80-84 and 85-90. This is attributed to
population growth in those age groups.
13
2004 was the latest data available for the 2007 Access Economics study.
Deloitte Access Economics
25
Living with Parkinson's Disease - update
Chart 3.4: PD Deaths, Females, 2011
400
Half of PD Associated Cause (Total = 628)
350
PD Underlying Cause (Total = 545)
300
Deaths
250
200
150
100
50
0
0-4 5-9 10- 15- 20- 25- 30- 35- 40- 45- 50- 55- 60- 65- 70- 75- 80- 85- 90+
14 19 24 29 34 39 44 49 54 59 64 69 74 79 84 89
Age Group
Source: Access Economics, 2007. Estimated “Associated Cause” deaths are halved due to evidence from the
literature – see explanation in 2007 Access Economics study.
Chart 3.5: PD Deaths, Males, 2011
600
Half of PD Associated Cause (Total = 1065)
500
PD Underlying Cause (Total = 754)
Deaths
400
300
200
100
0
0-4 5-9 10- 15- 20- 25- 30- 35- 40- 45- 50- 55- 60- 65- 70- 75- 80- 85- 90+
14 19 24 29 34 39 44 49 54 59 64 69 74 79 84 89
Age Group
Source: Access Economics, 2007. Estimated “Associated Cause” deaths are halved due to evidence from the
literature – see explanation in 2007 Access Economics study.
Deloitte Access Economics
26
Living with Parkinson's Disease - update
Chart 3.6: Estimated deaths due to PD, 2011 vs. 2005, males (a)
350
Deaths due to PD
300
250
200
150
100
50
0
50-54
55-59
60-64
65-69
2011
70-74
75-79
80-84
85-89
90+
2005
(a) The shaded areas reflect upper (associated cause) and lower (underlying cause) bounds.
Source: Access Economics, 2007.
Deaths due to PD
Chart 3.7: Estimated deaths due to PD, 2011 vs. 2005, females (a)
200
180
160
140
120
100
80
60
40
20
0
50-54
55-59
60-64
65-69
2011
70-74
75-79
80-84
85-89
90+
2005
(a) The shaded areas reflect upper (associated cause) and lower (underlying cause) bounds.
Source: Access Economics, 2007
Deloitte Access Economics
27
Living with Parkinson's Disease - update
3.6 Projections
Updated projections of PD prevalence and deaths due to PD for the period 2011 to 2031
are shown in Chart 3.8 and Chart 3.9. As in the 2007 Access Economics study, these are
made on the basis of age-sex specific prevalence and mortality rates, updated to reflect
current demographic data and projections from Deloitte Access Economics Demographic
Model (DAE-DEM). Updates are described in Sections 3.2 and 3.5. The projections do not
take into account changes in the prevalence of risk factors or the possibility that new
treatments will become available in the future, which may affect prevalence and death
rates.
An estimated 64,000 PWP in 2011 is projected to grow to 115,300 by 2031
(an 80% increase). This is equivalent to annual growth of 4% per annum
between 2011 and 2031. Females represent approximately 48% of PWP.
People of working age (15-64 years) comprise 19% of PWP in 2011, which is
projected to decline to 13% by 2031.
PWP (thousands)
Chart 3.8: Projected PD prevalence, 2011-2031
140
120
100
Prevalence in 2031 =
115,300
80
60
40
Prevalence in 2011 =
64,000
20
0
2011
2016
2021
2026
2031
There are estimated to be between 1,299 and 1,692 deaths from PD in 2011,
doubling to between 2,639 and 3,471 deaths in 2031. Females comprise 42%
of estimated deaths in 2011, falling slightly to 39% in 2031. People of working
age comprise 2.4% of deaths in 2011, which is projected to fall to 1.5% in 2031,
as a result of population ageing.
Deloitte Access Economics
28
Living with Parkinson's Disease - update
Chart 3.9: Projected deaths due to PD, 2011-2031
7,000
Half of PD Associated Cause
6,000
PD Underlying Cause
5,000
Deaths in 2031 = 3471
4,000
3,000
Deaths in 2011 = 1692
2,000
1,000
Deaths in 2031 = 2647
Deaths in 2011 = 1299
0
2011
2016
2021
2026
2031
Estimated “Associated Cause” deaths are halved due to evidence from the literature – see explanation in 2007
Access Economics study.
Deloitte Access Economics
29
Living with Parkinson's Disease - update
4 Updating economic costs
Current demographic data were used to update the cost estimates from the 2007 report.
However, based on the findings outlined in chapter 3, no changes were made to prevalence
and mortality rates. Parameters were updated using the most recent (or relevant) data
sources, and costs were indexed using the appropriate inflators (such as the CPI or health
cost inflation).
The following costs associated with PD are updated in this report:
Direct financial costs to the Australian health system include the costs of running
hospitals and nursing homes (buildings, care, consumables), GP and specialist services
reimbursed through Medicare and private funds, the cost of pharmaceuticals (PBS and
private) and of over-the-counter medications, allied health services, research and
“other” direct costs (such as health administration).
Productivity costs include productivity losses of the PWP (long-term employment
impacts), premature mortality and the value of informal care (including lost income of
carer).
Administrative costs and other financial costs include government and nongovernment programs such as respite, community palliative care, out-of-pocket
expenses (such as formal care, aids, equipment and modifications that are required to
help cope with illness, and transport and accommodation costs associated with
receiving treatment), and funeral costs.
Transfer costs comprise the deadweight losses associated with government transfers
such as taxation revenue foregone, welfare and disability payments.
Non-financial costs are also very important—the pain, suffering and premature death
that result from PD. Although more difficult to measure, these can be analysed in
terms of the years of healthy life lost, both quantitatively and qualitatively, known as
the “burden of disease”.
Different costs of diseases are borne by different individuals or sectors of society. Clearly
the PWP bears costs, but so do employers, government, friends and family, co-workers,
charities, community groups and other members of society. Table 4.1 below outlines the
schema used for cost classifications for this (and the 2007) report.
Deloitte Access Economics
30
Living with Parkinson's Disease - update
Table 4.1: Schema for cost classification
Conceptual group
Pain/suffering and
premature mortality
Subgroups
Bearers of Cost
Comments
Burden of disease
(YLLs, YLDs, DALYs) –
incidence approach.
PWP*
Health system costs
Costs by type of
service (and
prevalence in 2001)
PWP*, governments
and society (private
health insurers,
workers’
compensation)
Lost productivity from
temporary
absenteeism
PWP, employer and
government#
Lost management
productivity
Employer and
government#
Long-term lower
employment rates
PWP and government#
Includes premature
retirement
Premature death
PWP and government#
Loss of productive
capacity
Additional search and
hiring replacement
Employer
Incurred when
prematurely leave job
Lost informal carer
productivity
Friends and family, and
employer#
Includes both paid and
unpaid work
Respite/palliative care
services
Governments, PWP,
and society
Out-of-pocket
expenses
PWP
Funeral costs brought
forward
Friends and family
Deadweight loss
Society
Productivity costs
Other financial costs
Transfer costs
Formal care, aids,
equipment,
modifications, travel,
accommodation.
Relate to transfers
from taxation, welfare
etc
* Friends/family may also bear loss of wellbeing, health costs and lower living standards as a result of PD;
however, care is needed to assess the extent to which these are measurable, additional (to avoid double
counting) and not follow-on impacts. For example, a spouse may pay a medical bill and children may share in
lower household income when the PWP’s work hours are reduced – but as this is simply redistribution within
family income it is not measured here. Moreover, if a family carer develops depression or a musculoskeletal
disorder, it would be necessary to estimate the aetiological fraction attributable to PD, allowing for other
possible contributing factors.
# Where earnings are lost, so is taxation revenue and frequently also there are other transfers, such as welfare
payments for disability/sickness/caring etc, so Governments share the burden.
Deloitte Access Economics
31
Living with Parkinson's Disease - update
4.2 Incidence and prevalence approaches
In line with the 2007 report, this report uses the prevalence (annual costs) approach to
estimating the cost of PD. An alternative approach is the incidence (lifetime costs)
approach. The difference between the two is explained below.
Prevalence approaches measure the number of people with a given condition in a base
period and the costs associated with treating them as well as other financial and nonfinancial costs (productivity losses, loss of quality of life) in that year, due to the
condition. Prevalence approaches can be more suitable for chronic conditions and for a
snapshot of total economy-wide costs that will be borne in a given year.
Incidence approaches measure the number of new cases of a given condition in a base
period and the costs associated with treating them, as well as other financial and nonfinancial costs (e.g., productivity losses, loss of quality of life) over the person’s lifetime,
due to the condition. The total costs represent the net present value (NPV) of current
and future costs incurred due to new cases in the year in question.
Consider three different cases of people with PD:
a, who was diagnosed with PD in the past and has incurred the associated costs up to
the year in question, with associated lifetime costs of A + A*, shaded in green;
b, who was diagnosed with PD in the past and has incurred the associated costs in 2005
as well as in the past and future, with associated lifetime costs of B + B* + B**, shaded
in grey; and
c, who was diagnosed with PD in 2011, with lifetime costs of C + C*, shaded in blue.
All costs should be expressed as present values relative to 2011.
Using an incidence approach, only cases like ‘c’ would be included, with the total cost
estimate equivalent to the sum of all the costs in the base year (ΣC) plus the present value
of all the future costs (ΣC*). Costs associated with PWP diagnosed in an earlier year would
be excluded.
Using a prevalence approach, costs in 2011 relating to a, b and c would all be included, with
total costs equal to Σ(A + B + C). Costs in all other years are excluded.
Deloitte Access Economics
32
Living with Parkinson's Disease - update
Figure 4.1: Incidence and Prevalence Approaches to Measurement of Annual Costs
Past
Base
year
A*
Future
A
B*
B
C
B**
C*
Annual prevalence costs in the base year = Σ(A + B + C);
Annual incidence costs in the base year = Σ(C + present value of C*)
Note that 0 also defines the lifetime costs of PD for each person, as follows:
Lifetime cost for person c (= Incidence cost) = C + present value of C*
Lifetime cost for person b = B + present values of B* and B**
Lifetime cost for person a = A + present value of A*
4.3 Discount rates
Where future costs are ascribed to the year 2011 throughout the report the formula for
calculating the NPV of those cost streams is:
NPV = ΣCi/(1+r)^i where i=0,1,2….n
where
Ci = cost in year i, n = years that costs are incurred and r = discount rate.
Choosing an appropriate discount rate is a subject of some debate, as it varies depending
on what type of future income or cost stream is being considered. The discount rate needs
to appropriately take into account risks, inflation and positive time preference.
Risk and positive time preference
A ‘lower-bound’ scenario for the discount rate would be to assume certainty with regard to
future cash flows (i.e. assume the future flows are similar to the certain flows attached to a
long-term Government bond). Over the past decade, the long-term nominal bond rate has
averaged 5.5% per annum (Chart 4.1). This ‘risk-free’ rate compensates for inflation and
positive time preference (if there were no positive time preference, people would be
indifferent between having something now or a long way off in the future, which applies to
all goods and services).
Deloitte Access Economics
33
Living with Parkinson's Disease - update
Chart 4.1: 10-year Australian Government bond yields, daily; %
7.5
7.0
6.5
Yield, %
6.0
5.5
5.0
4.5
4.0
3.5
2001
2002
2003
2004
2005
2006
2007
2008
2009
2010
2011
2012
Data is for 1 August 2001 – 29 July 2011
Source: RBA 2011
Inflation
The Reserve Bank has a clear mandate to pursue a monetary policy that delivers 2% to 3%
inflation over the course of the economic cycle. This is a realistic longer run goal and an
inflation rate in this range (2.5%) is used in arriving at the discount rate for healthy life
below. It is important to allow for inflation in order to derive a real rather than nominal
rate.
In discounting healthy life and other costs in this report, a real discount rate of
3% (5.5 – 2.5) is used.
In the 2007 report, different discount rates were used to discount income streams of future
earnings, health costs and other (healthy life) costs (page 35). Our preferred methodology
now is to apply a single discount rate to all costs. This is consistent with international
health studies.
Deloitte Access Economics
34
Living with Parkinson's Disease - update
5 Health system costs
Health expenditure data for PD was sourced by special request from the Australian Institute
of Health and Welfare. The AIHW derive their expenditure estimates from an extensive
‘top-down’ process developed in collaboration with the National Centre for Health Program
Evaluation for the Disease Costs and Impact Study (DCIS). The approach measures health
services utilisation and expenditure for specific diseases and disease groups in Australia.
The DCIS methodology (Mathers et al, 1998) has been gradually refined over the 1990s to
now estimate a range of direct health costs from hospital morbidity data, case mix data,
Bettering the Evaluation and Care of Health (BEACH) data, the National Health Survey and
other sources.
The data obtained from the AIHW related to DCIS data released on 12 May 2004 (AIHW,
2004) for the year 2000-01 disaggregated by age, gender and type of cost. The 2000-01
data are the most recent available. These data use burden of disease categories based the
Tenth Revision of the International Classification of Disease (ICD-10) published by the World
Health Organisation and the International Classification of Primary Care Version 2 (ICPC2).
In this report, the 2000-01 data provided by the AIHW were used as the basis of the 2011
estimates. Two factors contribute to the extrapolation:
health cost inflation — assumed to be 3.4% per year, which was the ten year annual
average from 1997-1998 to 2007-08 (AIHW, 2010); and
projected growth of the prevalence of PD based on DAE-DEM population growth for
each age group.
The AIHW include only 86% of total recurrent health expenditure in their estimates of
expenditure by disease and injury, referred to as ‘allocated’ health expenditure. The
‘unallocated’ remainder includes capital expenditures, expenditure on community health
(excluding mental health), public health programs (except cancer screening), health
administration and health aids and appliances. Allowance was made for the unallocated
component after presentation of the allocated components.
The health system cost estimates do not include the additional funding for health research
announced in the 2006-07 Federal budget and other items that may have changed since
2000-01, such as greater utilisation rates for deep brain stimulation. Moreover, since 200001 several new drugs have been listed on the Pharmaceutical Benefits Scheme for PD and
there have been changes to permitted use of some PD medications.
Deloitte Access Economics
35
Living with Parkinson's Disease - update
Table 5.1: Health system costs, 2000-01
Age
Males
Females
Total
$m
$m
$m
0-4
0.03
0.07
0.10
5–14
0.01
0.00
0.02
15–24
0.03
0.20
0.23
25–34
0.21
0.04
0.26
35–44
0.67
0.66
1.33
45–54
1.59
3.35
4.94
55–64
12.72
5.92
18.64
65–74
34.85
18.31
53.17
75-84
46.29
34.87
81.16
85+
12.23
20.67
32.90
Total
108.64
84.09
192.73
Source: AIHW special data request.
Table 5.2: Health system costs, 2011
Age
Males
Total
per PWP
$m
Females
Total
per PWP
$
$m
$
Total
Total
per PWP
$m
$
0-4
0.0
0
0.0
0
0.0
0
5–14
0.0
0
0.0
0
0.0
0
15–24
0.0
0
0.0
0
0.0
0
25–34
0.4
1,442
0.0
0
0.4
1,442
35–44
1.1
2,282
1.1
6,327
2.3
3,351
45–54
2.9
1,351
6.2
7,010
9.1
3,009
55–64
29.3
6,398
13.9
4,177
43.2
5,465
65–74
70.1
6,980
35.8
4,242
105.8
5,731
75-84
94.2
8,908
63.0
5,904
157.1
7,399
85+
35.0
6,459
49.0
6,957
84.0
6,740
233.0
6,952
169.0
5,540
402.0
6,277
Total
Source: Deloitte Access Economics’ calculations.
Note: estimates for PWP aged under 35 shown as zeros due to rounding.
5.2 Cost components
Chart 5.1 shows the main health system cost components for PD in 2011 14.
Aged care ($236.0 million, $4,312 per PWP or $43,136 per PWP in an aged care
facility): nursing home placement is often required, particularly in the later stages of PD
14
These costs exclude the additional health system costs discussed in later sections.
Deloitte Access Economics
36
Living with Parkinson's Disease - update
due to functional impairment, drug complications (such as hallucinations) and
comorbidities associated with PD (such as dementia and incontinence).
Pharmaceuticals ($61 million or $1,115 per PWP): drug treatments for PD — includes
drugs listed on the PBS and RPBS (such as levodopa), non-subsidised prescription drugs
(such as ropinirole) and over-the-counter drugs (such as paracetamol and vitamins).
Inpatient & outpatient hospital services ($61.3 million or $1,119 per PWP): usually for
the purpose of confirming diagnosis and levodopa responsiveness, or for the
management of motor fluctuations and dyskinesias (Temlett, 2006). Hospital admission
may also be required for treatment for falls and other accidents, depression, some
invasive surgery (such as lesioning or neuro-stimulator placement), aspiration
pneumonia, and autonomic nervous system disorders, such as severe constipation,
urinary disorders, arising from PD or PD medication.
Other health system costs include:
• General practitioner (GP) services ($6.2 million or $112 per PWP)15: ongoing consultations with GPs are required to manage symptoms, prescribe
drugs, and treat complications.
• Out-of-hospital specialists ($3.9 million or $70 per PWP)16: neurologists are
often consulted to diagnose PD and to advise on appropriate treatment
pathways.
• Other health practitioners ($12.2 million or $223 per PWP): PWP may also
be referred to physiotherapists, speech therapists, occupational therapists,
clinical psychologists and specialist PD nurses.
• Imaging and pathology ($2.9 million or $53 per PWP): some services may be
used during the diagnosis stage to rule out other possible causes of
symptoms, but some of these costs may be avoidable. Additional services
may also be required to investigate PD complications – such as the extent of
fractures due to accidental falls.
• Research ($18.7 million or $341 per PWP): ongoing epidemiological research
into the causes of idiopathic PD, basic research (e.g. brain functions), applied
research (e.g. synthesising large molecule interactions) and developmental
research for new treatments (e.g. drug therapies).
These health costs vary considerably by age — with pharmaceuticals declining in share of
health system costs over time, and aged care costs increasing in share over time (Chart 5.2).
15
The underlying source used by AIHW to measure the cost of GP services is the BEACH database 1999–00 to
2001–02. The proportion of problems by disease was used to split top-down total expenditure (based on
Medicare). Consequently this may be an underestimate of the total GP costs associated with PD because:
individuals may consult the GP for more than just PD-related issues (even though PD may be the primary
reason), and issues regarding identifying encounters for rarer diseases using BEACH (Access Economics 2007).
16
The underlying source used by AIHW to measure the cost of GP services is the BEACH database 1999–00 to
2001–02. GP referral patterns were used to allocate total specialist expenditure (from AIHW). This may be an
underestimate of total specialist costs associated with PD depending on the rates of GP referral to specialists for
PD, compared to other diseases, and issues regarding identifying encounters for rarer diseases using BEACH (see
Access Economics 2007).
Deloitte Access Economics
37
Living with Parkinson's Disease - update
Chart 5.1: Health system cost components, 2011
Pharmaceuticals
1%
1% 3%
1%
5%
Aged Care
15%
Hospital (in and
outpatient)
15%
GP Services
Imaging and Pathology
Other Medical Services
59%
Other Health
Professionals
Research
Source: Deloitte Access Economics’ calculations.
Chart 5.2: Health system costs per person, component and age, 2011
10
$'000
9
8
7
6
5
4
3
2
1
0
25–34
35–44
45–54
55–64
65–74
75-84
85+
Pharmaceuticals
Aged Care
Hospital (in and outpatient)
GP Services
Imaging and Pathology
Other Medical Services
Other Health Professionals
Research
Source: Deloitte Access Economics’ calculations.
Deloitte Access Economics
38
Living with Parkinson's Disease - update
5.3 Health system costs by disease stage
The previous report identified estimated health costs by disease stage based on the results
of Findley et al (2003) and Spottke et al (2005). For each study the average health system
costs were estimated using the distribution of PWP by disease stage in Australia. The ratio
of health system costs compared to this average was then estimated for each disease stage.
The final results were adjusted so the total health expenditure by disease stage equals that
in Table 5.2. Details of this calculation can be found in Access Economics (2007a). The
average cost per PWP in 2011 was $6,277.
Table 5.3: Health system costs per PWP, by disease stage, 2011
Disease stage
Health system cost per PWP ($), 2011
I
4,059
II
4,057
III
7,527
IV
11,130
V
12,265
Total
6,277
Source: Deloitte Access Economics estimates.
5.4 Additional health system costs
The health system costs presented this far are largely dependent on the underlying
estimates of the use of the health system by PWP. For example, GP visits, hospital
separations and deaths due to PD may underestimate health system costs through the
incorrect attribution of the use of these services to other diseases or injuries (for example,
costs associated with accidental falls or pneumonia due to the symptoms of PD would be
attributed to accidental falls or pneumonia separately, respectively).
The methodology used to attribute various pharmaceutical costs to PD would also impact
on estimates: use of PD drugs for non-PD reasons would overestimate pharmaceutical
costs, whereas use of non-PD drugs to treat PD symptoms would underestimate costs.
Furthermore health system costs would be strongly affected (either over or
underestimated) by the level of undiagnosed and misdiagnosed cases of PD: for example
PWP who also have dementia in aged care facilities, if their admission was counted as “due
to dementia” rather than “due to PD”.
Temlett and Thompson (2006) analysed admissions of PWP into the Royal Adelaide Hospital
between 1999 and 2004. In the hospital each admission is coded according to the primary
diagnosis (the reason for admission based on the acute problem treated), although
additional information on secondary diagnoses is also recorded (other existing diseases
which also require management during the hospital stay). The study found that where PD
was a secondary diagnosis, the associated primary diagnosis was often directly attributable
to the effects of PD or the complications of treatment: namely, accidental falls and
fractures (due to problems with gait and balance), pneumonia (due to dysphagia), dementia
Deloitte Access Economics
39
Living with Parkinson's Disease - update
(commonly associated with PD), syncope and encephalopathy (through adverse drug
reactions). Gastrointestinal and genitourinary infections may also be a complication of PD
in some cases.
Overall it was found that for every hospital admission directly due to PD, there were at least
two additional admissions due to complications that were coded to a different disease or
injury. However, this does not take into account other comorbidities that may increase the
likelihood (i.e. visual impairment) or severity (i.e. osteoporosis) of the hospital admission.
Table 5.4: Hospital admissions PWP
Diagnosis
PD primary diagnosis
PD secondary diagnosis
Related to PD
Accidental falls/fractures
Pneumonia
Dementia
Encephalopathy
Syncope17
Sub-total
Unrelated to PD:
Genitourinary infections
Gastrointestinal
Cardiovascular
Stroke
Haematological
Neoplasms
Other
Sub-total
Total
Hospital Admissions
Ratio of Admissions:
Primary to Secondary
116
645
5.56
81
78
22
45
26
251
0.70
0.67
0.19
0.39
0.22
2.16
71
70
75
23
19
46
117
394
0.61
0.60
0.65
0.20
0.16
0.40
1.01
3.40
761
Note: Sub-totals do not add to total due to comorbidity in some cases.
Source: Temlett and Thompson (2006).
In 2009-10 there were 3,179 hospital admissions due PD (Table 5.5). From this it was
estimated that there were around 2,220 hospital admissions for accidental falls that were a
complication of PD, and 2,138 hospital admissions for pneumonia that were a complication
of PD. Assuming that the costs of treating accidental falls and pneumonia per PWP are the
same regardless of underlying cause, there was at least $76.6 million in additional health
system costs to treat the complications of PD (an additional 19% of the total health cost of
PD).
17
Temporary loss of consciousness or “fainting” due to postural hypotension (a fall in blood pressure when
moving from lying to sitting, or from sitting to standing).
Deloitte Access Economics
40
Living with Parkinson's Disease - update
Table 5.5: Additional health system costs ($), 2011
PD
hospital
admissions
Additional hospital
admissions
Falls Pneumonia
Total health system costs
per hospital admission
Falls ($) Pneumonia ($)
Additional
health system
costs ($m)
Males
0-4
5–14
15–24
25–34
35–44
45–54
55–64
65–74
75-84
85+
0
0
0
5
11
89
268
581
758
270
0
0
0
3
8
62
187
405
529
188
0
0
0
3
7
60
180
390
509
181
10,270
8,978
9,663
8,520
8,749
10,308
13,134
15,890
17,051
17,734
23,984
25,714
53,097
40,818
37,006
25,372
26,045
19,847
15,336
13,894
0.0
0.0
0.0
0.2
0.3
2.2
7.1
14.2
16.8
5.9
0
0
1
1
10
40
144
338
494
169
3,179
0
0
1
1
7
28
101
236
345
118
2,220
0
0
1
1
7
27
97
227
332
114
2,138
9,388
14,152
9,267
9,764
11,522
14,671
12,809
16,545
13,335
14,401
12,380
23,102
25,817
63,237
36,794
38,254
36,205
28,176
26,393
18,480
15,705
24,364
0.0
0.0
0.0
0.0
0.3
1.4
4.0
9.9
10.7
3.5
76.6
Females
0-4
5–14
15–24
25–34
35–44
45–54
55–64
65–74
75-84
85+
Total
Source: AIHW (2011b), Deloitte Access Economics’ calculations.
Deloitte Access Economics
41
Living with Parkinson's Disease - update
Table 5.6: Additional health system costs per PWP 2011, by age and sex
Age
Male ($)
Female ($)
Total costs ($)
0-4
5–14
15–24
25–34
35–44
45–54
55–64
65–74
75-84
85+
0
0
0
651
680
1,009
1,558
1,413
1,592
1,081
0
0
0
0
1,875
1,561
1,210
1,174
1,006
494
0
0
0
651
996
1,171
1,412
1,304
1,298
749
Total
1,393
978
1,195
Source: Deloitte Access Economics’ calculations.
Table 5.7: Additional health system costs per PWP, by disease stage, 2011
Disease stage
I
Cost per PWP ($)
826
II
795
III
1,421
IV
2,032
V
2,199
Total
1,195
Source: Deloitte Access Economics’ estimates.
5.5 Deep brain stimulation
In 2009-10, Australian Government expenditure on deep brain stimulation for PWP was
$792,428 (as discussed in section 2.6.1).
5.6 Summary of health costs
It is estimated that the health costs of PD was $478.5 million in 2011. Health system costs
have increased by 39% since 2005.
Of this expenditure, 42% was spent treating women with PD and 58% is spent treating
men with PD.
Of this expenditure, 15% was spent treating people aged less than 65 years (Chart 5.3).
Deloitte Access Economics
42
Living with Parkinson's Disease - update
Chart 5.3: Total health system costs by age ($m), 2011
200
180
160
Health system costs, $m
140
120
100
80
60
40
20
0
0-4
5–14
15–24
25–34
35–44
45–54
55–64
65–74
75-84
85+
Age
Source: Deloitte Access Economics’ estimates.
The average total health system cost per person with PD was $7,599 per annum, around
19% higher than in 2005.
Cost per PWP was lowest in the younger than 55 age-group, and highest in the 75 and
over group, where residential care becomes the dominant cost element (see Chart 5.4)
Cost per PWP increases with disease stage, where complications are more likely to
occur and residential care becomes the dominant cost element (see Chart 5.5).
Deloitte Access Economics
43
Living with Parkinson's Disease - update
Chart 5.4: Total health system costs per PWP, by age, 2011
10,000
9,000
Health system cost per PWP, $
8,000
7,000
6,000
5,000
4,000
3,000
2,000
1,000
0
0-4
5–14
15–24
25–34
35–44
45–54
55–64
65–74
75-84
85+
Age
Source: Deloitte Access Economics’ estimates.
Chart 5.5: Total health system costs per PWP, by disease stage, 2011
16,000
14,000
Health system cost per PWP
12,000
10,000
8,000
6,000
4,000
2,000
0
Stage I
Stage II
Stage III
Stage IV
Stage V
Disease stage
Source: Deloitte Access Economics’ estimates.
Deloitte Access Economics
44
Living with Parkinson's Disease - update
The health cost profile for PD was dominated by high care residential accommodation or
‘aged care’ – $237.9 million (50%).
The second largest cost component for PD was hospital costs (22% of total costs in
2011 or $105.1 million) while the third largest cost component for PD was
pharmaceuticals (15.5% of total costs in 2011 or $70.6 million).
Unreferred attendances (GPs), imaging and pathology costs and other out-of-hospital
medical (specialists) were $27.1 million (5.7%); and other (allied) health practitioners
$15.8 million (3.3%).
Research into PD was estimated as $19 million in 2011 (4% of total health expenditure
on PD). The average research share for all health conditions, of total allocated health
expenditure, is lower at 2.6% (AIHW, 2010).
Chart 5.6: Health System Costs by Cost Component, 2011
Other Health
Professionals
3%
Research
4%
Pharmaceuticals
15%
Out-of-hospital medical
6%
Hospital (in and
outpatient)
22%
Aged Care
50%
Note: includes the additional health system costs due to accidental falls and pneumonia.
Source: Deloitte Access Economics’ estimates.
Governments bore around two thirds of the health system costs (73%), while individuals
bore another 17%, and other parties (private health insurance, charities) bore the
remaining 11% (see Chart 5.7).
Deloitte Access Economics
45
Living with Parkinson's Disease - update
Chart 5.7: Health system costs, by who bears the cost, 2011
Other
11%
Individuals
17%
Federal Government
47%
State/Territory
Government
26%
Source: Deloitte Access Economics’ estimates.
Deloitte Access Economics
46
Living with Parkinson's Disease - update
6 Productivity costs
Productivity costs measure the losses to production resulting from PD. These include losses
to the formal sector through reduced workforce participation of PWP and their carers; as
well as losses to the unpaid sector such as house and yard work and voluntary work.
Productivity losses are broken down into short-run and long-run costs. Short-run costs are
those associated with temporary absences from work due to PD (such as to attend medical
appointments) and costs are incurred until production is restored to former levels. Longrun costs are those associated with permanent loss of the labour resource (through
premature workforce separation or premature mortality). In addition to the direct
productivity loss, the employer incurs administrative costs associated with both short-run
and long-run costs (such as processing employees who take time off or searching, hiring
and training replacement workers).
The 2007 report uses the friction method to measure short-run productivity costs and the
human capital method to estimate long-run productivity costs.
The friction method was developed by Koopmanschap et al (1995). This approach
estimates production losses for the time period required to restore production to its
pre-incident state. Based on neoclassical theory, wages and other marginal costs are
assumed to be equal to the value of the marginal revenue generated by an additional
worker under conditions of full employment (Berger and Murray, 2001). Lost
production is thus the value of the wages (measured as average earnings) plus other
inputs to production (capital, plant and equipment, land, enterprise etc) multiplied by
the number of workdays missed.
The human capital method estimates production losses based on the remaining
expected lifetime earnings for the individual.
A review of the literature since the 2007 report identified no Australian studies or new
useful datasets for estimating the impact of PD on productivity. As such, we used the
methodology outlined on pages 49–52 of the original report to populate the parameters of
these models and estimate productivity costs. This methodology draws largely on
international studies such as Rubenstein (1997), Le Penn (1999) and Chrischilles (1998)
To update productivity costs from the 2005 estimates, we updated the following
parameters:
earnings, using current mean weekly earnings rates by age group from the Australian
Bureau of Statistics (ABS, 2011b);
the probability of being employed (and remaining in employment) at any given age
using updated statistics on employment ratios by age group (ABS, 2011a & ABS, 2011f);
employee on-costs using current ABS data (ABS, 2011c & ABS, 2011d);
the proportion of sick leave that is paid (to divide costs of temporary absenteeism into
those borne by the worker and those borne by employers) using the most recent ABS
data on working arrangements (ABS, 2010).
Deloitte Access Economics
47
Living with Parkinson's Disease - update
The following parameters were left unchanged as they were based on research that is still
the best available:
temporary absenteeism from work (number of days) by disease stage (Le Penn (1999)
and Chrischilles (1998));
manager time lost per temporary absenteeism (HSE, 1999);
employee turnover costs (including increased turnover rate) (Access Economics, 2004);
and
the overtime premium (Access Economics, 2004).
The estimated productivity cost of PD in 2011 was around $107.3 million. This is almost
double the estimated cost in 2005 (Table 6.1).
Table 6.1: Summary of productivity costs in 2011 and 2005 (nominal), $m
Source of cost
Costs ($m)
2005
2011
Growth
(%)
Temporary absenteeism from work (including management admin
time)
15.3
28.0
83
Premature workforce separation
33.1
63.7
93
6.8
15.4
129
Premature mortality*
Search, hiring and training costs
0.02
0.1
339
Total
55.2
107.3
95
Although a higher prevalence of PD in 2011 compared to 2005 (see section 3.2.3) would no
doubt be contributing to the increase in productivity costs, the average productivity cost
per PWP has also increased significantly in real terms to $1,675 in 2011, up 66% from
$1,000 in 2005.
The increase is largely due to growth in earnings, which, on average, increased by 37% in
nominal terms and 14% in real terms (Table 6.2). Earnings are the major input in the
calculation of productivity costs (see explanation on friction and human capital methods
above), therefore any growth in earnings will have a discernable impact on overall
productivity costs.
Deloitte Access Economics
48
Living with Parkinson's Disease - update
Table 6.2: Real and nominal earnings growth 2005-11, by age group
Age group
AWE distribution
(average of males and females)
2005
2011
Total
(nominal)
growth (%)
Real growth*
(%)
15-19
235
285
22
1
20-24
531
671
26
5
25-29
799
993
24
3
30-34
799
1,097
37
14
35-39
862
1,179
37
14
40-44
862
1,201
39
16
45-49
878
1,197
36
14
50-54
878
1,152
31
9
55-59
836
1,144
37
14
60-64
726
1,018
40
17
65+
484
847
75
46
Average
717
980
37
14
* Adjusted for 20% CPI inflation over the period
As was the case in 2005, costs per PWP differed significantly by age, sex and disease stage
(Chart 6.1 and Chart 6.2). Costs were higher for males (largely reflecting their higher
earnings profile) and peaked between the ages of 50–59 (when the intersection of the
prevalence of PD and the probability of being employed is the highest).
Chart 6.1: Productivity costs per PWP ($), by age and sex
12,000
Productivity costs per PWP, $
10,000
8,000
6,000
4,000
2,000
0
25-29 30-34 35-39 40-44 45-49 50-54 55-59 60-64 65-69 70-74 75-79 80-84 85-89
90+
Age
Males
Deloitte Access Economics
Females
49
Living with Parkinson's Disease - update
Productivity costs are largest for stage III of the disease, reflecting the fact that PWP in
stages IV and V are mostly above the working age (and their potential productive capacity is
lower, regardless of PD).
Chart 6.2: Productivity costs per PWP ($), by disease stage, 2005 & 2011 (nominal)
4,000
Productivity costs per PWP, $
3,500
3,000
2,500
2,000
1,500
1,000
500
0
I
II
III
IV
V
Disease stage
2011
2005
Productivity costs are shared between the worker, the employer and society (through lost
taxation revenue) (Chart 6.3). Post tax:
Workers bore 52% of the productivity cost of PD ($53 million or $900 per PWP).
Employers bore around 16% of the productivity costs of PD (around $16 million or $300
per PWP). These costs largely reflect paid sick leave, overtime payments to workers
who pick up the hours of the absent PWP, costs of replacing workers (search, hiring and
training costs) and management administration time.
Governments bore 32% of the productivity costs ($32 million or $500 per PWP) through
lost taxation revenue.
Deloitte Access Economics
50
Living with Parkinson's Disease - update
Chart 6.3: Distribution of Productivity costs, 2011
Government (Lost
Taxes)
32%
Incurred by Employee
53%
Incurred by Employer
16%
Compared to 2005, some of the costs have shifted from the Government to the employee
through lower average tax rates. Employers’ share of costs is largely unchanged.
Deloitte Access Economics
51
Living with Parkinson's Disease - update
7 Informal care and other financial
costs
7.1 Number of carers of PWP
Access Economics (2007a) estimated that there were around 7,300 carers of PWP in 2005.
Based on growth in the prevalence of PWP between 2005 and 2011, we estimate that the
number of carers in 2011 is 8,501.
The number of carers by age, sex and disease stage (which is required to estimate the
opportunity cost of their time) was estimated using the methodology detailed on page
59 of the original report (Access Economics, 2007a). Overall, around 1,425 carers are of
working age (compared to 1,200 in 2005).
7.2 Time spent caring for PWP
In line with Access Economics (2007a), the time spent caring for PWP is estimated using the
average number of hours provided per week by Australian primary carers in general
(30.5 hours (ABS, 2010b) down from 33.5 hours estimated in 2005).
In total, informal carers provided around 13.5 million hours of care in 2011 – equivalent to
around 211 hours per PWP. In 2005, carers provided around 231 hours of informal care per
PWP.
7.3 Updating the cost of informal care
Applying the updated parameter estimates outlined in sections 7.2 and 7.3 above yields an
estimate of the cost of informal care provided to PWP in 2011 of $11.2 million, or $174
per PWP.
In 2005, this cost was estimated as $5.4 million (or $100 per PWP), so the costs of informal
care have more than doubled over the six years to 2011. The increase is almost entirely a
result of the higher value placed on informal carers’ time spent caring, which is measured
using earnings data outlined in chapter 618. The total number of informal care hours
provided has only increased slightly (and has decreased per PWP). These findings are
summarised in Table 7.1.
18
The estimate of the cost of informal care is derived using the opportunity cost method, which places a dollar
value on the time spent providing informal care by assigning the formal sector productivity losses associated
with this time (i.e. it values the time devoted to caring as time that cannot be spent in the workforce).
Deloitte Access Economics
52
Living with Parkinson's Disease - update
Table 7.1: Estimating the cost of informal care, 2005 & 2011 (nominal)
2005
Total
Number of carers
2011
Per PWP
Total
Per PWP
7,264
0.13
8,501
0.13
Time spent caring (hours)
12,654,091
231
13,483,241
211
Cost of informal care ($)
5,359,125
98
11,164,208
174
Informal care can also have other indirect costs on carers through impacts on their health
and wellbeing, though these are not measured here. These costs include emotional
detriment from the responsibility of caring, as well as physical injury often incurred from
lifting or moving the recipient of care19.
7.4 Out-of-pocket expenses
7.4.1
Use of aids and modifications
Access Economics (2007a) estimated the additional use of aids and modifications due to PD
for each stage of the disease, and then calculated the cost of this additional usage by
applying these weights to the average cost per year for the aid, which was sourced from
Sun Medical Equipment Centre. These costs were updated for 2011 using the Consumer
Price Index CPI and the additional usage rates are maintained from the previous report. The
results are summarised in Table 7.2.
On average (across all aids and disease stages), the additional use of aids and
modifications resulting from PD costs $802 per year per PWP. This is an
increase of 20% on the average cost per year per PWP in 2005.
19
For more information see pages 61 and 62 of the original report.
Deloitte Access Economics
53
Living with Parkinson's Disease - update
Table 7.2: Additional use of aids and modifications due to PD (by disease stage) and
average cost of aids in 2011
Aid
Average cost
in 2011 ($)
Walker, cane or crutches
Additional use by disease stage, %
I
II
III
IV
V
96
12
16
25
27
27
1,201
12
17
26
28
28
Grab bars or railings
30
11
16
25
27
27
Shower seats or raised stools
52
12
17
26
28
28
Raised toilet
72
11
15
23
25
25
3,499
0
14
30
46
62
60
12
17
26
28
28
Wheelchair
Incontinence Pads*
Wheelchair Maintenance
Average cost per year due to PD,
per PWP ($)
180
740 1,440 2,030 2,590
* 2,912 units used per year at $1 each for 2005 and $1.20 each for 2011
Source: Access Economics (2007a)
However, these costs are only incurred by PWP who are not already receiving help in a high
care residential setting. Applying the average cost per year per PWP to the number of PWP
not in a nursing home yields a total cost of aids and modifications of $51.4 million in 2011.
In 2005, this cost was estimated to be $36.5 million, thus the cost of aids and modifications
has increased by around 41%.
7.4.2
Use of formal care, accommodation and travel costs
In line with the 2007 report, the cost of formal care, accommodation and travel are
estimated as 6% of the total health system costs, which in 2011 equates to an average of
$45 per PWP, up from $38 per PWP in 2005.
Again, these costs are assumed to only be incurred by PWP not in a nursing home, so
applying this average cost as such yields a total cost of travel, accommodation and informal
care in 2011 of around $1.8 million (up from $1.3 million in 2005). Since we have assumed
that formal care costs have remained a constant proportion of total health system costs
since 2005, the sole driver of the PWP cost increase is the increase in health system costs. A
small increase in the number of PWP not residing in nursing homes has also added to the
total cost.
7.5 Government programs
Palliative Care Programs:
Government expenditure on the Palliative Care and Community Assistance program in
2010-11 was budgeted to be $33.2 million (DoHA, 2011). The other two Palliative care
programs listed in the 2007 report – under the Australian Health Care Agreements and the
Local Palliative Care Grants program – did not extend to 2010-11. Instead, in 2010-11
additional funding for palliative care came under the ‘sub-acute care’ funding bucket. The
2010-11 Budget for sub-acute care was $731.8 million. However, the proportion of this
funding relating to palliative care is not transparent.
Deloitte Access Economics
54
Living with Parkinson's Disease - update
Due to the difficulty in obtaining a comparable estimate for total palliative care funding in
2011, we (conservatively) assume that Federal government funding for palliative care has
not changed since 2005. Total funding in 2005 of $59.8 is indexed to 2011 by applying
health cost inflation of 3.3% per annum, yielding an estimate of total Federal Government
expenditure on palliative care in 2011 of $73.0 million. This figure will underestimate the
total funding for palliative care, as it does not include contributions from State and
Territory governments or from private sources.
Using the same methodology as the 2007 report (see page 67) to allocate a proportion of
palliative care funding to PD yields an estimate of total government expenditure on
palliative care for PD of around $70,000 (compared to around $57,000 in 2005).
The 2007 report also includes the value of volunteer hours provided to palliative care.
Maintaining this methodology, we indexed the value of volunteer hours provided to PWP in
2005 ($11,200) to 2011 using health cost inflation of 3.3% per annum, yielding an estimate
of $13,700 per PWP in 2011.
Consequently, the total value of community based palliative care services for
PD is around $83,000 (or $49 per death due to PD20).
The assumptions maintained from the 2007 report to arrive at this estimate are outlined in
Table 7.3.
Table 7.3: Assumptions maintained from 2007 report
Statistic
Value Source
% of people who died from PD receiving
specialist palliative care
4.1%
McNamara et al (2004)
% of people receiving specialist palliative care
with PD
0.1%
Access Economics (2007a)
Number of palliative care services
254
Register of Palliative Care Services Palliative Care Australia
% of palliative care services reporting the use
of volunteer services
78%
Palliative Care Australia 1998 Census
Number of volunteer hours received per
week received by each service
35.7
Palliative Care Australia 1998 Census
National Respite for Carers Program (NRCP)
Funding for the NRCP was $200 million in 2009-10 (the most recent year available) (PC,
2010). Inflating this to 2011 by applying health cost inflation of 3.3% yields an equivalent
funding of $206.6 million in 2010-11.
According to the Survey of Disability Ageing and Carers (SDAC) (ABS, 2003), in 2003 there
were 474,600 primary carers, of which 6,900 were carers of PWP (1.45%) (Access
20
Using the upper bound estimates for deaths (see section 3.5)
Deloitte Access Economics
55
Living with Parkinson's Disease - update
Economics, 2007a). Assuming that the proportion of primary carers caring for PWP has
remained unchanged and assuming that carers of PWP accessed respite services at the
same rate and same intensity as other carers, the total expenditure in 2010-11 on respite
for PWP is $3.0 million or $353 per carer. In 2005, total expenditure on the NRCP for PWP
was $2.0 million or $284 per PWP.
Community assistance programs:
The following community assistance programs are accessed by PWP:
Home and Community Care (HACC) Program;
Extended Aged Care at Home (EACH);
Community Aged Care Packages (CACP); and
Veterans Home Care (VHC) program.
The most recent report from the Productivity Commission on Government services (PC,
2011) details government expenditure on these programs in 2009-10 (Table 7.4).
Table 7.4: Government expenditure on selected community care programs (2009-10), $m
Total expenditure in
Australia ($m)
HACC
CACP
EACH
VHC*
Total
1,944.5
508.7
206.0
90.8
2,750
Source: PC, 2011
An additional 5.3 million for Community Care Grants and 109.6 million for DVA Community
Nursing were provided by DoHA and the DVA respectively.
However, no information is available on the use of these programs by PWP, so in line with
the 2007 methodology, they are excluded from our cost estimate.
Summary
In 2011, expenditure on PWP through government programs was at least $3.1 million,
consisting of community based palliative care ($83,101) and respite ($3.0 million). This is a
highly conservative estimate as expenditure on community care programs is excluded.
In 2005, this cost was estimated as $2.1 million, therefore growing by 40% over the 6-years
to 2011.
7.6 Funeral expenses
The ‘additional’ cost of funerals borne by family and friends of PWP is based on the number
of deaths due to PD. However, some PWP would have died during this time anyway, and
eventually everyone must die, and thus incur funeral expenses – so the true cost is the cost
brought forward (adjusted for the likelihood of dying anyway). The BTRE (2000) calculated
a weighted average cost of a funeral across all States and Territories, to estimate an
Australian total average cost of $3,200 per person for 1996, or $4,763 per person in 2011
(inflated using the CPI).
Deloitte Access Economics
56
Living with Parkinson's Disease - update
7.7 Summary
Overall, other financial costs due to PD were around $57.1 million in 2011. In 2005, this
cost was around $40.5 million, equating to growth of around 40% over the period (Table
7.5). The cost of aids and modifications continues to constitute the majority of these costs.
Table 7.5: Other financial costs of PD ($m), 2005 and 2011 (nominal)
Cost category
Cost ($m)
Aids and modifications
Formal care
Palliative care
Respite
Funeral costs
Total
Growth (%)
2005
2011
36.5
51.4
41
1.3
1.8
38
0.07
0.08
22
2.1
3.0
46
0.6
0.8
32
40.5
57.1
41
Around half of this growth was due to the increase in the prevalence of PD, but on average,
the cost per PWP still increased substantially to $887 (up 20% from $741 in 2005). The
remainder of the cost increase was largely due to CPI inflation over the period.
The distribution of costs over the stages of PD were largely unchanged, with costs peaking
in stage IV before many people were admitted to nursing homes (Chart 7.1).
Chart 7.1: Indirect costs per PWP ($), by disease stage
2,000
1,772
1,800
1,600
1,500
Other financial costs ($)
1,400
1,200
1,000
767
800
713
600
400
220
200
0
Stage I
Stage II
Stage III
Stage IV
Stage V
Disease stage
Deloitte Access Economics
57
Living with Parkinson's Disease - update
8 Transfers
Transfer payments are financial flows that impact on who bears the cost, but not on the
overall level of costs. However, the act of taxation and redistribution creates distortions
and inefficiencies which result in real costs, known as deadweight losses.
As well as being necessary to calculate DWLs, transfer costs are important when adopting a
whole-of-government approach to policy formulation and budgeting. Transfer costs also
allow us to examine the distribution of the costs of PD across different parts of society.
The following transfers relate to PD:
financial support for PWP (transfer from society to PWP)
financial support for carers of PWP (transfer from society to carers)
lost taxation revenue on foregone earnings through early workforce separation and/or
temporary absenteeism due to PD (transfer from society to PWP)
8.1 Financial support for PWP
The main source of income support for PWP is the Disability Support Pension (DSP). This is
payable to people aged less than 65 years. People aged 65+ are eligible for the age pension,
but following the method in the 2007 report, this section will focus only on people aged less
than 65 who would be receiving the DSP.
Drawing on findings from the 1999 ‘Living with Parkinson’s Disease in the Central West
NSW Study’, the 2007 report assumed that 56% of PWP aged 55–64 years received income
support. Maintaining this assumption, we estimate that 6,592 PWP aged less than 65 years
received income support in 2011 (up from 5,591 in 2005).
At June 2010 (the most recent period with data available), 792,581 people in Australia were
receiving the Disability Support Pension (FaHCSIA, 2011). DSP payments cost the
Government around 0.9% of GDP per annum (Commonwealth of Australia, 2010), thus for
2011, the total cost of DSP payments was around $2.9 billion, or $3,683 per person
(compared with $3,545 per person in 2005). Applying this per person cost to the number of
PWP receiving income support in 2011 estimated above provides an estimate of the total
expenditure on DSP payments to PWP in 2011 of $24.3 million. This expenditure has
grown by around 23% from $19.8 million in 2005, mainly a result of an increase in the
number of PWP receiving income support (payment per PWP has only increased slightly).
However, some of these people would have received DSP payments even in the absence of
PD, which must be netted out to estimate the additional welfare payments due to PD. In
line with the 2007 report, we do this by drawing on a Melbourne University study (Tseng
and Wilkins, 2002) about the ‘reliance’ of the general population (aged 15-64 years) on
income support.
Deloitte Access Economics
58
Living with Parkinson's Disease - update
Table 8.1: Additional DSP payments to PWP, 2011
Average reliance (%)
Males
Females
Disability Support Pension
10.2
Additional payments, 2011
($m)
14.9
21.4
Source: Tseng and Wilkins (2002)
Thus, we assume that 10% of the DSP payments made to females with PD and 15% of the
payments made to males with PD would have been made regardless of PD. This means that
around $21.4 million in additional welfare payments are paid to working age PWP – or
$1,800 per working age PWP.
8.2 Financial support for carers of PWP
There are two main income support measures available to primary carers:
Carer Payment is a means-tested income support payment payable to people who
cannot work full time because they provide home-based care to an adult or child who
has a severe and long-term disability or health condition, or the equivalent amount of
care to a number of less disabled people21.
Carer Allowance is a non-means tested income supplement for people who provide
daily care to an adult or child with a severe and long-term disability or health condition.
In 2010-11 around $4.3 billion was paid to carers in the form of the Carer Payment and
Carer Allowance (FaHCSIA, 2011b). Assuming that the number of hours provided per carer
receiving each payment has not changed since the 2007 report, the cost per hour can be
calculated
Table 8.2: Income support to carers, 2010-11
2010-11 budget
$m
Number of
recipients at
June 2010
Hours of care
(millions)
Cost per hour
$
Carer payment
2,730.7
168,913
1,754
1.56
Carer allowance
1,601.0
495,733
1,957
0.82
4,331.7
664,646
3,711
Total
Sources: ABS, 2010b; FaHCSIA, 2011 & 2011b
Based on these estimates and the number of carers of PWP (outlined in section 7.1), we
estimate that around $14.5 million was provided to carers of PWP in 2010-1122, or $230
per PWP. The estimate of the PWP cost has declined by $10 since 2005, indicating that the
funding for these payments has not increased proportionately with the aggregate level of
care required by PWP in 2011.
21
The PWP must also be in receipt of an income support payment.
22
This assumes that carers of PWP receive the Carer Payment or allowance at the same rate as the general
carer population for the period for which care is provided.
Deloitte Access Economics
59
Living with Parkinson's Disease - update
The government also paid an additional $452.9 million in Carer Supplements and $160.5
million in Child Disability Support Payments. However, there is no detailed information on
the number of recipients of these payments, so they are excluded from our costing.
The 2007 report details some additional avenues of financial support for carers and PWP,
such as Bereavement Allowances and Payments, payments from the DVA and early access
to superannuation.
8.3 Lost taxation revenue
PWP and their carers in paid employment, who have left the workforce temporarily due to
caring responsibilities, or permanently due to premature retirement or death, will
contribute less tax revenue to the Government. This lost value in wages and firm output
was calculated in chapters 6 and 7. Pre-tax:
PWP lost $82.5 million in wage income due to long-term lost earnings and premature
death;
Carers lost $11.2 million in wage income due to caring for PWP;
Employers lost $24.8 million in production value on account of absenteeism of the
carer, lost management productivity in managing the absenteeism, and direct worker
hiring and retraining costs.
In 2005, these losses were $42.1 million, $5.4 million and $13.1 million respectively.
In line with the methodology in the 2007 report, employer losses are treated as lost
company revenue, and the remainder are treated as lost personal income. The average
personal income tax rate is 18.9% and the average indirect tax rate is 12.6%, based on the
Access Economics Macroeconomic model (AEM). The vast majority of company income is
distributed to domestic shareholders (as franked dividends) and thus the income is charged
at the relevant personal tax rate (Access Economics, 2007a).
Together these calculations generate a total loss of tax revenue of $37.3 million in 2011,
up 68% from $22.2 million in 2005. The increase is entirely a result of there being more
foregone income due to PD, with both average tax rates actually declining since 2005.
8.4 Deadweight losses
In line with the 2007 report, the rate of deadweight loss used in this report is 27.5 cents per
$1 of tax revenue raised (PC, 2003), plus 1.25 cents per $1 of tax revenue raised for
Australian Taxation Office (ATO) administration. The DWL rate is applied to:
lost tax revenue from foregone earnings of PWP, their carers and employers (which
must be raised from another source);
welfare payments made to PWP and their carers; and
government services provided (e.g. the public health system, grants and programs)
(since in a budget neutral setting government expenditures require taxation to be
raised and thus also have associated distortionary impacts).
Deloitte Access Economics
60
Living with Parkinson's Disease - update
In 2011, the total deadweight loss relating to PWP was around $116 million (Table 8.3). In
2005, this cost was $82.3 million, thus DWL have increased by around 41% over the 6 years
to 2011 (entirely due to the increase in transfers).
Table 8.3: Summary of transfers and deadweight losses, 2011
Transfer
Health system costs borne by the Government
Other costs borne by the Government
Amount in 2011
($m)
345.5
3.1
Lost taxes
37.3
Welfare payments
35.9
Total transfers
421.8
Resulting dead weight loss
121.3
Deloitte Access Economics
61
Living with Parkinson's Disease - update
9 Burden of disease
A substantial cost of PD is the loss of wellbeing and life expectancy that patients
experience. As such, total economic costs of PD include a valuation of the burden of disease
(BoD). The BoD is measured in terms of disability adjusted life years (DALYs), which is the
sum of healthy years of life lost due to disability (YLD) and years of life lost due to
premature death (YLL). The BoD is converted into a monetary equivalent using an imputed
value of a statistical life year (VSLY), to enable comparison between the BoD and the
financial costs of PD.
In the last report, a gross VSLY of $162,561 (in 2005 dollars) was estimated based on the
value of a statistical life of $3.7 million. Since the 2007 report was completed, the
Department of Finance has released a guidance note on VSLY in Australia (OBPR, 2008). The
recommendation is that departments and agencies use the estimate of $3.5 million for the
value of statistical life and $151 000 for the value of statistical life year (both of these are
measured in 2007 dollars). Applying indexation, the VSLY in 2011 is $164,192. This VSLY
translates to a value of a statistical life year of $3.9 million in 2011 (using a discount rate of
3% (see section 4.3) and an expected life span of 40 years).
The BoD is then estimated by applying the value of a statistical life year of $164,192 to the
total Disability Adjusted Life Years (DALYs) calculated due to PD. This is done as follows,
with the results by disease stage summarised in Table 9.1:
Years of healthy life lost due to disability (YLDs) are calculated based on disability
weights of PD used in Begg et al (2007), multiplied by the number of PWP as estimated
in Section 3.2 (with no age weighting)23.
Years of life lost due to PD (YLLs) are calculated by comparing the number of deaths
from PD by age (as estimated in Section 3.5) with the corresponding YLLs for that age of
death in the Standard Life Expectancy Table (West Level 26).
YLDs and YLLs are added together to estimate total DALYs.
Table 9.1: Estimating the burden of PD in 2011, by disease stage
Stage
YLDs
YLLs
DALYs
Value in 2011 ($m)
I
9,633
3,143
12,776
2,098
II
8,202
2,921
11,123
1,826
III
6,993
2,630
9,623
1,580
IV
6,668
1,572
8,241
1,353
V
3,570
737
4,307
35,065
11,004
46,069
707
7,564
Total all stages
23
Note that this is a prevalence methodology for estimating YLDs, rather than an incidence methodology as
used in Begg et al (2007).
Deloitte Access Economics
62
Living with Parkinson's Disease - update
In summary, the non-financial burden of PD resulting from loss of life and
wellbeing in 2011 is estimated at around $7.6 billion.
In 2005, this cost was estimated to be around $6.3 billion, thus the estimated BoD has
increased by around 21% over the 6-years to 2011.
PWP aged 75-85 years bear most of the total burden of PD (Chart 9.1), but this is because
of the high prevalence in this age group. Per PWP, the burden increases consistently with
age (Chart 9.2).
Similarly, although most of the total burden is borne by PWP in the initial stages of the
disease (Chart 9.3), the burden per PWP increases with disease stage (Chart 9.4).
Chart 9.1: Total DALYs, by age, 2011
18,000
16,000
14,000
DALYs
12,000
10,000
8,000
6,000
4,000
2,000
0
0-4
5–14
15–24
25–34
35–44
45–54
55–64
65–74
75-84
85+
Age
YLDs
Deloitte Access Economics
YLLs
63
Living with Parkinson's Disease - update
Chart 9.2: DALYs per PWP, by age, 2011
1.00
0.80
DALYs
0.60
0.40
0.20
0.00
0-4
5–14
15–24
25–34
35–44
45–54
55–64
65–74
75-84
85+
Age
YLDs
YLLs
Chart 9.3: Total DALYs, by disease stage, 2011
14,000
12,000
10,000
DALYs
8,000
6,000
4,000
2,000
0
Stage I
Stage II
Stage III
Stage IV
Stage V
Disease stage
Deloitte Access Economics
64
Living with Parkinson's Disease - update
Chart 9.4: DALYs per PWP, by disease stage, 2011
1.2
1.1
1.0
1.0
DALYs
0.8
0.6
0.7
Stage I
Stage II
0.7
0.6
0.4
0.2
0.0
Stage III
Stage IV
Stage V
Disease stage
Note: DALYs per PWP are greater than 1 in stage V because future YLLs due to PD are attributed to the year that
the person dies.
Deloitte Access Economics
65
Living with Parkinson's Disease - update
10
Total economic cost of PD
In Australia in 2010-11 it is estimated that there were:
64,044 people living with PD;
10,497 new cases of PD; and
between 1,299 and 1,692 deaths due to PD.
The total financial cost of PD in the year 2011 was around $775.4 million.
The financial cost of PD has increased by 48% since 2005.
Costs placed on the health system were by far the largest component of the financial costs
of PD (Figure 10.1). Moreover, growth in health system costs accounted for over half of the
growth in financial costs since 2005.
Health system costs were $478.5 million (62%).
Deadweight losses were $121.3 million (16%).
Productivity costs were $107.3 million (14%).
Other financial costs were $57.1 million (7%).
Carer costs were $11.2 million (1%).
Figure 10.1: Financial costs of PD, by cost type, 2011
Deadweight Loss
16%
Other Financial Costs
7%
Carer Costs
1%
Productivity Costs
14%
Deloitte Access Economics
Health System Costs
62%
66
Living with Parkinson's Disease - update
The proportion of total financial costs attributable to each component is largely unchanged
since 2005. There was a slight shift from health system costs (-3 percentage points (%pts))
into productivity costs (+3 %pts).
The financial costs of PD are mainly borne by the Federal Government (39%), followed by
society and other parties (such as private health insurers and charities) (22%), the
household (PWP, their families and friends) (21%), State Governments (16%) and employers
(2%) (Chart 10.2). Again, this distribution is largely unchanged since 2011.
Chart 10.2: Financial costs of PD, by bearer of cost, 2011
Households
21%
Federal Government
39%
Society/ Other
22%
Employers
2%
State Government
16%
In addition to financial costs, the burden of disease – the suffering and premature death
experienced by people with PD – is estimated to cost an additional 46,069 DALYs (years of
healthy life lost), with 76% due to disability and the remaining 24% due to premature
death. The net value of the burden of disease was $7.6 million in 2011 (an increase of 21%
since 2005).
Thus, the total economic cost of PD per annum in 2011 was $8.3 billion.
Deloitte Access Economics
67
Living with Parkinson's Disease - update
Table 10.2: The total cost of PD by cost type and bearer of cost ($m), 2011
Individuals
Family/
Friends
Australian
Govt
State
Govt
Employers
Society
/ Other
Total
7,564.2
0.0
0.0
0.0
0.0
0.0
7,564
80.4
56.5
0.0
0.0
0.0
7.6
223.5
33.8
3.5
122.0
0.0
0.0
0.0
17.0
0.0
52.6
0.0
0.0
478
107
11
53.2
0.0
-21.4
7,732.9
0.8
0.0
-14.5
-6.1
3.1
0.0
35.9
299.8
0.0
0.0
17.0
0.0
121.3
0.0
173.9
57
121
0
8,339
Burden of Disease
Health System
Costs
Productivity Costs
Carer Costs
Other Financial
Costs
Deadweight Loss
Transfers
Total
0.0
0.0
122.0
The economic cost of PD per PWP was around $130,000, of which the BoD component was
around $118,000 per PWP (91%) while the financial cost was around $12,000 per PWP (9%).
The total economic cost per PWP increased by 5% over the 6-years to 2011,
largely as a result of higher burden of disease and productivity costs (Chart
10.3Chart 10.4).
Chart 10.3: Financial cost of PD per PWP, by cost type, 2005 and 2011 (nominal)
8,000
7,472
7,000
6,284
Cost per PWP, $
6,000
5,000
4,000
3,000
1,894
1,675
2,000
1,447
1,008
1,000
741 892
98
174
0
Health System Costs
Productivity Costs
Carer Costs
2005
Deloitte Access Economics
Indirect Costs
DWL
2011
68
Living with Parkinson's Disease - update
Chart 10.4: Burden of Disease per PWP, 2005 and 2011 (nominal)
119
118.1
BoD per PWP, $'000s
118
117
116
115
114.4
114
113
BoD
2005
2011
While the BoD generally increases with age (Chart 10.5), the financial cost of PD is highest
for people aged 50-65 years (Chart 10.6). This is largely due to the lost earnings due to
premature mortality and workforce separation, with this effect dissipating from 65 years
onwards.
The total value of the BoD is largely unchanged since 2005, mainly because the
methodology for the estimate of the VSLY differed from the previous report (chapter 9).
Deloitte Access Economics
69
Living with Parkinson's Disease - update
Chart 10.5: Net value of the burden of disease per PWP, by age ($), 2005 and 2011
(nominal)
160,000
Net value of Burden of Disease
140,000
120,000
100,000
80,000
60,000
40,000
20,000
0
25-29 30-34 35-39 40-44 45-49 50-54 55-59 60-64 65-69 70-74 75-79 80-84 85-89
90+
Age
2005
2011
Financial costs increased across all age groups except those aged 30-34, but the distribution
across age groups was largely unchanged.
Chart 10.6: Financial cost per PWP, by age ($), 2005 and 2011 (nominal)
20,000
18,000
16,000
Total financial cost, $
14,000
12,000
10,000
8,000
6,000
4,000
2,000
0
25-29 30-34 35-39 40-44 45-49 50-54 55-59 60-64 65-69 70-74 75-79 80-84 85-89
90+
Age
2005
Deloitte Access Economics
2011
70
Living with Parkinson's Disease - update
The value of the BoD increases with disease stage and again, is largely unchanged since
2005 (Chart 10.7)
Chart 10.7: Net value of the burden of disease per PWP, by disease stage ($), 2005 and
2011 (nominal)
200,000
180,000
Net value of the Burden of Disease
160,000
140,000
120,000
100,000
80,000
60,000
40,000
20,000
0
I
II
III
IV
V
Disease stage
2005
2011
Financial costs are highest in stage IV of PD (though stage V costs are basically equivalent)
(Chart 10.8). Financial costs have increased for all stages since 2005.
Deloitte Access Economics
71
Living with Parkinson's Disease - update
Chart 10.8: Financial costs per PWP, by disease stage ($), 2005 and 2011 (nominal)
25,000
Financial costs, $
20,000
15,000
10,000
5,000
0
I
II
III
IV
V
Disease stage
2005
Deloitte Access Economics
2011
72
Living with Parkinson's Disease - update
11 Sensitivity analyses
Although conservative assumptions have been used, almost every parameter is surrounded
by some uncertainty. Performing a sensitivity analysis on every parameter would involve
expending considerable effort for very little benefit (varying many of the parameters would
have a negligible impact on the total cost). Consequently the sensitivity analysis focuses on
a range of variables considered to be significant in this study. The choice of parameters
reflects either their potential impact on an important individual cost category (for example
parameters specific to productivity costs), or their pervasive impact on a number of cost
categories (for example the discount rate).
11.1 Prevalence and incidence
The 2007 report details the method for calculating an upper and lower bound for
prevalence and incidence of PD (pp 95-6). Following these methods yields the following
results for 2011 (Table 11.1):
Table 11.1: Analysis using upper and lower bound prevalence estimates, 2011
Base case
Prevalence
Lower bound*
64,044
Upper bound**
62,486
84,538
(-2.4%)
(+32%)
Costs ($m):
BoD
7,564
7,489
(-1%)
9,407
(+24%)
Financial costs
775.4
711.9
826.1
(-8%)
(+6.5%)
8,200.8
(-1.7%)
10,232.6
(+23%)
Total economic costs
8,339.5
*Based on Begg et al (2007) scaled up 8.2% to include secondary PD.
** The upper bound estimate of prevalence is based on the number of people receiving medications explicitly
for PD (i.e. the base case) increased by 32% to take into account the average rate of under-diagnosis of PD
found by de Rijk (1997).
11.2 Health system costs
As outlined in chapter 5, the health system cost estimates for 2011 are based on 2000-01
AIHW data, adjusted for health cost inflation and growth in the prevalence of PD. Using
these costs as a basis for estimation implicitly assumes that the use of the health system
has not changed since 2000-01 (e.g. assuming that the average cost of providing inpatient
hospital services has not changed assumes there have been no changes to procedures,
equipment or upgrades etc that would have increased/decreased the per person cost of
hospitalisations). It therefore neglects any additional funding for upgrades and innovations.
Deloitte Access Economics
Commercial-in-confidence
73
Living with Parkinson's Disease - update
This assumption also implies that there have been no changes to the usage rates of
pharmaceuticals or (for example) deep brain stimulation.
This assumption is clearly quite significant, and given the relative weight of health system
costs in total financial costs of PD, it has the potential to have a material impact on the
results. However, whether the average health system cost per PWP has increased or
decreased since 2000-01 is not clear and where there is uncertainty, it is best to use the
best available data and note the sensitivity of the estimates to this assumption. As such we
performed a high/low sensitivity analysis of the health system costs provided in Table 5.1.
Notably, changes in treatments may also affect the burden of disease, since for example,
deep brain stimulation has been shown to improve quality of life for PWP. Increases in
health system costs may therefore be associated with reductions in the burden of disease
costs.
AIHW projections indicate that health care expenditure on PD will increase by around $41
million per year between 2002-03 and 2032-33 (in 2011 dollars) (AIHW, 2008). Of this, it is
estimated that increased utilisation of the health system by PWP will contribute $14.8
million per year, and increased prevalence of PD will contribute $0.76 million per year. The
remainder of the increase is attributed to ageing, population, and price. Our estimates of
health system costs in Chapter 5 have accounted for ageing and population impacts
through updated demographic data and price impacts through health cost inflation.
Drawing on the AIHW estimates outlined above, we can estimate a high scenario for health
system costs in 2011 due to PD (Table 11.2) and test the sensitivity of the results to these
assumptions (Table 11.3).
Table 11.2: Health system expenditure
2000-01
expenditure
Base case 2011
expenditure
High case 2011
expenditure
0-4
0.1
0.0
0.0
5–14
0.0
0.0
0.0
15–24
0.2
0.0
0.0
25–34
0.3
0.4
0.6
35–44
1.3
2.3
3.7
45–54
4.9
9.1
14.6
55–64
18.6
43.2
69.1
65–74
53.2
105.8
169.4
75-84
81.2
157.1
251.5
85+
32.9
84.0
134.5
192.7
402.0
643.4
Total
Deloitte Access Economics
74
Living with Parkinson's Disease - update
Table 11.3: High health expenditure scenario sensitivity analysis
Base case
Total financial costs
775.4
High case
1,067.8
(+37.7%)
Burden of disease
7,564.2
7,564.2
(no change)
Total economic costs
8,339.5
8,632.0
(+3.5%)
Under the high case scenario for health system costs (which assumes that health system
expenditure due to growth in prevalence of PD and utilisation of the health system per case
of PD grows according to AIHW (2008) projections) total economic costs of PD are
estimated to be around $8.5 billion in 2011, 3.1% higher than in the base case scenario. The
increase is entirely captured within total financial costs, which are around 38% higher due
to higher health system costs, as well as higher formal care costs and consequently, higher
DWLs.
11.3 Deadweight Losses
Deadweight losses are the third largest cost component of the total economic cost of PD in
2011, accounting for 16% of financial costs. Section 8.4 describes the calculation of
deadweight losses due to PD using a rate of 28.75% (the base case). A DWL rate of 28.75%
was selected to follow the methodology of the 2007 report. However, there are sensible
arguments that support the selection of a higher and a lower rate. For example, it could be
argued that based on a meta-analysis of the literature, 28.75% is too high, for instance,
Campbell (1997) finds it to be 24%. On the other hand, although the rate itself is quite high,
the transfers that the DWL is applied to in this report are conservative estimates of the
actual transfers relating to PWP in Australia. For instance, as outlined in section 8.1, the
estimate of Government expenditure on PWP through government programs is highly
conservative as it disregards expenditure on community care programs and assumes public
expenditure on palliative care has been unchanged since 2005. Thus, it could be argued
that a higher DWL should be used to offset the ‘low’ estimate for transfers.
As such, this section presents the results of high and low sensitivity analyses using a DWL
rate of base case +/- 5%pts.
Deloitte Access Economics
75
Living with Parkinson's Disease - update
Table 11.4: High and low DWL scenarios sensitivity analysis
Total financial costs
Burden of disease
Total economic costs
Base case
DWL = 28.75%
High case
DWL = 33.75%
Low case
DWL = 23.75%
775.4
796.5
754.3
(+2.7%)
(-2.7%)
7,564.2
(no change)
7,564.2
(no change)
7,564.2
(no change)
8,339.5
8,360.6
(+0.3%)
8,318.4
(-0.3%)
Source: Deloitte Access Economics’ calculations
Increasing (decreasing) the rate of DWL by five percentage points increases (decreases) the
estimate of total economic costs of PD in 2011 by 0.3%.
Deloitte Access Economics
76
Living with Parkinson's Disease - update
12 Conclusions
This report provides an update to the report ‘Living with Parkinson’s Disease’, which was
based on 2005 data (released in June 2007).
The analysis highlights the growing burden of PD and its extent throughout many sectors of
society and the economy. Although there have been some advances since the 2007 study,
adoption of many of the positive steps advocated in the 2007 report has been limited and
many of the issues impeding advancement outlined in the 2007 report (such as the lack of a
definitive test for PD diagnosis) still apply.
A major challenge facing advancement in reducing the burden of PD is the lack of
government funding for services focussed specifically on PD – in particular – funding for the
education of specialist Parkinson’s nurses.
Acute specialist knowledge regarding
medication and symptoms is required to provide effective care for PWP. The Movement
Disorders Faculty of the Royal College of Nursing has advised that there are 33 nurses who
can be considered as specialists, compared with 264 in the UK. None of the Australian
nurses are funded by the Australian Government and there is no policy to provide them on
a basis similar to the UK. Recognised benefits and select examples from the UK’s
investment in specialist Parkinson’s nurses are provided below (Parkinson’s UK, 2011):
A singe Parkinson’s nurse can save, on average, £43,812 (A$57,83124) in consultant
appointments each year:
“For an average 12-month period between January 2009 and February 2010,
504 patients were seen in a nurse-led clinic, or at home, rather than by the
consultant. At a local tariff of £194, the Parkinson’s nurse saved on average
£97,776 in avoided consultant appointments for this trust each year.” –
Western Cheshire Primary Care Trust
Community-based Parkinson’s nurses can save more than £80,000 (A$105,600) per
year in avoided hospital admissions:
“Admission figures for patients with Parkinson’s from Bury Primary Care Trust
to Fairfield Hospital from 2008-2009 compared to 2009-2010, have reduced
from 172 to 154. This is an admissions reduction of 10% since the Parkinson’s
nurse started in post. The trust calculated the fixed annual cost saving of this
reduction is £81,522 each year.”
Parkinson’s nurses can save on average £147,021 (A$194,068) per year in bed days:
“The Parkinson’s nurse appointed in 2009 saved Pennine Acute Trust £190,218
each year by reducing the number of bed days for people with Parkinson’s.
Between 2008/09 and 2009/10 there were 294 fewer bed days used for
Parkinson’s patients at a cost of £647 per day.”
24
All exchanges are done using OECD
http://stats.oecd.org/Index.aspx?DataSetCode=CPL
Deloitte Access Economics
Purchasing
Power
Parity
(PPP)
exchange
rates:
77
Living with Parkinson's Disease - update
Another key issue is the lack of formal recognition of PD as a chronic disease. The Australian
Government’s National Chronic Disease Strategy covers cancer, diabetes, heart disease,
stroke and vascular disease, but not PD, or any other neurological condition (NHPAC, 2006).
However, the 2007 Access Economics report notes that over a lifetime, PWP experience
more DALYs than people with any of the aforementioned conditions. In fact, the number of
DALYs per PWP is second only to congenital malformations and associated illnesses (Access
Economics, 2007: page 110). This lack of recognition limits funding and services that are
available only to ‘chronic’ diseases.
As well as a lack of funding for PD, there is also a lack of awareness in the general
community, and in many parts of the health services community, of the challenges and
needs of those suffering from PD, their families and carers. This often results in suboptimal care, increasing the burden of the disease. These challenges and needs are
exacerbated for people with early onset PD, which is generally considered as those younger
than 65 years with PD, of which there were an estimated 11,865 persons in 2011. Young
PWP often have additional needs relating to forming relationships and rearing children, as
well as asset acquisition and financial planning. Awareness and services dedicated to these
people are currently very limited, further magnifying the burden of the disease.
Although there are a number of effective treatments available for PWP in Australia, a lack
of synthesis in the approach to tackling PD has resulted in many of these treatments being
too expensive since even if the drug itself is listed on the PBS, oftentimes the consumables
required to administer the drugs are not. This example highlights the need for a
collaborative approach to addressing the issues and challenges faced by PWP, especially
since the number of PWP is expected to almost double over the next two decades alongside
the finding of this report that the burden of PD per PWP is increasing.
Deloitte Access Economics
78
Living with Parkinson's Disease - update
References
Access Economics (2004) ‘Costs of Workplace Injury and Illness to the Australian Economy:
Reviewing the Estimation Methodology and Estimates of the Level and Distribution of
Costs’, report for the National Occupational Health and Safety Commission, now
OASCC.
-
(2007a) ‘Living with Parkinson’s disease: Challenges and positive steps for the
future’, report for Parkinson’s Australia, 18 June.
-
(2007b) The Economic Cost of Cancer in NSW, report for Cancer Council NSW.
Australian Bureau of Statistics (2003) ‘Survey of Disability, Ageing and Carers (SDAC)’ special
request.
-
(2010a) ‘Working Time Arrangements, Australia, November 2009’, Cat. No. 6342.0,
21 May.
-
(2010b) ‘Disability, Ageing and Carers, Australia: Summary of Findings, 2009’, Cat.
No. 4430.0, 16 December.
-
(2011a) ‘Australian Labour Market Statistics, April 2011’, Cat. No. 6105.0, 5 April.
-
(2011b) ‘Employee Earnings, Benefits and Trade Union Membership, Australia, Aug
2010’, Cat. No. 6310.0, 6 May.
-
(2011c) ‘Labour Price Index, Australia, March 2011’, Cat. No. 6345.0, 18 May.
-
(2011d) ‘Australian National Accounts: National Income, Expenditure and Product,
Mar 2011’, Cat. No. 5206.0, 1 June.
-
(2011e) ‘Disability, Ageing and Carers Australia, Summary of Findings, 2009’, Cat. No.
4430.0, 20 June.
-
(2011f) ‘Australian Demographic Statistics, Dec 2010’, Cat. No. 3101.0, 23 June.
Australian Institute of Health and Welfare (2011a) ‘Health Expenditure Australia 2008-09’,
http://www.aihw.gov.au/publication-detail/?id=6442472450&tab=2, accessed 4
August 2011.
-
(2011b) ‘National Hospital Morbidity DataCube’.
-
(2004) ‘Australia’s Health 2004’, Australian Institute of Health and Welfare, Cat No
AUS 44.
Begg S, Vos T, Barker B, Stevenson C, Stanley L, Lopez AD (2007) ‘Burden of disease and
injury in Australia 2003’, AIHW PHE 82 Canberra, April.
Deloitte Access Economics
79
Living with Parkinson's Disease - update
Campbell, H (1997) ‘The cost of public funds in Australia’, The Economic Record, 73(220):
22-34.
Chrischilles E, Rubenstein L, Voelker M, Wallace R, and Rodnitzky R (1998) ‘The Health
Burdens of Parkinson’s Disease’, Movement Disorders, 13(3): 406-413.
Colebatch, T (2009) ‘Retirement by 70 a fading hope for many’, The Age, 25 February: 1,
http://www.theage.com.au/national/retirement-by-70-a-fading-hope-for-many20090224-8gvu.html, accessed 21 July 2011.
Commonwealth of Australia (2010) ‘Australia to 2050: Future challenges’, Intergenerational
report 2010, Canberra, January.
Department of Families, Housing, Community Services and Indigenous Affairs (FaHCSIA)
(2011) ‘Income support customers: A statistical overview 2010’, Statistical paper No.
9, Canberra.
-
(2011b) ‘Portfolio budget statements 2011-12: Budget Related Paper No. 1.7’,
Canberra.
Department of Health and Ageing (DOHA) (2011) ‘Health and Ageing Portfolio Budget
Statements
2010-11:
Health
System
Capacity
and
Quality’,
http://www.health.gov.au/internet/budget/publishing.nsf/Content/201011_Health_PBS_sup2/$File/Outcome%2010%20%20Health%20System%20and%20Capacity.pdf, accessed 4 August 2011,
-
(2010),
‘Home-based
care’,
http://www.health.gov.au/internet/main/publishing.nsf/content/hacc-index.htm,
accessed 4 August 2011.
-
2006, ‘Ropinirole’, Public Summary Documents by Product, available:
http://www.health.gov.au/internet/main/publishing.nsf/Content/pbac-psdropinirole-mar06 (accessed 27 September 2011).
Findley, L, Aujla, M, Baker, M, Beech, C et al 2003, ‘Direct economic impact of Parkinson’s
disease: a research survey in the United Kingdom’, Movement Disorders, 18(10):
1139–1189.
Health and Safety Executive (1999) The costs to Britain of workplace accidents and workrelated ill health in 1995-96, second edition, HSE Books.
Le Pen C, Wait S, Moutard-Martin F, Dujardin M, and Zieger M (1999) ‘Cost of Illness and
Disease Severity in a Chort of French Patients with Parkinson’s Disease’,
Pharmacoeconomics, 16(1):59-69
Lix LM, Hobson DE, Azimaee M, Leslie WD, Burchill C, Hobson S (2010) ‘Socioeconomic
variations in the prevalence and incidence of Parkinson's disease: a populationbased analysis’, Journal of Epidemiology Community Health, 64(4), pp. 335-40.
Mathers, C, Stevenson, C, Carter R, Penm, R 1998, Disease costing methodology used in the
Disease Costs and Impact Study 1993-94, AIHW Cat No HWE 7.
Deloitte Access Economics
80
Living with Parkinson's Disease - update
Medical Services Advisory Committee (MSAC) (2006) ‘Deep brain stimulation for the
symptoms of Parkinson’s disease’, report for DOHA.
Mehta P, Kifley A, Wang J, Rochtchina E, Mitchell P & Sue C (2007) ‘Population prevalence
and incidence of Parkinson’s disease in an Australian community’, Internal Medicine
Journal 37, pp. 812-814.
Morgante L, Nicoletti A, Epifanio A, Contrafatto D, Savica R, Lanzafame S, Musolino R, La
Spina P, Bonuccelli U, Marconi R, D'Amelio M, Savettieri G and Zappia M (2008)
‘Prevalence of Parkinson's disease and other types of parkinsonism in the Aeolian
Archipelago, Sicily’, Parkinsonism Related Disorders, 14(7), pp. 572-5.
National Health Priority Action Council (NHPAC) (2006) ‘National Chronic Disease Strategy’,
Australian Government Department of Health and Ageing, Canberra
National Institute of Neurological Disorders and Stroke (NINDS) (2005) ‘Parkinson's Disease:
Hope
Through
Research’,
http://www.ninds.nih.gov/disorders/parkinsons_disease/detail_parkinsons_disease.
htm, accessed 15 August 2011Newman EJ, Grosset KA and Grosset DG (2009a)
‘Geographical difference in Parkinson's disease prevalence within West Scotland’,
Movement Disorders, 24(3), pp. 401-6.
Newman EJ, Breen K, Patterson J, Hadley DM, Grosset KA and Grosset DG (2009b) ‘Accuracy
of Parkinson's disease diagnosis in 610 general practice patients in the West of
Scotland’, Movement Disorders, 24(16), pp. 2379-85.
Neurology Expert Group (2007) ‘Parkinson’s disease’, Therapeutic Guidelines: neurology,
version 3, Therapeutic Guidelines Limited Melbourne.
Office of Best Practice Regulation (OBPR) (2008) ‘Value of statistical life, Best practice
regulation
guidance
note’,
http://www.finance.gov.au/obpr/docs/ValuingStatisticalLife.pdf (accessed 29 April
2011).
Osaki Y, Morita Y, Kuwahara T, Miyano I and Doi Y (2010) ‘Prevalence of Parkinson's disease
and atypical parkinsonian syndromes in a rural Japanese district’, Acta Neurology
Scandinavia, published online ahead of print.
Parkinson’s UK (2011) ‘Parkinson’s nurses – affordable, local, accessible and expert care: A
guide
for
commissioners
in
England’,
http://www.parkinsons.org.uk/advice/publications/professionals/england_nurse_rep
ort.aspx, accessed 15 August 2011.
Prince of Wales Medical Research Institute (3 April 2007) Diagnostic methods for
Parkinson’s
Disease,
available
at:
http://www.powmri.edu.au/research/pdda/pdrd/cellular/
diagnostic.htmProductivity Commission (PC) (2011) ‘Report on Government Services
2011’, http://www.pc.gov.au/gsp/reports/rogs/2011, accessed 4 August 2011.
Productivity Commission (PC) (2003) ‘Evaluation of the Pharmaceutical Industry Investment
Program’, Research report, AusInfo, Canberra.
Deloitte Access Economics
81
Living with Parkinson's Disease - update
Rubenstein L, Chrischilles E, and Voelker M (1997) ‘The Impact of Parkinson’s Disease on
Health Status, Health Expenditures, and Productivity: Estimates from the National
Medical Expenditure Survey’, Pharmacoeconomics, 12(4): 486-498.
Seijo-Martinez M, Castro del Rio M, Rodríguez Alvarez J, Suarez Prado R, Torres Salgado E,
Paz Esquete J and Sobrido MJ (2011), ‘Prevalence of parkinsonism and Parkinson's
disease in the Arosa Island (Spain): a community-based door-to-door survey’, Journal
of Neurological Science, 304(1-2), pp. 49-54.
Spottke, A, Reuter, M, Machat, O, Bornschein, B, von Campenhausen, S, et al 2005, ‘Cost of
illness and its predictors for Parkinson’s disease in Germany’, Pharmacoeconomics,
23(8):817-836.
Temlett, J, and Thompson, P 2006, ‘Reasons for admission to hospital for Parkinson’s
Disease’, Internal Medicine Journal, 36: 534-526.
Wada-Isoe K, Uemura Y, Suto Y, Doi K, Imamura K, Hayashi A, Kitayama M, Watanabe Y,
Adachi Y and Nakashima K (2009), ‘Prevalence of dementia in the rural island town of
Ama-cho, Japan’, Neuroepidemiology, 32(2), pp. 101-6.
Walker RW, Hand A, Jones C, Wood BH and Gray WK (2010) ‘The prevalence of Parkinson's
disease in a rural area of North-East England’, Parkinsonism Related Disorders, 16(9),
pp. 572-5.
Wermuth L, Bech S, Petersen MS, Joensen P, Weihe P and Grandjean P (2008), ‘Prevalence
and incidence of Parkinson's disease in The Faroe Islands’, Acta Neurology
Scandinavia, 118(2), pp. 126-31.
Wickremaratchi M, Perera D, O'Loghlen C, Sastry D, Morgan E, Jones A, Edwards P,
Robertson NP, Butler C, Morris HR and Ben-Shlomo Y (2009) ‘Prevalence and age of
onset of Parkinson's disease in Cardiff: a community based cross sectional study and
meta-analysis’, Journal of Neurol Neurosurg Psychiatry, 80(7), pp. 805-7.
Yamawaki M, Kusumi M, Kowa H and Nakashima K (2009) ‘Changes in prevalence and
incidence of Parkinson's disease in Japan during a quarter of a century’,
Neuroepidemiology, 32(4), pp. 263-9.
Deloitte Access Economics
82
Living with Parkinson's Disease - update
Limitation of our work
General use restriction
This report is prepared solely for the use of Parkinson’s Australia. This report is not
intended to and should not be used or relied upon by anyone else and we accept no duty of
care to any other person or entity. The report has been prepared for the purpose specified
in our engagement letter. You should not refer to or use our name or the advice for any
other purpose.
Deloitte Access Economics
83
Living with Parkinson's Disease - update
Contact us
Deloitte Access Economics
ACN: 49 633 116
Level 1
9 Sydney Avenue
Barton ACT 2600
PO Box 6334
Kingston ACT 2604 Australia
Tel: +61 2 6175 2000
Fax: +61 2 6175 2001
www.deloitte.com/au/economics
Deloitte Access Economics is Australia’s preeminent economics advisory practice and a
member of Deloitte's global economics
group. The Directors and staff of Access
Economics joined Deloitte in early 2011.
Deloitte refers to one or more of Deloitte Touche
Tohmatsu Limited, a UK private company limited
by guarantee, and its network of member firms,
each of which is a legally separate and
independent entity. Please see
www.deloitte.com/au/about for a detailed
description of the legal structure of Deloitte
Touche Tohmatsu Limited and its member firms.
About Deloitte
Deloitte provides audit, tax, consulting, and
financial advisory services to public and private
clients spanning multiple industries. With a
globally connected network of member firms in
more than 150 countries, Deloitte brings worldclass capabilities and deep local expertise to help
clients succeed wherever they operate. Deloitte's
approximately 170,000 professionals are
committed to becoming the standard of
excellence.
About Deloitte Australia
In Australia, the member firm is the Australian
partnership of Deloitte Touche Tohmatsu. As one
of Australia’s leading professional services firms.
Deloitte Touche Tohmatsu and its affiliates provide
audit, tax, consulting, and financial advisory
services through approximately 5,400 people
across the country. Focused on the creation of
value and growth, and known as an employer of
choice for innovative human resources programs,
we are dedicated to helping our clients and our
people excel. For more information, please visit
our web site at www.deloitte.com.au.
Liability limited by a scheme approved under
Professional Standards Legislation.
Member of Deloitte Touche Tohmatsu Limited
© 2011 Deloitte Access Economics Pty Ltd


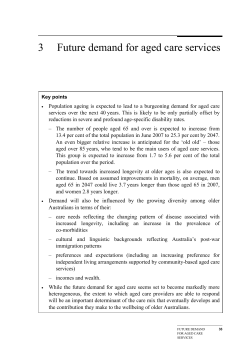
![This article was downloaded by: [Open University] Publisher: Routledge](http://cdn1.abcdocz.com/store/data/000001986_2-d98b53a21816b5d3350bbe89007e9bb0-250x500.png)


© Copyright 2026