
CA n Ce
Cancer in Australia an overview 2012
Cancer in Australia: an overview, 2012 presents the latest
available information on incidence, mortality, survival,
prevalence, burden of cancer, hospitalisations and national
cancer screening programs. It is estimated that the most
commonly diagnosed cancers in 2012 will be prostate
cancer, bowel cancer and breast cancer. For all cancers
combined, the incidence rate increased by 12% from
1991 to 2009, but the mortality rate decreased and survival
improved over time. Cancer outcomes differ by Aboriginal
and Torres Strait Islander status, remoteness area and
socioeconomic status.
in Australia an overview 2012
AIHW
Australasian Association
of Cancer Registries
CANCER SERIES
Number 74
Cancer in Australia
An overview 2012
Australian Institute of Health and Welfare
Canberra
Cat. no. CAN 70
The Australian Institute of Health and Welfare is a major national agency
which provides reliable, regular and relevant information and statistics
on Australia’s health and welfare. The Institute’s mission is
authoritative information and statistics to promote better health and wellbeing.
© Australian Institute of Health and Welfare 2012
This product, excluding the AIHW logo, Commonwealth Coat of Arms and any material owned by a
third party or protected by a trademark, has been released under a Creative Commons BY 3.0
(CC-BY 3.0) licence. Excluded material owned by third parties may include, for example, design and
layout, images obtained under licence from third parties and signatures. We have made all reasonable
efforts to identify and label material owned by third parties.
You may distribute, remix and build upon this work. However, you must attribute the AIHW as the
copyright holder of the work in compliance with our attribution policy available at
<www.aihw.gov.au/copyright/>. The full terms and conditions of this licence are available at
<http://creativecommons.org/licenses/by/3.0/au/>.
Enquiries relating to copyright should be addressed to the Head of the Communications, Media and
Marketing Unit, Australian Institute of Health and Welfare, GPO Box 570, Canberra ACT 2601.
This publication is part of the Australian Institute of Health and Welfare’s Cancer series. A complete
list of the Institute’s publications is available from the Institute’s website <www.aihw.gov.au>.
ISSN 1039-3307
ISBN 978-1-74249-386-2
Suggested citation
Australian Institute of Health and Welfare & Australasian Association of Cancer Registries 2012.
Cancer in Australia: an overview, 2012. Cancer series no. 74. Cat. no. CAN 70. Canberra: AIHW.
Australian Institute of Health and Welfare
Australasian Association of Cancer Registries
Board Chair
Dr Andrew Refshauge
Chair
Ms Helen Farrugia
Director
David Kalisch
Any enquiries about or comments on this publication should be directed to:
Communications, Media and Marketing Unit
Australian Institute of Health and Welfare
GPO Box 570
Canberra ACT 2601
Tel: (02) 6244 1032
Email: [email protected]
Published by the Australian Institute of Health and Welfare
Please note that there is the potential for minor revisions of data in this report.
Please check the online version at <www.aihw.gov.au> for any amendments.
Contents
Acknowledgments............................................................................................................................... v
Abbreviations ...................................................................................................................................... vi
Summary .............................................................................................................................................. ix
Data at a glance .....................................................................................................................................x
1
Introduction....................................................................................................................................1
What is cancer? ...............................................................................................................................1
What are the known risk factors for cancer? ..............................................................................1
Purpose and structure of this report............................................................................................6
Data interpretation .........................................................................................................................7
Data sources ....................................................................................................................................8
What is missing from the picture? ...............................................................................................9
2
Incidence of cancer ......................................................................................................................10
About incidence ............................................................................................................................11
How many people will be diagnosed with cancer in 2012? ...................................................12
Which cancers are estimated to be the most common? ..........................................................12
Does incidence differ by age? .....................................................................................................13
What is the risk of being diagnosed with cancer? ...................................................................14
What has changed over time?.....................................................................................................15
How does Australia compare internationally? ........................................................................21
3
Mortality from cancer .................................................................................................................23
About mortality ............................................................................................................................24
How many people died from cancer in 2010? ..........................................................................24
What is the risk of death from cancer? ......................................................................................27
What has changed over time?.....................................................................................................27
How does Australia compare internationally? ........................................................................33
4
Survival after a diagnosis of cancer .........................................................................................35
About survival ..............................................................................................................................36
What is the prospect of survival? ...............................................................................................38
Conditional survival ....................................................................................................................44
How does Australia compare internationally? ........................................................................45
5
Prevalence of cancer ....................................................................................................................47
About prevalence .........................................................................................................................48
iii
How prevalent was cancer in 2007? ..........................................................................................49
6
Differences across population groups.....................................................................................51
About differences across population groups ...........................................................................52
Aboriginal and Torres Strait Islander status ............................................................................52
State and territory.........................................................................................................................56
Remoteness area ...........................................................................................................................59
Socioeconomic status ...................................................................................................................62
7
Burden of disease due to cancer ...............................................................................................67
About burden of disease .............................................................................................................68
What is estimated burden of disease due to cancer in 2012? .................................................68
8
Hospitalisations and palliative care for cancer......................................................................72
About hospitalisations .................................................................................................................73
How many hospitalisations occurred in 2010–11? ..................................................................74
Palliative care for cancer in the hospital setting ......................................................................79
9
National cancer screening programs .......................................................................................83
About national population screening programs......................................................................84
BreastScreen Australia .................................................................................................................85
National Cervical Screening Program .......................................................................................87
National Bowel Cancer Screening Program .............................................................................91
Appendix A
Cancer codes ............................................................................................................96
Appendix B
Summary pages for selected cancers...................................................................99
Appendix C
Cancer incidence and mortality for all cancer groupings .............................137
Appendix D
Guide to online supplementary tables .............................................................140
Appendix E
Classifications .......................................................................................................141
Appendix F
Constructing the 2009 Australian Cancer Database .......................................144
Appendix G
Year-to-date estimates for Australian cancer incidence and mortality ......148
Appendix H
Statistical methods and technical notes ...........................................................150
Appendix I
Data sources ...........................................................................................................156
Appendix J
Definition of cancer-related hospitalisations .................................................182
Glossary..............................................................................................................................................184
References ..........................................................................................................................................188
List of tables ......................................................................................................................................193
List of figures ....................................................................................................................................196
List of boxes .......................................................................................................................................201
iv
Acknowledgments
Cancer in Australia: an overview, 2012 was prepared by staff in the Cancer and Screening Unit
of the Australian Institute of Health and Welfare (AIHW). The main authors were Ms Wendy
Ho, Ms Shubhada Shukla, Mr Lucas Mills, Ms Theresa Negrello, Mr Hao Min and Ms Ellen
Connell. Substantial contributions were also made by Ms Anne Ganner Bech, Dr Alison
Budd, Ms Chun Chen, Dr Brett Davis, Ms Melissa Goodwin, Mr David Meere, Dr Mark Short
and Ms Biljana Tanevska. The authors would like to thank AIHW staff who commented on
earlier drafts.
The support of the Australasian Association of Cancer Registries (AACR) in producing this
report is gratefully acknowledged. The AACR assisted with data provision, the resolution of
coding and tabulation issues, checking of tabulated data and reviewing the draft.
v
Abbreviations
AACR
Australasian Association of Cancer Registries
ABCR
Australian Blood Cancer Registry
ABS
Australian Bureau of Statistics
ACD
Australian Cancer Database
ACHI
Australian Classification of Health Interventions
ACIM
Australian Cancer Incidence and Mortality
ACT
Australian Capital Territory
AIDS
Acquired Immunodeficiency Syndrome
AIHW
Australian Institute of Health and Welfare
ALOS
average length of stay
ASGC
Australian Standard Geographical Classification
ASR
age-standardised rate
CA
Cancer Australia
CI
confidence interval
COAG
Council of Australian Governments
CS
crude survival
DALY
disability-adjusted life year
DCIS
ductal carcinoma in situ
DoHA
Australian Government Department of Health and Ageing
FOBT
faecal occult blood test
HPV
human papilloma virus
IARC
International Agency for Research on Cancer
ICD-10
International Statistical Classification of Diseases and Related Health
Problems, Tenth Revision
ICD-10-AM
International Statistical Classification of Diseases and Related Health
Problems, Tenth Revision, Australian Modification
ICD-O
International Classification of Diseases for Oncology
ICD-O-3
International Classification of Diseases for Oncology, 3rd edition
IRSD
Index of Relative Socio-economic Disadvantage
MBS
Medicare Benefits Schedule
vi
MIR
mortality-to-incidence ratio
NBCSP
National Bowel Cancer Screening Program
NCCH
National Centre for Classification in Health
NCSP
National Cervical Screening Program
NDI
National Death Index
NHPA
National Health Priority Area
NHMD
National Hospital Morbidity Database
NHVP
National HPV Vaccination Program
NMD
National Mortality Database
NMSC
non-melanoma skin cancer
NOCD
National Outpatient Care Database
NOS
not otherwise specified
No.
number
NSW
New South Wales
NT
Northern Territory
Qld
Queensland
Pap
Papanicolaou (cervical smear test)
POA
postal area
PSA
prostate-specific antigen
RS
relative survival
SA
South Australia
SACC
Standard Australian Classification of Countries
SEIFA
Socio-Economic Indexes for Areas
SLA
Statistical Local Area
Tas
Tasmania
Vic
Victoria
WA
Western Australia
WHO
World Health Organization
YLD
years lost due to disability
YLL
years of life lost (due to premature mortality)
vii
Symbols
$
Australian dollars, unless otherwise specified
%
per cent
<
less than
>
greater than
+
and over
..
not applicable
n.a.
not available
n.p.
not published (data cannot be released due to quality issues)
viii
Summary
Cancer in Australia: an overview, 2012 is a joint report by the Australian Institute of Health and
Welfare and the state and territory members of the Australasian Association of Cancer
Registries, and is a product of the National Cancer Statistics Clearing House. It provides a
comprehensive picture of national statistics on cancer, presenting the latest available data
and trends over time. Differences by Aboriginal and Torres Strait Islander status, state and
territory, remoteness area and socioeconomic status are also discussed.
Cancer is the major cause of illness in Australia
In 2012, it is estimated that more than 120,700 Australians will be diagnosed with cancer,
excluding basal and squamous cell carcinoma of the skin. More than half (56%) of these cases
are expected to be diagnosed in males. The most commonly reported cancers in 2012 are
expected to be prostate cancer, followed by bowel cancer, breast cancer, melanoma of the
skin and lung cancer.
Between 1991 and 2009, the number of new cancer cases diagnosed almost doubled—from
66,393 to 114,137. This increasing trend is primarily due to the rise in the number of prostate
cancer, breast cancer in females, bowel cancer and lung cancer, and is partly explained by the
ageing and increasing size of the population.
Mortality rate due to cancer has fallen
In 2010, more than 42,800 Australians died from cancer. Cancer accounted for about 3 in 10
deaths in Australia, making it the second most common cause of death, exceeded only by
cardiovascular diseases. For all cancers combined, the age-standardised mortality rate
decreased by 17% from 210 per 100,000 in 1991 to 174 per 100,000 in 2010.
Survival improved over time, but not consistent across all cancers
Five-year survival from all cancers combined increased from 47% in 1982–1987 to 66% in
2006–2010. The cancers that had the largest survival gains over this time were prostate
cancer, kidney cancer and non-Hodgkin lymphoma.
Gains in survival have not been consistent across all cancers. Some cancers that already had
low survival in 1982–1987 showed only small gains, such as mesothelioma (from 5.5% to
6.2%), brain cancer (from 20% to 22%), pancreatic cancer (from 3% to 5%) and lung cancer
(from 9% to 14%).
Australians diagnosed with cancer generally had better survival prospects compared with
people living in other countries and regions.
Cancer outcomes differ across population groups
Cancer outcomes differ by Aboriginal and Torres Strait Islander status, remoteness area and
socioeconomic status. For all cancers combined, Indigenous Australians experienced higher
incidence and mortality rates than non-Indigenous Australians. Incidence rates and survival
were lower for people living in remote areas compared with those in major cities, while
mortality rates rose with increasing remoteness. Incidence and mortality rates rose and
survival from all cancers fell as a person’s socioeconomic status decreased.
ix
Data at a glance
Estimated incidence of cancer in 2012
Table 1: Estimated 20 most commonly diagnosed cancers, Australia, 2012(a)
Males
Females
Site/type (ICD-10 codes)
Cases
ASR(c)
Site/type (ICD-10 codes)
Cases
ASR(c)
Prostate (C61)
18,560
147.9
Breast (C50)
14,560
113.2
Bowel (C18–C20)
8,760
72.8
Bowel (C18–C20)
7,080
51.5
Melanoma of skin (C43)
7,440
62.7
Melanoma of skin (C43)
5,070
39.9
Lung (C33–C34)
6,620
55.8
Lung (C33–C34)
4,650
34.1
Non-Hodgkin lymphoma
(C82–C85)
2,620
22.0
Uterus (C54–C55)
2,270
17.1
Kidney (C64)
2,000
16.6
Non-Hodgkin lymphoma
(C82–C85)
2,070
15.6
Bladder (C67)
1,800
15.3
Thyroid (C73)
1,830
15.4
Unknown primary site (C80)
1,490
12.7
Ovary (C56)
1,410
10.7
Pancreas (C25)
1,450
12.1
Unknown primary site (C80)
1,360
9.2
Stomach (C16)
1,420
11.9
Pancreas (C25)
1,290
9.1
Liver (C22)
1,080
9.0
Kidney (C64)
995
7.6
Oesophagus (C15)
1,000
8.4
Cervix (C53)
785
6.6
Brain (C71)
960
8.1
Stomach (C16)
770
5.5
Myeloma (C90)
895
7.5
Brain (C71)
680
5.4
Myelodysplastic syndrome
(D46)
810
7.0
Myeloma (C90)
650
4.7
Chronic lymphocytic
leukaemia (C91.1)
765
6.4
Bladder (C67)
625
4.3
Testis (C62)
740
6.7
Myelodysplastic syndrome
(D46)
520
3.5
Lip (C00)
660
5.6
Chronic lymphocytic
leukaemia (C91.1)
465
3.3
Thyroid (C73)
595
5.1
Oesophagus (C15)
445
3.1
Larynx (C32)
580
4.8
Gallbladder & bile ducts
(C23–C24)
415
2.9
53,460
404.5
All cancers combined
(b)
67,260
557.9
All cancers combined
(b)
(a)
2012 estimates are based on 2000–2009 incidence data (see Appendix G). The estimates are rounded to the nearest 10. For estimates less
than 1,000 they are rounded to nearest 5.
(b)
Includes cancers coded in ICD-10 as C00–C97, D45, D46, D47.1 and D47.3 with the exception of those C44 codes that indicate a basal or
squamous cell carcinoma of the skin.
(c)
The rates were standardised to the Australian population as at 30 June 2001 and are expressed per 100,000 population.
Source: AIHW Australian Cancer Database 2009.
x
Mortality from cancer in 2010
Table 2: The 20 most common causes of death from cancer, Australia, 2010(a)
Males
Females
Deaths
ASR(c)
Deaths
ASR(c)
Lung (C33–C34)
4,934
44.6
Lung (C33–C34)
3,165
24.2
Prostate (C61)
3,235
30.6
Breast (C50)
2,840
21.6
Bowel (C18-C20)
2,205
20.1
Bowel (C18–C20)
1,777
13.0
Pancreas (C25)
1,233
11.1
Pancreas (C25)
1,201
8.9
Unknown primary site (C80)
1,167
10.7
Unknown primary site (C80)
1,113
7.8
Melanoma of skin (C43)
993
8.9
Ovary (C56)
912
7.0
Liver (C22)
890
7.9
Other digestive organs
(C26)
641
4.4
Oesophagus (C15)
879
7.8
Non-Hodgkin lymphoma
(C82–C85)
557
4.0
Non-Hodgkin lymphoma
(C82–C85)
781
7.1
Brain (C71)
512
4.1
Bladder (C67)
736
6.9
Melanoma of skin (C43)
459
3.5
Brain (C71)
735
6.4
Liver (C22)
449
3.4
Stomach (C16)
719
6.6
Stomach (C16)
375
2.8
Other digestive organs
(C26)
713
6.5
Uterus (C54–C55)
364
2.7
Kidney (C64)
575
5.1
Kidney (C64)
352
2.6
Mesothelioma (C45)
516
4.7
Myeloma (C90)
351
2.6
473
4.3
(C92.0, C92.3–C92.5, C93.0,
C94.0, C94.2, C94.4, C94.5)
350
2.6
(C92.0, C92.3–C92.5, C93.0,
C94.0, C94.2, C94.4, C94.5)
450
4.1
Oesophagus (C15)
344
2.5
Multiple primary cancers
(C97)
325
3.1
Bladder (C67)
295
2.0
Non-melanoma of the skin
(C44)
304
2.8
Cervix (C53)
232
1.9
Larynx (C32)
223
2.0
Multiple primary cancers
(C97)
178
1.3
18,516
137.6
Site/type (ICD-10 codes)
Site/type (ICD-10 codes)
Acute myeloid leukaemia
Myeloma (C90)
Acute myeloid leukaemia
All cancers combined
(b)
24,328
221.7
All cancers combined
(b)
(a)
Mortality data for 2010 are preliminary and are subject to further revision.
(b)
Includes cancers coded in ICD-10 as C00–C97, D45, D46, D47.1 and D47.3.
(c)
The rates were standardised to the Australian population as at 30 June 2001 and are expressed per 100,000 population.
Source: AIHW National Mortality Database.
xi
1
Introduction
Cancer is a major cause of illness in Australia and has a significant impact on individuals,
families and the health-care system. Despite a decline in cancer mortality and an increase in
survival over time, 1 in 2 Australians will develop cancer and 1 in 5 will die from it before
the age of 85. Since cancer affects many people—either directly through personally
developing the disease or indirectly through family and community members—it is a topic
of interest to many and has had a prominent policy focus for decades.
In 1996, cancer was declared a National Health Priority Area by Australian health ministers
(AIHW & DHFS 1997). Over the years, a number of national efforts have targeted cancer,
focusing on prevention, detection, treatment and research. Some of the major initiatives
include the National Health Priority Area cancer control report (DHFS & AIHW 1998) and
the National chronic disease strategy (NHPAC 2006a) and National service improvement
framework for cancer (NHPAC 2006b). In 2008, five cancers (bowel, breast, cervical, lung and
melanoma of the skin) were included in the health performance indicator ‘Incidence of
selected cancers’ as part of the Council of Australian Governments (COAG) National
Healthcare Agreement, and are reported annually. The agreement aims to report on the
goals of the health system, and reflect the roles and responsibilities of governments in
managing and providing health services (COAG Reform Council 2011).
What is cancer?
Cancer is a diverse group of diseases in which some of the body’s cells become defective and
multiply out of control. These abnormal cells invade and damage the tissues around them,
and sooner or later spread (metastasise) to other parts of the body and can cause further
damage. If the spread of these tumours is not controlled, they can result in death. Not all
tumours are invasive. Some are benign, which means they do not spread to other parts of the
body and are rarely life-threatening.
Cancers are distinguished from one another by the location in the body in which the disease
began (known as the site) and/or by the type of cell involved (known as histology). Cancer
that begins in the lung is called lung cancer and cancer that begins in the breast is called
breast cancer, regardless of whether or not it has metastasised to other sites. Examples of
different cell types of cancer are carcinomas (cancers that begin in the skin or in tissues that
line or cover internal organs), sarcomas (which develop in connective and supportive tissues,
such as bone, cartilage and muscle), and hematopoietic cancers (cancers that begin in bloodforming tissues, such as the bone marrow). Note that, unlike most other forms of cancer,
cancers of the blood, such as leukaemia, do not form a tumour but instead invade other areas
of the body through the bloodstream.
The original site in which a cancerous tumour is formed is referred to as the primary cancer.
The spread of cancerous cells from the primary tumour to another (that is, secondary) site is
referred to as metastasis.
What are the known risk factors for cancer?
A risk factor is any factor associated with an increased likelihood of a person developing a
health disorder or health condition, such as cancer. Understanding what causes cancer is
Cancer in Australia: an overview, 2012
1
essential in order to successfully prevent, detect and treat the disease. For most cancers the
causes are not fully understood. However, some factors that place individuals at a greater
risk for cancer are well-recognised and are outlined below. These risk factors were sourced
from the World cancer report 2008 (IARC 2008) and Food, nutrition, physical activity and the
prevention of cancer (WCRF & AICR 2007).
It should be noted that having a risk factor does not mean that a person will develop cancer.
Many people have at least one cancer risk factor but will never get cancer, while others with
this disease may have had no known risk factors.
Smoking
Smoking is the major cause of cancer in humans, accounting for
about 20–30% of cancer cases. Evidence suggests that both active
and passive smoking can cause cancer of the:
•
bladder
•
nasal cavity and nasal sinuses
•
cervical
•
oral cavity (lip, mouth, tongue)
•
kidney
•
oesophagus
•
larynx
•
pancreas
•
liver
•
pharynx
•
lung
•
stomach.
•
myeloid leukaemia
Alcohol consumption
Alcohol consumption is an important risk factor for cancer. The
risk of cancer increases with the amount of alcohol consumed.
Cancers associated with alcohol consumption include:
2
•
bowel
•
oesophageal
•
breast (females)
•
oral cavity (lip, mouth, tongue)
•
colon
•
pharynx
•
larynx
•
rectum.
•
liver
Cancer in Australia: an overview, 2012
Diet
Evidence suggests that high intake of particular foods (such as
processed meat and foods that are high in fat) is associated with an
increased risk of the following cancers:
•
bowel
•
pancreas
•
breast
•
prostate
•
kidney
•
stomach
•
oesophageal
•
uterine.
Obesity and physical inactivity
Obesity is defined as abnormal or excessive fat accumulations that
may impair health and a body mass index of 30 and over.
Physical activity is an important part of a healthy lifestyle. Doing
little or no physical activity increases an individual's risk of being
overweight or obese, and is associated with a higher risk of
developing cancer. Obesity and no physical activity increases the
risk of the following cancers:
•
bowel
•
kidney
•
breast (females)
•
oesophageal
•
colon (males)
•
ovarian
•
endometrial cancer
•
pancreas.
•
gallbladder
Chronic infections
Chronic infections (such as viruses, bacteria and parasites) are
estimated to cause about 8% of cancer cases. Cancers associated
with chronic infections include:
•
bladder
•
lung
•
cervical
•
lymphoma
•
gallbladder
•
oral cavity (lip, month, tongue)
•
leukaemia
•
oropharynx
•
liver
•
stomach.
Cancer in Australia: an overview, 2012
3
Family history and genetic susceptibility
Some gene mutations increase the risk of cancer being pass from
parent to child. Generally for most cancers, inherited susceptibility
is rare (5–10% of cancer cases). Genetic inheritance increases risk of
the following cancers:
•
bladder
•
ovarian
•
bowel
•
pancreas
•
breast
•
prostate
•
colon
•
testicular
•
gallbladder
•
thyroid.
•
leukaemia
Occupational exposures
Occupational exposures account for an estimated 2–5% of cancer
cases. Occupational exposures include chemicals, dusts, radiation
and industrial processes. Cancers that have found to be caused by
occupational exposures include:
•
bladder
•
nasal cavity
•
kidney
•
nasopharynx
•
leukaemia
•
non-melanoma skin cancer
•
liver
•
oesophagus
•
lung
•
oral cavity (lip, mouth, tongue)
•
lymphoma
•
pharynx
•
mesothelioma
•
stomach.
Sunlight
Excessive exposure to the ultraviolet rays of the sun is a risk factor
for some cancers. The risk of sunlight is highest for people who
have fair skin, blond or red hair, freckles, and/or a tendency to
burn easily. Sunlight is a risk factor for:
4
•
melanoma of the skin
•
non-melanoma skin cancer.
Cancer in Australia: an overview, 2012
Radiation
Ionising radiation from natural sources, from nuclear accidents
and explosions, and from diagnostic X-rays can be risk factors for
cancer. The most common source of radiation for the average
person is diagnostic X-rays, however the risk of developing a
cancer after an X-ray is minimal and the benefits nearly always
outweigh the risk. Ionising radiation can increase the risk of the
following cancers:
•
breast
•
lung
•
leukaemia
•
thyroid.
Medical and iatrogenic factors
Medical and iatrogenic factors relate to the inadvertent adverse
effect or complication resulting from medical treatment or advice.
For example, drugs or treatment used for one disease can
potentially lead to the development of a secondary condition.
Cancers relating to medical and iatrogenic factors include:
•
bladder
•
lung
•
bowel
•
mesothelioma
•
kidney
•
oesophageal
•
liver
•
pancreas.
Reproductive and hormonal factors
Reproductive hormones are thought to influence the risk of
developing some cancers. For women, the risk can be related to
reproductive history, endogenous and exogenous hormone
exposures and child-bearing. Cancers that are associated with
reproductive and hormonal factors include:
•
breast
•
ovarian
•
endometrial.
Environmental pollution
There are many pollutants in the environment that may cause
cancer. People are exposed to these pollutants through the air,
drinking water, food, soil, sediment, surface waters and
groundwater. Pollution can contribute to the following cancers:
•
bladder
•
lung
•
kidney
•
skin
•
liver
•
stomach
Cancer in Australia: an overview, 2012
5
Purpose and structure of this report
Cancer in Australia: an overview, 2012 provides a comprehensive overview of national statistics
on cancer (see Box 1.1 for list of terminology in this report). The report presents the latest
available statistics on cancer as a whole, as well as on many individual types of cancer. It
includes information on incidence, mortality, survival, prevalence, burden of disease due to
cancer, hospitalisations, and the national cancer screening programs. The report is aimed at a
wide audience, including health professionals, policy makers, health planners, educators,
researchers, consumers and the general public.
The Australian Institute of Health and Welfare (AIHW) has produced an overview report on
cancer, either annually or biennially since 1987, and this report is the sixteenth in the series.
Information is in eight thematic chapters. This introductory chapter provides some
background information, describes what cancer is and what are the known risk factors, and
provides details on data interpretation and data sources. The remaining chapters cover the
following topics:
•
the number of new cancers diagnosed each year (Chapter 2)
•
the number of people who die from cancer each year (Chapter 3)
•
survival prospects for those diagnosed with cancer (Chapter 4)
•
the number of people alive who have been diagnosed with cancer (Chapter 5)
•
differences in incidence, mortality and survival across selected population groups
(Chapter 6)
•
the burden of disease due to cancer (Chapter 7)
•
the number of hospitalisations for cancer (Chapter 8)
•
the number of people participated in the national cancer screening programs (Chapter 9).
Data are presented for individual or grouped cancer sites, with the sites defined according to
the tenth revision of the International Classification of Diseases and Related Health Problems
(ICD-10). Appendix A lists the cancer groupings used in this report.
Compared with the 2010 edition of this report (AIHW & AACR 2010), data for two broader
cancer groupings—total lymphoid cancers and total myeloid cancers—are not included,
instead, data for individual subgroups of these cancers are presented and compared. Also,
‘Chapter 2 Incidence of cancer’ focuses on the estimated cancer incidence for 2012.
For incidence and mortality statistics, a summary page has been devoted to selected cancers
that were commonly diagnosed or were common causes of cancer deaths (Appendix B).
These pages present the latest available data, as well as estimates for 2012. Also, an overview
of incidence and mortality statistics for all cancer groupings is in Appendix C.
In addition, supplementary data for each chapter are available as online Excel tables at
<www.aihw.gov.au>. Throughout the report, these online tables are referred to with a ‘D’,
for example, ‘See online Table D2.1’. Appendix D provides more information on accessing
these tables online.
6
Cancer in Australia: an overview, 2012
Box 1.1: Terminology used in this report
Incidence rate: the number of new cancers diagnosed per 100,000 population during a
specific period, usually 1 year.
Mortality rate: the number of deaths per 100,000 people for which the underlying cause was
cancer.
Relative survival: the average survival experience. It compares the survival of people
diagnosed with cancer (that is, observed survival) with that experienced by people in the
general population of equivalent age and sex in the same calendar year (that is, expected
survival).
Prevalence: the number of people alive who were diagnosed with cancer within a specified
time period, such as the previous 5 years.
Burden of disease: the quantified impact of prostate cancer on an individual or population.
Hospitalisation rate: the number of hospital admissions per 10,000 people due to cancer.
Year-to-date estimates: simple extrapolation of recent trend data to the current year. This
uses known parameters, such as current populations and knowledge of current practices in
cancer detection.
Projections: longer-term extrapolation of recent trend data using unknown parameters,
such as expected future populations.
Data interpretation
In this report, the term ‘cancer’ is used to refer to primary tumours that are invasive (that is,
malignant). It does not encompass secondary cancers, nor does it include benign or
non-invasive tumours.
A number of different classifications are referred to in this report, such as ICD (that is,
International Statistical Classification of Disease and Related Health Problems) and ICD-O
(that is, International Classification of Disease for Oncology). Information about these
classifications is in Appendix E.
This report includes information on the number of cancer cases and deaths, as well as agestandardised rates. The use of age-standardised rates is important when making
comparisons between groups and within groups over time, to take into account differences
in the age structure and size of the population. This is especially important for cancer, since
the risk of many cancers increases with age. Rates have been standardised to the Australian
population at 30 June 2001 and are generally expressed per 100,000 population. Further
information on age-standardisation and other technical matters is in Appendix H.
Confidence intervals (at the 95% level) are shown in graphs (as error bars) and tables in this
report. As explained more fully in Appendix H, confidence intervals can be used as a guide
when considering whether differences in rates may be a result of chance variation. Where
confidence intervals do not overlap, the difference between rates may be regarded as greater
than would readily be attributable to chance. While such differences may be regarded as
‘significant’ in statistical terms, they may or may not be ‘significant’ from a practical or
clinical perspective.
International comparisons are provided for cancer incidence, mortality and survival. Caution
should be taken when comparing cancer data from different countries since observed
Cancer in Australia: an overview, 2012
7
differences may be influenced not only by the underlying number of cancer cases (or number
of cancer deaths when considering mortality data), but by differences in:
•
age distribution and composition of populations
•
cancer detection and screening
•
types of treatment provided and access to treatment services
•
characteristics of the cancer, such as stage at diagnosis and histology type
•
coding practices and cancer registration methods, as well as accuracy and completeness
of recording of cancer cases.
Data sources
A key data source for this report was the 2009 Australian Cancer Database (ACD). This
database contains information on all new cases of primary, invasive cancer (excluding basal
cell and squamous cell carcinoma of the skin) diagnosed in Australia since 1982. Data are
collected by state and territory cancer registries from a number of sources and are supplied
annually to the AIHW. The AIHW is responsible for the compilation of the ACD through the
National Cancer Statistics Clearing House—a collaboration with the Australasian
Association of Cancer Registries (AACR).
The 1982–2009 data files for New South Wales and the Australian Capital Territory were not
available for inclusion in the 2009 version of the ACD. An extended delay of the receipt of
mortality data has meant that New South Wales and the Australian Capital Territory have
not been able to close off their 2009 data sets. As a consequence, 2009 cancer data for these
jurisdictions are not available for reporting purposes. The 2009 incidence data for New South
Wales and the Australian Capital Territory were estimated by the AIHW in consultation
with New South Wales and the Australian Capital Territory cancer registries. The estimates
were combined with the actual data supplied by other state and territory cancer registries to
form a 1982–2009 national cancer data set. Appendix F provides further information.
Another key data source was the National Mortality Database (NMD). This database is a
national collection of information for all deaths in Australia from 1968 to 2010 and is
maintained by the AIHW. Information on the characteristics and causes of death of the
deceased is provided by the Registrars of Births, Deaths and Marriages and coded nationally
by the Australian Bureau of Statistics (ABS). Unless stated otherwise, death information in
this report relates to the year of death, except for the most recent year (namely, 2010) where
year of registration is used. Previous investigation has shown that, due to a lag in processing
of deaths, year of death information for the latest available year generally underestimates the
true number of deaths, whereas the number of deaths registered in that year is closer to the
true value.
Several other data sources—including the National Death Index, the National Hospital
Morbidity Database, Medicare Australia data, the Disease Expenditure Database and the
2008 GLOBOCAN database—have also been used to present a broad picture of cancer
statistics in Australia.
Additional information about each of the data sources used in this report is in Appendix I.
8
Cancer in Australia: an overview, 2012
Box 1.2: Throughout this report:
• The term ‘cancer’ is used to refer to primary tumours which are invasive.
• Differences that are described as ‘significant’ refer to a statistically significant difference.
Such differences may or may not be significant from a practical or clinical perspective.
What is missing from the picture?
Reliable national data on the incidence of cancer and on the mortality from cancer for
Aboriginal and Torres Strait Islander people are not available. While all cancer registries
collect information on Aboriginal and Torres Strait Islander status, in some jurisdictions, the
quality of the data is insufficient for analyses. In this report incidence data by Aboriginal and
Torres Strait Islander status is presented for four jurisdictions and mortality data is presented
for five jurisdictions.
Currently, there are no registered national data on the stage (severity) of cancer at diagnosis.
Further, no information is available on the treatments applied to cancers, complications with
cancer treatment, or the frequency of recurrence of cancer after treatment. However, there
are comprehensive national data on treatments provided through admitted patient
hospitalisations, for example, surgery and non-surgical care.
Collecting data on stage, treatment and recurrence of cancer is difficult and expensive. Some
pilot projects are under ways to collect these data with the aim of expanding the
methodology to national data (Cancer Australia 2010).
Cancer in Australia: an overview, 2012
9
2
Incidence of cancer
Key findings
In 2012 in Australia, it is estimated that:
10
•
120,710 new cases of cancer will be diagnosed.
•
More than half (56%) of all cancers will be diagnosed in males.
•
Seventy-five per cent of new cancer cases in males and 65% in females will occur
among those aged 60 and over.
•
The most commonly diagnosed cancers in males will be prostate cancer (18,560 cases),
bowel cancer (8,760), melanoma of the skin (7,440), lung cancer (6,620) and nonHodgkin lymphoma (2,620).
•
The most commonly diagnosed cancers in females will be breast cancer (14,560 cases),
bowel cancer (7,080), melanoma of the skin (5,070), lung cancer (4,650) and uterine
cancer (2,270).
•
The age-standardised incidence rate will be 474 per 100,000.
•
The risk of being diagnosed with cancer before the age of 85 will be 1 in 2 for males
and 1 in 3 for females.
Cancer in Australia: an overview, 2012
About incidence
Incidence data indicate the number of new cancers diagnosed during a specific period,
usually 1 year. Only those cases where cancer was a primary invasive cancer are considered.
The case must also be a ‘new’ primary cancer and not a reoccurrence of a previous primary
cancer in the same site (IARC 2004).
Data on the incidence of cancer refers to the number of cases newly diagnosed and not to the
number of people newly diagnosed with cancer. However, since it is rare that a person would
be diagnosed with more than one primary cancer during a 1-year period, the annual number
of new cancers is practically the same as the annual number of people newly diagnosed with
cancer.
The main data source for this chapter was the 2009 ACD. A description of how this database
is compiled is in Appendix F. Box 2.1 below describes the registration of cancers in Australia.
The information provided in this chapter includes both actual and estimated incidence data.
Actual incidence data cover the period 1991–2009—except for New South Wales and the
Australian Capital Territory; for these jurisdictions, data were available to 2008 and
estimated for 2009 (see Appendix F). Incidence data for 2010–2012 were estimated based on
2000–2009 national cancer incidence data. Appendix G provides detailed information on the
methodology for estimating 2010–2012 incidence data.
This chapter focuses on the estimated cancer incidence for 2012 and cancer trends from 1991
to 2009. It should be noted that the 2010–2012 estimates are only indicative of the future
trends and the actual incidence may be different to these estimates. They are not forecasts
and do not attempt to allow for future changes in cancer detection methods, changes in
cancer risk factors or for non-demographic factors (such as major government policy changes
and economic differences) that may affect future cancer incidence rates.
Summary pages for selected cancers are in Appendix B. These pages present the latest
available incidence data (2009) and estimates for 2012. An overview of incidence statistics for
all cancers is in Appendix C.
Box 2.1: Cancer registration in Australia
Registration of all cancers, excluding basal and squamous cell carcinomas of the skin, is
required by law in each state and territory. Information on newly diagnosed cancers is
collected by each state and territory cancer registry. Each cancer registry provides data to
the AIHW annually, encompassing all cancer cases notified to the registry between 1982
and the most recent completed year of data. The data are compiled to form the ACD.
Since basal and squamous cell carcinomas of the skin are not notifiable, data on these
cancers are not included in the ACD and therefore not in this report. However, past
research has shown that basal and squamous cell carcinomas of the skin are by far the most
frequently diagnosed cancers in Australia (AIHW & CA 2008).
Cancer in Australia: an overview, 2012
11
How many people will be diagnosed with cancer in
2012?
It is estimated that 120,710 new cases of cancer will be diagnosed in Australia in 2012,
excluding basal and squamous cell carcinoma of the skin (Table 2.1). More than half (56%) of
these cases are expected to be diagnosed in males.
Table 2.1: Estimated incidence of all cancers combined(a), Australia, 2012(b)
Number of cases
Males
Females
Persons
67,260
53,460
120,710
(c)
557.9
404.5
474.4
95% confidence interval
553.6–562.1
401.0–408.0
473.0–477.1
55.7
44.3
100.0
Age-standardised rate
Per cent of all cancer cases
(a)
Cancers coded in ICD-10 as C00–C97, D45, D46, D47.1 and D47.3 with the exception of those C44 codes that indicate a basal or
squamous cell carcinoma of the skin.
(b)
2012 estimates are based on 2000–2009 incidence data (see Appendix G). The estimates are rounded to the nearest 10. The estimates for
males and females may not add to the estimates for persons due to rounding.
(c)
The rates were standardised to the Australian population as at 30 June 2001 and are expressed per 100,000 population.
Source: AIHW Australian Cancer Database 2009.
Which cancers are estimated to be the most
common?
Prostate cancer is estimated to be the most common cancer in 2012 (18,560 cases), followed
by bowel cancer (15,840), breast cancer (14,680), melanoma of the skin (12,510) and lung
cancer (11,280). These cancers are expected to account for more than 60% of all cancers
estimated to be diagnosed in 2012.
For males, prostate cancer is estimated to be the most commonly diagnosed (18,560 cases),
follow by bowel cancer (8,760), melanoma of the skin (7,440), lung cancer (6,620) and nonHodgkin lymphoma (2,620).
For females, breast cancer is estimated to be the most commonly diagnosed (14,560 cases).
This is followed by bowel cancer (7,080), melanoma of the skin (5,070), lung cancer (4,650)
and uterine cancer (2,270) (Table 2.2).
12
Cancer in Australia: an overview, 2012
Table 2.2: Estimated 10 most commonly diagnosed cancers(a), Australia, 2012
Males
Females
Cancer site/type
(ICD-10 codes)
Cases
ASR(b)
95% CI
Breast (C50)
14,560
113.2
111.4–115.1
Bowel (C18–C20)
7,080
51.5
50.3–52.7
61.3–64.2
Melanoma of the
skin (C43)
5,070
39.9
38.8–41.1
55.8
54.4–57.1
Lung (C33–C34)
4,650
34.1
33.1–35.1
2,620
22.0
21.1–22.8
Uterus (C54–C55)
2,270
17.1
16.4–17.8
Kidney (C64)
2,000
16.6
15.9–17.3
Non-Hodgkin
lymphoma
(C82–C85)
2,070
15.6
14.9–16.2
Bladder (C67)
1,800
15.3
14.6–16.0
Thyroid (C73)
1,830
15.4
14.7–16.1
Unknown primary
site (C80)
1,490
12.7
12.1–13.4
Ovary (C56)
1,410
10.7
10.2–11.3
Pancreas (C25)
1,450
12.1
11.5–12.8
Unknown primary
site (C80)
1,360
9.2
8.7–9.7
Stomach (C16)
1,420
11.9
11.3–12.6
Pancreas (C25)
1,290
9.1
8.6–9.6
53,460
404.5
401.0–408.0
Cancer site/type
(ICD-10 codes)
Cases
ASR(b)
95% CI
Prostate (C61)
18,560
147.9
145.8–150.1
Bowel (C18–C20)
8,760
72.8
71.3–74.4
Melanoma of the
skin (C43)
7,440
62.7
Lung (C33–C34)
6,620
Non-Hodgkin
lymphoma
(C82–C85)
(c)
All cancers
67,260
557.9
553.6–562.1
(c)
All cancers
(a)
2012 estimates are based on 2000–2009 incidence data (see Appendix G). The estimates are rounded to the nearest 10.
(b)
The rates were standardised to the Australian population as at 30 June 2001 and are expressed per 100,000 population.
(c)
Cancers coded in ICD-10 as C00–C97, D45, D46, D47.1 and D47.3 with the exception of those C44 codes which indicate a basal or
squamous cell carcinoma of the skin.
Source: AIHW Australian Cancer Database 2009.
Does incidence differ by age?
The incidence of cancer is expected to increase with age (Figure 2.1). In 2012, it is estimated
that 75% of new cancer cases will be diagnosed in males and 65% in females aged 60 and
over.
For those aged under 30, the incidence rates are expected to be similar in males and females.
For those aged 30–54, the estimated age-standardised incidence rate is higher for females
than males, while a higher incidence rate is expected for males after the age 55.
The expected high incidence of cancer in females aged 30–54 could be due to the estimated
high incidence of breast cancer in this age group. Incidence of prostate cancer, bowel cancer,
melanoma of the skin and lung cancer will contribute to the estimated high incidence rate in
males aged over 55.
Cancer in Australia: an overview, 2012
13
Rate (per 100,000)
4,000
Males
3,500
3,000
Females
2,500
Persons
2,000
1,500
1,000
85+
80–84
75–79
70–74
65–69
60–64
55–59
50–54
45–49
40–44
35–39
30–34
25–29
20–24
15–19
10–14
5–9
0
0–4
500
Age group (years)
Notes
1.
2012 estimates are based on 2000–2009 incidence data (see Appendix G).
2.
Data pertain to cancers coded in ICD-10 as C00–C97, D45, D46, D47.1 and D47.3 with the exception of those C44 codes that
indicate a basal or squamous cell carcinoma of the skin.
3.
Data for this figure are in online Table D2.1.
Source: AIHW Australian Cancer Database 2009.
Figure 2.1: Estimated incidence rates of all cancers combined by age at diagnosis, Australia,
2012
What is the risk of being diagnosed with cancer?
In 2012, it is estimated that 1 in 3 males and 1 in 4 females will be diagnosed with cancer by
the age of 75. By the age of 85, the risk is estimated to increase to 1 in 2 for males and 1 in 3
for females (see Appendix H for an explanation of how these risks were calculated).
Table 2.3: Estimated risk of being diagnosed with cancer(a), Australia, 2012
(a)
Risk to age 75
Risk to age 85
Males
1 in 3
1 in 2
Females
1 in 4
1 in 3
Persons
1 in 3
1 in 2
2012 estimates are based on 2000–2009 incidence data (see Appendix G).
Source: AIHW Australian Cancer Database 2009.
For males, the risk of being diagnosed with cancer is estimated to be highest for prostate
cancer, at 1 in 8 before the age of 75 and 1 in 6 before the age of 85. The risk is also expected
to be high for bowel cancer, at 1 in 19 before the age of 75 and 1 in 10 before the age of 85.
For females, the risk of being diagnosed with cancer is estimated to be highest for breast
cancer, with a risk of 1 in 11 before the age of 75 and 1 in 8 before the age of 85. In
comparison, the risk of a woman being diagnosed with bowel cancer is estimated to be 1 in
27 before the age of 75, and 1 in 14 before the age of 85.
14
Cancer in Australia: an overview, 2012
What has changed over time?
In this section, trends in incidence for all cancers combined and selected cancer sites are
presented for 1991–2009. Estimated incidence data for 2010–2012 are shown in figures and
online tables, and were derived from 2000–2009 national cancer incidence data (see
Appendix G).
Trends for all cancers combined
Between 1991 and 2009, the number of new cancer cases diagnosed almost doubled—from
66,393 in 1991 to 114,137 in 2009. This increasing trend is primarily due to the rise in the
number of prostate cancer, breast cancer in females, bowel cancer and lung cancer.
The age-standardised incidence rate of all cancers combined increased by 12% from 433 per
100,000 in 1991 to 486 per 100,000 in 2009. This suggests that the increase in the absolute
number of cancer cases over the years can only be partly explained by the ageing and
increasing size of the population.
The trend in the incidence rate of all cancers combined was markedly different for males and
females (Figure 2.2). For males, it increased steadily until 1994, where it peaked at 612 per
100,000. This was followed by a decline until the late 1990s when it began to increase again,
reaching a rate of 603 per 100,000 in 2008. The rate fell slightly in 2009 to 584 per 100,000. The
trend in the rate for males is strongly influenced by changes in the incidence rate of prostate
cancer—the most common cancer in males.
For females, the incidence rate of all cancers combined rose steadily during the early 1990s,
reaching 397 per 100,000 in 1995. Since then, it was fairly stable, ranging from 389 to 407 per
100,000. The rate for females has been strongly influenced by the trend in the incidence rate
of breast cancer.
Cancer in Australia: an overview, 2012
15
Number of cases
100,000
Rate (per 100,000)
Males
700
Females
90,000
Rate (per 100,000)
600
80,000
70,000
500
Rate (per 100,000)
60,000
400
50,000
40,000
300
30,000
200
20,000
2012
2011
2010
2009
2008
2007
2006
2005
2004
2003
2002
2001
2000
1999
1998
1997
1996
1995
1994
1993
1992
1991
0
100
Number of cases
10,000
0
Year
Notes
1.
The graph presents actual data for 1991–2009 and estimates for 2010–2012.
2.
2010–2012 estimates are based on 2000–2009 incidence data (see Appendix G). Estimates are displayed on the graph as a dotted
line or bar.
3.
Data pertain to cancers coded in ICD-10 as C00–C97, D45, D46, D47.1 and D47.3 with the exception of those C44 codes that indicate
a basal or squamous cell carcinoma of the skin.
4.
The rates were age-standardised to the Australian population as at 30 June 2001.
5.
The data for this figure are in online Table D2.2.
Source: AIHW Australian Cancer Database 2009.
Figure 2.2: Trends in incidence of all cancers combined, Australia, 1991 to 2009, with estimates
to 2012
Trends for specific cancers
Figure 2.3 presents a summary of the percentage change in age-standardised incidence rates
between 1991 and 2009 for selected cancers.
In general, the incidence rate of some cancers decreased over time. Of the selected cancers,
those that showed the greatest percentage-point decrease were:
•
cervical cancer (from 13 to 6.7 per 100,000)
•
lip cancer (from 6.3 to 3.7 per 100,000)
•
cancer of unknown primary site (from 19 to 12 per 100,000)
•
stomach cancer (from 12 to 8.5 per 100,000).
The incidence rate of these cancers decreased by more than 30 per cent.
However, some cancers showed an increase in incidence rate between 1991 and 2009. They
included:
•
thyroid cancer (from 3.5 to 9.1 per 100,000)
•
liver cancer (from 2.5 to 5.5 per 100,000)
•
prostate cancer (from 110 to 172 per 100,000).
More information about the trends in incidence rates of prostate cancer, breast cancer in
females, bowel cancer, melanoma of the skin and lung cancer is provided in the following
section.
16
Cancer in Australia: an overview, 2012
Thyroid*
Liver*
Prostate*
Mesothelioma*
HL*
Testis*
Myeloma*
Melanoma*
Kidney*
Uterus*
NHL*
Tongue
Breast (females)*
All cancers*
AML
Pancreas*
Brain
CLL
Oesophagus
Bowel*
Lung*
Ovary*
Gallbladder*
Bladder*
Larynx*
Stomach*
UPS*
Lip*
Cervix*
-160 -140 -120 -100 -80 -60 -40 -20
Per cent change in incidence rate
0
0
20
40
60
80
100 120 140 160
Per cent change in incidence rate
Notes
1.
The bars indicate the percentage change in incidence rates from 1991 to 2009.
2.
The percentage change from 1991 to 2009 is a summary measure that allows the use of a single number to describe the change over a
period of multiple years. However, it is not always reasonable to expect that a single measure can accurately describe the trend over the
entire period.
3.
Cancers labelled with an asterisk (*) indicate changes that were statistically significant.
4.
HL=Hodgkin lymphoma, NHL=Non-Hodgkin lymphoma, CLL=Chronic lymphocytic leukaemia, AML=Acute myeloid leukaemia,
UPS=Cancer of unknown primary site. Melanoma refers to melanoma of the skin.
5.
The rates were age-standardised to the Australian population as at 30 June 2001.
Source: AIHW Australian Cancer Database 2009.
Figure 2.3: Percentage change in age-standardised incidence rates, Australia, 1991 to 2009
Prostate cancer
Sharp increases in the age-standardised incidence rate of prostate cancer began to appear in
the early 1990s, with a peak of 184 per 100,000 in 1994. The rate then declined rapidly to 130
per 100,000 in 1997, before stabilising for several years. From 2002, it began to increase again,
reaching 191 per 100,000 in 2008. The incidence rate declined in 2009 and is estimated to
fluctuate between 2010 and 2012 (Figure 2.4).
Cancer in Australia: an overview, 2012
17
The peaks in prostate cancers are thought to be due to changes in how prostate cancers are
detected, rather than an elevated risk. Prostate-specific antigen (PSA) testing first became
available in 1987 and was listed in the Medicare Benefits Schedule in 1989. Therefore, the
peak in the early 1990s reflects the large pool of undiagnosed cases that were identified using
the PSA test (and subsequent biopsy and confirmation by a specialist). As prostate cancer can
be diagnosed in men without symptoms, some of these cancers may have remained
undiagnosed until symptoms emerged, or never diagnosed because of mortality from
another condition (AIHW & AACR 2010). The second rise in incidence numbers in more
recent years is probably a result of changes in diagnostic procedures, including lowering the
investigation threshold, which may have led to more men being sent for biopsy and
increasing the number of core biopsies taken (Smith et al. 2008).
Breast cancer in females
The age-standardised incidence rate of breast cancer in females was 101 per 100,000 in 1991.
It increased in the following years and reached 116 per 100,000 in 1995. After this, the rates
were fairly stable, ranging from 110 to 118 to 100,000, with the 2009 rate at 114 per 100,000. It
is estimated to remain stable between 2010 and 2012 (Figure 2.4).
The pronounced increase in the incidence of breast cancer between 1991 and 1995 is most
likely due to the introduction of the national breast cancer screening program (known today
as BreastScreen Australia), which aims to detect cases of unsuspected breast cancer in
women aged 40 and over using screening mammography. The target age range for screening
is women aged 50–69 (see Chapter 9 for more information).
Rate (per 100,000)
250
Prostate cancer
Breast cancer in females
200
150
100
2012
2011
2010
2009
2008
2007
2006
2005
2004
2003
2002
2001
2000
1999
1998
1997
1996
1995
1994
1993
1992
0
1991
50
Year
Notes
1.
2010–2012 estimates are based on 2000–2009 incidence data (see Appendix G). Estimates are displayed on the graph as a dotted
line.
2.
The rates were age-standardised to the Australian population as at 30 June 2001.
3.
The data for this figure are in online Table D2.3.
Source: AIHW Australian Cancer Database 2009.
Figure 2.4: Trends in incidence of prostate cancer in males and breast cancer in females,
Australia, 1991 to 2009, with estimates to 2012
18
Cancer in Australia: an overview, 2012
Bowel cancer
The age-standardised incidence rate of bowel cancer for males was 76 per 100,000 in 1991. It
increased to 80 per 100,000 in 2000 and declined in the following years. It is expected to fall
to 73 per 100,000 in 2012—a 4.7% decrease from the rate in 1991 (Figure 2.5).
The incidence rate of bowel cancer for females varied between 51 and 55 per 100,000 from
1991 to 2009. It was considerably lower than that for males during the entire period. This
may be related to differences in behaviour that increases the risk of bowel cancer and the
differing effect of obesity in males and females (Center et al. 2009). The rate is expected to
remain fairly stable between 2010 and 2012.
Rate (per 100,000)
90
80
70
60
50
40
Males
Females
30
20
2012
2011
2010
2009
2008
2007
2006
2005
2004
2003
2002
2001
2000
1999
1998
1997
1996
1995
1994
1993
1992
0
1991
10
Year
Notes
1.
2010–2012 estimates are based on 2000–2009 incidence data (see Appendix G). Estimates are displayed on the graph as a dotted
line.
2.
The rates were age-standardised to the Australian population as at 30 June 2001.
3.
The data for this figure are in online Table D2.4.
Source: AIHW Australian Cancer Database 2009.
Figure 2.5: Trends in incidence of bowel cancer, Australia, 1991 to 2009, with estimates to 2012
Melanoma of the skin
The age-standardised incidence rate of melanoma of the skin increased for both males and
females from 1991 to 2009. The increase was more marked for males—from 44 per 100,000 in
1991 to 62 per 100,000 in 2009 (an increase of 42%). For females, the incidence rate increased
by 18%, from 34 per 100,000 to 40 per 100,000 over the same period. The rate is expected to
remain stable between 2010 and 2012 (Figure 2.6).
Cancer in Australia: an overview, 2012
19
Rate (per 100,000)
70
60
50
40
30
Males
Females
20
2012
2011
2010
2009
2008
2007
2006
2005
2004
2003
2002
2001
2000
1999
1998
1997
1996
1995
1994
1993
1992
0
1991
10
Year
Notes
1.
2010–2012 estimates are based on 2000–2009 incidence data (see Appendix G). Estimates are displayed on the graph as a dotted
line.
2.
The rates were age-standardised to the Australian population as at 30 June 2001.
3.
The data for this figure are in online Table D2.5.
Source: AIHW Australian Cancer Database 2009.
Figure 2.6: Trends in incidence of melanoma of the skin, Australia, 1991 to 2009, with
estimates to 2012
Lung cancer
Between 1991 and 2009, the age-standardised incidence rate of lung cancer in males fell by
26%, from 75 to 56 per 100,000, but rose by 37% in females, from 24 to 33 per 100,000. These
trends in males and females are expected to continue between 2010 and 2012 (Figure 2.7).
The different pattern of lung cancer incidence rates in males and females is probably due to
their different histories of tobacco smoking. As overall tobacco consumption began to decline
in males in the second half of the 20th century, the incidence rate of lung cancer for males
also declined, with a time lag of about 20 years. Cigarette smoking in women peaked later
than in men, which may explain why the lung cancer incidence rate for females is still rising
(AIHW & CA 2011).
20
Cancer in Australia: an overview, 2012
Rate (per 100,000)
80
70
60
Males
Females
50
40
30
20
2012
2011
2010
2009
2008
2007
2006
2005
2004
2003
2002
2001
2000
1999
1998
1997
1996
1995
1994
1993
1992
0
1991
10
Year
Notes
1.
2010–2012 estimates were based on 2000–2009 incidence data (see Appendix G). Estimates are displayed on the graph as a
dotted line.
2.
The rates were age-standardised to the Australian population as at 30 June 2001.
3.
The data for this figure are in online Table D2.6.
Source: AIHW Australian Cancer Database 2009.
Figure 2.7: Trends in incidence of lung cancer, Australia, 1991 to 2009, with estimates to 2012
How does Australia compare internationally?
In this section, the incidence rate of cancer in Australia is compared with that for other
countries and regions using data from the GLOBOCAN database, which is prepared by the
International Agency for Research on Cancer (IARC) (Ferlay et al. 2010). The most recent
GLOBOCAN estimates are for 2008, and are based on cancer incidence rates from about 3 to
5 years earlier. The GLOBOCAN data for all cancers combined pertain to cancers coded in
ICD-10 as C00–C97, excluding C44 (that is, non-melanoma skin cancer), and thus encompass
a narrower range of cancers than is generally considered in this report (see Appendix I).
As discussed in Chapter 1, caution must be taken when comparing data from different
countries since observed differences may be due to differences in the composition of the
populations, cancer detection and screening, types of treatment provided, and cancer coding
and registration practices. In Australia, all states and territories have legislation that makes
cancer a notifiable disease (see Appendix I) and the completeness of cancer data is relatively
high in comparison to a number of countries or regions (Curado et al. 2007).
The estimated number of new cases of cancer around the world in 2008 was 12.7 million.
Figure 2.8 shows the estimated incidence rates of cancer by region. The estimated agestandardised incidence rate for Australia was 314 per 100,000 (online Table D2.7). While this
rate was generally at the same level as that estimated for people in New Zealand (309 per
100,000), it was significantly higher than the rates estimated for all other regions in the
world. This is probably a consequence of the high rate of melanoma of the skin in Australia.
In 2008, Australia had the world’s highest age-standardised incidence rate of melanoma of
the skin (37 per 100,000), which was more than 12 times the average world rate (3 per
100,000). Australia also had the highest incidence rate of prostate cancer (105 per 100,000)
Cancer in Australia: an overview, 2012
21
and the fourth highest rate of breast cancer in females (85 per 100,000) in 2008 (Ferlay et al.
2010).
Australia
New Zealand
Northern America
Western Europe
Western Europe
Southern Europe
Central and Eastern Europe
Polynesia
Southern Africa
Eastern Asia
World
Caribbean
South America
Micronesia
South-Eastern Asia
Melanesia
Central America
Western Asia
Eastern Africa
Western Africa
South-Central Asia
Northern Africa
Middle Africa
0
50
100
150
200
250
300
350
Rate (per 100,000)
Notes
1.
Cancers coded in ICD-10 as C00–C97, excluding C44 non-melanoma skin cancer.
2.
Data were estimated for 2008 by the International Agency for Research on Cancer (IARC) and are based on data from about 3 to
5 years earlier.
3.
The age-standardised rates were standardised by the IARC using the Doll et al. (1966) World Standard Population and are
expressed per 100,000 persons. Countries or regions are ordered in descending order according to the age-standardised rate.
4.
The confidence intervals are approximations and were calculated by the AIHW (see Appendix H).
5.
Data for this figure are in online Table D2.7.
Source: Ferlay et al. 2010.
Figure 2.8: International comparison of estimated incidence for all cancers combined, persons,
2008
22
Cancer in Australia: an overview, 2012
3
Mortality from cancer
Key findings
In 2010 in Australia:
•
A total of 42,844 people died from cancer, an average of 117 deaths every day.
•
Cancer was the second most common cause of death, exceeded only by cardiovascular
diseases.
•
The majority of cancer deaths were in males (57%).
•
Lung cancer was the leading cause of cancer death among males (4,934 deaths),
followed by prostate cancer (3,235), bowel cancer (2,205), pancreatic cancer (1,233) and
cancer of unknown primary site (1,167).
•
The most common cancers causing death in females were lung cancer (3,165 deaths),
breast cancer (2,840), bowel cancer (1,777), pancreatic cancer (1,201) and cancer of
unknown primary site (1,113).
•
For both males and females, the average age at death due to cancer was 73.
•
The age-standardised mortality rate for all cancers combined was 174 per 100,000, a fall
of 17% from 1991 (210 per 100,000).
•
The risk of a person in the general population dying from cancer before the age of 85
was 1 in 4 for males and 1 in 6 for females.
Cancer in Australia: an overview, 2012
23
About mortality
In this report, mortality refers to the number of deaths for which the underlying cause was a
primary cancer. The cancer that led to the death of the person may have been diagnosed
many years previously, in the same year in which the person died or, in some cases, after
death (for example at autopsy). Information on the underlying cause of death is derived
from the medical certificate of cause of death, which is usually completed by a medical
practitioner.
The main data source used in this chapter was the AIHW National Mortality Database,
which contains information about all deaths registered in Australia (see Appendix I for more
information).
Data on mortality from cancer are based on the year of occurrence of death, except in 2010
(the latest year for which mortality data are available), where the year of registration of death
is used. Previous investigation has shown that the year of death and its registration
correspond for most part of the year. However, deaths that occur at the end of the calendar
year often do not get registered till the following year due to a lag in processing of deaths.
Therefore, the number of death registered for the most recent year (2010) is used as an
estimate to account for these deaths. Additional information on mortality from ‘all cancers
combined’ and the selected cancer sites is in online tables (see Appendix D) that are available
on the AIHW website.
Summary pages for selected cancers are in Appendix B. These pages present the latest
available mortality data and estimates for 2012. An overview of mortality statistics for all
cancers is in Appendix C.
How many people died from cancer in 2010?
Cancer accounted for about 3 of every 10 deaths (30%) registered in Australia in 2010 (Table
3.1). This makes cancer the second most common cause of death, exceeded only by
cardiovascular diseases (32% of all deaths) (ABS 2012a).
In 2010, 42,844 people died from cancer in Australia, an average of 117 deaths every day.
More males (57%) than females (43%) died from cancer, with cancer accounting for 33% of all
male deaths and 27% of all female deaths.
The age-standardised mortality rate for all cancers combined was 174 per 100,000 in 2010.
The mortality rate of males (222 per 100,000) was significantly higher than that of females
(138 per 100,000).
24
Cancer in Australia: an overview, 2012
Table 3.1: Deaths from all cancers combined(a), Australia, 2010(b)
Number of deaths
Males
Females
Persons
24,328
18,516
42,844
(c)
221.7
137.6
174.3
95% confidence interval
218.9–224.5
135.6–139.7
172.7–176.0
Per cent of all cancer deaths
56.8
43.2
100.0
Per cent of all deaths
33.1
26.5
29.9
Age-standardised rate
(a)
Cancers coded in ICD-10 as C00–C97, D45, D46, D47.1 and D47.3.
(b)
Mortality data for 2010 are preliminary and are subject to further revision.
(c)
The rates were standardised to the Australian population as at 30 June 2001 and are expressed per 100,000 population.
Source: AIHW National Mortality Database.
Which cancers lead to most deaths?
In 2010, lung cancer (8,099 deaths), bowel cancer (3,982), prostate cancer (3,235), breast cancer
(2,864) and pancreatic cancer (2,434) were the most common causes of cancer death. Together
these five cancers represented just under half (48%) of the total mortality from cancer, with
lung cancer alone accounting for 1 in every 5 deaths due to cancer (19%).
Lung cancer was the leading cause of cancer death among Australian males, with 4,934
deaths in 2010. Prostate cancer (3,235) and bowel cancer (2,205) were the second and third
leading cause of cancer death in males, followed by pancreatic cancer (1,233) and cancer of
unknown primary site (1,167). These five cancers accounted for 53% of all cancer deaths in
males.
Lung cancer was also the most common cause of cancer deaths in females in 2010 (3,165
deaths). This was followed by breast cancer (2,840), bowel cancer (1,777), pancreatic cancer
(1,201) and cancer of unknown primary site (1,113). These five cancers accounted for 55% of
all cancer deaths in females.
Cancer in Australia: an overview, 2012
25
Table 3.2: The 10 most common causes of death from cancer, Australia, 2010(a)
Males
Females
Cancer site/type
(ICD-10 codes)
Deaths
ASR(b)
95% CI
43.3–45.9
Lung (C33–C34)
3,165
24.2
23.3–25.0
30.6
29.6–31.7
Breast (C50)
2,840
21.6
20.8–22.4
2,205
20.1
19.2–20.9
Bowel (C18–C20)
1,777
13.0
12.4–13.6
Pancreas (C25)
1,233
11.1
10.5–11.7
Pancreas (C25)
1,201
8.9
8.4–9.4
Unknown primary site
(C80)
1,167
10.7
10.1–11.3
Unknown primary site
(C80)
1,113
7.8
7.4–8.3
Melanoma of the skin
(C43)
993
8.9
8.4–9.5
Ovary (C56)
912
7.0
6.6–7.5
Liver (C22)
890
7.9
7.4–8.4
Other digestive organs
(C26)
641
4.4
4.1–4.8
Oesophagus (C15)
879
7.8
7.2–8.3
Non-Hodgkin
lymphoma (C82–C85)
557
4.0
3.7–4.3
Non-Hodgkin
lymphoma (C82–C85)
781
7.1
6.6–7.6
512
4.1
3.8–4.5
Bladder (C67)
736
6.9
6.4–7.4
459
3.5
3.2–3.8
18,516
137.6
135.6–139.7
Cancer site/type
(ICD-10 codes)
Deaths ASR(b)
Lung (C33–C34)
4,934
44.6
Prostate (C61)
3,235
Bowel (C18–C20)
(c)
All cancers
24,328
221.7
95% CI
218.9–224.5
Brain (C71)
Melanoma of the skin
(C43)
(c)
All cancers
(a)
Mortality data for 2010 are preliminary and are subject to further revision.
(b)
The rates were standardised to the Australian population as at 30 June 2001 and are expressed per 100,000 population.
(c)
Cancers coded in ICD-10 as C00–C97, D45, D46, D47.1 and D47.3.
Source: AIHW National Mortality Database.
Does mortality differ by age?
The age-specific mortality rate from all cancers combined increased with age (Figure 3.1). In
2010, 85% of all cancer deaths in males and 83% all cancer deaths in females occurred in
people aged over 60. The average age at death due to cancer was 73 for both males and
females.
The mortality rate was similar for males and females up to the age of 50–54. After 55, the
mortality rates were higher and increased more steeply in males. Mortality from lung cancer,
prostate cancer and bowel cancer accounted for the high cancer mortality in older men.
26
Cancer in Australia: an overview, 2012
Rate (per 100,000)
3,500
Males
3,000
Females
2,500
Persons
2,000
1,500
1,000
85 +
80–84
75–79
70–74
65–69
60–64
55–59
50–54
45–49
40–44
35–39
30–34
25–29
20–24
15–19
10–14
5–9
0
0–4
500
Age group (years)
Notes
1.
Mortality data for 2010 are preliminary and are subject to further revision.
2.
Data pertain to cancers coded in ICD-10 as C00–C97, D45, D46, D47.1 and D47.3.
3.
Data for this figure are in online Table D3.1.
Source: AIHW National Mortality Database.
Figure 3.1: Mortality from all cancers combined by age at death, Australia, 2010
What is the risk of death from cancer?
In 2010, the risk of dying from cancer before the age of 75 years was 1 in 8 for males and 1 in
12 for females. By the age of 85, the risk increased to 1 in 4 for males and 1 in 6 for females
(Table 3.3) (see Appendix H for an explanation of how these risks were calculated).
Table 3.3: Risk of death from cancer, Australia, 2010(a)
Risk to age 75
Risk to age 85
1 in 8
1 in 4
Females
1 in 12
1 in 6
Persons
1 in 10
1 in 5
Males
(a)
Mortality data for 2010 are preliminary and are subject to further revision.
Source: AIHW National Mortality Database.
The risk of dying from lung cancer was high for both males and females. Specifically, before
the age of 75, the risk was 1 in 36 males and 1 in 58 females. By the age of 85, the risk of
dying from lung cancer doubled to be 1 in 16 for males and 1 in 29 for females.
What has changed over time?
In this section, trends in mortality from all cancers combined and selected cancer sites are
presented from 1991 to 2010.
Cancer in Australia: an overview, 2012
27
Trends for all cancers combined
The number of deaths from all cancers combined has steadily increased over time. In 2010,
42,844 Australians died from cancer, compared with 31,356 in 1991, an increase of 37%. The
number of deaths recorded for 2010 was the largest number reported in any year to date.
In contrast, there was a statistically significant decrease in the age-standardised mortality
rate. Between 1991 and 2010, the mortality rate fell by 17% from 210 to 174 per 100,000.
For males, after the mortality rate reached a peak in 1994, it fell by 22% over the period to
2010 (from 284 to 222 per 100,000) (Figure 3.2). The trend of cancer mortality in males was
heavily influenced by declines in mortality rates for lung cancer, prostate cancer and bowel
cancer, which accounted for most of the total decrease between 1994 and 2010.
The cancer mortality rate for females was consistently lower than that of males throughout
the 20 years considered. The female mortality rate remained fairly stable before 1993 and
decreased thereafter. The mortality rate among females fell by 16% from 1993 (164 per
100,000) to 2010 (138 per 100,000) (Figure 3.2). The fall was largely due to declines in
mortality rates of breast cancer and bowel cancer.
Number of deaths
Rate (per 100,000)
Males
30,000
Females
300
Rate (per 100,000)
25,000
20,000
250
Rate (per 100,000)
200
15,000
150
10,000
100
5,000
2010
2009
2008
2007
2006
2005
2004
2003
2002
2001
2000
1999
1998
1997
1996
1995
1994
1993
1992
1991
0
50
Number of deaths
0
Year
Notes
1.
Mortality data for 2009 and 2010 are revised and preliminary, respectively, and are subject to further revision.
2.
The rates were age-standardised to the Australian population as at 30 June 2001.
3.
Data pertain to cancers coded in ICD-10 as C00–C97, D45, D46, D47.1 and D47.3.
4.
Data for this figure are in online Table D3.2.
Source: AIHW National Mortality Database.
Figure 3.2: Trends in mortality from all cancers combined, Australia, 1991 to 2010
Trends for specific cancers
Figure 3.3 summaries the percentage change in age-standardised mortality rates between
1991 and 2010 for selected cancers.
In general, the mortality rate of many cancers decreased over time. Of the selected cancers,
those that showed the greatest statistically significant percentage-point decrease in mortality
rate were:
•
28
cancer of the gallbladder (from 2.4 to 1.0 per 100,000)
Cancer in Australia: an overview, 2012
•
cervical cancer (from 4.0 to 1.9 per 100,000)
•
stomach cancer (from 8.8 to 4.5 per 100,000)
•
bowel cancer (from 28 to 16 per 100,000).
Mortality rate of these cancers decreased by more than 40 per cent.
Of the selected cancers, only liver cancer showed a significant increase in mortality rate
between 1991 and 2010 (from 2.8 to 5.5 per 100,000).
More information about the trends in the mortality rates of lung cancer, bowel cancer
prostate cancer and breast cancer in females is provided in the following section.
Cancer in Australia: an overview, 2012
29
Liver*
Thyroid
Melanoma
Pancreas
Myeloma
Oesophagus
Brain
Uterus
All cancers*
Bladder*
Ovary*
Lung*
HL
Kidney*
Prostate*
Tongue
Breast (females)*
UPS*
NHL*
Larynx*
Bowel*
Stomach*
Testis
Cervix*
Gallbladder*
-100
-80
-60
-40
-20
Per cent change in mortality rate
0
0
20
40
60
80
Per cent change in mortality rate
100
Notes
1.
Mortality data for 2009 and 2010 are revised and preliminary, respectively, and are subject to further revision.
2.
The bars indicate the percentage change in mortality rates from 1991 to 2010.
3.
The percentage change from 1991 to 2010 is a summary measure that allows the use of a single number to describe the change over a
period of multiple years. However, it is not always reasonable to expect that a single measure can accurately describe the trend over the
entire period.
4.
Cancers labelled with an asterisk (*) indicate changes that were statistically significant.
5.
HL=Hodgkin lymphoma, UPS=Cancer of unknown primary site, NHL=Non-Hodgkin lymphoma. Melanoma refers to melanoma of the skin.
6.
The rates were age-standardised to the Australian population as at 30 June 2001.
Source: AIHW National Mortality Database.
Figure 3.3: Percentage change in age-standardised mortality rates, Australia, 1991 to 2010
Lung cancer
Trends in the age-standardised mortality rates of lung cancer differ starkly for males and
females. As illustrated in Figure 3.4, the mortality rate for males has fallen steadily from 67
per 100,000 in 1991 to 45 per 100,000 in 2010; an overall fall of 33%. Over the same period,
mortality rate for females increased, and by 2010 the rate (24 per 100,000) was 17% higher
than it was in 1991 (21 per 100,000). While the mortality rate for females was still lower than
that for males in 2010, the gap has narrowed considerably over the last decades.
30
Cancer in Australia: an overview, 2012
The different patterns of mortality rates for males and females may reflect the historical
differences in smoking behaviour described earlier (see Chapter 2).
Rate (per 100,000)
80
70
Males
60
Females
50
40
30
20
2010
2009
2008
2007
2006
2005
2004
2003
2002
2001
2000
1999
1998
1997
1996
1995
1994
1993
1992
0
1991
10
Year
Notes
1.
Mortality data for 2009 and 2010 are revised and preliminary, respectively, and are subject to further revision.
2.
The rates were age-standardised to the Australian population as at 30 June 2001.
3.
Data for this figure are in online Table D3.3.
Source: AIHW National Mortality Database.
Figure 3.4: Trends in mortality from lung cancer, Australia, 1991 to 2010
Bowel cancer
The age-standardised mortality rate of bowel cancer decreased for males and females (Figure
3.5). Between 1991 and 2010, it fell by 41% for males (from 34 to 20 per 100,000) and 45% for
females (from 24 to 13 per 100,000). The reasons for the continued fall are not clear, but may
be due to earlier detection of pre-cancerous polyps and improved treatment.
Rate (per 100,000)
40
35
Males
30
Females
25
20
15
10
2010
2009
2008
2007
2006
2005
2004
2003
2002
2001
2000
1999
1998
1997
1996
1995
1994
1993
1992
0
1991
5
Year
Notes
1.
Mortality data for 2009 and 2010 are revised and preliminary, respectively, and are subject to further revision.
2.
The rates were age-standardised to the Australian population as at 30 June 2001.
3.
Data for this figure are in online Table D3.4.
Source: AIHW National Mortality Database.
Figure 3.5: Trends in mortality from bowel cancer, Australia, 1991 to 2010
Cancer in Australia: an overview, 2012
31
Prostate cancer
The age-standardised mortality rate of prostate cancer rose until 1993, where it peaked at 44
per 100,000 (Figure 3.6). Since then the rate tended to fall, with a much sharper decline
occurring in the 1990s than in the 2000s. By 2010, the mortality rate was 31 per 100,000,
indicating an overall decrease of 30% between 1993 and 2010.
The fall partly due to early detection of prostate cancer cases by prostate-specific antigen
testing. Improvements in general health and treatments for men may be other contributing
factors leading to improved mortality rates (Baade et al. 2004; CCS 2010; Schroder et al.
2009).
Breast cancer in females
Figure 3.6 shows that the age-standardised mortality rate of breast cancer in females
remained fairly stable throughout the early 1990s (29 to 31 per 100,000). After this time, there
was an appreciable decline in the rate, from 31 per 100,000 in 1994 to 22 per 100,000 in 2010—
a fall of 30%. The decline in recent decades is believed to be due to increased availability and
quality of screening mammography and improved treatments (ACS 2009).
Rate (per 100,000)
50
Prostate cancer
45
Breast cancer in females
40
35
30
25
20
15
10
Year
Notes
1.
Mortality data for 2009 and 2010 are revised and preliminary, respectively, and are subject to further revision.
2.
The rates were age-standardised to the Australian population as at 30 June 2001.
3.
Data for this figure are in online Table D3.5.
Source: AIHW National Mortality Database.
Figure 3.6: Trends in mortality from prostate cancer in males and breast cancer in females,
Australia, 1991 to 2010
32
Cancer in Australia: an overview, 2012
2010
2009
2008
2007
2006
2005
2004
2003
2002
2001
2000
1999
1998
1997
1996
1995
1994
1993
1992
0
1991
5
How does Australia compare internationally?
Data on deaths of persons from all cancers combined for different regions and countries are
shown in Figure 3.7. The data is from the GLOBOCAN database (Ferlay et al. 2010) (see
Appendix I).
International differences in cancer mortality rates by country could relate to a number of
factors including differences in:
•
the composition of the populations
•
cancer detection and screening
•
cancer coding and registration practices
•
cancer incidence rates (see Chapter 2)
•
features at diagnosis (for example, stage at diagnosis and cancer histology type)
•
individual’s level of co-morbidity
•
availability and quality of treatment (CCS & NCIC 2007).
The age-standardised mortality rate for cancer varied considerably between countries and
regions. It was highest for Southern Africa (133 per 100,000) and lowest for South Central
Asia (100 per 100,000). The rate for Australia was 103 per 100,000, which was slightly lower
than the average world rate (106 per 100,000).
Cancer in Australia: an overview, 2012
33
Southern Africa
Central and Eastern Europe
Eastern Asia
Northern Europe
Southern Europe
New Zealand
Polynesia
Western Europe
Melanesia
World
Northern America
Australia
South America
Caribbean
Eastern Africa
South-Eastern Asia
Western Asia
Micronesia
Western Africa
Central America
Northern Africa
Middle Africa
South-Central Asia
0
20
40
60
80
100
120
140
Rate (per 100,000)
Notes
1.
Cancers coded in ICD-10 as C00–C97, excluding C44 non-melanoma skin cancer.
2.
The data were estimated for 2008 by the International Agency for Research on Cancer (IARC) and are based on data from about
3 to 5 years earlier.
3.
The age-standardised rates were standardised by the IARC using the Doll et al. (1966) World Standard Population and are
expressed per 100,000 persons. Countries or regions are ordered in descending order according to the age-standardised rate.
4.
The confidence intervals are approximations and were calculated by the AIHW (see Appendix H).
5.
Data for this figure are in online Table D3.6.
Source: Ferlay et al. 2008.
Figure 3.7: International comparison of estimated mortality for all cancers combined,
persons, 2008
34
Cancer in Australia: an overview, 2012
4
Survival after a diagnosis of cancer
Key findings
In 2006–2010 in Australia:
•
Five-year relative survival was 66% for all cancers combined.
•
Females had slightly higher survival than males (5-year relative survival of 67% and
65%, respectively).
•
For males diagnosed with cancer, 5-year relative survival was highest for testicular
cancer (98%), lip cancer (93%) and prostate cancer (92%).
•
For females diagnosed with cancer, 5-year relative survival was highest for thyroid
cancer (98%), melanoma of the skin (94%) and lip cancer (92%).
•
For all cancers combined, 5-year relative survival decreased with age.
From 1982–1987 to 2006–2010:
•
Five-year relative survival increased significantly from 41% to 65% for males and 53%
to 67% for females for all cancers combined.
Cancer in Australia: an overview, 2012
35
About survival
Information on the survival from cancer provides not only an indication of cancer prognosis
but also the success of control programs as well as treatments available. It refers to the
probability of being alive for a given amount of time after diagnosis and reflects the impact
of a cancer diagnosis.
Survival is influenced by a range of factors, including the characteristics of those diagnosed
with cancer (such as age, sex, additional illness and lifestyle); the nature of the tumours (such
as primary site, stage at diagnosis and histology type); and the health-care system (such as
availability of screening, diagnostic and treatment facilities, and follow-up services) (Black et
al. 1998; WCRF & AICR 2007).
Since survival estimates are based on the outcomes of people diagnosed with cancer with
diverse characteristics, they provide an indication of the average survival experience. They do
not reflect an individual’s chance of surviving since this is affected by specific characteristics
of the individual, the cancer they have and the treatments received. A doctor is the best
source of information about an individual’s survival prospects.
In this report, ‘relative survival’ statistics are used to examine survival from cancer. These
estimates are derived by comparing the survival of people diagnosed with cancer (that is,
observed survival) with that experienced by people in the general population, matched for
age and in the same calendar year (that is, expected survival). An estimate of less than 100%
suggests that those with cancer had a lower chance of survival than the general population.
For example, 5-year relative survival of 50% for people with cancer means that these people
had half the chance of surviving at least 5 years after diagnosis relative to comparable people
in the general population.
Note that all survival estimates in this report are relative survival estimates. That is, all
survival probabilities presented are relative to those of the general population. For brevity,
they will be referred to simply as ‘survival’, without a comparison to the general population
each time.
The period method developed by Brenner and Gefeller (1996) was used to calculate relative
survival estimates. The period method examines the survival experience of people during a
particular at-risk period and who were diagnosed with cancer before or during this period
(see Box 4.1 and Appendix H for further information).
Information on survival differences by the level of remoteness area and socioeconomic status
of residence at diagnosis is in Chapter 6.
36
Cancer in Australia: an overview, 2012
Box 4.1: Period survival
In this report, relative survival (see Box 4.2 for definition) was calculated using the period
method (Brenner & Gefeller 1996). This method calculates survival from a given follow-up
or at-risk period. Survival estimates are based on the survival experience of people who
were diagnosed before or during this period, and who were at risk of dying during this
period. More information about the period method is in Appendix H.
Note that the period method is an alternative to the traditional cohort method, which
focuses on a group of people diagnosed with cancer in the past time period, and follows
these people over time. By its nature the period method produces more up-to-date
estimates of survival than the cohort method. Because the cohort method was used in
previous Cancer in Australia reports (for example, AIHW & AACR 2010), survival estimates
in this report should not be directly compared with those in earlier reports.
In this chapter, 5-year survival is shown after a diagnosis of invasive cancer. Further
information on survival over time, by age group and cancer type are in the AIHW
publication Cancer survival and prevalence in Australia: period estimates from 1982 to 2010
(AIHW 2012d).
The survival estimates in this chapter are based on the 2007 ACD. Data from the National
Death Index (NDI) on deaths (from any cause) that occurred up to 31 December 2010 were
used to determine which people with cancer had died and when this occurred. International
comparisons were calculated using the GLOBOCAN database (Ferlay et al. 2010).
Box 4.2: Survival terminology in this report
Survival: a general term indicating the probability of being alive for a given amount of time
after a particular event, such as a diagnosis of cancer.
Observed survival: the proportion of people alive for a given amount of time after a
diagnosis of cancer. Observed survival estimates are crude estimates calculated from
population-based cancer data.
Expected survival: the proportion of people in the general population alive for a given
amount of time. Expected survival estimates are crude estimates calculated from life tables
of the entire Australian population.
Relative survival: the ratio of observed survival to expected survival. Relative survival
measures inversely the excess mortality associated with a cancer diagnosis. All survival
estimates in this report are relative survival estimates.
Conditional relative survival: the probability that individuals with cancer will be alive for
a given amount of time provided that they have already survived for a specified time after
diagnosis. All conditional survival estimates in this report are conditional relative survival
estimates as they were derived from relative survival.
Cancer in Australia: an overview, 2012
37
What is the prospect of survival?
In 2006–2010, 5-year survival was 66% for all cancer combined. This means that people
diagnosed with cancer had a 66% chance of surviving for at least 5 years compared with
their counterparts in the general population.
Females had slightly higher 5-year survival than males, at 67% compared with 65% for males
(Table 4.1).
Table 4.1: Five-year relative survival from all cancers combined(a), Australia, 2006–2010
Sex
5-year relative survival (%)
95% confidence interval
Males
65.1
64.9–65.4
Females
67.4
67.1–67.6
Persons
66.1
65.9–66.3
(a)
Cancers coded in ICD-10 as C00–C97 D45, D46, D47.1 and D47.3 with the exception of C44 codes that indicate a basal or
squamous cell carcinoma of the skin.
Source: AIHW Australian Cancer Database 2007.
Is the prospect of survival similar for all cancer sites?
In 2006–2010, 5-year survival was highest for people diagnosed with thyroid cancer (96%),
lip cancer (93%) and melanoma of the skin (92%), and lowest for those diagnosed with
pancreatic cancer (5%) and mesothelioma (6%).
For males, 5-year survival was highest for those diagnosed with testicular cancer (98%), lip
cancer (93%) and prostate cancer (92%). For females, it was highest for those diagnosed with
thyroid cancer (98%), melanoma of the skin (94%) and lip cancer (92%) (Figure 4.1).
For both males and females, 5-year survival was lowest for pancreatic cancer (5% and 6%
respectively) and mesothelioma (5% and 10% respectively).
38
Cancer in Australia: an overview, 2012
5-year relative survival (%)
Males
Pancreas
Mesothelioma
Liver
Lung
UPS
Oesophageal
Brain
AML
Gallbladder
Ovary
Stomach
Bladder
Myeloma
Larynx
Tongue
All cancers
NHL
Bowel
CLL
Kidney
Cervix
Uterus, body
HL
Breast
Thyroid
Melanoma of skin
Prostate
Lip
Females
Testis
100
90
80
70
60
50
40
30
20
10
0
Notes
1.
All cancers include cancers coded in ICD-10 as C00–C97 D45, D46, D47.1 and D47.3 with the exception of C44 codes that indicate a
basal or squamous cell carcinoma of the skin.
2.
HL=Hodgkin lymphoma, AML=Acute myeloid leukaemia, CLL=Chronic lymphocytic leukaemia, NHL=Non-Hodgkin lymphoma,
UPS=Cancer of unknown primary site.
3.
Data for this figure are in online Table D4.1.
Source: AIHW Australian Cancer Database 2007.
Figure 4.1: Five-year relative survival from selected cancers, Australia, 2006–2010
In 2006–2010, 5-year survival was significantly higher for males than for females for bladder
cancer (1.2 times of females) and cancer of unknown primary site (1.4 times of females). Fiveyear survival was significantly higher for females than for males for mesothelioma (1.9 times
of males), lung cancer (1.3 times of males) and brain cancer (1.2 times of males).
Does survival differ by age?
In 2006–2010 for all cancers combined, 5-year survival was highest for those aged under 40
(86%) and decreased with age so that it was the lowest (43%) for those aged 80 and over
(Figure 4.2). The difference by age in survival may be due to a number of reasons, including
the stage at diagnosis of tumours, a greater likelihood of co-morbidity among those
diagnosed at an older age, differences in treatment received and the inclusion in clinical
trials (Brenner & Arndt 2004; Ellison & Gibbons 2006; NCRI & WHC 2006).
Females had a survival advantage up to the 60–69 year age group. The difference was most
marked for those aged 40–49, where 5-year survival was 84% for females and 74% for males.
After the age of 60–69, survival was slightly higher for males, with a significant difference for
those aged 70–79. The difference in the age-related pattern of survival by sex may be due to
the age distributions and survival outcomes for prostate cancer and breast cancer.
Cancer in Australia: an overview, 2012
39
5-year relative survival (%)
100
Males
90
Females
80
Persons
70
60
50
40
30
20
10
0
0–39
40–49
50–59
60–69
70–79
80+
Age group (years)
Note: Data for this figure are in online Table D4.2.
Source: AIHW Australian Cancer Database 2007.
Figure 4.2: Five-year relative survival from all cancers combined by age at diagnosis,
Australia, 2006–2010
The age-related pattern of survival for all cancers combined was characteristic of most
individual cancer types. The reduction in survival with age was more pronounced in the
second half of the lifespan, however the pattern of decline varied across cancer types. For
example, survival from bowel cancer declined slowly with age—72% for people aged 0–39
and 58% for those aged 80 and over. In contrast, survival from lung cancer fell sharply with
age, from 42% for those aged under 40 to 20% for those aged 40–49 to 6.3% for those aged 80
and over (Figure 4.3).
Some cancers showed a rise in 5-year survival with age before declining in the older age
groups. For prostate cancer in males and breast cancer in females, 5-year survival was
highest for those aged 50–59 and 60–69 (Figure 4.3).
40
Cancer in Australia: an overview, 2012
5-year relative survival (%)
100
90
80
70
60
Bowel
Breast (females)
Prostate
Lung
50
40
30
20
10
0
0–39
40–49
50–59
60–69
Age group (years)
80+
70–79
Note: Data for this figure are presented in online Table D4.2.
Source: AIHW Australian Cancer Database 2007.
Figure 4.3: Five-year relative survival from selected cancers by age at diagnosis, Australia,
2006–2010
How has survival changed over time?
Five-year survival for people diagnosed with cancer increased significantly over time, from
47% in 1982–1987 to 66% in 2006–2010 (Figure 4.4).
The increase in 5-year survival is evident in both males and females, although the gain was
greater for males. For all cancers combined, 5-year survival for males increased from 41% in
1982–1987 to 65% in 2006–2010, compared with 53% to 67% for females. These gains can be
explained by better diagnostic methods, earlier detection and improvements in treatment
(Dickman & Adami 2006).
5-year relative survival (%)
80
70
60
Males
50
Females
40
Persons
30
20
10
0
1982–1987
1988–1993
1994–1999
2000–2005
2006–2010
Note: Data for this figure are in online Table D4.3.
Source: AIHW Australian Cancer Database 2007.
Figure 4.4: Five-year relative survival from all cancers combined, Australia, 1982–1987 to
2006–2010
Cancer in Australia: an overview, 2012
41
Between 1982–1987 and 2006–2010, survival from most cancers improved, but the change
was not uniform over time and across cancer types (Figure 4.5).
The cancers that had the largest absolute increase in survival were prostate cancer, kidney
cancer, non-Hodgkin lymphoma, bowel cancer, breast cancer in females and myeloma,
where 5-year survival increased by 17 percentage points or more.
Other cancers that showed a greater proportional increase in survival included liver cancer,
cancer of unknown primary site, and acute myeloid leukaemia. Five-year survival from these
cancers more than doubled between 1982–1987 and 2006–2010, despite remaining lower than
the average.
However, gains in survival have not been consistent across all cancers. Many of the cancers
that already had low survival in 1982–1987 showed only small gains, such as mesothelioma
(from 5.5% to 6.2%), brain cancer (from 20% to 22%), pancreatic cancer (from 3% to 5%) and
lung cancer (from 9% to 14%).
Cancer of the bladder showed a statistically significant decrease in 5-year survival (68% to
58%). The negative trend in bladder cancer survival has been observed elsewhere in
Australia and is believed to be related to changes in the coding of invasive cancers and
changes in the age at diagnosis over time (English et al. 2007; Duncombe et al. 2009; Luke et
al. 2010).
42
Cancer in Australia: an overview, 2012
Notes
1.
Arrow positions indicate survival estimates and arrow lengths indicate the change in survival between the periods 1982–1987 and
2006–2010. Cancers labelled with an asterisk (*) indicate changes that were not statistically significant.
2.
Data for 1988–1993, instead of 1982–1987, are used for liver cancer due to the small number of cases from the earlier time period.
Source: AIHW Australian Cancer Database 2007.
Figure 4.5: Survival trends for selected cancers, Australia, 1982–1987 to 2006–2010
Cancer in Australia: an overview, 2012
43
Conditional survival
Conditional survival shows the probability of surviving a given number of years provided
that an individual has already survived a specified amount of time after diagnosis. Ordinary
relative survival estimates show the probability of survival at diagnosis: they may be less
informative or even overly pessimistic when applied to those who have already survived for
some time after their diagnosis (Xing et al. 2010). Conditional relative survival may therefore
be a more realistic and clinically-relevant measure of survival for individuals who are
already living with cancer (Baade et al. 2011).
Note that all conditional survival estimates in this report are conditional relative survival
estimates. That is, they have been derived from relative survival but are referred simply as
‘conditional survival’.
For all cancers combined, the prospect of surviving for at least 5 more years increased
markedly with the number of years already survived. At diagnosis, the probability of
surviving for at least 5 years was 66%. However, by 1 year after diagnosis, individuals with
cancer had an 80% chance of surviving at least 5 more years (Table 4.2). This increased
further to 97% by 15 years after diagnosis, at which survival prospects were almost the same
as in the general population.
Table 4.2: Summary of conditional relative survival from all cancers combined(a), Australia,
2006–2010
Years already survived
5-year conditional relative survival (%)
95% confidence interval
At diagnosis
66.1
65.9–66.3
Already survived 1 year after diagnosis
80.0
79.9–80.2
Already survived 5 years after diagnosis
91.1
90.9–91.2
Already survived 10 years after diagnosis
94.0
93.8–94.2
(a)
Cancers coded in ICD-10 as C00–C97, D45, D46, D47.1 and D47.3, with exception of those C44 codes that indicate basal cell and
squamous cell carcinoma of the skin.
Source: AIHW Australian Cancer Database 2007.
Figure 4.6 presents the probability of surviving for at least 5 more years by the amount of
time already survived by cancer sites: at diagnosis, 1 year after diagnosis, and 5 years after
diagnosis. Note that the three columns for each cancer are overlapping, such that the area for
Already survived 5 years after diagnosis includes those for Already survived 1 year after diagnosis
and At diagnosis.
The relationship between conditional survival and survival at diagnosis varied for different
cancer sites. Some cancers that had poor survival prospects at diagnosis were observed to
have substantial increases in conditional survival with the number of additional years
survived. These included stomach cancer, gallbladder cancer, cancer of unknown primary
site and acute myeloid leukaemia. All of these had a 5-year survival at diagnosis of less than
30%, and 5 years after diagnosis, survival for an additional 5 years was more than 80%.
Some cancers that had relatively high survival at diagnosis were observed to have little
increase in conditional survival by 5 years after diagnosis. For example, survival from
testicular cancer, thyroid cancer and prostate cancer was comparatively high at diagnosis
(more than 90%), but there were only marginal gains in conditional survival by 5 years after
diagnosis.
44
Cancer in Australia: an overview, 2012
5-year survival (%)
Already survived 5 years after diagnosis
100
90
80
70
60
50
40
30
20
10
0
Already survived 1 year after diagnosis
Myeloma
Mesothelioma
Liver
Lung
CLL
Pancreas
Ovary
Oesophagus
Brain
Larynx
Tongue
UPS
Gallbladder
NHL
Bladder
AML
Stomach
Bowel
All cancers
combined
Kidney
Prostate
Lip
Breast (females)
Cervix
HL
Uterus
Thyroid
Melanoma
Testis
At diagnosis
Notes
1.
The three columns for each cancer are overlapping, such that the area for Already survived 5 years after diagnosis includes those
for Already survived 1 year after diagnosis and At diagnosis.
2.
AML=Acute myeloid leukaemia, CLL=Chronic lymphocytic leukaemia, HL= Hodgkin lymphoma, NHL=Non-Hodgkin lymphoma,
UPS=Cancer of unknown primary site. Melanoma refers to melanoma of the skin.
3.
Data for this figure are in online Table D4.4.
Source: AIHW Australian Cancer Database 2007.
Figure 4.6: Five-year survival by number of years already survived, Australia, 2006–2010
How does Australia compare internationally?
In addition to the methodological challenges associated with comparing cancer statistics
from different countries (as discussed in Chapter 1), additional uncertainties arise when
comparing relative survival estimates. In particular, there tends to be variation across
countries in: the years to which the relative survival estimates apply, the length of the
follow-up period considered (for example, 1, 5, 10 years and so forth), and the methods used
to calculate the relative survival estimates. For these reasons, relative survival estimates for
different countries are not compared in this report.
Although more rudimentary than relative survival estimates, the mortality-to-incidence ratio
(MIR) is used in this report to make international comparisons. This ratio describes how
many deaths there were in a particular year due to a particular disease, relative to the
number of new cases diagnosed that year (using age-standardised data). For example, an
MIR of 0.30 for cancer would indicate that there were 30 deaths for every 100 new cases of
cancer diagnosed in that year (though the deaths need not relate to the same people as the
cases). If survival tends to be comparatively lower in a particular country, then the MIR for
that country generally would be expected to be higher (that is, closer to 1.00). In contrast, if
survival is higher, the ratio generally would be closer to zero. Appendix H provides further
information about interpreting MIRs.
For this report, mortality-to-incidence for cancer ratios were calculated using data from
GLOBOCAN (Ferlay et al. 2010). The fact that the GLOBOCAN data were estimates for 2008
should be taken into account when interpreting the results shown in Figure 4.7.
Cancer in Australia: an overview, 2012
45
The 2008 GLOBOCAN data suggest that the MIRs for all cancers varied markedly between
countries and regions. The MIR for Australia was 0.33, suggesting that the survival of people
in Australia who were diagnosed with cancer was higher than that of people in other
countries and regions. By comparison, the MIR for African regions, Melanesia and Eastern
Asia was 0.70 or higher, suggesting relatively poorer survival.
Differences in survival across the world could relate not only to the underlying number of
cancer cases and deaths but also to differences in the age-distribution and composition of
populations, availability and quality of treatment, availability and completeness of cancer
surveillance programs, cancer coding and registration practices, and characteristics of the
cancers diagnosed (for example, stage at diagnosis and histological type).
Middle Africa
Eastern Asia
Eastern Africa
Western Africa
Melanesia
Northern Africa
Southern Africa
Northern America
South-Eastern Asia
Central America
Central and Eastern Europe
World
South America
Caribbean
Micronesia
South-Central Asia
Polynesia
Western Asia
Southern Europe
Northern Europe
Western Europe
New Zealand
Australia
0.00
0.20
0.40
0.60
0.80
1.00
Mortality-to-incidence ratio
Notes
1.
The ratios are based on incidence and mortality data for 2008.
2.
The mortality-to-incidence ratio equals the age-standardised mortality rate divided by the age-standardised incidence rate.
3.
Cancers coded in ICD-10 as C00–C97 with the exception of code C44 that indicates non-melanoma skin cancer.
4.
Data for this figure are in online Table D4.5.
Source: Ferlay et al. 2010.
Figure 4.7: International comparison of mortality-to-incidence ratios for all cancers,
2008
46
Cancer in Australia: an overview, 2012
5
Prevalence of cancer
Key findings
At the end of 2007 in Australia:
•
More than 339,000 people were alive who had been diagnosed with cancer within the
previous 5 years. This represented 1.6% of the Australian population.
•
Five-year prevalence was higher in males than in females (55% and 45% of all
prevalent cases, respectively).
•
Twenty-six-year prevalence increased with age, with the highest prevalence among
those aged 80 and over.
•
Among males, 5-year prevalence was highest for prostate cancer (39% of total male 5year prevalence), followed by melanoma of the skin (14%) and bowel cancer (14%).
•
Among females, 5-year prevalence was highest for breast cancer (36% of total female 5year prevalence), followed by bowel cancer (13%) and melanoma of the skin (13%).
Cancer in Australia: an overview, 2012
47
About prevalence
Prevalence refers to the number of people alive who have ever been diagnosed with cancer.
It is different from incidence, which is number of new cancer cases diagnosed in a given
period.
Along with information on incidence, mortality and survival, prevalence is another indicator
of the impact of cancer in our society, both at the personal or family level and societal level,
particularly in terms of need for health-care services. Prevalence contributes to
hospitalisations due to the disease as well as expenditure for health-care services, and
therefore it is important for workforce planning, resource allocation and service delivery.
Prevalence is a direct product of incidence and survival. Cancers with high incidence and
high survival (such as melanoma of the skin) tend to have high prevalence, whereas cancers
with low incidence and low survival (such as pancreatic cancer) tend to have low prevalence.
In other cancers, prevalence may represent a balance between conflicting patterns of
incidence and survival. Lung cancer, for example, had low prevalence compared with other
cancers despite being the fifth most common cancer diagnosed. This is because people with
lung cancer tend not to live as long as those diagnosed with other cancers (AIHW & CA
2011).
Prevalence is also influenced by deaths from other causes and the age at which people are
diagnosed, because older people are more likely to die sooner due to age-related morbidity
and frailty.
In this chapter, limited-duration prevalence is presented, which provides information on the
number of people alive who were diagnosed with cancer within a given period up to a
specified (or index) date. For example, limited-duration prevalence data are presented for 5
years with an index date of 31 December 2007. Note that 26-year prevalence is the longest
duration that can be calculated based on incidence data from 1982 to 2007.
Unlike the incidence data, which pertain to the number of cancers, the prevalence data in this
report pertain to the number of people who have been diagnosed with cancer and are still
alive. Note that a person who was diagnosed with two separate cancers contributed
separately to the prevalence of each cancer. However, this person would contribute only
once towards prevalence of all cancers combined.
In this chapter, no international comparisons are made. Making such comparisons is
difficult, since prevalence data from other countries often differ from Australian data in the
years to which they apply, the number of years considered (for example, 1 and 5) and the
analytical methods used to calculate prevalence.
A summary of prevalence data is provided in this chapter. This includes prevalence
estimates for selected cancers at the end of 2007 and differences in prevalence by sex. Further
information on prevalence, by age group and cancer type are in the AIHW publication
Cancer survival and prevalence in Australia: period estimates from 1982 to 2010 (AIHW 2012d).
48
Cancer in Australia: an overview, 2012
How prevalent was cancer in 2007?
At the end of 2007, 339,077 people were alive who had been diagnosed with cancer in the
previous 5 years (Table 5.1). This represented 1.6% of the Australian population. Males made
up 55% of the 5-year prevalence. At the same time, the 10-year prevalence of cancer was
531,357 and the 26-year prevalence was 774,674 (Table 5.1).
Table 5.1: Limited-duration prevalence of all cancers combined(a), Australia, as at end of 2007
5-year prevalence
10-year prevalence
26-year prevalence
Number(b)
Per cent of
prevalent cases
Per cent of
population(c)
Number(b)
Number(b)
Males
185,574
54.7
1.8
277,939
381,164
Females
153,503
45.3
1.4
253,418
393,510
Persons
339,077
100.0
1.6
531,357
774,674
(a)
Cancers coded in ICD-10 as C00–C97, D45, D46, D47.1 and D47.3, with exception of those C44 codes that indicate basal cell and
squamous cell carcinoma of the skin.
(b)
Prevalence refers to number of living people previously diagnosed with cancer, not the number of cancer cases.
(c)
Based on the number of persons in the Australian population at 31 December 2007.
Source: AIHW Australian Cancer Database 2007.
Does prevalence differ by age?
Twenty-six-year prevalence for all cancers combined increased with age. Note that in these
prevalence statistics, age refers to the age of a person on the index date of 31 December 2007.
At the end of 2007, almost one-fifth (19%) of all Australian aged 80 and over had had a
diagnosis of cancer within the previous 26 years.
Twenty-six-year prevalence rate was highest for those aged 80 and over (19,222 per 100,000)
and lowest for those under 20 (119 per 100,000) (Figure 5.1).
26-year prevalence (number)
Rate (per 100,000)
200,000
25,000
180,000
Number of people
160,000
20,000
Rate (per 100,000)
140,000
120,000
15,000
100,000
80,000
10,000
60,000
40,000
5,000
20,000
0
0–19
20–29
30–39
40–49
50–59
60–69
70–79
80+
0
Age group (years)
Notes
1.
Prevalence refers to number of living people previously diagnosed with cancer, not the number of cancer cases.
2.
Data for this figure are in online Table D5.1.
Source: AIHW Australian Cancer Database 2007.
Figure 5.1: Twenty-six-year prevalence of all cancers combined by age group, Australia,
as at end of 2007
Cancer in Australia: an overview, 2012
49
Does prevalence differ by cancer sites?
Five-year prevalence data for selected cancer sites are shown in Figure 5.2. Among males,
prostate cancer had the highest 5-year prevalence of 72,582 people. This was followed by
melanoma of the skin (25,740), and bowel cancer (25,066). Prostate cancer accounted for 39%
of the total 5-year prevalence in males, while melanoma of the skin and bowel cancer
contributed 14% each.
Among females, breast cancer had the highest 5-year prevalence (55,537 people), followed by
bowel cancer (20,697) and melanoma of the skin (20,013). Breast cancer accounted for 36% of
the total 5-year prevalence in females, while both bowel cancer and melanoma of the skin
contributed 13% each.
Of the selected cancer sites, the lowest 5-year prevalence was observed for pancreatic cancer
(981 males and 882 females), Hodgkin lymphoma (1,166 males and 1,034 females) and brain
cancer (1,416 males and 1,028 females).
For the majority of cancer sites, 5-year prevalence was higher in males than in females. This
trend was most pronounced in bladder cancer, kidney cancer and stomach cancer. For
bladder cancer, 5-year prevalence was more than 3 times higher in males than in females
(5,564 males and 1,614 females). For kidney cancer and stomach cancer, 5-year prevalence
was almost twice as high in males as in females (5,620 males and 2,962 females, and 2,335
males and 1,257 females, respectively). In contrast, the 5-year prevalence for thyroid cancer
was more than 3 times higher in females than in males (1,769 males and 5,693 females).
5-year prevalance (number)
70,000
60,000
Males
Females
50,000
40,000
30,000
20,000
Pancreas
HL
Brain
Cervix
Testis
UPS
Ovary
CLL
Stomach
Bladder
Thyroid
Uterus
Kidney
Lung
NHL
Melanoma
Bowel
Breast
0
Prostate
10,000
Notes
1.
Prevalence refers to number of living people previously diagnosed with cancer, not the number of cancer cases.
2.
NHL=Non-Hodgkin lymphoma, CLL=Chronic lymphocytic leukaemia, UPS=Cancer of unknown primary site, HL=Hodgkin lymphoma.
Melanoma refers to melanoma of the skin.
3.
Data for this figure are in Appendix Table C5.2.
Source: AIHW Australian Cancer Database 2007.
Figure 5.2: Five-year prevalence of selected cancers, Australia, as at the end of 2007
50
Cancer in Australia: an overview, 2012
6
Differences across population groups
Key findings
Incidence
In the 5 years from 2004 to 2008:
•
The age-standardised incidence rate was significantly higher for Indigenous than for
non-Indigenous Australians for cervical cancer (2.8 times higher), cancer of unknown
primary site (1.9), lung cancer (1.9) and pancreatic cancer (1.5).
•
The incidence rate for all cancers combined was highest in Queensland (516 per
100,000) and lowest in the Northern Territory (442 per 100,000).
•
People living in Remote and very remote areas of Australia had 1.3–1.4 times higher
incidence rates of cervical cancer, cancer of unknown primary site and lung cancer
than people living in Major cities, but 0.8–0.9 times lower rates of prostate cancer, breast
cancer in females and non-Hodgkin lymphoma.
•
People living in the lowest socioeconomic status areas had (1.1–1.6 times) higher
incidence rates of cervical cancer, cancer of unknown primary site, lung cancer and
bowel cancer than those living in the highest socioeconomic status areas, but they had
0.8–0.9 times lower rates of non-Hodgkin lymphoma, breast cancer in females and
prostate cancer.
Mortality
In the 5 years from 2006 to 2010:
•
The age-standardised mortality rate was significantly higher for Indigenous than for
non-Indigenous Australians for cervical cancer (4.4 times higher), lung cancer (1.8),
cancer of unknown primary site (1.7), breast cancer in females (1.3) and pancreatic
cancer (1.3).
•
The mortality rate for all cancers combined was highest in the Northern Territory (216
per 100,000) and Tasmania (199 per 100,000) and lowest in the Australian Capital
Territory (163 per 100,000).
•
People living in Remote and very remote areas of Australia had higher mortality rates of
cervical cancer (3.2 times higher), cancer of unknown primary site (1.4), breast cancer
in females (1.3) and lung cancer (1.3) than those living in Major cities.
People living in the lowest socioeconomic areas had higher mortality rates of cervical
cancer (1.8 times higher), lung cancer (1.5), cancer of unknown primary site (1.3) and
bowel cancer (1.1) than those living in the lowest socioeconomic areas.
Survival
In the period 2006–2010:
•
•
Five-year relative survival from all cancers combined decreased with greater
remoteness—from 67% in Major cities to 63% in Remote and very remote areas.
•
Five-year relative survival from all cancers combined decreased with greater
socioeconomic disadvantage—from 71% in the highest socioeconomic status areas to
63% in lowest socioeconomic status areas.
Cancer in Australia: an overview, 2012
51
About differences across population groups
Cancer incidence and mortality data are presented according to four population
characteristics: Aboriginal and Torres Strait Islander status, state and territory, remoteness
area and socioeconomic status. Data are presented for all cancers combined and for nine
selected cancers: bowel cancer, melanoma of the skin, lung cancer, breast cancer in females,
prostate cancer, cervical cancer, pancreatic cancer, non-Hodgkin lymphoma and cancer of
unknown primary site. These cancers are not only among the most commonly diagnosed
(see Chapter 2), but are also among the leading causes of mortality from cancer (see Chapter
3). Some of these cancers are included in the health performance indicator as part of the
National Healthcare Agreement, and are reported annually to the Council of Australian
Governments.
Age-standardised rates are provided for incidence and mortality to account for differences in
the age structure and the size of the population groups. The data are presented for the five
years from 2004 to 2008 for incidence and from 2006 to 2010 for mortality rather than for just
1 year, since presenting the data for multiple years reduces random variation in the rates.
This is especially important for comparisons of small groups (for example, Aboriginal and
Torres Strait Islander people or populations in smaller states and territories). Apart from
breast cancer in females, cervical cancer and prostate cancer, results are presented for males
and females combined in a further attempt to reduce the random variation in the data.
Relative survival data are presented by remoteness area and socioeconomic status. They
were sourced from the AIHW publication Cancer survival and prevalence in Australia: period
estimates from 1982 to 2010 (AIHW 2012d). Relative survival proportions cannot be calculated
according to Aboriginal and Torres Strait Islander status due to data limitations and the lack
of necessary life tables. See Chapter 4 for further information on survival data.
Observed differences by the characteristics examined in this section may result from a
number of factors, including variation in:
•
•
•
population characteristics (for example a relatively greater proportion of Indigenous
people living in remote areas)
the prevalence of risk and/or protective factors (for example tobacco consumption,
physical activity)
the availability and usage of diagnostic services.
The main data source for this chapter was the 2009 ACD and the NMD. The 5 years of
incidence data from 2004 to 2008 was used for this chapter because 2008 is the latest year for
which actual data were available for all states and territories (see Appendix F).
Aboriginal and Torres Strait Islander status
Aboriginal and Torres Strait Islander peoples are disadvantaged across a range of healthrelated and socioeconomic indicators compared with other Australians (AIHW 2011a). They
are more likely to live in remote areas of Australia and have a relatively younger age
structure than the non-Indigenous population. For instance, in 2005–2007, the average life
expectancy at birth was estimated to be about 10–12 years lower for Indigenous people than
other Australians (ABS 2009b).
The disparity in health experienced by Indigenous Australians may be further explained by
differences in socioeconomic status, with Indigenous Australians reporting lower incomes,
52
Cancer in Australia: an overview, 2012
higher rates of unemployment, lower educational attainment and more overcrowded
households than other Australians. Also, cultural, social and environmental factors may
contribute to the poorer health of Indigenous Australians (AIHW 2012a).
Do incidence rates differ for Indigenous Australians?
Reliable national data on the incidence of cancer for Indigenous Australians are not
available. While all state and territory cancer registries collect information on Indigenous
status, in some jurisdictions, the quality of the data is insufficient for analyses. In this report,
data for four states and territories—New South Wales, Queensland, Western Australia and
the Northern Territory—are used to examine the incidence of cancer by Indigenous status.
While the majority (84%) of Australian Indigenous people live in these four jurisdictions
(ABS 2009a), the degree to which data for these jurisdictions are representative of data for all
Indigenous people is unknown.
For the four jurisdictions analysed, the overall level of missing data on Indigenous status for
all cancers combined diagnosed between 2004 and 2008 was 12% (online Table D6.1). It
should be noted, however, that the level of missing data was particularly high for prostate
cancer (16%) and melanoma of the skin (41%). This may be because these cancers are more
likely to be treated outside the hospital setting where the level of Indigenous identification is
generally lower than within the hospital system.
Between 2004 and 2008, an average of 775 Indigenous Australians were diagnosed with
cancer each year—this comprises 1% of all cancer cases diagnosed in that period. Of the nine
selected cancers, lung cancer (average of 121 cases per year) was the most commonly
diagnosed cancer among Indigenous people, followed by breast cancer in females (88 cases
per year) and bowel cancer (70 cases per year).
The age-standardised incidence rate of all cancers combined was significantly higher for
Indigenous Australians than their non-Indigenous counterparts (461 and 434 per 100,000
respectively). This contrasts with the finding in previous editions of this report, where
Indigenous Australians had a lower incidence rate of all cancers combined than nonIndigenous Australians (AIHW & AACR 2010). However, these data by Indigenous status
are not comparable across publications as different sets of states and territories were used.
There was a similar trend for cervical cancer, where the incidence rate was almost 3 times as
high for Indigenous Australians as non-Indigenous Australians (18 and 7 per 100,000
respectively). Incidence rates of cancer of unknown primary site and lung cancer were also
significantly higher for Indigenous Australians than for non-Indigenous Australians (1.9
times for both) (Figure 6.1).
The higher incidence rate of cervical cancer observed for Indigenous Australians is likely to
be associated with lower participation in cervical screening and higher rates of infection with
human papilloma virus (Condon 2004; Condon et al. 2005; Roder 2005), while the higher
incidence rate of lung cancer is consistent with Indigenous Australians’ higher rate of
smoking (Scollo & Winstanley 2008; Stumpers & Thomson 2009). The higher incidence of
cancer of unknown primary site may be related to late diagnosis (ABS & AIHW 2008;
Stumpers & Thomson 2009).
Cancer in Australia: an overview, 2012
53
Rate (per 100,000)
100
90
Indigenous
80
Non-Indigenous
70
60
50
40
30
20
10
0
Cervical
Pancreas
UPS
Lung
Type of cancer
Notes
1.
The rates were age-standardised to the Australian population as at 30 June 2001 and based on the total number of cases over the
5 years from 2004 to 2008.
2.
Some states and territories use an imputation method for determining Indigenous cancers, which may lead to differences between
these data and those shown in jurisdictional cancer incidence reports.
3.
UPS=Cancer of unknown primary site.
4.
Data for this figure are in online Tables D6.4, D6.5, D6.8 and D6.10.
Source: AIHW Australian Cancer Database 2009.
Figure 6.1: Incidence of cervical cancer, pancreatic cancer, cancer of unknown primary site and
lung cancer by Indigenous status, New South Wales, Queensland, Western Australia and the
Northern Territory, 2004–2008
Conversely, incidence rates were significantly lower for Indigenous Australians than nonIndigenous Australians for non-Hodgkin lymphoma, melanoma of the skin, bowel cancer,
breast cancer in females and prostate cancer (Figure 6.2).
The reasons for the lower incidence of some cancers among Indigenous Australians are not
clear. It may either be a true lower incidence (that is, Indigenous Australians are less likely to
develop these cancers) or a lower rate of diagnosis. The former seems most likely for
melanoma of the skin and is consistent with the high level of pigment in the skin of
Indigenous Australians. It is possible that the latter is true for non-Hodgkin lymphoma,
breast cancer in females, bowel cancer and prostate cancer for a number of reasons. NonHodgkin lymphoma, breast cancer in females, bowel cancer and prostate cancer are
primarily diseases that affect older people (see Chapter 2), and the shorter life expectancy of
Indigenous Australians may mean that these cancers may not have presented at the time of
death. Further, the uptake of screening and diagnostics testing (such as breast and bowel
screening and prostate-specific antigen testing) is low among Indigenous people (ABS 2009a;
Condon et al. 2001; Roder 2005; Stumpers & Thomson 2009; Threlfall & Thompson 2009),
which may also contribute to a low rate of diagnosis.
54
Cancer in Australia: an overview, 2012
Rate (per 100,000)
160
Indigenous
140
Non-Indigenous
120
100
80
60
40
20
0
NHL
Melanoma of skin
Bowel
Breast (females)
Prostate
Type of cancer
Notes
1.
The rates were age-standardised to the Australian population as at 30 June 2001 and based on the total number of cases over the
5-year period from 2004 to 2008.
2.
Some states and territories use an imputation method for determining Indigenous cancers, which may lead to differences between
these data and those shown in jurisdictional cancer incidence reports.
3.
NHL=Non-Hodgkin lymphoma.
4.
Data for this figure are in online Tables D6.2, D6.3, D6.6, D6.7 and D6.9.
Source: AIHW Australian Cancer Database 2009.
Figure 6.2: Incidence of non-Hodgkin lymphoma, melanoma of skin, bowel cancer, breast
cancer in females and prostate cancer by Indigenous status, New South Wales, Queensland,
Western Australia and the Northern Territory, 2004–2008
Do mortality rates differ for Indigenous Australians?
Information in the NMD on Indigenous status from 2006 to 2010 is considered to be of
sufficient quality for use for five jurisdictions: New South Wales, Queensland, Western
Australia, South Australia and the Northern Territory. Almost 9 in 10 (89%) Indigenous
people live in these jurisdictions (ABS 2009a). In the NMD, the level of missing data on
Indigenous status for all cancers combined was about 1% (online Table D6.1).
Between 2006 and 2010, there was an annual average of 424 cancer deaths (1% of all deaths
due to cancer), making cancer the second leading cause of death among Indigenous
Australians in that period (ABS 2012a).
Of the selected cancer sites, lung cancer (average of 104 deaths per year), cancer of unknown
primary site, breast cancer in females (27 deaths per year for both) and bowel cancer (22
deaths per year) were the most common causes of cancer death in Indigenous Australians.
The age-standardised mortality rate of all cancers combined was significantly higher for
Indigenous Australians than for their non-Indigenous counterparts (249 and 174 per 100,000
respectively). The higher mortality rate for Indigenous Australians may be explained by their
greater likelihood of being diagnosed with cancers where the prospect of successful
treatment and survival is poorer (for example, lung cancer and cancer of unknown primary
site) (Condon et al. 2003; Threlfall & Thompson 2009) or being diagnosed at an advanced
Cancer in Australia: an overview, 2012
55
stage, as well as a lesser likelihood of receiving adequate treatment (AIHW 2012a;
Cunningham et al. 2008).
The mortality rate was significantly higher for Indigenous than for non-Indigenous
Australians for cervical cancer (4.4 times), lung cancer (1.8), cancer of unknown primary site
(1.7), pancreatic cancer (1.3) and breast cancer in females (1.3) (Figure 6.3).
In contrast, the mortality rate of melanoma of the skin was significantly lower for Indigenous
Australians than for non-Indigenous Australians (0.4 times) (online Table D6.7). There was
no statistically significant difference in the mortality rates of bowel cancer, non-Hodgkin
lymphoma and prostate cancer for Indigenous Australians compared with non-Indigenous
Australians (online Tables D6.2, D6.6 and D6.9).
Rate (per 100,000)
80
Indigenous
70
Non-Indigenous
60
50
40
30
20
10
0
Cervical
Pancreas
UPS
Breast (females)
Lung
Type of cancer
Notes
1.
The rates were age-standardised to the Australian population as at 30 June 2001 and based on the total number of deaths over
the 5-year period from 2006 to 20010.
2.
Mortality data for 2009 and 2010 are revised and preliminary, respectively, and are subject to further revision.
3.
Data for this figure are in online Tables D6.3, D6.4, D6.5, D6.8 and 6.10.
4.
UPS=Cancer of unknown primary site.
Source: AIHW National Mortality Database.
Figure 6.3: Mortality from cervical cancer, pancreatic cancer, cancer of unknown primary site,
breast cancer in females and lung cancer by Indigenous status, New South Wales,
Queensland, Western Australia, South Australia and the Northern Territory, 2006–2010
State and territory
Do incidence rates differ by state and territory?
Between 2004 and 2008, the average annual number of cancer cases diagnosed ranged from
35,771 cases in New South Wales to 567 cases in the Northern Territory (Table 6.1).
When the size and age structure of the population in each state and territory was taken into
account, the highest incidence rates of all cancers combined was in Queensland (516 per
100,000), followed by Tasmania (510 per 100,000), with both of these rates significantly
higher than that of the other states and territories. In contrast, the incidence rate was lowest
in the Northern Territory (442 per 100,000) and the Australian Capital Territory (461 per
100,000).
56
Cancer in Australia: an overview, 2012
Table 6.1: Incidence of all cancers combined(a) by state and territory, Australia, 2004–2008
State or territory
Average annual
number of cases(b)
Total number
of cases
Age-standardised
rate(c)
95% confidence
interval
New South Wales
35,771
178,857
487.1
484.9–489.4
Victoria
26,070
130,349
476.9
474.3–479.5
Queensland
21,314
106,568
515.6
512.5–518.7
Western Australia
9,812
49,060
480.1
475.9–484.4
South Australia
8,768
43,842
479.4
474.9–483.9
Tasmania
2,875
14,373
509.6
501.3–518.1
Australian Capital Territory
1,364
6,818
461.4
450.4–472.7
567
2,833
442.3
423.0–462.1
106,540
532,700
488.2
486.9–489.5
Northern Territory
Total
(a)
Cancers coded in ICD-10 as C00–C97, D45, D46, D47.1 and D47.3, with the exception of those C44 codes that indicate a basal or
squamous cell carcinoma of the skin.
(b)
Numbers may not sum to the total due to rounding.
(c)
The rates were age-standardised to the Australian population as at 30 June 2001 and are expressed per 100,000 population. The rates
were based on the total number of cases over the 5 years from 2004 to 2008.
Source: AIHW Australian Cancer Database 2009.
The age-standardised incidence rates for selected cancer sites varied widely according to
state and territory in 2004 to 2008. Particularly notable variations were evident for cervical
cancer, lung cancer and cancer of unknown primary site, where the incidence rates for the
Northern Territory were 1.2–2.2 times higher than that for other jurisdictions (online Tables
D6.4, D6.5 and D6.10).
Do mortality rates differ by state and territory?
The average annual number of deaths from cancer ranged from 13,792 in New South Wales
to 238 in Northern Territory between 2006 and 2010. The age-standardised mortality rate of
all cancers combined was significantly lower for the Australian Capital Territory (163 per
100,000) than for other states and territories. In contrast, the highest mortality rates were
observed for the Northern Territory (216 per 100,000) and Tasmania (199 per 100,000), with
both of these rates significantly higher than other states and territories (Table 6.2).
Cancer in Australia: an overview, 2012
57
Table 6.2: Mortality from all cancers combined(a) by state and territory, Australia, 2006–2010(b)
Average annual
number of deaths(d)
Total number
of deaths
Age-standardised
rate(e)
95% confidence
interval
New South Wales
13,792
68,958
175.4
174.0–176.7
Victoria
10,414
52,071
176.8
175.3–178.4
Queensland
7,725
38,624
177.3
175.6–179.1
Western Australia
3,748
18,738
174.8
172.3–177.4
South Australia
3,567
17,837
177.7
175.0–180.3
Tasmania
1,199
5,996
198.9
193.8–204.0
Australian Capital Territory
484
2,419
163.1
156.6–169.8
Northern Territory
238
1,189
215.6
201.5–230.3
41,166
205,832
176.9
176.1–177.6
State or territory(c)
Total
(a)
Cancers coded in ICD-10 as C00–C97, D45, D46, D47.1 and D47.3.
(b)
Mortality data for 2009 and 2010 are revised and preliminary, respectively, and are subject to further revision.
(c)
Mortality data may not be comparable with mortality data published in state and territory cancer reports since the data shown in this report
relate to the place of residence at the time of death, not the place of residence at the time of diagnosis as shown in some state and territory
reports. Further, the state and territory cancer registries may use a different methodology from that used by the AIHW to determine the
cause of death (see Box 6.1).
(d)
Numbers may not sum to the total due to rounding.
(e)
The rates were age-standardised to the Australian population as at 30 June 2001 and are expressed per 100,000 population. The rates
were based on the total number of deaths over the 5 years from 2006 to 2010.
Source: AIHW National Mortality Database.
The age-standardised mortality rates of some cancers showed greater variability between
states and territories. For cervical cancer, the mortality rate of the Northern Territory (4 per
100,000) was almost 3 times the rate of Victoria (1.5 per 100,000). The mortality rate of lung
cancer in the Northern Territory was twice the mortality rate of the Australian Capital
Territory (52 and 26 per 100,000 respectively). For melanoma of the skin, the mortality rate of
Queensland was 2.5 times that of the Northern Territory (7.2 and 2.7 per 100,000
respectively) (online Table D6.4).
Box 6.1: Differences in mortality data reported by state and territory
The state and territory data on mortality due to cancer shown in this report may not be
comparable with data published by individual state and territory cancer registries for a
number of reasons, including (Cancer Council Queensland 2011; Tracey et al. 2010):
58
•
The state and territory mortality data in this report refer to the place of a person’s
residence at the time of death. In contrast, some state and territory cancer registries
present mortality information based on a person’s place of residence at the time of
diagnosis. In the latter data, the deaths may or may not have occurred in the state or
territory indicated.
•
Different approaches were used to assign cause of death. In this report, data on
mortality for each jurisdiction were derived from the NMD (see Appendix I).
Information on cause of death in the NMD is coded by the Australian Bureau of
Statistics. This process uses an automated coding system which selects the underlying
cause of death from all the information documented on the death certificate. In
contrast, the state and territory cancer registries may make use of information from a
number of different sources, including pathology reports and other notifications, to
assign a cause of death.
Cancer in Australia: an overview, 2012
Remoteness area
People living in remote areas of Australia are often disadvantaged in relation to access to
primary health-care services, educational and employment opportunities and income.
Further, they are more likely to have higher rates of risky health behaviours, such as
smoking, heavy alcohol use and poor nutrition (AIHW 2012a).
To compare incidence, mortality and survival rates according to the level of remoteness area
of residence at diagnosis, the Australian Standard Geographical Classification Remoteness
Area classification (ABS 2006) was used to allocate remoteness categories to areas across
Australia (AIHW 2004). More information about this classification is in Appendix E. This
classification divides all areas into five categories: Major cities, Inner regional, Outer regional,
Remote and Very remote (AIHW 2004). For this report, the categories of Remote and Very
remote were collapsed due to the small number of cases in these two subgroups.
Do incidence rates differ by remoteness area?
Between 2004 and 2008, the age-standardised incidence rate of all cancers combined was
significantly higher in Inner regional (504 per 100,000) than other areas.
Variation by geographical region of residence was also evident for the selected cancers. Inner
regional areas of Australia had higher incidence rates of bowel cancer, melanoma of the skin
and prostate cancer. For these cancers, the lowest rates were observed for people living in
Remote and very remote areas at the time of diagnosis (online Tables D6.2, D6.6 and D6.9).
The incidence rates of breast cancer in females and non-Hodgkin lymphoma decreased with
remoteness, with Remote and very remote areas 0.8–0.9 times the rate in Major cities
respectively (Figure 6.4).
Rate (per 100,000)
140
Major cities
120
Inner regional
100
Outer regional
Remote and Very remote
80
60
40
20
0
Breast (females)
NHL
Type of cancer
Notes
1.
Remoteness was classified according to the Australian Standard Geographical Classification (ASGC) Remoteness Areas
(see Appendix E).
2.
The rates were age-standardised to the Australian population as at 30 June 2001 and based on the total number of cases over
the 5 years from 2004 to 2008.
3.
NHL=Non-Hodgkin lymphoma.
4.
Data for this figure are in online Tables D6.3 and D6.7.
Source: AIHW Australian Cancer Database 2009.
Figure 6.4: Incidence of prostate cancer, breast cancer in females and non-Hodgkin lymphoma
by remoteness area, Australia, 2004–2008
Cancer in Australia: an overview, 2012
59
The incidence rates of cervical cancer, cancer of unknown primary site and lung cancer
increased with remoteness. People living in Remote and very remote areas had 1.4 times the
rate of cervical cancer and cancer of unknown primary site, and 1.3 times the rate of lung
cancer than those living in Major cities (Figure 6.5).
Rate (per 100,000)
70
60
50
40
Major cities
Inner regional
Outer regional
Remote and Very remote
30
20
10
0
Cervical
UPS
Lung
Type of cancer
Notes
1.
Remoteness was classified according to the Australian Standard Geographical Classification (ASGC) Remoteness Areas
(see Appendix E).
2.
The rates were age-standardised to the Australian population as at 30 June 2001 and based on the total number of cases over the
5 years from 2004 to 2008.
3.
UPS=Cancer of unknown primary site.
4.
Data for this figure are in online Tables D6.4, D6.5 and D6.10.
Source: AIHW Australian Cancer Database 2009.
Figure 6.5: Incidence of cervical cancer, cancer of unknown primary site and lung cancer by
remoteness area, Australia, 2004–2008
Do mortality rates differ by remoteness area?
Between 2006 and 2010, the age-standardised mortality rate of all cancers combined was
significantly higher in Remote and very remote areas (196 per 100,000) than in Major cities (171
per 100,000) (online Table D6.1).
The mortality rates of cervical cancer, cancer of unknown primary site, breast cancer in
females and lung cancer increased with remoteness (Figure 6.6). People living in Remote and
very remote areas had 3.2 times the mortality rate of cervical cancer, 1.4 times the rate of
cancer of unknown primary site and 1.3 times the rate of lung cancer and breast cancer in
females than those living in Major cities.
Some of the differences in mortality from cervical cancer, cancer of unknown primary site,
breast cancer in females and lung cancer may be explained by the high proportion of
Indigenous people who live in more remote areas and who have higher mortality rates than
non-Indigenous people from these cancers (see section about Aboriginal and Torres Strait
Islander status).
For prostate cancer, bowel cancer, pancreatic cancer, non-Hodgkin lymphoma and
melanoma of the skin, particularly high mortality rates were observed for those who lived in
Inner or Outer regional areas (online Tables D6.2, D6.6–D6.9).
60
Cancer in Australia: an overview, 2012
Rate (per 100,000)
50
45
Major cities
40
Inner regional
35
30
25
Outer regional
Remote and Very remote
20
15
10
5
0
Cervical
UPS
Breast (females)
Lung
Type of cancer
Notes
1.
Remoteness was classified according to the Australian Standard Geographical Classification (ASGC) Remoteness Areas (see
Appendix E).
2.
Mortality data for 2009 and 2010 are revised and preliminary, respectively, and are subject to further revision.
3.
The rates were age-standardised to the Australian population as at 30 June 2001 and based on the total number of deaths over
the 5 years from 2006 to 2010.
4.
UPS=Cancer of unknown primary site.
5.
The data for this figure are in online Tables D6.3, D6.4, D6.5 and D6.10.
Source: AIHW National Mortality Database.
Figure 6.6: Mortality from cervical cancer, cancer of unknown primary site, breast cancer in
females and lung cancer by remoteness area, Australia, 2006–2010
Does survival differ by remoteness area?
In the period 2006–2010, 5-year survival from all cancers combined was higher in Major cities
compared with other areas; similar trend was observed for bowel cancer, breast cancer in
females and lung cancer.
Melanoma of skin had a higher 5-year survival in Remote and very remote areas than in other
areas (Figure 6.7).
Cancer survival outcomes may vary across regions due to differences in the age at diagnosis,
the extent of disease at diagnosis and cancer histology and subtypes. The effects of these
covariates on survival have been modelled and further explored in other Australian reports
(English et al. 2007; Tracey et al. 2010).
Cancer in Australia: an overview, 2012
61
5-year relative survival (%)
100
Major cities
Inner regional
Outer regional
Remote and Very remote
90
80
70
60
50
40
30
20
10
0
All cancers
combined
Bowel
Lung
Melanoma of
skin
Breast
(females)
Prostate
NHL
Notes
1.
Remoteness is classified according to the Australian Standard Geographical Classification (ASGC) Remoteness Areas
(see Appendix E).
2.
NHL=Non-Hodgkin lymphoma.
3.
Data for this figure are in online Table D6.11
Source: AIHW Australian Cancer Database 2007.
Figure 6.7: Five-year relative survival from selected cancers by remoteness area, Australia,
2006–2010
Socioeconomic status
Socioeconomic status is associated with access to health services, material resources and
educational opportunities. Persons of a lower socioeconomic status are more likely to have
higher levels of cancer and lifestyle related risk factors, such as physical inactivity, tobacco
use and poor diet (AIHW 2012a).
The Index of Relative Socio-economic Disadvantage (IRSD) is used to indicate socioeconomic
status. The IRSD scores each area by summarising attributes of the population such as low
income, low educational attainment, high unemployment and jobs in relatively unskilled
occupations. In this report, the first socioeconomic status group (labelled ‘1’) corresponds to
geographical areas containing the 20% of the population with the lowest socioeconomic
status, and the fifth group corresponds to the 20% of the population with the highest
socioeconomic status. Note that the IRSD is an area-based measure of socioeconomic status
rather than a person-based measure. It is used as a proxy for the socioeconomic status of
people living in those areas and would not be correct for each person living in that area.
More information is in Appendix E.
Do incidence rates differ by socioeconomic status?
Between 2004 and 2008, the age-standardised incidence rate of all cancers combined showed
that people living in lower socioeconomic status areas (group 1 to 3) had a higher incidence
rate than those living in higher socioeconomic status areas (group 4 and 5) (online Table
D6.1).
62
Cancer in Australia: an overview, 2012
People living in the lowest socioeconomic status areas (group 1) had 1.1–1.6 times higher
incidence rates of cervical cancer, cancer of unknown primary site, lung cancer and bowel
cancer than those living in the highest socioeconomic status areas (group 5), but they had
0.8–0.9 times lower rates of non-Hodgkin lymphoma, breast cancer in females and prostate
cancer (Figure 6.8).
Rate (per 100,000)
250
Group 1 (lowest)
Group 2
Group 3
Group 4
Group 5 (highest)
200
150
100
50
0
NHL
Breast (females)
Prostate
Type of cancer
Notes
1.
Socioeconomic status was classified using the ABS Index of Relative Socio-economic Disadvantage (see Appendix E).
2.
The rates were age-standardised to the Australian population as at 30 June 2001 and based on the total number of cases over the
5-year period from 2004 to 2008.
3.
NHL=Non-Hodgkin lymphoma.
4.
Data for this figure are in online Tables D6.3, D6.7 and D6.9.
Source: AIHW Australian Cancer Database 2009.
Figure 6.8: Incidence of non-Hodgkin lymphoma, breast cancer in females and prostate
cancer by socioeconomic status, Australia, 2004–2008
People living in the lowest socioeconomic status areas had higher incidence rates of cervical
cancer, cancer of unknown primary site, lung cancer and bowel cancer (Figure 6.9). Of
particular note, the incidence rate of lung cancer for people living in the lowest
socioeconomic status areas was 1.6 times the rate for those living in the highest
socioeconomic status areas.
For melanoma of the skin and pancreatic cancer, the association with socioeconomic status
was either inconsistent or non-existent (online Tables D6.6 and D6.8).
Cancer in Australia: an overview, 2012
63
Rate (per 100,000)
70
Group 1 (lowest)
Group 2
Group 3
Group 4
Group 5 (highest)
60
50
40
30
20
10
0
Cervical
UPS
Lung
Bowel
Type of cancer
Notes
1.
Socioeconomic status was classified using the ABS Index of Relative Socio-economic Disadvantage (see Appendix E).
2.
The rates were age-standardised to the Australian population as at 30 June 2001 and based on the total number of cases over the
5 years from 2004 to 2008.
3.
UPS=Cancer of unknown primary site.
4.
Data for this figure are in online Tables D6.2, D6.4, D6.5 and D6.10.
Source: AIHW Australian Cancer Database 2009.
Figure 6.9: Incidence of cervical cancer, cancer of unknown primary site, lung cancer and
bowel cancer by socioeconomic status, Australia, 2004–2008
Do mortality rates differ by socioeconomic status?
Between 2006 and 2010, for all cancers combined, people living in the lowest socioeconomic
status areas had significantly higher mortality rates (1.1 times) than those living in the
highest socioeconomic status areas (online Table D6.1).
There was a gradient between age-standardised mortality rate and the level of
socioeconomic status for four of the nine selected cancers (Figure 6.10). Specifically, people
living in the lowest socioeconomic areas had higher mortality rates of cervical cancer (1.8
times higher), lung cancer (1.5), cancer of unknown primary site (1.3) and bowel cancer (1.1)
than those living in the highest socioeconomic areas. The largest relative difference in
mortality rate across socioeconomic groups was for cervical cancer, where the mortality rate
for people living in the lowest socioeconomic areas was almost double the rate for people
living in the highest socioeconomic status areas (2.2 and 1.2 per 100,000 respectively).
64
Cancer in Australia: an overview, 2012
Rate (per 100,000)
40
35
Group 1 (lowest)
Group 2
Group 3
30
Group 4
25
Group 5 (highest)
20
15
10
5
0
Cervical
UPS
Bowel
Lung
Type of cancer
Notes
1.
Socioeconomic status was classified using the ABS Index of Relative Socio-economic Disadvantage (see Appendix E).
2.
Mortality data for 2009 and 2010 are revised and preliminary, respectively, and are subject to further revision.
3.
The rates were age-standardised to the Australian population as at 30 June 2001 and based on the total number of deaths over the
5 years from 2006 to 2010.
4.
UPS=Cancer of unknown primary site.
5.
Data for this figure are in online Tables D6.2, D6.4, D6.5 and D6.10.
Source: AIHW National Mortality Database.
Figure 6.10: Mortality from cervical cancer, cancer of unknown primary site, bowel cancer and
lung cancer by socioeconomic status, Australia, 2006–2010
Does survival differ by socioeconomic status?
Some cancers demonstrated survival differences by socioeconomic status of the area of
residence at diagnosis. In the period 2006–2010, 5-year survival from all cancers combined
was significantly higher in the highest socioeconomic status areas compared with the lowest
areas. Similar trends can be observed for other selected cancers, including bowel cancer, lung
cancer, breast cancer in females, prostate cancer and non-Hodgkin lymphoma (Figure 6.11).
Notably in males, prostate cancer had significantly higher survival in the highest
socioeconomic status areas than for other areas. This may be related to PSA testing, which
may be more prevalent in socioeconomically advantaged population groups (Brenner &
Arndt 2004) and which can lead to earlier detection.
Differences in survival may be affected by the overlap between remoteness and
socioeconomic status. For example, an earlier report showed that almost 30% of people with
cancer in Remote and Very remote areas lived in areas of the lowest socioeconomic status,
while almost 95% of people with cancer in the highest socioeconomic status areas lived in
Major cities (AIHW et al. 2008).
Cancer in Australia: an overview, 2012
65
5-year relative survival (%)
100
90
80
Group 1 (lowest)
Group 2
Group 3
Group 4
Group 5 (highest)
70
60
50
40
30
20
10
0
All cancers
combined
Bowel
Lung
Melanoma of
skin
Breast
(females)
Prostate
Notes
1.
Socioeconomic status is classified according to the ABS Socio-Economic Indexes for Areas (SEIFA) Index of Relative
Socio-economic Disadvantage (see Appendix E).
2.
NHL=Non-Hodgkin lymphoma.
3.
Data for this figure are in online Table D6.12.
Source: AIHW Australian Cancer Database 2007.
Figure 6.11: Five-year relative survival from selected cancers by socioeconomic status,
Australia, 2006–2010
66
Cancer in Australia: an overview, 2012
NHL
7
Burden of disease due to cancer
Key findings
In 2012 in Australia,
•
In males, lung cancer is expected to be the leading cause of the burden of disease due
to cancer.
•
In females, breast cancer is expected to be the leading cause of the burden of disease
due to cancer.
•
Cancer is estimated to be the leading cause of the burden of disease in Australia,
accounting for about 19% of the total burden.
•
Males are expected to account for more of the total burden of disease due to cancer
than females (53% compared with 47%).
•
The majority of cancers are expected to contribute more years of life lost to premature
death than years of healthy life lost to disease, disability or injury.
Cancer in Australia: an overview, 2012
67
About burden of disease
Burden of disease analysis is a technique used to assess and compare the fatal and non-fatal
effects of different diseases (such as prostate cancer) among population groups and over
time. It combines data around premature death, measured by the years of life lost (YLL) and
non-fatal health outcomes, measured by years lost due to disability (YLD) into a summary
measure called the DALY (disability-adjusted life years). This allows the effects of different
diseases (such as cancer) and injures to be compared on an equal basis.
The DALY uses time as a common currency. One DALY is one year of ‘healthy life’ lost due
to premature death, prolonged illness or disability. The more DALYs associated with a
particular disease, the greater the burden (see Box 7.1 for more details). The main advantage
of DALYs is that they give weight to health problems that cause substantial illness and
disability even if they are not fatal. Further information about DALYs is in The burden of
disease and injury in Australia (Begg et al. 2007) and Appendix I.
The most recent national burden of disease analysis, based on 2003 data, was conducted by
the AIHW and the University of Queensland (Begg et al. 2007). Since then no updates have
been made to the national data. However, projections that were calculated as part of the 2003
study provide estimates of updated national burden of disease, and this has been used in this
chapter.
This chapter presents 2012 estimated burden of disease in Australia for selected cancers and
all cancers combined. Although sophisticated statistical methods were used to produce the
projected results, caution should be taken when interpreting these results because of
uncertainties about how incidence, mortality and other factors might change over time
(AIHW 2012a).
Note that in this section of the report, some cancer groupings are defined differently from
that used in most other sections of this report (see Appendix I).
Box 7.1: What is a ‘DALY’?
One disability-adjusted life year or ‘DALY’ is one year of ‘healthy life’ lost due to a disease
or injury. To illustrate the basic concept, a person who has been healthy all their life but
who suddenly dies of a heart attack 20 years early than expected has lost 20 years of healthy
life—20 DALYs. For a person who lives to a normal old age but has been only ‘half-well’ for
30 years, there are 15 DALYs lost. Using information about the duration and severity of
diseases and injuries in individuals, and the pattern of these conditions among the
community, DALYs can be added up for each problem (for example, breast cancer) and also
combined to give a grand total for a specific disease group, such as cancer (AIHW 2012a).
What is estimated burden of disease due to cancer
in 2012?
In 2012, the total burden of disease in Australia is estimated to be more than 2.9 million
DALYs, with males accounting for slightly more of this burden than females (1.5 million
compared with 1.4 million).
68
Cancer in Australia: an overview, 2012
Cancer is estimated to be the leading cause of the burden of disease in Australia (19% of the
total DALYs), followed by cardiovascular disease (16%), nervous system and sense organ
disorders (14%), mental disorders (13%) and diabetes (7%).
Which cancers were the leading causes of burden of disease?
In males, lung cancer is expected to be the leading cause of the burden of disease due to
cancer (57,300 DALYs) in 2012, followed by prostate cancer (44,300) and bowel cancer
(38,800) (Table7.1). Together, these cancers are expected to account for almost half (48%) of
the total burden of disease due to cancer and for 9% of all male burden of disease. In terms of
the leading causes of burden of disease for males, lung, prostate and bowel cancer are
expected to rank fourth, eighth and eleventh, respectively.
In females, the leading contributors to the female burden of disease due to cancer in 2012 are
expected to be breast cancer (61,300 DALYs), lung cancer (43,400) and bowel cancer (30,700).
These cancers are estimated to account for about 53% of the total burden of disease due to
cancer in females and for about 10% of all female burden of disease. In terms of the leading
causes of burden of disease for females, breast, lung and bowel cancer are expected to rank
sixth, seventh and tenth, respectively.
Table 7.1: Estimated leading cancer causes of burden of disease, Australia, 2012(a)
Males
DALYs(b)
Site/type
% of
cancer
burden
Females
% of
total
burden
Rank
DALYs(b)
Site/type
% of
cancer
burden
% of
total
burden
Rank
Lung
57,300
19
4
4
Breast
61,300
24
4
6
Prostate
44,300
15
3
8
Lung
43,400
17
3
7
Bowel
38,800
13
3
11
Bowel
30,700
12
2
10
Melanoma
15,700
5
1
23
Ovary
13,200
5
1
26
Lymphoma
14,700
5
1
25
Pancreas
12,700
5
1
28
Leukaemia
13,000
4
1
30
Lymphoma
12,600
5
1
29
Pancreas
12,800
4
1
32
Leukaemia
9,300
4
1
34
Brain
12,600
4
1
33
Brain
9,000
4
1
36
Oesophagus
10,600
4
1
38
Melanoma
7,100
3
1
44
8,900
3
1
43
Kidney
5,500
2
0
56
256,900
100
18
..
100
..
Kidney
All cancers
(c)
All causes
(a)
(c)
294,400
100
20
..
All cancers
1,497,600
..
100
..
All causes
1,413,000
The estimates are projected from a 2003 baseline. See Appendix I for further details.
(b)
The estimates are rounded to the nearest 100.
(c)
Includes cancers coded in ICD-10 as C00–C96.
Source: AIHW Burden of Disease Database.
Cancer in Australia: an overview, 2012
69
Differences by sex
In 2012, males is expected to account for more of the total burden of disease due cancer than
females (53% compared with 47%). Apart from the sex-specific cancers (that is, prostate,
testicular, ovarian, cervical and uterine cancer), considerably differences in the experience of
burden from cancer between the sexes are expected in 2012 (Figure 7.1). Males are expected
to have a greater share of the burden of disease from the majority of individual cancer sites,
with the imbalance expected to be greatest for laryngeal cancer (87% compared with 13%). In
contrast, females are expected to have a greater share of the burden of disease from cancer of
the gallbladder, thyroid cancer and breast cancer.
Per cent
Females
100
Males
80
60
40
20
0
Notes
1.
The estimates are projected from a 2003 baseline. See Appendix I for further details.
2.
The data for this figure are in online Table D7.1.
Source: AIHW Burden of Disease Database.
Figure 7.1: Proportion by sex for estimated leading cancer causes of burden of disease,
Australia, 2012
70
Cancer in Australia: an overview, 2012
Burden due to years of life lost and years of life lost to disability
In this section, information on the leading cause of disease burden for males is presented by
the extent of burden due to premature death (YLL) and due to disease, disability or injury
(YLD). For cancer, causes of YLD include side effects during and after treatment (for example
during and after radiotherapy or chemotherapy) and the psychosocial affects after diagnosis
and treatment.
In 2012, cancers as a group is expected to account for about 34% (457,400 YLLs) of the total
years of life lost to premature death and 6% (93,900 YLDs) of the total years of healthy life
lost due to disability. Lung, bowel and breast cancer are expected to result in the highest
number of years lost to premature death (Figure 7.2). Together, these three cancers are
expected to account for 14% of total years of life lost to premature death. Meanwhile, breast,
prostate and bowel cancer are expected to account for the highest number of years lost due
to disability, with these three cancers combined expected to account for 3% of the total years
of healthy life lost due to disability.
Due to the relatively poor prognosis for many cancers compared with other diseases, most
cancers contribute more years of life lost to premature death than years of healthy life lost to
disease, disability or injury. In 2012, this discrepancy is expected to be most marked for
pancreatic and liver cancer, with close to 100% of the burden from these cancers coming from
years of life lost due to premature death (97% for pancreatic cancer and 98% for liver cancer).
Disability-adjusted life years (DALYs)
Years of healthy life lost (YLD)
100,000
Years of life lost (YLL)
80,000
60,000
40,000
20,000
0
Notes
1.
Liver cancer excludes hepatitis B- and C-related liver cancers.
2.
Breast cancer pertains to breast cancer in females only.
3.
The data for this figure are in online Table D7.2.
Source: AIHW Burden of Disease database.
Figure 7.2: Estimated burden of disease due to cancer, by fatal and non-fatal components,
Australia, 2012
Cancer in Australia: an overview, 2012
71
8
Hospitalisations and palliative care for
cancer
Key findings
In the 2010–11 financial year in Australia:
•
Cancer was responsible for 1 in 10 of all hospitalisations.
•
Three-quarters (75%) of cancer-related hospitalisations were for same-day care.
•
Cancer patients accounted for 2.31 million patient days.
•
When same-day hospitalisations were excluded, the average length of stay was 7.6
days.
•
Non-melanoma skin cancer was the most common cancer type recorded as the primary
reason for hospitalisation, with about 95,000 hospitalisations.
•
Chemotherapy was the most common type of other cancer-related hospitalisation, with
about 350,000 hospitalisations.
Between 2001–02 and 2010–11:
•
The number of all cancer-related hospitalisations has increased by 36% (from 649,352
to 880,432).
•
The age-standardised rate of all cancer-related hospitalisations increased by 10%, from
311 per 10,000 (in 2001–02) to 364 per 10,000 (in 2010–11).
In the 2009–10 financial year in Australia:
•
72
Cancer was the most common principal diagnosis for palliative care separations,
accounting for 33,278 of these hospitalisations (59%).
Cancer in Australia: an overview, 2012
About hospitalisations
The extent of hospitalisation for cancer is an important indicator of the burden of cancer on
the Australian population. Hospital morbidity data provide information on people requiring
hospitalisation as an admitted patient for a variety of reasons including both diagnostic
procedures and treatment. The number of such hospitalisations for cancer in any 1 year is
related not only to the number of people with cancer, but also to the number of cancerrelated health services requiring admission to hospital. Other factors that may influence the
number of cancer-related hospitalisations in any 1 year include the availability of alternative
health-care services, relative accessibility of hospital care, admission criteria and
administrative policies.
In this chapter, a summary is provided on the number of admitted patient hospitalisations
that are related to the care and/or treatment of persons with cancer. The data source for this
chapter was the National Hospital Morbidity Database (NHMD), which contains data on
admitted patient hospitalisations. Note that the data from the NHMD refer to
hospitalisations and not individuals. Any person may have multiple hospitalisations during
the course of a year but data on the number of people hospitalised for a particular disease are
not available. The most recent data available relate to the 2010–11 financial year. Further
information about the NHMD is in Appendix I and in AIHW’s annual Australian hospital
statistics reports (AIHW 2012b).
There are two distinct types of diagnosis recorded in the NHMD—principal diagnosis and
additional diagnosis (see Box 8.1 for definitions). The principal and additional diagnoses are
coded using the International statistical classification of diseases and related health problems, tenth
revision, Australian modification (ICD-10-AM), 7th edition. The diagnosis can include a disease
or a specific treatment for a current condition. Where a treatment is recorded as the principal
diagnosis, the disease being treated is usually recorded as an additional diagnosis (NCCH
2010).
As discussed in more detail in Appendix J, cancer-related hospitalisations are defined in this
report (unless stated otherwise) as admitted patient hospitalisations in which:
•
cancer was recorded as the principal diagnosis (ICD-10 AM codes C00–C97, D45, D46,
D47.1 and D47.3)
or
•
cancer was recorded as an additional diagnosis where the principal diagnosis code
related specifically to health services or treatments of patients with cancer (such as Z51.1
Pharmacotherapy session for neoplasm).
For the purposes of this report, hospitalisations with a principal diagnosis of cancer are
called ‘Cancer as principal diagnosis’ whereas those hospitalisations with principal
diagnoses related to health services or treatments (such as follow-up care or screening) of
cancer are called ‘Other cancer-related principal diagnosis’. See Appendix J for further
details on the classification of cancer-related hospitalisations.
Over the last decade, a number of public hospitals in New South Wales, South Australia and
the Australian Capital Territory changed their admissions practices so that not all patients
who receive same-day chemotherapy treatment were admitted to hospital. Instead, these
hospitals provided chemotherapy treatment on an outpatient (that is, non-admitted patient)
basis. This change must be taken into account when interpreting numbers and rates in this
report (see Appendix I).
Cancer in Australia: an overview, 2012
73
This chapter discusses the total number of cancer-related hospitalisations and provides
information on cancer-related palliative care hospitalisations.
Box 8.1: Summary of terms used in the hospitalisation chapter?
Admitted patient: a patient who undergoes a hospital’s formal admission process to receive
treatment and/or care. This treatment and/or care is provided over a period of time and
can occur in hospital and/or in the person’s home (for hospital-in-the-home patients)
Hospitalisation: refers to an episode of care for an admitted patient, which can be a total
hospital stay (from admission to discharge, transfer or death), or a portion of a hospital stay
beginning or ending in a change of type of care (for example, from acute to rehabilitation).
A hospitalisation is classified as same-day when a patient is admitted and separates (that is,
the process by which an admitted patient completes an episode of care either by being
discharged, dying, transferring to another hospital or changing type of care) on the same
date. A hospitalisation is classified as overnight when a patient is admitted to and separated
from the hospital on different dates.
Average length of stay (ALOS): is the average number of patient days for admitted patient
episodes. Patients admitted and separated on the same day are allocated a length of stay of
1 day.
Principal diagnosis: is the diagnosis established after study to be chiefly responsible for
occasioning the patient‘s episode of admitted patient care.
Additional diagnosis: is a condition or complaint that either coexists with the principal
diagnosis or arises during the episode of care. Additional diagnoses are reported if the
conditions affect patient management.
Palliative care: is care in which the clinical intent or treatment goal is primarily quality of
life for a patient with an active, progressive disease with little or no prospect of cure. It is
usually evidenced by an interdisciplinary assessment and/or management of the physical,
psychological, emotional and spiritual needs of the patient; and a grief and bereavement
support service for the patient and their carers/family.
How many hospitalisations occurred in 2010–11?
In the 2010–11, there were 880,432 cancer-related hospitalisations. Cancer was responsible for
1 in 10 hospitalisations in Australia. Three-quarters (75%) of the total number of
hospitalisations for cancer were same-day hospitalisations (Table 8.1).
Table 8.1: Number of hospitalisations, persons, Australia, 2010–11
All cancer-related hospitalisations
(a)
Per cent of total cancer-related hospitalisations
(b)
All hospitalisations
Overnight
Total
664,556
215,876
880,432
75.5
24.5
100.0
5,120,417
3,732,133
8,852,550
(a)
Hospitalisations in which (i) the principal diagnosis is cancer (ICD-10-AM codes C00–C97, D45, D47.1 and D47.3), or (ii) the principal
diagnosis is a health service or treatment that may be related to treatment of cancer (see Appendix J).
(b)
ICD-10-AM codes A00–Z89.
Source: AIHW National Hospital Morbidity Database.
74
Same-day
Cancer in Australia: an overview, 2012
How long did cancer patients stay in hospital?
In 2010–11, cancer patients accounted for 2.31 million patient days (8.6% of all
hospitalisations). When same-day hospitalisations were excluded, the crude average length
of stay for overnight cancer-related hospitalisations was 7.6 days. This is longer than the
overnight average length of stay for all hospitalisations (5.8 days) (Table 8.2).
Table 8.2: Average length of stay (days) for cancer-related overnight hospitalisations, persons,
Australia, 2010–11
Overnight ALOS
All cancer-related hospitalisations
(a)
7.6
(b)
All hospitalisations
5.8
(a)
Hospitalisations in which (i) the principal diagnosis is cancer (ICD-10-AM codes C00–C97, D45, D47.1 and D47.3), or (ii) the principal
diagnosis is a health service or treatment that may be related to treatment of cancer (see Appendix J).
(b)
ICD-10-AM codes A00–Z89.
Source: AIHW National Hospital Morbidity Database.
In 2010–11, the five cancer types with the longest average length of stay (excluding same-day
hospitalisations) were acute myeloid leukaemia (17.5 days), Kaposi sarcoma (14.8 days),
brain cancer, cancer of the small intestine (11.9 days), and myeloma (11.4 days).
Which cancers and related treatments lead to the most
hospitalisations?
Due to the way in which hospital morbidity data is coded, not all cancer-related
hospitalisations can be classified by a specific cancer type. In many instances, those
hospitalisations for health services related to cancer do not specify the type of cancer, or
specify multiple cancers as responsible. As such, examination of cancer types responsible for
hospitalisations in Australia are confined to those hospitalisations where cancer is listed as
the principal diagnosis. For other cancer-related hospitalisations, variations are examined by
treatment type.
Cancer as a principal diagnosis
The 10 types of cancer most commonly recorded in Australia as the primary reason for
hospitalisation for 2010–11 are listed in Table 8.3. Non-melanoma skin cancer was the most
common cause of hospitalisations with cancer as principal diagnosis. It accounted for 11% of
all cancer-related hospitalisations. This was followed by cancer of secondary site, prostate,
bowel and breast cancers.
Cancer in Australia: an overview, 2012
75
Table 8.3: Ten most common hospitalisations with a principal diagnosis of cancer, persons,
Australia, 2010–11
Principal Diagnosis (ICD-10-AM codes)
Same-day
Overnight
Total
Non-melanoma skin (C44)
80,122
15,190
95,312
Secondary site (C77–C79)
6,347
34,880
41,227
18,241
16,935
35,176
Bowel (C18–C20)
8,504
20,759
29,263
Breast (C50)
4,917
19,100
24,017
Non-Hodgkin lymphoma (C82–C85)
8,759
10,238
18,997
Lung (C33–C34)
3,887
13,845
17,732
Bladder (C67)
6,771
7,784
14,555
10,729
2,629
13,358
7,026
3,431
10,457
195,767
210,837
406,604
664,556
215,876
880,432
Cancer site/type
Prostate (C61)
Myelodysplastic syndrome (D46)
Melanoma skin (C43)
Cancer as principal diagnosis
(a)
All cancer-related hospitalisations
(a)
Hospitalisations in which (i) the principal diagnosis is cancer (ICD-10-AM codes C00–C97, D45, D47.1 and D47.3), or (ii) the principal
diagnosis is a health service or treatment that may be related to treatment of cancer (see Appendix J).
Source: AIHW National Hospital Morbidity Database.
The 10 most common cancer types represented more than two-thirds of all overnight cancerrelated hospitalisations. Cancer of secondary site was the most common cause of overnight
hospitalisations, representing 17% of total overnight cancer-related hospitalisation.
Meanwhile, 1 in 8 (12%) of all same-day cancer-related hospitalisations were for nonmelanoma skin cancer.
Other cancer-related hospitalisations
Other cancer-related hospitalisations were dominated by chemotherapy sessions, which
accounted for 40% of all cancer-related hospitalisations in 2010–11. This was followed by
special screening examination for neoplasms, follow-up after surgery for cancer, and
adjustment and management of infusion pumps and vascular devices (Table 8.4).
Most other cancer-related hospitalisations are for same-day services. The five leading
treatments accounted for about 7 in 10 (69%) of all same-day cancer-related hospitalisations
in 2010–11. Although the total number of overnight hospitalisations for other cancer-related
hospitalisations was small, follow-up after surgery was the most common.
76
Cancer in Australia: an overview, 2012
Table 8.4: Five most common other cancer-related hospitalisations, persons, Australia, 2010–11
Principal diagnosis (ICD-10-AM codes)
Same-day
Overnight
Total
352,704
168
352,872
Special screening examination (Z12)
53,177
517
53,694
Follow-up after surgery for cancer (Z08.0)
38,331
2,100
40,431
Follow-up after multiple treatment (Z08.7–Z08.9)
8,397
409
8,806
Adjustment and management of infusion pumps and
vascular device (Z45.1, Z45.2)
7,082
233
7,321
468,789
5,039
473,828
664,556
215,876
880,432
Chemotherapy session (Z51.1)
Other cancer-related hospitalisations
(a)
All cancer-related hospitalisations
(a)
Hospitalisations in which (i) the principal diagnosis is cancer (ICD-10-AM codes C00–C97, D45, D47.1 and D47.3), or (ii) the principal
diagnosis is a health service or treatment that may be related to treatment of cancer (see Appendix J).
Source: AIHW National Hospital Morbidity Database.
It is important to note that the number of same day services for chemotherapy does not
include chemotherapy treatment on an outpatient (that is, non-admitted patient) basis. Over
the past decade, a number of hospitals (mainly public sector) in New South Wales, South
Australia and Australian Capital Territory changed their admissions practices so that not all
patients who receive same-day chemotherapy services are admitted to hospital and instead
receive treatment on an outpatient basis.
Information on outpatient chemotherapy services is included in the National Outpatient
Care Database (NOCD). However, there is variation across jurisdictions in the reporting of
chemotherapy services due to differences in admission practices and in the types of facilities
offering these services. In 2010–11, there were 130,205 outpatient services recorded for
chemotherapy in the NOCD. More detail about the scope of the NOCD is in the AIHW
report Australian hospital statistics 2010–11 (AIHW 2012b).
Does hospitalisation differ by age?
Cancer-related hospitalisation was more common in the older age groups. The rate of
hospitalisation for patients with cancer was relatively low in the younger age groups and
started to increase after the age of 30. The highest hospitalisation rate of 1,644 per 10,000 was
in those aged 75–79.
The cancer-related hospitalisation rate was similar for males and females aged under 30.
Females aged 30–54 had a slightly higher rate of hospitalisation than males. The rate in males
increased more steeply after the age of 55 and was markedly higher than that of females
thereafter (Figure 8.1).
Cancer in Australia: an overview, 2012
77
Rate (per 10,000 )
2,500
Males
Females
2,000
Persons
1,500
1,000
85+
80–84
75–79
70–74
65–69
60–64
55–59
50–54
45–49
40–44
35–39
30–34
25–29
20–24
0
<20
500
Age group (years)
Notes
1.
Hospitalisations in which (i) the principal diagnosis is cancer (ICD-10-AM codes C00–C97, D45, D47.1 and D47.3), or (ii) the principal
diagnosis is a health service or treatment that may be related to treatment of cancer (see Appendix J).
2.
Data for this figure are in online Table D8.1.
Source: AIHW National Hospital Morbidity Database.
Figure 8.1: Age-specific rates for all cancer-related hospitalisations, Australia, 2010–11
Has cancer-related hospitalisation changed over time?
In this section, trends in hospitalisation are presented from 2001–02 to 2010–11. As noted
earlier, changes in hospital admission procedures during this period should be taken into
account when interpreting trends over time. The number of all cancer-related
hospitalisations has increased by 36% between 2001–02 and 2010–11 (from 649,352 to
880,432). A majority of the change is related to a substantial increase (43%) in the number of
same-day hospitalisations (from 465,439 in 2001–02 to 664,556 in 2010–11) (Figure 8.2).
The age-standardised rate of all cancer-related hospitalisations increased by 10% over this
period, from 331 per 10,000 (in 2001–02) to 364 per 10,000 (in 2010–11). The trend in the rate
of all cancer-related hospitalisations was mostly driven by the changes in the rate of sameday hospitalisations, which has been affected by changes in the admission practices for
same-day chemotherapy.
78
Cancer in Australia: an overview, 2012
Rate (per 100,000)
400
Total
350
300
250
Same-day
200
150
100
Overnight
50
0
2001–02
2002–03
2003–04
2004–05
2005–06
2006–07
2007–08
2008–09
2009–10
2010–11
Year
Notes
1.
Hospitalisations in which (i) the principal diagnosis is cancer (ICD-10-AM codes C00–C97, D45, D47.1 and D47.3), or (ii) the principal
diagnosis is a health service or treatment that may be related to treatment of cancer (see Appendix J).
2.
Rates were age-standardised to the Australian population as at 30 June 2001 and expressed per 10,000 population.
3.
Data for this figure are in online Table D8.2.
Source: AIHW National Hospital Morbidity Database.
Figure 8.2: All cancer-related hospitalisations by same-day and overnight status, Australia, 2001–02
to 2010–11
Palliative care for cancer in the hospital setting
A growing number of people die from cancer each year and this trend is expected to
continue with Australia’s ageing population. While medical care is often focused on the
treatment and cure of disease, for patients diagnosed with advanced cancer where it is not
expected that they will recover from the disease, the doctors, in consultation with the patient
and family members, may pursue a course of treatment that focuses on ‘quality of life’
aiming to reduce the pain and suffering from the disease (WHO 2002).
Palliative care describes care in which the clinical intent or treatment goal is to maintain the
quality of life for a patient with an active, progressive disease with little or no prospect of
cure. Palliative care usually includes an interdisciplinary assessment and/or management of
the physical, psychological, emotional and spiritual needs of the patient and a grief and
bereavement support service for the patient and their carers/family (see Box 8.2).
This section presents a summary of cancer-related palliative care separations within an
admitted patient setting in 2009–10. The palliative care may have been delivered in a hospice,
a dedicated palliative care ward or in other admitted patient beds in a hospital. For the
purpose of this report, a ‘palliative care separation’ is defined as a separation for which
palliation was a substantial component of the care provided, and in which the principal
clinical intent of the care was palliation during part or all of the separation, as evidenced by a
code of Palliative care for the ‘Care type’ and /or diagnosis data items in the NHMD. Further
information is in Appendix J and the AIHW’s report Palliative care services in Australia (AIHW
2012g).
Cancer in Australia: an overview, 2012
79
Box 8.2: World Health Organization definition of palliative care
Palliative care is defined by the World Health Organization (WHO) as ‘an approach that
improves the quality of life of patients and their families facing the problems associated
with life-threatening illness, through the prevention and relief of suffering by means of
early identification and impeccable assessment and treatment of pain and other problems,
physical, psychosocial and spiritual’ (WHO 2002).
How many cancer-related palliative care hospitalisations occurred
in 2009–10?
In 2009–10, there were 55,983 palliative care hospitalisations in Australia. Cancer was the
most common principal diagnosis, accounting for 33,278 of these hospitalisations (59%) of
these hospitalisations (Table 8.5). Cancer-related palliative care separations accounted for
3.8% of all cancer-related hospitalisations.
Table 8.5: Palliative care hospitalisations, Australia, 2009–10
Number of hospitalisations
All cancer-related palliative care hospitalisations
(a)
All palliative care hospitalisations
(a)
33,278
55,983
Palliative care hospitalisations in which (i) the principal diagnosis is cancer (ICD-10-AM codes C00–C97, D45, D47.1 and D47.3), or
(ii) the principal diagnosis is a health service or treatment that may be related to treatment of cancer (see Appendix J).
Source: AIHW National Hospital Morbidity Database.
Which cancers lead to the most palliative care hospitalisations?
Most palliative care hospitalisations for cancer involved overnight hospital care (93%), with a
small number of same-day hospitalisations.
The most common type of cancer recorded for the palliative care separations was secondary
site cancer, which refers to a malignant tumour that originated elsewhere in the body; this
principal diagnosis was reported in 15% of palliative care separations in 2010–11 (Table 8.6).
80
Cancer in Australia: an overview, 2012
Table 8.6: Ten most common palliative care hospitalisations with a principal diagnosis of cancer,
persons, Australia, 2009–10
Total
Proportion of palliative
care hospitalisations (%)
Secondary site (C77–C79)
8,192
14.6
Lung (C33–C34)
5,552
9.9
Bowel (C18–C20)
2,686
4.8
Pancreas (C25)
1,736
3.1
Prostate (C61)
1,579
2.8
Breast (C50)
1,390
2.5
Brain (C71)
1,267
2.3
Stomach (C16)
932
1.7
Oesophagus (C15)
759
1.4
742
1.3
33,278
59.4
Principal diagnosis (ICD-10-AM codes)
Cancer site/type
Liver (C22)
(a)
All cancer-related palliative care hospitalisations
(a)
Palliative care hospitalisations in which (i) the principal diagnosis is cancer (ICD-10-AM codes C00–C97, D45, D47.1 and D47.3), or (ii) the
principal diagnosis is a health service or treatment that may be related to treatment of cancer (see Appendix J).
Source: AIHW National Hospital Morbidity Database.
Palliative care and deaths in hospital
In the previous section, the focus has been on all palliative care hospitalisations that occurred
in an admitted patient setting. In this section, the focus is on a subset of these palliative care
hospitalisations: those that ended with their death in the admitted patient setting. Further
information is in the AIHW’s report Palliative care services in Australia (AIHW 2012g).
Around half of all palliative care hospitalisations result in a patient’s death, and this
proportion is the same among palliative care patients diagnosed with cancer. There are a
number of other reasons that a person with a terminal illness may be admitted as a palliative
care patient, including for pain management or to perform procedures to alleviate
symptoms.
Research has shown that the majority of palliative care services are provided to cancer
patients, and this may be due to the recognised disease pathway and prognosis of decline for
cancer patients compared with non-cancer patients (AIHW 2011b). This is particularly
evident when we examine the proportion of admitted patients who died who were palliative
care patients at the time of their death. Among those with cancer as a principal diagnosis
who died during their hospitalisation, 7 out of 10 (71%) had been a palliative care patient
(Table 8.7). This is much higher than the overall proportion (37%) of patients that had been a
palliative care patient during the stay that ended in their deaths when all hospitalisations
were considered.
Cancer in Australia: an overview, 2012
81
Table 8.7: Palliative care patients among those who died as an admitted patient, persons,
Australia, 2009–10
Palliative care
patient deaths(a)
Total admitted
patient deaths
Per cent of palliative
care patient deaths(a)
16,459
23,082
71.3
27,270
73,021
37.3
All cancer-related hospitalisations(b)
(c)
All hospitalisations
(a)
Refers to patients for whom palliative care was the principal clinical intent during part or all of the separation that ended with their
death.
(b)
Hospitalisations in which (i) the principal diagnosis is cancer (ICD-10-AM codes C00–C97, D45, D47.1 and D47.3), or (ii) the
principal diagnosis is a health service or treatment that may be related to treatment of cancer (see Appendix J).
(c)
ICD-10-AM codes A00–Z89.
Source: AIHW National Hospital Morbidity Database.
82
Cancer in Australia: an overview, 2012
9
National cancer screening programs
Key findings
BreastScreen Australia
•
More than 1.7 million women participated in BreastScreen Australia in 2009–2010.
Participation by women in the target age group of 50–69 has remained between 55%
and 57% for the past decade.
•
Sixty per cent of all invasive breast cancers detected by BreastScreen Australia were
small (that is, less than or equal to 15mm). Small breast cancers are associated with
better treatment options and improved survival.
•
In line with BreastScreen Australia’s aim to reduce death from breast cancer, the agestandardised mortality rate has decreased since the program began in 1991. Between
1991 and 2010, the mortality rate for women aged 50–69 decreased by 37% from 68 to
43 deaths per 100,000.
National Cervical Screening Program
•
Nearly 3.8 million women participated in the National Cervical Screening Program in
2009–2010. Participation by women in the target age group of 20–69 has remained
between 57% and 59% for the past 5 years.
•
The overall incidence rate of cervical cancer in women aged 20–69 (the target age
group) has fallen by about 50% since the introduction of the National Cervical
Screening Program in 1991.
National Bowel Cancer Screening Program
•
About 38% of the 2.1 million people invited to participate in the National Bowel
Cancer Screening Program between July 2008 and June 2011 returned a completed
bowel cancer screening kit for analysis.
•
Women were more likely to participate than men (41% and 36%, respectively), but men
were more likely to have a positive screening test. Participants who receive a positive
screening result are encouraged to discuss this result with their doctor, who will refer
them for colonoscopy, if necessary.
•
Three per cent of participants who had a colonoscopy to follow-up a positive screening
test were found to have suspected or confirmed cancer. In addition, 14% had
adenomas (benign growths that have the potential to become cancerous) detected.
Cancer in Australia: an overview, 2012
83
About national population screening programs
In Australia, there are organised national population screening programs for breast, cervical
and bowel cancers. Their goals are to reduce illness and death from these cancers through
early detection of cancer and pre-cancerous abnormalities and effective follow-up treatment.
The programs are BreastScreen Australia, the National Cervical Screening Program and the
National Bowel Cancer Screening Program. They provide screening services that are free to
individuals in the target population (for breast and bowel screening) or are covered by a
Medicare rebate (for cervical screening).
In this chapter, information on the performance of each of the three programs is presented.
While the focus is on people who have had a screening test through one of the programs,
because out-of-program screening may occur in the case of breast cancer and bowel cancer,
the data presented underestimate the level of breast and bowel cancer screening in Australia.
Note that, except where otherwise specified, rates are expressed per 100 people (not per
100,000 people as was used for the cancer incidence and mortality chapters) and are often
referred to as a percentage.
Box 9.1: What is cancer screening?
Cancer screening involves the use of a test to identify individuals at risk of cancer. The
screening test itself is not diagnostic; rather, individuals with a positive screening result are
usually referred for further investigation with diagnostic tests. The aim of screening is to
either detect cancer at an earlier stage where treatment options are often more effective, or
detect and treat abnormalities that, if left untreated, may become cancerous.
Population-based cancer screening is an organised, integrated process that uses systematic
testing within a defined target group. It does not include testing when an individual
presents to a health-care practitioner because of symptoms, or when a test is offered to an
individual without symptoms as part of a general health check.
Population-based screening programs should ideally meet a number of criteria defined by
the WHO: the condition must be an important health problem and have a recognisable
latent or early symptomatic stage; a validated, safe and acceptable test that is able to
accurately predict the presence of the disease must be available; and effective, available and
accessible treatment options must be available to all people diagnosed with the disease.
Why doesn’t Australia have a prostate cancer screening program?
In Australia there are national population-based screening programs for breast, cervical and
bowel cancer that meet the above criteria defined by the WHO. While prostate cancer is also
an important health condition, current evidence is that the commonly used PSA test, either
alone or combined with digital rectal examination, is not suitable for use in a populationbased screening program, and the harms of such screening outweigh the benefits
(Australian Health Ministers’ Advisory Council 2010).
84
Cancer in Australia: an overview, 2012
BreastScreen Australia
BreastScreen Australia was established in 1991 and operates as a joint program of the
Australian and state and territory governments. It aims to reduce illness and death resulting
from breast cancer in Australia through organised mammographic screening to detect cases
of unsuspected cancer in women, enabling intervention at an early stage.
BreastScreen Australia provides free mammographic screening and assessment for women
aged 40 and over. However, the primary target group is women aged 50 to 69. Women in
this age group are targeted because they have a relatively high incidence of breast cancer and
screening mammography is known to be effective in reducing mortality in this age group
(BreastScreen Australia 2004). If mammographic screening identifies signs suspicious for
breast cancer, a woman is recalled for further investigation.
In this section, data on the number of women obtaining a screening mammogram through
BreastScreen Australia are presented. Participation is measured over 2 years to align with the
recommended screening interval (time between screening mammograms) of BreastScreen
Australia, and is based on the number of women screened (not the number of screening
mammograms performed) as a proportion of the target population. Data on the number of
breast cancers detected through the program in 2010 are also presented. The data were
sourced from the AIHW report BreastScreen Australia monitoring report 2009–2010 (AIHW
2012c). The data for this report were provided to the AIHW by the state and territory
BreastScreen programs and pertain to the 2-year period 2009–2010.
For more detailed information about BreastScreen Australia, see the BreastScreen Australia
monitoring report 2009–2010 (AIHW 2012c).
How many women participated?
More than 1.7 million women participated in BreastScreen Australia in 2009–2010, of which
79% were in the target age group of 50–69 (Table 9.1).
Table 9.1: Participation in the BreastScreen Australia Program, females, Australia, 2009–2010
Number of females(a)
Rate (per cent)(b)
95% confidence interval
50–69 years
1,352,112
55.0
54.9–55.0
Total (40+ years)
1,710,312
32.4
32.4–32.5
Age
(a)
Participants are the number of females screened through BreastScreen Australia in each 2-year reporting period. The screening
periods cover 1 January of the initial year to 31 December of the latter year indicated.
(b)
Participation rates were based on the number of females screened in the 2-year reporting period through BreastScreen Australia as a
proportion of the average of the ABS estimated resident population for 2009 and 2010, age-standardised to the Australian population
as at 30 June 2001 and expressed per 100 females.
Source: AIHW analysis of BreastScreen Australia data.
The age-standardised rate of participation by women aged 50–69 has remained steady at 55%
to 57% between 1997–1998 and 2009–2010, despite a steady increase in the actual number of
women participating over this time.
Does participation differ for different population groups?
Aboriginal and Torres Strait Islander women participate in BreastScreen Australia at a lower
rate than non-Indigenous women. However, participation rates for Aboriginal and Torres
Strait Islander women have increased from 34.9% in 1999–2000 to 36.2% in 2009–2010. While
participation increases with improving socioeconomic status, this trend is small, with all
socioeconomic groups recording participation rates of 53–56% (Figure 9.1).
Cancer in Australia: an overview, 2012
85
Participation (per cent)
70
60
50
40
30
20
10
0
1 Lowest
2
3
Socioeconomic status
4
5 Highest
Notes
1.
Participation rates were based on the number of females aged 50–69 screened through BreastScreen Australia as a proportion of the
average of the ABS estimated resident population for 2009 and 2010 for females aged 50–69, age-standardised to the Australian
population as at 30 June 2001 and expressed per 100 females.
2.
Socioeconomic status was classified using the ABS Index of Relative Socio-economic Disadvantage (see Appendix E).
3.
Data for this figure are in online Table D9.1.
Source: AIHW analysis of BreastScreen Australia data.
Figure 9.1: Participation in BreastScreen Australia by socioeconomic status, females aged 50–69,
2009–2010
Participation was highest in Outer regional locations at 58%. BreastScreen also reaches 47% of
women in Very remote locations (Figure 9.2). To improve access for women in Remote and
Very remote areas, states and territories use relocatable screening services, mobile screening
vans and community buses to overcome transport barriers.
Participation (per cent)
70
60
50
40
30
20
10
0
Major cities
Inner regional
Outer regional
Remote
Very remote
Remoteness area
Notes
1.
Participation rates were based on the number of females aged 50–69 screened through BreastScreen Australia as a proportion of the
average of the ABS estimated resident population for 2009 and 2010 for females aged 50–69, age-standardised to the Australian
population as at 30 June 2001 and expressed per 100 females.
2.
Remoteness was classified according to the Australian Standard Geographical Classification (ASGC) Remoteness Areas (see
Appendix E).
3.
Data for this figure are in online Table D9.1.
Source: AIHW analysis of BreastScreen Australia data.
Figure 9.2: Participation in BreastScreen Australia by remoteness area, females aged 50–69,
2009–2010
86
Cancer in Australia: an overview, 2012
How many women had a breast cancer detected?
The aim of BreastScreen Australia is to reduce illness and death from breast cancer. This can
be achieved by maximising the detection of unsuspected cancers, and in particular small
cancers, since this leads to better treatment options (NBOCC 2009) and improved survival
(AIHW & NBCC 2007).
In 2010, BreastScreen New South Wales data for cancer detection were not available because
of issues relating to the implementation of a new business information system. It is
anticipated that future BreastScreen Australia monitoring reports will include data for this
year (these can be accessed on the AIHW website <www.aihw.gov.au>). In 2010, 381 women
who screened for the first time and 2,033 women who attended subsequent screens were
diagnosed with breast cancer. This means that for every 10,000 women aged 50–69 screened
for the first time, 97 had a breast cancer detected, and for every 10,000 women attending
subsequent screens, 46 had a breast cancer detected (AIHW 2012c).
A high proportion of breast cancers detected through BreastScreen Australia in 2010 were
small—47% of breast cancers detected in women at their first screen, and 63% of those in
women attending subsequent screens. It is thought that a woman is more likely to be
diagnosed with a small cancer in subsequent screens than in her first screen because a first
screen detects prevalent cancers that may have been present for some time, whereas
subsequent screens detect incident cancers that have grown between screens, and are more
likely to be small, having had less time in which to grow.
What impact has BreastScreen Australia had on mortality?
After a period of relative stability from 1982 to 1994, mortality from breast cancer in women
aged 50–69 began to decrease steadily from 1995. Mortality rates decreased from 66 per
100,000 women in 1995, to 43 per 100,000 women in 2010. The decrease in mortality has been
attributed to the early detection of breast cancer through BreastScreen Australia, along with
advances in the management and treatment of breast cancer (BreastScreen Australia
Evaluation Advisory Committee 2009).
National Cervical Screening Program
The National Cervical Screening Program (NCSP), established in 1991, operates as a joint
program of the Australian and state and territory governments. It aims to reduce cervical
cancer cases, as well as illness and death resulting from cervical cancer in Australia, by
detecting and treating high-grade abnormalities of the cervix before any possible progression
to cervical cancer. It achieves this through an organised approach to cervical screening
targeting women aged 20–69 for 2-yearly Papanicolaou smears (or Pap tests).
National policy recommends that women aged between 18 and 20 should begin screening
within 1 or 2 years of becoming sexually active, while Pap tests may cease at the age of 70 for
women who have had two normal results within the last 5 years (DoHA 2012). These
recommendations apply to women who have received the vaccine introduced in 2007 against
human papilloma virus (HPV) as well as to unvaccinated women. For more information on
the HPV vaccine, see Box 9.2.
In this section, data on participation in the NCSP are presented. Participation is measured
over 2 years to align with the recommended screening interval (time between Pap tests) of
the NCSP, and is based on the number of women screened (not the number of Pap tests
Cancer in Australia: an overview, 2012
87
performed) as a proportion of the target population. The impact of the program on the
number of new cases of cervical cancer is also discussed. The data were sourced from the
AIHW report Cervical screening in Australia 2009–2010 (AIHW 2012e). The data were
provided to the AIHW by the state and territory cervical screening programs and pertain to
the 2-year period 2009–2010.
More information about the National Cervical Screening Program and the method by which
estimates were derived is in the Cervical screening in Australia 2009–2010 report (AIHW
2012e).
How many women participated?
Nearly 3.8 million women participated in the NCSP in 2009–2010, of which 96% were in the
target age group of 20–69. Participation in this age group has remained steady at 57% to 59%
between 2004–2005 and 2009–2010. There has been a steady increase in the actual number of
women participating over this time.
While 2 years is the recommended screening interval, the NCSP also monitors participation
over 3 and 5 years. In the 3-year period 2008–2010, 70% of women aged 20–69 participated in
the NCSP at least once, while in the 5-year period 2006–2010, 83% did (Table 9.2).
Table 9.2: Participation in the National Cervical Screening Program, females aged 20–69, Australia,
over 2-year (2009–2010), 3-year (2008–2010), and 5-year (2006–2010) period
Number of females
Rate (per cent)(a)
95% confidence interval
(b)
3,635,929
57.4
57.3–57.5
(b)
4,412,027
70.2
70.1–70.3
(b)
5,154,472
83.3
83.2–83.4
2-year
3-year
5-year
(a)
Equals the number of females screened as a percentage of the ABS estimated resident population for females aged 20–69, adjusted to
include only women with an intact cervix using age-specific hysterectomy fractions derived from the AIHW National Hospitals Morbidity
Database, age-standardised to the Australian population as at 30 June 2001.
(b)
The 2-year period covers 1 January 2009 to 31 December 2010; the 3-year period covers 1 January 2008 to 31 December 2010; and the
5-year period covers 1 January 2006 to 31 December 2010.
Source: AIHW analysis of NCSP Register data.
Does participation differ for different population groups?
Information on participation for Aboriginal and Torres Strait Islander women is not
available, as Indigenous status of participants is not collected, although there is evidence that
this population group is under-screened (Binns & Condon 2006; Coory 2002).
There was a clear trend of increasing participation with increasing socioeconomic status of
area of usual residence, ranging from 52% in the most disadvantaged areas to 63% in the
least disadvantaged (Figure 9.3).
While participation in the NCSP was significantly higher in Major cities, Inner regional and
Very remote areas compared with other geographic areas, this difference was small, with all
areas recording participation rates of 55–58% (Figure 9.4).
88
Cancer in Australia: an overview, 2012
Participation (per cent)
70
60
50
40
30
20
10
0
1 Lowest
2
3
4
5 Highest
Socioeconomic status
Notes
1.
Participation rates were based on the number of females aged 20–69 screened as a proportion of the average of the ABS estimated
resident population for 2009 and 2010 for females aged 20–69, adjusted for the estimated proportion of women who have had a
hysterectomy, age-standardised to the Australian population as at 30 June 2001 and expressed per 100 females.
2.
Socioeconomic status was classified using the ABS Index of Relative Socio-economic Disadvantage (see Appendix E).
3.
Data for this figure are in online Table D9.2.
Source: AIHW analysis of NCSP register data.
Figure 9.3: Participation in the National Cervical Screening Program by socioeconomic status,
females aged 20–69, 2009–2010
Participation (per cent)
70
60
50
40
30
20
10
0
Major cities
Inner regional
Outer regional
Remote
Very remote
Remoteness area
Notes
1.
Participation rates were based on the number of females aged 20–69 screened as a proportion of the average of the ABS estimated
resident population for 2009 and 2010 for females aged 20–69, adjusted for the estimated proportion of women who have had a
hysterectomy, age-standardised to the Australian population as at 30 June 2001 and expressed per 100 females.
2.
Remoteness was classified according to the Australian Standard Geographical Classification (ASGC) Remoteness Areas
(see Appendix E).
3.
Data for this figure are in online Table D9.2.
Source: AIHW analysis of NCSP register data.
Figure 9.4: Participation in the National Cervical Screening Program by remoteness area, females
aged 20–69, 2009–2010
Cancer in Australia: an overview, 2012
89
How many women had a high-grade abnormality detected?
In 2010, for every 1,000 women aged 20–69 screened, 8 had a high-grade abnormality
detected, providing an opportunity for treatment before possible progression to cervical
cancer.
Box 9.2: The effect of the National HPV Vaccination Program on cervical screening
and the incidence of cervical cancer
During the past decade much research has been aimed at identifying what causes cervical
cancer. It is now recognised that cervical cancer is a rare outcome of persistent infection
with HPV. HPV infection with one or more of the 40 genital HPV types is the most common
sexually transmitted infection of both men and women, with infection rates highest in
women in young adulthood. Persistent infection with a high-risk HPV type is necessary,
although not sufficient, for the development of cervical cancer (Bosch et al. 2002;
Walboomers et al. 1999).
Australia was the first country to introduce a national HPV vaccination program in 2007.
The National HPV Vaccination Program (NHVP), funded by the Australian Government,
offers a course of three injections to be given over 6 months. Currently, the NHVP is an
ongoing program for girls aged 12–13 administered through schools, although between
2007 and 2009 it also included a catch-up program for girls and women aged 12–26
(National HPV Vaccination Register 2011). To be effective, the vaccines need to be
administered before first HPV infection with the specific HPV types; that is, before first
sexual activity.
It is important that women who have received the vaccination continue to participate in
cervical screening because the vaccine protects against only two of the HPV types, infection
with which can lead to cervical cancer. Also, women who received the vaccine after
becoming sexually active may not get the full benefit of the vaccine if they had already
acquired HPV.
What are the effects of vaccination on the incidence of cervical cancer?
Effects on cervical cancer incidence require sufficient time to pass for cancers that would
otherwise have developed to be averted by HPV vaccination. However, since the program
began, there has been a decline in genital warts among young women (Donovan et al. 2011;
Read et al. 2011), as well as the first evidence of a decline in cervical abnormalities (changes
to cells in the cervix caused by infection with HPV) in girls younger than 18 in the 3 years
after the introduction of the HPV vaccine in Australia (Brotherton et al. 2011)—both
conditions associated with HPV infection.
90
Cancer in Australia: an overview, 2012
What impact has the National Cervical Screening Program had on
the incidence of cervical cancer?
Overall, the cervical cancer incidence rate of women aged 20–69 decreased by about 50%
between 1991 (the year the NCSP was introduced) and 2009 (Figure 9.5).
Rate (per 100,000)
20
18
16
14
12
10
8
6
4
2009
2008
2007
2006
2005
2004
2003
2002
2001
2000
1999
1998
1997
1996
1995
1994
1993
1992
0
1991
2
Year
Notes
1.
2009 incidence data include estimates for NSW and the ACT. See Appendix F for more details.
2.
The rates were age-standardised to the Australian population as at 30 June 2001 and are expressed per 100,000 females.
3.
Data for this figure are in online Table D9.3.
Source: AIHW Australian Cancer Database 2009.
Figure 9.5: Incidence of cervical cancer in females aged 20–69, Australia, 1991 to 2009
National Bowel Cancer Screening Program
The NBCSP aims to reduce both the number of new cases of bowel cancer, as well as illness
and death resulting from bowel cancer, by detecting abnormalities of the colon and rectum
early. The program is coordinated at the national level by the Australian Government
Department of Health and Ageing, in partnership with state and territory governments.
Eligible people are individually invited to participate in the program through the
Department of Human Services (formerly Medicare Australia). Invitation packs include a
free faecal occult blood test (FOBT) kit that enables a person to take a sample of their faeces,
which is sent to the program’s pathology laboratory to be tested for microscopic traces of
blood.
The NBCSP is being phased in gradually to help ensure that health services, such as
colonoscopy and treatment services, are well-placed to meet any increased demand. The
program began in 2006 with screening offered to men and women aged 55 and 65. In July
2008, it extended screening to include people aged 50. From 2013, it will include people aged
60, and from 2015 those aged 70. The program will be further expanded in 2017–18 to include
biennial screening.
While annual participation rates provide an important indicator of the proportion of the
population screened in a given year, the NBCSP is a relatively new screening program, and
there have been a number of factors that may have affected annual participation rates. These
include a change in the target population, an issue with the reliability of the screening FOBT
Cancer in Australia: an overview, 2012
91
kit in 2009, and uncertainty over ongoing funding. These factors, combined with the unique
design of the NBCSP, mean that a more meaningful measure of program participation uses a
longer time frame. Accordingly, participation is presented for 1 July 2008 to 30 June 2011.
How many people participated?
About 38% of the 2.1 million people invited between 1 July 2008 and 30 June 2011 returned a
completed bowel cancer screening kit for analysis.
Women (41%) were 1.1 times as likely to screen as men (36%). The highest rate of
participation was by people aged 65 (47%), while those aged 50 had the lowest (34%)
(Table 9.3, Figure 9.6).
Table 9.3: Participation in the National Bowel Cancer Screening Program, 1 July 2008–30 June 2011
Invitations(a)
Participation(b)
Rate (per cent)
95% CI
Males
1,044,445
374,144
35.8
35.7–35.9
Females
1,053,075
432,336
41.1
41.0–41.1
Persons
2,092,520
806,480
38.4
38.4–38.5
(a)
Pertains to valid invitations sent to people aged 50, 55 and 65.
(b)
Participants in the program are defined as members of the eligible population who have been sent an invitation to screen and who returned
a completed faecal occult blood test (FOBT) kit. This includes people who suspended or opted off the program.
Source: AIHW analysis of NBCSP Register data.
Participation (per cent)
70
60
Males
Females
50
40
30
20
10
0
50 years
55 years
65 years
Notes
1.
Rates are age-specific based on the number of people screened through the NBCSP as a proportion of the number of people
aged 50, 55 and 65 invited to participate between 1 July 2008 and 30 June 2011.
2.
Data for this figure are in online Table D9.4.
Source: AIHW analysis of NBCSP register data as at 30 June 2011.
Figure 9.6: Crude participation in the National Bowel Cancer Screening Program, by age
and sex, 2008–2011
Does participation differ for different population groups?
Participation rates for Aboriginal and Torres Strait Islander people were not available as it is
unknown how many of those invited identify as Indigenous. However, comparison with
data from the 2006 ABS Census of Population and Housing indicate that it is likely that they
under-screen.
92
Cancer in Australia: an overview, 2012
People living in the most disadvantaged areas had a significantly lower level of participation
than people from other socioeconomic areas (see online Table 9.5).
People invited in Remote and Very remote regions had a significantly lower level of
participation than people invited from other regions (Figure 9.7).
Participation (per cent)
70
60
50
40
30
20
10
0
Major cities
Inner regional
Outer regional
Remote
Very remote
Remoteness area
Notes
1.
Rates are age-specific based on the number of people screened through the NBCSP as a proportion of the number of people aged 50,
55 and 65 invited to participate between 1 July 2008 and 30 June 2011.
2.
Remoteness was classified according to the Australian Standard Geographical Classification (ASGC) Remoteness Areas
(see Appendix E).
3.
Data for this figure are in online Table D9.5.
Source: AIHW analysis of NBCSP register data as at 30 June 2011.
Figure 9.7: Crude participation in the National Bowel Cancer Screening Program by remoteness
area, 2008–2011
How many people needed to be followed-up after a positive
screening result?
About 62,000 participants (7.8%) who returned a valid screening test had a positive screening
result. Participants who receive a positive screening result are encouraged to discuss this
result with their doctor, who will refer them for colonoscopy, if necessary (Table 9.4).
About 71% of those with a positive screening result were recorded as having had a
colonoscopy.
Does follow-up differ for different population groups?
Males were more likely than females to have blood detected in their faeces and require
follow-up, but were less likely to screen.
Older people were more likely to have blood detected and require follow-up than younger
people, but were also more likely to screen.
Cancer in Australia: an overview, 2012
93
How many people had bowel cancers or adenomas detected at
colonoscopy?
Of those people invited between 1 July 2008 and 30 June 2011, there were about 1,100
confirmed or suspected cancers reported to the NBCSP Register by clinicians (Table 9.4). This
equates to about 1 confirmed or suspected cancer found for every 33 colonoscopies
performed after a positive screening test.
About a further 3,300 advanced adenomas were also detected during colonoscopy. When all
adenomas are taken into account, 5,120 were detected, which equates to 13.7% of participants
having an adenoma detected at colonoscopy. Adenomas are benign growths that have the
potential to become cancerous, and their removal is likely to lower the risk of future bowel
cancer in these patients.
From the available NBCSP data, almost 80% of bowel cancers removed (resected) were in the
earliest two (out of four) stages of cancer spread. Cancers diagnosed at earlier stages are
generally associated with improved patient prognosis (Morris et al. 2007).
94
Cancer in Australia: an overview, 2012
Table 9.4: National Bowel Cancer Screening Program outcomes from colonoscopic investigation of positive FOBT (including histopathology),
by age and sex, 1 July 2008–30 June 2011(a)
FOBT positive
Males
Females
Persons
(a)
Colonoscopy
recorded(d)
No
cancer or
adenoma(e)
Polyps
awaiting
histopathology(f)
Confirmed
diminutive
adenoma(g)
Confirmed
small
adenoma(g)
Confirmed
advanced
adenoma(g)
Suspected
cancer(h)
Confirmed
cancer(i)
Invitations
issued(b)
Number
screened(c)
Total
positive
FOBT
Number
1,044,445
374,144
32,456
19,517
7,709
7,917
503
561
2,150
521
156
Per cent
..
..
..
..
39.5
40.6
2.6
2.9
11.0
2.7
0.8
Number
1,053,075
432,336
29,611
17,927
10,408
5,169
362
361
1,183
347
97
Per cent
..
..
..
..
58.1
28.8
2.0
2.0
6.6
1.9
0.5
Number
2,097,520
806,480
62,067
37,444
18,117
13,086
865
922
3,333
868
253
Per cent
..
..
..
..
48.4
34.9
2.3
2.5
8.9
2.3
0.7
Data are based on data recorded in the NBCSP Register to 21 July 2011 for persons invited between 1 July 2008 and 30 June 2011.
(b)
‘Invitations issued’ equals the number of eligible people who were issued an invitation to screen in the NBCSP.
(c)
‘Number screened’ equals the number of people who completed an FOBT kit and had results forwarded to the Register.
(d)
‘Colonoscopy recorded’ includes colonoscopies recorded via the Colonoscopy Report and/or Histopathology Report forms. It does not include colonoscopies identified through Medicare claims.
(e)
No cancers were suspected at colonoscopy or confirmed non-cancerous by histopathology; no polyps identified at colonoscopy, or polyps confirmed as non-adenomatous at histopathology.
(f)
Polyps detected at colonoscopy and sent to histopathology for analysis. No Histopathology Report form received by Register.
(g)
Confirmed adenoma figures were based on a combination of the Colonoscopy and Histopathology Report forms for a person received by the Register.
(h)
Cancer suspected at colonoscopy but not yet confirmed by histopathology.
(i)
Cancer confirmed by histopathology.
Source: National Bowel Cancer Screening Program Register as at 21 July 2011.
Cancer in Australia: an overview, 2012
95
Appendix A Cancer codes
Table A1: Cancer codes
Cancer site/type
ICD-10 codes
Lip, oral cavity and pharynx
Lip
C00
Tongue
C01–C02
Mouth
C03–C06
Salivary glands
C07–C08
Oropharynx
C09–C10
Nasopharynx
C11
Hypopharynx
C12–C13
Other sites in pharynx, etc.
C14
Digestive organs
Oesophagus
C15
Stomach
C16
Small intestine
C17
Bowel
C18–C20
Anus
C21
Liver
C22
Gallbladder & bile ducts
C23–C24
Pancreas
C25
Other digestive organs
C26
Respiratory system and intrathoracic organs
Nose, sinuses, etc.
Larynx
C30–C31
C32
Lung
C33–C34
Other thoracic and respiratory organs
C37–C39
Bone
C40–C41
Skin
Melanoma of the skin
Non-melanoma of the skin
C43
C44(a)
Mesothelioma and soft tissue
Mesothelioma
C45
Kaposi sarcoma
C46
Peritoneum
C48
Other soft tissue
Breast
C47, C49
C50
(continued)
96
Cancer in Australia: an overview, 2012
Table A1 (continued): Cancer codes
Cancer site/type
ICD-10 codes
Female genital organs
Vulva
C51
Vagina
C52
Cervix
C53
Uterus
C54–C55
Ovary
C56
Other female genital organs and placenta
C57–C58
Male genital organs
Penis
C60
Prostate
C61
Testis
C62
Other male genital organs
C63
Urinary tract
Kidney
C64
Bladder
C67
Other urinary organs
C65–C66, C68
Eye, brain and other parts of the central nervous system
Eye
C69
Brain
C71
Other central nervous system
C70, C72
Thyroid and other endocrine glands
Thyroid
C73
Other endocrine glands
C74–C75
Blood and lymphatic system
Hodgkin lymphoma
C81
Non-Hodgkin lymphoma
C82–C85
Immunoproliferative cancers
C88
Myeloma
C90
Acute lymphoblastic leukaemia
C91.0
Chronic lymphocytic leukaemia
C91.1
Other and unspecified lymphoid leukaemia
Total lymphoid cancers
C91.2–C91.9
C81–C85, C88, C90, C91
Chronic myelogenous leukaemia
C92.1
Other myeloproliferative cancers
C94.1, C94.3, C96.2, D45, D47.1, D47.3
Myelodysplastic syndrome
Acute myeloid leukaemia
D46
C92.0, C92.3–C92.5, C93.0, C94.0, C94.2, C94.4, C94.5
(continued)
Cancer in Australia: an overview, 2012
97
Table A1 (continued): Cancer codes
Cancer site/type
Unspecified myeloid leukaemia
Total myeloid cancers
Other cancers of the blood and lymphatic system
ICD-10 codes
C92.2, C92.7, C92.9, C93.1–C93.9, C94.7
C92–C94, C96.2, D45, D46, D47.1, D47.3
C95, C96.0, C96.1, C96.3–C96.9
Other
Other and ill-defined sites
Unknown primary site
C80(b)
Multiple primary
C97(c)
All cancers
(a)
C00–C97(a), D45, D46, D47.1, D47.3
For incidence data, those C44 codes that indicate basal or squamous cell carcinoma of the skin are not included.
(b)
For mortality data prior to 2008, the applicable codes are C77–C80.
(c)
Of relevance for mortality data only.
Source: AIHW Australian Cancer Database 2009, AIHW National Mortality Database.
98
C76
Cancer in Australia: an overview, 2012
Appendix B Summary pages for selected
cancers
This appendix provides summary pages on the incidence and mortality statistics for selected
cancers that were commonly diagnosed or were common causes of cancer deaths.
Cancer in Australia: an overview, 2012
99
All cancers (C00–C97(a), D45, D46, D47.1, D47.3)
Risk factors(b):
Table B1: Observed incidence (2009) and mortality (2010) of all cancers, and estimated for 2012
Incidence
Mortality
Males
Females
Persons
Males
Females
Persons
64,342
49,795
114,137
24,328
18,516
42,844
67,260
53,460
120,710
25,860
19,650
45,520
583.5
404.2
485.7
221.7
137.6
174.3
579.0–588.1
400.6–407.8
484.3–488.6
218.9–224.5
135.6–139.7
172.7–176.0
557.9
404.5
474.4
220.1
138.0
174.1
Number
2009 incidence/2010 mortality(c)
(d)
2012 (estimated)
(e)
Age-standardised rate
2009 incidence/2010 mortality
95% CI
(d)
2012 (estimated)
Other information for 2009 incidence/2010 mortality
Per cent of all cancer
100.0
100.0
100.0
100.0
100.0
100.0
Risk to age 75
1 in 3
1 in 4
1 in 3
1 in 8
1 in 12
1 in 10
Risk to age 85
1 in 2
1 in 3
1 in 2
1 in 4
1 in 6
1 in 5
66.3
64.2
65.4
72.8
72.9
72.8
(f)
Mean age
Rate (per 100,000)
Rate (per 100,000)
700
4,000
600
3,500
3,000
500
2,500
400
2,000
300
Incidence—males
Mortality—males
80–84
70–74
60–64
40–44
30–34
50–54
Incidence—females
Mortality—females
Figure B1.2: All cancers incidence (2009) and
mortality (2010) rates(g) by age group
(a)
For incidence data, those ICD-10 C44 codes that indicate a basal or squamous cell carcinoma of the skin are not included.
(b)
Based on the IARC (2008) and WCRF & AICR (2007).
(c)
2009 incidence data include estimates for NSW and the ACT. See Appendix F for more details. Mortality data for 2009 and 2010 are revised
and preliminary, respectively, and are subject to further revision.
(d)
2010–2012 estimates for incidence are based on 2000–2009 incidence data. 2011–2012 estimates for mortality are based on 2001–2010
mortality data (see Appendix G). They are rounded to the nearest 10. For estimates less than 1,000 they are rounded to nearest 5. The
estimates for males and females may not add to estimates for persons due to rounding. Estimates are displayed on graph as dotted lines.
(e)
The rates were age-standardised to the Australian population as at 30 June 2001 and are expressed per 100,000 population.
(f)
Mean age for 2009 incidence was calculated excluding NSW and the ACT.
(g)
The rates shown are age-specific rates.
Source: AIHW Australian Cancer Database 2009, AIHW National Mortality Database.
100
20–24
Incidence—males
Mortality—males
Incidence—females
Mortality—females
Figure B1.1: All cancers incidence and mortality
rates(e), 1991–2012
10–14
2011
2009
2007
2005
2003
2001
1999
0
1997
0
1995
500
1993
100
1991
1,000
0–4
1,500
200
Cancer in Australia: an overview, 2012
Acute myeloid leukaemia (C92.0, C92.3–C92.5, C93.0,
C94.0, C94.2, C94.4, C94.5)
Risk factors(a):
Table B2: Observed incidence (2009) and mortality (2010) of acute myeloid leukaemia, and estimated
for 2012
Incidence
Mortality
Males
Females
Persons
Males
Females
Persons
2009 incidence/2010 mortality(b)
502
396
898
450
350
800
2012 (estimated)(c)
475
375
845
495
350
845
4.7
3.2
3.9
4.1
2.6
3.3
4.3–5.1
2.9–3.6
3.6–4.1
3.7–4.5
2.4–2.9
3.1–3.5
4.1
2.8
3.4
4.2
2.5
3.3
0.8
0.8
0.8
1.8
1.9
1.9
Risk to age 75
1 in 330
1 in 440
1 in 379
1 in 370
1 in 594
1 in 458
Risk to age 85
1 in 168
1 in 253
1 in 205
1 in 168
1 in 261
1 in 207
63.0
61.4
62.3
70.4
72.6
71.4
Number
Age-standardised rate(d)
2009 incidence/2010 mortality
95% CI
2012 (estimated)(c)
Other information for 2009 incidence/2010 mortality
Per cent of all cancer
Mean age(e)
Rate (per 100,000)
Rate (per 100,000)
40
6
35
5
30
4
25
20
3
15
2
10
1
Incidence—males
Mortality—males
Incidence—females
Mortality—females
Figure B2.1: Acute myeloid leukaemia incidence
and mortality rates(d), 1991–2012
Incidence—males
Mortality—males
80–84
70–74
60–64
50–54
40–44
30–34
20–24
10–14
0
0–4
2011
2009
2007
2005
2003
2001
1999
1997
1995
1993
5
1991
0
Incidence—females
Mortality—females
Figure B2.2: Acute myeloid leukaemia incidence
(2009) and mortality (2010) rates(f) by age group
(a)
Based on the IARC (2008) and WCRF & AICR (2007).
(b)
2009 incidence data include estimates for NSW and the ACT. See Appendix F for more details. Mortality data for 2009 and 2010 are revised
and preliminary, respectively, and are subject to further revision.
(c)
2010–2012 estimates for incidence are based on 2000–2009 incidence data. 2011–2012 estimates for mortality are based on 2001–2010
mortality data (see Appendix G). They are rounded to the nearest 10. For estimates less than 1,000 they are rounded to nearest 5. The
estimates for males and females may not add to estimates for persons due to rounding. Estimates are displayed on graph as dotted lines.
(d)
The rates were age-standardised to the Australian population as at 30 June 2001 and are expressed per 100,000 population.
(e)
Mean age for 2009 incidence was calculated excluding NSW and the ACT.
(f)
The rates shown are age-specific rates.
Source: AIHW Australian Cancer Database 2009, AIHW National Mortality Database 2010.
Cancer in Australia: an overview, 2012
101
Cancer of the anus (C21)
Table B3: Observed incidence (2009) and mortality (2010) of cancer of the anus, and estimated for 2012
Incidence
Mortality
Males
Females
Persons
Males
Females
Persons
142
194
337
37
37
74
145
200
345
35
40
70
1.3
1.6
1.4
0.3
0.3
0.3
1.1–1.5
1.4–1.8
1.3–1.6
0.2–0.5
0.2–0.4
0.2–0.4
1.2
1.5
1.4
0.3
0.3
0.3
0.2
0.4
0.3
0.2
0.2
0.2
Risk to age 75
1 in 1,017
1 in 803
1 in 897
1 in 4,724
1 in 4,606
1 in 4,659
Risk to age 85
1 in 611
1 in 568
1 in 593
1 in 2,612
1 in 2,878
1 in 2,762
64.3
62.3
63.1
66.2
67.5
66.8
Number
2009 incidence/2010 mortality(a)
(b)
2012 (estimated)
(c)
Age-standardised rate
2009 incidence/2010 mortality
95% CI
(b)
2012 (estimated)
Other information for 2009 incidence/2010 mortality
Per cent of all cancer
(d)
Mean age
Rate (per 100,000)
Rate (per 100,000)
2
10
8
6
1
4
Incidence—males
Mortality—males
80–84
70–74
60–64
40–44
30–34
50–54
Incidence—females
Mortality—females
Figure B3.2: Cancer of the anus incidence (2009)
and mortality (2010) rates(e) by age group
(a)
2009 incidence data include estimates for NSW and the ACT. See Appendix F for more details. Mortality data for 2009 and 2010 are revised
and preliminary, respectively, and are subject to further revision.
(b)
2010–2012 estimates for incidence are based on 2000–2009 incidence data. 2011–2012 estimates for mortality are based on 2001–2010
mortality data (see Appendix G). They are rounded to the nearest 10. For estimates less than 1,000 they are rounded to nearest 5. The
estimates for males and females may not add to estimates for persons due to rounding. Estimates are displayed on graph as dotted lines.
(c)
The rates were age-standardised to the Australian population as at 30 June 2001 and are expressed per 100,000 population.
(d)
Mean age for 2009 incidence was calculated excluding NSW and the ACT.
(e)
The rates shown are age-specific rates.
Source: AIHW Australian Cancer Database 2009, AIHW National Mortality Database.
102
20–24
Incidence—males
Mortality—males
Incidence—females
Mortality—females
Figure B3.1: Cancer of the anus incidence and
mortality rates(c), 1991–2012
10–14
2011
2009
2007
2005
2003
2001
1999
1997
1995
1993
0
1991
0
0–4
2
Cancer in Australia: an overview, 2012
Bladder cancer (C67)
Risk factors(a):
Table B4: Observed incidence (2009) and mortality (2010) of bladder cancer, and estimated for 2012
Incidence
Mortality
Males
Females
Persons
Males
Females
Persons
1,695
621
2,316
736
295
1,031
1,800
625
2,420
795
340
1,140
16.0
4.6
9.7
6.9
2.0
4.1
15.2–16.8
4.3–5.0
9.3–10.1
6.4–7.4
1.8–2.3
3.9–4.4
15.3
4.3
9.2
6.9
2.2
4.3
2.6
1.2
2.0
3.0
1.6
2.4
Risk to age 75
1 in 113
1 in 403
1 in 178
1 in 384
1 in 1,327
1 in 602
Risk to age 85
1 in 43
1 in 148
1 in 69
1 in 108
1 in 387
1 in 177
73.5
76.2
74.2
77.9
80.7
78.7
Number
2009 incidence/2010 mortality(b)
(c)
2012 (estimated)
(d)
Age-standardised rate
2009 incidence/2010 mortality
95% CI
(c)
2012 (estimated)
Other information for 2009 incidence/2010 mortality
Per cent of all cancer
(e)
Mean age
Rate (per 100,000)
30
Rate (per 100,000)
250
25
200
20
150
15
100
10
Incidence—males
Mortality—males
Incidence—females
Mortality—females
Figure B4.1: Bladder cancer incidence and
mortality rates(d), 1991–2012
Incidence—males
Mortality—males
80–84
70–74
60–64
50–54
40–44
30–34
20–24
10–14
2011
2009
2007
2005
2003
2001
1999
1997
1995
1993
0
1991
0
0–4
50
5
Incidence—females
Mortality—females
Figure B4.2: Bladder cancer incidence (2009) and
mortality (2010) rates(f) by age group
(a)
Based on the IARC (2008) and WCRF & AICR (2007).
(b)
2009 incidence data include estimates for NSW and the ACT. See Appendix F for more details. Mortality data for 2009 and 2010 are revised
and preliminary, respectively, and are subject to further revision.
(c)
2010–2012 estimates for incidence are based on 2000–2009 incidence data. 2011–2012 estimates for mortality are based on 2001–2010
mortality data (see Appendix G). They are rounded to the nearest 10. For estimates less than 1,000 they are rounded to nearest 5. The
estimates for males and females may not add to estimates for persons due to rounding. Estimates are displayed on graph as dotted lines.
(d)
The rates were age-standardised to the Australian population as at 30 June 2001 and are expressed per 100,000 population.
(e)
Mean age for 2009 incidence was calculated excluding NSW and the ACT.
(f)
The rates shown are age-specific rates.
Source: AIHW Australian Cancer Database 2009, AIHW National Mortality Database.
Cancer in Australia: an overview, 2012
103
Bowel cancer (C18–C20)
Risk factors(a):
Table B5: Observed incidence (2009) and mortality (2010) of bowel cancer, and estimated for 2012
Incidence
Mortality
Males
Females
Persons
Males
Females
Persons
7,982
6,428
14,410
2,205
1,777
3,982
8,760
7,080
15,840
2,200
1,760
3,950
73.0
50.5
61.1
20.1
13.0
16.2
71.4–74.6
49.3–51.8
60.1–62.1
19.2–20.9
12.4–13.6
15.7–16.7
72.8
51.5
61.5
18.6
12.2
15.1
12.4
12.9
12.6
9.1
9.6
9.3
Risk to age 75
1 in 19
1 in 28
1 in 23
1 in 83
1 in 136
1 in 103
Risk to age 85
1 in 10
1 in 15
1 in 12
1 in 37
1 in 57
1 in 45
68.5
70.3
69.3
72.3
74.7
73.4
Number
2009 incidence/2010 mortality(b)
(c)
2012 (estimated)
(d)
Age-standardised rate
2009 incidence/2010 mortality
95% CI
(c)
2012 (estimated)
Other information for 2009 incidence/2010 mortality
Per cent of all cancer
(e)
Mean age
Rate (per 100,000)
Rate (per 100,000)
90
600
80
500
70
400
60
50
300
40
200
30
20
Incidence—males
Mortality—males
80–84
70–74
60–64
40–44
30–34
50–54
Incidence—females
Mortality—females
Figure B5.2: Bowel cancer incidence (2009) and
mortality (2010) rates(f) by age group
(a)
Based on the IARC (2008) and WCRF & AICR (2007).
(b)
2009 incidence data include estimates for NSW and the ACT. See Appendix F for more details. Mortality data for 2009 and 2010 are revised
and preliminary, respectively, and are subject to further revision.
(c)
2010–2012 estimates for incidence are based on 2000–2009 incidence data. 2011–2012 estimates for mortality are based on 2001–2010
mortality data (see Appendix G). They are rounded to the nearest 10. For estimates less than 1,000 they are rounded to nearest 5. The
estimates for males and females may not add to estimates for persons due to rounding. Estimates are displayed on graph as dotted lines.
(d)
The rates were age-standardised to the Australian population as at 30 June 2001 and are expressed per 100,000 population.
(e)
Mean age for 2009 incidence was calculated excluding NSW and the ACT.
(f)
The rates shown are age-specific rates.
Source: AIHW Australian Cancer Database 2009, AIHW National Mortality Database.
104
20–24
Incidence—males
Mortality—males
Incidence—females
Mortality—females
Figure B5.1: Bowel cancer incidence and
mortality rates(d), 1991–2012
10–14
2011
2009
2007
2005
2003
2001
1999
1997
1995
1993
0
1991
0
0–4
100
10
Cancer in Australia: an overview, 2012
Brain cancer (C71)
Table B6: Observed incidence (2009) and mortality (2010) of brain cancer, and estimated for 2012
Incidence
Mortality
Males
Females
Persons
Males
Females
Persons
928
667
1,596
735
512
1,247
960
680
1,640
745
520
1,270
8.4
5.7
7.0
6.4
4.1
5.2
7.8–8.9
5.2–6.1
6.6–7.3
6.0–6.9
3.8–4.5
4.9–5.5
8.1
5.4
6.7
6.2
4.0
5.1
1.4
1.3
1.4
3.0
2.8
2.9
Risk to age 75
1 in 148
1 in 226
1 in 179
1 in 190
1 in 300
1 in 233
Risk to age 85
1 in 100
1 in 151
1 in 122
1 in 122
1 in 190
1 in 150
56.8
56.0
56.5
62.3
63.3
62.8
Number
2009 incidence/2010 mortality(a)
(b)
2012 (estimated)
(c)
Age-standardised rate
2009 incidence/2010 mortality
95% CI
(b)
2012 (estimated)
Other information for 2009 incidence/2010 mortality
Per cent of all cancer
Mean age
(d)
Rate (per 100,000)
Rate (per 100,000)
10
35
30
8
25
6
20
15
4
10
2
Incidence—males
Mortality—males
Incidence—females
Mortality—females
Figure B6.1: Brain cancer incidence and
mortality rates(c), 1991–2012
80–84
70–74
60–64
50–54
40–44
30–34
20–24
10–14
0–4
2011
2009
2007
2005
2003
2001
1999
1997
1995
1993
0
1991
0
5
Incidence—males
Incidence—females
Mortality—males
Mortality—females
Figure B6.2: Brain cancer incidence (2009) and
mortality (2010) rates(e) by age group
(a)
2009 incidence data include estimates for NSW and the ACT. See Appendix F for more details. Mortality data for 2009 and 2010 are revised
and preliminary, respectively, and are subject to further revision.
(b)
2010–2012 estimates for incidence are based on 2000–2009 incidence data. 2011–2012 estimates for mortality are based on 2001–2010
mortality data (see Appendix G). They are rounded to the nearest 10. For estimates less than 1,000 they are rounded to nearest 5. The
estimates for males and females may not add to estimates for persons due to rounding. Estimates are displayed on graph as dotted lines.
(c)
The rates were age-standardised to the Australian population as at 30 June 2001 and are expressed per 100,000 population.
(d)
Mean age for 2009 incidence was calculated excluding NSW and the ACT.
(e)
The rates shown are age-specific rates.
Source: AIHW Australian Cancer Database 2009, AIHW National Mortality Database.
Cancer in Australia: an overview, 2012
105
Breast cancer (C50)
Risk factors(a):
Table B7: Observed incidence (2009) and mortality (2010) of breast cancer, and estimated for 2012
Incidence
Mortality
Males
Females
Persons
Males
Females
Persons
110
13,668
13,778
24
2,840
2,864
120
14,560
14,680
25
2,920
2,940
1.0
113.5
59.1
0.2
21.6
11.6
0.8–1.2
111.6–115.4
58.1–60.1
0.1–0.3
20.8–22.4
11.2–12.1
1.0
113.2
58.8
0.2
21.1
11.3
0.2
27.4
12.1
0.1
15.3
6.7
Risk to age 75
1 in 1,457
1 in 11
1 in 21
1 in 8,492
1 in 67
1 in 130
Risk to age 85
1 in 724
1 in 8
1 in 16
1 in 4,367
1 in 39
1 in 72
68.9
60.6
60.7
75.9
69.0
69.0
Number
2009 incidence/2010 mortality(b)
(c)
2012 (estimated)
(d)
Age-standardised rate
2009 incidence/2010 mortality
95% CI
(c)
2012 (estimated)
Other information for 2009 incidence/2010 mortality
Per cent of all cancer
(e)
Mean age
Rate (per 100,000)
Rate (per 100,000)
400
120
350
100
300
80
250
60
200
150
40
Incidence—males
Mortality—males
Incidence—females
Mortality—females
Figure B7.1: Breast cancer incidence and
mortality rates(d), 1991–2012
80–84
70–74
60–64
50–54
40–44
30–34
20–24
Incidence—males
Incidence—females
Mortality—males
Mortality—females
Figure B7.2: Breast cancer incidence (2009) and
mortality (2010) rates(f) by age group
(a)
Based on the IARC (2008) and WCRF & AICR (2007).
(b)
2009 incidence data include estimates for NSW and the ACT. See Appendix F for more details. Mortality data for 2009 and 2010 are revised
and preliminary, respectively, and are subject to further revision.
(c)
2010–2012 estimates for incidence are based on 2000–2009 incidence data. 2011–2012 estimates for mortality are based on 2001–2010
mortality data (see Appendix G). They are rounded to the nearest 10. For estimates less than 1,000 they are rounded to nearest 5. The
estimates for males and females may not add to estimates for persons due to rounding. Estimates are displayed on graph as dotted lines.
(d)
The rates were age-standardised to the Australian population as at 30 June 2001 and are expressed per 100,000 population.
(e)
Mean age for 2009 incidence was calculated excluding NSW and the ACT.
(f)
The rates shown are age-specific rates.
Source: AIHW Australian Cancer Database 2009, AIHW National Mortality Database.
106
10–14
2011
2009
2007
2005
2003
2001
1999
1997
1995
0
1993
0
1991
50
0–4
100
20
Cancer in Australia: an overview, 2012
Cervical cancer (C53)
Risk factors(a):
Table B8: Observed incidence (2009) and mortality (2010) of cervical cancer, and estimated for 2012
Incidence
Mortality
Males
Females
Persons
Males
Females
Persons
..
771
771
..
232
232
..
785
785
..
255
255
2009 incidence/2010 mortality
..
6.7
..
..
1.9
..
95% CI
..
6.3–7.2
..
..
1.6–2.1
..
..
6.6
..
..
1.9
..
Per cent of all cancer
..
1.5
..
..
1.3
..
Risk to age 75
..
1 in 198
..
..
1 in 728
..
Risk to age 85
..
1 in 162
..
..
1 in 494
..
..
50.2
..
..
62.2
..
Number
2009 incidence/2010 mortality(b)
(c)
2012 (estimated)
(d)
Age-standardised rate
(c)
2012 (estimated)
Other information for 2009 incidence/2010 mortality
(e)
Mean age
Rate (per 100,000)
Rate (per 100,000)
14
16
12
14
12
10
10
8
8
6
Incidence—females
80–84
70–74
60–64
50–54
40–44
30–34
20–24
Incidence—females
Mortality—females
Figure B8.1: Cervical cancer incidence and
mortality rates(d), 1991–2012
10–14
2011
2009
2007
2005
2003
2001
1999
1997
0
1995
0
1993
2
1991
4
2
0–4
6
4
Mortality—females
Figure B8.2: Cervical cancer incidence (2009) and
mortality (2010) rates(f) by age group
(a)
Based on the IARC (2008) and WCRF & AICR (2007).
(b)
2009 incidence data include estimates for NSW and the ACT. See Appendix F for more details. Mortality data for 2009 and 2010 are revised
and preliminary, respectively, and are subject to further revision.
(c)
2010–2012 estimates for incidence are based on 2000–2009 incidence data. 2011–2012 estimates for mortality are based on 2001–2010
mortality data (see Appendix G). They are rounded to the nearest 10. For estimates less than 1,000 they are rounded to nearest 5. The
estimates for males and females may not add to estimates for persons due to rounding. Estimates are displayed on graph as dotted lines.
(d)
The rates were age-standardised to the Australian population as at 30 June 2001 and are expressed per 100,000 population.
(e)
Mean age for 2009 incidence was calculated excluding NSW and the ACT.
(f)
The rates shown are age-specific rates.
Source: AIHW Australian Cancer Database 2009, AIHW National Mortality Database.
Cancer in Australia: an overview, 2012
107
Chronic lymphocytic leukaemia (C91.1)
Risk factors(a):
Table B9: Observed incidence (2009) and mortality (2010) of chronic lymphocytic leukaemia, and
estimated for 2012
Incidence
Mortality
Males
Females
Persons
Males
Females
Persons
652
410
1,062
212
142
354
765
465
1,230
230
135
365
6.0
3.2
4.5
2.0
0.9
1.4
5.5–6.5
2.9–3.5
4.2–4.8
1.7–2.3
0.8–1.1
1.3–1.6
6.4
3.3
4.8
2.0
0.9
1.4
1.0
0.8
0.9
0.9
0.8
0.8
Risk to age 75
1 in 228
1 in 448
1 in 304
1 in 1,118
1 in 2,996
1 in 1,641
Risk to age 85
1 in 122
1 in 226
1 in 161
1 in 404
1 in 868
1 in 567
69.6
70.4
69.9
77.0
82.4
79.2
Number
2009 incidence/2010 mortality(b)
(c)
2012 (estimated)
(d)
Age-standardised rate
2009 incidence/2010 mortality
95% CI
(c)
2012 (estimated)
Other information for 2009 incidence/2010 mortality
Per cent of all cancer
(e)
Mean age
Rate (per 100,000)
Rate (per 100,000)
8
60
7
50
6
40
5
4
30
3
20
2
Incidence—males
Mortality—males
Incidence—females
Mortality—females
Figure B9.1: Chronic lymphocytic leukaemia
incidence and mortality rates(d), 1991–2012
80–84
70–74
60–64
50–54
40–44
30–34
20–24
Incidence—males
Mortality—males
Incidence—females
Mortality—females
Figure B9.2: Chronic lymphocytic leukaemia
incidence (2009) and mortality (2010) rates(f) by
age group
(a)
Based on the IARC (2008) and WCRF & AICR (2007).
(b)
2009 incidence data include estimates for NSW and the ACT. See Appendix F for more details. Mortality data for 2009 and 2010 are revised
and preliminary, respectively, and are subject to further revision.
(c)
2010–2012 estimates for incidence are based on 2000–2009 incidence data. 2011–2012 estimates for mortality are based on 2001–2010
mortality data (see Appendix G). They are rounded to the nearest 10. For estimates less than 1,000 they are rounded to nearest 5. The
estimates for males and females may not add to estimates for persons due to rounding. Estimates are displayed on graph as dotted lines.
(d)
The rates were age-standardised to the Australian population as at 30 June 2001 and are expressed per 100,000 population.
(e)
Mean age for 2009 incidence was calculated excluding NSW and the ACT.
(f)
The rates shown are age-specific rates.
Source: AIHW Australian Cancer Database 2009, AIHW National Mortality Database.
108
10–14
2011
2009
2007
2005
2003
2001
1999
1997
1995
1993
0
1991
0
0–4
10
1
Cancer in Australia: an overview, 2012
Cancer of the gallbladder and bile ducts cancer
(C23–C24)
Risk factors(a):
Table B10: Observed incidence (2009) and mortality (2010) of cancer of the gallbladder and bile ducts
cancer, and estimated for 2012
Incidence
Mortality
Males
Females
Persons
Males
Females
Persons
2009 incidence/2010 mortality(b)
313
369
682
98
159
257
2012 (estimated)(c)
345
415
760
115
185
300
2.9
2.8
2.9
0.9
1.2
1.0
2.6–3.2
2.6–3.2
2.7–3.1
0.7–1.1
1.0–1.4
0.9–1.2
2.9
2.9
2.9
1
1.3
1.1
0.5
0.7
0.6
0.4
0.9
0.6
Risk to age 75
1 in 541
1 in 551
1 in 546
1 in 1,979
1 in 1,657
1 in 1,800
Risk to age 85
1 in 256
1 in 243
1 in 248
1 in 737
1 in 597
1 in 654
71.1
74.1
72.7
74.1
77
75.9
Number
Age-standardised rate(d)
2009 incidence/2010 mortality
95% CI
2012 (estimated)(c)
Other information for 2009 incidence/2010 mortality
Per cent of all cancer
Mean age(e)
Rate (per 100,000)
Rate (per 100,000)
35
4
30
3
25
20
2
15
10
1
Incidence—males
Mortality—males
Incidence—females
Mortality—females
Figure B10.1: Cancer of the gallblader and bile
ducts cancer incidence and mortality rates(d),
1991–2012
Incidence—males
Mortality—males
80–84
70–74
60–64
50–54
40–44
30–34
20–24
10–14
2011
2009
2007
2005
2003
2001
1999
1997
1995
1993
0
0–4
5
1991
0
Incidence—females
Mortality—females
Figure B10.2: Cancer of the gallbladder and bile
ducts cancer indicende (2009) and mortality
(2010) rates(f) by age group
(a)
Based on the IARC (2008) and WCRF & AICR (2007).
(b)
2009 incidence data include estimates for NSW and the ACT. See Appendix F for more details. Mortality data for 2009 and 2010 are revised
and preliminary, respectively, and are subject to further revision.
(c)
2010–2012 estimates for incidence are based on 2000–2009 incidence data. 2011–2012 estimates for mortality are based on 2001–2010
mortality data (see Appendix G). They are rounded to the nearest 10. For estimates less than 1,000 they are rounded to nearest 5. The
estimates for males and females may not add to estimates for persons due to rounding. Estimates are displayed on graph as dotted lines.
(d)
The rates were age-standardised to the Australian population as at 30 June 2001 and are expressed per 100,000 population.
(e)
Mean age for 2009 incidence was calculated excluding NSW and the ACT.
(f)
The rates shown are age-specific rates.
Source: AIHW Australian Cancer Database 2009, AIHW National Mortality Database.
Cancer in Australia: an overview, 2012
109
Hodgkin lymphoma (C81)
Risk factors(a):
Table B11: Observed incidence (2009) and mortality (2010) of hodgkin lymphoma, and estimated for
2012
Incidence
Mortality
Males
Females
Persons
Males
Females
Persons
286
261
547
44
40
84
305
265
570
40
35
75
2.6
2.3
2.5
0.4
0.3
0.4
2.3–2.9
2.1–2.6
2.3–2.7
0.3–0.6
0.2–0.4
0.3–0.4
2.7
2.3
2.5
0.4
0.3
0.3
0.4
0.5
0.5
0.2
0.2
0.2
Risk to age 75
1 in 513
1 in 589
1 in 549
1 in 3,864
1 in 5,938
1 in 4,706
Risk to age 85
1 in 443
1 in 484
1 in 463
1 in 1,853
1 in 2,382
1 in 2,095
39.4
40.5
40.0
64.0
66.1
65.0
Number
2009 incidence/2010 mortality(b)
(c)
2012 (estimated)
(d)
Age-standardised rate
2009 incidence/2010 mortality
95% CI
(c)
2012 (estimated)
Other information for 2009 incidence/2010 mortality
Per cent of all cancer
Mean age
(e)
Rate (per 100,000)
Rate (per 100,000)
3
6
5
2
4
3
2
1
Incidence—males
Mortality—males
80–84
70–74
50–54
40–44
30–34
60–64
Incidence—females
Mortality—females
Figure B11.2: Hodgkin lymphoma incidence
(2009) and mortality (2010) rates(f) by age group
(a)
Based on the IARC (2008) and WCRF & AICR (2007).
(b)
2009 incidence data include estimates for NSW and the ACT. See Appendix F for more details. Mortality data for 2009 and 2010 are revised
and preliminary, respectively, and are subject to further revision.
(c)
2010–2012 estimates for incidence are based on 2000–2009 incidence data. 2011–2012 estimates for mortality are based on 2001–2010
mortality data (see Appendix G). They are rounded to the nearest 10. For estimates less than 1,000 they are rounded to nearest 5. The
estimates for males and females may not add to estimates for persons due to rounding. Estimates are displayed on graph as dotted lines.
(d)
The rates were age-standardised to the Australian population as at 30 June 2001 and are expressed per 100,000 population.
(e)
Mean age for 2009 incidence was calculated excluding NSW and the ACT.
(f)
The rates shown are age-specific rates.
Source: AIHW Australian Cancer Database 2009, AIHW National Mortality Database.
110
20–24
Incidence—males
Mortality—males
Incidence—females
Mortality—females
Figure B11.1: Hodgkin lymphoma incidence and
mortality rates(d), 1991–2012
10–14
2011
2009
2007
2005
2003
2001
1999
1997
1995
1993
0
1991
0
0–4
1
Cancer in Australia: an overview, 2012
Kidney cancer (C64)
Risk factors(a):
Table B12: Observed incidence (2009) and mortality (2010) of kidney cancer, and estimated for 2012
Incidence
Mortality
Males
Females
Persons
Males
Females
Persons
1,746
961
2,708
575
352
927
2,000
995
3,000
605
365
970
15.6
7.9
11.5
5.1
2.6
3.7
14.9–16.4
7.4–8.4
11.1–12.0
4.7–5.6
2.3–2.9
3.5–4.0
16.6
7.6
11.9
5.1
2.5
3.7
2.7
1.9
2.4
2.4
1.9
2.2
Risk to age 75
1 in 80
1 in 157
1 in 106
1 in 317
1 in 691
1 in 437
Risk to age 85
1 in 51
1 in 103
1 in 69
1 in 144
1 in 271
1 in 191
63.7
62.9
63.4
71.1
75
72.5
Number
2009 incidence/2010 mortality(b)
(c)
2012 (estimated)
(d)
Age-standardised rate
2009 incidence/2010 mortality
95% CI
(c)
2012 (estimated)
Other information for 2009 incidence/2010 mortality
Per cent of all cancer
(e)
Mean age
Rate (per 100,000)
Rate (per 100,000)
18
80
16
70
14
60
12
50
10
40
8
Incidence—males
Mortality—males
Incidence—females
Mortality—females
Figure B12.1: Kidney cancer incidence and
mortality rates(d), 1991–2012
Incidence—males
Mortality—males
80–84
70–74
60–64
50–54
40–44
30–34
20–24
10–14
2011
2009
2007
2005
2003
2001
0
1999
0
1997
10
1995
2
1993
20
1991
4
0–4
30
6
Incidence—females
Mortality—females
Figure B12.2: Kidney cancer incidence (2009) and
mortality (2010) rates(f) by age group
(a)
Based on the IARC (2008) and WCRF & AICR (2007).
(b)
2009 incidence data include estimates for NSW and the ACT. See Appendix F for more details. Mortality data for 2009 and 2010 are revised
and preliminary, respectively, and are subject to further revision.
(c)
2010–2012 estimates for incidence are based on 2000–2009 incidence data. 2011–2012 estimates for mortality are based on 2001–2010
mortality data (see Appendix G). They are rounded to the nearest 10. For estimates less than 1,000 they are rounded to nearest 5. The
estimates for males and females may not add to estimates for persons due to rounding. Estimates are displayed on graph as dotted lines.
(d)
The rates were age-standardised to the Australian population as at 30 June 2001 and are expressed per 100,000 population.
(e)
Mean age for 2009 incidence was calculated excluding NSW and the ACT.
(f)
The rates shown are age-specific rates.
Source: AIHW Australian Cancer Database 2009, AIHW National Mortality Database.
Cancer in Australia: an overview, 2012
111
Laryngeal cancer (C32)
Risk factors(a):
Table B13: Observed incidence (2009) and mortality (2010) of laryngeal cancer, and estimated for 2012
Incidence
Mortality
Males
Females
Persons
Males
Females
Persons
537
69
606
223
32
255
580
75
660
210
30
245
4.8
0.6
2.6
2.0
0.2
1.1
4.4–5.2
0.4–0.7
2.4–2.8
1.8–2.3
0.2–0.3
0.9–1.2
4.8
0.6
2.6
1.8
0.2
0.9
0.8
0.1
0.5
0.9
0.2
0.6
Risk to age 75
1 in 242
1 in 2,072
1 in 438
1 in 740
1 in 6,140
1 in 1,341
Risk to age 85
1 in 152
1 in 1,401
1 in 286
1 in 336
1 in 2,726
1 in 632
66.2
68.2
66.5
71.9
72.8
72.1
Number
2009 incidence/2010 mortality(b)
(c)
2012 (estimated)
(d)
Age-standardised rate
2009 incidence/2010 mortality
95% CI
(c)
2012 (estimated)
Other information for 2009 incidence/2010 mortality
Per cent of all cancer
Mean age
(e)
Rate (per 100,000)
Rate (per 100,000)
30
9
8
25
7
20
6
5
15
4
10
3
2
Incidence—males
Mortality—males
80–84
70–74
60–64
40–44
30–34
50–54
Incidence—females
Mortality—females
Figure B13.2: Laryngeal cancer incidence (2009)
and mortality (2010) rates(f) by age group
(a)
Based on the IARC (2008) and WCRF & AICR (2007).
(b)
2009 incidence data include estimates for NSW and the ACT. See Appendix F for more details. Mortality data for 2009 and 2010 are revised
and preliminary, respectively, and are subject to further revision.
(c)
2010–2012 estimates for incidence are based on 2000–2009 incidence data. 2011–2012 estimates for mortality are based on 2001–2010
mortality data (see Appendix G). They are rounded to the nearest 10. For estimates less than 1,000 they are rounded to nearest 5. The
estimates for males and females may not add to estimates for persons due to rounding. Estimates are displayed on graph as dotted lines.
(d)
The rates were age-standardised to the Australian population as at 30 June 2001 and are expressed per 100,000 population.
(e)
Mean age for 2009 incidence was calculated excluding NSW and the ACT.
(f)
The rates shown are age-specific rates.
Source: AIHW Australian Cancer Database 2009, AIHW National Mortality Database.
112
20–24
Incidence—males
Mortality—males
Incidence—females
Mortality—females
Figure B13.1: Laryngeal cancer incidence and
mortality rates(d), 1991–2012
10–14
2011
2009
2007
2005
2003
2001
1999
1997
1995
1993
0
1991
0
0–4
5
1
Cancer in Australia: an overview, 2012
Lip cancer (C00)
Risk factors(a):
Table B14: Observed incidence (2009) and mortality (2010) of lip cancer, and estimated for 2012
Incidence
Mortality
Males
Females
Persons
Males
Females
Persons
625
241
865
4
7
11
660
280
945
10
5
15
5.7
1.9
3.7
0.0
0.1
0.0
5.2–6.2
1.7–2.2
3.5–4.0
0.0–0.1
0.0–0.1
0.0–0.1
5.6
2.1
3.8
0.1
0.0
0.1
1.0
0.5
0.8
0.0
0.0
0.0
Risk to age 75
1 in 224
1 in 722
1 in 344
1 in 70,287
1 in 50,168
1 in 57,608
Risk to age 85
1 in 156
1 in 417
1 in 230
1 in 14,895
1 in 13,583
1 in 14,382
59.2
65.9
61.0
63.5
77.7
72.5
Number
2009 incidence/2010 mortality(b)
(c)
2012 (estimated)
(d)
Age-standardised rate
2009 incidence/2010 mortality
95% CI
(c)
2012 (estimated)
Other information for 2009 incidence/2010 mortality
Per cent of all cancer
Rate (per 100,000)
Incidence—males
Mortality—males
Incidence—females
Mortality—females
Figure B14.1: Lip cancer incidence and mortality
rates(d), 1991–2012
Incidence—males
Mortality—males
80–84
70–74
60–64
50–54
40–44
0
30–34
0
20–24
5
2011
2
2009
10
2007
4
2005
15
2003
6
2001
20
1999
8
1997
25
1995
10
1993
30
1991
12
10–14
Rate (per 100,000)
0–4
Mean age
(e)
Incidence—females
Mortality—females
Figure B14.2: Lip cancer incidence (2009) and
mortality (2010) rates(f) by age group
(a)
Based on the IARC (2008) and WCRF & AICR (2007).
(b)
2009 incidence data include estimates for NSW and the ACT. See Appendix F for more details. Mortality data for 2009 and 2010 are revised
and preliminary, respectively, and are subject to further revision.
(c)
2010–2012 estimates for incidence are based on 2000–2009 incidence data. 2011–2012 estimates for mortality are based on 2001–2010
mortality data (see Appendix G). They are rounded to the nearest 10. For estimates less than 1,000 they are rounded to nearest 5. The
estimates for males and females may not add to estimates for persons due to rounding. Estimates are displayed on graph as dotted lines.
(d)
The rates were age-standardised to the Australian population as at 30 June 2001 and are expressed per 100,000 population.
(e)
Mean age for 2009 incidence was calculated excluding NSW and the ACT.
(f)
The rates shown are age-specific rates.
Source: AIHW Australian Cancer Database 2009, AIHW National Mortality Database.
Cancer in Australia: an overview, 2012
113
Liver cancer (C22)
Risk factors(a):
Table B15: Observed incidence (2009) and mortality (2010) of liver cancer, and estimated for 2012
Incidence
Mortality
Males
Females
Persons
Males
Females
Persons
936
368
1,304
890
449
1,339
1,080
395
1,470
975
465
1,440
8.5
2.9
5.5
7.9
3.4
5.5
7.9–9.0
2.6–3.2
5.2–5.9
7.4–8.4
3.1–3.7
5.2–5.8
9.0
2.8
5.8
8.2
3.2
5.6
1.5
0.7
1.1
3.7
2.4
3.1
Risk to age 75
1 in 158
1 in 522
1 in 244
1 in 177
1 in 447
1 in 255
Risk to age 85
1 in 91
1 in 264
1 in 139
1 in 92
1 in 212
1 in 131
65.8
68.7
66.6
68.7
72.8
70.0
Number
2009 incidence/2010 mortality(b)
(c)
2012 (estimated)
(d)
Age-standardised rate
2009 incidence/2010 mortality
95% CI
(c)
2012 (estimated)
Other information for 2009 incidence/2010 mortality
Per cent of all cancer
Mean age
(e)
Rate (per 100,000)
Rate (per 100,000)
60
10
50
8
40
6
30
4
Incidence—males
Mortality—males
Incidence—females
Mortality—females
Figure B15.1: Liver cancer incidence and
mortality rates(d), 1991–2012
80–84
70–74
60–64
50–54
40–44
30–34
20–24
Incidence—males
Mortality—males
Incidence—females
Mortality—females
Figure B15.2: Liver cancer incidence (2009) and
mortality (2010) rates(f) by age group
(a)
Based on the IARC (2008) and WCRF & AICR (2007).
(b)
2009 incidence data include estimates for NSW and the ACT. See Appendix F for more details. Mortality data for 2009 and 2010 are revised
and preliminary, respectively, and are subject to further revision.
(c)
2010–2012 estimates for incidence are based on 2000–2009 incidence data. 2011–2012 estimates for mortality are based on 2001–2010
mortality data (see Appendix G). They are rounded to the nearest 10. For estimates less than 1,000 they are rounded to nearest 5. The
estimates for males and females may not add to estimates for persons due to rounding. Estimates are displayed on graph as dotted lines.
(d)
The rates were age-standardised to the Australian population as at 30 June 2001 and are expressed per 100,000 population.
(e)
Mean age for 2009 incidence was calculated excluding NSW and the ACT.
(f)
The rates shown are age-specific rates.
Source: AIHW Australian Cancer Database 2009, AIHW National Mortality Database.
114
10–14
2011
2009
2007
2005
2003
2001
1999
1997
0
1995
0
1993
10
1991
2
0–4
20
Cancer in Australia: an overview, 2012
Lung cancer (C33–C34)
Risk factors(a):
Table B16: Observed incidence (2009) and mortality (2010) of lung cancer, and estimated for 2012
Incidence
Mortality
Males
Females
Persons
Males
Females
Persons
6,034
4,159
10,193
4,934
3,165
8,099
6,620
4,650
11,280
5,070
3,340
8,410
55.7
33.1
43.2
44.6
24.2
33.3
54.3–57.1
32.1–34.1
42.4–44.1
43.3–45.9
23.3–25.0
32.5–34.0
55.8
34.1
43.9
42.9
24.0
32.5
9.4
8.4
8.9
20.3
17.1
18.9
Risk to age 75
1 in 26
1 in 39
1 in 32
1 in 36
1 in 58
1 in 44
Risk to age 85
1 in 13
1 in 22
1 in 16
1 in 16
1 in 29
1 in 21
71.0
69.9
70.5
72.4
72.0
72.2
Number
2009 incidence/2010 mortality(b)
(c)
2012 (estimated)
(d)
Age-standardised rate
2009 incidence/2010 mortality
95% CI
(c)
2012 (estimated)
Other information for 2009 incidence/2010 mortality
Per cent of all cancer
(e)
Mean age
Rate (per 100,000)
Rate (per 100,000)
80
500
450
70
400
60
350
50
300
250
40
200
30
150
20
100
10
Incidence—males
Mortality—males
80–84
70–74
60–64
50–54
40–44
30–34
20–24
Incidence—males
Mortality—males
Incidence—females
Mortality—females
Figure B16.1: Lung cancer incidence and
mortality rates(d), 1991–2012
10–14
2011
2009
2007
2005
2003
2001
1999
1997
1995
1993
0
0–4
50
1991
0
Incidence—females
Mortality—females
Figure B16.2: Lung cancer incidence (2009) and
mortality (2010) rates(f) by age group
(a)
Based on the IARC (2008) and WCRF & AICR (2007).
(b)
2009 incidence data include estimates for NSW and the ACT. See Appendix F for more details. Mortality data for 2009 and 2010 are revised
and preliminary, respectively, and are subject to further revision.
(c)
2010–2012 estimates for incidence are based on 2000–2009 incidence data. 2011–2012 estimates for mortality are based on 2001–2010
mortality data (see Appendix G). They are rounded to the nearest 10. For estimates less than 1,000 they are rounded to nearest 5. The
estimates for males and females may not add to estimates for persons due to rounding. Estimates are displayed on graph as dotted lines.
(d)
The rates were age-standardised to the Australian population as at 30 June 2001 and are expressed per 100,000 population.
(e)
Mean age for 2009 incidence was calculated excluding NSW and the ACT.
(f)
The rates shown are age-specific rates.
Source: AIHW Australian Cancer Database 2009, AIHW National Mortality Database.
Cancer in Australia: an overview, 2012
115
Melanoma of the skin (C43)
Risk factors(a):
Table B17: Observed incidence (2009) and mortality (2010) of melanoma of the skin, and estimated for
2012
Incidence
Mortality
Males
Females
Persons
Males
Females
Persons
6,764
4,781
11,545
993
459
1,452
7,440
5,070
12,510
1,070
495
1,560
61.7
40.0
49.8
8.9
3.5
5.9
60.3–63.2
38.8–41.1
48.9–50.8
8.4–9.5
3.2–3.8
5.6–6.3
62.7
39.9
50.3
9.1
3.6
6.1
10.5
9.6
10.1
4.1
2.5
3.4
Risk to age 75
1 in 22
1 in 33
1 in 27
1 in 181
1 in 410
1 in 253
Risk to age 85
1 in 14
1 in 23
1 in 17
1 in 85
1 in 226
1 in 128
62.3
58.8
60.8
69.5
69.0
69.4
Number
2009 incidence/2010 mortality(b)
(c)
2012 (estimated)
(d)
Age-standardised rate
2009 incidence/2010 mortality
95% CI
(c)
2012 (estimated)
Other information for 2009 incidence/2010 mortality
Per cent of all cancer
(e)
Mean age
Rate (per 100,000)
Rate (per 100,000)
70
400
60
350
300
50
250
40
200
30
Incidence—males
Mortality—males
Incidence—females
Mortality—females
Figure B17.1: Melanoma of the skin incidence
and mortality rates(d), 1991–2012
80–84
70–74
60–64
50–54
40–44
30–34
20–24
Incidence—males
Mortality—males
Incidence—females
Mortality—females
Figure B17.2: Melanoma of the skin incidence
(2009) and mortality (2010) rates(f) by age group
(a)
Based on the IARC (2008) and WCRF & AICR (2007).
(b)
2009 incidence data include estimates for NSW and the ACT. See Appendix F for more details. Mortality data for 2009 and 2010 are revised
and preliminary, respectively, and are subject to further revision.
(c)
2010–2012 estimates for incidence are based on 2000–2009 incidence data. 2011–2012 estimates for mortality are based on 2001–2010
mortality data (see Appendix G). They are rounded to the nearest 10. For estimates less than 1,000 they are rounded to nearest 5. The
estimates for males and females may not add to estimates for persons due to rounding. Estimates are displayed on graph as dotted lines.
(d)
The rates were age-standardised to the Australian population as at 30 June 2001 and are expressed per 100,000 population.
(e)
Mean age for 2009 incidence was calculated excluding NSW and the ACT.
(f)
The rates shown are age-specific rates.
Source: AIHW Australian Cancer Database 2009, AIHW National Mortality Database.
116
10–14
2011
2009
2007
2005
2003
2001
1999
1997
1995
0
1993
50
0
1991
100
10
0–4
150
20
Cancer in Australia: an overview, 2012
Mesothelioma (C45)
Risk factors(a):
Table B18: Observed incidence (2009) and mortality (2010) of mesothelioma, and estimated for 2012
Incidence
Mortality
Males
Females
Persons
Males
Females
Persons
540
126
666
516
126
642
580
125
705
540
110
645
5.0
1.0
2.8
4.7
1.0
2.6
4.6–5.5
0.8–1.2
2.6–3.1
4.3–5.1
0.8–1.1
2.4–2.9
4.9
0.9
2.7
4.6
0.8
2.5
0.8
0.3
0.6
2.1
0.7
1.5
Risk to age 75
1 in 287
1 in 1,522
1 in 489
1 in 334
1 in 1,356
1 in 543
Risk to age 85
1 in 130
1 in 705
1 in 231
1 in 135
1 in 684
1 in 237
71.8
72.6
72.0
73.9
72.9
73.7
Number
2009 incidence/2010 mortality(b)
(c)
2012 (estimated)
(d)
Age-standardised rate
2009 incidence/2010 mortality
95% CI
(c)
2012 (estimated)
Other information for 2009 incidence/2010 mortality
Per cent of all cancer
Incidence—males
Mortality—males
Incidence—females
Mortality—females
Figure B18.1: Mesothelioma incidence and
mortality rates(d), 1991–2012
Incidence—males
Mortality—males
80–84
70–74
60–64
50–54
40–44
0
30–34
0
20–24
10
2011
1
2009
20
2007
2
2005
30
2003
3
2001
40
1999
4
1997
50
1995
5
1993
60
1991
6
10–14
Rate (per 100,000)
Rate (per 100,000)
0–4
Mean age
(e)
Incidence—females
Mortality—females
Figure B18.2: Mesothelioma incidence (2009) and
mortality (2010) rates(f) by age group
(a)
Based on the IARC (2008) and WCRF & AICR (2007).
(b)
2009 incidence data include estimates for NSW and the ACT. See Appendix F for more details. Mortality data for 2009 and 2010 are revised
and preliminary, respectively, and are subject to further revision.
(c)
2010–2012 estimates for incidence are based on 2000–2009 incidence data. 2011–2012 estimates for mortality are based on 2001–2010
mortality data (see Appendix G). They are rounded to the nearest 10. For estimates less than 1,000 they are rounded to nearest 5. The
estimates for males and females may not add to estimates for persons due to rounding. Estimates are displayed on graph as dotted lines.
(d)
The rates were age-standardised to the Australian population as at 30 June 2001 and are expressed per 100,000 population.
(e)
Mean age for 2009 incidence was calculated excluding NSW and the ACT.
(f)
The rates shown are age-specific rates.
Source: AIHW Australian Cancer Database 2009, AIHW National Mortality Database.
Cancer in Australia: an overview, 2012
117
Mouth cancer (C03–C06)
Risk factors(a):
Table B19: Observed incidence (2009) and mortality (2010) of mouth cancer, and estimated for 2012
Incidence
Mortality
Males
Females
Persons
Males
Females
Persons
362
192
554
72
49
121
360
220
580
80
60
140
3.2
1.5
2.3
0.6
0.4
0.5
2.9–3.6
1.3–1.8
2.2–2.5
0.5–0.8
0.3–0.5
0.4–0.6
3.0
1.6
2.3
0.7
0.4
0.5
0.6
0.4
0.5
0.3
0.3
0.3
Risk to age 75
1 in 378
1 in 853
1 in 527
1 in 2,081
1 in 4,267
1 in 2,810
Risk to age 85
1 in 251
1 in 491
1 in 336
1 in 1,245
1 in 2,298
1 in 1,646
63.8
68.1
65.2
66.1
75.3
69.9
Number
2009 incidence/2010 mortality(b)
(c)
2012 (estimated)
(d)
Age-standardised rate
2009 incidence/2010 mortality
95% CI
(c)
2012 (estimated)
Other information for 2009 incidence/2010 mortality
Per cent of all cancer
Mean age
(e)
Rate (per 100,000)
Rate (per 100,000)
16
4
14
12
3
10
8
2
6
4
1
Incidence—males
Mortality—males
Incidence—females
Mortality—females
Figure B19.1: Mouth cancer incidence and
mortality rates(d), 1991–2012
80–84
70–74
60–64
50–54
40–44
30–34
20–24
Incidence—males
Mortality—males
Incidence—females
Mortality—females
Figure B19.2: Mouth cancer incidence (2009) and
mortality (2010) rates(f) by age group
(a)
Based on the IARC (2008) and WCRF & AICR (2007).
(b)
2009 incidence data include estimates for NSW and the ACT. See Appendix F for more details. Mortality data for 2009 and 2010 are revised
and preliminary, respectively, and are subject to further revision.
(c)
2010–2012 estimates for incidence are based on 2000–2009 incidence data. 2011–2012 estimates for mortality are based on 2001–2010
mortality data (see Appendix G). They are rounded to the nearest 10. For estimates less than 1,000 they are rounded to nearest 5. The
estimates for males and females may not add to estimates for persons due to rounding. Estimates are displayed on graph as dotted lines.
(d)
The rates were age-standardised to the Australian population as at 30 June 2001 and are expressed per 100,000 population.
(e)
Mean age for 2009 incidence was calculated excluding NSW and the ACT.
(f)
The rates shown are age-specific rates.
Source: AIHW Australian Cancer Database 2009, AIHW National Mortality Database.
118
10–14
2011
2009
2007
2005
2003
2001
1999
1997
1995
1993
0
1991
0
0–4
2
Cancer in Australia: an overview, 2012
Multiple primary cancers (C97)
Table B20: Observed mortality (2010) of multiple primary cancers, and estimated for 2012
Incidence(a)
Mortality
Males
Females
Persons
Males
Females
Persons
..
..
..
325
178
503
..
..
..
430
250
680
2009 incidence/2010 mortality
..
..
..
3.1
1.3
2.0
95% CI
..
..
..
2.7–3.4
1.1–1.5
1.8–2.2
..
..
..
3.7
1.7
2.5
Per cent of all cancer
..
..
..
1.3
1.0
1.2
Risk to age 75
..
..
..
1 in 843
1 in 1,504
1 in 1,088
Risk to age 85
..
..
..
1 in 240
1 in 530
1 in 342
Mean age
..
..
..
77.5
75.8
76.9
Number
2009 incidence/2010 mortality(b)
(c)
2012 (estimated)
(d)
Age-standardised rate
(c)
2012 (estimated)
Other information for 2009 incidence/2010 mortality
Rate (per 100,000)
Rate (per 100,000)
70
5
60
4
50
3
40
2
30
20
1
Mortality—males
Mortality—females
Figure B20.1: Multiple primary cancers mortality
rates(d), 1991–2012
Mortality—males
80–84
70–74
60–64
50–54
40–44
30–34
20–24
10–14
0–4
2011
2009
2007
2005
2003
2001
1999
1997
1995
1993
0
1991
0
10
Mortality—females
Figure B20.2: Multiple primary cancers mortality
(2010) rates(e) by age group
(a)
Of relevance for mortality data only.
(b)
Mortality data for 2009 and 2010 are revised and preliminary, respectively, and are subject to further revision.
(c)
2011–2012 estimates for mortality are based on 2001–2010 mortality data (see Appendix G). They are rounded to the nearest 10. For
estimates less than 1,000 they are rounded to nearest 5. The estimates for males and females may not add to estimates for persons due to
rounding. Estimates are displayed on graph as dotted lines.
(d)
The rates were age-standardised to the Australian population as at 30 June 2001 and are expressed per 100,000 population.
(e)
The rates shown are age-specific rates.
Source: AIHW Australian Cancer Database 2009, AIHW National Mortality Database.
Cancer in Australia: an overview, 2012
119
Myelodysplastic syndrome (D46)
Table B21: Observed incidence (2009) and mortality (2010) of myelodysplastic syndrome, and
estimated for 2012
Incidence
Mortality
Males
Females
Per sons
Males
Females
Persons
713
471
1,185
209
144
353
810
520
1,330
265
180
440
6.9
3.5
5.0
2.0
0.9
1.4
6.4–7.4
3.2–3.8
4.7–5.3
1.8–2.3
0.8–1.1
1.2–1.5
7.0
3.5
5.1
2.3
1.1
1.6
1.1
0.9
1.0
0.9
0.8
0.8
Risk to age 75
1 in 318
1 in 531
1 in 401
1 in 2,607
1 in 7,496
1 in 3,909
Risk to age 85
1 in 103
1 in 214
1 in 144
1 in 434
1 in 886
1 in 600
75.3
75.7
75.4
81.9
84.4
82.9
Number
2009 incidence/2010 mortality(a)
(b)
2012 (estimated)
(c)
Age-standardised rate
2009 incidence/2010 mortality
95% CI
(b)
2012 (estimated)
Other information for 2009 incidence/2010 mortality
Per cent of all cancer
Mean age
(d)
Rate (per 100,000)
Rate (per 100,000)
9
140
8
120
7
100
6
5
80
4
60
3
40
2
Incidence—males
Mortality—males
Incidence—females
Mortality—females
Figure B21.1: Myelodysplastic syndrome
incidence and mortality rates(c), 1991–2012
80–84
70–74
60–64
50–54
40–44
30–34
20–24
Incidence—males
Mortality—males
Incidence—females
Mortality—females
Figure B21.2: Myelodysplastic syndrome
incidence (2009) and mortality (2010) rates(e) by
age group
(a)
2009 incidence data include estimates for NSW and the ACT. See Appendix F for more details. Mortality data for 2009 and 2010 are revised
and preliminary, respectively, and are subject to further revision.
(b)
2010–2012 estimates for incidence are based on 2000–2009 incidence data. 2011–2012 estimates for mortality are based on 2001–2010
mortality data (see Appendix G). They are rounded to the nearest 10. For estimates less than 1,000 they are rounded to nearest 5. The
estimates for males and females may not add to estimates for persons due to rounding. Estimates are displayed on graph as dotted lines.
(c)
The rates were age-standardised to the Australian population as at 30 June 2001 and are expressed per 100,000 population.
(d)
Mean age for 2009 incidence was calculated excluding NSW and the ACT.
(e)
The rates shown are age-specific rates.
Source: AIHW Australian Cancer Database 2009, AIHW National Mortality Database.
120
10–14
2011
2009
2007
2005
2003
2001
1999
1997
1995
1993
0
1991
0
0–4
20
1
Cancer in Australia: an overview, 2012
Myeloma (C90)
Table B22: Observed incidence (2009) and mortality (2010) of myeloma, and estimated for 2012
Incidence
Mortality
Males
Females
Persons
Males
Females
Persons
864
661
1,525
473
351
824
895
650
1,540
495
395
890
7.9
5.2
6.5
4.3
2.6
3.3
7.4–8.4
4.8–5.6
6.1–6.8
3.9–4.7
2.3–2.9
3.1–3.6
7.5
4.7
6.0
4.2
2.8
3.4
1.3
1.3
1.3
1.9
1.9
1.9
Risk to age 75
1 in 173
1 in 271
1 in 212
1 in 404
1 in 620
1 in 491
Risk to age 85
1 in 92
1 in 134
1 in 110
1 in 156
1 in 248
1 in 195
68.6
70.0
69.2
73.2
75.7
74.3
Number
2009 incidence/2010 mortality(a)
(b)
2012 (estimated)
(c)
Age-standardised rate
2009 incidence/2010 mortality
95% CI
(b)
2012 (estimated)
Other information for 2009 incidence/2010 mortality
Per cent of all cancer
Mean age
(d)
Rate (per 100,000)
Rate (per 100,000)
8
70
7
60
6
50
5
40
4
30
3
Incidence—males
Mortality—males
80–84
70–74
60–64
50–54
40–44
30–34
20–24
Incidence—males
Mortality—males
Incidence—females
Mortality—females
Figure B22.1: Myeloma incidence and mortality
rates(c), 1991–2012
10–14
2011
2009
2007
2005
2003
2001
1999
1997
0
1995
0
1993
10
1991
1
0–4
20
2
Incidence—females
Mortality—females
Figure B22.2: Myeloma incidence (2009) and
mortality (2010) rates(e) by age group
(a)
2009 incidence data include estimates for NSW and the ACT. See Appendix F for more details. Mortality data for 2009 and 2010 are revised
and preliminary, respectively, and are subject to further revision.
(b)
2010–2012 estimates for incidence are based on 2000–2009 incidence data. 2011–2012 estimates for mortality are based on 2001–2010
mortality data (see Appendix G). They are rounded to the nearest 10. For estimates less than 1,000 they are rounded to nearest 5. The
estimates for males and females may not add to estimates for persons due to rounding. Estimates are displayed on graph as dotted lines.
(c)
The rates were age-standardised to the Australian population as at 30 June 2001 and are expressed per 100,000 population.
(d)
Mean age for 2009 incidence was calculated excluding NSW and the ACT.
(e)
The rates shown are age-specific rates.
Source: AIHW Australian Cancer Database 2009, AIHW National Mortality Database.
Cancer in Australia: an overview, 2012
121
Non-Hodgkin lymphoma (C82–C85)
Risk factors(a):
Table B23: Observed incidence (2009) and mortality (2010) of non-Hodgkin lymphoma, and estimated
for 2012
Incidence
Mortality
Males
Females
Persons
Males
Females
Persons
2,466
1,915
4,381
781
557
1,338
2,620
2,070
4,680
800
640
1,440
22.5
15.5
18.7
7.1
4.0
5.4
21.6–23.4
14.8–16.2
18.2–19.3
6.6–7.6
3.7–4.3
5.1–5.7
22.0
15.6
18.6
6.8
4.3
5.5
3.8
3.8
3.8
3.2
3.0
3.1
Risk to age 75
1 in 62
1 in 87
1 in 72
1 in 243
1 in 531
1 in 336
Risk to age 85
1 in 35
1 in 51
1 in 42
1 in 100
1 in 175
1 in 130
63.8
66.0
64.7
72.1
76.2
73.8
Number
2009 incidence/2010 mortality(b)
(c)
2012 (estimated)
(d)
Age-standardised rate
2009 incidence/2010 mortality
95% CI
(c)
2012 (estimated)
Other information for 2009 incidence/2010 mortality
Per cent of all cancer
(e)
Mean age
Rate (per 100,000)
Rate (per 100,000)
25
160
140
20
120
100
15
80
10
60
40
5
Figure B23.1: Non-Hodgkin lymphoma
incidence and mortality rates(d), 1991–2012
80–84
70–74
60–64
50–54
40–44
30–34
Incidence—males
Mortality—males
Incidence—females
Mortality—females
Figure B23.2: Non-Hodgkin lymphoma
incidence (2009) and mortality (2010) rates(f) by
age group
(a)
Based on the IARC (2008) and WCRF & AICR (2007).
(b)
2009 incidence data include estimates for NSW and the ACT. See Appendix F for more details. Mortality data for 2009 and 2010 are revised
and preliminary, respectively, and are subject to further revision.
(c)
2010–2012 estimates for incidence are based on 2000–2009 incidence data. 2011–2012 estimates for mortality are based on 2001–2010
mortality data (see Appendix G). They are rounded to the nearest 10. For estimates less than 1,000 they are rounded to nearest 5. The
estimates for males and females may not add to estimates for persons due to rounding. Estimates are displayed on graph as dotted lines.
(d)
The rates were age-standardised to the Australian population as at 30 June 2001 and are expressed per 100,000 population.
(e)
Mean age for 2009 incidence was calculated excluding NSW and the ACT.
(f)
The rates shown are age-specific rates.
Source: AIHW Australian Cancer Database 2009, AIHW National Mortality Database.
122
20–24
0–4
2011
2009
2007
Incidence—females
Mortality—females
10–14
Incidence—males
Mortality—males
2005
2003
2001
1999
1997
1995
1993
0
1991
0
20
Cancer in Australia: an overview, 2012
Non-melanoma skin cancer (C44)(a)
Risk factors(b):
Table B24: Observed incidence (2009) and mortality (2010) of non-melanoma skin cancer, and
estimated for 2012
Incidence
Mortality
Males
Females
Persons
Males
Females
Persons
469
313
782
304
141
445
490
325
815
350
155
505
4.4
2.4
3.3
2.8
0.9
1.8
4.0–4.9
2.1–2.7
3.1–3.5
2.5–3.2
0.8–1.1
1.6–1.9
4.2
2.3
3.1
3.0
1.0
1.9
0.7
0.6
0.7
1.2
0.8
1.0
Risk to age 75
1 in 406
1 in 797
1 in 542
1 in 930
1 in 3,165
1 in 1,449
Risk to age 85
1 in 162
1 in 341
1 in 227
1 in 289
1 in 1,034
1 in 474
70.9
70.6
70.8
75.8
81.9
77.8
Number
2009 incidence/2010 mortality(c)
(d)
2012 (estimated)
(e)
Age-standardised rate
2009 incidence/2010 mortality
95% CI
(d)
2012 (estimated)
Other information for 2009 incidence/2010 mortality
Per cent of all cancer
Mean age
(f)
Rate (per 100,000)
Rate (per 100,000)
400
5
350
4
300
3
250
2
150
200
100
1
Incidence—males
Mortality—males
Incidence—females
Mortality—females
Figure B24.1: Non-melanoma skin cancer
incidence and mortality rates(e), 1991–2012
(a)
Incidence—males
Mortality—males
80–84
70–74
60–64
50–54
40–44
30–34
20–24
10–14
2011
2009
2007
2005
2003
2001
1999
1997
1995
1993
0
0–4
50
1991
0
Incidence—females
Mortality—females
Figure B24.2: Non-melanoma skin cancer
incidence (2009) and mortality (2010) rates(g) by
age group
For incidence data, those C44 codes that indicate basal or squamous cell carcinoma of the skin are not included.
(b)
Based on the IARC (2008) and WCRF & AICR (2007).
(c)
2009 incidence data include estimates for NSW and the ACT. See Appendix F for more details. Mortality data for 2009 and 2010 are revised
and preliminary, respectively, and are subject to further revision.
(d)
2010–2012 estimates for incidence are based on 2000–2009 incidence data. 2011–2012 estimates for mortality are based on 2001–2010
mortality data (see Appendix G). They are rounded to the nearest 10. For estimates less than 1,000 they are rounded to nearest 5. The
estimates for males and females may not add to estimates for persons due to rounding. Estimates are displayed on graph as dotted lines.
(e)
The rates were age-standardised to the Australian population as at 30 June 2001 and are expressed per 100,000 population.
(f)
Mean age for 2009 incidence was calculated excluding NSW and the ACT.
(g)
The rates shown are age-specific rates.
Source: AIHW Australian Cancer Database 2009, AIHW National Mortality Database.
Cancer in Australia: an overview, 2012
123
Oesophageal cancer (C15)
Risk factors(a):
Table B25: Observed incidence (2009) and mortality (2010) of oesophageal cancer, and estimated for
2012
Incidence
Mortality
Males
Females
Persons
Males
Females
Persons
917
397
1,314
879
344
1,223
1,000
445
1,450
960
395
1,350
8.3
3.0
5.5
7.8
2.5
5.0
7.8–8.9
2.7–3.3
5.2–5.8
7.2–8.3
2.2–2.7
4.7–5.3
8.4
3.1
5.6
8.0
2.7
5.2
1.4
0.8
1.2
3.6
1.9
2.9
Risk to age 75
1 in 158
1 in 547
1 in 247
1 in 173
1 in 735
1 in 282
Risk to age 85
1 in 86
1 in 233
1 in 129
1 in 92
1 in 297
1 in 144
68.0
74.1
69.7
68.9
75.9
70.9
Number
2009 incidence/2010 mortality(b)
(c)
2012 (estimated)
(d)
Age-standardised rate
2009 incidence/2010 mortality
95% CI
(c)
2012 (estimated)
Other information for 2009 incidence/2010 mortality
Per cent of all cancer
Mean age
(e)
Rate (per 100,000)
Rate (per 100,000)
60
10
50
8
40
6
30
4
Incidence—males
Mortality—males
Incidence—females
Mortality—females
Figure B25.1: Oesophageal cancer incidence and
mortality rates(d), 1991–2012
80–84
70–74
60–64
50–54
40–44
30–34
20–24
Incidence—males
Mortality—males
Incidence—females
Mortality—females
Figure B25.2: Oesophageal cancer incidence
(2009) and mortality (2010) rates(f) by age group
(a)
Based on the IARC (2008) and WCRF & AICR (2007).
(b)
2009 incidence data include estimates for NSW and the ACT. See Appendix F for more details. Mortality data for 2009 and 2010 are revised
and preliminary, respectively, and are subject to further revision.
(c)
2010–2012 estimates for incidence are based on 2000–2009 incidence data. 2011–2012 estimates for mortality are based on 2001–2010
mortality data (see Appendix G). They are rounded to the nearest 10. For estimates less than 1,000 they are rounded to nearest 5. The
estimates for males and females may not add to estimates for persons due to rounding. Estimates are displayed on graph as dotted lines.
(d)
The rates were age-standardised to the Australian population as at 30 June 2001 and are expressed per 100,000 population.
(e)
Mean age for 2009 incidence was calculated excluding NSW and the ACT.
(f)
The rates shown are age-specific rates.
Source: AIHW Australian Cancer Database 2009, AIHW National Mortality Database.
124
10–14
2011
2009
2007
2005
2003
2001
1999
1997
0
1995
0
1993
10
1991
2
0–4
20
Cancer in Australia: an overview, 2012
Cancer of other digestive organs (C26)
Table B26: Observed incidence (2009) and mortality (2010) of cancer of other digestive organs, and
estimated for 2012
Incidence
Mortality
Males
Females
Persons
Males
Females
Persons
74
95
169
713
641
1,354
80
95
180
965
835
1,800
0.7
0.7
0.7
6.5
4.4
5.4
0.6–0.9
0.5–0.8
0.6–0.8
6.0–7.0
4.1–4.8
5.1–5.7
0.7
0.6
0.7
8.2
5.5
6.8
0.1
0.2
0.1
2.9
3.5
3.2
Risk to age 75
1 in 3,343
1 in 4,199
1 in 3,725
1 in 270
1 in 526
1 in 359
Risk to age 85
1 in 1,044
1 in 1,245
1 in 1,142
1 in 111
1 in 176
1 in 138
75.4
80.9
78.5
73.6
78.4
75.9
Number
2009 incidence/2010 mortality(a)
(b)
2012 (estimated)
(c)
Age-standardised rate
2009 incidence/2010 mortality
95% CI
(b)
2012 (estimated)
Other information for 2009 incidence/2010 mortality
Per cent of all cancer
Mean age
(d)
Rate (per 100,000)
Rate (per 100,000)
9
100
8
90
80
7
70
6
60
5
50
4
40
3
30
2
Incidence—males
Mortality—males
Incidence—females
Mortality—females
Figure B26.1: Cancer of other digestive organs
incidence and mortality rates(c), 1991–2012
Incidence—males
Mortality—males
80–84
70–74
60–64
50–54
40–44
30–34
20–24
10–14
2011
2009
2007
2005
2003
2001
1999
1997
1995
1993
0
1991
10
0
0–4
20
1
Incidence—females
Mortality—females
Figure B26.2: Cancer of other digestive organs
incidence (2009) and mortality (2010) rates(e) by
age group
(a)
2009 incidence data include estimates for NSW and the ACT. See Appendix F for more details. Mortality data for 2009 and 2010 are revised
and preliminary, respectively, and are subject to further revision.
(b)
2010–2012 estimates for incidence are based on 2000–2009 incidence data. 2011–2012 estimates for mortality are based on 2001–2010
mortality data (see Appendix G). They are rounded to the nearest 10. For estimates less than 1,000 they are rounded to nearest 5. The
estimates for males and females may not add to estimates for persons due to rounding. Estimates are displayed on graph as dotted lines.
(c)
The rates were age-standardised to the Australian population as at 30 June 2001 and are expressed per 100,000 population.
(d)
Mean age for 2009 incidence was calculated excluding NSW and the ACT.
(e)
The rates shown are age-specific rates.
Source: AIHW Australian Cancer Database 2009, AIHW National Mortality Database.
Cancer in Australia: an overview, 2012
125
Other myeloproliferative cancers (C94.1, C94.3,
C96.2, D45, D47.1, D47.3)
Table B27: Observed incidence (2009) and mortality (2010) of other myeloproliferative cancers, and
estimated for 2012
Incidence
Mortality
Males
Females
Persons
Males
Females
Persons
360
313
673
90
72
162
375
340
710
100
90
190
3.3
2.5
2.9
0.8
0.5
0.6
3.0–3.7
2.2–2.8
2.7–3.1
0.7–1.0
0.4–0.6
0.5–0.7
3.2
2.5
2.8
0.9
0.6
0.7
0.6
0.6
0.6
0.4
0.4
0.4
Risk to age 75
1 in 449
1 in 540
1 in 492
1 in 2,852
1 in 6,147
1 in 3,932
Risk to age 85
1 in 226
1 in 310
1 in 265
1 in 933
1 in 2,288
1 in 1,378
66.6
66.4
66.5
75.5
81.4
78.1
Number
2009 incidence/2010 mortality(a)
(b)
2012 (estimated)
(c)
Age-standardised rate
2009 incidence/2010 mortality
95% CI
(b)
2012 (estimated)
Other information for 2009 incidence/2010 mortality
Per cent of all cancer
Mean age
(d)
Rate (per 100,000)
Rate (per 100,000)
5
30
4
25
20
3
15
2
Incidence—males
Mortality—males
Incidence—females
Mortality—females
Figure B27.1: Other myeloproliferative cancers
incidence and mortality rates(c), 1991–2012
80–84
70–74
60–64
50–54
40–44
30–34
20–24
Incidence—males
Mortality—males
Incidence—females
Mortality—females
Figure B27.2: Other myeloproliferative cancers
incidence (2009) and mortality (2010) rates(e) by
age group
(a)
2009 incidence data include estimates for NSW and the ACT. See Appendix F for more details. Mortality data for 2009 and 2010 are revised
and preliminary, respectively, and are subject to further revision.
(b)
2010–2012 estimates for incidence are based on 2000–2009 incidence data. 2011–2012 estimates for mortality are based on 2001–2010
mortality data (see Appendix G). They are rounded to the nearest 10. For estimates less than 1,000 they are rounded to nearest 5. The
estimates for males and females may not add to estimates for persons due to rounding. Estimates are displayed on graph as dotted lines.
(c)
The rates were age-standardised to the Australian population as at 30 June 2001 and are expressed per 100,000 population.
(d)
Mean age for 2009 incidence was calculated excluding NSW and the ACT.
(e)
The rates shown are age-specific rates.
Source: AIHW Australian Cancer Database 2009, AIHW National Mortality Database.
126
10–14
2011
2009
2007
2005
2003
2001
1999
1997
0
1995
0
1993
5
1991
1
0–4
10
Cancer in Australia: an overview, 2012
Other soft tissue cancers (C47, C49)
Table B28: Observed incidence (2009) and mortality (2010) of other soft tissue cancers, and estimated
for 2012
Incidence
Mortality
Males
Females
Persons
Males
Females
Persons
313
254
567
147
134
281
345
275
620
135
120
255
2.9
2.1
2.5
1.3
1.1
1.2
2.6–3.2
1.9–2.4
2.3–2.7
1.1–1.6
0.9–1.2
1.0–1.3
3.0
2.2
2.5
1.2
0.9
1.0
0.5
0.5
0.5
0.6
0.7
0.7
Risk to age 75
1 in 499
1 in 627
1 in 557
1 in 1,018
1 in 1,308
1 in 1,147
Risk to age 85
1 in 287
1 in 464
1 in 362
1 in 624
1 in 839
1 in 721
59.8
55.1
57.7
62.0
64.3
63.1
Number
2009 incidence/2010 mortality(a)
(b)
2012 (estimated)
(c)
Age-standardised rate
2009 incidence/2010 mortality
95% CI
(b)
2012 (estimated)
Other information for 2009 incidence/2010 mortality
Per cent of all cancer
Mean age
(d)
Rate (per 100,000)
Rate (per 100,000)
70
4
60
3
50
40
2
30
20
1
Incidence—males
Mortality—males
Incidence—females
Mortality—females
Figure B28.1: Other soft tissue cancers incidence
and mortality rates(c), 1991–2012
Incidence—males
Mortality—males
80–84
70–74
60–64
50–54
40–44
30–34
20–24
10–14
2011
2009
2007
2005
2003
2001
1999
1997
1995
1993
0
1991
0
0–4
10
Incidence—females
Mortality—females
Figure B28.2: Other soft tissue cancers incidence
(2009) and mortality (2010) rates(e) by age group
(a)
2009 incidence data include estimates for NSW and the ACT. See Appendix F for more details. Mortality data for 2009 and 2010 are revised
and preliminary, respectively, and are subject to further revision.
(b)
2010–2012 estimates for incidence are based on 2000–2009 incidence data. 2011–2012 estimates for mortality are based on 2001–2010
mortality data (see Appendix G). They are rounded to the nearest 10. For estimates less than 1,000 they are rounded to nearest 5. The
estimates for males and females may not add to estimates for persons due to rounding. Estimates are displayed on graph as dotted lines.
(c)
The rates were age-standardised to the Australian population as at 30 June 2001 and are expressed per 100,000 population.
(d)
Mean age for 2009 incidence was calculated excluding NSW and the ACT.
(e)
The rates shown are age-specific rates.
Source: AIHW Australian Cancer Database 2009, AIHW National Mortality Database.
Cancer in Australia: an overview, 2012
127
Ovarian cancer (C56)
Risk factors(a):
Table B29: Observed incidence (2009) and mortality (2010) of ovarian cancer, and estimated for 2012
Incidence
Mortality
Males
Females
Persons
Males
Females
Persons
..
1,338
1,338
..
912
912
..
1,410
1,410
..
975
975
2009 incidence/2010 mortality
..
10.9
..
..
7.0
..
95% CI
..
10.3–11.5
..
..
6.6–7.5
..
..
10.7
..
..
7.0
..
Per cent of all cancer
..
2.7
..
..
4.9
..
Risk to age 75
..
1 in 116
..
..
1 in 194
..
Risk to age 85
..
1 in 75
..
..
1 in 103
..
..
64.4
..
..
69.9
..
Number
2009 incidence/2010 mortality(b)
(c)
2012 (estimated)
(d)
Age-standardised rate
(c)
2012 (estimated)
Other information for 2009 incidence/2010 mortality
(e)
Mean age
Rate (per 100,000)
Rate (per 100,000)
14
60
12
50
10
40
8
30
6
Incidence—females
Mortality—females
Figure B29.1: Ovarian cancer incidence and
mortality rates(d), 1991–2012
80–84
70–74
60–64
50–54
40–44
30–34
20–24
Incidence—females
Mortality—females
Figure B29.2: Ovarian cancer incidence (2009)
and mortality (2010) rates(f) by age group
(a)
Based on the IARC (2008) and WCRF & AICR (2007).
(b)
2009 incidence data include estimates for NSW and the ACT. See Appendix F for more details. Mortality data for 2009 and 2010 are revised
and preliminary, respectively, and are subject to further revision.
(c)
2010–2012 estimates for incidence are based on 2000–2009 incidence data. 2011–2012 estimates for mortality are based on 2001–2010
mortality data (see Appendix G). They are rounded to the nearest 10. For estimates less than 1,000 they are rounded to nearest 5. The
estimates for males and females may not add to estimates for persons due to rounding. Estimates are displayed on graph as dotted lines.
(d)
The rates were age-standardised to the Australian population as at 30 June 2001 and are expressed per 100,000 population.
(e)
Mean age for 2009 incidence was calculated excluding NSW and the ACT.
(f)
The rates shown are age-specific rates.
Source: AIHW Australian Cancer Database 2009, AIHW National Mortality Database.
128
10–14
2011
2009
2007
2005
2003
2001
1999
1997
0
1995
0
1993
10
1991
2
0–4
20
4
Cancer in Australia: an overview, 2012
Pancreatic cancer (C25)
Risk factors(a):
Table B30: Observed incidence (2009) and mortality (2010) of pancreatic cancer, and estimated for 2012
Incidence
Mortality
Males
Females
Persons
Males
Females
Persons
1,309
1,237
2,546
1,233
1,201
2,434
1,450
1,290
2,740
1,300
1,200
2,500
12.0
9.5
10.7
11.1
8.9
9.9
11.4–12.7
8.9–10.0
10.3–11.1
10.5–11.7
8.4–9.4
9.5–10.3
12.1
9.1
10.5
10.9
8.4
9.6
2.0
2.5
2.2
5.1
6.5
5.7
Risk to age 75
1 in 122
1 in 165
1 in 141
1 in 134
1 in 194
1 in 159
Risk to age 85
1 in 60
1 in 77
1 in 68
1 in 64
1 in 76
1 in 70
69.4
72.5
70.9
71.0
75.0
73.0
Number
2009 incidence/2010 mortality(b)
(c)
2012 (estimated)
(d)
Age-standardised rate
2009 incidence/2010 mortality
95% CI
(c)
2012 (estimated)
Other information for 2009 incidence/2010 mortality
Per cent of all cancer
Mean age
(e)
Rate (per 100,000)
Rate (per 100,000)
14
120
12
100
10
80
8
60
6
Incidence—males
Mortality—males
Incidence—females
Mortality—females
Figure B30.1: Pancreatic cancer incidence and
mortality rates(d), 1991–2012
Incidence—males
Mortality—males
80–84
70–74
60–64
50–54
40–44
30–34
20–24
10–14
2011
2009
2007
2005
2003
2001
1999
1997
0
1995
0
1993
20
1991
2
0–4
40
4
Incidence—females
Mortality—females
Figure B30.2: Pancreatic cancer incidence (2009)
and mortality (2010) rates(f) by age group
(a)
Based on the IARC (2008) and WCRF & AICR (2007).
(b)
2009 incidence data include estimates for NSW and the ACT. See Appendix F for more details. Mortality data for 2009 and 2010 are revised
and preliminary, respectively, and are subject to further revision.
(c)
2010–2012 estimates for incidence are based on 2000–2009 incidence data. 2011–2012 estimates for mortality are based on 2001–2010
mortality data (see Appendix G). They are rounded to the nearest 10. For estimates less than 1,000 they are rounded to nearest 5. The
estimates for males and females may not add to estimates for persons due to rounding. Estimates are displayed on graph as dotted lines.
(d)
The rates were age-standardised to the Australian population as at 30 June 2001 and are expressed per 100,000 population.
(e)
Mean age for 2009 incidence was calculated excluding NSW and the ACT.
(f)
The rates shown are age-specific rates.
Source: AIHW Australian Cancer Database 2009, AIHW National Mortality Database.
Cancer in Australia: an overview, 2012
129
Prostate cancer (C61)
Risk factors(a):
Table B31: Observed incidence (2009) and mortality (2010) of prostate cancer, and estimated for 2012
Incidence
Mortality
Males
Females
Persons
Males
Females
Persons
19,438
..
19,438
3,235
..
3,235
18,560
..
18,560
3,410
..
3,410
171.9
..
..
30.6
..
..
169.5–174.3
..
..
29.6–31.7
..
..
147.9
..
..
29.7
..
..
30.2
..
..
13.3
..
..
Risk to age 75
1 in 7
..
..
1 in 105
..
..
Risk to age 85
1 in 5
..
..
1 in 25
..
..
67.4
..
..
80.0
..
..
Number
2009 incidence/2010 mortality(b)
(c)
2012 (estimated)
(d)
Age-standardised rate
2009 incidence/2010 mortality
95% CI
(c)
2012 (estimated)
Other information for 2009 incidence/2010 mortality
Per cent of all cancer
(e)
Mean age
Rate (per 100,000)
Incidence—males
Incidence—males
Mortality—males
Figure B31.1: Prostate cancer incidence and
mortality rates(d), 1991–2012
80–84
70–74
60–64
40–44
50–54
Mortality—males
Figure B31.2: Prostate cancer incidence (2009)
and mortality (2010) rates(f) by age group
(a)
Based on the IARC (2008) and WCRF & AICR (2007).
(b)
2009 incidence data include estimates for NSW and the ACT. See Appendix F for more details. Mortality data for 2009 and 2010 are revised
and preliminary, respectively, and are subject to further revision.
(c)
2010–2012 estimates for incidence are based on 2000–2009 incidence data. 2011–2012 estimates for mortality are based on 2001–2010
mortality data (see Appendix G). They are rounded to the nearest 10. For estimates less than 1,000 they are rounded to nearest 5. The
estimates for males and females may not add to estimates for persons due to rounding. Estimates are displayed on graph as dotted lines.
(d)
The rates were age-standardised to the Australian population as at 30 June 2001 and are expressed per 100,000 population.
(e)
Mean age for 2009 incidence was calculated excluding NSW and the ACT.
(f)
The rates shown are age-specific rates.
Source: AIHW Australian Cancer Database 2009, AIHW National Mortality Database.
130
30–34
0
20–24
100
0
10–14
200
20
2011
300
40
2009
60
2007
400
2005
80
2003
500
2001
600
100
1999
700
120
1997
800
140
1995
900
160
1993
1,000
180
1991
200
0–4
Rate (per 100,000)
Cancer in Australia: an overview, 2012
Stomach cancer (C16)
Risk factors(a):
Table B32: Observed incidence (2009) and mortality (2010) of stomach cancer, and estimated for 2012
Incidence
Mortality
Males
Females
Persons
Males
Females
Persons
1,317
702
2,019
719
375
1,094
1,420
770
2,190
700
415
1,120
12.1
5.5
8.5
6.6
2.8
4.5
11.5–12.8
5.1–5.9
8.2–8.9
6.1–7.1
2.5–3.1
4.2–4.8
11.9
5.5
8.5
5.9
2.9
4.3
2.0
1.4
1.8
3.0
2.0
2.6
Risk to age 75
1 in 115
1 in 275
1 in 163
1 in 256
1 in 666
1 in 374
Risk to age 85
1 in 61
1 in 137
1 in 86
1 in 112
1 in 272
1 in 163
68.9
71
69.6
71.6
73.6
72.3
Number
2009 incidence/2010 mortality(b)
(c)
2012 (estimated)
(d)
Age-standardised rate
2009 incidence/2010 mortality
95% CI
(c)
2012 (estimated)
Other information for 2009 incidence/2010 mortality
Per cent of all cancer
Mean age
(e)
Rate (per 100,000)
Rate (per 100,000)
120
20
18
100
16
14
80
12
60
10
8
40
6
4
Incidence—males
Mortality—males
Incidence—females
Mortality—females
Figure B32.1: Stomach cancer incidence and
mortality rates(d), 1991–2012
Incidence—males
Mortality—males
80–84
70–74
60–64
50–54
40–44
30–34
20–24
10–14
2011
2009
2007
2005
2003
2001
1999
1997
1995
1993
0
1991
0
0–4
20
2
Incidence—females
Mortality—females
Figure B32.2: Stomach cancer incidence (2009)
and mortality (2010) rates(f) by age group
(a)
Based on the IARC (2008) and WCRF & AICR (2007).
(b)
2009 incidence data include estimates for NSW and the ACT. See Appendix F for more details. Mortality data for 2009 and 2010 are revised
and preliminary, respectively, and are subject to further revision.
(c)
2010–2012 estimates for incidence are based on 2000–2009 incidence data. 2011–2012 estimates for mortality are based on 2001–2010
mortality data (see Appendix G). They are rounded to the nearest 10. For estimates less than 1,000 they are rounded to nearest 5. The
estimates for males and females may not add to estimates for persons due to rounding. Estimates are displayed on graph as dotted lines.
(d)
The rates were age-standardised to the Australian population as at 30 June 2001 and are expressed per 100,000 population.
(e)
Mean age for 2009 incidence was calculated excluding NSW and the ACT.
(f)
The rates shown are age-specific rates.
Source: AIHW Australian Cancer Database 2009, AIHW National Mortality Database.
Cancer in Australia: an overview, 2012
131
Testicular cancer (C62)
Risk factors(a):
Table B33: Observed incidence (2009) and mortality (2010) of testicular cancer, and estimated for 2012
Incidence
Mortality
Males
Females
Persons
Males
Females
Persons
751
..
751
23
..
23
740
..
740
20
..
20
6.9
..
..
0.2
..
..
6.4–7.4
..
..
0.1–0.3
..
..
6.7
..
..
0.2
..
..
1.2
..
..
0.1
..
..
Risk to age 75
1 in 204
..
..
1 in 5,719
..
..
Risk to age 85
1 in 202
..
..
1 in 5,719
..
..
35.6
..
..
47.6
..
..
Number
2009 incidence/2010 mortality(b)
(c)
2012 (estimated)
(d)
Age-standardised rate
2009 incidence/2010 mortality
95% CI
(c)
2012 (estimated)
Other information for 2009 incidence/2010 mortality
Per cent of all cancer
(e)
Mean age
Rate (per 100,000)
Rate (per 100,000)
8
18
7
16
14
6
12
5
10
4
8
3
Incidence—males
Mortality—males
Figure B33.1: Testicular cancer incidence and
mortality rates(d), 1991–2012
80–84
70–74
60–64
50–54
40–44
30–34
20–24
Incidence—males
Mortality—males
Figure B33.2: Testicular cancer incidence (2009)
and mortality (2010) rates(f) by age group
(a)
Based on the IARC (2008) and WCRF & AICR (2007).
(b)
2009 incidence data include estimates for NSW and the ACT. See Appendix F for more details. Mortality data for 2009 and 2010 are revised
and preliminary, respectively, and are subject to further revision.
(c)
2010–2012 estimates for incidence are based on 2000–2009 incidence data. 2011–2012 estimates for mortality are based on 2001–2010
mortality data (see Appendix G). They are rounded to the nearest 10. For estimates less than 1,000 they are rounded to nearest 5. The
estimates for males and females may not add to estimates for persons due to rounding. Estimates are displayed on graph as dotted lines.
(d)
The rates were age-standardised to the Australian population as at 30 June 2001 and are expressed per 100,000 population.
(e)
Mean age for 2009 incidence was calculated excluding NSW and the ACT.
(f)
The rates shown are age-specific rates.
Source: AIHW Australian Cancer Database 2009, AIHW National Mortality Database.
132
10–14
2011
2009
2007
2005
2003
2001
1999
1997
1995
0
1993
2
0
1991
4
1
0–4
6
2
Cancer in Australia: an overview, 2012
Thyroid cancer (C73)
Risk factors(a):
Table B34: Observed incidence (2009) and mortality (2010) of thyroid cancer, and estimated for 2012
Incidence
Mortality
Males
Females
Persons
Males
Females
Persons
503
1,536
2,039
38
76
114
595
1,830
2,420
55
80
130
4.5
13.5
9.1
0.3
0.6
0.5
4.2–5.0
12.9–14.2
8.7–9.5
0.2–0.5
0.4–0.7
0.4–0.6
5.1
15.4
10.3
0.4
0.6
0.5
0.8
3.1
1.8
0.2
0.4
0.3
Risk to age 75
1 in 275
1 in 93
1 in 139
1 in 4,888
1 in 3,763
1 in 4,257
Risk to age 85
1 in 211
1 in 82
1 in 117
1 in 1,922
1 in 1,347
1 in 1,578
54.9
49.6
51.0
72.0
74.1
73.4
Number
2009 incidence/2010 mortality(b)
(c)
2012 (estimated)
(d)
Age-standardised rate
2009 incidence/2010 mortality
95% CI
(c)
2012 (estimated)
Other information for 2009 incidence/2010 mortality
Per cent of all cancer
Mean age
(e)
Rate (per 100,000)
Rate (per 100,000)
30
18
16
25
14
20
12
10
15
8
10
6
4
Incidence—males
Mortality—males
Incidence—females
Mortality—females
Figure B34.1: Thyroid cancer incidence and
mortality rates(d), 1991–2012
Incidence—males
Mortality—males
80–84
70–74
60–64
50–54
40–44
30–34
20–24
10–14
2011
2009
2007
2005
2003
2001
1999
1997
1995
1993
0
1991
0
0–4
5
2
Incidence—females
Mortality—females
Figure B34.2: Thyroid cancer incidence (2009)
and mortality (2010) rates(f) by age group
(a)
Based on the IARC (2008) and WCRF & AICR (2007).
(b)
2009 incidence data include estimates for NSW and the ACT. See Appendix F for more details. Mortality data for 2009 and 2010 are revised
and preliminary, respectively, and are subject to further revision.
(c)
2010–2012 estimates for incidence are based on 2000–2009 incidence data. 2011–2012 estimates for mortality are based on 2001–2010
mortality data (see Appendix G). They are rounded to the nearest 10. For estimates less than 1,000 they are rounded to nearest 5. The
estimates for males and females may not add to estimates for persons due to rounding. Estimates are displayed on graph as dotted lines.
(d)
The rates were age-standardised to the Australian population as at 30 June 2001 and are expressed per 100,000 population.
(e)
Mean age for 2009 incidence was calculated excluding NSW and the ACT.
(f)
The rates shown are age-specific rates.
Source: AIHW Australian Cancer Database 2009, AIHW National Mortality Database.
Cancer in Australia: an overview, 2012
133
Tongue cancer (C01–C02)
Risk factors(a):
Table B35: Observed incidence (2009) and mortality (2010) of tongue cancer, and estimated for 2012
Incidence
Mortality
Males
Females
Persons
Males
Females
Persons
418
200
618
144
60
204
440
205
645
140
65
200
3.7
1.6
2.6
1.3
0.5
0.8
3.3–4.1
1.4–1.9
2.4–2.8
1.1–1.5
0.3–0.6
0.7–1.0
3.6
1.6
2.6
1.1
0.4
0.8
0.6
0.4
0.5
0.6
0.3
0.5
Risk to age 75
1 in 316
1 in 805
1 in 456
1 in 988
1 in 3,889
1 in 1,591
Risk to age 85
1 in 229
1 in 521
1 in 323
1 in 578
1 in 1,779
1 in 895
61.0
63.4
61.8
66.4
70.6
67.6
Number
2009 incidence/2010 mortality(b)
(c)
2012 (estimated)
(d)
Age-standardised rate
2009 incidence/2010 mortality
95% CI
(c)
2012 (estimated)
Other information for 2009 incidence/2010 mortality
Per cent of all cancer
Mean age
(e)
Rate (per 100,000)
Rate (per 100,000)
14
4
12
3
10
8
2
6
4
1
Incidence—males
Mortality—males
Incidence—females
Mortality—females
Figure B35.1: Tongue cancer incidence and
mortality rates(d), 1991–2012
80–84
70–74
60–64
50–54
40–44
30–34
20–24
Incidence—males
Mortality—males
Incidence—females
Mortality—females
Figure B35.2: Tongue cancer incidence (2009) and
mortality (2010) rates(f) by age group
(a)
Based on the IARC (2008) and WCRF & AICR (2007).
(b)
2009 incidence data include estimates for NSW and the ACT. See Appendix F for more details. Mortality data for 2009 and 2010 are revised
and preliminary, respectively, and are subject to further revision.
(c)
2010–2012 estimates for incidence are based on 2000–2009 incidence data. 2011–2012 estimates for mortality are based on 2001–2010
mortality data (see Appendix G). They are rounded to the nearest 10. For estimates less than 1,000 they are rounded to nearest 5. The
estimates for males and females may not add to estimates for persons due to rounding. Estimates are displayed on graph as dotted lines.
(d)
The rates were age-standardised to the Australian population as at 30 June 2001 and are expressed per 100,000 population.
(e)
Mean age for 2009 incidence was calculated excluding NSW and the ACT.
(f)
The rates shown are age-specific rates.
Source: AIHW Australian Cancer Database 2009, AIHW National Mortality Database.
134
10–14
2011
2009
2007
2005
2003
2001
1999
1997
1995
1993
0
1991
0
0–4
2
Cancer in Australia: an overview, 2012
Unknown primary site (C80)(a)
Table B36: Observed incidence (2009) and mortality (2010) of unknown primary site, and estimated for
2012
Incidence
Mortality
Males
Females
Persons
Males
Females
Persons
1,496
1,399
2,895
1,167
1,113
2,280
1,490
1,360
2,850
1,380
1,170
2,550
14.0
10.4
12.0
10.7
7.8
9.2
13.3–14.8
9.8–11.0
11.6–12.5
10.1–11.3
7.4–8.3
8.8–9.6
12.7
9.2
10.8
11.7
7.9
9.6
2.3
2.8
2.5
4.8
6.0
5.3
Risk to age 75
1 in 129
1 in 183
1 in 152
1 in 190
1 in 266
1 in 222
Risk to age 85
1 in 53
1 in 72
1 in 62
1 in 66
1 in 98
1 in 80
71.7
74.8
73.3
73.8
77.7
75.7
Number
2009 incidence/2010 mortality(b)
(c)
2012 (estimated)
(d)
Age-standardised rate
2009 incidence/2010 mortality
95% CI
(c)
2012 (estimated)
Other information for 2009 incidence/2010 mortality
Per cent of all cancer
Rate (per 100,000)
Incidence—males
Mortality—males
Incidence—females
Mortality—females
Figure B36.1: Unknown primary site incidence
and mortality rates(d), 1991–2012
Incidence—males
Mortality—males
80–84
70–74
60–64
50–54
40–44
30–34
20–24
0
2011
0
2009
50
2007
5
2005
100
2003
10
2001
150
1999
15
1997
200
1995
20
1993
250
1991
25
10–14
Rate (per 100,000)
0–4
Mean age
(e)
Incidence—females
Mortality—females
Figure B36.2: Unknown primary site incidence
(2009) and mortality (2010) rates(f) by age group
(a)
For mortality data prior to 2008, the applicable codes are C77–C80.
(b)
2009 incidence data include estimates for NSW and the ACT. See Appendix F for more details. Mortality data for 2009 and 2010 are revised
and preliminary, respectively, and are subject to further revision.
(c)
2010–2012 estimates for incidence are based on 2000–2009 incidence data. 2011–2012 estimates for mortality are based on 2001–2010
mortality data (see Appendix G). They are rounded to the nearest 10. For estimates less than 1,000 they are rounded to nearest 5. The
estimates for males and females may not add to estimates for persons due to rounding. Estimates are displayed on graph as dotted lines.
(d)
The rates were age-standardised to the Australian population as at 30 June 2001 and are expressed per 100,000 population.
(e)
Mean age for 2009 incidence was calculated excluding NSW and the ACT.
(f)
The rates shown are age-specific rates.
Source: AIHW Australian Cancer Database 2009, AIHW National Mortality Database.
Cancer in Australia: an overview, 2012
135
Uterine cancer (C54–C55)
Risk factors(a):
Table B37: Observed incidence (2009) and mortality (2010) of uterine cancer, and estimated for 2012
Incidence
Mortality
Males
Females
Persons
Males
Females
Persons
..
2,105
2,105
..
364
364
..
2,270
2,270
..
395
395
2009 incidence/2010 mortality
..
17.1
..
..
2.7
..
95% CI
..
16.3–17.8
..
..
2.4–3.0
..
..
17.1
..
..
2.8
..
Per cent of all cancer
..
4.2
..
..
2.0
..
Risk to age 75
..
1 in 66
..
..
1 in 558
..
Risk to age 85
..
1 in 48
..
..
1 in 259
..
..
64.1
..
..
74.3
..
Number
2009 incidence/2010 mortality(b)
(c)
2012 (estimated)
(d)
Age-standardised rate
(c)
2012 (estimated)
Other information for 2009 incidence/2010 mortality
(e)
Mean age
Rate (per 100,000)
Rate (per 100,000)
18
70
16
60
14
50
12
10
40
8
30
6
20
4
Incidence—females
80–84
70–74
60–64
40–44
30–34
50–54
Mortality—females
Figure B37.2: Uterine cancer incidence (2009) and
mortality (2010) rates(f) by age group
(a)
Based on the IARC (2008) and WCRF & AICR (2007).
(b)
2009 incidence data include estimates for NSW and the ACT. See Appendix F for more details. Mortality data for 2009 and 2010 are revised
and preliminary, respectively, and are subject to further revision.
(c)
2010–2012 estimates for incidence are based on 2000–2009 incidence data. 2011–2012 estimates for mortality are based on 2001–2010
mortality data (see Appendix G). They are rounded to the nearest 10. For estimates less than 1,000 they are rounded to nearest 5. The
estimates for males and females may not add to estimates for persons due to rounding. Estimates are displayed on graph as dotted lines.
(d)
The rates were age-standardised to the Australian population as at 30 June 2001 and are expressed per 100,000 population.
(e)
Mean age for 2009 incidence was calculated excluding NSW and the ACT.
(f)
The rates shown are age-specific rates.
Source: AIHW Australian Cancer Database 2009, AIHW National Mortality Database.
136
20–24
Incidence—females
Mortality—females
Figure B37.1: Uterine cancerincidence and
mortality rates(d), 1991–2012
10–14
2011
2009
2007
2005
2003
2001
1999
1997
1995
1993
0
1991
0
0–4
10
2
Cancer in Australia: an overview, 2012
Appendix C Cancer incidence and
mortality for all cancer groupings
Table C1: Number of new cases (2009) and deaths (2010) by cancer type, persons, Australia
Incidence(a)
Mortality(a)
Number
ASR(b)
95% CI
Number
ASR(b)
95% CI
Lip (C00)
865
3.7
3.5–4.0
11
0.0
0.0–0.1
Tongue (C01–C02)
618
2.6
2.4–2.8
204
0.8
0.7–1.0
Mouth (C03–C06)
554
2.3
2.2–2.5
121
0.5
0.4–0.6
Salivary glands (C07–C08)
265
1.1
1.0–1.3
88
0.4
0.3–0.4
Oropharynx (C09–C10)
447
1.9
1.7–2.1
147
0.6
0.5–0.7
Nasopharynx (C11)
118
0.5
0.4–0.6
48
0.2
0.1–0.3
Hypopharynx (C12–C13)
174
0.7
0.6–0.9
65
0.3
0.2–0.3
82
0.3
0.3–0.4
79
0.3
0.3–0.4
Oesophagus (C15)
1,314
5.5
5.2–5.8
1,223
5.0
4.7–5.3
Stomach (C16)
2,019
8.5
8.2–8.9
1,094
4.5
4.2–4.8
404
1.7
1.6–1.9
99
0.4
0.3–0.5
14,410
61.1
60.1–62.1
3,982
16.2
15.7–16.7
Anus (C21)
337
1.4
1.3–1.6
74
0.3
0.2–0.4
Liver (C22)
1,304
5.5
5.2–5.9
1,339
5.5
5.2–5.8
682
2.9
2.7–3.1
257
1.0
0.9–1.2
2,546
10.7
10.3–11.1
2,434
9.9
9.5–10.3
169
0.7
0.6–0.8
1,354
5.4
5.1–5.7
Nose, sinuses, etc. (C30–C31)
166
0.7
0.6–0.8
38
0.2
0.1–0.2
Larynx (C32)
606
2.6
2.4–2.8
255
1.1
0.9–1.2
10,193
43.2
42.4–44.1
8,099
33.3
32.5–34.0
Other thoracic and respiratory organs (C37–C39)
104
0.5
0.4–0.6
57
0.2
0.2–0.3
Bone (C40–C41)
185
0.8
0.7–1.0
114
0.5
0.4–0.6
11,545
49.8
48.9–50.8
1,452
5.9
5.6–6.3
782
3.3
3.1–3.5
445
1.8
1.6–1.9
Cancer site/type (ICD-10 codes)
Lip, oral cavity and pharynx
Other sites in pharynx, etc. (C14)
Digestive organs
Small intestine (C17)
Bowel (C18–C20)
Gallbladder & bile ducts (C23–C24)
Pancreas (C25)
Other digestive organs (C26)
Respiratory system and intrathoracic organs
Lung (C33–C34)
Skin
Melanoma of skin (C43)
(c)
Non-melanoma of the skin (C44)
(continued)
Cancer in Australia: an overview, 2012
137
Table C1 (continued): Number of new cases (2009) and deaths (2010) by cancer type, persons,
Australia
Incidence(a)
Mortality(a)
Number
ASR(b)
95% CI
Number
ASR(b)
95% CI
666
2.8
2.6–3.1
642
2.6
2.4–2.9
60
0.3
0.2–0.3
4
0.0
0.0–0.0
Peritoneum (C48)
206
0.9
0.8–1.0
95
0.4
0.3–0.5
Other soft tissue (C47, C49)
567
2.5
2.3–2.7
281
1.2
1.0–1.3
13,778
59.1
58.1–60.1
2,864
11.6
11.2–12.1
311
..
..
68
..
..
Vagina (C52)
69
..
..
21
..
..
Cervix (C53)
771
..
..
232
..
..
Uterus (C54–C55)
2,105
..
..
364
..
..
Ovary (C56)
1,338
..
..
912
..
..
112
..
..
39
..
..
82
..
..
17
..
..
19,438
..
..
3,235
..
..
751
..
..
23
..
..
22
..
..
4
..
..
Kidney (C64)
2,708
11.5
11.1–12.0
927
3.7
3.5–4.0
Bladder (C67)
2,316
9.7
9.3–10.1
1,031
4.1
3.9–4.4
460
2.0
1.8–2.1
110
0.4
0.4–0.5
252
1.1
1.0–1.2
46
0.2
0.1–0.3
1,596
7.0
6.6–7.3
1,247
5.2
4.9–5.5
88
0.4
0.3–0.5
20
0.1
0.1–0.1
2,039
9.1
8.7–9.5
114
0.5
0.4–0.6
101
0.5
0.4–0.6
59
0.3
0.2–0.3
547
2.5
2.3–2.7
84
0.4
0.3–0.4
4,381
18.7
18.2–19.3
1,338
5.4
5.1–5.7
103
0.4
0.4–0.5
38
0.1
0.1–0.2
1,525
6.5
6.1–6.8
824
3.3
3.1–3.6
326
1.5
1.4–1.7
97
0.4
0.3–0.5
Cancer site/type (ICD-10 codes)
Mesothelioma and soft tissue
Mesothelioma (C45)
Kaposi sarcoma (C46)
Breast (C50)
Female genital organs
Vulva (C51)
Other female genital organs and placenta
(C57–C58)
Male genital organs
Penis (C60)
Prostate (C61)
Testis (C62)
Other male genital organs (C63)
Urinary tract
Other urinary organs (C65–C66, C68)
Eye, brain and other parts of the central nervous system
Eye (C69)
Brain (C71)
Other central nervous system (C70, C72)
Thyroid and other endocrine glands
Thyroid (C73)
Other endocrine glands (C74–C75)
Blood and lymphatic system
Hodgkin lymphoma (C81)
Non-Hodgkin lymphoma (C82–C85)
Immunoproliferative cancers (C88)
Myeloma (C90)
Acute lymphoblastic leukaemia (C91.0)
(continued)
138
Cancer in Australia: an overview, 2012
Table C1 (continued): Number of new cases (2009) and deaths (2010) by cancer type, persons,
Australia
Incidence(a)
Mortality(a)
Number
ASR(b)
95% CI
Number
ASR(b)
95% CI
1,062
4.5
4.2–4.8
354
1.4
1.3–1.6
111
0.5
0.4–0.6
34
0.1
0.1–0.2
6,531
28.1
27.4–28.8
2,769
11.2
10.8–11.7
Chronic myelogenous leukaemia (C92.1)
290
1.3
1.1–1.4
95
0.4
0.3–0.5
Other myeloproliferative cancer (C94.1, C94.3,
C96.2, D45, D47.1, D47.3)
673
2.9
2.7–3.1
162
0.6
0.5–0.7
1,185
5.0
4.7–5.3
353
1.4
1.2–1.5
Acute myeloid leukaemia (C92.0, C92.3–C92.5,
C93.0, C94.0, C94.2, C94.4, C94.5)
898
3.9
3.6–4.1
800
3.3
3.1–3.5
Unspecified myeloid leukaemia (C92.2, C92.7,
C92.9, C93.1–C93.9, C94.7)
274
1.1
1.0–1.3
114
0.5
0.4–0.5
3,319
14.1
13.6–14.6
1,524
6.1
5.8–6.5
105
0.4
0.4–0.5
154
0.6
0.5–0.7
37
0.2
0.1–0.2
180
0.7
0.6–0.8
2,895
12.0
11.6–12.5
2,280
9.2
8.8–9.6
..
..
..
503
2.0
1.8–2.2
114,137
485.7
484.3–488.6
42,844
174.3
172.7–176.0
Cancer site/type (ICD-10 codes)
Chronic lymphocytic leukaemia (C91.1)
Other and unspecified lymphoid leukaemia
(C91.2–C91.9)
Total lymphoid cancers (C81–C85, C88, C90, C91)
Myelodysplastic syndrome (D46)
Total myeloid cancers (C92–C94, C96.2, D45, D46,
D47.1, D47.3)
Other cancers of blood and lymphatic system
(C95, C96.0, C96.1, C96.3–C96.9)
Other
Other and ill-defined sites (C76)
(d)
Unknown primary site (C80)
(e)
Multiple primary cancers (C97)
(c)
All cancers (C00–C97 , D45, D46, D47.1, D47.3)
(a)
2009 incidence data include estimates for NSW and the ACT. See Appendix F for more details. Mortality data for 2010 are preliminary and
are subject to further revision.
(b)
The rates were age-standardised to the Australian population as at 30 June 2001 and expressed by 100,000 population.
(c)
For incidence data, those C44 codes that indicate basal or squamous cell carcinoma of the skin are not included.
(d)
For mortality data before 2008, the applicable codes are C77–C80.
(e)
Of relevance for mortality data only.
Source: AIHW Australian Cancer Database 2009, AIHW National Mortality Database.
Cancer in Australia: an overview, 2012
139
Appendix D Guide to online
supplementary tables
Additional tables are available as online Excel tables at <www.aihw.gov.au>. These tables
contain detailed statistics, some of which are presented in summary form in the body of the
report. Throughout the report, online additional tables are referred to with a ‘D’, for
example, ‘See online Table D1.1’.
There are 8 Excel files, each representing a chapter from the report:
140
•
Chapter 2—Incidence of cancer
•
Chapter 3—Mortality from cancer
•
Chapter 4—Survival after a diagnosis of cancer
•
Chapter 5—Prevalence of cancer
•
Chapter 6—Differences across population groups
•
Chapter 7—Burden of disease due to cancer
•
Chapter 8—Hospitalisations and palliative care for cancer
•
Chapter 9—National cancer screening programs.
Cancer in Australia: an overview, 2012
Appendix E Classifications
Australian Standard Geographical Classification
Remoteness Areas
The Australian Standard Geographical Classification (ASGC) Remoteness Areas was used to
assign areas across Australia to a remoteness category (ABS 2006). This classification
allocates one in five remoteness categories to areas depending on their distance from
different-sized urban centres, where the population size of the urban centre is considered to
govern the range and type of services available.
Areas are classified as Major cities, Inner regional, Outer regional, Remote and Very remote
(AIHW 2004). The category Major cities includes Australia’s capital cities, with the exceptions
of Hobart and Darwin, which are classified as Inner regional. For this report, the categories of
Remote and Very remote were collapsed due to the small number of cases in these two
subgroups.
The remoteness category was assigned to a cancer case according to the postal areas of
residence at the time of diagnosis, and it was assigned to a cancer death according to the
statistical local area of residence at time of death.
Index of Relative Socio-economic Disadvantage
The Index of Relative Socio-economic Disadvantage (IRSD) is one of four Socio-Economic
Indexes for Areas (SEIFAs) developed by the Australian Bureau of Statistics (ABS 2008a).
This index is based on factors such as average household income, education levels and
unemployment rates. Rather than being a person-based measure, the IRSD is an area-based
measure of socioeconomic status in which small areas of Australia are classified on a
continuum from disadvantaged to affluent. This information is used as a proxy for the
socioeconomic status of people living in those areas and may not be correct for each person
in that area.
Socioeconomic status quintiles were assigned to cancer cases and deaths according to the
IRSD of the statistical local area of residence at the time of diagnosis or death.
In this report, the first socioeconomic status group (labelled ‘1’) corresponds to geographical
areas containing the 20% of the population with the lowest socioeconomic status according
to the IRSD, and the fifth group (labelled ‘5’) corresponds to the 20% of the population with
the highest socioeconomic status.
International Classification of Diseases for Oncology
Cancers were originally classified solely under the ICD classification system, based on
topographic site and behaviour. However, during the creation of the ninth revision of ICD in
the late 1960s, working parties suggested the creation of a separate classification for cancers
that included improved morphological information. The first edition of the International
Classification of Diseases for Oncology (ICD-O) was subsequently released in 1976 and, in
this classification, cancers were coded by both morphology (histology type and behaviour)
and topography (site).
Cancer in Australia: an overview, 2012
141
Since the first edition of the ICD-O, a number of revisions have been made, mainly in the
area of lymphomas and leukaemias. The current edition, the third, was released in 2000
(Fritz et al. 2000) and is used by most state and territory cancer registries in Australia, as well
as by the AIHW in regard to the Australian Cancer Database.
International Statistical Classification of Diseases
and Related Health Problems
The International Statistical Classification of Diseases and Related Health Problems (ICD) is
used to classify diseases and other health problems (including symptoms and injuries) in
clinical and administrative records. The use of a standard classification system enables the
storage and retrieval of diagnostic information for clinical and epidemiological purposes that
is comparable between different service providers, across countries and over time.
In 1903, Australia adopted the ICD to classify causes of death and it was fully phased in by
1906. Since 1906, the ICD has been revised nine times in response to the recognition of new
diseases (for example, Acquired Immunodeficiency Syndrome, or AIDS), increased
knowledge of diseases, and changing terminology in the description of diseases. The version
currently in use, ICD-10 (WHO 1992), was endorsed by the 43rd World Health Assembly in
May 1990 and officially came into use in WHO member states from 1994.
International Statistical Classification of Diseases
and Related Health Problems, Australian
Modification
The Australian modification of ICD-10, which is referred to as the ICD-10-AM (NCCH 2010),
is based on ICD-10. ICD-10 was modified for the Australian setting by the National Centre
for Classification in Health with assistance from clinicians and clinical coders. Despite the
modifications, compatibility with ICD-10 at the higher levels (that is, up to 4 character codes)
of the classification has been maintained. ICD-10-AM has been used for classifying diagnoses
in hospital records in all states and territories since 1999–00 (AIHW 2000).
Australian Classification of Health Interventions
The current version of the ICD does not incorporate a classification system for coding health
interventions (that is, procedures). In Australia, a health intervention classification system
was designed to be implemented at the same time as the ICD-10-AM in July 1998. The
system was based on the Medicare Benefits Schedule (MBS) coding system and originally
called MBS-Extended. The name was changed to the Australian Classification of Health
Interventions (ACHI) with the release of the third revision of the ICD-10-AM in July 2002
(NCCH 2010). ACHI and ICD-10-AM are used together for classifying morbidity, surgical
procedures and other health interventions in Australian hospital records.
Standard Australian Classification of Countries
The Standard Australian Classification of Countries (SACC) is the Australian statistical
standard for statistics classified by country (ABS 2008c). It is a classification of countries that
142
Cancer in Australia: an overview, 2012
is essentially based on the concept of geographic proximity. It groups neighbouring
countries into progressively broader geographical areas on the basis of their similarity in
terms of social, cultural, economic and political characteristics. The first edition of the SACC
was published in 1998, and the second—the one used in this report—was released by the
ABS in 2008.
Cancer in Australia: an overview, 2012
143
Appendix F Constructing the 2009
Australian Cancer Database
The 1982–2009 data files for New South Wales and the Australian Capital Territory were not
available for inclusion in the 2009 version of the Australian Cancer Database (ACD). An
extended delay of the receipt of mortality data has meant that New South Wales and the
Australian Capital Territory have not been able to close off their 2009 data sets. As a
consequence, 2009 cancer data for these jurisdictions are not available for reporting
purposes. The 2009 incidence data for New South Wales and the Australian Capital Territory
were estimated by the AIHW in consultation with New South Wales and the Australian
Capital Territory cancer registries. The estimates were combined with the actual data
supplied by other state and territory cancer registries to form a 1982–2009 national cancer
data set. These steps are explained in more details below.
To construct the 2009 ACD, the 2009 estimates for New South Wales and the Australian
Capital Territory were combined with the actual data supplied by other state and territory
cancer registries to form a 1982–2009 national cancer data set. The process is summarised in
Figure F1.
Actual 1982–2008 data
for NSW and the ACT,
as submitted in 2011 and after
national deduplication
Estimated 2009 data
for NSW and the ACT
Simulated 1982–2009 data
for NSW and the ACT
= actual 1982–2008 data
+ estimated 2009 data
Actual 1982–2009 data
for the other jurisdictions,
as submitted in 2012
2009 Australian Cancer Database
Figure F1: Outline of how the 2009 Australian Cancer Database was constructed
144
Cancer in Australia: an overview, 2012
Estimating 2009 cancer incidence for New South
Wales and the Australian Capital Territory
To estimate 2009 cancer incidence for New South Wales and the Australian Capital Territory,
with the exception of prostate cancer (detailed below), the most recent 10 years of incidence
count data from the 2008 version of the ACD were divided into time series stratified by the
following:
•
Year of diagnosis: 1999, …, 2008.
•
Jurisdiction: New South Wales, Australian Capital Territory.
•
Sex: Male, female.
•
Age group: 5-year age groups 0–4, …, 80–84, and 85+.
•
Cancer type: For the non-haematological cancers, cancer type was defined by the 3character ICD-10 codes C00–C80 (excluding C61 prostate cancer). For the haematological
cancers, cancer type was defined by the 3rd edition of the International Classification of
Diseases for Oncology (ICD-O-3) histology codes M9590–M9989. This enabled flexibility
for grouping according to different classification schemes.
For each time series, the following steps were undertaken to estimate cancer incidence:
•
The incidence numbers were divided by the sex-age-specific mid-year populations to
obtain the age-specific incidence rates from 1999 to 2008.
•
Least squares linear regression was used to find the straight line of best fit through the
time series.
•
A 5% level of significance was used to test the hypothesis that the slope of the line was
different from zero.
•
If the slope was not found to be significantly different from zero, the mean of the rates
was used as the estimate of the 2009 rate.
•
If the slope was found to be positive, the straight line of best fit was extrapolated to
obtain the estimate of the 2009 rate.
•
If the slope was negative, the time series was fitted with a log-linear model (that is, the
logs of the rates were fitted with a straight line) and the estimated rate for 2009 was
found by extrapolating this line.
•
The estimated incidence rates for 2009 were then multiplied by the Estimated Resident
Population for 2009 to obtain the estimated incidence numbers.
•
Time series that contained a rate of zero were always fitted with the mean value of the
series, irrespective of the outcome of the significance test. This was done to ensure that
fitted lines never crossed the x-axis no matter how far forward or backward they were
extrapolated.
There were a small number of series that did not have a history of 10 years of incidence data.
These were non-melanoma skin cancer (ICD-10 code C44; series begins at 2001) and the
myelodysplastic and/or myeloproliferative cancers (M9950, M9960–M9962, M9980–M9989;
series begin at 2003). In these cases, the method was adjusted to account for the shorter time
series.
Cancer in Australia: an overview, 2012
145
Estimating the incidence of prostate cancer
Due to the effect of PSA testing, prostate cancer incidence rates have fluctuated considerably
over time making the above methodology unsuitable for estimating the incidence of prostate
cancer. Instead, the relationship between prostate cancer incidence and PSA testing were
used in conjunction with Medicare Benefits Schedule data on PSA tests to estimate the
incidence of prostate cancer in 2009.
In May 2001, a single item (66655) which covered one PSA test for screening in a 12-month
period was listed, enabling screening activity for prostate cancer to be quantified.
Examination of the time trends in services of item 66655 shows a relationship between the
level of PSA testing for screening purposes and prostate cancer incidence and may provide
some insight into future trends.
The data used were:
•
Year of test/diagnosis: 2002, …, 2009 (2001 was excluded because it was an incomplete
year for item 66655).
•
Jurisdiction: New South Wales, Australian Capital Territory.
•
MBS age group: 0–4, then 10-year age groups 5–14, …, 75–84, and 85+.
•
PSA tests: Number of services of item 66655 (known for 2009), downloaded from
<www.medicareaustralia.gov.au/statistics/mbs_item.shtml>.
•
Prostate cancer incidence: Number of cases of prostate cancer (unknown for 2009).
The ratio ‘number of cases’ divided by ‘number of tests’ was computed for each stratum in
the above data set to form a time series of ratios from 2002 to 2008.
For each of these time series, the following steps were undertaken to estimate prostate cancer
incidence:
•
Least squares linear regression was used to find the straight line of best fit through the
time series.
•
A 5% level of significance was used to test the hypothesis that the slope of the line was
different from zero.
•
If the slope was not found to be significantly different from zero, the pooled mean of the
ratios was used as the estimate of the 2009 ratio (pooled mean is the total number of
cases in 2002–2008 divided by the total number of tests in 2002–2008).
•
If the slope was found to be positive, the straight line of best fit was extrapolated to
obtain the estimate of the 2009 ratio.
•
If the slope was negative, the time series was fitted with a log-linear model and the
estimated ratio for 2009 was found by extrapolating this line.
•
The estimated incidence counts for 2009 were then obtained by multiplying the
estimated ratios for 2009 by the number of services of item 66655 for 2009.
•
Time series that contained a ratio of zero were always fitted with the pooled mean of the
ratios, irrespective of the outcome of the significance test. This was done to ensure that
fitted lines never crossed the x-axis no matter how far forward or backward they were
extrapolated.
The final step was to convert the estimated incidence counts for the 10-year MBS age groups
to 5-year age groups consistent with incidence data. The data used in this step were:
146
Cancer in Australia: an overview, 2012
•
Year of diagnosis: 2002, …, 2008.
•
Jurisdiction: New South Wales, Australian Capital Territory.
•
MBS age group: 10-year age groups 5–14, …, 75–84 (0–4 and 85+ not required).
•
5-year age group within the 10-year age group. For example, in MBS age group 5–14
there would be the ‘younger’ age group 5–9 and the ‘older’ age group 10–14.
•
Prostate cancer incidence: Number of cases of prostate cancer in each 5-year age group.
The ‘younger ratio’ is defined to be ‘number of cases of prostate cancer in younger age
group’ divided by ‘number of cases of prostate cancer in corresponding 10-year age group’
and the ‘older ratio’ is the analogous ratio. Note the older ratio can also be defined as 1
minus the younger ratio.
The following steps were then undertaken:
•
The younger ratios were computed for each stratum in the above data set to form a time
series of ratios from 2002 to 2008.
•
Least squares linear regression was used to find the straight line of best fit through the
time series.
•
A 5% level of significance was used to test the hypothesis that the slope of the line was
different from zero.
•
If the slope was not found to be significantly different from zero, the pooled mean of the
ratios was used as the estimate of the 2009 younger ratio.
•
If the slope was found to be significantly different from zero, then the slope of the
younger ratio time series will be equal but of opposite sign to the slope of the older ratio
time series.
•
The series (of younger or older ratios) with negative slope was selected at this point and
fitted with a log-linear model and the estimated ratio for 2009 was found by
extrapolating this line.
•
For each 2009 ratio that has been determined above (by either the pooled mean or a loglinear model), the other ratio for 2009 is computed to be 1 minus the ratio determined.
There is now a complete set of estimated younger and older ratios for 2009.
•
The estimated number of cases for each 5-year age group for 2009 was then obtained by
multiplying the estimated number of cases for the corresponding 10-year age group by
the appropriate ratio (that is, younger or older) for 2009.
•
Time series that contained a ratio of zero were always fitted with the pooled mean of the
ratios, irrespective of the outcome of the significance test. This was done to ensure that
fitted lines never crossed the x-axis no matter how far forward or backward they were
extrapolated.
Cancer in Australia: an overview, 2012
147
Appendix G Year-to-date estimates for
Australian cancer incidence and mortality
Incidence
Estimates of incidence in 2010–2012 were calculated using the approach described for
estimating 2009 cancer incidence for New South Wales and the Australian Capital Territory.
(see Appendix F). The following data were used:
•
Year of diagnosis: 2000, …, 2009.
•
Sex: Male, female.
•
Age group: 5-year age groups 0–4, …, 80–84, and 85+.
•
Cancer type: For the non-haematological cancers, cancer type was defined by the 3character ICD-10 codes C00–C80 (excluding C61 prostate cancer). For the haematological
cancers, cancer type was defined by ICD-O-3 histology codes M9590–M9989. This
enabled flexibility for grouping according to different classification schemes.
•
ABS population projection series 29(B) was used for 2012 population estimates (ABS
2008b).
Estimating the incidence of prostate cancer
As explained in Appendix F, Medicare Benefits Schedule item 66655 enables screening
activity for prostate cancer to be quantified.
At the time this analysis was undertaken, the number of services of item 66655 was available
up to and including May 2012. The total number of services for 2012 was estimated using the
following data:
•
Year of test: 2002, …, 2011 (2001 was excluded because it was an incomplete year for item
66655).
•
MBS age group: 0–4, then 10-year age groups 5–14, …, 75–84, and 85+.
•
Total number of services of item 66655 from January to May inclusive.
•
Total number of services of item 66655 from January to December inclusive.
The ratio ‘January to May total’ divided by ‘January to December total’ was computed for
each unit record in the above data set to form a time series from 2002 to 2011. The same
approach for estimation was used to derive the estimated number of services for 2012 (see
Appendix F).
Prostate cancer incidence was then estimated using the following data:
148
•
Year of test/diagnosis: 2002, …, 2012.
•
MBS age group: 0–4, then 10-year age groups 5–14, …, 75–84, and 85+.
•
PSA tests: Number of services of item 66655, downloaded from
<www.medicareaustralia.gov.au/statistics/mbs_item.shtml>.
•
Prostate cancer incidence: Number of cases of prostate cancer (unknown for 2010–2012).
Cancer in Australia: an overview, 2012
Estimates of prostate cancer incidence for 2010–2012 were calculated using the approach
described for estimating 2009 prostate cancer incidence for New South Wales and the
Australian Capital Territory. (see Appendix F).
Mortality
The method used for producing year-to-date estimates of cancer mortality for Australia was
almost the same as the approach used to derive year-to-date estimates of cancer incidence.
The only differences were:
•
The AIHW has the national mortality data set for 2010. The most recent 10-year period
available is 2001–2010 and only 2011 and 2012 cancer mortality needed to be estimated.
•
‘Cancer type’ for the non-haematological cancers is defined by the 3-character ICD-10
codes C00–C76, C80 and C97. This excludes C77–C79, as these codes are no longer used
to classify underlying cause of death (last used for 2007 year of death registration).
•
Prostate cancer mortality is estimated by the same method as all other cancers.
•
‘Cancer type’ for the haematological cancers is defined by the 4-character ICD-10 codes
C81.0–C96.9, D45, D46.0–D46.9, D47.1 and D47.3.
•
All cancer types have a history of at least 10 years.
Cancer in Australia: an overview, 2012
149
Appendix H Statistical methods and
technical notes
Age-specific rates
Age-specific rates provide information on the incidence of a particular event in an age group
relative to the total number of people at risk of that event in the same age group. It is
calculated by dividing the number of events occurring in each specified age group by the
corresponding ‘at-risk’ population in the same age group and then multiplying the result by
a constant (for example, 100,000) to derive the rate. Age-specific rates are often expressed per
100,000 population.
Age-standardised rates
A crude rate provides information on the number of, for example, new cases of cancer or
deaths from cancer by the population at risk in a specified period. No age adjustments are
made when calculating a crude rate. Since the risk of cancer is heavily dependent on age,
crude rates are not suitable for looking at trends or making comparisons across groups in
cancer incidence and mortality.
More meaningful comparisons can be made by the use of age-standardised rates, with such
rates adjusted for age in order to facilitate comparisons between populations that have
different age structures, for example, between Indigenous people and other Australians. This
standardisation process effectively removes the influence of age structure on the summary
rate.
There are two methods commonly used to adjust for age: direct and indirect standardisation.
In this report, the direct standardisation approach presented by Jensen and colleagues (1991)
is used. To age-standardise using the direct method, the first step is to obtain population
numbers and numbers of cases (or deaths) in age ranges—typically 5-year age ranges. The
next step is to multiply the age-specific population numbers for the standard population (in
this case the Australian population as at 30 June 2001) by the age-specific incidence rates (or
death rates) for the population of interest (such as those in a certain socioeconomic status
group or those who lived in Major cities). The next step is to sum across the age groups and
divide this sum by the total of the standard population to give an age-standardised rate for
the population of interest. Finally, this is expressed per 1,000 or 100,000 as appropriate.
Age-standardised average length of stay
Information on age-standardised ALOS is in Chapter 8. The use of age-standardised ALOS
enables comparisons between groups and within groups over time taking into account
differences in the age structure and size of the population.
Calculating age-standardised ALOS is a three-step process. Within each population of
interest, the crude ALOS for each age category is derived first by dividing the number of
patient days for each age category by the corresponding number of hospitalisations. The
second step is to calculate the weights using the selected standard population. The weights
are derived by dividing the number of hospitalisations for each age category by the overall
150
Cancer in Australia: an overview, 2012
total of the standard population. The standard population chosen is the Australian female
overnight hospitalisations population in 2009–10 where the principal diagnosis was cancer
(ICD-10-AM codes of C00–C97, D45, D47.1 and D47.3). The third step is to multiply the
crude ALOS with the corresponding weights and then sum up to obtain the total agestandardised ALOS.
Confidence intervals
An observed value of a rate may vary due to chance, even where there is no variation in the
underlying value of the rate. A confidence interval provides a range of values that has a
specified probability of containing the true rate or trend. The 95% (p-value = 0.05) confidence
interval is used in this report, thus, there is a 95% likelihood that the true value of the rate is
somewhere within the stated range. Confidence intervals can be used as a guide to whether
or not differences are consistent with chance variation. In cases where no values within the
confidence intervals overlap, the difference between rates is greater than that which could be
explained by chance and is regarded as statistically significant. Note, however, that
overlapping confidence intervals do not necessarily mean that the difference between two
rates is definitely due to chance. Instead, an overlapping confidence interval represents a
difference in rates that is too small to allow differentiation between a real difference and one
which is due to chance variation. It can, therefore, only be stated that no statistically
significant differences were found, and not that no differences exist. The approximate
comparisons presented might understate the statistical significance of some differences, but
they are sufficiently accurate for the purposes of this report.
As with all statistical comparisons, care should be exercised in interpreting the results of the
comparison of rates. If two rates are statistically significantly different from each other, this
means that the difference is unlikely to have arisen by chance. Judgment should, however, be
exercised in deciding whether or not the difference is in fact due to chance or whether it is of
any practical significance.
The variances of the age-specific rates were calculated by assuming that the counts follow a
Poisson distribution, as recommended in Jensen et al. (1991) and Breslow and Day (1987).
When the age-specific rates are low relative to the population at risk, the variability in the
observed counts is accepted to be Poisson. However, even if the age-specific rates are not
low, Poisson distribution is still generally assumed (Brillinger 1986; Eayres et al. 2008).
With one exception, the confidence intervals of the age-standardised rates in this report were
calculated using a method developed by Dobson et al. 1991. This method calculates
approximate confidence intervals for a weighted sum of Poisson parameters.
The one exception applies to the confidence intervals that were calculated for the
international comparisons of incidence and mortality data using GLOBOCAN data. For
those data, the lack of the required data meant that the Dobson method could not be used
and the AIHW approximated the confidence intervals using the following formula:
95% CI approximation = AS rate ± 1.96 x
AS rate
Number of cases
Cancer in Australia: an overview, 2012
151
Since the GLOBOCAN data are based on the estimates of the number of new cases and
deaths from cancer, the associated confidence intervals indicate the range of random
variation that might be expected, should those estimates be 100% accurate.
Note that statistical independence of observations is assumed in the calculations of the
confidence intervals for this report. This assumption may not always be valid for
episode-based data (such as data from the National Hospital Morbidity Database).
Mortality-to-incidence ratio
Both MIRs and relative survival ratios can be used to estimate survival from a particular
disease, such as cancer, for a population. Although MIRs are the cruder of the two ratios,
MIRs do not have the same comparability and interpretation problems associated with them
when attempting to make international comparisons (see Chapter 6). Thus, the MIR is
considered to be a better measure when comparing survival between countries.
The MIR is defined as the age-standardised mortality rate divided by the age-standardised
incidence rate. For example, an MIR of 0.42 in a given year for all types of cancers means that
for every 100 new cancer cases diagnosed that year, there were 42 deaths due to cancer in the
same year (though the deaths need not be of the same people as the cases). If people tend to
die relatively soon after diagnosis from a particular cancer (that is, the death rate is nearly as
high as the incidence rate for that cancer), then the MIR will be close to 1.00. In contrast, if
people tend to survive a long time after being diagnosed, then the MIR will be close to zero.
The MIR only gives a valid measure of the survival experience in a population if:
•
•
cancer registration and death registration are complete or nearly so
and
the incidence rate, mortality rate and survival proportion are not undergoing rapid
change.
The incidence and mortality data used to calculate the MIRs in Chapter 4 were extracted
from the 2008 GLOBOCAN database (Ferlay et al. 2010).
Prevalence
Limited-duration prevalence is expressed as N-year prevalence throughout this report. N-year
prevalence on a given index date (31 December 2007), where N is any number 1, 2, 3 and so
forth, is defined as the number of people alive at the end of that day who had been
diagnosed with cancer in the past N years. For example:
•
One-year prevalence is the number of living people who were diagnosed in the past year
to 31 December 2007.
•
Five-year prevalence is the number of living people who were diagnosed in the past 5
years to 31 December 2007. This includes the people defined by 1-year prevalence.
In this report, 26-year prevalence is the longest duration that can be calculated based on the
earliest (1982) and latest (2007) years of available incidence data. People who were diagnosed
with cancer between 1982 and 2007 and who were alive on 31 December 2007 would be
counted in 26-year prevalence. It is presented in this report as an approximation of the
number of people alive who have ever been diagnosed with cancer, known as complete
prevalence. Limited-duration prevalence was selected given its advantages in the ease of
152
Cancer in Australia: an overview, 2012
interpretation and calculation. Twenty-six years was deemed a sufficiently long period for
approximating complete prevalence, especially given that most cancers are diagnosed in the
later years of life.
Note that prevalence is measured by the number of people diagnosed with cancer, not the
number of cancer cases. An individual who was diagnosed with two separate cancers will
contribute separately to the prevalence of each cancer. However, this individual will
contribute only once to prevalence of all cancers combined. For this reason, the sum of
prevalence for individual cancers will not equal the prevalence of all cancers combined.
Prevalence can be expressed as a proportion of the total population as at the index date. In
this report, the prevalence proportion is expressed per 10,000 population due to the relative
size of the numerator and denominator. These are crude rates and have not been
standardised.
Differences in limited-duration prevalence are presented according to age in the report. Note
that while age for survival and incidence statistics refers to the age at diagnosis, prevalence
age refers to the age at the point in time from which prevalence was calculated, or 31
December 2007, in this report. Therefore, a person diagnosed with cancer in 1982 when they
turned 50 that year would be counted as age 75 in the prevalence statistics (as at the end of
2007).
Relative survival
Relative survival is a measure of the survival of people with cancer compared with that of
the general population. It is the standard approach used by cancer registries to produce
population-level survival statistics and is commonly used as it does not require information
on cause of death. Instead, relative survival reflects the net survival (or excess mortality)
associated with cancer by adjusting the survival experience of those with cancer for the
underlying mortality that they would have experienced in the general population.
Relative survival is calculated by dividing observed survival by expected survival, where the
numerator and denominator have been matched for age, sex, calendar year, and where
applicable, remoteness and socioeconomic status.
Observed survival refers to the proportion of people alive for a given amount of time after a
diagnosis of cancer and is calculated from population-based cancer data. Expected survival
refers to the proportion of people in the general population alive for a given amount of time
and is calculated from life tables of the entire Australian population, assumed to be cancerfree.
A simplified example of how relative survival is interpreted is shown in Figure H1. Given
that 6 in 10 people with cancer are alive 5 years after their diagnosis (observed survival of
0.6) and that 9 in 10 people from the general population are alive after the same 5 years
(expected survival of 0.9), the relative survival of people with cancer would be calculated as
0.6 divided by 0.9, or 0.67. This means that individuals with cancer are 67% as likely to be
alive for at least 5 years after their diagnosis compared with their counterparts in the general
population.
Cancer in Australia: an overview, 2012
153
Observed survival = 0.6
Relative survival
Individuals with cancer
5 years after diagnosis
observed survival
expected survival
= 0.6 ÷ 0.9
= 0.67
= 67%
Expected survival = 0.9
General population
Figure H1: A simplified example of how relative survival is calculated
All observed survival was calculated from data in the ACD. Expected survival was
calculated from the life tables of the entire Australian population, as well as the Australian
population stratified by remoteness area and socioeconomic status quintile. The Ederer II
method was used to determine how long people in the general population are considered ‘at
risk’. It is the default approach whereby matched people in the general population are
considered to be at risk until the corresponding cancer patient dies or is censored (Ederer &
Heise 1959).
The survival analysis was based on records of primary and invasive cancers diagnosed
between 1982 and 2007. At the time of analysis, these cases had been followed for deaths
(from any cause) to the end of 2010. Therefore, the censor date selected for survival analysis
was 31 December 2010.
The period method was used to calculate the survival estimates in this report (Brenner &
Gefeller 1996), in which estimates are based on the survival experience during a given at-risk
or follow-up period. Time at risk is left truncated at the start of the period and right censored
at the end so that anyone who is diagnosed before this period and whose survival experience
overlaps with this period would be included in the analysis.
The main follow-up period in this report was for the 5-year period 2006–2010, which was
used for the most up-to-date estimates of survival by age, histological subtype, remoteness
and socioeconomic status.
Trends are also analysed by five periods of follow-up: 1982–1987, 1988–1993, 1994–1999,
2000–2005 and 2006–2010. In each period, 5 or 6 years of follow-up have been combined to
draw upon a greater number of cases to produce more precise estimates.
All survival statistics in this report were produced using SAS statistical software and
calculated using software written by Dickman (2004). Further details on the approach used
154
Cancer in Australia: an overview, 2012
to calculate the relative survival estimates, including rules which were applied during data
preparation, are in AIHW publication Cancer survival and prevalence in Australia: period
estimates from 1982 to 2010 (AIHW 2012d).
Risk to age 75 or 85
The calculations of risk shown in this report are measures that approximate the risk of
developing (or dying from) cancer before the age 75 or 85, assuming that the risks at the time
of estimation remained throughout life. It is based on a mathematical relationship with the
cumulative rate.
The cumulative rate is calculated by summing the age-specific rates for all specific age
groups:
= 5 x (Sum of the age-specific rates) x 100
100,000
Cumulative rate
The factor of 5 is used to indicate the 5 years of life in each age group and the factor of 100 is
used to present the result as a percentage. As age-specific rates are presented per 100,000
population, the result is divided by 100,000 to return the age-specific rates to a division of
cases by population. Cumulative risk is related to cumulative rate by the expression:
Cumulative risk
1 − e − rate
=
100
Where the rate is expressed as a percentage.
The risk is expressed as a ‘1 in n’ proportion by taking the inverse of the above formula:
n
=
(1 − e
1
)
− rate 100
For example, if n equals 3, then the risk of a person in the general population being
diagnosed with cancer before the age of 75 (or 85) is 1 in 3. Note that these figures are
average risks for the total Australian population. An individual person’s risk may be higher
or lower than the estimated figures, depending on their particular risk factors.
Cancer in Australia: an overview, 2012
155
Appendix I
Data sources
To provide a comprehensive picture of national cancer statistics in this report, a range of data
sources were used, including AIHW and external data sources. These data sources are
described in this appendix.
Australian Cancer Database
The Australian Cancer Database (ACD) is a database that holds information about 2.2
million cancer cases of Australians who were diagnosed with cancer (other than basal cell
and squamous cell carcinomas of the skin) between 1982 and 2009. Data from this source are
used in Chapters 2, 4 and 5.
The AIHW compiles and maintains the ACD, in partnership with the AACR, whose member
registries provide data to the AIHW on an annual basis. Each Australian state and territory
has legislation that makes the reporting of all cancers (excluding basal cell and squamous cell
carcinomas of the skin) mandatory. Pathology laboratories and Registrars of Births, Deaths
and Marriages across Australia must report on cancer cases, as do hospitals, radiation
oncology units and nursing homes in some (but not all) jurisdictions.
The earliest cancer registries have been operating since 1972 but it was not until 1982 that
cancer registration was nearly universal in Australia, the only jurisdictions missing being the
Northern Territory and the Australian Capital Territory. These two territories were
registering cancers from before 1982 but the legislation making notification compulsory was
not enacted until later, so that Northern Territory registrations are considered complete from
1991 and Australian Capital Territory registrations from 1994.
The data provided to the AIHW by the state and territory cancer registries include, at a
minimum, an agreed set of items that provide information about the individual with the
cancer and the characteristics of the cancer (see Table I1). In addition to the agreed set of
items, registries often provide other data which are also included in the ACD. For example,
data on ductal carcinoma in situ (DCIS) of the breast are not part of the agreed ACD data set
but are regularly provided by the state and territory registries.
Once the data are received from the state and territory cancer registries, the AIHW assembles
the data into the ACD. Internal linking checks are undertaken to identify those who had
tumours diagnosed in more than one state or territory; this process reduces the degree of
duplication within the ACD to a negligible amount. The ACD is also linked with information
on deaths (from the National Death Index) to add the date of death for those people who
have died (from any cause). Any conflicting information and other issues with the cancer
data are resolved through consultation with the relevant state or territory cancer registry.
The registration of cases of cancer is a dynamic process such that records in the state and
territory cancer registries may be modified if new information is received. Thus, records in
the cancer registries are always open and updated as required. For these changes to be
incorporated into the ACD, a new complete file for all years of cancer data is provided by
each of the jurisdictions annually. As a result, the number of cancer cases reported by the
AIHW for any particular year may change slightly over time and, in addition, data published
by a cancer registry at a certain point in time may differ to some extent from what is
published by the AIHW (AIHW 2009).
156
Cancer in Australia: an overview, 2012
The data in the ACD are protected physically, electronically with built-in computer security
systems and legislatively under the Australian Institute of Health and Welfare Act 1987 as well
as under agreements with the state and territory cancer registries. More information about
physical security and legislative protection of the ACD is in the National Cancer Statistics
Clearing House protocol (AIHW 2009).
Table I1: Agreed set of items to be provided by the states and territories to the AIHW for inclusion
in the Australian Cancer Database
Person-level attributes
Tumour-level attributes
Person identification number (assigned by the
state/territory)
Tumour identification number (assigned by the
state/territory)
Surname
Date of diagnosis
First given name
Date of diagnosis accuracy indicator
Second given name
ICD-O-3(a) topography code
Third given name
ICD-O-3(a) morphology code
Sex
ICD-10(b) disease code
Date of birth
Most valid basis of diagnosis
Date of birth accuracy indicator
Statistical local area at diagnosis
Indigenous status
Postcode at diagnosis
Country of birth
Melanoma thickness (mm)
Date of death
Breast tumour size (mm)
Cause of death
(a)
International Classification of Diseases for Oncology, 3rd edition.
(b)
International Statistical Classification of Diseases and Related Health Problems, Tenth Revision.
Source: AIHW 2009.
Non-melanoma skin cancers
Data on all types of cancer, other than two types of non-melanoma skin cancer (NMSC), are
reportable and collected by the state and territory registries. The two most common types of
NMSC—basal cell carcinoma and squamous cell carcinoma—are not reportable and are thus
not generally recorded in cancer registries in Australia. These two types of skin cancers are
by far the most frequently diagnosed cancers in Australia for both males and females (AIHW
& CA 2008). A number of other, rarer types of cancer also fall within the NMSC category (for
example, Merkel cell carcinoma). These are reportable cancers and hence do occur in the
ACD.
Data Quality Statement: Australian Cancer Database 2009
Important note
To avoid excessive repetition in what follows, the word ‘cancer’ is used to mean ‘cancer,
excluding basal cell carcinomas of the skin and squamous cell carcinomas of the skin’. In
most states and territories these two very common skin cancers are not notifiable diseases
and as such are not in the scope of the Australian Cancer Database (ACD).
Cancer in Australia: an overview, 2012
157
Summary of key issues
•
All states and territories maintain a population-based cancer registry to which all cancer
cases and deaths must be reported.
•
The Australian Institute of Health and Welfare (AIHW) compiles the ACD using
information from state and territory registers.
•
Some duplication may occur where the same person and cancer have been registered in
two or more jurisdictions. The AIHW provisionally resolves these instances and notifies
the relevant states and territories of possible duplicates. Full resolution has usually
occurred by the following year’s version of the ACD.
•
The level of duplication is small, about 0.17% of all records.
•
Cancer registry databases change every day, adding new records and improving the
quality of existing records as new information becomes available. Information on ACD
records may therefore change from year to year.
Description
All states and territories have legislation that makes cancer a notifiable disease. All hospitals,
pathology laboratories, radiotherapy centres and registries of births, deaths and marriages
must report cancer cases and deaths to the state or territory population-based cancer registry.
Each registry supplies incidence data annually to the AIHW under an agreement between
the registries and the AIHW. These data are compiled into the ACD, the only repository of
national cancer incidence data.
Institutional environment
The AIHW is a major national agency set up by the Australian Government under the
Australian Institute of Health and Welfare Act 1987 to provide reliable, regular and relevant
information and statistics on Australia’s health and welfare. It is an independent statutory
authority established in 1987, governed by a management board, and accountable to the
Australian Parliament through the Health and Ageing portfolio.
The AIHW aims to improve the health and wellbeing of Australians through better health
and welfare information and statistics. It collects and reports information on a wide range of
topics and issues, ranging from health and welfare expenditure, hospitals, disease and
injury, and mental health, to ageing, homelessness, disability and child protection.
The Institute also plays a role in developing and maintaining national metadata standards.
This work contributes to improving the quality and consistency of national health and
welfare statistics. The Institute works closely with governments and non-government
organisations to achieve greater adherence to these standards in administrative data
collections to promote national consistency and comparability of data and reporting.
One of the main functions of the AIHW is to work with the states and territories to improve
the quality of administrative data and, where possible, to compile national datasets based on
data from each jurisdiction, to analyse these datasets and disseminate information and
statistics.
The Australian Institute of Health and Welfare Act 1987, in conjunction with compliance to the
Privacy Act 1988 (Cwlth), ensures that the data collections managed by the AIHW are kept
securely and under the strictest conditions with respect to privacy and confidentiality.
For further information, see the AIHW website <www.aihw.gov.au>.
158
Cancer in Australia: an overview, 2012
The AIHW has been maintaining the ACD since 1986.
Timeliness
This data quality statement refers to the 2009 version of the ACD, which contains data on
all cancer cases diagnosed between 1982 and 2009. However, the number of cases in 2009
for New South Wales and the Australian Capital Territory was estimated (see ‘Accuracy’
section below).
Each jurisdictional cancer registry supplies data annually to the AIHW. Because each
jurisdiction operates on its own data compilation and reporting cycle, the ACD cannot be
fully compiled until the final jurisdiction supplies its data.
It generally takes a year or more for the state and territory cancer registries to fully process
and release their latest full-year of cancer data to the AIHW. Once the AIHW receives all the
data sets from cancer registries, time is needed to check for data consistency and to
deduplicate the data before the new version of the ACD is available for reporting purposes.
Accessibility
The AIHW website provides cancer incidence and mortality data that can be downloaded
without charge. Numerous reports, including the biennial Cancer in Australia, are published
and are available on the AIHW website where they can also be downloaded without charge.
Users can request data not available online or in reports via the Cancer and Screening Unit of
the AIHW on (02) 6244 1000 or via email to <[email protected]>. Requests that take longer
than half an hour to compile are charged on a cost-recovery basis. General enquiries about
AIHW publications can be made to the Communications, Media and Marketing Unit on (02)
6244 1032 or via email to <[email protected]>.
Researchers following a cohort of people enrolled in a longitudinal study of health outcomes
can request the AIHW to undertake data linkage of their cohort to the ACD. Such requests
must be approved by the AIHW Ethics Committee as well as the ethics committees
governing access to the state and territory cancer registries.
Interpretability
Information on the ACD is available on the AIHW website.
While numbers of new cancers are easy to interpret, other statistical calculations (for
example, calculations of age-standardised rates and confidence intervals) are more complex
and their concepts may be confusing to some users. In most publications there is an
appendix on statistical methods as well as technical notes.
Relevance
The ACD is highly relevant for monitoring trends in cancer incidence. The data are used for
many purposes, such as by policy makers to evaluate health intervention programs and as
background data for health labour force planning and health expenditure; by pharmaceutical
companies to assess the size of the market for new drugs; by researchers to explore the
epidemiology of cancer; and by insurance companies to evaluate the risk of people being
diagnosed with cancer.
The ACD contains information on all reported cancer cases and deaths in Australia. Data can
be provided at state and territory level and at Remoteness Area level.
Cancer in Australia: an overview, 2012
159
The 3rd edition of the International Classification of Diseases for Oncology (ICD-O-3) is used
to classify cancer cases. Data can also be classified according to the tenth revision of the
International Statistical Classification of Diseases and Related Health Problems (ICD-10).
The ACD also contains the name and date of birth of each person diagnosed with cancer.
This allows researchers who have enrolled people in a study to link their database to the
ACD to find out which of their study subjects have been diagnosed with cancer, what kind of
cancer, and when. (Such data linkage can only be undertaken after receiving approvals from
various ethics committees.) This kind of research gives insight into cancer risk factors. Data
linkage is also undertaken when a researcher has been contracted to investigate a potential
cancer cluster in a workplace or small area.
Accuracy
The 1982–2009 data files for New South Wales and the Australian Capital Territory were not
available for inclusion in the 2009 version of the ACD. An extended delay of the receipt of
mortality data has meant that New South Wales and the Australian Capital Territory have
not been able to close off their 2009 data sets. As a consequence, 2009 cancer data for these
jurisdictions are not available for reporting purposes. The 2009 incidence data for New South
Wales and the Australian Capital Territory were estimated by the AIHW in consultation
with New South Wales and the Australian Capital Territory cancer registries. The estimates
were combined with the actual data supplied by these two jurisdictions for the 2008 ACD to
form their 1982–2009 data sets for inclusion in the 2009 ACD. Although the estimation
procedure has been shown to be reasonably accurate for estimating overall cancer incidence,
its accuracy with respect to individual cancers will vary. As New South Wales and the
Australian Capital Territory make up about a third of Australia’s population, the national
incidence data for 2009 is likely to be somewhat inaccurate for some individual cancers—
which cancers these are is not predictable.
It is anticipated that future versions of the ACD will include 2009 actual data for New South
Wales and the Australian Capital Territory and the data will then be made available in
subsequent cancer publications.
The publication Cancer incidence in five continents is issued about every 5 years as a
collaborative effort by the International Agency for Research on Cancer (IARC) and the
worldwide network of cancer registries. Australia’s cancer registries continue to pass IARC’s
numerous tests for data quality. Details of the tests and Australia’s cancer registries’ results
are in the above-mentioned book and the registries’ annual incidence reports.
Each year, when all the registries’ new data have been compiled into the new ACD, a data
linkage process called the national deduplication is undertaken. This process detects
instances where the same person and cancer have been registered in two or more
jurisdictions. This could happen, for example, when a person attends hospitals in different
jurisdictions. All such instances are provisionally resolved at the AIHW by removing one
record and the relevant jurisdictions are notified so that they can determine in which
jurisdiction the person was a usual resident at the time of diagnosis. Their resolution will
flow through to the ACD in the next year’s data supply. In recent years the national
deduplication has resulted in the removal of about 3,500 records from the ACD, which is
about 0.17% of all records supplied by the jurisdictions.
While all state and territory cancer registries collect information on Indigenous status, in
some jurisdictions the level of identification of Indigenous Australians is considered to be
insufficient to enable analysis. Data for four states and territories—New South Wales,
160
Cancer in Australia: an overview, 2012
Queensland, Western Australia and the Northern Territory—are considered suitable for
analysis.
Cancer registry databases change every day, and not just because new records are added.
Existing records are changed if new, more precise, information about the diagnosis becomes
available. Also, any typographical errors that are discovered by routine data checking
procedures are corrected by referring to the source documentation. Finally, existing records
can be deleted if it is discovered that the initial diagnosis of cancer was incorrect (for
example, the tumour was benign) or the person is found to be not a resident of that state or
territory. As a result, the number of cancer cases reported by AIHW for any particular year
may change slightly over time, and data published by a cancer registry at a certain point may
differ slightly from what is published by the AIHW at a different time.
Coherence
Cancer data are reported and published annually by the AIHW. While there are sometimes
changes to coding for particular cancers, it is possible to map coding changes to make
meaningful comparisons over time.
BreastScreen Australia Program data
Data from BreastScreen Australia were used in Chapter 9 to indicate the number of women
who had a screening mammogram and the number of cancers detected through BreastScreen
Australia. These data are supplied annually to the AIHW by state and territory BreastScreen
programs for monitoring purposes. They are compiled by the AIHW and reports are
produced annually (AIHW 2012c). Mortality data came from the AIHW’s National Mortality
Database.
Data Quality Statement: BreastScreen Australia data 2009–2010
Summary of key issues
•
All states and territories maintain a population-based BreastScreen register which
records the data collected during a woman’s contact with a BreastScreen service.
•
The Australian Institute of Health and Welfare (AIHW) compiles BreastScreen Australia
data supplied from state and territory BreastScreen registers in order to monitor
BreastScreen Australia annually at a national level.
•
State and territory BreastScreen registers change every day, adding new records and
improving the quality of existing records as new information becomes available.
BreastScreen Australia data may therefore change from year to year.
•
For 2009–2010 data, New South Wales data are not available for participation by main
language spoken at home, rescreening, recall to assessment, invasive breast cancer and
DCIS detection and sensitivity due to issues relating to the implementation of a new
Business Information System in NSW. It is anticipated that future reports will include
data for these years.
Description
BreastScreen Australia is Australia’s national, population-based breast cancer screening
program and is a joint program of the Australian and state and territory governments.
Cancer in Australia: an overview, 2012
161
BreastScreen registers in each state and territory record data collected during a woman’s
contact with a BreastScreen service.
Each BreastScreen program supplies BreastScreen data annually to the AIHW. These data are
compiled into the BreastScreen Australia database, held at the AIHW to enable national
monitoring of BreastScreen Australia.
Some BreastScreen data are supplied as aggregate data, which are not included in the
BreastScreen Australia database.
Institutional environment
The AIHW is a major national agency set up by the Australian Government under the
Australian Institute of Health and Welfare Act 1987 to provide reliable, regular and relevant
information and statistics on Australia’s health and welfare. It is an independent statutory
authority established in 1987, governed by a management board, and accountable to the
Australian Parliament through the Health and Ageing portfolio.
The AIHW aims to improve the health and wellbeing of Australians through better health
and welfare information and statistics. It collects and reports information on a wide range of
topics and issues, ranging from health and welfare expenditure, hospitals, disease and
injury, and mental health, to ageing, homelessness, disability and child protection.
The Institute also plays a role in developing and maintaining national metadata standards.
This work contributes to improving the quality and consistency of national health and
welfare statistics. The Institute works closely with governments and non-government
organisations to achieve greater adherence to these standards in administrative data
collections to promote national consistency and comparability of data and reporting.
One of the main functions of the AIHW is to work with the states and territories to improve
the quality of administrative data and, where possible, to compile national datasets based on
data from each jurisdiction, to analyse these datasets and disseminate information and
statistics.
The Australian Institute of Health and Welfare Act 1987, in conjunction with compliance to the
Privacy Act 1988 (Cwlth), ensures that the data collections managed by the AIHW are kept
securely and under the strictest conditions with respect to privacy and confidentiality.
For further information, see the AIHW website <www.aihw.gov.au>.
The AIHW has been receiving BreastScreen data since 1996.
Timeliness
BreastScreen data are available within about 6–12 months (it can take up to 6–12 months for
final pathology results on all breast tissue samples to be received by BreastScreen registers).
The BreastScreen Australia database cannot be fully compiled until the final jurisdiction
supplies its data.
Participation data for the previous calendar year are supplied in July each year; rescreening
and invasive breast cancer and DCIS detection data for the previous calendar year are
supplied July–December each year (rescreening and sensitivity data lag behind, as the
specifications for these require a specified period of time to pass before they can be
accurately calculated).
The current BreastScreen Australia database contains data on women who participated in
BreastScreen Australia between 1996 and 2010.
162
Cancer in Australia: an overview, 2012
Accessibility
BreastScreen Australia data are published annually in the BreastScreen Australia monitoring
report available on the AIHW website <http://www.aihw.gov.au/breast-cancerscreening/>, where they can be downloaded without charge. Supplementary data tables that
provide more detailed data are also provided to accompany each report, and these, too, are
available on the AIHW website where they can be downloaded without charge.
General enquiries about AIHW publications can be made to the Communications, Media and
Marketing Unit on (02) 6244 1032 or via email to <[email protected]>.
Interpretability
While many concepts in the BreastScreen Australia monitoring report are easy to interpret,
other concepts and statistical calculations are more complex. All concepts are explained
within the body of the report presenting these data, along with footnotes to provide further
details and caveats. Appendix C provides additional detail on the data sources and
classifications, and Appendix E provides details on the statistical methods used.
Relevance
Breast cancer screening data are highly relevant for monitoring trends in breast screening
participation and the detection of invasive breast cancer and DCIS, as well as other measures
of program performance, such as recall rates and sensitivity measures. The data are used for
many purposes by policy makers and researchers, but are supplied and analysed specifically
to monitor and inform BreastScreen Australia.
Accuracy
All data provided by state and territory BreastScreen programs, once analysed, are supplied
back for verification.
Women attending a BreastScreen service are able to self-report Aboriginal and Torres Strait
Islander status; this database field is therefore considered to be of high quality. However, use
of the ‘not stated’ category has decreased substantially over time, which provides much
more accurate data on current participation in BreastScreen Australia by Aboriginal and
Torres Strait Islander status, but makes trend data difficult to interpret.
State and territory BreastScreen databases change every day, and not just because new
records are added; existing records are changed if new, more precise information becomes
available or if typographical errors are discovered by routine data checking procedures. As a
result, the number of women participating, as well as DCIS and invasive breast cancer cases
reported by the AIHW for any particular year, may change slightly over time, and data
published by a jurisdictional BreastScreen program at a certain point may differ slightly from
what is published by the AIHW at a different time.
Coherence
BreastScreen data are reported and published annually by the AIHW.
For 2009–2010 data, New South Wales data are not available for participation by main
language spoken at home, rescreening, recall to assessment, invasive breast cancer and DCIS
detection and sensitivity due to issues relating to the implementation of a new Business
Information System in that state. It is anticipated that future reports will include data for
these years.
Cancer in Australia: an overview, 2012
163
Burden of disease data
Information on the burden of disease from selected cancer sites and all cancers combined is
in Chapter 7 of this report.
The first study that provided an overview of disease and injury burden in Australia was
published in 1999 (AIHW: Mathers et al. 1999). The second and most recent study was
published in 2007 and provides burden of disease information in relation to 2003 as well as
backwards and forwards projections from 1993 to 2023 (Begg et al. 2007). The summary
measure used in that study is the disability-adjusted life year, or DALY, with this term used
interchangeably with ‘burden of disease’. The DALY quantifies the gap between a
population’s actual health status and some ‘ideal’ or reference status, with time (either lived
in health states or lost through premature death and illness) being the unifying ‘currency’ for
combining the impact of mortality and non-fatal health outcomes.
A DALY for a disease or health condition is calculated as the sum of the years of life lost due
to premature mortality (YLL) in the population and the equivalent ‘healthy’ years lost due to
disability (YLD) for incident cases of the health condition such that:
DALY = YLL + YLD
where
YLL = number of deaths x standard life expectancy at age of death, and
YLD = incidence x duration x severity weight.
Further information about how the DALY was derived, as well as further information on
interpretation of burden of disease data, is in Begg et al. (2007).
This report presents the projected burden of disease due to cancer for 2012. These data were
estimated by Begg and associates using data on the burden of cancer over the period from
1979 to 2003. More information about how these projection estimates were derived is in the
report by Begg and associates (Begg et al. 2007).
In the burden of disease study, some cancer groupings are defined differently from that used
in most other sections of this report. Table I2 summarises the cancer groupings used in the
report by Begg and associates and their respective ICD-10 codes.
164
Cancer in Australia: an overview, 2012
Table I2: Cancer groupings and ICD-10 codes used for calculation of burden of disease
Cancer site/type
ICD-10 codes
Mouth and oropharynx cancers
C00–C14
Oesophagus cancer
C15
Stomach cancer
C16
Colorectal cancer
C18–C21
(a)
Liver cancer
C22
Gallbladder cancer
C23–C24
Pancreas cancer
C25
Larynx cancer
C32
Lung cancer
C33–C34
Bone and connective tissue cancer
C40–C41, C49
Melanoma of the skin
C43
Non-melanoma skin cancers
C44
(b)
Breast cancer
C50
Cervix cancer
C53
Corpus uteri cancer
C54
Ovary cancer
C56, C57.0–C57.4
Prostate cancer
C61
Testicular cancer
C62
Kidney cancer
C64–C66, C68
Bladder cancer
C67
Eye cancer
C69
Brain cancer
C71
Thyroid cancer
C73
Lymphoma
C81–C85, C96
Multiple myeloma
C88–C90
Leukaemia
C91–C95
Other malignant neoplasms
C17, C26–C31, C37–C39, C45–C48, C51–C52,
C57.7–C57.9, C58–C60, C36, C70, C72, C74–C75
All cancers
(a)
Excluding hepatitis B- and C-related liver cancer.
(b)
Pertains to breast cancer in females only.
C00–C96
Source: Begg et al. 2007.
GLOBOCAN
One of the main sources of internationally comparable data on cancer is the GLOBOCAN
database which is prepared by the IARC (Ferlay et al. 2010). The IARC collates cancer
incidence and mortality data from cancer registries around the world and uses those data to
produce estimates for a ‘common year’. The most recent GLOBOCAN estimates for which
data could be obtained are for 2008. GLOBOCAN data are in Chapters 2, 3 and 4 of this
report for all cancers combined.
Cancer in Australia: an overview, 2012
165
For the GLOBOCAN data, all cancers combined were defined as those coded as ‘C00 to C97’
in ICD-10, with the exception of code C44 which indicates non-melanoma skin cancer. Thus
the definition used in those data is different from that used in most other sections of this
report.
In the GLOBOCAN database, age-standardised incidence and mortality rates are provided,
with the data standardised to the 1966 WHO World Standard Population.
The database does not include confidence intervals. To provide some guidance on whether
the differences were statistically significant, the AIHW calculated ‘approximate’ confidence
intervals (with the methodology for doing so explained in Appendix H).
National Bowel Cancer Screening Program data
Data from the National Bowel Cancer Screening Register were used in Chapter 9 to indicate
the number of persons who participated in the National Bowel Cancer Screening Program
(NBCSP) as well as to indicate the number of bowel cancers detected through the program.
These data are supplied twice a year to the AIHW by the Department of Human Services
(formerly Medicare Australia) for monitoring purposes. They are compiled by the AIHW
and reports are produced annually (AIHW 2012f).
Data Quality Statement: National Bowel Cancer Screening Program
screening data: July 2008–June 2011
Summary of key issues
166
•
The National Bowel Cancer Screening Program (NBCSP) is a joint program of the
Australian Government Department of Health and Ageing and state and territory
governments. The NBCSP is monitored annually by the Australian Institute of Health
and Welfare (AIHW). Results are compiled and reported at the national level by the
AIHW in an annual NBCSP monitoring report.
•
NBCSP data depend on the return of data forms from participants, general practitioners,
colonoscopists and pathologists to the NBCSP register. The register is maintained by
Medicare Australia. Data from the register are provided to the AIHW every 6 months as
de-identified unit record data.
•
Analysis of remoteness and socioeconomic status are based on postcode of residential
address of NBCSP invitees at the time of screening. Concordances for these
disaggregations may be unavoidably older than the year(s) of screening data being
reported, leading to inaccuracies.
•
Aboriginal and Torres Strait Islander, language and disability status are self-reported by
participating individuals.
•
Exclusion of people screened outside the NBCSP will result in an underestimation of
population screening rates in the target ages.
•
Data return for later stages in the NBCSP screening pathway (GP, colonoscopy and
pathology follow-up, as required) is not mandatory. Further, not all people who received
a positive (abnormal) screening result may have had time to complete follow-up steps at
the time of reporting. These factors may result in under-reporting of outcome data.
Cancer in Australia: an overview, 2012
•
Data may be suppressed for confidentiality and reliability reasons (for example, if the
denominator is less than 1,000, the numerator is less than 5, or the rate could not be
sensibly estimated).
Description
The NBCSP is a joint program of the Australian Government Department of Health and
Ageing and state and territory governments. It started in 2006 and uses national invitation
and screening analysis processes. A ‘usual care’ model is then used for follow-up functions
for those with a positive (abnormal) screening result; that is, these people are encouraged to
see their doctor to discuss the test result and seek further diagnostic testing (such as
colonoscopy) as required. Data from these follow-up functions are returned to the national
NBCSP register via non-mandatory form return.
Currently those Australians registered at Medicare Australia or the Department of Veterans’
Affairs receive a screening invitation at, or around, their 50th, 55th and 65th birthdays. From
2013 the program will also include people aged 60, and from 2015 those aged 70. The
program will be further expanded in 2017–18 with a phased roll out of biennial screening for
those aged 50–74.
NBCSP data depend on the return of data forms from participants, general practitioners,
colonoscopists and pathologists to the NBCSP register. The register is maintained by
Medicare Australia. Data from the register are provided to the AIHW every 6 months as deidentified unit record data.
The NBCSP is monitored annually by the AIHW. Results are compiled and reported at the
national level by the AIHW in an annual NBCSP monitoring report.
Institutional environment
The AIHW is a major national agency set up by the Australian Government under the
Australian Institute of Health and Welfare Act 1987 to provide reliable, regular and relevant
information and statistics on Australia’s health and welfare. It is an independent statutory
authority established in 1987, governed by a management board, and accountable to the
Australian Parliament through the Health and Ageing portfolio.
The AIHW aims to improve the health and wellbeing of Australians through better health
and welfare information and statistics. It collects and reports information on a wide range of
topics and issues, ranging from health and welfare expenditure, hospitals, disease and
injury, and mental health, to ageing, homelessness, disability and child protection.
The Institute also plays a role in developing and maintaining national metadata standards.
This work contributes to improving the quality and consistency of national health and
welfare statistics. The Institute works closely with governments and non-government
organisations to achieve greater adherence to these standards in administrative data
collections to promote national consistency and comparability of data and reporting.
The Australian Institute of Health and Welfare Act 1987, in conjunction with compliance to the
Privacy Act 1988 (Cwlth), ensures that the data collections managed by the AIHW are kept
securely and under the strictest conditions with respect to privacy and confidentiality.
For further information, see the AIHW website <www.aihw.gov.au>.
The AIHW has been receiving NBCSP screening data since 2006.
Cancer in Australia: an overview, 2012
167
Timeliness
The data discussed in this data quality statement are for the period July 2008–June 2011.
A snapshot of all NBCSP activity is made available to the AIHW regularly at 6-month
intervals for analysis. However, as there is a time lag between issuing invitations and
confirmed diagnosis of bowel cancer, the monitoring reports are based on outcomes of a
cohort of people sent invitations in a given period—this is usually cut off about 6 months
before the date of the data supply to allow for sufficient follow-up data for analysis.
Therefore, the NBCSP data held at the AIHW at any given time is about 6 months behind the
current date.
Accessibility
The NBCSP annual monitoring reports, and any supplementary data, are available via the
AIHW website where they can be downloaded without charge. Users can request data not
available online or in reports via the Cancer and Screening Unit of the AIHW on (02) 6244
1000 or via email to <[email protected]>. Requests that take longer than half an hour to
compile are charged on a cost-recovery basis. General enquiries about AIHW publications
can be made to the Communications, Media and Marketing Unit on (02) 6244 1032 or via
email to <[email protected]>.
General enquiries about AIHW publications can be made to the Communications, Media and
Marketing Unit on (02) 6244 1032 or via email to <[email protected]>.
Interpretability
While the concept of participation in the NBCSP is easy to interpret, the NBCSP screening
pathway and other concepts and statistical calculations are more complex and may be
confusing to some users. All concepts are explained within the body of the reports
presenting these data, along with footnotes to provide further details and caveats. The
appendices provide additional detail on the data sources and classifications, and on the
statistical methods used.
Relevance
NBCSP screening data are highly relevant for monitoring trends and outcomes from NBCSP
screening participation. It is important to note that additional bowel cancer screening is
undertaken outside the NBCSP. Data on people screened outside the program are not
routinely collected, therefore, the level of underestimation of overall bowel cancer screening
in Australia is unknown.
Socioeconomic status Index of Relative Socio-economic Disadvantage (IRSD) rankings are
calculated by postal area (POA) using a population-based method at the Australia-wide
level. These ranked socioeconomic status POAs are then allocated to their relevant
jurisdiction, meaning quintiles should contain similar socioeconomic groups across
jurisdictions.
Accuracy
Self-reporting of Aboriginal and Torres Strait Islander, language spoken at home and
disability status within the program means these data are dependent on accurate, and
complete, information.
168
Cancer in Australia: an overview, 2012
Socioeconomic status Index of Relative Socio-economic Disadvantage (IRSD) rankings are
only measured at the time of the census and are not available for about 18 months from the
census date. Consequently, socioeconomic status for a geographic area may be up to 6 years
out of date and not an accurate representation of the status of residents at the time the data is
analysed.
An Australian Bureau of Statistics POA to remoteness concordance and a POA to
socioeconomic status concordance are used to allocate persons screened to remoteness and
socioeconomic status categories based on their postcode of residence. Postal areas are
defined to match Australia Post postcodes as closely as possible, but for various reasons,
they do not match identically. Socioeconomic status is calculated using a population-based
method at the Australia-wide level.
The remoteness (and socioeconomic status) to POA concordances are based on postal areas,
boundaries and classifications as at the year of the last Australian census, which may have
been up to 5 years earlier, and boundaries, socioeconomic status and remoteness regions
may have changed over time, creating inaccuracies. New postal areas defined since the last
census will not have valid remoteness or socioeconomic status concordance data available as
they will not match the old postal areas.
NBCSP outcome data is via non-mandatory form return from GP visits, colonoscopy,
histopathology, adverse events and surgical resection. The level of form return is unknown,
therefore, there is an unknown amount of missing outcome data, which needs to be taken
into consideration when reviewing NBCSP outcome analyses.
The data used in NBCSP monitoring reports allows for 6 months of follow-up time postinvitation. However, this may not be enough time for all people who had a positive
screening result to have completed the screening pathway and had outcomes returned to the
Register. This may also result in some under-reporting of outcome data.
Some data cells have been suppressed for confidentiality and reliability reasons (for example,
if the denominator is less than 1,000, the numerator is less than 5, or the rate could not be
sensibly estimated).
Coherence
NBCSP screening data are reported and published annually by the AIHW. Changes in
reporting practices over time are clearly noted throughout the monitoring reports. In future,
the addition of extra screening ages and biennial rescreening are expected to affect results in
most areas of the screening pathway.
National Cervical Screening Program data
Data from the National Cervical Screening Program were used in Chapter 9 to indicate the
number of women who participated and the number of high-grade cervical abnormalities
detected through the program. Participation data are supplied to the AIHW by state and
territory cervical screening programs and include all women screened in each jurisdiction,
not just those women resident in each jurisdiction (AIHW 2012e). The two exceptions to this
are Victoria, which only supplies data on women resident in Victoria, and the Australian
Capital Territory, which only registers women resident in the Australian Capital Territory.
Incidence data came from the Australian Cancer Database.
Cancer in Australia: an overview, 2012
169
Data Quality Statement: cervical screening data
Summary of key issues
•
All states and territories maintain a population-based cervical cytology register (also
referred to as ’Pap test registers’ or ‘Pap smear registers’) to which all cervical cytology,
histology, and human papillomavirus (HPV) DNA tests are reported.
•
State and territory cervical cytology registers were established to support the National
Cervical Screening Program (NCSP) which began in 1991.
•
The Australian Institute of Health and Welfare (AIHW) compiles cervical screening data
using aggregate data supplied from state and territory cervical cytology registers in
order to monitor the NCSP annually.
•
Some duplication may occur where the same test is reported to the cervical cytology data
in two or more jurisdictions. The AIHW is unable to identify or resolve these instances,
and although the level of duplication is unknown, it is believed to be small.
•
Cervical cytology register databases change every day, adding new records and
improving the quality of existing records as new information becomes available.
Description
All states and territories have legislation that requires pathology laboratories to send all
cervical tests to the relevant state or territory population-based cervical cytology register.
Cervical screening programs in each state and territory interrogate their own cervical
cytology register in accordance with detailed data specifications to supply aggregate data
annually to the AIHW. These data are compiled into the only repository of national cervical
screening data, although because these are aggregate and not unit record data, these data do
not exist in a database per se, and cannot be interrogated further.
Institutional environment
The AIHW is a major national agency set up by the Australian Government under the
Australian Institute of Health and Welfare Act 1987 to provide reliable, regular and relevant
information and statistics on Australia’s health and welfare. It is an independent statutory
authority established in 1987, governed by a management board, and accountable to the
Australian Parliament through the Health and Ageing portfolio.
The AIHW aims to improve the health and wellbeing of Australians through better health
and welfare information and statistics. It collects and reports information on a wide range of
topics and issues, ranging from health and welfare expenditure, hospitals, disease and
injury, and mental health, to ageing, homelessness, disability and child protection.
The Institute also plays a role in developing and maintaining national metadata standards.
This work contributes to improving the quality and consistency of national health and
welfare statistics. The Institute works closely with governments and non-government
organisations to achieve greater adherence to these standards in administrative data
collections to promote national consistency and comparability of data and reporting.
One of the main functions of the AIHW is to work with the states and territories to improve
the quality of administrative data and, where possible, to compile national datasets based on
data from each jurisdiction, to analyse these datasets and disseminate information and
statistics.
170
Cancer in Australia: an overview, 2012
The Australian Institute of Health and Welfare Act 1987, in conjunction with compliance to the
Privacy Act 1988 (Cwlth), ensures that the data collections managed by the AIHW are kept
securely and under the strictest conditions with respect to privacy and confidentiality.
For further information, see the AIHW website <www.aihw.gov.au>.
The AIHW has been receiving cervical screening data since 1989.
Timeliness
Cervical cytology data are available within about 6 months (there can be a lag of up to 6
months in the transmission of test results from pathology laboratories to cervical cytology
registers), and data for the previous calendar year are supplied in July each year (rescreening
and correlation data lag behind, as the specifications for these require a specified period of
time to pass before this can be accurately calculated).
The current cervical screening data contains all cytology and histology tests performed in
2010.
Accessibility
Cervical screening data are published annually in the report Cervical screening in Australia,
available on the AIHW website <http://www.aihw.gov.au/cervical-cancer-screening/>
where they can be downloaded without charge. Supplementary data tables that provide
more detailed data are also provided to accompany each report, and these, too, are available
on the AIHW website where they can be downloaded without charge.
General enquiries about AIHW publications can be made to the Communications, Media and
Marketing Unit on (02) 6244 1032 or via email to <[email protected]>.
Interpretability
While many concepts in the report Cervical screening in Australia are easy to interpret, other
concepts and statistical calculations are more complex and may be confusing to some users.
All concepts are explained within the body of the report presenting these data, along with
footnotes to provide further details and caveats. Appendix C provides additional detail on
the data sources and classifications, and Appendix E provides details on the statistical
methods used.
Relevance
Cervical screening data are highly relevant for monitoring trends in cervical screening
participation and abnormality detection trends. The data are used for many purposes by
policy makers and researchers, but are supplied and analysed specifically to monitor and
inform the NCSP.
Accuracy
All data provided by state and territory cervical screening programs, once analysed, are
supplied back for verification.
Further, the National Pathology Accreditation Advisory Council (NPAAC) Performance
Measures for Australian Laboratories Reporting Cervical Cytology allow some cervical screening
data compiled and reported by the AIHW to be compared with data that are also sourced
from state and territory cervical cytology registers for a different purpose.
Cancer in Australia: an overview, 2012
171
Coherence
Cervical screening data are reported and published annually by the AIHW. Changes in
reporting practices over time are clearly noted throughout the reports.
National Death Index
Cancer incidence data were linked to the National Death Index (NDI) to provide survival
and prevalence information (Chapters 4 and 5). The NDI is a database that is maintained by
the AIHW, and it contains information on all deaths in Australia since 1980.
The NDI database comprises the following variables for each deceased person: name,
alternative names (including maiden names), date of birth (or estimated year of birth), age at
death, sex, date of death, marital status, Aboriginal and Torres Strait Islander status, and
state or territory of registration. Cause of death information in a coded form is also available.
For records to 1996, only the code for underlying cause of death is available. For records
from 1997, the codes for the underlying cause of death and all other causes of death
mentioned on the death certificate are available.
This database exists solely for research linkage purposes, such as to gain epidemiological
mortality information on individuals in a particular cohort, or with a known disease state.
Ethics approval is required for the NDI to be used for any particular research project.
Data Quality Statement: National Death Index
Summary of key issues
•
Deaths occurring in Australia are registered and maintained by the Registrars of Births,
Deaths and Marriages in each state and territory. These registration details are then
provided to the Australian Institute of Health and Welfare (AIHW) and are assumed to
be as correct as possible. The AIHW has no ability to confirm the correctness and
completeness of these data.
•
It is expected that some death registration details may contain errors and some
information that is critical might be missing. The AIHW uses a probabilistic data linking
technique to link researchers’ data to the NDI. Consequently, the linkage result is an
indication or index of death, rather than an absolute fact of death.
•
Incorrect linkages can result because of errors or incorrect details in personal information
supplied when deaths are registered. Examples of such errors are: the changed surname
when women marry is not provided; given names are transposed, incorrectly spelt, or
partly replaced by nicknames; the date of birth is wrong, the birth day of an elderly
relative might be known, but not the year of birth.
•
Linkages are tailored to the needs of the researcher, in terms of the matching tightness.
Description
The NDI is a database, housed at the AIHW, which contains records of all deaths occurring
in Australia since 1980. The data are obtained from the Registrars of Births, Deaths and
Marriages in each state and territory. The Index is designed to facilitate the conduct of
epidemiological studies and its use is strictly confined to medical research.
Researchers undertaking such studies need to follow up groups of persons who, for example
take part in clinical trials, or who have suffered from particular diseases, or are known to
172
Cancer in Australia: an overview, 2012
have been exposed to specific hazards, in order to determine, whether death has occurred,
and if so to analyse the survival rate and causes of death.
Each Registry records only those deaths that occur in its own state or territory, and if a
person dies in a state or territory other than the one in which the circumstances being
studied were experienced, without the NDI the researchers would have to contact every
Registry to determine whether or not a death has been registered.
Institutional environment
The AIHW is a major national agency set up by the Australian Government under the
Australian Institute of Health and Welfare Act 1987 to provide reliable, regular and relevant
information and statistics on Australia's health and welfare. It is an independent statutory
authority established in 1987, governed by a management board, and accountable to the
Australian Parliament through the Health and Ageing portfolio.
The AIHW aims to improve the health and wellbeing of Australians through better health
and welfare information and statistics. It collects and reports information on a wide range of
topics and issues, ranging from health and welfare expenditure, hospitals, disease and
injury, and mental health, to ageing, homelessness, disability and child protection.
The Institute also plays a role in developing and maintaining national metadata standards.
This work contributes to improving the quality and consistency of national health and
welfare statistics. The Institute works closely with governments and non-government
organisations to achieve greater adherence to these standards in administrative data
collections to promote national consistency and comparability of data and reporting.
One of the main functions of the AIHW is to work with the states and territories to improve
the quality of administrative data and, where possible, to compile national datasets based on
data from each jurisdiction, to analyse these datasets and disseminate information and
statistics.
The Australian Institute of Health and Welfare Act 1987, in conjunction with compliance to the
Privacy Act 1988 (Cwlth), ensures that the data collections managed by the AIHW are kept
securely and under the strictest conditions with respect to privacy and confidentiality.
For further information see the AIHW website <www.aihw.gov.au>.
Timeliness
The Registrars of Births, Deaths and Marriages in each state and territory provide to the
AIHW on a monthly basis, the details of deaths registered in a given month, as soon as that
month ends, usually within the first two weeks of the following month.
In most cases, deaths that were registered in a given month did happen in that month,
however some deaths are registered many years after death occurs, for example in cases
when the remains are found.
Cause of death information is derived from the National Mortality Database (NMD), which
records the underlying and other causes of death as ICD10 codes derived by the Australian
Bureau of Statistics (ABS) from the death certificates. This information is generally not
available for the most recent two years of data.
The latest and the most current NDI data are available to link to the researchers’ cohort.
Cancer in Australia: an overview, 2012
173
Accessibility
Researchers can access the NDI if their study generally meets the following set of conditions:
•
the study focuses on health issues
•
the study has been approved by the researcher’s host institution ethics committee and
the AIHW Ethics Committee. Typically this review concentrates on the issues of public
interest and use of confidential information
•
the study is scientifically valid (as judged by a peer review process)
•
the study results will be placed in the public domain (for example, published papers or
books, conference presentations, feedback to patients)
•
the study will not break confidentiality provisions
•
the study investigators comply with the AIHW legislation under which the data are
released
•
the data will be secured in an environment that guarantees confidentiality of individual’s
data.
Given that the study can meet these conditions, it can be best progressed by researchers
discussing feasibility and likely costs with one of the contact officers in the AIHW. To
formally apply for NDI use, researchers can obtain from the Institute’s web page an NDI data
provision package (<www.aihw.gov.au/national-death-index/>). This package includes
instructions as to what data formats are required, a description of the NDI, the legislation
covering the use of NDI data and the AIHW Ethics Committee application forms. These
forms contain questions relating to the objectives of the project, the security of the
confidential information, the intended release of the study results and the public benefit that
might be gained from conducting the study. The Ethics Committee will consider these
factors in determining whether to grant approval to the project. The Committee meets four
times a year. Once a study is given an Ethics Committee certificate, the project can proceed.
Interpretability
The NDI database held by the AIHW comprises such variables for each deceased person as:
name, alternative names (including maiden names), dates of birth (or estimated year of
birth), age at death, sex, date of death, marital status, indigenous status, state/territory of
registration and registration number. In some records, the additional information of address
and the text related to cause of death is available.
Cause of death information in a coded form is derived by linking the NDI registration
numbers for deaths with the NMD. This latter data base records underlying cause of death in
ICD10 codes as derived by Australian Bureau of Statistics (ABS) from the death certificates.
This information is generally not available for the most recent two years of data.
A description of the NDI is included in the application package that researchers use when
applying to link their data to the NDI. The researchers are made aware of the probabilistic
nature of the data linkage method and are instructed to treat the linkage results as indication
or index of death, rather than as an absolute fact.
Relevance
The NDI contains records of all deaths that occurred in Australia since 1980 to the most
recent month past.
174
Cancer in Australia: an overview, 2012
Researchers are made aware of the limitation of the probabilistic data linkage method and
that they need to provide sufficient details of their subjects for the technique to be effective.
Accuracy
Deaths occurring in Australia are registered and maintained by the Registrars of Births,
Deaths and Marriages in each state and territory. These registration details are then provided
to the AIHW and are assumed to be as correct as possible. The AIHW has no ability to
confirm the correctness and completeness of these data.
It is expected that some death registration details may contain errors and some information
that is critical might be missing. The AIHW uses a probabilistic data linking technique to link
researchers’ data to the NDI. Consequently, the linkage result is an indication or index of
death, rather than an absolute fact of death. These issues are communicated to the
researchers.
Incorrect linkages can result because of errors or incorrect details in personal information
supplied when deaths are registered. Examples of such errors are: the changed surname
when women marry is not provided; given names are transposed, incorrectly spelt, or partly
replaced by nicknames; the date of birth is wrong, the birth day of an elderly relative might
be known, but not the year of birth.
Linkages are tailored to the needs of the researcher, in terms of the matching tightness. For
example some studies require that the matching be very precise and the researchers will only
accept matches that are identical in terms of name, date of birth/death and sex, whereas
others will allow for variations in names and dates at least. These scenarios are catered for by
using probabilistic record linkage software. The AIHW undertakes the linkage and in some
cases clerical reviews of marginal matches. Reports of the final matches are then provided to
the researchers. The linkage result is an indication or index of death, rather than an absolute
fact of death.
Coherence
Only a small number of variables such as: names, sex, date of birth, date of death and
components of address are utilised from the NDI for the linking purpose. Although the file
formats in which data are provided by the Registrars changes from time to time, the contents
of data remains constant. To ensure consistency, a substantial cleaning and standardisation
of data takes place before loading to the database. For example, names are converted to
upper case, dates are standardised to ‘yyyymmdd’ format and gender is set to ‘1’ for males
and ‘2’ for females.
The one serious exception from the consistency over time is coded cause of death. This field
was derived by ABS from the death certificates and is obtained from the NMD, by linking it
to the NDI. The causes of death are coded using the International Classification of Diseases
(ICD) that originated in the 1800s and undergoes revisions from time to time. The current
version is ICD-10. It is critical to know the version of the ICD that relates to given data. This
information and the description of data items are provided to the researchers with the
linking results.
National Hospital Morbidity Database
Data from the National Hospital Morbidity Database (NHMD) are used in Chapter 8 of this
report to examine the number of cancer-related hospitalisations. The NHMD contains
Cancer in Australia: an overview, 2012
175
demographic, diagnostic, procedural and duration of stay information on episodes of care
for patients admitted to hospital. This annual collection is compiled and maintained by the
AIHW, using data supplied by state and territory health authorities. Information from
almost all hospitals in Australia is included in the database: public acute and public
psychiatric hospitals; private acute and private psychiatric hospitals; and private
free-standing day hospital facilities. The database is episode-based and it is not possible to
count patients individually.
Coverage for the NHMD is essentially complete. For 2010–11, all public hospitals were
included, except for a small mothercraft hospital in the Australian Capital Territory. Private
hospital data were not provided for private freestanding day facilities in the Australian
Capital Territory and the Northern Territory, and for one private freestanding day facility in
Tasmania.
The majority of private hospitals were also included. Most of the private facilities that did
not report to the NHMD were free-standing day hospital facilities. For 2010–11, data were
not provided for private day hospital facilities in the Australian Capital Territory and the
Northern Territory, and for a small private hospital in Victoria. Victoria estimated that its
data were essentially complete. Counts of private hospital hospitalisations presented in this
report are therefore likely to be underestimates of the actual counts.
Comprehensive hospital statistics from this database are released by the AIHW annually
(AIHW 2012b). Further information about this data source is available in those reports.
Data are held in the NHMD for the years from 1993–94 to 2010–11. In this report data on
cancer-related hospitalisations are presented for 2010–11.
The hospitalisations data presented in this report exclude those hospitalisations for which
the care type was reported as newborn (unqualified days only), hospital boarder or
posthumous organ procurement. Thus, it includes all other admitted care hospitalisations
including those with a care type of acute care, rehabilitation care and palliative care.
Data Quality Statement: National Hospital Morbidity Database
Summary of key issues
176
•
The National Hospital Morbidity Database (NHMD) is a comprehensive dataset that has
records for all separations of admitted patients from essentially all public and private
hospitals in Australia.
•
A record is included for each separation, not for each patient, so patients who separated
more than once in the year have more than one record in the NHMD.
•
For 2010–11, almost all public hospitals provided data for the NHMD. The exception was
a mothercraft hospital in the Australian Capital Territory. The great majority of private
hospitals also provided data, the exceptions being the private day hospital facilities in
the Australian Capital Territory, the single private free-standing day hospital facility in
the Northern Territory, and a small private hospital in Victoria.
•
Hospitals may be re-categorised as public or private between or within years.
•
There is apparent variation between states and territories in the use of statistical
discharges and associated assignment of care types.
•
There was variation between states and territories in the reporting of separations for
Newborns (without qualified days):
Cancer in Australia: an overview, 2012
–
For 2010–11, private hospitals in Victoria did not report most Newborn episodes
without qualified days, therefore the count of newborn episodes will be
underestimated.
–
South Australian private hospitals are not required to provide records for Newborn
episodes without qualified days.
–
For Tasmania, where a newborn’s qualification status was considered qualified at
any point during the episode of care, the entire episode was reported as qualified
days. As a consequence, the average length of stay for Newborn episodes with
qualified days only in Tasmanian public hospitals is not directly comparable with
that in other states.
•
Data on state of hospitalisation should be interpreted with caution because of crossborder flows of patients. This is particularly the case for the Australian Capital Territory.
In 2010–11, about 23% of separations for Australian Capital Territory hospitals were for
patients who resided in New South Wales.
•
Variations in admission practices and policies lead to variation among providers in the
number of admissions for some conditions.
•
Caution should be used in comparing diagnosis, procedure and external cause data over
time, as the classifications and coding standards for those data can change over time. In
particular, in 2010–11, there were significant changes in the coding of diagnoses for
diabetes, obstetrics and imaging procedures.
•
The Indigenous status data are of sufficient quality for statistical reporting purposes for
the following jurisdictions: New South Wales, Victoria, Queensland, South Australia,
Western Australia and the Northern Territory (public hospitals only). National totals
include these six jurisdictions only. Indigenous status data reported for Tasmania and
the Australian Capital Territory should be interpreted with caution until further
assessment of Indigenous identification is completed.
Description
The National Hospital Morbidity Database (NHMD) is a compilation of episode-level
records from admitted patient morbidity data collection systems in Australian hospitals. It is
a comprehensive data set that has records for all episodes of admitted patient care from
essentially all public and private hospitals in Australia.
The data supplied are based on the National Minimum Data Set (NMDS) for admitted
patient care and include demographic, administrative and length of stay data, as well as data
on the diagnoses of the patients, the procedures they underwent in hospital and external
causes of injury and poisoning.
In 2010–11, diagnoses and external causes of injury and poisoning were recorded using the
7th edition of the International statistical classification of diseases and related health problems, tenth
revision, Australian modification (ICD-10-AM). Procedures were recorded using the seventh
edition of the Australian Classification of Health Interventions (ACHI).
The counting unit for the NHMD is the ‘separation’. Separation is the term used to refer to
the episode of admitted patient care, which can be a total hospital stay (from admission to
discharge, transfer or death) or a portion of a hospital stay beginning or ending in a change
of type of care (for example, from acute care to rehabilitation).
The NHMD contains records from 1993–94 to 2010–11. For each reference year, the NHMD
includes records for admitted patient separations between 1 July and 30 June.
Cancer in Australia: an overview, 2012
177
Timeliness
The reference period for this data set is 2010–11. This includes records for admitted patient
separations between 1 July 2010 and 30 June 2011.
States and territories provided a first version of 2010–11 data to the AIHW at the end of
December 2011. The data were published on 30 April 2012. Data provision and publication
were in accordance with agreed timetables.
Relevance
The purpose of the NHMD is to collect information about care provided to admitted patients
in Australian hospitals. The scope of the NHMD is episodes of care for admitted patients in
all public and private acute and psychiatric hospitals, free-standing day hospital facilities
and alcohol and drug treatment centres in Australia. Hospitals operated by the Australian
Defence Force, corrections authorities and in Australia’s off-shore territories are not in scope
but some are included.
The hospital separations data do not include episodes of non-admitted patient care provided
in outpatient clinics or emergency departments. Patients in these settings may be admitted
subsequently, with the care provided to them as admitted patients being included in the
NHMD.
The NHMD is the source of information for 12 performance indicators for the National
Healthcare Agreement and other national performance reporting.
Although the NHMD is a valuable source of information on admitted patient care, the data
have limitations. For example, variations in admission practices and policies lead to variation
among providers in the number of admissions for some conditions (such chemotherapy and
endoscopies).
Accuracy
Although there are national standards for data on admitted patient care, statistics may be
affected by variations in admission and reporting practices across states and territories.
There is apparent variation between states and territories in the use of statistical discharges
and associated assignment of care types.
For 2010–11, principal diagnosis information was not provided for 882 public hospital
separations and 3,306 private hospital separations.
There was variation between public and private hospitals and, for private hospitals, between
states and territories in the timing of the implementation of the seventh edition ICD-10-AM
coding standards for obstetrics cases in 2010–11. Therefore, the principal diagnosis data for
obstetrics cases are not comparable between public and private hospitals, and are not
comparable over time.
There was variation between states and territories in the reporting of separations for
Newborns (without qualified days):
178
•
For 2010–11, private hospitals in Victoria did not report most Newborn episodes without
qualified days, therefore the count of newborns will be underestimated.
•
South Australian private hospitals are not required to provide records for Newborn
episodes without qualified days.
•
For Tasmania, where a newborn’s qualification status was considered qualified at any
point during the episode of care, the entire episode was reported as qualified days. As a
Cancer in Australia: an overview, 2012
consequence, the average length of stay for Newborn episodes with qualified days only in
Tasmanian public hospitals is not directly comparable with that in other jurisdictions.
The quality of the data reported for Indigenous status are of sufficient quality for statistical
reporting purposes for the following jurisdictions: New South Wales, Victoria, Queensland,
South Australia, Western Australia and the Northern Territory (public hospitals only).
National totals include these six jurisdictions only. Indigenous status data reported for
public hospitals in Tasmania and the Australian Capital Territory should be interpreted with
caution until further assessment of Indigenous identification is completed.
Not all states provided information on the area of usual residence of the patient in the form
of a statistical local area (SLA) code for all presentations. In addition, not all states and
territories provided the version of SLA specified in the NMDS.
Where necessary, the AIHW mapped the supplied area of residence data for each
presentation to the same SLA and to remoteness area categories based on the Australian
Bureau of Statistics (ABS) Australian Standard Geographical Classification (ASGC)
Remoteness Structure for 2006. This mapping was done on a probabilistic basis. Because of
the probabilistic nature of the mapping, the SLA and remoteness areas data for individual
records may not be accurate; however, the overall distribution of records by geographical
area is considered useful.
Socioeconomic status is based on the reported area of usual residence of the patient. The
Socio-Economic Indexes for Areas (SEIFA) categories for socioeconomic status are assigned
at the national level, not at the individual state/territory level.
Coherence
The NHMD includes data for each year from 1993–94 to 2010–11.
The data reported for 2010–11 are broadly consistent with data reported for the NHMD for
previous years.
Time series presentations may be affected by changes in admission practices, particularly for
same-day activity such as dialysis, chemotherapy and endoscopy.
Between 2009–10 and 2010–11:
•
there was a decrease in private hospital separations for Victoria due to the
reclassification of some same-day mental health care as non-admitted patient activity
(which was previously classified as admitted patient activity)
•
there was a decrease in separations (and patient days) for psychiatric care reported for
Tasmanian public hospitals due to the categorisation of some care as residential care. In
previous years, this care was categorised as admitted patient care.
Changes in the ICD-10-AM/ACHI classifications and the associated Australian Coding
Standards may affect the comparability of the data over time. In particular, in 2010–11, there
were significant changes in the coding of diagnoses for diabetes, obstetrics and imaging
procedures.
National Mortality Database
Data from the National Mortality Database are used in Chapter 3 and 6 to provide statistical
information on mortality in Australia due to cancer. The mortality data used in this report
were provided by the Registries of Births, Deaths and Marriages, the ABS and the National
Cancer in Australia: an overview, 2012
179
Coroners Information System. These data are maintained at the AIHW in the National
Mortality Database.
The registration of deaths has been compulsory since the mid-1850s and this information is
registered with the relevant state and territory Registrar of Births, Deaths and Marriages.
Since 1906, the Commonwealth Statistician has compiled the information collected by the
Registrars and published national death information.
The National Mortality Database contains information for all deaths in Australia registered
from 1964 to 2010. In this report, data are presented for the 20 years from 1991 to 2010.
The information on cause of death is coded by the ABS to an international standard, the
International classification of disease and related health problems, currently the tenth revision
(ICD-10).
Over time, changes have been made to the coding and processing of mortality data that
affect comparability of the data. For instance, data holdings on cause of death for 1987 to
1996 were manually coded using the ninth revision of the ICD, while the data for 1997
onwards were coded to the ICD-10 standard, using an automated system. The change to the
coding and processing of mortality data introduced a break, in 1997, in the time series.
In the National Mortality Database, both the year of occurrence of the death and the year in
which the death was registered are provided. For the purposes of this report, mortality data
are shown based on the year of death, except for the most recent year (namely, 2010) where
the number of people whose death was registered is used. Previous investigation has shown
that the year of death and its registration coincide for the most part. However, in some
instances, deaths at the end of each calendar year may not be registered until the following
year. Thus, year of death information for the latest available year is generally an
underestimate of the actual number of deaths that occurred in that year.
Queensland mortality data by Aboriginal and Torres Strait Islander status have been
adjusted for late registrations in 2010. More information is available in the ABS Causes of
death 2010 (cat. no. 3303.0) (ABS 2012a) from <www.abs.gov.au>.
The data quality statements underpinning the National Mortality Database can be found in
the following ABS publications: ABS Quality declaration summary for Causes of death 2010
(cat. no. 3303.0) (ABS 2012a) and ABS Quality declaration summary for Deaths, Australia
2010 (cat. no. 3302.0) (ABS 2012b) from <http://www.abs.gov.au>.
Population data
Throughout this report, population data were used to derive rates of, for example, cancer
incidence and mortality. The population data were sourced from the ABS demography
section using the most up-to-date estimates available at the time of analysis.
To derive their estimates of the resident populations, the ABS uses the 5-yearly Census of
Population and Housing data and adjusts it as follows:
•
•
•
180
all respondents in the Census are placed in their state or territory, statistical local area
and postcode of usual residence; overseas visitors are excluded
an adjustment is made for persons missed in the Census (about 2%)
Australians temporarily overseas on Census night are added to the usual residence
Census count.
Cancer in Australia: an overview, 2012
Estimated resident populations are then updated each year from the census data using
indicators of population change, such as births, deaths and net migration. More information
is available from the ABS website <www.abs.gov.au>.
For the Indigenous comparisons in this report (Chapter 6), the most recently released
Indigenous experimental estimated resident populations as released by the ABS were used
(ABS 2009a). Those estimates were based on the 2006 Census of Population and Housing.
Cancer in Australia: an overview, 2012
181
Appendix J Definition of cancer-related
hospitalisations
Data on hospitalisations include principal diagnosis—this is the reason determined to be
chiefly responsible for the person’s hospitalisation. The principal diagnosis recorded is
usually a disease, (or injury or poisoning), but can also be a specific treatment of an already
diagnosed condition, such as chemotherapy for cancer. These treatments are usually coded
using Z-codes defined in ICD-10-AM Chapter 21 ‘Factors influencing health status and
contact with health services’ (NCCH 2010).
Due to the method in which the principal diagnosis for hospitalisations of cancer patients is
coded, it is insufficient to simply select those hospitalisations for which cancer was recorded
as the principal diagnosis—it must also include those hospitalisations where a treatment
relating to cancer was recorded as the principal diagnosis.
Many cancer-related interventions recorded as a principal diagnosis (such as Z51.1
Chemotherapy or Z12 Special screening examination for neoplasm) are specific only to the
investigation for, or treatment of cancer. However, some (Z45.1 and Z45.2 Adjustment and
management of infusion pumps or vascular devices) apply to a number of disease types.
For some cancer-related interventions (such as same-day chemotherapy), the Australian
Coding Standards (NCCH 2010) stipulate that the principal diagnosis is to be coded to reflect
the treatment with the type(s) of cancer listed as an additional diagnosis. This standard does
not apply, however, to all cancer-related interventions.
Thus, for the purposes of examining the number of admitted patient hospitalisations that
arose due to invasive cancer or were directly related to the investigation, treatment or care
for cancer, ‘cancer–related hospitalisations’ were identified in this report as those
hospitalisations in which:
•
the principal diagnosis was cancer (ICD-10 AM codes C00–C97, D45, D46, D47.1 and
D47.3)
or
•
the principal diagnosis was related to health services or treatment for cancer. This
includes a principal diagnosis of one of the following cancer-specific ICD-10-AM Zcodes:
–
Z08
Follow-up examination after treatment for malignant neoplasms
–
Z12
Special screening examination for neoplasm
–
Z40.0 Prophylactic surgery
–
Z51.0 Radiotherapy session
–
Z51.1 Pharmacotherapy session for neoplasm
–
Z54.1 Convalescence following radiotherapy
–
Z54.2 Convalescence following chemotherapy
–
Z80
Family history of malignant neoplasm
–
Z85
Personal history of malignant neoplasm
or
182
Cancer in Australia: an overview, 2012
•
a principal diagnosis of one of the following non-cancer specific ICD-10-AM Z codes
with an additional diagnosis of cancer (ICD-10 AM codes C00–C97, D45, D46, D47.1 and
D47.3):
–
Z29.1 Prophylactic immunotherapy
–
Z29.2 Other prophylactic chemotherapy
–
Z42.0 Follow-up care involving plastic surgery of head and neck
–
Z42.1 Follow-up care involving plastic surgery of breast
–
Z45.1 Adjustment and management of infusion pump
–
Z45.2 Adjustment and management of vascular access device.
Identifying palliative care separations
Information on the provision of palliative care is captured by two NHMD data items, ‘care
type’ and ‘diagnosis’. They can be used to identify separations in an admitted patient setting
for which palliation was a substantial component of the care provided.
A ‘Care type’ is assigned for each admitted patient separation, with any one separation equal
to either a total hospital stay (from admission to discharge, transfer or death) or to a portion
of a hospital stay beginning or ending in a change of care type (for example, from a ‘Care
type’ of Acute care to a ‘Care type’ of Palliative care).
In addition, information on palliative care is also recorded in the NHMD under the
‘diagnosis’ data items. While diagnosis codes usually describe a disease, injury or poisoning,
they can also be used in certain instances to indicate the specific care or service provided for
a current condition or other reasons for hospitalisation. This is the case when Palliative care is
recorded as a diagnosis code ‘Z51.5’.
For the purpose of this report, a palliative care separation is defined as a separation for
which palliation was a substantial component of the care provided, and those in which the
principal clinical intent of the care was palliation during part or all of the separation, as
evidenced by a code of Palliative care for the ‘Care type’ and/or diagnosis data items in the
NHMD. Further information is in the AIHW’s report Palliative Care Services in Australia
(AIHW 2012g).
Cancer in Australia: an overview, 2012
183
Glossary
Aboriginal or Torres Strait Islander: A person of Aboriginal and/or Torres Strait Islander
descent who identifies as an Aboriginal and/or Torres Strait Islander. See also Indigenous.
Additional diagnosis: A condition or complaint either coexisting with the principal
diagnosis or arising during the episode of care.
Administrative databases: Observations about events that are routinely recorded or
required by law to be recorded. Such events include births, deaths, hospital separations and
cancer incidence. Administrative databases include the Australian Cancer Database, the
National Mortality Database and the National Hospital Morbidity Database.
Admitted patient: A person who undergoes a hospital’s formal admission process to receive
treatment and/or care. Such treatment or care can occur in hospital and/or in the person’s
home (as a ‘hospital-in-home’ patient).
Age-specific rate: A rate for a specific age group. The numerator and denominator relate to
the same age group.
Age-standardisation: A method of removing the influence of age when comparing
populations with different age structures. This is usually necessary because the rates of many
diseases vary strongly (usually increasing) with age. The age structures of the different
populations are converted to the same ‘standard’ structure; then the disease rates that would
have occurred with that structure are calculated and compared.
Average length of stay (ALOS): The average (mean) number of patient days for admitted
patient episodes. Patients admitted and separated on the same date are allocated a length of
stay of 1 day.
Benign: Non-cancerous tumours that may grow larger but do not spread to other parts of the
body.
Burden of disease and injury: Term referring to the quantified impact of a disease or injury
on an individual or population, using the disability-adjusted life year (DALY) measure.
Cancer (malignant neoplasm): A large range of diseases in which some of the body’s cells
become defective, begin to multiply out of control, can invade and damage the area around
them, and can also spread to other parts of the body to cause further damage.
Carcinoma: A cancer that begins in the lining layer (epithelial cells) of organs such as the
ovaries.
Chemotherapy: The use of drugs (chemicals) to prevent or treat disease, with the term being
applied for treatment of cancer rather than for other uses.
Cohort method: A method of calculating survival that is based on a cohort of people
diagnosed with cancer in a previous time period and followed over time.
Combined hormone replacement therapy: Daily hormone therapy/hormone replacement
therapy containing oestrogen plus progestin, a synthetic form of the natural hormone.
Comorbidity: When a person has two or more health problems at the same time.
184
Cancer in Australia: an overview, 2012
Confidence interval (CI): A statistical term describing a range (interval) of values within
which we can be ‘confident’ that the true value lies, usually because it has a 95% or higher
chance of doing so.
Constant prices: Dollar amounts for different years that are adjusted to reflect the prices in a
chosen reference year. This provides a way of comparing expenditure over time on an equal
value-for-value basis without the distorting effects of inflation. The comparison will reflect
only the changes in the amount of goods and services purchased—changes in the ‘buying
power’—not the changes in prices of these goods and services caused by inflation.
Crude rate: The number of events in a given period divided by the size of the population at
risk in a specified time period.
Crude survival: The proportion of people alive at a specified point in time subsequent to the
diagnosis of cancer.
Disability-adjusted life years (DALYs): A year of healthy life lost, either through premature
death or equivalently through living with disability due to illness or injury. It is the basis
unit used in burden of disease and injury estimates.
Death due to cancer: A death where the underlying cause is indicated as cancer.
Expected survival: A measure of survival that reflects the proportion of people in the general
population alive for a given amount of time. Expected survival estimates are crude estimates
calculated from life tables of the general population by age, sex and calendar year.
Heath expenditure: Includes expenditure on health goods and services (for example,
medications, aids and appliances, medical treatment, public health, research) that collectively
are termed current expenditure; and on health-related investment which is often referred to
as capital expenditure.
Histology: The microscopic characteristics of cellular structure and composition of tissue.
Hospitalisation: See Separation.
Incidence: The number of new cases (of an illness or event, and so on) in a given period.
Indigenous: A person of Aboriginal and/or Torres Strait Islander descent who identifies as
an Aboriginal and/or Torres Strait Islander. See also Aboriginal or Torres Strait Islander.
International Statistical Classification of Diseases and Related Health Problems: The
World Health Organization’s internationally accepted classification of death and disease. The
tenth revision (ICD-10) is currently in use. ICD-10-AM is the Australian modification of ICD10; it is used for diagnoses and procedures recorded for patients admitted to hospitals (see
Appendix E).
Invasive: See Malignant.
Length of stay: Duration of hospital stay, calculated by subtracting the date the patient was
admitted from the day of separation. All leave days, including the day the patient went on
leave, are excluded. A same-day patient is allocated a length of stay of 1 day.
Life tables: Tables of annual probabilities of death in the general population.
Limited-duration prevalence: The number of people alive at a specific time who have been
diagnosed with cancer over a specified period (such as the previous 5 or 25 years).
Malignant: A tumour with the capacity to spread to surrounding tissue or to other sites in
the body.
Cancer in Australia: an overview, 2012
185
Median: The midpoint of a list of observations that have been ranked from the smallest to
the largest.
Metastasis: See Secondary cancer.
Mortality due to cancer: The number of deaths which occurred during a specified period
(usually a year) for which the underlying cause of death was recorded as cancer.
Mortality-to-incidence ratio (MIR): The ratio of the age-standardised mortality rate for
cancer to the age-standardised incidence rate for cancer.
New cancer case: See Incidence.
Neoplasm: An abnormal (‘neo’, new) growth of tissue. Can be ‘benign’ (not a cancer) or
‘malignant’ (a cancer). Also known as a tumour.
Non-Indigenous: People who have declared that they are not of Aboriginal or Torres Strait
Islander descent.
Observed survival: A measure of survival that reflects the proportion of people alive for a
given amount of time after a diagnosis of cancer. Observed survival estimates are crude
estimates calculated from population-based cancer data.
Other Australians: Includes people who have declared that they are not of Aboriginal or
Torres Strait Islander descent as well as those who have not stated their Indigenous status.
Overnight patient: An admitted patient who receives hospital treatment for a minimum of
1 night (that is, is admitted to, and separates from, hospital on different dates).
Patient days: The number of full or partial days of stay for patients who were admitted for
an episode of care and who underwent separation during the reporting period. A patient
who is admitted and separated on the same day is allocated one patient day.
Period method: A method of calculating survival that is based on the survival experience
during a recent at-risk or follow-up time period.
Population estimates: Official population numbers compiled by the Australian Bureau of
Statistics at both state and territory and statistical local area levels by age and sex, as at
30 June each year. These estimates allow comparisons to be made between geographical
areas of differing population sizes and age structures (see Appendix E).
Prevalence (or complete prevalence): The total number of people alive at a specific date who
have ever been diagnosed with a particular disease such as cancer.
Primary cancer: A tumour that is at the site where it first formed (see also Secondary cancer).
Principal diagnosis: The diagnosis listed in hospital records to describe the problem that
was chiefly responsible for the patient’s episode of care in hospital.
Procedure: A clinical intervention that is surgical in nature, carries a procedural risk, carries
an anaesthetic risk, requires specialised training and/or requires special facilities or
equipment available only in the acute care setting.
Relative survival: The ratio of observed survival of a group of persons diagnosed with cancer
to expected survival of those in the corresponding general population after a specified interval
following diagnosis (such as 5 or 10 years).
Risk factor: Any factor that represents a greater risk of a health disorder or other unwanted
condition or event. Some risk factors are regarded as causes of disease, others are not
186
Cancer in Australia: an overview, 2012
necessarily so. Along with their opposites, namely protective factors, risk factors are known
as ‘determinants’.
Same-day patient: A patient who is admitted to, and separates from, hospital on the same
date.
Secondary cancer: A tumour that originated from a cancer elsewhere in the body. Also
referred to as a metastasis.
Separation: An episode of care for an admitted patient which may include a total hospital
stay (from admission to discharge, transfer or death) or a portion of a hospital stay that
begins or ends in a change of type of care (for example, from acute to rehabilitation). In this
report, separations are also referred to as hospitalisations.
Statistical significance: An indication from a statistical test that an observed difference or
association may be significant or ‘real’ because it is unlikely to be due just to chance. A
statistical result is usually said to be ‘significant’ if it would occur by chance only once in 20
times or less often (see Appendix B for more information about statistical significance).
Stage: The extent of a cancer in the body. Staging is usually based on the size of the tumour,
whether lymph nodes contain cancer, and whether the cancer has spread from the original
site to other parts of the body.
Survival: A general term indicating the probability of being alive for a given amount time
after a particular event, such as a diagnosis of cancer.
Symptom: Any indication of a disorder that is apparent to the person affected.
Underlying cause of death: The disease or injury that initiated the sequence of events
leading directly to death.
Valid FOBT test: Only faecal occult blood test (FOBT) results that are either positive or
negative are classified as valid results. Inconclusive results are excluded from analysis.
Years of healthy life lost due to disability (YLD): For each new case of cancer, YLD equals
the average duration of the cancer (to remission or death) multiplied by a severity weight for
cancer (which depends upon its disabling effect over the disease duration).
Years of life lost (YLL): For each new case, YLL equals the number of years between
premature death and the standard life expectancy for the individual.
Cancer in Australia: an overview, 2012
187
References
ABS (Australian Bureau of Statistics) 2006. Statistical Geography Volume 1— Australian
Standard Geographical Classification (ASGC). Canberra: ABS. Viewed Viewed 4 April 2012,
<http://www.abs.gov.au/AUSSTATS/[email protected]/Previousproducts/1216.0Contents1Jul%20
2006?opendocument&tabname=Summary&prodno=1216.0&issue=Jul%202006&num=&view
=>.
ABS 2008a. Information paper: an introduction to Socio-Economic Indexes for Areas (SEIFA)
2006. ABS cat. no. 2039.0. Canberra: ABS.
ABS 2008b. Population projections, Australia 2006 to 2101. ABS cat. no. 3222.0. Canberra:
ABS.
ABS 2008c. Standard Australian Classification of Countries (SACC). ABS cat. no. 1269.
Canberra: ABS.
ABS 2009a. Experimental Estimates and Projections, Aboriginal and Torres Strait Islander
Australians, 1991 to 2021. ABS cat. no. 3238.0. Canberra: ABS.
ABS 2009b. Experimental life tables for Aboriginal and Torres Strait Islander Australians,
2005–2007. ABS cat. no. 3303.0.55.003. Canberra: ABS.
ABS 2012a. Causes of Death, Australia, 2010. ABS cat. no. 3303.0. Canberra: ABS.
ABS 2012b. Causes of Death, Australia, 2010. ABS cat. no. 3303.0. Canberra: ABS.
ABS & AIHW (Australian Institute of Health and Welfare) 2008. The health and welfare of
Australia’s Aboriginal and Torres Strait Islander peoples 2008. ABS cat. no. 4704.0 and
AIHW Cat. no. AIHW 21. Canberra: ABS & AIHW.
ACS (American Cancer Society) 2009. Breast cancer facts and figures 2009–2010. Atlanta:
ACS.
AIHW (Australian Institute of Health and Welfare) 2000. Australian hospital statistics 1998–
99. Health services series no. 15. Cat. no. HSE 11. Canberra: AIHW.
AIHW 2004. Rural, regional and remote health: a guide to remoteness classifications. Cat. no.
PHE 53. Canberra: AIHW.
AIHW 2009. National Cancer Statistics Clearing House protocol 2009. Canberra: AIHW.
AIHW 2011a. The health and welfare of Australia’s Aboriginal and Torres Strait Islander
peoples: an overview. Cat. no. IHW 42. Canberra: AIHW.
AIHW 2011b. Trends in palliative care in Australian hospitals. Cat. no. HWI 112. Canberra:
AIHW.
AIHW 2012a. Australia’s health 2012. Australia’s health series no.13. Cat. no. AUS 156.
Canberra: AIHW.
AIHW 2012b. Australian hospital statistics 2010-11. Health services series no. 43. Cat. no.
HSE 117. Canberra: AIHW.
AIHW 2012c. BreastScreen Australia monitoring report 2009–2010. Cancer series no. 72. Cat.
no. CAN 68. Canberra: AIHW.
AIHW 2012d. Cancer survival and prevalence in Australia: period estimates from 1982 to
2010. Cancer Series no. 69. Cat. no. CAN 65. Canberra: AIHW.
AIHW 2012e. Cervical screening in Australia 2009–2010. Cancer series 67. Cat. no. CAN 63.
Canberra: AIHW.
188
Cancer in Australia: an overview, 2012
AIHW 2012f. National Bowel Cancer Screening Program monitoring report: phase 2, July
2008–June 2011. Cancer series no. 65. CAN 61. Canberra: AIHW.
AIHW 2012g. Palliative care services in Australia. Cat. no. HWI 120. Canberra: AIHW.
AIHW & AACR (Australasian Association of Cancer Registries) 2010. Cancer in Australia: an
overview, 2010. Cancer series no. 60. Cat. no. CAN 56. Canberra: AIHW.
AIHW & CA (Cancer Australia) 2008. Non-melanoma skin cancer: general practice
consultations, hospitalisation and mortality. Cancer series 43 Cat. no. CAN 39. Canberra:
AIHW.
AIHW & CA 2011. Lung cancer in Australia: an overview. Cat. no. CAN 58. Canberra:
AIHW.
AIHW, CA & AACR 2008. Cancer survival and prevalence in Australia: cancers diagnosed
from 1982 to 2004. Cancer series 42 Cat. no. CAN 38. Canberra: AIHW.
AIHW & DHFS (Department of Health and Family Services) 1997. First Report on National
Health Priority Areas 1996. AIHW Cat. No. PHE 1. Canberra: AIHW & DHFS.
AIHW & NBCC (National Breast Cancer Centre) 2007. Breast cancer survival by size and
nodal status. Cancer series no. 39 Cat. no. CAN34. Canberra: AIHW.
AIHW: Mathers C, Vos T & Stevenson C 1999. The burden of disease and injury in Australia.
Cat. no. PHE 17. Canberra: AIHW.
Australian Health Ministers’ Advisory Council 2010. Prostate cancer screening in Australia:
position statement. Viewed 28 June 2012,
<http://www.cancerscreening.gov.au/internet/screening/publishing.nsf/Content/449D83
7448F6BA03CA25752700062313/$File/joint%20prostate%20screening%20statement.pdf>.
Baade P, Youlden D & Chambers S 2011. When do I know I am cured? Using conditional
estimates to provide better information about cancer survival prospects. Medical Journal of
Australia 194(2):1784–92.
Baade PD, Coory MD & Aitken JF 2004. International trends in prostate-cancer mortality: the
decrease is continuing and spreading. Cancer Causes Control 15:237-41.
Begg S, Vos T, Barker B, Stevenson C, Stanley L & Lopez A 2007. The burden of disease and
injury in Australia 2003. Cat. no. PHE 82. Canberra: AIHW.
Binns PL & Condon JR 2006. Participation in cervical screening by Indigenous women in the
Northern Territory: a longitudinal study. Medical Journal of Australia 185:490–4.
Black R, Sankaranarayanan R & Parkin D 1998. Interpretation of population-based cancer
survival data. In: Sankaranarayanan R, Black R & Parkin D (eds). Cancer survival in
developing countries. Lyon: IARC Scientific Publication, 13–7.
Bosch FX, Lorincz A, Munoz N, Meijer CJ & Shah KV 2002. The causal relation between
human papillomavirus and cervical cancer. Journal of Clinical Pathology 55:244–65.
BreastScreen Australia 2004. BreastScreen Australia National Accreditation Standards.
Canberra: DoHA.
BreastScreen Australia Evaluation Advisory Committee 2009. BreastScreen Australia
Evaluation: evaluation final report. Screening Monograph No. 1/2009. Canberra: DoHA.
Viewed 28 June 2012,
<http://www.cancerscreening.gov.au/internet/screening/publishing.nsf/Content/brevaluation-report-cnt>.
Brenner H & Arndt V 2004. Recent increase in cancer survival according to age: higher
survival in all age groups, but widening age gradient. Cancer Causes Control 15:903–10.
Cancer in Australia: an overview, 2012
189
Brenner H & Gefeller O 1996. An alternative approach to monitoring cancer patient survival.
Cancer 78:2004–10.
Breslow N & Day N 1987. Statistical methods in cancer research. Lyon: International Agency
for Research on Cancer.
Brillinger DR 1986. The natural variability of vital rates and associated statistics. Biometrics
42:693–734.
Brotherton JM, Fridman M, May CL, Chappell G, Saville AM & Gertig DM 2011. Early effect
of the HPV vaccination programme on cervical abnormalities in Victoria, Australia: an
ecological study. Lancet 377:2085–92.
Cancer Australia 2010. Cancer data to improve cancer survival. Canberra: Cancer Australia.
Cancer Council Queensland 2011. Cancer in Queensland: Incidence, Mortality, Survival and
Prevalence—1982 to 2008. Spring Hill: Cancer Council Queensland.
Center MM, Jemal A, Smith RA & Ward E 2009. Worldwide variations in colorectal cancer.
CA Cancer Journal for Clinicians 59:366–78.
CCS (Canadian Cancer Statistics) 2010. Canadian Cancer Statistics 2010. Toronto: CCS.
CCS & NCIC (National Cancer Institute of Canada) 2007. Canadian cancer statistics 2007.
Toronto: CCS.
Coleman MP, Forman D, Bryant H, Butler J, Rachet B, Maringe C et al. 2011. Cancer survival
in Australia, Canada, Denmark, Norway, Sweden, and the UK, 1995–2007 (the International
Cancer Benchmarking Partnership): an analysis of population-based cancer registry data.
Lancet 377:127–38.
COAG (Council of Australian Governments) Reform Council 2011. National Healthcare
Agreement: performance report for 2009–10. Sydney: COAG Reform Council.
Condon J 2004. Cancer, health services and indigenous Australians. Canberra: OATSIH.
Condon J, Armstrong B, Barnes A & Cunningham J 2003. Cancer in Indigenous Australians:
a review. Cancer Causes Control 14:109–21.
Condon J, Armstrong B, Barnes T & Zhao Y 2005. Cancer incidence and survival for
Indigenous Australians in the Northern Territory. Australian and New Zealand Journal of
Public Health 29:123–8.
Condon J, Warman G & Arnold L (eds) 2001. The health and welfare of Territorians. Darwin:
Epidemiology Branch, Territory Health Services.
Coory MF, P. Muller, J. Dunn, N. 2002. Participation in cervical screening by women in rural
and remote Aboriginal and Torres Strait Islander communities in Queensland. Medical
Journal of Australia 177:544–7.
Cunningham J, Rumbold AR, Zhang X & Condon JR 2008. Incidence, aetiology, and
outcomes of cancer in Indigenous peoples in Australia. Lancet Oncology 9:585–95.
Curado M, Edwards B, Shin H, Storm H, Ferlay J, Heanue M et al. (eds) 2007. Cancer
Incidence in Five Continents Vol. IX. Lyon: IACR.
Department of Health and Ageing 2012. National Cervical Screening Program. 11 November
2009. Canberra: Department of Health and Ageing. Viewed 10 July 2012,
<http://www.cancerscreening.gov.au/internet/screening/publishing.nsf/Content/cervical
-about>.
DHFS (Department of Health and Family Services) & AIHW 1998. National Health Priority
Areas Report on Cancer Control 1997. AIHW Cat. No. PHE 4. Canberra: DHFS & AIHW.
190
Cancer in Australia: an overview, 2012
Dickman PW & Adami H-O 2006. Interpreting trends in cancer patient survival. Journal of
Internal Medicine 260:103–17.
Dobson AJ, Kuulasmaa K, Eberle E & Scherer J 1991. Confidence intervals for weighted sums
of Poisson parameters. Stat Med 10:457–62.
Donovan B, Franklin N, Guy R, Grulich AE, Regan DG, Ali H et al. 2011. Quadrivalent
human papillomavirus vaccination and trends in genital warts in Australia: analysis of
national sentinel surveillance data. Lancet Infectious Diseases 11:39–44.
Duncombe J, Stavrou E, Chen W, Baker D, Tracey E & Bishop J 2009. Bladder cancer in New
South Wales. Sydney: Cancer Institute NSW.
Eayres D, Cunningham A, Fryers P, Abbas J, Flowers J & Stockton D 2008. APHO technical
briefing 3: commonly used public health statistics and their confidence intervals. York:
Association of Public Health Observatories. Viewed 10 December 2010,
<http://www.apho.org.uk/resource/item.aspx?RID=48457>.
Ederer F & Heise H 1959. Instructions to IBM 650 programmers in processing survival
computations. Methodological note No.10. Bethesda: National Cancer Institute.
Ellison LF & Gibbons L 2006. Survival from cancer—up-to-date predictions using period
analysis. Health Reports 17:19–30.
English D, Farrugia H, Thursfield V, Chang P & Giles G 2007. Cancer survival Victoria 2007.
Melbourne: The Cancer Council Victoria Epidemiology Centre.
Ferlay J, Shin H, Bary F, Forman D, Mathers C & Parkin D 2010. GLOBOCAN 2008 version
1.2. Cancer incidence and mortality worldwide. IARC CancerBase No. 10. Lyon: IARC.
Fritz A, Percy C, Jack A, Shanmugaratnam K, Sobin L & Parkin D 2000. International
Classification of Disease for Oncology. Geneva: WHO.
IARC (International Agency of Research on Cancer) 2004. International rules for multiple
primary cancers (ICD–O 3rd edn). Lyon: IARC. Viewed 2 August 2011,
<www.iacr.com.fr/MPrules_july2004.pdf>.
IARC 2008. World cancer report 2008. Lyon: IARC.
Jensen O, Parkin D, MacLennan R, Muir C & Skeet R (eds) 1991. Cancer registration:
principles and methods. IARC scientific publications no. 95. Lyon: IARC.
Luke C, Tracey E, Stapleton A & Roder D 2010. Exploring contrary trends in bladder cancer
incidence, mortality and survival: implications for research and cancer control. Internal
Medicine Journal 40:357–63.
Morris M, Lacopetta B & Platell C 2007. Comparing survival outcomes for patients with
colorectal cancer treated in public and private hospitals. Medical Journal of Australia
186(6):296–300.
National HPV Vaccination Register 2011. Information for health professionals. May 2011.
Melbourne: Victorian Cytology Service Inc. Viewed 16 June 2012,
<http://www.hpvregister.org.au/health-professionals.aspx>.
NBOCC (National Breast and Ovarian Cancer Centre) 2009. National Breast and Ovarian
Cancer Centre and Royal Australasian College of Surgeons National Breast Cancer Audit.
Public Health Monitoring Series 2007 Data. Sydney: NBOCC.
NCCH (National Cantre for Classification in Health) 2010. The International Statistical
Classification of Diseases and Related Health Problems, Tenth Revision, Australian
Modification (ICD-10-AM), Australian Classification of Health Interventions (ACHI) and
Australian Coding Standards (ACS), 7th edn. Sydney: University of Sydney.
Cancer in Australia: an overview, 2012
191
NCRI (National Cancer Registry Ireland) & WHC (Women's Health Council) 2006. Women
and cancer in Ireland 1994-2001. Dublin: WHC.
NHPAC (National Health Priority Action Council) 2006a. National Chronic Disease Strategy.
Canberra: DoHA.
NHPAC 2006b. National service improvement framework for cancer. Canberra: DoHA.
Read TR, Hocking JS, Chen MY, Donovan B, Bradshaw CS & Fairley CK 2011. The near
disappearance of genital warts in young women 4 years after commencing a national human
papillomavirus (HPV) vaccination programme. Sexually Transmitted Infections
doi:10.1136/sextrans-2011-050234
Roder D 2005. Comparative cancer incidence, mortality and survival in Indigenous and nonIndigenous residents of South Australia and the Northern Territory. Cancer Forum 29(1):7–9.
Schroder FH, Hugosson J, Roobol MJ, Tammela TL, Ciatto S, Nelen V et al. 2009. Screening
and prostate-cancer mortality in a randomized European study. New England Journal of
Medicine 360:1320-8.
Scollo M & Winstanley M (eds) 2008. Tobacco in Australia: facts and issues. Melbourne:
Cancer Council Victoria.
Smith DP, Supramaniam R, Marshall VR & BK A 2008. Prostate cancer and prostate-specific
antigen testing in New South Wales. Medical Journal of Australia 189:315-8.
Stumpers S & Thomson N 2009. Review of cancer among indigenous peoples.: Australian
Indigenous Health Infonet. Viewed 22-02-2010 2010,
<http://www.healthinfonet.ecu.edu.au/chronic-conditions/cancer/reviews/our-review>.
Threlfall TJ & Thompson JR 2009. Cancer incidence and mortality in Western Australia, 2007.
Perth: Department of Health, Western Australia.
Tracey E, Kerr T, Dobrovic A & Currow D 2010. Cancer in NSW: Incidence and mortality
report 2008. Sydney: Cancer Institute NSW.
Walboomers JM, Jacobs MV, Manos MM, Bosch FX, Kummer JA, Shah KV et al. 1999.
Human papillomavirus is a necessary cause of invasive cervical cancer worldwide. Journal
of Pathology 189:12-9.
WCRF (World Cancer Research Fund) & AICR (American Institute for Cancer Research)
2007. Food, nutrition, physical activity and the prevention of cancer: a global perspective.
Washington: AICR.
WHO (World Health Organisation) 1992. International statistical classification of diseases
and related health problems, 10th revision. Volume 1. Geneva: WHO.
WHO 2002. National cancer control programmes: policies and managerial guidelines, second
edition. Geneva: WHO.
Xing Y, Chang G, Hu C, Askew R, Ross M & Gershenwald Jea 2010. Conditional survival
estimates improve over time for patients with advanced melanoma: results from a
population-based analysis. Cancer 116:2234–41.
192
Cancer in Australia: an overview, 2012
List of tables
Table 1:
Estimated 20 most commonly diagnosed cancers, Australia, 2012 ....................................x
Table 2:
The 20 most common causes of death from cancer, Australia, 2010 ................................ xi
Table 2.1:
Estimated incidence of all cancers combined, Australia, 2012.......................................... 12
Table 2.2:
Estimated 10 most commonly diagnosed cancers, Australia, 2012 .................................. 13
Table 2.3:
Estimated risk of being diagnosed with cancer, Australia, 2012 ...................................... 14
Table 3.1:
Deaths from all cancers combined, Australia, 2010............................................................ 25
Table 3.2:
The 10 most common causes of death from cancer, Australia, 2010 ................................ 26
Table 3.3:
Risk of death from cancer, Australia, 2010 .......................................................................... 27
Table 4.1:
Five-year relative survival from all cancers combined, Australia, 2006–2010 ................ 38
Table 4.2:
Summary of conditional relative survival from all cancers combined,
Australia, 2006–2010 ............................................................................................................... 44
Table 5.1:
Limited-duration prevalence of all cancers combined, Australia, as
at end of 2007 ........................................................................................................................... 49
Table 6.1:
Incidence of all cancers combined by state and territory, Australia, 2004–2008 ............ 57
Table 6.2:
Mortality from all cancers combined by state and territory, Australia,
2006–2010 ................................................................................................................................. 57
Table 7.1:
Estimated leading cancer causes of burden of disease, Australia, 2012 .......................... 69
Table 8.1:
Number of hospitalisations, persons, Australia, 2010–11 ................................................. 74
Table 8.2:
Average length of stay (days) for cancer-related overnight hospitalisations,
persons, Australia, 2010–11 ................................................................................................... 75
Table 8.3:
Ten most common hospitalisations with a principal diagnosis of cancer,
persons, Australia, 2010–11 ................................................................................................... 76
Table 8.4:
Five most common other cancer-related hospitalisations, persons,
Australia, 2010–11 ................................................................................................................... 77
Table 8.5:
Palliative care hospitalisations, Australia, 2009–10 ............................................................ 80
Table 8.6:
Ten most common palliative care hospitalisations with a principal diagnosis
of cancer, persons, Australia, 2009–10.................................................................................. 81
Table 9.1:
Participation in the BreastScreen Australia Program, females, Australia,
2009–2010 ................................................................................................................................. 85
Table 9.2:
Participation in the National Cervical Screening Program, females aged
20–69, Australia, over 2-year (2009–2010), 3-year (2008–2010), and
5-year (2006–2010) period ...................................................................................................... 88
Table 9.3:
Participation in the National Bowel Cancer Screening Program,
1 July 2008–30 June 2011 ........................................................................................................ 92
Table 9.4:
National Bowel Cancer Screening Program outcomes from colonoscopic
investigation of positive FOBT (including histopathology), by age and sex,
1 July 2008–30 June 2011 ........................................................................................................ 95
Table A1:
Cancer codes ............................................................................................................................ 96
Cancer in Australia: an overview, 2012
193
194
Table B1:
Observed incidence (2009) and mortality (2010) of all cancers, and
estimated for 2012 ................................................................................................................. 100
Table B2:
Observed incidence (2009) and mortality (2010) of acute myeloid leukaemia,
and estimated for 2012 ......................................................................................................... 101
Table B3:
Observed incidence (2009) and mortality (2010) of cancer of the anus, and
estimated for 2012 ................................................................................................................. 102
Table B4:
Observed incidence (2009) and mortality (2010) of bladder cancer, and
estimated for 2012 ................................................................................................................. 103
Table B5:
Observed incidence (2009) and mortality (2010) of bowel cancer, and
estimated for 2012 ................................................................................................................. 104
Table B6:
Observed incidence (2009) and mortality (2010) of brain cancer, and
estimated for 2012 ................................................................................................................. 105
Table B7:
Observed incidence (2009) and mortality (2010) of breast cancer, and
estimated for 2012 ................................................................................................................. 106
Table B8:
Observed incidence (2009) and mortality (2010) of cervical cancer, and
estimated for 2012 ................................................................................................................. 107
Table B9:
Observed incidence (2009) and mortality (2010) of chronic lymphocytic
leukaemia, and estimated for 2012 ..................................................................................... 108
Table B10:
Observed incidence (2009) and mortality (2010) of cancer of the gallbladder
and bile ducts cancer, and estimated for 2012 .................................................................. 109
Table B11:
Observed incidence (2009) and mortality (2010) of hodgkin lymphoma, and
estimated for 2012 ................................................................................................................. 110
Table B12:
Observed incidence (2009) and mortality (2010) of kidney cancer, and
estimated for 2012 ................................................................................................................. 111
Table B13:
Observed incidence (2009) and mortality (2010) of laryngeal cancer, and
estimated for 2012 ................................................................................................................. 112
Table B14:
Observed incidence (2009) and mortality (2010) of lip cancer, and
estimated for 2012 ................................................................................................................. 113
Table B15:
Observed incidence (2009) and mortality (2010) of liver cancer, and
estimated for 2012 ................................................................................................................. 114
Table B16:
Observed incidence (2009) and mortality (2010) of lung cancer, and
estimated for 2012 ................................................................................................................. 115
Table B17:
Observed incidence (2009) and mortality (2010) of melanoma of the skin,
and estimated for 2012 ......................................................................................................... 116
Table B18:
Observed incidence (2009) and mortality (2010) of mesothelioma, and
estimated for 2012 ................................................................................................................. 117
Table B19:
Observed incidence (2009) and mortality (2010) of mouth cancer, and
estimated for 2012 ................................................................................................................. 118
Table B20:
Observed mortality (2010) of multiple primary cancers, and estimated for 2012 ........ 119
Table B21:
Observed incidence (2009) and mortality (2010) of myelodysplastic
syndrome, and estimated for 2012 ...................................................................................... 120
Table B22:
Observed incidence (2009) and mortality (2010) of myeloma, and
estimated for 2012 ................................................................................................................. 121
Cancer in Australia: an overview, 2012
Table B23:
Observed incidence (2009) and mortality (2010) of non-Hodgkin lymphoma,
and estimated for 2012 ......................................................................................................... 122
Table B24:
Observed incidence (2009) and mortality (2010) of non-melanoma skin cancer,
and estimated for 2012 ......................................................................................................... 123
Table B25:
Observed incidence (2009) and mortality (2010) of oesophageal cancer, and
estimated for 2012 ................................................................................................................. 124
Table B26:
Observed incidence (2009) and mortality (2010) of cancer of other digestive
organs, and estimated for 2012............................................................................................ 125
Table B27:
Observed incidence (2009) and mortality (2010) of other myeloproliferative
cancers, and estimated for 2012 .......................................................................................... 126
Table B28:
Observed incidence (2009) and mortality (2010) of other soft tissue cancers,
and estimated for 2012 ......................................................................................................... 127
Table B29:
Observed incidence (2009) and mortality (2010) of ovarian cancer, and
estimated for 2012 ................................................................................................................. 128
Table B30:
Observed incidence (2009) and mortality (2010) of pancreatic cancer, and
estimated for 2012 ................................................................................................................. 129
Table B31:
Observed incidence (2009) and mortality (2010) of prostate cancer, and
estimated for 2012 ................................................................................................................. 130
Table B32:
Observed incidence (2009) and mortality (2010) of stomach cancer, and
estimated for 2012 ................................................................................................................. 131
Table B33:
Observed incidence (2009) and mortality (2010) of testicular cancer, and
estimated for 2012 ................................................................................................................. 132
Table B34:
Observed incidence (2009) and mortality (2010) of thyroid cancer, and
estimated for 2012 ................................................................................................................. 133
Table B35:
Observed incidence (2009) and mortality (2010) of tongue cancer, and
estimated for 2012 ................................................................................................................. 134
Table B36:
Observed incidence (2009) and mortality (2010) of unknown primary site,
and estimated for 2012 ......................................................................................................... 135
Table B37:
Observed incidence (2009) and mortality (2010) of uterine cancer, and
estimated for 2012 ................................................................................................................. 136
Table C1:
Number of new cases (2009) and deaths (2010) by cancer type, persons,
Australia ................................................................................................................................. 137
Table I1:
Agreed set of items to be provided by the states and territories to the AIHW
for inclusion in the Australian Cancer Database .............................................................. 157
Table I2:
Cancer groupings and ICD-10 codes used for calculation of burden of disease .......... 165
Cancer in Australia: an overview, 2012
195
List of figures
196
Figure 2.1:
Estimated incidence rates of all cancers combined by age at diagnosis,
Australia, 2012 ......................................................................................................................... 14
Figure 2.2:
Trends in incidence of all cancers combined, Australia, 1991 to 2009, with
estimates to 2012 ..................................................................................................................... 16
Figure 2.3:
Percentage change in age-standardised incidence rates, Australia, 1991 to 2009 .......... 17
Figure 2.4:
Trends in incidence of prostate cancer in males and breast cancer in females,
Australia, 1991 to 2009, with estimates to 2012 ................................................................... 18
Figure 2.5:
Trends in incidence of bowel cancer, Australia, 1991 to 2009, with estimates to
2012 ........................................................................................................................................... 19
Figure 2.6:
Trends in incidence of melanoma of the skin, Australia, 1991 to 2009, with
estimates to 2012 ..................................................................................................................... 20
Figure 2.7:
Trends in incidence of lung cancer, Australia, 1991 to 2009, with estimates
to 2012 ....................................................................................................................................... 21
Figure 2.8:
International comparison of estimated incidence for all cancers combined,
persons, 2008............................................................................................................................ 22
Figure 3.1:
Mortality from all cancers combined by age at death, Australia, 2010............................ 27
Figure 3.2:
Trends in mortality from all cancers combined, Australia, 1991 to 2010 ........................ 28
Figure 3.3:
Percentage change in age-standardised mortality rates, Australia, 1991 to 2010........... 30
Figure 3.4:
Trends in mortality from lung cancer, Australia, 1991 to 2010 ......................................... 31
Figure 3.5:
Trends in mortality from bowel cancer, Australia, 1991 to 2010 ...................................... 31
Figure 3.6:
Trends in mortality from prostate cancer in males and breast cancer in females,
Australia, 1991 to 2010............................................................................................................ 32
Figure 3.7:
International comparison of estimated mortality for all cancers combined,
persons, 2008........................................................................................................................... 34
Figure 4.1:
Five-year relative survival from selected cancers, Australia, 2006–2010 ........................ 39
Figure 4.2:
Five-year relative survival from all cancers combined by age at diagnosis,
Australia, 2006–2010 ............................................................................................................... 40
Figure 4.3:
Five-year relative survival from selected cancers by age at diagnosis, Australia,
2006–2010 ................................................................................................................................. 41
Figure 4.4:
Five-year relative survival from all cancers combined, Australia, 1982–1987 to
2006–2010 ................................................................................................................................. 41
Figure 4.5:
Survival trends for selected cancers, Australia, 1982–1987 to 2006–2010 ........................ 43
Figure 4.6:
Five-year survival by number of years already survived, Australia, 2006–2010 ........... 45
Figure 4.7:
International comparison of mortality-to-incidence ratios for all cancers, 2008 ............ 46
Figure 5.1:
Twenty-six-year prevalence of all cancers combined, by age group, Australia,
as at end of 2007 ...................................................................................................................... 49
Figure 5.2:
Five-year prevalence of selected cancers, Australia, as at the end of 2007 ..................... 50
Cancer in Australia: an overview, 2012
Figure 6.1:
Incidence of cervical cancer, pancreatic cancer, cancer of unknown primary
site and lung cancer by Indigenous status, New South Wales, Queensland,
Western Australia and the Northern Territory, 2004–2008 ............................................... 54
Figure 6.2:
Incidence of non-Hodgkin lymphoma, melanoma of skin, bowel cancer,
breast cancer in females and prostate cancer by Indigenous status, New
South Wales, Queensland, Western Australia and the Northern Territory,
2004–2008 ................................................................................................................................. 55
Figure 6.3:
Mortality from cervical cancer, pancreatic cancer, cancer of unknown
primary site, breast cancer in females and lung cancer by Indigenous status,
New South Wales, Queensland, Western Australia, South Australia and the
Northern Territory, 2006–2010 .............................................................................................. 56
Figure 6.4:
Incidence of prostate cancer, breast cancer in females and non-Hodgkin
lymphoma by remoteness area, Australia, 2004–2008 ....................................................... 59
Figure 6.5:
Incidence of cervical cancer, cancer of unknown primary site and lung
cancer by remoteness area, Australia, 2004–2008 ............................................................... 60
Figure 6.6:
Mortality from cervical cancer, cancer of unknown primary site, breast
cancer in females and lung cancer by remoteness area, Australia, 2006–2010 ............... 61
Figure 6.7:
Five-year relative survival from selected cancers by remoteness area,
Australia, 2006–2010 ............................................................................................................... 62
Figure 6.8:
Incidence of non-Hodgkin lymphoma, breast cancer in females and
prostate cancer by socioeconomic status, Australia, 2004–2008 ....................................... 63
Figure 6.9:
Incidence of cervical cancer, cancer of unknown primary site, lung cancer
and bowel cancer by socioeconomic status, Australia, 2004–2008 ................................... 64
Figure 6.10:
Mortality from cervical cancer, cancer of unknown primary site, bowel
cancer and lung cancer by socioeconomic status, Australia, 2006–2010 ......................... 65
Figure 6.11:
Five-year relative survival from selected cancers by socioeconomic status,
Australia, 2006–2010 ............................................................................................................... 66
Figure 7.1:
Proportion by sex for estimated leading cancer causes of burden of disease,
Australia, 2012 ......................................................................................................................... 70
Figure 7.2:
Estimated burden of disease due to cancer, by fatal and non-fatal components,
Australia, 2012 ......................................................................................................................... 71
Figure 8.1:
Age-specific rates for all cancer-related hospitalisations, Australia, 2010–11 ................ 78
Figure 8.2:
All cancer-related hospitalisations by same-day and overnight status,
Australia, 2001–02 to 2010–11 ................................................................................................ 79
Figure 9.1:
Participation in BreastScreen Australia by socioeconomic status, females
aged 50–69, 2009–2010 ............................................................................................................ 86
Figure 9.2:
Participation in BreastScreen Australia by remoteness area, females aged
50–69, 2009–2010 ..................................................................................................................... 86
Figure 9.3:
Participation in the National Cervical Screening Program by socioeconomic
status, females aged 20–69, 2009–2010 ................................................................................. 89
Figure 9.4:
Participation in the National Cervical Screening Program by remoteness area,
females aged 20–69, 2009–2010.............................................................................................. 89
Figure 9.5:
Incidence of cervical cancer in females aged 20–69, Australia, 1991 to 2009 .................. 91
Cancer in Australia: an overview, 2012
197
198
Figure 9.6:
Crude participation in the National Bowel Cancer Screening Program, by
age and sex, 2008–2011 ........................................................................................................... 92
Figure 9.7:
Crude participation in the National Bowel Cancer Screening Program by
remoteness area, 2008–2011 ................................................................................................... 93
Figure B1.1:
All cancers incidence and mortality rates, 1991–2012 ...................................................... 100
Figure B1.2:
All cancers incidence (2009) and mortality (2010) rates by age group .......................... 100
Figure B2.1:
Acute myeloid leukaemia incidence and mortality rates, 1991–2012 ............................ 101
Figure B2.2:
Acute myeloid leukaemia incidence (2009) and mortality (2010) rates
by age group .......................................................................................................................... 101
Figure B3.1:
Cancer of the anus incidence and mortality rates, 1991–2012......................................... 102
Figure B3.2:
Cancer of the anus incidence (2009) and mortality (2010) rates by age group ............. 102
Figure B4.1:
Bladder cancer incidence and mortality rates, 1991–2012 ............................................... 103
Figure B4.2:
Bladder cancer incidence (2009) and mortality (2010) rates by age group .................... 103
Figure B5.1:
Bowel cancer incidence and mortality rates, 1991–2012 .................................................. 104
Figure B5.2:
Bowel cancer incidence (2009) and mortality (2010) rates by age group....................... 104
Figure B6.1:
Brain cancer incidence and mortality rates, 1991–2012.................................................... 105
Figure B6.2:
Brain cancer incidence (2009) and mortality (2010) rates by age group ........................ 105
Figure B7.1:
Breast cancer incidence and mortality rates, 1991–2012 .................................................. 106
Figure B7.2:
Breast cancer incidence (2009) and mortality (2010) rates by age group ....................... 106
Figure B8.1:
Cervical cancer incidence and mortality rates, 1991–2012 .............................................. 107
Figure B8.2:
Cervical cancer incidence (2009) and mortality (2010) rates by age group ................... 107
Figure B9.1:
Chronic lymphocytic leukaemia incidence and mortality rates, 1991–2012 ................. 108
Figure B9.2:
Chronic lymphocytic leukaemia incidence (2009) and mortality (2010) rates
by age group .......................................................................................................................... 108
Figure B10.1:
Cancer of the gallblader and bile ducts cancer incidence and mortality rates,
1991–2012 ............................................................................................................................... 109
Figure B10.2:
Cancer of the gallbladder and bile ducts cancer indicende (2009) and
mortality (2010) rates by age group .................................................................................... 109
Figure B11.1:
Hodgkin lymphoma incidence and mortality rates, 1991–2012 ..................................... 110
Figure B11.2:
Hodgkin lymphoma incidence (2009) and mortality (2010) rates by age group .......... 110
Figure B12.1:
Kidney cancer incidence and mortality rates, 1991–2012 ................................................ 111
Figure B12.2:
Kidney cancer incidence (2009) and mortality (2010) rates by age group ..................... 111
Figure B13.1:
Laryngeal cancer incidence and mortality rates, 1991–2012 ........................................... 112
Figure B13.2:
Laryngeal cancer incidence (2009) and mortality (2010) rates by age group ................ 112
Figure B14.1:
Lip cancer incidence and mortality rates, 1991–2012 ....................................................... 113
Figure B14.2:
Lip cancer incidence (2009) and mortality (2010) rates by age group............................ 113
Figure B15.1:
Liver cancer incidence and mortality rates, 1991–2012 .................................................... 114
Figure B15.2:
Liver cancer incidence (2009) and mortality (2010) rates by age group ........................ 114
Figure B16.1:
Lung cancer incidence and mortality rates, 1991–2012.................................................... 115
Cancer in Australia: an overview, 2012
Figure B16.2:
Lung cancer incidence (2009) and mortality (2010) rates by age group ........................ 115
Figure B17.1:
Melanoma of the skin incidence and mortality rates, 1991–2012 ................................... 116
Figure B17.2:
Melanoma of the skin incidence (2009) and mortality (2010) rates by
age group ............................................................................................................................... 116
Figure B18.1:
Mesothelioma incidence and mortality rates, 1991–2012 ................................................ 117
Figure B18.2:
Mesothelioma incidence (2009) and mortality (2010) rates by age group ..................... 117
Figure B19.1:
Mouth cancer incidence and mortality rates, 1991–2012 ................................................. 118
Figure B19.2:
Mouth cancer incidence (2009) and mortality (2010) rates by age group ...................... 118
Figure B20.1:
Multiple primary cancers mortality rates, 1991–2012 ...................................................... 119
Figure B20.2:
Multiple primary cancers mortality (2010) rates by age group....................................... 119
Figure B21.1:
Myelodysplastic syndrome incidence and mortality rates, 1991–2012.......................... 120
Figure B21.2:
Myelodysplastic syndrome incidence (2009) and mortality (2010) rates
by age group .......................................................................................................................... 120
Figure B22.1:
Myeloma incidence and mortality rates, 1991–2012......................................................... 121
Figure B22.2:
Myeloma incidence (2009) and mortality (2010) rates by age group ............................. 121
Figure B23.1:
Non-Hodgkin lymphoma incidence and mortality rates, 1991–2012 ............................ 122
Figure B23.2:
Non-Hodgkin lymphoma incidence (2009) and mortality (2010) rates by
age group ............................................................................................................................... 122
Figure B24.1:
Non-melanoma skin cancer incidence and mortality rates, 1991–2012 ......................... 123
Figure B24.2:
Non-melanoma skin cancer incidence (2009) and mortality (2010) rates by
age group ............................................................................................................................... 123
Figure B25.1:
Oesophageal cancer incidence and mortality rates, 1991–2012 ...................................... 124
Figure B25.2:
Oesophageal cancer incidence (2009) and mortality (2010) rates by age group ........... 124
Figure B26.1:
Cancer of other digestive organs incidence and mortality rates, 1991–2012 ................ 125
Figure B26.2:
Cancer of other digestive organs incidence (2009) and mortality (2010) rates
by age group .......................................................................................................................... 125
Figure B27.1:
Other myeloproliferative cancers incidence and mortality rates, 1991–2012 ............... 126
Figure B27.2:
Other myeloproliferative cancers incidence (2009) and mortality (2010) rates
by age group .......................................................................................................................... 126
Figure B28.1:
Other soft tissue cancers incidence and mortality rates, 1991–2012............................... 127
Figure B28.2:
Other soft tissue cancers incidence (2009) and mortality (2010) rates by
age group ............................................................................................................................... 127
Figure B29.1:
Ovarian cancer incidence and mortality rates, 1991–2012 ............................................... 128
Figure B29.2:
Ovarian cancer incidence (2009) and mortality (2010) rates by age group ................... 128
Figure B30.1:
Pancreatic cancer incidence and mortality rates, 1991–2012 ........................................... 129
Figure B30.2:
Pancreatic cancer incidence (2009) and mortality (2010) rates by age group ............... 129
Figure B31.1:
Prostate cancer incidence and mortality rates, 1991–2012 ............................................... 130
Figure B31.2:
Prostate cancer incidence (2009) and mortality (2010) rates by age group.................... 130
Figure B32.1:
Stomach cancer incidence and mortality rates, 1982–2012 .............................................. 131
Cancer in Australia: an overview, 2012
199
200
Figure B32.2:
Stomach cancer incidence (2009) and mortality (2010) rates by age group .................. 131
Figure B33.1:
Testicular cancer incidence and mortality rates, 1991–2012 ............................................ 132
Figure B33.2:
Testicular cancer incidence (2009) and mortality (2010) rates by age group ................ 132
Figure B34.1:
Thyroid cancer incidence and mortality rates, 1991–2012 ............................................... 133
Figure B34.2:
Thyroid cancer incidence (2009) and mortality (2010) rates by age group ................... 133
Figure B35.1:
Tongue cancer incidence and mortality rates, 1991–2012................................................ 134
Figure B35.2:
Tongue cancer incidence (2009) and mortality (2010) rates by age group .................... 134
Figure B36.1:
Unknown primary site incidence and mortality rates, 1991–2012 ................................. 135
Figure B36.2:
Unknown primary site incidence (2009) and mortality (2010) rates by
age group ............................................................................................................................... 135
Figure B37.1:
Uterine cancerincidence and mortality rates, 1991–2012 ................................................. 136
Figure B37.2:
Uterine cancer incidence (2009) and mortality (2010) rates by age group .................... 136
Figure F1:
Outline of how the 2009 Australian Cancer Database was constructed ........................ 144
Figure H1:
A simplified example of how relative survival is calculated .......................................... 154
Cancer in Australia: an overview, 2012
List of boxes
Box 1.1:
Terminology used in this report…………………………………….……………...7
Box 1.2:
Throughout this report…………………………………….………………………...9
Box 2.1:
Cancer registration in Australia………………………….………………………..11
Box 4.1:
Period survival………………………….…………………………………………..37
Box 4.2:
Survival terminology in this report……………………………………………….37
Box 6.1:
Differences in mortality data reported by state and territory………………….58
Box 7.1:
What is a ‘DALY’? ………………………………………………………………….68
Box 8.1:
Summary of terms used in the hospitalisation chapter? ………………….……74
Box 8.2:
World Health Organization definition of palliative care………….……………80
Box 9.1:
What is cancer screening? ………………………….……………………………...84
Box 9.2:
The effect of the National Human papilloma virus (HPV) Vaccination
Program on cervical screening and the incidence of cervical cancer………….90
Cancer in Australia: an overview, 2012
201
Cancer in Australia an overview 2012
Cancer in Australia: an overview, 2012 presents the latest
available information on incidence, mortality, survival,
prevalence, burden of cancer, hospitalisations and national
cancer screening programs. It is estimated that the most
commonly diagnosed cancers in 2012 will be prostate
cancer, bowel cancer and breast cancer. For all cancers
combined, the incidence rate increased by 12% from
1991 to 2009, but the mortality rate decreased and survival
improved over time. Cancer outcomes differ by Aboriginal
and Torres Strait Islander status, remoteness area and
socioeconomic status.
in Australia an overview 2012
AIHW
Australasian Association
of Cancer Registries
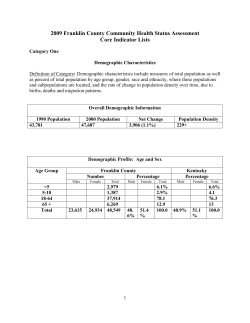
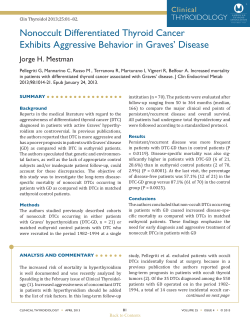


© Copyright 2026