
Ranking of States
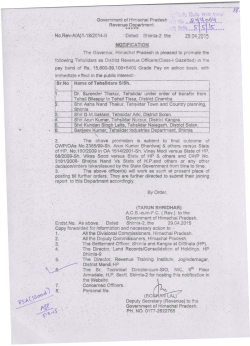
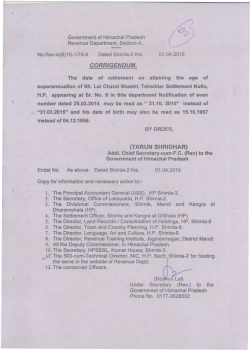
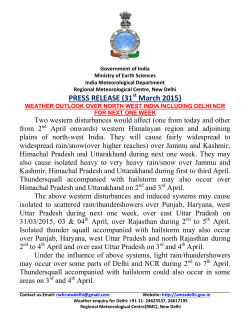
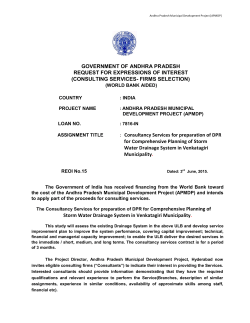
2015 How Effective is Devolution Across Indian States 2. Ranking of States in Devolution 2.1. Introduction This chapter seeks to develop a composite index to provide indicative ranking of States on four different aspects of the functioning of PRIs. 2 Ranking of States in Devolution Figure 2-1: Devolution Index - Ranking Parameter It was also proposed to assess how the major CSS are implemented by the PRIs and to rank the States according to their performances in CSS implementation through PRIs. However because of inadequacies in data on CSS this has been avoided. The composite index developed seeks to capture Effective Devolution of powers and resources as well as creation of mechanisms for responsive and efficient governance in the PRIs. The Devolution Index constructed earlier measured devolution from the standpoint of policy landmarks and executive orders passed by the State governments. The attempt here is to understand devolution from the spirit of the Constitutional mandate and the indicators are designed to best assess the achievements of the States with respect to this parameter. 2.2. Data sources As discussed in Chapter 1, two approaches of data collection were used for this study. A questionnaire was designed for the State Panchayati Raj departments, to obtain state-level aggregates on selected parameters. 45 2015 How Effective is Devolution Across Indian States Parallel to this, primary data was collected from 41 DPs, 39 BPs and 42 GPs using a structured questionnaire. The field data obtained allows for groundtruthing of data obtained from state-level aggregates and also facilitates better understanding of specific constraints faced by PRIs. The indicators on each component that are obtained from the state-level questionnaire and the PRI-level questionnaire are not identical, though they reflect similar aspects of devolution of functions, functionaries, finances and IGT. Only 5% of DPs were selected for primary data collection and only one BP and one GP were selected from the sample DPs4. Hence, in most of the States only one or two DPs are included in the sample. The sample size is too small to be representative of the State in a strictly statistical sense. The selected DPs are close to the State average (median) in proportion of SC/ST population in total population and share of agricultural workers in total rural workforce. It is assumed that such a DP would be an ‘average performing DP’ in the State, in the parameters that are being measured. Information was sought from the States disaggregated to the three tiers of panchayats. This was the first time that such data was being collected. 4 The relative ranking of the States in terms of the indicators obtained from the state-level questionnaire and the PRI-level questionnaires will vary. The discrepancies may indicate wide disparities in the performance of PRIs within the State. This is similar to sampling errors arising out of a very small sample size. The discrepancies may also indicate divergence between the intended and actual devolution in the fields captured by the field verification exercise. 2.3. Limitations of data Several challenges were faced at the time of data collection from State governments and from the field. A detailed consideration of data gaps has already been undertaken in Chapter 1, hence the discussions here will be limited only to aspects of index construction. The questionnaire was complex and the questions asked were very detailed and specific in nature. Information was sought from the States disaggregated to the three tiers of panchayats. This was the first time that such data was being collected. A detailed discussion on sample selection is in Chapter 1 46 2015 How Effective is Devolution Across Indian States The present official statistical system, whose architecture was designed to serve the needs of central and state planning, does not allow for collection, aggregation and dissemination of data that are required for planning and administration by the local bodies. In most of the cases, the State governments did not have such data readily available at their disposal. The data systems in the Panchayat Departments are weak. For example many State governments could not provide consolidated data on financial indicators such as own source revenue of panchayats, development expenditure, funds received from CSS and SSS, disaggregated by the three tiers of the panchayats. Even the number of SC, ST and women elected representatives at the three tiers was difficult to obtain. These are simple quantitative indicators that should have been readily available from a departmental MIS or annual report. To the extent that administrative records are the main sources of statistical data, weak data systems do reflect the weakness of the State level panchayat administration. However, non-availability of data is also a reflection of the inability of the present statistical system in the country to cater to the data needs of the panchayats. The present official statistical system, whose architecture was designed to serve the needs of central and state planning, does not allow for collection, aggregation and dissemination of data that are required for planning and administration by the local bodies. There is an immense need to build up systems for regular and systematic collection, aggregation and dissemination of data for panchayats. A true assessment of the status of devolution to the panchayats is contingent upon availability of data of uniform quality on relevant parameters across all PRIs in the country. The second problem faced while collecting data was ambiguity in definitions across States. For example, there was no clear definition on what is a transferred institution/ function/ scheme/ functionary and what should be the relationship between a transferred institution/ function/ scheme / functionary and the PRIs. A detailed list of existing village, block and district level institutions/ functions/ functionaries have been provided. The institutions were listed taking the responsibilities enlisted in the eleventh schedule as the reference point. Specific questions were also designed to assess the actual control exercised by the PRIs on the institution/scheme/ function/ functionary. In spite of such detailed design, satisfactory responses were not forthcoming from most of the States. Such definitional ambiguity is also a reflection of the disconnect between the line departments, the State bureaucracy and the PRIs. Instead of complementing each other, they seem to be functioning as parallel administrative structures, with the panchayats often seen as junior partners. As elaborated in Chapter 1, a large amount of effort for this report was for collecting meaningful data, data that would reflect the actual and effective status of devolution. Some of the indicators planned to be used in our analysis 47 2015 How Effective is Devolution Across Indian States had to be dropped for data limitations. Within the limitations imposed by data availability, the report has endeavoured to use the best available indicators and more detailed and objective quantification of indicators. 2.4. Components 2.4.1. Devolution of Functions The ranking of States on the devolution of functions will be based on two indicators. The first set of indicators tries to capture the detailed activities under each function transferred to the PRIs. The list of functions included in the analysis covers the 29 sectoral functions mandated by the Constitution of India as well as some general and administrative functions. The second set of indicators is the institutions transferred to PRIs. As indicated earlier there were definitional ambiguities in identifying transferred institutions. Therefore through a process of elaborate communications with the States, an effort was made to grade the institutions, working with PRIs as institutions under Substantive Functional Control (SFC) of the PRI, Limited Functional Control of the PRI (LFC) and institutions Reporting to and only Receiving Recommendations from PRIs (RRR). The institutions include the offices of the line departments at the respective tier like the office of Deputy Director of Agriculture at the District Level or an actual institution like Community Health Centre etc. For completeness, the programme setups for major CSS programmes like National Rural Health Mission (NRHM), Sarva Siksha Abhiyan (SSA) etc., have been included. The ranking as described above has been done based on the relations between the PRI and the institution, based on a checklist circulated to them. The checklist is provided in Table 2.1. The following aspects of the interrelationships were considered: The actual provision of resources from the PRI budget for the functioning of the institution, The control of PRI over actual release of funds, The control of the PRI or Standing Committee over expenditure, The role of the PRI in deciding the programmes of the institution etc. The aspect of control of functionaries was not included here since this is covered under functionaries separately. Institutions receiving more than 50% of their budgetary allocations from the PRIs on a regular basis and whose fund releases and / or expenditure are controlled by the PRI are treated as under SFC. Institutions receiving at least part of their budgetary allocations from the PRIs on a regular basis are treated as under LFC. Other institutions which regularly report details of their functioning to the PRIs and may receive recommendations (which may or may not be considered) are treated as RRR. 48 2015 How Effective is Devolution Across Indian States 2.4.2. Devolution of Functionaries Devolution of functionaries shall be based on two indicators viz., the number of functionaries at the disposal of PRIs and the composition of the functionaries. The first indicator measures the actual number of functionaries including both own functionaries and transferred, available at the panchayat. As far as functionaries are concerned they see the Chief Executive as the Controlling Officer and do not assign any space to the Political Executive in the matter of their functioning Various states have included functionaries who are under limited control of the panchayat also here even though they were requested to include details of functionaries who are only under the effective control of the Panchayats. For instance functionaries reporting to the BDO (who is incidentally the Block Panchayat Secretary) covering all the Rural Development Department functionaries in the Block, many of whom are not having any direct connection to the BP on a day to day basis as such, have been included as BP Functionaries. An effort was made to go deeper into this issue by interacting with some of the State nodal officers; which soon ran into serious conceptual issues. It was observed that many of the nodal officers can hardly identify the polity in the panchayat as having any role in working with functionaries. As far as functionaries are concerned they see the Chief Executive as the Controlling Officer and do not assign any space to the Political Executive in the matter of their functioning. The Political Executive to them had only a policy role and handled mundane issues like beneficiary selection - concerning their electorate. An effort was also made to collect data on actual control of PRIs over the functionaries at their disposal (on matters relating to leave, transfer, functional and operational control, disciplinary control); which could have thrown some additional light on the relation of the PRI with the functionaries working with them, however, the data obtained in this regard is also not complete. This aspect has been covered in field level study to a limited extent. The second component covers the composition of the functionaries based on their categorisation as Professional, Technical, Administrative and Ministerial. 49 2015 How Effective is Devolution Across Indian States Professional Technical •Professionally qualified functionaries like Engineers, Doctors, Agricultural Officer, Veterinary Officer, Lawyers, High School Teachers, Scientific staff etc •Officers implementing programmes by undertaking project formulation, scheduling and implementation identifying their institutional role •Functionaries who handle technically specific functions like ICDS Supervisors, Primary School Teachers, Nursing staff, Paramedical staff, Draftsmen, Surveyors, Mechanics, Fitters, Plumbers, Health Inspectors, Drivers etc. Administrative •Functionaries, who handle routine office functions like clerks, typists, accountants, peons etc., are treated as Administrative functionaries Ministerial •Functionaries including Night watchmen, sanitation workers, labourers and sweepers etc., are treated as Ministerial Figure 2-2: Categorisation of Functionaries The ratio of the sum of professional and technical functionaries out of the total was considered as an indicator to assess the role of the functionaries in the development and welfare functions of the PRIs. 2.4.3. Devolution of Finances The third component deals with the devolution of finances to PRIs. It measures the quantum of funds that the panchayat spent autonomously. It also measures the composition of receipts and utilization of funds from the field data. As explained in Chapter 1, there had been serious problems in the reporting of receipts and expenditure of panchayats. Because of these inconsistencies only two indicators were available from the State level data for ranking States on the devolution of finances viz., per capita share of NFC award in PRI receipts and per capita share of SFC award in PRI receipts. For calculating the per capita figures rural population (as per the 2011 census) was arrived at by subtracting the population of Urban Local Bodies5 from the total census population. Aspects of accountability of PRIs were also covered here. 2.4.4. Infrastructure, Governance and transparency In this component the infrastructure available with the PRIs, and mechanisms for governance and transparency in their functioning are assessed. The indicator on transparency has been developed using data on the number of reports on PRIs available online. 5 This is not the same as urban population, since by definition urban population includes urban agglomerations, census towns etc., falling within PRIs. 50 2015 How Effective is Devolution Across Indian States 2.5. Construction of Indices Based on the indicators covered above three indices of devolution have been constructed: a) the Index of Devolution in Policy (DPo), b) the Index of Devolution in Practice (DPr) and c) the Index of Devolution in Policy adjusted against Practice (DPa) 2.5.1. Disaggregation of indicators across the three tiers – an integrated model The questionnaires and indicators are designed in a way that allows us to measure the performance indicators at each tier of the panchayats. For example, performance of the state in transfer of institutions to the District, Block, and Panchayat levels will be analysed. A state may have done relatively well in transferring district level institutions to the DP, but failed to transfer village institutions to the Gram Panchayat. Such variations can be captured in our design of indexing. Analysis of such variations across the three tiers of the Panchayat may have important policy implications for the states to deepen the process of devolution. In the final analysis, the performance of each tier of the Panchayat across the states would be ranked. The aggregate performance (rank) of the state will be the average of the performance of each tier of PRIs. 2.5.2. Indicators The Index of Devolution in Policy (DPo) uses information collected from the State Governments of every State. The indicators used relate to four components and three tiers. The list of indicators is given in Table 2.1. Table 2-1: Indicators in the index of devolution in policy Components/Dimensions Indicators Devolution of functions Transfer of functionaries % of detailed functions transferred6 % of institutions transferred coming under SFC and LFC Number of functionaries (own + transferred) per 1000 population % of techno-professional functionaries in the functionaries own and transferred % of positions filled to sanctioned strength Devolution of finances Per capita SFC fund available Per capita CFC fund available % of Panchayats audited. Infrastructure, Governance and transparency 6 An exhaustive and detailed list of functions was provided (See questionnaire and codes used in Appendix). States were allowed to make new additions to the list. The percentage calculated is the total number of functions/activities reported by the State government as a percentage of maximum number of functions/activities reported. 51 2015 How Effective is Devolution Across Indian States Infrastructure % of panchayats with rooms, computers, and internet Transparency % of panchayats that publish accounts ,budget documents, accounts statement, audited accounts and annual performance online The Index of Devolution in Practice (DPr) uses field data from sample District, Block and Gram panchayats. Data on each indicator is collected for all three tiers of panchayats. The indicators used are listed in Table 2.2. Table 2-2: Indicators in the index of devolution in practice Components/ Dimensions Devolution of functions7 Indicators from field data % of institutions (under Substantive Functional Control and Limited Functional Control) actually transferred; % of activities undertaken by the transferred; Institutions actually managed by PRI in 2013-14; % of activities (other than those concerning transferred institutions) undertaken by PRI in 2013-14. Transfer of functionaries Functionaries per 1000 population; % of dimensions of control8; % of filled positions to sanctioned positions. Devolution of finances Per capita development expenditure; Share of SFC and CFC fund in total fund available; Own source revenue as % of total revenue; Total expenditure as % of total revenue; Accountability including upkeep of accounts computerised accounting, approval of accounts, auxiliary audit, concurrent audit and performance audit. Infrastructure, Governance and transparency Infrastructure % of amenities (out of 9) available at panchayat office. A comprehensive list of institutions and activities was provided to the States. This list was constructed using the constitutional mandate as the reference point. The state governments had to select from the list the institutions and activities that was transferred to PRIs in the respective States. The percentage used in construction of the index is the number of institutions, activities reported as transferred by the State as percentage of maximum number of institutions and activities in the code list. 8 A list of codes on the dimensions of control was provided to the States. The dimensions of control were classified as leave, transfer, functional control and disciplinary control. The percentage arrived here is the weighted average of the number of functionaries and the levels of control as percentage of the maximum value possible for the set of functionaries. ie., 100 ∑(𝑓𝑖 𝑐𝑖 ) 4 ∑ 𝑓𝑖 7 52 2015 How Effective is Devolution Across Indian States Components/ Dimensions Governance and Transparency Indicators from field data Covers measures of Governance including registers managed, minutes books maintained, electronic records systems established, mechanisms for certification of project records etc. Systems for transparency include existence of websites, beneficiary records mandatory disclosure on accounts statements, social audit and other systems of mandatory disclosure. 2.5.3. Measurement of indicators – use of numbers and ratios To the extent possible, the use of ordinal scores (subjective scoring on a predetermined scale) to quantify the indicators has been avoided. Most of the quantified indicators are ratios and numbers in an interval scale. To make such quantification possible, an exhaustive set of codes and options for each question have been designed and the indicator value can be objectively derived from the responses. Apart from minimizing subjectivity in assigning scores, the indicators also become more sensitive to small differences between the states, that is, the indicators are able to capture variation across states better. 2.5.4. Normalisation of indicators Each quantified indicator may have different maximum and minimum values, and different mean values. This makes comparisons and aggregation across indicators difficult. Hence, the indicators must be normalized to enable aggregation. The normalized indicator value has been arrived at using a distance function. The distance function is most commonly used in construction of composite indices. The indicator value of variable x, State i is computed as, 𝑑(𝑥𝑖 ) = (𝐴𝑐𝑡𝑢𝑎𝑙 𝑥𝑖 − 𝑀𝑖𝑛 𝑥) (𝑀𝑎𝑥 𝑥 − 𝑀𝑖𝑛 𝑥) where Min x is the minimum value of x and Max x is the maximum value of x observed among all the States. For example, if per capita SFC fund for DP for a State is 2.01, the maximum value of the said indicator for the tier is 1472 and minimum is zero; then the normalised indicator value for the indicator per capita award for DP for the State is equal to 𝑑(𝑥𝑖 ) = 2.01 − 0 = 0.0014 1472 − 0 2.5.5. Aggregation 1. The component indices The Devolution indices DPo and DPr consist of three components, Devolution of Functions, Functionaries and Finances, and IGT (Infrastructure, Governance and Transparency). Each of these component indices are disaggregated for the three tiers of the Panchayats. 53 2015 How Effective is Devolution Across Indian States 2. The Tier-wise Component Index for component k and tier j can be denoted as, 𝐷𝑘𝑗 = 1 𝑛 ∑ 𝑑𝑖𝑗 , ∀ 𝑎𝑙𝑙 𝑑𝑖 ∈ 𝐶𝑜𝑚𝑝𝑜𝑛𝑒𝑛𝑡 𝑘 𝑖 Where, dij is the ith indicator for jth tier in component k, and n is the total number of indicators in component k. Thus, each indicator gets equal weight in the component index.For example, the Tier-wise Component Index (calculated for the Composite Index on Policy) for GP, for the component ‘functions’ would be computed from the normalised values of the two indicators under that component as mentioned in Table 2.1, as follows. Component Index for functions equals: 𝑁𝑜𝑟𝑚𝑎𝑙𝑖𝑠𝑒𝑑 𝑉𝑎𝑙𝑢𝑒 𝑜𝑓 𝑖𝑛𝑑𝑖𝑐𝑎𝑡𝑜𝑟 1 + 𝑁𝑜𝑟𝑚𝑎𝑙𝑖𝑠𝑒𝑑 𝑉𝑎𝑙𝑢𝑒 𝑜𝑓 𝑖𝑛𝑑𝑖𝑐𝑎𝑡𝑜𝑟 2 2 3. The Component wise Aggregate Index for component k is, 𝐷𝑘 = 1 3 ∑ 𝐷𝑘𝑗 𝑗 Each tier gets equal weight in the aggregate component index. Adjustments in the formula are made in the component index for three States which do not follow the three-tier structure. Jammu & Kashmir has only gram panchayats, hence the GP component index and the component wise aggregate index is the same for the State. Manipur and Sikkim have only two tiers; they do not have block panchayats. Thus for these two States, the component index for component k is, 𝐷𝑘 = 1 2 ∑ 𝐷𝑘𝑗 𝑗 4. The Tier wise Aggregate index for tier j can be denoted as, 𝐼𝑗 = 1 3 ∑ 𝐷𝑘𝑗 𝑘 Thus, each component k has equal weight in the tier-wise Devolution Index 5. The Composite Devolution Index for all three tiers is, 1 𝐼 = ∑ 𝐼𝑗 3 𝑗 Adjustments in the formula are made for States that do not follow the three tier system. The construction of the Index as outlined above is pictorially depicted in Figure 2.3 given below 54 2015 How Effective is Devolution Across Indian States Figure 2-3: Pictorial depiction of construction of the Index 55 2015 How Effective is Devolution Across Indian States 2.6. Aggregate Ranking of States in Devolution of Powers and Responsibility to Panchayats 2.6.1. Index of Devolution in Policy As mentioned earlier, the index of devolution in policy uses data collected from the State level departments of Panchayati Raj. The indicators used reflect the state governments’ policy commitment to devolve responsibilities and resources to the panchayats. Thus the indicators include the functions, functionaries and finances officially allocated to the panchayats and the infrastructure and governance structures created for the smooth functioning of Panchayat operations. According to the composite index (see Table 2.3) constructed, Kerala, Karnataka, Maharashtra, Sikkim and West Bengal are the better performers. Arunachal Pradesh, Jammu and Kashmir, Bihar, Assam and Uttarakhand are the poorer performing States. An examination of the component indices show that the low performance states perform poorly in many of the four dimensions. However there are variations in performance across the better performing States. The better performing states in terms of devolution of functions are Kerala, Sikkim and West Bengal. In transfer of functionaries the better performers are Kerala, Maharashtra and Manipur. In finances Karnataka, Madhya Pradesh and Kerala are among the lead performers. In terms of infrastructure, governance and transparency, Kerala ranks 1st, West Bengal 2nd, Maharashtra 3rd and Sikkim 4th. The Panchayat administrative systems (buildings, staff, systems of record keeping, accounting and dissemination of information) are already established and institutionalized in these States and this is reflected in the index. The difference in ranking of Andhra Pradesh and Telangana needs special mention. In the component ‘functions’, the ranks of Andhra Pradesh and Telangana are identical. In the component ‘functionaries’ the rank of Telangana falls below that of Andhra Pradesh, because the proportion of the technoprofessional functionaries reported is lower. The functionaries reported per thousand population is also much smaller. This might reflect an issue of regional imbalance in erstwhile undivided Andhra Pradesh. On the other hand the percentage of panchayats reported as audited is very high in Telangana compared to Andhra Pradesh. This gets reflected in the component index of finances even though the per capita share of NFC and SFC are the same for both the States for the years 2011-12 and 2012-13. There is moderate positive correlation between the functions index and the other component indices (see Table 2.4). Similarly functionaries have a moderate correlation with functions and finances. This implies that in general, States performing well in one of the components also perform well in the other. There is a weak negative correlation between functionaries and IGT. This indicates that panchayats with lesser number of administrative personnel could leverage modern governance systems for their service delivery to a limited extent. 56 2015 How Effective is Devolution Across Indian States 2.6.2. Index of devolution in practice The index of devolution in practice (DPr) allows us to analyse the actual devolution happening in the field and validate the data obtained from the State government. The indicators chosen also reflected on actual control of panchayats over transferred institutions, functions, functionaries, financial autonomy and utilization of development funds and the status of infrastructure and administrative systems in place. However, it is pointed out at the very outset that the sample of panchayats selected for field verification was small. Some States such as Assam, Uttarakhand, Tripura, Himachal Pradesh, Gujarat and Haryana which have performed poorly or moderately poor in the index of devolution in policy (DPo) have improved their performance in the index of devolution in practice (DPr). Table 2.5 provides the ranking of States by the index of development in practice. Kerala stands out as the top performing State even in this index. Though there are differences in the ranks, a comparison of the relative position of States in the two indices show broad concordance, that is, most states performing well in the index of devolution in policy (DPo) also perform well in the index of devolution in Practice (DPr) and vice versa. Thus our selection of indicators and the data collected from States reflect the actual status of devolution in the field. However, some States such as Assam, Uttarakhand, Tripura, Himachal Pradesh, Gujarat and Haryana which have performed poorly or moderately poor in the index of devolution in policy (DPo) have improved their performance in the index of devolution in practice (DPr). (See figure 2.4). Figure 2-4: Scatter Policy against Practice 57 2015 How Effective is Devolution Across Indian States Further Assam, Uttarakhand and Tripura had been the states which were unable to furnish state level data as could be seen from the discussions in Chapter 1 on data gaps. At the other extreme, some moderate to good performing states in the DPo, such as Telangana, Punjab, Andhra Pradesh, Rajasthan, Tamilnadu and Manipur, show moderate to poor performance in the DPr index. There is a fall in the DPr rankings of these States in some of the components. This might reflect actual problems of panchayat administration in these States. The difference in DPr ranking of Andhra Pradesh and Telangana needs mentioning. As per the report of the field teams, the accountability system in Telangana seems to be much better than those in Andhra Pradesh. This is the predominant factor which has contributed to the improved ranking of Telangana in comparison with Andhra Pradesh. 2.6.3. Comparison of rankings across tiers Table 2.6 shows the ranking of states in the tier-wise DPo index. The district and the gram panchayats are the most important tiers in Panchayat administration. The last column of the table shows the difference in ranks between the DP and GP in each state. A negative difference implies that the state has performed relatively better in devolution to the DP compared to devolution to the GP. A positive difference implies the opposite. Kerala ranks top in devolution to the GP level, followed by Maharashtra, Sikkim, Karnataka and Tamilnadu. At the DP level Kerala ranks at the top with Sikkim, Karnataka, West Bengal and Maharashtra. Rank differences are large in Punjab, Bihar and Andhra Pradesh where devolution to GP is much behind the State’s performance at the DP level. At the other end are Chhattisgarh, Tamilnadu and Jharkhand, where the GP was seen to perform better than the DP In most other States the rank difference between the DP and GP is less than 4 The pattern of variations in the DPr index is shown in Table 2.7. The variation in Andhra Pradesh, Haryana, Telangana, Karnataka, Himachal Pradesh, Rajasthan, Tripura and Tamil Nadu is similar to that in the DPo index. The variations are smaller in the DPr index. In several cases like Uttarakhand, Assam, Gujarat, Jharkhand, Chhattisgarh, Punjab etc., the direction of rank differences in DPr are not similar to that reflected in DPo. The direction of ranks’ reversal are different thus in Punjab which has high negative rank difference in DPo, the rank difference being positive in DPr. In the case of Uttarakhand, Gujarat, Jharkhand which exhibit positive rank differences in DPo, the pattern is reversed in DPr. On the other hand, in the case of Chhattisgarh, with a strong positive rank difference in DPo, the direction gets reversed and it becomes a minor negative rank change in DPr. 58 2015 How Effective is Devolution Across Indian States 2.6.4. Index of Devolution in Policy adjusted against Practice The aggregate index of devolution in policy adjusted against practice (DPa) in Table 2.8, takes into account not only the achievements of each State on functions, functionaries, finances and IGT as reproduced in the State datasets, but also how these achievements are actually reflected in sample PRIs in the field by fine tuning the value of each dimensions in policy with its equivalent in practice. The dimensions of the adjusted index are computed by taking the arithmetic mean of the respective indices of the devolution in policy and the devolution in practice. In the adjusted index also Kerala remains at the top. Sikkim is ranked second followed by Karnataka, Maharashtra and West Bengal. At the other extreme Jammu and Kashmir is at the bottom with Arunachal Pradesh, Bihar, Jharkhand and Uttar Pradesh being the poor performers in order. The States which improve their performance in the adjusted index in comparison with the policy index are Assam, Uttarakhand, Tripura, Himachal Pradesh, Gujarat and Chhattisgarh. The States which lose out on their performance in the adjusted index in comparison with Policy index are Manipur, Andhra Pradesh, Punjab, Telangana, Tamilnadu, Odisha and Madhya Pradesh. The variations across the three indices are diagrammatically represented in Figure 2.5. 59 2015 How Effective is Devolution Across Indian States 0 1. Kerala 5 2 2 3. Karnataka 2 25 30 3 3 3 4 4 5 5 6. Himachal Pradesh 5 8 10 6 7 7 7. Rajasthan 14 6 15 8 8 9. Madhya Pradesh Dpo 9 9 9 10. Odisha 12 11 12. Tripura Dpa 13 17 7 12 22 6 13 14. Gujarat 16 11 14 13 15. Telangana 16. Uttarakhand DPr 12 10 11. Chattisgarh 13. Assam 20 4 5. West Bengal 8. TamilNadu 15 1 1 1 2. Sikkim 4. Maharashtra 10 21 10 16 17. Haryana 16 20 17 14 18. Andhra Pradesh 20 18 15 19. Punjab 20. Manipur 17 15 19 19 11 23 20 18 18 21. Uttar Pradesh 21 19 22. Jharkhand 23. Bihar 21 22 22 23 23 24. Arunachal Pradesh 24 24 25. Jammu and Kashmir 24 Figure 2-5: Variation in Ranks of States in DPo, DPr and DPa 60 25 25 25 2015 How Effective is Devolution Across Indian States 2.7. The effectiveness of devolution is critically dependent on the operative core of decentralisation viz. effective transfer of functions based on the principle of subsidiarity, unambiguous control of the panchayat over the functionaries discharging the functions and financial authorisation of the panchayat commensurate to the functional responsibilities it should discharge Conclusion Through this extensive study, three composite indices have been constructed to assess the status of effective devolution of powers and responsibilities to panchayats. The index of devolution in policy (DPo) captured the policy intension of state governments, while the index of devolution in practice (DPr) captured the field reality in a small sample of PRIs. The sample was not representative for the States as a whole. However the index is much richer and captures more nuances in the devolution of functions, functionaries and finances, which the index of devolution in policy could not capture because of limitations in data sets. The index of devolution in policy adjusted against practice (DPa) is the index of devolution in policy fine-tuned by the variations in practice. The State of Kerala is the top performer in all the indices. Sikkim, Karnataka, Maharashtra and West Bengal are also among the better performing States according to the indices. Jammu & Kashmir, Arunachal Pradesh, Bihar, Jharkhand and Uttar Pradesh are among the poorer performers in the various indices. There was strong association in the ranking of States by DPo, DPr and DPa. The four components in the composite index, as discussed before, were devolution of functions functionaries, finances, and IGT. According to DPo, the best performers in the various component indices were Kerala, Karnataka and Sikkim respectively. The effectiveness of devolution is critically dependent on the operative core of decentralisation viz. effective transfer of functions based on the principle of subsidiarity, unambiguous control of the panchayat over the functionaries discharging the functions and financial authorisation of the panchayat commensurate to the functional responsibilities it should discharge. Strengthening of Infrastructure, improving governance systems and transparency and capacity building can also contribute to improving performance of PRIs but in the absence of devolved powers their impact is going to be limited. The indices developed above have captured the medium to long-term trends in devolution across states. Incremental indices for analysing short-term progress in states are also important; however this requires comparable data on immediate interventions and their impacts in the shorter term. 61 2015 How Effective is Devolution Across Indian States 2.8. Tables Table 2-3: Ranking of States in the component and aggregate indices of Devolution in Policy State Functions Functionaries Finances Aggregate DPo IGT Kerala 1 1 3 1 1 Karnataka 8 12 1 8 2 Maharashtra 5 2 8 3 3 Sikkim 2 11 4 4 4 West Bengal 3 22 10 2 5 Tamil Nadu 6 7 7 13 6 Rajasthan 7 4 16 9 7 Madhya Pradesh 23 6 2 19 8 Odisha 11 15 9 17 9 Himachal Pradesh 22 5 15 6 10 Manipur 25 3 5 22 11 Chhattisgarh 4 16 22 15 12 Telangana 9 24 12 11 13 Andhra Pradesh 9 17 24 10 14 Punjab 17 14 14 12 15 Gujarat 18 19 11 18 16 Tripura 21 20 17 7 17 Uttar Pradesh 16 13 21 16 18 Jharkhand 20 23 6 20 19 Haryana 24 21 13 14 20 Uttarakhand 15 10 20 21 21 Assam 19 25 18 5 22 Bihar 12 8 25 23 23 Jammu and Kashmir 13 18 19 24 24 Arunachal Pradesh 14 9 23 25 25 62 2015 How Effective is Devolution Across Indian States Table 2-4: Rank Correlation Coefficient components and Aggregate Indices Component Functions Functionary Finances Functions 1 Functionary 0.4093 1 Finances 0.3592 0.2826 1 IGT 0.4664 -0.0001 0.3205 1 Aggregate Dpo 0.8200 0.5351 0.6904 0.7102 63 IGT Aggregate DPo 1 2015 How Effective is Devolution Across Indian States Table 2-5: Ranking of States in the component and aggregate indices of Devolution in Practice State Functions Functionaries Finances IGT Aggregate DPr Kerala 1 1 1 1 1 Sikkim 3 2 13 3 2 Karnataka 2 6 11 6 3 Maharashtra 11 4 2 8 4 Himachal Pradesh 14 9 3 4 5 Assam 10 3 10 13 6 Tripura 9 5 4 12 7 West Bengal 5 22 21 2 8 Madhya Pradesh 6 18 6 7 9 Uttarakhand 4 8 17 16 10 Gujarat 8 14 15 15 11 Odisha 19 12 12 9 12 Chhattisgarh 7 21 18 10 13 Rajasthan 21 7 23 11 14 Tamil Nadu 20 17 5 14 15 Haryana 18 25 9 5 16 Telangana 13 16 16 18 17 Uttar Pradesh 17 23 8 17 18 Punjab 16 13 20 19 19 Andhra Pradesh 12 19 14 20 20 Jharkhand 23 15 22 22 21 Bihar 22 24 19 21 22 Manipur 15 11 25 23 23 Arunachal Pradesh 24 10 7 24 24 Jammu and Kashmir 24 20 24 25 25 64 2015 How Effective is Devolution Across Indian States Table 2-6: Ranking of States in tier-wise DPo index Rank Difference Rank in Aggregate DPo Index State DP BP GP Overall DP-GP Punjab 6 13 23 15 -17 Bihar 15 17 25 23 -10 Andhra Pradesh 9 14 17 14 -8 Manipur 7 NA 13 11 -6 Uttar Pradesh 16 11 22 18 -6 West Bengal 4 6 7 5 -3 Telangana 12 12 14 13 -2 Haryana 19 18 20 20 -1 Karnataka 3 2 4 2 -1 Sikkim 2 NA 3 4 -1 Arunachal Pradesh 24 22 24 25 0 Kerala 1 1 1 1 0 Odisha 10 10 10 9 0 Assam 20 20 18 22 2 Himachal Pradesh 13 9 11 10 2 Madhya Pradesh 11 8 9 8 2 Rajasthan 8 5 6 7 2 Tripura 17 19 15 17 2 Maharashtra 5 3 2 3 3 Uttarakhand 22 16 19 21 3 Gujarat 18 21 12 16 6 Jharkhand 23 15 16 19 7 Tamil Nadu 14 4 5 6 9 Chhattisgarh 21 7 8 12 13 Jammu and Kashmir NA NA 21 24 NA 65 2015 How Effective is Devolution Across Indian States Table 2-7: Ranking of States in tier-wise DPr index Rank in Aggregate DPr Index State Rank Difference DP BP GP Overall DP-GP Andhra Pradesh 15 19 19 20 -5 Haryana 13 9 18 16 -3 Telangana 14 16 20 17 -3 Uttarakhand 7 14 9 10 -3 Assam 4 6 14 6 -2 Gujarat 9 12 13 11 -2 Jharkhand 19 22 22 21 -2 Arunachal Pradesh 23 20 24 24 -1 Chhattisgarh 12 10 15 13 -1 Karnataka 2 2 11 3 -1 Uttar Pradesh 17 18 16 18 -1 Bihar 22 21 23 22 0 Kerala 1 1 1 1 0 West Bengal 8 5 12 8 0 Himachal Pradesh 6 7 5 5 1 Maharashtra 5 3 4 4 1 Manipur 24 NA 21 23 1 Sikkim 3 NA 2 2 1 Madhya Pradesh 11 8 6 9 2 Punjab 21 17 17 19 2 Rajasthan 16 13 10 14 2 Tripura 10 4 7 7 3 Tamil Nadu 20 15 3 15 5 Odisha 18 11 8 12 6 Jammu and Kashmir NA NA 25 25 NA 66 2015 How Effective is Devolution Across Indian States Table 2-8: Ranking of States in the Aggregate Index of Policy adjusted against Practice State Policy Index DPo Rank Practice Index DPr Rank Adjuste d Index Rank Change in Rank Kerala 0.75 1 0.79 1 0.77 1 0 Karnataka 0.58 2 0.52 3 0.55 3 1 Maharashtra 0.57 3 0.49 4 0.53 4 1 Sikkim 0.57 4 0.55 2 0.56 2 -2 West Bengal 0.49 5 0.44 8 0.46 5 0 Tamil Nadu 0.48 6 0.37 15 0.43 8 2 Rajasthan 0.47 7 0.38 14 0.43 7 0 Madhya Pradesh 0.42 8 0.43 9 0.42 9 1 Odisha 0.41 9 0.39 12 0.40 10 1 Himachal Pradesh 0.41 10 0.45 5 0.43 6 -4 Manipur 0.40 11 0.25 23 0.33 20 9 Chhattisgarh 0.40 12 0.39 13 0.39 11 -1 Telangana 0.37 13 0.34 17 0.36 15 2 Andhra Pradesh 0.36 14 0.30 20 0.33 18 4 Punjab 0.35 15 0.30 19 0.33 19 4 Gujarat 0.34 16 0.40 11 0.37 14 -2 Tripura 0.34 17 0.44 7 0.39 12 -5 Uttar Pradesh 0.33 18 0.32 18 0.33 21 3 Jharkhand 0.32 19 0.27 21 0.29 22 3 Haryana 0.31 20 0.37 16 0.34 17 -3 Uttarakhand 0.30 21 0.42 10 0.36 16 -5 Assam 0.29 22 0.45 6 0.37 13 -9 Bihar 0.29 23 0.26 22 0.27 23 0 Jammu and Kashmir 0.22 24 0.18 25 0.20 25 1 Arunachal Pradesh 0.19 25 0.24 24 0.22 24 -1 67


© Copyright 2026