
an investigation of school administrator personality type and gender
37?
M8fJ
Aio.
AN INVESTIGATION OF SCHOOL ADMINISTRATOR PERSONALITY
TYPE AND GENDER TO LEADER EFFECTIVENESS,
FLEXIBILITY, AND YEARS OF EXPERIENCE
DISSERTATION
Presented to the Graduate Council of the
University of North Texas in Partial
Fulfillment of the Requirements
For the Degree of
DOCTOR OF PHILOSOPHY
By
Linda K. Anderson, B.S., M.Ed.
Denton, Texas
August, 1995
Anderson, Linda K., An investigation of school administrator
personality type and gender to leader effectiveness, flexibility, and years of
experience. Doctor of Philosophy (Applied Technology, Training and
Development), August, 1995, 87 pp., 15 tables, references, 40 titles.
The purpose of this study was to determine if there was a relationship
between four selected personality categories as measured by Myers-Briggs
Type Indicator® (MBTI) and gender to leader effectiveness and flexibility as
measured by Leader Behavior Analysis II Self-A® (LBAII Self-A) and years of
experience in school administration. A review of literature traced leadership
to the Situational Leadership II model utilized in this study. The model was
based on selecting the appropriate leadership style for the individual situation
and development level of followers.
MBTI® measured sixteen combinations of four personality types which
included Extravert® or Introvert, Sensing or iNtuitive®, Thinking or
Feeling, and Judging or Perceiving. Four types were selected for this study
(ISTJ, ESTJ, INTP, and ESFJ). The LBAII Self-A® instrument measured leader
effectiveness and flexibility.
The sample was 80 Texas school administrators in eleven school
districts. Statistics utilized to test the hypotheses included Hotelling's T 2 ,
Multiple Analysis of Variance, Analysis of Variance, and Multiple
Regression.
Independent variables were gender and personality type. Dependent
variables were leader effectiveness, flexibility, and years of experience in
school administration.
Findings reported a significant difference in leader effectiveness scores
of the ESTJ personality type. Additionally, Judging/Perceiving was a
significant predictor of years of experience of school administrators.
In conclusion, a significant difference was found in leader effectiveness
scores which showed that ESTJ personality types had higher scores. Another
significant finding was Judging/ Perceiving as a predictor of years of
administrative experience. As years of experience increased, Judging
(preference for order) increased as a personality variable rather than
Perceiving (preference for spontaneity).
It was recommended that MBTI® and LBAII® be administered to
school administrators as part of pre-service leadership training and for ongoing staff development. These instruments can be utilized as tools to help
administrators understand personality type and effective leadership practices.
TABLE OF CONTENTS
Page
LIST OF TABLES
vi
Chapter
I. INTRODUCTION
1
Background Information
Statement of the Problem
Purpose of the Study
Hypotheses
Significance of Study
Definition of Terms
Limitations
Delimitations
1
3
3
4
4
5
8
8
II. REVIEW OF LITERATURE
10
Introduction to Literature Review
Definitions of Leadership
Stages in the Development of Leadership
Theories Influencing Situational Leadership
Explanation of Leader Behavior Analysis II (LBAII®)
Situational Leadership® II Premises
Leadership Styles
Development Level
Explanation of Myers-Briggs Type Indicator (MB11®)
Explanation of Personality Type Preferences
Previous Research Utilizing LBAII® and MBTI®
m
10
10
13
15
18
20
20
21
22
23
26
Chapter
Page
HI. METHODS AND PROCEDURES
Subjects
Sample Size Determination
Instrumentation
Formulas for Determining Scores
Validity
LBAII® Self-A
MBTI®
Reliability
LBAII® Self-A
MBTI®
Research Design
Independent and Dependent Variables
Research Questions
Analysis
Hotelling's T 2
MANOVA
Multiple Regression
Computer Program
IV. FINDINGS
32
32
32
35
36
39
39
41
43
44
45
47
47
47
48
48
49
49
52
54
Introductory Statement
Descriptive Results
Mean Gender Differences in Effectiveness, Flexibility,
and Years of Experience
Hotelling's T 2 Results
Mean Difference Between Myers-Briggs Personality Type
and LBAII Effectiveness Scores, Flexibility Scores, and
Years of Experience in School Administration
MANOVA Results
MANOVA Simple Effects Tests
Relationship Between Myers-Briggs Subscales in Predicting
LBAII Effectiveness Scores
Multiple Regression Results
Relationship Between Myers-Briggs Subscales in Predicting
LBAII Flexibility Scores
Relationship Between Myers-Briggs Subscales in Predicting
Years of Experience of School Administrators
Summary
IV
54
54
55
55
56
56
57
60
61
61
62
63
Chapter
V. CONCLUSIONS AND RECOMMENDATIONS
Introduction
Purpose for the Study
Literature Review
Methods and Procedures
Findings
Conclusions
Recommendations
Page
65
65
65
66
68
68
69
70
APPENDIX A - LETTERS OF PERMISSION
72
APPENDIX B-HUMAN SUBJECTS FORM
81
APPENDIX C - SAMPLE INSTRUMENT DEMOGRAPHICS
83
APPENDIX D - COMPUTER PROGRAM
85
REFERENCES
88
LIST OF TABLES
Tables
Page
1.
Means and Standard Deviations (n=80)
51
2.
Hotelling's T 2
52
3.
MANOVA
53
4.
Analysis of Variance on Effectiveness Scores
54
4a. Post Hoc Analysis of Effectiveness Scores
55
5.
55
Analysis of Variance on Flexibility Scores
5a. Post Hoc Analysis of Flexibility Scores
6.
Analysis of Variance on Years of Experience as
School Administrator
6a. Post Hoc Analysis of Years of Experience as
School Administrator
7.
56
57
Correlation of Effectiveness with Myers-Briggs
Subscales
57
7a. Multiple Regression on Effectiveness
8.
56
58
Correlation of Flexibility with Myers-Briggs
Subscales
58
8a. Multiple Regression on Flexibility
Correlation of Years of School Administration
Experience with Myers-Briggs Subscales
9a. Multiple Regression on Years of Experience as
School Administrator
59
9.
vi
59
60
CHAPTER I
INTRODUCTION TO THE STUDY
Background Information
Most people have a definite idea of characteristics which they feel
leaders possess. However, the dynamic technological society in which we live
has expectations of leaders which fit with a mindset of change rather than
maintaining the traditional status quo which was at one time accepted.
No longer is the educational community operating in a vacuum of its
own, but instead has joined forces with business and industry to provide the
type of education and training that young people need for jobs of today and
tomorrow. This major shift in philosophy from traditional schools that we
have known to dynamic, risk-taking organizations requires a new kind of
leader. This new leader embraces change and is skilled at developing
partnerships with business and industry to provide school-to-work programs
and non-traditional methods of delivering instruction to students in ways
that are relevant and applicable to the workplace. The new educational leader
places an emphasis on technology across the disciplines and is open to flexible
scheduling of the school day and the school year to accommodate the
curricular needs of a changing instructional program. This changing school
atmosphere must have a visionary at the helm who can readily adapt to
change and the increasing societal pressures for schools to take responsibility
for the overall well-being of students.
This concern for the well-being of students does not stop at the gates of the
school house but requires that educational leaders take full responsibility for the
welfare of students even into the workplace before and after graduation.
National attention has been focusing on the need for major reform in
public education including the Secretary's Commission on Achieving Necessary
Skills (SCANS) reports of the United States Department of Labor in 1991 and
1992. SCANS is calling for a linkage of schools with the world of work creating
a climate of change which is sweeping our country's educational institutions.
Pursuant federal education legislation including the School-to-Work
Opportunities Act of 1994, the Goals 2000: Educate America Act of 1994, the
reauthorization of the Elementary and Secondary Education Act (ESEA) of 1994,
and the Carl D. Perkins Vocational and Applied Technology Act which is up for
reauthorization in 1995 calls for an actual restructuring of public education.
Therefore, it is fitting to take a close look at public school leadership and draw
some conclusions regarding individual personality types of public school
administrators and relationships of personality types to measured effectiveness
and flexibility as leaders.
The changing climate of education, coupled with the demand for
efficiency and effectiveness in schools, makes effective leadership critical. This
researcher's goal is to focus on leadership in education, and more specifically to
determine if there is a relationship between administrators' personality types
and gender and three leadership variables: effectiveness, flexibility, and years of
experience as a school administrator.
Statement of the Problem
Effective leadership draws upon the use of multiple skills. School
administrators who are aware of leadership strengths and needs are better able
to meet situational demands (Blanchard, et alv 1985). An understanding of
natural differences, as defined by personality type, can contribute to this selfawareness (Myers and McCaulley, 1993). Having this self-awareness can help
administrators understand leadership strengths associated with certain
personality traits and recognize blind spots which can inhibit success as a leader.
Purpose of the Study
The purpose of this study is to determine if there is a relationship
between four personality type categories as measured by Myers-Briggs Type
Indicator® and gender to leader effectiveness and flexibility as measured by
Leader Behavior Analysis II Self -A® and years of experience as a school
administrator.
Determining the relationship between personality types of school
administrators and leader effectiveness, flexibility and years of experience can
help clarify, for school administrators, the skills needing development to become
successful leaders. There are certain natural tendencies, personality traits, which
cause individuals to act in a given way (Myers and McCaulley, 1993). These
personality traits can translate into skills that bring forth effective leadership
strategies. According to Barr and Barr, "Genuine leadership is measured by
what the leader influences others to do. Leaders consistently influence people to
go beyond their perceived limits to give energies and talents to accomplish
organization or group goals" (Barr and Barr, 1994). Given the climate of change
in public schools, an investigation of personality type of school administrators
and its relationship to leader effectiveness, flexibility, and years of experience is
of interest. Information obtained from this investigation can assist
administrators in their development of continuous school improvement and
personal improvement of those who are in leadership positions, providing
vision for change.
Hypotheses
The following hypotheses are set forth to accomplish the purposes of this
study.
HOI: There is no significant mean gender difference in Leader Behavior
Analysis II (LBAII®) Effectiveness scores, LBAII® Flexibility scores, and years of
experience in school administration.
H02: There is no significant mean difference between the four categories
of Myers-Briggs personality type in LBAII® Effectiveness scores, LBAII®
Flexibility scores, and years of experience in school administration.
H03: There is no significant relationship between Myers-Briggs
subscales (EI, SN, TF, and JP) in predicting LBAII® Effectiveness scores.
H04: There is no significant relationship between Myers-Briggs
subscales (EI, SN, TF, and JP) in predicting LBAII® Flexibility scores.
H05: There is no significant relationship between Myers-Briggs
subscales (EI, SN, TF, and JP) in predicting years of experience of school
administrators.
Significance of Study
School districts have undergone major restructuring, which has included
downsizing central administration, with emphasis being placed on site-based
decision making. Administrators are feeling the pressures of campus and
district accountability related to standardized achievement test scores which are
indicators of student success. Restructuring efforts call for increased staff
development which will help administrators recognize personality types and
gain skills in responding appropriately to each given situation — a characteristic
of effectiveness as a leader (Zigarmi et al., 1991). This study recognizes the
importance of personality type and natural tendencies to act in a given way.
This study also recognizes that leadership skills can be developed which allow
an administrator to be flexible and act appropriately in each given situation
(Zigarmi et al v 1991). Through this action research, school administrators will
complete the Myers-Briggs Type Indicator® and the Leader Behavior Analysis
(LBAH®) instruments and receive feedback that will make them aware of
personality type and strengths related to leader effectiveness and leader
flexibility. Understanding normal developmental patterns and normal
differences can help administrators capitalize on strengths and leam to
recognize their blind spots so that appropriate adjustments can be made to
practice effective leadership (Good et al., 1992). Additionally, this research will
advance the theoretical knowledge of personality and its relationship to leader
effectiveness,flexibility,and years of experience in school administration.
Definition of Terms
The following list of definitions will clarify the meaning of terms as they
relate to the field of education and to this particular leadership study.
1. Blind Spots - Areas of preference which make up each individual's
personality that inhibit understanding of appropriate actions in given leadership
situations.
2. Development Level - Extent to which a person has the competence
and commitment to accomplish a task describes that person's development level.
The employee's development level determines how s/he responds to various
leader styles.
3. Directive - Leader behavior characterized by one-way communication
of telling followers what is to be done, as well as when and how tasks are to be
accomplished.
4. Extravert® - Personality preference identified by Myers-Briggs Type
Indicator (MBTI)® which identifies individuals who are outgoing, having a
focus on the outer world of people and things and counterpart to Introversion.
5. Feeling - Preference identified by the MBTI® for making decisions
based on values and person-centered reasons. Feeling is the counterpart to
Thinking.
6. Introvert - MBTI® personality preference which is the counterpart of
Extraversion®. Individuals with this preference prefer focusing on the inner
world of thoughts and ideas.
7. iNtuition® - MBTI® preference of individuals who focus on
possibilities and the future. iNtuition® is the counterpart to Sensing.
8. Judging - Individuals identified by the MBTI® who prefer an ordered
approach to life and having things settled. This preference is the counterpart to
Perceiving.
9. Leader Behavior Analysis II (LBAII®) - Instrument of twenty situations
designed to provide an individual with information about leader effectiveness,
leader flexibility, and leader style based on responses to the situations. LBAII®
is based on the Situational Leadership II Model.
10. Leader Effectiveness - Dimension of leadership measured by the
LBAII® that is based on the number of correct selections of leadership style for
each of twenty situations on the instrument.
11. Leader Flexibility - Dimension of leadership measured by the LBAII®
that is based on utilization of four different leadership styles depending on the
situation and the developmental level of the follower.
12. Leadership - Capacity of school administrators to demonstrate certain
effective behaviors of leadership style based on the situation.
13. Leader Style - Four dimensions that include: SI for directing; S2 for
coaching; S3 for supporting; and S4 for delegating.
14. Myers-Briggs Type Indicator (MBTI®) - Instrument which identifies a
combination of four preferences for interests, values, and skills that form up to
sixteen personality types based on these combinations. The four dimensions are
Extraversion® or Introversion, Sensing or iNtuition®, Thinking or Feeling, and
Judging or Perceiving.
15. Perceiving - Dimension of personality identified by the MBTI®
which characterizes an individual who likes to be flexible and have a
spontaneous approach to life keeping options open. This dimension is the
counterpart to Judging.
16. Personality Type - Personality type is identified by preferences for
certain values, attitudes, and skills which make up one combination of four
dimensions identified by the MBTI®. There are up to sixteen combinations of
the four dimensions which describe natural tendencies of individuals.
8
17. School Administrators - Campus level staff including principals and
assistant principals and central level staff including superintendents, associate
superintendents, directors, assistant directors, supervisors, and consultants.
18. Sensing - Dimension of personality preference measured by the
MBTI® whch describes people who focus on the present and concrete
information which is taken in by the five senses. The counterpart to this
preference is iNtuition®.
19. Situational Leadership® - Model of leadership developed through
extensive research which depicts the amount of directive behavior and the
amount of supportive behavior which a leader must utilize given the level of
follower readiness and the individual situation.
20. Supportive Behavior - Behavior characterized by a leader utilizing
two-way communication, socioemotional support, and acting as a facilitator to
accomplish organizational goals.
21. Thinking - Dimension of personality preference measured by the
MBTI® which describes a preference for decisions based on objectivity, logic,
and analysis of cause and effect. The counterpart to this preference is Feeling.
Limitations
One limitation applies to this study. The study is limited to campus and
central administrators in eleven North Central Texas school districts located in
Tarrant and Dallas counties.
Delimitations
The following delimitations apply to this study.
1. The dimensions of personality are delimited in terms of sixteen
combinations of four personality preferences as defined by the Myers-Briggs
Type Indicator®. However, this study requires a balanced design and will only
utilize four combinations in which most school administrators fall, according to
past research utilizing the MBTI®.
2. The dimensions of leadership are delimited to leader effectiveness and
flexibility as measured by the Leader Behavior Analysis II (LBAII® Self-A)
instrument.
CHAPTER II
REVIEW OF LITERATURE
Introduction to Literature Review
The literature on leadership is extensive dating back centuries.
However, for the purpose of this study, the review will include sections
which lead into the situational leadership® model which is utilized in this
study. The chapter includes sections on: definitions of leadership, stages in
the development of leadership, theories influencing situational leadership,
explanation of Leader Behavior Analysis II (LBAII®), situational leadership®
II premises, explanation of the Myers-Briggs Type Indicator (MBTI®),
explanation of personality type preferences, and previous research utilizing
LBAII® and MBTI®.
Definitions of Leadership
Leadership has been termed a "sophisticated concept" (Bass, 1990).
Leadership has had as many definitions as there are individuals who define it
(Bass, 1990). There are, however, similarities or certain strands which appear
through the definitions yielding a somewhat cohesiveness to the overall
concept. We look to leaders for vision, inspiration, guidance, protection, and
other indications of constancy or direction upon which we can depend.
"Leader" appeared in the English language as far back as 1300 A.D.
However, "leadership" did not appear until the first half of the nineteenth
century and was related to the British Parliament and the control its members
10
11
exerted over the country (Bass, 1990). Leader has been defined as a focus of
group change, activity, or process. Cooley defined leader as "the nucleus of
tendency" (Bass, 1990). Blackmon in 1911 saw leadership as the "centralization
of effort in one person as an expression of the power of all" (Bass, 1990). In 1936,
J. F. Brown wrote that "the leader may not be separated from the group, but
may be treated as a position of high potential in the field" (Bass, 1990).
The concept of personality was studied by some of the early theorists to
explain why some persons have better leadership skills than others. A.O.
Bowden in 1926 correlated leadership with strength of personality and the
amount of influence one person has over others (Bowden, 1926). In that same
year, L.L. Bernard theorized that, "Any person who is more than ordinarily
efficient in carrying psychosocial stimuli to others and is thus effective in
conditioning collected responses may be called a leader. The leader must
possess prestige and know what stimuli will condition adequate responses for
his purposes and develop a technique for presenting these stimuli" (Bass, 1990).
This research study is based on the personality aspect of individuals in
leadership positions. Along this line of thought, in 1927 Bingham defined a
leader as a person who possesses the greatest number of desirable traits of
personality and character (Bingham ,1927). In 1929, Tead regarded leadership as
a combination of traits that enables an individual to induce others to accomplish
a given task (Tead, 1935). Bogardus in 1934 defined leadership as "a personality
in action under group conditions ... it is a personality and a group phenomenon;
it is a social process involving a number of persons in mental contact in which
one person assumes dominance over others" (Bogardus, 1918). This definition
differed slightly from his earlier work which described a leader as one who sets
12
forth exceptional behavior patterns in such a way that other persons respond to
them (Bass, 1990).
The aforementioned theorists saw leadership as a one-way influence
effect. They noted that leaders possess different characteristics from followers
but did not account for the interactive characteristics of a leadership situation.
Some personality traits such as "social boldness" or one might say, being
an extrovert, often characterize a leader. Note, however, that this trait is not
necessarily a requirement of leadership (Bass, 1990). One who possesses this
trait may not necessarily be considered a leader.
Another important point is that leadership does not necessarily emerge
from a position which one holds. Position power is not a requirement of true
leadership. The status accorded an individual based on position may help in
getting a commitment to goals or in influencing others, but a leader may gain
commitment to goals and influence others if the person is held in high esteem by
the group. Esteem can be translated to personal power for the individual and
occurs as an individual earns the respect of the group.
While discussing the importance of esteem and personal power to a
leader, it is pertinent to briefly mention the concept of headship versus
leadership. Leadership can include headship or the two can be completely
differentiated. In 1960, Bass defined leadership broadly including the many
ways it is exerted by leaders and heads and the sources of power that make
leadership work (Bass, 1990). C.A. Gibb, in 1969, differentiated the two by
defining headship in terms of an organized system and not spontaneous
recognition by group members based on contribution to the group (Gibb, 1969).
In headship there is no sense of shared feeling or joint action in pursuit of a goal.
13
Also, in headship, there is a wide social gap between group members and the
head who strives to maintain social distance from the group. The leader's
authority is spontaneously accorded by fellow group members and particularly
by followers. Bass characterized heads as leading by the power of the position
they occupy or their status as mentioned earlier (Bass, 1990). The position of
this researcher is that leaders can be effective from status of the position held
and from esteem which is an earned respect based on value to the organization,
accomplishments, trust, and overall competence.
For the purpose of this study, leadership is defined as the capacity of
school administrators to demonstrate certain effective behaviors of leadership
based on a given situation which determines effectiveness of actions by
followers or the group. Determination will be made as to whether personality
type influences leader effectiveness and flexibility.
Stages in the Development of Leadership
There is no single understanding of the concept of leadership that is
universal in nature. Focusing on the evolution of leadership, four stages of
development surface which have been identified by J.M. Lipham (Griffiths,
1964). The four stages of development examine the concept of leadership as:
(1) examination of the "great men" approach; (2) examination of the traits and
characteristics of leaders; (3) examination of situational factors that affect
leaders; and (4) observation of behaviors of individuals. However, literature
does not as easily compartmentalize the stages. Rather, there is a definite
interrelatedness.
According to the "great men" approach, there are relevant traits and
characteristics reported. In looking at situational leadership, leader's behaviors
14
are observed and specific traits and attributes are studied (Burdin, 1989). G.
Barry Morris combines the "great men" and "observation of the behaviors of
leaders" as related stages because several leadership styles are identified
(Burdin, 1989). M. Weber describes differences among the legal, traditional, and
charismatic styles. R. J. Havighurst identifies three categories of great leaders:
(1) the prophet; (2) the scholar-scientist; and (3) the social engineer (Havighurst,
1945). A.W. Halpin categorizes the democratic and authoritarian leadership
styles (Halpin, 1956) Likert speaks of job-centered and employee-centered
styles.
(Likert, 1977).
The second leadership development stage is identifying traits and
characteristics of leaders. The stage is outlined by R. L. Abrell who identified
the most significant traits as (1) active participation; (2) creating a facilitating
climate; (3) providing inspiration; (4) providing justice and fairness; (5) resisting
unnecessary demands; (6) recognizing talent; and (7) practicing ethical integrity
(Abrell, 1979).
The third stage is an analysis of situational factors. There has been
extensive research by Paul Hersey and Ken Blanchard on situational leadership.
They contend that effective leadership is based on selecting the appropriate
leadership style for the individual situation and matching the development level
of followers. According to Saville, leadership is described as a process of
structuring, organizing, and guiding a situation so that all members of a group
can achieve common goals with maximum economy and minimum of time and
effort. Sergiovanni and Carver assess situational analysis as a process of
interaction between the leader and the group. Situational analysis supports the
15
premise that effective leadership requires utilizing different leadership
techniques based on the particular group (Burdin, 1989).
The fourth stage which recognizes behaviors of individuals is expanded
to include effective leadership for quality education. This stage stresses effective
leadership approaches of "information giving, communication, and interaction
among the members" which brings into play the importance of teamwork for
achieving educational goals. There is also a dimension of futures thinking
which helps leaders learn to be effective in a rapidly changing educational
climate (Burdin, 1989). This teamwork is critical considering the changes taking
place in education. Teamwork recognizes the strengths of individuals in the
organization and stresses effective problem solving and a shared vision for
success.
The third and fourth stages lead into the utilization of situational
leadership in an educational setting which provides the foundation for this
study. By determining the relationship between personality traits and leader
effectiveness, flexibility, and years of experience, there is a focus on the
development of situational leadership and on the natural tendencies for
behaviors of individuals based on their personality types.
Certain leadership theories have had a major impact on the work of
Hersey 's and Blanchard's situational leadership model upon which this research
study is based. The theories are presented as background information to help
develop an understanding of the roots of situational leadership.
Theories Influencing Situational Leadership
Leadership theories that most influenced the work of Kenneth Blanchard
and Paul Hersey and their Situational Leadership® model were studies by
16
Lewin, Lippitt, and White; Tannenbaum and Schmidt; Stogdill, Hemphill, and
Halpin; Blake and Mouton; Fiedler; and Reddin (Blanchard et al., 1993). A brief
discussion of each of these theories will follows:
Lewin, Lippett, and White studied the differences between the autocratic,
democratic, and laissez-faire forms of leadership (Lewin et al., 1960). From that
foundation Robert Tannenbaum and Warren Schmidt wrote about choosing
leadership styles through utilization of a continuum (Tannenbaum and Schmidt,
1958). The continuum approach was limited in that it characterized leadership as
autocratic, democratic (or somewhere in between), or laissez-faire (Blanchard et
al., 1993).
A two-dimensional model was developed by Ralph Stogdill and a group
that included John Hemphill and Andrew Halpin. This two-dimensional model
yielded four leadership styles by contrasting the dimensions and was more
complex than the single autocratic or democratic continuum (Blanchard et al.,
1993). Their theory showed two separate leadership behaviors, the "Initiating
Structure" and "Consideration" (Stogdill and Coons, 1957). Robert Blake and
Jane Mouton developed a "Managerial Grid" which changed "Initiating
Structure" and "Consideration" to "Concern for Production" and "Concern for
People" (Blake and Mouton, 1964). This model was developed into a
management training program (Blanchard et al., 1993). Ohio State University
held that Style 2 which was high on "Initiation Structure" and "Consideration"
was the optimum leadership style. Blake and Mouton in turn postulated that a
9-9 Style which was high "Concern for People" and high "Concern for
Production", called the "team" style was the best leadership style (Blanchard et
al., 1993).
17
Fred Fiedler who has been called the "Father of the Contingency Theory
of Leadership," theorized that there are three major situational variables that
determine if a situation is favorable to leaders: (1) "leader-member relations" personal relations with members of their group; (2) "task structure" - amount of
structure in the task assigned; and (3) "position power" - authority that a leader's
position provides (Fiedler, 1967). From the very definition of Fiedler's
situational variables, the "leader-member relations" are associated with the
relationship concepts presented in the previous theories. Also, "task structure"
and "position-power" are related to the task concepts mentioned in earlier
theories (Blanchard, 1993).
After Fiedler's situational approach, William Reddin developed a 3-D
Management Style Theory which was the first to add an effectiveness dimension
to the relationship and task dimensions. In addition, Reddin's work emphasized
that "there was no best leadership style" (Reddin, 1967). From this work,
Hersey and Blanchard created an initial Life Cycle model that emphasized
behavior instead of attitude and were responsible for taking the normative
labels off leadership (Blanchard et al., 1993).
Hersey and Blanchard were greatly influenced by Reddin's work. Their
Life Cycle model depicted a parallel between the changes of style necessary for
effective parenting and the stages of development through which an infant goes
to adulthood. They suggested that this same philosophy is needed for effective
leadership as a worker goes from new and inexperienced through the stages of
professional growth to becoming experienced in a position (Hersey and
Blanchard, 1969). Hersey and Blanchard first used the term "Situational
Leadership" to describe their model in the 1972 edition of Management of
18
Organizational Behavior (Blanchard et al., 1993). They developed the "TriDimensional Leader Effectiveness Model" with the influence of Reddin's work
and from the original Life Cycle model (Hersey and Blanchard, 1993).
From the work of Graeff and others, flaws were identified in the original
Hersey and Blanchard "LEAD" instrument (Graeff, 1983). Because of this
critique, changes were made to the original instrument. In 1982, Ken Blanchard,
Ron Hambleton, Drea Zigarmi, and Doug Forsyth developed the "Leader
Behavior Analysis" (LBA) which reflected changes to address learnings from
experience, research on individual and group development, and extensive
feedback from management clients at Blanchard Training and Development,
Incorporated (Blanchard et al., 1985). This revision of the LEAD instrument was
the result of work by Drs. Donald Carew and Eunice Parisi-Carew, Drs. Kenneth
Blanchard, Marjorie Blanchard, Frederick Finch, Lawrence Hawkins, Drea
Zigarmi, and Patricia Zigarmi. (Blanchard et al., 1993). Blanchard, Zigarmi and
Zigarmi explained Situational Leadership® II in 1985 in the book, Leadership
and the One Minute Manager, and the LBA was revised to create the LBAII
(Blanchard et al., 1993).
Explanation of Leader Behavior Analysis II (LBAII®)
LBAII® is based on the Situational Leadership® Model which is useful
for diagnosing demands of given leadership situations and evaluating the
amount of direction (directive behavior) and the amount of socioemotional
support (supportive behavior) necessary for a leader to provide based on the
given situation and level of development of the followers. Research over the
past several decades recognizes direction and support as two critical dimensions
of a leader's behavior. Theorists have labeled the dimensions with terms such as
19
autocratic, democratic, employee-oriented, and production-oriented. Directive
and supportive behaviors are styles of leadership that had to be one or the other
and could be represented linearly on a single continuum ranging from
authoritarian (directive behavior) to participative (supportive behavior).
Based on the research of Hersey, Blanchard, and others and extensive
leadership studies at Ohio State University, the assumption was questioned that
direction and support had to be either/ or, and leader effectiveness could instead
be measured by an appropriate style being utilized for a given situation and in
light of the development level of the follower or the group. The Ohio State
group observed behaviors of leaders in various situations with varying levels of
follower readiness and found that most of the activities of leaders could be
classified in to two dimensions, "initiating structure" (directive behavior) and
"consideration" (supportive behavior). Directive behavior is described as the
leader providing a top to bottom, or one-way, communication by explaining
exactly what the follower is to do and how to do it. Supportive behavior is
described as the leader engaging in two-way communication and providing
practical and socio-emotional support to the follower.
Although the LBAII® yields six scores, the two primary scores are the
Flexiblity Score and the Effectiveness Score. The Flexibility score is the
numerical indicator of how often a respondent uses a different style (SI, S2, S3,
S4) to solve each of twenty given situations on the LBAII-Self instrument. The
more often a respondent choses a single style, the less flexibility is evidenced.
The more evenly the spread of style choices, the higher the flexibility score
which means that more flexibility is exhibited. The Flexibility scores of zero to
thirty (0-30) can be subject to parametric statistics. The Effectiveness score is the
20
respondent's correct or appropriate usage of a chosen style given the situation
described. The Situational Leadership® Model advocates that there is one style
which is the preferred style in light of each given situation. A value is assigned
for excellent, good, fair, and poor answers. If the respondent choses all excellent
answers, the score is computed by multiplying four times twenty (4 x20)
questions to yield a perfect score of eighty (80). The Effectiveness score
demonstrates an individual's diagnostic skills of determining the appropriate
style given a particular situation. According to the Blanchard group, "The
Effectiveness score is the most important. The score's ranges from twenty to
eighty (20 to 80) can be subjected to parametrical statistical analysis" (Zigarmi et
al., 1992).
Four other dimensions, which denote style (SI, S2, S3, S4) are utilized to
show preference of behavior in a leadership role. There are also four follower
development levels (Dl, D2, D3, and D4) which denote the readiness and
development level of the followers. A discussion of the actual premises of the
Situational Leadership II model are included to provide a detailed explanation
of the dimensions measured by the model.
Situational Leadership® II Premises
Managers need to be concerned with both directive and supportive
behaviors. Therefore, "task and relationship behavior" were modified in
Situational Leadership® II to reflect both as important and necessary to one
another (Blanchard et al., 1993).
Leadership Styles
Style 1 is "Directing", which was renamed from "Telling" in the original
Situational Leadership model to emphasize one of the two behavior dimensions
21
mentioned previously. Style 2 was relabeled "Coaching" instead of "Selling"
because leaders use both suppportive and directive behaviors to develop
people's skills. "Coaching" implies what you do with people to develop them.
Style 3 was relabeled "Supporting" instead of "Participating" to again emphasize
one of the two leader behaviors. Style 4 has remained as "Delegating" which
involves low Supportive and low Directive behavior (Blanchard et al., 1993).
Development Level
Development Level refers to "the extent to which a person has mastered
the skills necessaiy for the task at hand and has developed a positive attitude
toward the task" (Blanchard et al., 1993). Development level determines how
employees respond to various leader styles. LBAII is based on the notion that
employee competence and confidence can be developed when the appropriate
leadership styles are used. According to the LBAII model, dimensions of
employee development are "Competence" and"Commitment." "Competence",
which is knowledge and skills, is development of ability in a job as a person
gains experience. "Commitment" is generally high initially, but employees can
become less committed in a new job if they begin to feel overwhelmed
(Blanchard et al., 1993).
Employee development levels are Dl, D2, D3, and D4. Development
level Dl is described as individuals being hired or promoted who are initially
low in competence but high in commitment because they are eager to learn.
Therefore, Dl describes individuals as high on "Commitment" and low in
"Competence." Development level D2 describes individuals who may be
discouraged because they are trying to learn quickly but have not reached the
level of competence they desire. Some "Competence" has been developed at this
22
level, but there is low "Commitment." Development level D3 is described as
high "Competence" but variable "Commitment". These employees appreciate
handling day to day decision-making but may still need managers to listen and
help with problem-solving by providing Style 3 supportive leadership
behaviors. Development level D4 is high "Competence" and high
"Commitment". This employee is described as fully developed and responds
well to a Style 4 leader style (Blanchard et al., 1993).
Explanation of Myers-Briggs Type Indicator (MBTI®)
The Myers-Briggs Type Indicator® measures sixteen combinations of four
preferences of interests, values, and skills which identify personaltiy types. The
sixteen types yield characteristics which vary among the population.
There are sensing types which experience the world and act based on
stimuli which are taken in through the senses in a concrete fashion. The
intuitive types, however, yield to intuition and focus on the future.
There are extraverts® and introverts. Extraverts® focus on the outer
world of people, and introverts focus on the inner world of ideas and
impressions.
There are thinking and feeling types. Thinkers base decisions on
objective reasoning, logic, and cause and effect; whereas those with a propensity
for feeling are person-centered and base decisions on values and subjective
evaluation.
There are those who prefer judging and those who prefer perceiving.
Those who prefer judging tend to prefer a planned and organized approach to
life. People who prefer perceiving like a flexible and spontaneous approach to
life, preferring to keep options open.
23
Explanation of Personality Type Preferences
The personality type preferences combine the eight dichotomous
variables which total sixteen combinations of the four dimensions measured by
the MBTI®. The four dichotomous variables which make up the sixteen
personality types are arranged as follows:
1. Extravert® or Introvert - Outer world versus inner world,
2. Sensing or iNtuition® - Present and concrete versus future
possibilities,
3. Thinking or Feeling - Objective logic versus subjective evaluation, and
4. Judging or Perceiving - Planned and organized versusflexibleand
spontaneous.
The preceding variables make up sixteen personality types. Each type
has its own interests, values, and skills. The sixteen types and a brief
explanation of each one are included to assist in understanding the dimensions
and how they are combined together into a personality type preference.
1. ISTJ - The ISTJ preference is a serious and quiet individual who
concentrates, is practical and well-organized, and uses his/her own head to
make decisions.
2. ISTP - The ISTP preference is quiet and reserved and interested in
cause and effect. One will notice an occasional glimmer of humor in this
individual. This person has a propensity for organizing facts logically and
enjoys learning how mechanical things operate.
3. ISFJ - This person is stable, quiet, and friendly. It is important to this
individual to meet any obligations made, therefore, s/he strives for accuracy
24
and is good with details. An ISFJ can be described as a loyal person who is
concerned with others feelings.
4. ISFP - This person is usually a loyal follower who does not care to have
a leadership role. His/her opinions are not forced on others, and s/he does not
like disagreements. The ISFP takes a laid back attitude about getting things
done for fear of spoiling the moment with undue worry about obligations.
5. ESTP - This person is very good at solving problems immediately. The
ESTP does not worry, rather chooses to enjoy things as they come. This person
likes sports, is conservative, but usually is adaptable as well. The ESTP likes
hands-on activities, things that need to be taken apart or put back together,
including mechanical things. The person with this personality preference
usually does not like to listen to long explanations about anything.
6. ESTJ - This person is practical and has a head for business. Usually the
ESTJ does not care to learn about things that s/he sees no use for, but can learn
if necessary. This person is an organizer who likes to be in charge. The ESTJ
can make a good administrator but needs to work at understanding others and
their feelings.
7. ESFP - The ESFP is easy to get along with, friendly, and fun to be
around. S/he remembers facts easier than theories and is good in situations that
require common sense and someone who is a people-person.
8. ESFJ - This person is cooperative and a perfect member of any
committee. S/he is talkative and has the ability to create harmony among
others. This person always does nice things for others and needs praise.
9. INFf - This person is one with perseverance and the drive to do
whatever is necessary. The INFJ preference individual is quiet and
25
conscientious and concerned for others. This person is one who is held in high
esteem for upholding principles and supporting the good of others.
10. INFP - This person has a lot of enthusiasm but only shares that with
those individuals s/he considers to know well. The INFP usually takes on too
many projects at one time but is able to see them through to completion.
Although the INFP is friendly, s/he is usually too busy for small talk. Physical
possessions are not coveted by the INFP preference individual.
11. INTJ - The INTJ has original ideas and the ability to carry out projects
which are important to him/her whether or not there is help for the project. The
INTJ can be described as critical, determined, and sometimes stubborn. It is
important for the INTJ to learn to compromise on issues which are not
important in order to gain acceptance for those issues which are of prime
importance.
12. INTP - This individual is quiet and reserved. S/he has an interest in
science and theories. The INTP does not enjoy small talk or parties but is mainly
interested in ideas. His/ her career area should be of strong interest to him/ her.
13. ENFP - The ENFP is a warm individual who has a creative
imagination. This person is a good problem-solver and is willing to help others.
The ENFP usually does not plan in advance but improvises to get things done.
14. ENFJ - The ENFJ is a responsible individual who cares about other
peoples' feelings. This individual is good at leading discussions, is sociable, and
is usually popular. The ENFJ responds equally well to praise and to criticism.
15. ENTP - The ENTP has a quick wit and is good at many different
things. This person can argue both sides of an issue. The ENTP is a good
problem-solver for challenging or difficult situations but may forget routine
26
matters. The person with this personality preference is an individual who goes
from one interest to another.
16. ENTJ - The ENTJ is a leader who is decisive and who is good at
public speaking. This individual is good in anything that requires utilization of
reintellectual abilities. ENTJ may act more skilled than s/ he actually is.
The characteristics provide an explanation to assist in understanding each
personality type and its relationship to leader effectiveness and flexibility. By
understanding the characteristics associated with each personality preference,
relationships are easier to visualize between personality type and leadership
dimensions.
The following section provides information about previous research
conducted utilizing the LBAII®. Also included is one study which utilized the
MBTI® to determine one dimension of leadership effectiveness for school
principals. In addition, the work of Barr and Barr, in their book Leadership
Development Maturity and Power, is addressed.
Previous Research Utilizing LBAII® and MBTI®
LBAII® studies have yielded no significant findings in regard to
demographic variables such as age, gender, and education in relationship to the
LBAII® scores. The authors suggest that researchers do more than pure
demographic studies if significant findings are sought. Thirty-two percent of all
studies done up to 1993 indicate that demographics have little correlation with
leadership style (Blanchard et al., 1993). From a total of fifty studies, sixteen are
classified demographic, and as one researcher stated,"... the findings ... provide
adequate evidence that demographic variables are not meaningful predictors of
leadership styles. Replications of similar research studies are not recommended
27
(Martin, 1990). However, Blanchard Training and Development, Incorporated,
considers gender differences worthy of study, and in granting permission to
utilize the LBAII Self-A instrument requested that gender differences in scores
be included in this research study (Zigarmi, et al, 1993). Additionally, a
previous educational study, "Lead Styles, Flexibility, and Effectiveness of Public
Secondary School Principals in Thailand" by Wisessang, noted that there were
no correlations between leadership styles, flexibility, and effectiveness and
demographics such as gender and years of experience (Zigarmi, et al, 1993).
Wisessang's study addressed the possibility that years of experience could
impact leadership effectiveness even though no significant correlation was
found. Therefore, in order to address possible demographic variables in this
study, a balanced design of males and females is utilized, and years of
experience is included as a dependent variable.
The main finding from the LBAII® research has to do with employee
satisfaction. A positive correlation between leader effectiveness and employee
satisfaction shows that development of effective leader behavior is worthwhile if
one believes that employee satisfaction results in higher productivity. Keep in
mind that a high effectiveness score on the LBAII® is determined by selection of
the appropriate leader style based on the development level of the followers.
Wilkinson compared high scoring and low scoring leaders on the
Effectiveness scores and found a positive relationship between high
Effectiveness scores and employee satisfaction with supervisors (t=3.18, p<.001),
satisfaction with administration and policies (t-2.09, p<.019), and total
satisfaction scores (t=1.78, p<.039). This study was conducted in a government
agency and had an N=116 (Wilkinson, 1990).
28
There were positive correlations found between high effectiveness scores
on the LBAll® Other and seven dimensions of employee perceived satisfaction
in a business setting. Positive correlations were found between LBAII®
Effectiveness and employee perceived satisfaction in a business setting.
Positive correlations were found between LBAII® Effectiveness and employee
perceptions of high performance (R=.24, pc.001, N=293), high productivity
(R=.25, p<.001, N=293), team effectiveness (R=.25, pc.001, N=293), inspiration
(R=.23, pc.001, N=295), alignment (R=.28, pc.001, N=292), commitment (R=.12,
pc.021, N=290), and feelings of empowerment (R=.34, pc.001, N=292). (StonerZemel, 1988).
In Blanchard studies of the LBAII® and a comparison of high
Effectiveness scores of managers and employee morale, the managers with high
Effectiveness scores had employees who had higher morale (F=4.29, pc.036,
N=552) and reported positive opportunities for growth within the organization
(F=4.87, pc.018, N=552). Also, if the manager had high Effectiveness scores, the
employees reported less tension in the organization (F=6.89, pc.001, N=552).
(Blanchard et al., 1993).
Another study which supports predictive validity for the LBA
Effectiveness score was found by Haley. He reported positive correlations
between the Effectiveness score and employees' perceptions of manager's overall
effectiveness (R=.40, pc.001, N=95) and work group effectiveness (R=.18, pc.05,
N=95) (Haley, 1983).
A nursing study was conducted by Duke who found positive correlations
between the Effectiveness score and the PKPCT Barrett Empowerment Scale.
Duke found positive correlations with the Effectiveness score and perceptions of
29
the freedom to act intentionally subscale (F=4.02, p<.01, N=324) and the
involvement in creating change subscale (F=4.68, p<.01, N=324) (Duke, 1988).
This study showed that managers who are seen by employees as matching
appropriate leadership style with development level were seen as empowering
(Blanchard et al., 1993).
Jacobsen found positive correlations with the Management Advancement
Quotient (MAQ) and the LBA Effectiveness score as rated by employees (R=.13,
pc.05, N=267) (Jacobsen, 1984). "Managers who have the skill to match
leadership style to development level tend to move up the corporate ladder
more quickly" (Blanchard et al., 1993).
The Blanchard group did an unpublished study in 1992 which compared
LBAII ® Self Effectiveness scores of high and low scoring managers to
employees' perceptions of climate and satisfaction (Zigarmi et al., 1993).
According to Blanchard, Zigarmi, and Nelson,... "the proof of Situational
Leadership II model may lie in a mosaic approach in which different pieces fit
together to display an understanding of what happens in the interplay between
employees and their managers. To reach that point, research needed includes
work on development level, standard instrumentation, and match studies"
(Blanchard et al., 1993).
Another study worth noting by Hambleton and Gumpert examined and
supported the validity of Hersey and Blanchard's Situational Leadership®
Model. Although no causal relationship was found, a significant relationship
was reported between the leadership style of a manager in particular situations
and managers' perceptions of subordinate job performance (Hambleton et al.,
1982).
30
A study which utilized the Myers-Briggs Type Indicator (MBTI)® and
the Principal Problem Strategy Questionnaire (PPSQ), administered the
instruments to 86 principals. The PPSQ presented twelve problem situations. It
was determined that personality type preference as measured by MBTI® is a
major determinant of leader behavior problem solving strategies utilized to
solve the PPSQ problem situations (Myers and McCaulley, 1993). The current
study addresses the possible relationship between personality type preferences
and gender to leader Effectiveness, Flexibility, and years of experience. The
study is intended to enhance school administrators' understandings of
personality type preferences, related strengths, and their relationship to effective
leader behaviors.
Barr and Barr utilized the Myers-Briggs personality preferences to explain
leadership development in what they identified as Stage IV Leadership which
they described as the only true leadership stage. Stage IV described a mature
leader who inspires and empowers others. According to Barr and Barr, "Leaders
create relationships of trustworthiness, integrity, maturity, and caring that
provide a cultural environment for growth and discovery" (Barr and Barr, 1994).
According to Barr and Barr, change is the redistribution of power. They add,
"Leadership through managing process and teamwork changes behaviors,
systems, structure and culture" (Barr and Barr, 1994). This type of leadership is
needed in school districts to respond to the public outcry for systemic change in
public schools. Because of current focus on leadership for change, this study of
relationships between personality preferences and leader effectiveness,
flexibility, and years of experience is especially timely.
31
A bridge was developed between the two models which were the basis
for this research study. Although there are some differences between the bridge
and this study, there are some similarities as well which are worth mentioning.
The differences between the bridge and this study have to do with a focus on
managers rather than school administrators which are the focus of this study.
The bridge includes the personality types of managers and their employees,
whereas this study focuses solely on personality types and gender of school
administrators in relationship to leader effectiveness, flexibility, and years of
experience. The bridge is a program developed by the Blanchard group which
facilitates learning of the leadership process. The program merges the work of
the Blanchard group and Carl Jung, Isabel Myers, and Katharine Briggs (Good et
al., 1992). The purpose of the bridge between these two models is to help
managers enhance their leadership abilities, communication skills, and team
development by understanding the relationship of their leadership styles and
personality type preferences to their employees' development levels and type
preferences (Good et al., 1992).
CHAPTER III
METHODS AND PROCEDURES
Subjects
The population for this study were school administrators in eleven
school districts located in North Central Texas, more specifically in Tarrant
and Dallas Counties. The Tarrant County school districts represented
included Azle, Birdville, Eagle Mountain Saginaw, Lake Worth, and
Mansfield. Dallas County districts included in this study were Duncanville,
Garland, Irving, Lewisville, Mesquite, and Piano. The population sampled
were certified and practicing Texas school administrators. Because the
administrators were certified and practicing Texas administrators, the
findings can be generalized to administrators in other Texas districts.
The respondents in this study completed a Human Subjects Form to
give permission for the results from their participation to be utilized in this
research study. This form is included in Appendix B.
Sample Size Determination
The eleven (11) school districts for the sample were randomly selected
from the Texas School Directory from thirty (30) total districts in Tarrant and
Dallas Counties. The sample was comprised of eighty (80) out of a total
population of 317 administrators who completed the LBAII® Self instrument
administered by this researcher. The respondents were also given the Myers-
32
33
Briggs Type Indicator® which was administered by counselors and school
psychologists. Respondents were given feedback concerning their scores and
the findings from both instruments. Therefore, they received training to help in
understanding their personality type preferences and their Effectiveness and
Flexibility as a leader. Respondents did not provide any personal information
other than school district, gender, and years of experience. Therefore, the
instruments were administered with full anonymity of the respondents. The
sample instrument which included the school district, categorized the
administrators according to gender, and provided years of school administrative
experience is included in Appendix C.
The overall test was made at the .05 level of significance, and a power of
.80 was desired. The formula utilized to determine sample size was as follows:
n
=
(a2/E)2
a
=
estimate of population's standard deviation
2
=
1.96, oc : .05
E
=
X vs (i
n
=
[(7*2)/2)]2
n
=
(7)2
n
=
49
where:
therefore:
As shown in the formula above, the sample size minimum was 49 in
order to achieve a power of .80 at the .05 level of significance. However, for the
purpose of this study it was critical to have a balanced design which called for
an equal number of subjects in each cell. The design utilized Analysis of
34
Variance (ANOVA) and a minimum of 10 subjects per cell was desired for a
total of 80 subjects. The balanced design is shown in the following Figure 3.1.
Figure 3.1 Balanced Design - Equal Cell Size
Mvers-Briggs Tvpe
Male
Gender
Female
Main Effects
MBl(ISTJ)
MB 2 (ESTJ)
MB 3 (INTP)
MB 4 (ESFJ)
10
10
10
10
X
Main
10
10
10
10
X
Effects
X
X
X
X
It was necessary to have an equal number of male and female subjects in
each of the personality type categories to achieve the required balanced design.
There are sixteen Myers-Briggs categories, however, this study limited the
categories to four because past research indicated that it was more likely for
school administrators to fall into the four categories above based on their
personality type preferences (Myers and McCaulley, 1993). In addition, the four
categories above included each of the dichotomous variables in at least one of
the personality type combinations. For example, E or I (Extravert® or Introvert),
includes E in two categories and I in two categories. In the dimensions of S or N
(Sensing or iNtuitive®), S is in three categories and N is in one category. In the
dimensions of T or F (Thinking or Feeling), T is in three categories and F is in
one category. The the J or P (Judging or Perceiving) dimension includes J in
three categories and P in one category. Based on job requirements of a school
administrator, these personality categories are reasonable representations of
individuals who serve in these positions. Previous studies have found the
following percentages of individuals to hold jobs as school administrators in
35
elementary and secondary school level positions or in overall district-wide
positions (Myers and McCaulley, 1993).
ISTJ
INTP -
-
28%
ESTJ -
22%
07%
ESFJ-
15%
The percentages account for 72% of elementary, secondary and unspecified
school administrators with the remaining 28% falling in the other twelve
personality types.
Instrumentation
Two instruments were utilized to gather data for this research. One was
the LBAII® Self-A which measured leader effectiveness, flexibility, and style
and the other was the Myers-Briggs Personality Type Indicator (MBTI)®.
Concerning the dimensions of the LBAII® Self-A, leader Effectiveness
was scored on a scale ranging from 20 to 80. There were 20 responses which
were scored four points for an excellent (E) response, three points for a good (G)
response, one point for a fair (F) response, and one point for a poor (P) response.
Flexibility was scored on a scale ranging from 0 to 30, depending on the
variety of leader styles selected for the twenty situations. A respondent who
utilized only one or two styles scored lower on Flexibility than a respondent
who utilized a variety of styles.
There are four variables related to leader style which are categories SI, S2,
S3, and S4. The premise of situational leadership is that an effective leader
selects the appropriate style depending on the development level of the group
or followers and the situation at hand. In order to obtain permission to utilize
the LBAII® Self-A for this research project, certain stipulations had to be met in
regard to providing descriptive data requested. The permission letters and
36
descriptive data results are presented in Appendix A. The descriptive data
required as a condition to utilizing the instrument were as follows:
1. Average Flexibility Score and Standard Deviation.
2. Average Effectiveness Score and Standard Deviation.
3. Average Style Score Means and Standard Deviations Styles 1
through S4.
4. Percent of Primary Styles 1 through S4.
5. Percent of Secondary Styles 1 through S4.
6. Percent of Developing Styles 1 through S4.
7. Maximum and Minimum Scores.
8. Average Flexibility Scores and Standard Deviation by Gender.
9. Average Effectiveness Scores and Standard Deviation by Gender.
10. Average Style Score Means and Standard Deviation by Gender.
The four personality dimensions measured by the MBTI® represented
dichotomous variables which relate to a case of either/ or. For instance, each
respondent had four preference scores for Introversion or Extroversion®,
Sensing or iNtuition®, Thinking or Feeling, and Judging or Perceiving. More
importantly, however, was the combining of the four personality dimensions to
form scores for sixteen personality preference types. This study utilized four of
the sixteen types.
Formulas for Determining Scores
The scores for both instruments were computed according to instructions
in the respective test manuals. For the LBAII® Self-A instructions were utilized
from Research on the LBAII® A Validity and Reliability Study by Zigarmi et al.
37
For the MBTI® the Manual: A Guide to the Development and Use of the MyersBriggs Type Indicator by Myers and McCaulley was utilized.
The formulas for the LBAII ® are as follows:
1. Compute Flexibility = 30 - (I SI - 51 + IS2 - 51 + I S3 - 51 + IS4 - 51)
2. Compute Effectiveness = [(P • 1) + (F • 1) + (G • 3) + (E • 4)]
3. Compute Primary Style = (Largest of SI, S2, S3, or S4)
4. Compute Secondary Style = (Second Largest of SI, S2, S3, or S4) > 4
5. Compute Developing Style(s) = (SI, S2, S3, and/ or S4) < 4
It is important to keep in mind that SI, S2, S3, and S4 stand for leadership
Styles 1,2,3, and 4 respectively. The styles explain methods of leadership
which are utilized including Style 1 which is a leader who exhibits high
direction and low support, Style 2 which is high direction and high support,
Style 3 which is low direction and high support, and Style 4 which is low
direction and low support. The scoring of Effectiveness is P-Poor, F-Fair, GGood, and E-Excellent which rate the responses to the twenty (20) items on the
LBAII® Self-A. Each item is given a weight of 1 to 4 based on the quality of
response to the item by selecting the appropriate leadership Style based on the
situation explained in the item. A poor (P) and fair (F) response were both
worth one point. The good response was worth 3 points and an excellent
response was worth 4 points. Therefore, the instrument yielded an Effectiveness
score of from 20 to 80 points.
The formulas for the Myers-Briggs scores indicate a conversion to
continuous scores. The preference score for each of the four dimensions consists
of a letter showing the direction of preference and a number showing the
reported strength of the preference. The greater number of points indicates the
38
direction of preference (for example E 17 and I 9 indicate an E preference;
however, E 9 and I 17 indicate an I preference). This scoring procedure works
very well when the Myers-Briggs preference scores are considered
independently of other measures. However, when Myers-Briggs is compared to
another instrument it is better to treat the dichotomous preference scores as if
they were continuous scales.
Preference scores can be calculated by formula. The formula is as follows:
1. For E, S, T, and J:
2 X (larger points minus smaller points) - 1
2. For I, N, F, and P:
2 X (larger points minus smaller points) + 1
3. For ties:
I 01, N 01, F 01, P 01
The following formulas were utilized to transform the Myers-Briggs
scores to continuous scores.
1. For E, S, T, and J preference scores the continuous score is 100 minus
the numerical preference score.
Example:
Preference scores
= (E 19, S 17, T 25, J12)
Continuous scores
= (100-19,100-17,100-25,100-12)
= (81,83,75,88)
2. For I, N, F, and P preference scores, the continuous score is 100
plus the numerical preference score.
Example:
Preference scores
= (119, N17, F 25, P12)
Continuous scores
= (100+19,100+17,100+25,
100+12)
= (119,117,125,112)
This study coded MBTI® preference scores as continuous scores in order to
make comparisons with the LBAII® Self-A scores.
39
Validity
Validity is a necessary component in the process of determining the
appropriate instrument(s) to achieve the purposes of the study. A valid
instrument is one that measures what it purports to measure. The instruments
utilized in this study demonstrated content, construct, and predictive validity.
Prior to the discussion of validity of the LBAII® Self-A, it is important to
note that validity and reliability studies were conducted on the LBAII® Self-A
and the LBAII®-Other instruments. The two instruments are the same length.
The only difference between the two instruments is in the wording of the
questions. The "Self" instrument rates oneself, for example, "You would....".
The "Other" rates the boss, for example, 'The leader would....". Therefore, the
validity and reliability results of the LBAII®-Other can be applied to the
LBAII®-Self as well. (Zigarmi et al., 1993).
LBAII® SELF-A
Content validity of LBAII® Self-A is based on the notion that important
content from the Situational Leadership®II Model has been adequately
translated into test items. (Zigarmi et al., 1993). Content validity is also
determined in the process of establishing construct validity.
The LBAII® Self-A instrument is designed to measure leadership. In
order to determine construct validity, subconstructs of leadership are defined as
Effectiveness, Flexibility, and Style (S1-S4). Another instrument, the Wilson
Multi-Level Management Survey (MLMS), was selected to help establish
validity of the LBAII® Self-A,. The Wilson MLMS is designed to measure 23
subconstructs of leadership behavior and has been subjected to intensive
construct validity procedures. (Zigarmi et al., 1993). The Leader Behavior
40
Description Questionnaire (LBDQ) instrument was also utilized to establish
content validity because the scores measure task and relationship behaviors
which relate to the directive and supportive behaviors on the LBAII® Self-A.
"The LBDQ has a long history of validity" (Zigarmi et al., 1993).
The LBAII® Self-A and MLMS subconstructs acted similarly, as if they
were measuring the same thing, which was the overall construct of leadership
(Zigarmi et al., 1993). The full model of the comparisons in scores noted a
significant relationship in comparing all six of the LBAII® Self-A scores to the
fifteen subscale variables measured by the scores on the MLMS instrument
(Zigarmi et al., 1993). The correlations ranged from r 2 = .36 to .52. The partial
model which breaks out the LBAII® Self-A leadership Style scores in utilizing
the Wilson's Managerial Task Cycle to predict Style, yielded correlations of r 2 =
.36 to .58 for Style 1 scores; r 2 = .12 to .20 for Style 2 scores; r 2 = .40 to .52 for
Style 3 scores; and r 2 = .37 to .50 for Style 4 scores.
The LBDQ scores and LBAII® Self-A scores were logically and
quantitatively related as well. Comparisons of the scores showed significance
and yielded correlations from r 2 = .02 to .26 (Zigarmi et al., 1993).
The predictive validity of the LBAII®-Self, in order to be of value in this
study, should utilize its scores to predict an administrator's future success or
behavior. Administrators who possess Leader Effectiveness should produce
more in the terms of output, should provide for greater employee satisfaction,
and should advance faster. In order to determine predictive validity, the
LBAII® Self-A Leader Effectiveness score and follower perception of
organizational climate using four of the Wilson MLMS subscales (building trust,
interest in subordinate growth, approachability, and team building) were
41
utilized. Once again, the scores were correlated between the two instruments.
The correlations ranged from r 2 = .15 to .18. It is worthy to note that present
scores were utilized for comparisons with the inference that this same
relationship might occur in future situations. (Zigarmi et al., 1993).
MBTI®
The MBTI® was designed to implement Carl Jung's theory of
psychological types. Therefore, its validity is based on its ability to demonstrate
relationships and outcomes predicted by the theory. (Myers and McCaulley,
1993). The theoiy suggests that persons are different personality types. The
MBTI® classifies persons according to their true types.
Content validity in the item selection is based on the empirical evidence
that the items separate persons with opposing preferences. Two assumptions
exist. One is that true personality preferences exist, and secondly, these
preferences are dichotomized with each pole of a preference being equally
valuable. The indicator was developed in a series of stages beginning in 1942
and continuing to publication of Form G in 1977.
Type distributions are the method for presenting MBTI data on groups.
The type tables provide evidence for construct validity.
MBTI® has also been correlated with other scales of personality, interest,
and academic tests. In comparing the MBTI preferences with the Adjective
Check List (ACL), by Gough and Heibrun in 1983, the significant positive
correlations of at least .20 included the following:
(1) Extravert correlated with self-confidence, dominance, lability,
affiliation, and autonomy.
(2) Introvert correlated with abasement and deference.
42
(3) Sensing correlated with self-control, endurance, order, and
deference.
(4) iNtuitive® correlated with self-confidence, autonomy, and
lability.
(5) Thinking correlated with achievement, dominance, endurance, order,
and autonomy.
(6) Feeling correlated with personal adjustment, intraception, affiliation,
abasement, and deference.
(7) Judging correlated with self-control, personal adjustment, endurance,
order, abasement, and deference.
(8) Perceiving correlated with lability and autonomy.
MBTI® continuous scores were also correlated with the California
Psychological Inventory (CPI) by Gough in 1975 (Myers and McCaulley 1993).
The reported findings show preferences with correlations of at least .20. These
results are as follows:
(1) Extravert correlated with dominance, capacity for status,
sociability, social presence, self-acceptance, sense of well-being, tolerance,
good impression, achievement, intellectual efficiency, social conformity,
and activity.
(2) There were no significant correlations reported for Introvert.
(3) Sensing correlated with communality.
(4) iNtuitive® correlated with capacity for status, sociability, social
presence, self-acceptance, achievement, intellectual efficiency,
psychological-mindedness, and flexibility.
(5) There were no significant correlations for Thinking.
43
(6) There were no significant correlations for Feeling.
(7) Judging correlated with responsibility, socialization, self-control,
good impression, communality, and achievement.
(8) Perceiving correlated with social presence and flexibility.
In order to strengthen the construct validity of the instrument, a study
was conducted by Rich in 1972 which used correlation between the MBTI® and
the Jungian Type Survey (JTS) (Myers and McCaulley, 1993). The correlations
between the two were Extravert (.68, p < .01, N=98); Introvert (.66, p < .01,
N=98); Sensing (.54, p < .01, N=98); iNtuitive® (.47, p < .01, N=98); Thinking
(.33, p < .01, N=98); and Feeling (.23, p < .05, N=98). Therefore, the two
instruments seem to be measuring the same constructs but are more consistent
with EI and SN than with TF (Myers and McCaulley, 1993).
Reliability
Establishing reliability of a test instrument helps to reduce the
measurement error. A reliable instrument will measure the same construct each
time it is administered or will measure what it is purported to measure and do
so consistently. Therefore, the results are stable over several administrations of
the same sample and over several samples of the population. A reliable
instrument reduces measurement error, and administration can be repeated
with consistent results.
Several methods were utilized to establish reliability on the two test
instruments utilized in this study. The test / retest method was utilized on both
the LBAII® Self-A and the MBTI®. The alternate form method and internal
consistency method was utilized on the LBAII® Self-A. The split-halves method
was utilized only on the MBTI® because the LBAII® Self-A was considered too
44
limited in the number of items and subconstructs to be measured for the internal
consistency method to be effective. Generally, the method(s) selected is
appropriate for the instrument in establishing reliability.
LBAll® SELF-A
The LBAII® Self-A was subjected to test/retest, in a 1986 study
conducted by Nye, as one way to determine reliability. There were ten days
between the two test administrations and yielded test/retest reliability of
r 2 = .72 for Leader Flexibility and .30 for Effectiveness. (Zigarmi et al., 1993).
Alternate forms were utilized in one study by Stoner-Zemel in 1988
which yielded statistically positive scores between the LBAII® Effectiveness
scores and the six subscales of the Excellent Organizational Practices Index
(PAVE). The reliability coefficients ranged from .12 to .34.
The split-halves method is considered inappropriate for the LBAII®-Self
and has not been utilized. The main reason for eliminating this method in
establishing reliability of the instrument is due to the limited number of items
and subconstructs to be measured (Zigarmi et al., 1993).
Internal consistency as a method to establish reliability on the LBAII®
Self-A and Other utilized Cronbach's Coefficient Alpha and Kuder Richardson
Formula-20 (KR-20). One study is worth mentioning which utilized the
PowerBase Inventory (PBI) Self and the LBAII® Self-A. In this PBI Self / LBAII
Self-A study, KR-20 internal consistency of scores on the LBAII® Self-A yielded
.98 for Style 1, .97 for Style 2, .99 for Style 3, and .98 for Style 4. (Zigarmi et al.,
1993).
45
Overall, the internal consistencies reliability of scores on the LBAII® SelfA and Other ranged from .43 to .86. Therefore, the reliability of the instrument
is strong based on the internal consistency method.
One thorough reliability study was conducted by Punch in 1987 on the
LBAII® Self-A. The internal consistency was examined in terms of an "ideal
mathematical model for the way items are expected to act" (Zigarmi et al., 1993).
The LBAII® Self-A Effectiveness score was analyzed using the Rasch
measurement model. The Rasch model allows for a thorough analysis of the
patterns of choices to the items on a scale and gives insight as to the way items
behave and the way they are ordered on the continuum which measures the
trait (in this case Leader Effectiveness scores which matches appropriate styles
to situational demands). The Rasch model mathematically explains the
difference in what is expected to happen and what actually happens, "how the
items fall on a natural logistic curve" (Zigarmi et al., 1993). The test of
significance is described as a "Test of Fit". The higher the probability, the better
the "Fit", and the inverse is true for the lower probability levels. This study
reported that fifteen items of the LBAII® Self-A fit the model very well. Two
items were reported as over-discriminating which is desirable because they
contribute to variance. Only three items fell below the discriminating threshold
(Zigarmi et al., 1993).
MBTI®
One of the main concerns of reliability of the MBTI® is measuring types
over time and the consistency with which a person remains in the same type.
One observation made is that a person who has a good understanding of his
own preferences will report those preferences more consistently. Therefore,
46
samples of older persons are expected to have higher reliability estimates than
younger persons. Also, since quality of perception and judgment are better for
higher achieving individuals, it is expected that individuals who have higher
achievement levels will report their preferences more consistently.
A logical split-half procedure was utilized to select the X and Y halves as
a method to determine internal consistency reliability. Each split-half drew from
every item content domain. The MBTI® reliabilities are consistent with those of
other personality instruments. Internal consistency was derived from X and Y
continuous scores utilizing the Spearman-Brown Prophecy formula correction.
The groupings were from three samples taken from the Center for Applications
of Psychological Type (CAPT) databank. Reliabilities remain stable for up to
twenty-five omissions for MBTI® Form G. As expected, older respondents had
higher consistency as well as higher achieving respondents. Reliability scores
are higher in the higher intelligence groups as well.
In summary, the estimates of internal consistency reliabilities for the
continuous scores of the four MBTI® scales are acceptable for adult samples.
The split-half reliabilities did not take into account the dichotomous nature of
the scores for which the MBTI® was designed (Myers and McCaulley, 1993).
Test-retest reliability estimates indicate the likelihood that a person will
come out the same MBTI® type upon retest. The chance probability of choosing
all four preferences (coming out the same type) on a retest is 6.25%. The actual
retest probabilities are significantly different from chance. Within a two month
interval for Howard Universtiy students, 53% chose the same four preferences;
after five weeks 48% of Mississippi State students chose the same four
47
preferences, and after six years 61% of the elementary teachers tested chose the
same four preferences (Myers and McCaulley, 1993).
In conclusion, test-retest reliabilities of MBTI show consistency over time.
When subjects report a change in type, it is most likely to occur in only one
preference and in scales where the original preference was low (Myers and
McCaulley, 1993).
Research Design
For a complete understanding of the research design it is important to
keep in mind which variables are independent and which are dependent. The
independent variable is the antecedent, the presumed cause of the dependent
variable. The dependent variable is the consequent, the presumed effect
(Kerlinger, 1986).
Independent and Dependent Variables
The independent variables were: (1) gender and (2) personality type
category which was limited to four of the Myers-Briggs personality types as
measured by the MBTI® (KTJ, ESTJ, INTP, and ESFJ) and the Myers-Briggs
subscale scores (EI, SN, TF, and JP). The dependent variables for the study
were: (1) Leader Effectiveness which was measured from the twenty item
LBAII®-Self instrument on a scale of 20-80; (2) Leader Flexibility which was
determined from the appropriate selection of leadership style to be utilized
based on the situation at hand and measured on a scale of 0-30; and (3) years of
experience in school administration.
Research Questions
The following research questions are organized according to the
statistical test to be utilized.
48
Hotelling's T 2
1. Is there a significant mean gender difference in LBAll Effectiveness
scores, Flexibility scores, and years of experience in school administration?
MANOVA
2. Is there a significant mean difference between four categories of
Myers-Briggs personality type in LBAII Effectiveness scores, Flexibility scores,
and years of experience in school administration?
Multiple Regression
3. How much variance is explained by Myers-Briggs subscales (EI, SN,
TF, JP) in predicting LBAII Effectiveness scores?
4. How much variance is explained by Myers-Briggs subscales (EI, SN,
TF, JP) in predicting LBAII Flexibility Scores?
5. How much variance is explained by Myers-Briggs subscales (EI, SN,
TF, JP) in predicting years of experience in school administration?
Statistical tests utilized were Hotelling's T 2 , Multiple Analysis of Variance
(MANOVA) to test for interaction and main effects, and Multiple Regression to
predict leader Effectiveness, Flexibility, and years of experience based on MyersBriggs personality type categories. Analysis of Variance (ANOVA), t-tests, and
one-way were used to test for simple effects.
Analysis
Analysis of the data included Hotelling's T 2 , MANOVA and Multiple
Regression.
Hotelling's T 2
A Hotelling s T 2 was utilized to determine differences in gender.
49
MANOVA
A Multiple Analysis of Variance (MANOVA) was utilized to determine if
there was a significant mean difference between the four categories of MyersBriggs personality type, gender and (1) LBAII Effectiveness Scores, (2) LBAII
Flexibility scores, and (3) years of school administration experience. MANOVA
was selected because it is an advanced statistical procedure which controls for
power. The MANOVA determined interaction and main effects, but a post hoc
analysis was necessary to determine simple effects. The post hoc analysis
included ANOVA, t-tests, and one-way. The following list includes the
MANOVA post hoc simple effects tests.
(1) ANOVA
Effectiveness by Gender (1,2) Myers-Briggs (1,4).
(2) ANOVA
Flexibility by Gender (1,2) Myers-Briggs (1,4).
(3) ANOVA
Years by Gender (1,2) Myers-Briggs (1,4).
(4) t-test
Groups=Gender (l,2)/Variable=Effectiveness.
(5) t-test
Groups=Gender (l,2)/Variable=Flexibility.
(6) t-test
Groups=Gender (l,2)/Variable=Years.
(7) one-way
Effectiveness by Myers-Briggs (1,4).
(8) one-way
Flexibility by Myers-Briggs (1,4).
(9) one-way
Years by Myers-Briggs (1,4).
Multiple Regression
Multiple regression was utilized to determine how much variance was
explained by Myers-Briggs subscales (EI, SN, TF, and JP) in predicting LBAII®
Effectiveness scores, LBAII® Flexibility scores, and years of experience in
school administration. This study utilized Myers-Briggs continuous scores
which ranged from 33 to 167. The E, S, T, and J scales ranged from 33 through
50
99 and the I, N, F, and P scales ranged from 101 through 167. Multiple
Regression determined the relationship of the scores of the dependent variables
(Effectiveness, Flexibility, and years) with the scores of the independent
variables (Myers-Briggs personality type dichotomous subscales). Either the
scores showed an inverse or a positive relationship. The following Figures 3.23.4 show the possible directions of the relationships.
Figure 3.2 Multiple Regression for Effectiveness
Dependent Variable
Effectiveness
I
E
80
50
20
EI
I
E
167
4
101
99
N
S
Independent Variables
SN
TF
IE
167
4
167
4
101
99
F
T
167
4
101
99
P
J
101
99
1
4
4
4
33
33
33
33
Figure 3.2 shows the possibility of an inverse relationship between
Effectiveness and the Extra vert®/ Introvert (EI) dimension, the
Sensing/iNtuitive® (SN) dimension, the Thinking/Feeling (TF) dimension, and
the Judging/Perceiving (JP) dimension.
51
Figure 3.3 Multiple Regression for Flexibility
Dependent Variable
Flexibility
I
E
30
15
EI
I
E
0
167
1
101
99
N
S
Independent Variables
SN
TF
JP
167
t
t
167
t
101
99
101
99
101
99
F
T
167
P
J
1
t
t
t
33
33
33
33
Figure 3.3 shows the possibility of an inverse relationship between
Flexibility and the EI dimension and a positive relationship between Flexibility
and SN, TF, and JP.
Figure 3.4 Multiple Regression for Years of Administrative Experience
Dependent Variable
Years
I
E
30
15
0
Independent Variables
SN
TF
EI
I
E
167
N
167
1
t
101
99
101
99
I
33
S
F
167
P
167
t
t
T
E
101
99
J
101
99
r
t
t
33
33
33
52
The possible relationships shown in Figure 3.4 are inverse between years
of administrative experience and the dimension of EI and positive between
years of experience and SN, TF, and JP.
Scores in the figures were continuous predictor variables and the
expected relationships were either positive (as the independent variable score
moved up, the dependent variable scores moved up also) or the relationships
were inverse (as the independent variable score moved up, the dependent
variable scores moved down). Relationships presented in Figures 3.2,3.3, and
3.4 were only possibilities. Data gathering and analysis of data answered the
questions about the relationships of the scores.
Computer Program
The Hotelling's T2, MANOVA, and Multiple Regression analyses used
the SPSS PC program presented below in Figure 3.5 and in Appendix D with
mock data utilized to be assured that the program would work.
53
Figure 3.5 Computer Program
TITLE 'personality type and leadership style'.
DATA LIST fixed/ id 1-2 yrs 4-5 gender 7 myers 9 ei 11-13 sn 15-17 tf 19-21
jp 23-25 eff 27-28 flex 30-31 si 33-34 s2 36-37 s3 39-40 s3 42-43
psl 45 ps2 47 ssl 49 ss2 51 dsl 53 ds2 55.
VARIABLE LABELS
yrs 'yrs of school administrative experience'.
gender 'male or female', myers 'myers-briggs
personality type', eff 'leadership effectiveness'.
flex 'leadership flexibility', ei 'extravert or introvert',
sn 'sensing or intuitive', tf 'thinking or feeling',
jp 'judging or perceiving'.
si 'leader style 1'. s2 'leader style 2'. s3 'leader
style 3'. s4 'leader style 4'. psl 'primary style 1'.
ps2 'primary style 2'. ssl 'secondary style 1'. ss2
secondary style 2'. dsl 'developing style 1'.
ds2 'developing style 2'.
VALUE LABELS
gender 1'male' 2 female'/.
myers 1'istj' 2 'estj' 3 'intp' 4 'esfj'/.
BEGIN DATA
END DATA.
*hotelling's T^
manova eff flex yrs by gender(l,2)/print = Cellinfocmeans/Cov/Cor)
homogeneity(bartlett) signif(efsize)/ power.
manova eff flex yrs by gender(l,2) myers(l,4)/print = cellinfo (means, cov, cor)
homogeneity (bartlett) signif(efsize)/ power.
*manova simple effects tests.
anova eff by gender(l,2) myers(l,4). anova flex by gender(l,2) myers (1,4).
anova yrs by gender(l,2) myers(l,4).
t-test groups=gender(l,2) / variable=eff.
t-test groups=gender(l,2)/ variable=flex.
t-test groups=gender(l,2)/ variable=yrs.
oneway eff by myers(l,4). oneway flex by myers(l,4). oneway yrs by myers(l,4).
regression variables= eff ei sn tf jp /
dependent=eff/
method=enter.
regression variables=flex ei sn tf jp/
dependent=flex/ method=enter.
variables=yrs
ei sn tf jp/
regression
dependent=yrs/ method=enter.
FINISH.
CHAPTER IV
FINDINGS
Introductory Statement
This chapter contains the findings from statistical procedures
conducted in this study. The research provided a balanced design with an
equal number of males (n=40) and females (n=40) and an equal number of
each of four Myers-Briggs personality types (ISTJ; ESTJ; INTP; and ESFP), nj =
20. Descriptive results are reported in Table 1 followed by the findings which
will be reported in order of the hypotheses presented in Chapter 1.
Descriptive Results
Table 1 provides the means and standard deviations for the three
dependent variables.
Table 1
Means and Standard Deviations
of Dependent Variables
Dependent Variables
(n=80)
X
S.D.
Effectiveness
51.62
6.12
Flexibility
17.36
4.72
9.03
7.25
Years
54
55
Mean Gender Differences in Effectiveness, Flexibility, and Years of Experience
HOI: There is no significant mean gender difference in LBAll
Effectiveness scores, Flexibility scores, and years of experience in school
administration.
The hypothesis is accepted. No significant differences in any of the three
dependent variables were found between males and females. Note p > .05 for
all dependent variables.
Hotelling's T2_ Results
The statistics utilized to test the first hypothesis was Hotelling's T2The Hotelling's T 2 results are presented in Table 2.
Table 2 Hotelling's T 2
Dependent Variables
Male
Female
S.D.
X
S.D.
Univariate F
Effectiveness
51.98
6.02
51.28
6.28
.26
.61
Flexibility
17.48
4.12
17.25
5.31
.05
.83
9.48
8.06
8.58
6.42
.31
.58
Years
56
Mean Difference Between Myers-Briggs Personality Type and LBAII
Effectiveness Scores, Flexibility Scores, and Years of Experience in School
Administration
H02: There is no significant mean difference between the four categories
of Myers-Briggs personality type in LBAII Effectiveness scores, Flexibility
scores, and years of experience in school administration.
The second hypothesis is rejected. Although no significant differences are
reported for Flexibility and years of experience dependent variables;
Effectiveness (leader effectiveness) indicated a significant difference between
the four Myers-Briggs personality types. The univariate F test between
Effectiveness and Myers-Briggs personality types (F = 8.13; p < .00, n = 80)
reported power of .99. Hotelling's Power reported .97 with an effect size of .117.
Simple effects will indicate which personality categories significantly differ in
Effectiveness scores.
MANOVA Results
Multiple Analysis of Variance was utilized to test the second hypothesis
with results reported in Table 3. Table 3 presents MANOVA results for each
dependent variable. Note the non-significance of Flexibility and years of
experience (p > .05) and the significance between Effectiveness and MyersBriggs personality types (p < .00) shown in Table 3.
57
Table 3 MANOVA
Univariate F
ANOVA
SS
df
MS
Effectiveness
Gender
Myers
713.65
9.80
703.85
4
1
3
178.41
9.80
234.62
6.18
.34
8.13
.00
.56
.00
Flexibility
Gender
Myers
118.15
1.01
117.14
4
1
3
29.54
1.01
39.05
1.38
.05
1.82
.25
.83
.15
Years
131.85
16.20
115.65
4
1
3
32.96
16.20
38.55
.64
.31
.74
.64
.58
.53
Gender
Myers
P
MANOVA Simple Effects Tests
MANOVA simple effects tests include the Analysis of Variance
(ANOVA) and Scheffe' post-hoc procedures. ANOVA results are presented in
Tables 4,4a; 5,5a; and 6,6a for each dependent variable respectively. Tables 4,
4a show the significance between Effectiveness scores and Myers-Briggs
personality types, specifically ESTJ. Although no significant differences are
reported for Flexibility and years of experience, descriptive data (means and
standard deviations) and statistics are reported in Tables 5,5a and 6,6a to
indicate the similarity in means across the groups.
58
Analysis of Variance on Effectiveness Scores
Source
SS
df
MS
F
p
Gender
9.80
1
178.41
6.18
.56
Myers
703.85
3
234.62
8.13
oo
p
Table 4
Gender by Myers
167.10
3
55.70
1.93
.13
Residual
2.078.00
72
Total
2,958.75
79
a
Myers significantly differed in Effectiveness scores.
28.86
37.45
Table 4a includes Scheffe' results which provides a conservative post hoc
analysis of Effectiveness scores for Myers-Briggs personality types. Post hoc
results indicate a significant difference between Effectiveness scores of ESTJ
personality type category versus ISTJ, INTP, and ESFJ.
Table 4a
Post Hoc Analysis of Effectiveness Scores
for Myers-Briggs Personality Categories
Independent Variable
Myers-Briggs Groups (nj = 20)
1 - ISTJ
X
50.25
3.75
2-ESTJ
56.75
7.81a
3 - INTP
49.80
4.20
4-ESFJ
49.70
ESTJ significantly differed from ISTJ, INTP, and ESFJ.
a
F
S.D.
Scheffe = 5.77
510
59
Tables 5,5a show no significant differences. They are included to show
the similarity of means of scores for the dependent variable - - Flexibility. Note
p > .05 for all variables.
Table 5
Analysis of Variance on Flexibility Scores
Source
SS
df
MS
F
Gender
1.01
1
1.01
.31
.58
Myers
117.14
3
39.05
.74
.53
Gender by Myers
101.84
3
33.95
1.86
.15
1,542.50
1,762.49
72
79
21.42
22.31
1.16
.34
Residual
Total
Table 5a
P
Post Hoc Analysis of Flexibility Scores
X
S.D.
17.85
4.69
2 - ESTJ
19.10
4.13
3-INTP
16.50
4.44
4-ESFJ
16.00
5.27
Independent Variable
Myers-Briggs Groups (nj =20)
1-ISTJ
Tables 6,6a show no significant differences but are included to show
similarity of means of scores for the dependent variable - - years of experience.
Note p > .05 for all variables.
60
Table 6 Analysis of Variance on Years of Experience of School Administrators
Source
SS
Gender
16.20
Myers
Gender by Myers
Residual
Total
Table 6a
df
MS
F
p
1
16.20
.31
.58
115.65
3
38.55
.74
.53
289.20
3
96.37
1.86
.15
3,737.00
4,157.95
72
79
51.90
52.63
1.16
.34
Post Hoc Analysis of Years of Experience
of School Administrators
Independent Variable
X
SXX
1 - ISTJ
10.50
8.04
2-ESTJ
8.05
7.35
3 - INTP
7.65
7.04
4-ESFJ
9.90
6.68
Myers-Briggs Groups (nj =20)
Relationship Between Myers-Briggs Subscales in Predicting LBAII Effectiveness
Scores
H03: There is no significant relationship between Myers-Briggs
subscales (EI, SN, TF, and JP) in predicting LBAII Effectiveness scores.
This hypothesis is accepted. No significant predictors were found with
Myers-Briggs subscales in predicting LBAII Effectiveness scores (Tables 7, 7a).
61
Multiple Regression Results
Multiple regression was utilized to test H03, H04, and H05. Results are
reported in Table 7, 7a; 8,8a; and 9,9a.
Table 7
Correlation of Effectiveness with Myers-Briggs Subscales
Effect.
1.00
-.11
-.11
-.05
-.12
51.63
6.12
Effect.
EI
SN
TF
IP
Means
S.D.
Table 7a
Independent Variable
EI
SN
TF
TP
1.00
.15
-.47
.13
99.78
28.27
1.00
.12
.63
85.20
25.97
1.00
.08
89.60
24.61
1.00
83.42
27.44
Multiple Regression on Effectiveness
b
SEh
EI
-.03
.03
-.15
.25
SN
-.00
.04
-.01
.93
TF
-.03
.03
-.12
.35
.03
-.09
.56
IP
-.02
R - .04, no predictors were significant.
2
h
E
Relationship Between Mvers-Briggs Subscales in Predicting LBAII Flexibility
Scores
H04: There is no significant relationship between Myers-Briggs
subscales (EI, SN, TF, and JP) in predicting LBAII Flexibility scores.
This hypothesis is accepted. No significant predictors were found with
Myers-Briggs subscales in predicting LBAII Flexibility scores (Tables 8,8a).
62
Table 8
Correlation of Flexibility with Myers-Briggs Subscales
Flex.
1.00
-.08
-.20
-.07
-.09
17.36
4.72
Flex.
EI
SN
TF
IP
Means
S.D.
Table 8a
EI
SN
TF
TP
1.00
.15
-.47
.13
99.78
28.27
1.00
.12
.63
85.20
25.97
1.00
.08
89.60
24.61
1.00
83.42
27.44
Multiple Regression on Flexibility
Independent Variable
_SEb_
EI
-.02
.02
-.10
.45
SN
-.04
.03
-.21
.16
TF
-.02
.03
-.10
.45
.01
.03
IP
R - .05, no predictors were significant.
.06
.66
2
Relationship Between Myers-Briggs Subscales in Predicting Years of
Experience of School Administrators
H05: There is no significant relationship between Myers-Briggs
subscales (EI, SN, TF, and JP) in predicting years of experience of school
administrators.
This hypothesis is rejected. JP (Judging/Perceiving) was found to be a
significant predictor of years of experience (Tables 9,9a).
63
Table 9 Correlation of Years of Experience of School Administrators
with Myers-Briggs Subscales
Yrs.
1.00
-.03
-.02
.01
-.21
9.03
7.25
Yrs.
EI
SN
TF
TP
Means
S.D.
EI
SN
TF
TP
1.00
.15
-.47
.13
99.78
28.27
1.00
.12
.63
85.20
25.97
1.00
.08
89.60
24.61
1.00
83.42
27.44
Table 9a Multiple Regression on Years of Experience of
School Administrators
Independent Variable
R
2_
_SEb_
EI
.02
.03
.08
.57
SN
.05
.04
.17
.24
TF
.04
.04
.05
.70
.09
.04
-.34
JP
.07, JP is a significant predictor of years of experience.
.02
Summary
No gender differences were found in any of the three dependent
variables. Significant differences found are listed as follows.
1. Myers-Briggs personality type categories involved different leader
Effectiveness averages. Specifically, ESTJ personality type differed in leader
Effectiveness from the other groups, ISTJ, INTP, and ESFJ.
64
2. The JP variable was a significant predictor of years of experience of school
administrators. As years of experience increase, judging was increased as a
significant personality variable rather than perceiving.
CHAPTER V
CONCLUSIONS AND RECOMMENDATIONS
Introduction
This chapter summarizes the purpose for the study, literature review,
methods and procedures, and findings. Finally, conclusions and
recommendations are made based on the findings of the study.
Purpose for the Study
Studies have shown that personality traits cause individuals to act in a
given way. These traits can translate into leadership skills. Therefore, it is
fitting to study personality types and their relationship to leader effectiveness
and flexibility.
School districts are facing the challenge of downsizing central
administration and placing more responsibility on local campus
administrators. This site-based decision-making brings with it accountability
related to student performance. Campus administrators are evaluated based
on student performance on their campuses. In addition, central
administrators are accountable for district-wide student performance.
Centrally, administrators are required to asssume multiple roles, taking
responsibility for many district-wide administrative tasks. Greater
accountability for local campus administrators and the phenomenon of
assuming multiple roles for central administrators requires efficient and
effective leadership.
65
66
Effective leadership requires utilization of multiple skills. School
administrators who understand personality types in relation to leadership
strengths are able to be flexible in meeting situational demands in a changing
educational climate. Therefore, a study of personality type and its relationship
to leader effectiveness and flexibility is of interest to school administrators.
Literature Review
Leadership as a concept appeared in the first half of the nineteenth
century explaining the control Parliament exerted over British citizens. In the
latter decades of the nineteenth century and the early decades of the twentieth
century, leadership was a one-way influence. The person in power (leader)
influenced and controlled the followers.
The model utilized for this study, Situational Leadership II, was
developed by Kenneth Blanchard and Paul Hersey. The Situational Leadership
II model is based on selecting the appropriate leadership style for the individual
situation and to match the development level of followers. The model utilizes
the Leader Behavior Analysis II (LBAII®) instrument to determine effectiveness,
flexibility, and style of leadership. This study utilized the LBAII® Self-A to
measure effectiveness and flexibility of school administrators.
The personality of school administrators was measured utilizing the
Myers-Briggs Type Indicator (MBTI®) instrument. MBTI® measures sixteen
combinations of four preferences of interests, values, and skills which identify
personality types. This study selected four personality types which could be
considered more common to school administrators than the other twelve types.
The four types were selected to assure that each preference was represented in
the study.
67
The four dichotomous variables which make up the sixteen personality
types are as follows:
1. Extravert® or Introvert - outer world versus inner world;
2. Sensing or iNtuition® - present and concrete versus future;
3. Thinking or Feeling - objective logic versus subjective
evaluation; and
4. Judging or Perceiving - planned and organized versus flexible
and spontaneous.
Four types selected for this study and a brief description of each are as follows:
1. ISTJ - serious and quiet individuals who use their own heads to
make decisions;
2. ESTJ - individuals who are organizers and like to be in charge;
3. INTP - quiet and reserved individuals who are interested in
ideas and have an interest in science and theories; and
4. ESFJ - individuals who are cooperative and perfect members of
committees.
Several previous studies created interest for this particular study.
However, one in particular was a study which utilized the MBTI and Principal
Problem Strategy Questionnaire (PPSQ). PPSQ was administered to 86
principals. It was determined that personality type preference as measured by
MBTI is a major determinant of leader behavior problem solving strategies
utilized to solve the PPSQ problem situations. The current study addresses the
relationship between personality type preferences and gender to leader
effectiveness, flexibility, and years of experience as a school administrator.
68
Methods and Procedures
TheMBTT® and LBAII® Self-A instruments were administered to 80
school administrators in Texas, specifically from eleven districts in Dallas and
Tarrant counties. Although the overall test at the .05 level of significance with a
power of .80 only required 49 subjects, a balanced design was desired. The
balanced design utilized in this study required 10 males and 10 females in each
of the four personality type groups. The design utilizes Analysis of Variance
(ANOVA), and a minimum of 10 subjects per cell is desired for a total of eighty
80 subjects. Statistical tests utilized to test the hypotheses included Hotelling's
T 2 , MANOVA, ANOVA, and Multiple Regression.
The independent variables for the study were gender and personality
type category which were four of the Myers-Briggs personality type groups
(ISTJ, ESTJ, INTP, and ESFJ). The dependent variables were leader effectiveness
and leader flexibility measured by LBAII® Self-A instrument and years of
experience in school administration.
Findings
Findings of the study are listed as follows:
1. No gender differences were found in any of the three dependent
variables.
2. A significant difference was found in LBAII® Effectiveness scores of
the ESTJ personality type category.
3. There was no significant mean difference between the four categories
of Myers-Briggs personality type and LBAII® Flexibility scores.
69
4. There was no significant mean difference between the four categories
of Myers-Briggs personality type and years of experience of school
administrators.
5. There was no significant relationship between the Myers-Briggs
personality type subscales and LBAII® Effectiveness scores.
6. There was no significant relationship between the Myers-Briggs
personality type subscales and LBAII® Flexibility scores.
7. The JP variable was a significant predictor of years of experience of
school administrators. As years of experience increase, judging was increased as
a significant personality variable rather than perceiving.
Conclusions
Conclusions are based on findings of the study.
1. No gender differences were found in any of the three dependent
variables, leader effectiveness, leader flexibility or years of experience in school
administration. The review of literature included information which stated that
previous demographic studies with the LBAII® instrument yielded results with
no significant findings.
2. A significant difference was found in effectiveness scores of ESTJ
personality type category. ESTJ was defined as an individual with a mind for
business who can be a good administrator but needs to work at understanding
others and their feelings. The ESTJ is an organizer and likes to be in charge.
3. Another significant finding was that the JP variable was a significant
predictor of years of experience of school administrators. JP is the
Judging/ Perceiving variable. The findings indicate as years of experience
increase, judging increases as a personality variable. This finding is not
70
surprising since judging characterizes individuals who prefer an ordered
approach to life and having things settled. The perceiving preference is a
spontaneous approach to life. Demands of an administrator's job could cause an
individual to learn to act in a judging (ordered) way rather than acting in a
spontaneous manner. The longer an individual serves in the capacity of school
administrator, the more likely s/he would be to respond as a judging
preference.
Recommendations
The following recommendations were formulated on the basis of the
related literature, findings, and conclusions of this study.
1. Gender differences should not be considered as a significant factor in
understanding leadership effectiveness and flexibility.
2. ESTJ personality type as measured by MBTI® had significantly higher
leader effectiveness scores. Therefore, MBTI® should be offered to all
administrators to provide an understanding of personality attributes which
contribute to leader effectiveness.
3. JP (Judging/Perceiving) variable was a significant predictor of
years of experience of school administrators. As years of experience increased
judging increased as a personality variable. Characteristics of judging which
contribute to administrative effectiveness should be investigated to use in
leadership training for school administrators.
4. Based on the mean scores on the LBAII®, the Situational Leadership®
II model should be utilized in school administrator pre-service training as a tool
to help beginning administrators understand effective leadership practices.
71
5. LBAII® scores were not higher for administrators with more years of
experience. Therefore, on-going staff development should be offered to teach
effective leadership techniques based on the Situational Leadership® II model.
APPENDIX A
LETTERS OF PERMISSION
72
October 1,1994
73
Linda K. Andersen
3420 Andover Drive
Bedford,. Texas 76021
Dr. Drea Zigarmi
c/o Hanchard Training and Development, Inc
125 State Place
Escondido, Califcmia 92029
Dear Dr. Zigarmi:
This request is for permission to use the LBAII Self-A instrument to gather
data for my dissertation. I am mast interested in the findings of your research
and would like to do further study erf the dimensions measured by your
instrument. I am a student at University of North Texas in the College of
Education with a major in Applied Technology, Training and Development and a
minor in Educational Administration.
My proposal is to correlate the sixteen personality types measured by the
Myers-Briggs Sdf-Sccrabie Type Indicator with Effectiveness, Flexibility, and
Style scores measured by the LBAII Self-A instrument for public schod
administrators. If permission is granted, I will need 100 LBAII Self-A
instruments. In addition, I will gladly share the findings from my research with
your group.
Your prompt consideration of my request will be most appreciated, as I
would like to gather data from your instrument during this semester. Also, I
would appreciate receiving information concerning ordering copies of the
instrument
Respectfully submitted,
Linda K. Anderson
Blanchard Training
and Development, Inc.
•
•
bid
October 12, 1994
?4
i 0*^
PlnrA
Escondido,CA 92029
619 489-5005
Ms. Linda K. Anderson
3420 Andover Drive
Bedford, TX 76021
Dear Linda:
Over the years the LB All® Self or Other has been used in over forty
dissertations on Master studies. We are pleased that the model and
instruments have become more visible. As the requests for LBAII®s
increase, we have found it necessary to humbly request that researchers
follow some general guidelines.
BTD will provide the LBAII® instruments to you at no cost providing you
are willing to meet the following conditions:
•
That any dissertations, papers, etc. written from this theoretical
framework and using these instruments give citations and
references as to where the instruments can be obtained.
•
That you do not sell or make economic gain from selling the
instruments for popular consumption and that any copies of the
instruments used be clearly marked "For research only."
•
That Blanchard Training and Development receive a full bound copy
of any dissertation or monograph written concerning this research.
•
That Blanchard Training and Development be allowed to pass on
your research (in summary form) to others who might be doing
similar research as a way of supporting those who are working
hard to further the field of education.
•
That the following scores be produced and reported in your
publication using your sample base.
Page 2
October 12,1994
75
1. Average Flexibility Score and Standard Deviation
2. Average Effectiveness Score and Standard Deviation
3. Average Style Score Means and Standard Deviations to S1
through S4
4. Per cent of Primary Styles 1 through S4
5. Per cent of Secondary Styles 1 through S4
6. Per cent of Developing Styles 1 through S4
7. Maximums and Minimums
This request has emerged because researchers do not fully utilize the six
scores that can be derived from the LBAII®. With these scores, BTD will
be able to compare across populations. These numbers may aid in a
future meta analysis.
Optional scores that would help further comparisons are
8. Average Flexibility Scores and Standard Deviations by Gender
9. Average Effectiveness Scores and Standard Deviations by
Gender
10. Average Style Score Means and Standard Deviations by Gender
Upon your request we will be glad to send you a copy of the Reliability/
Validity Study which describes the LBAII® Self and Other and relevant
research. If you decide to use the LBAII®, please call me so we can
discuss your research design.
Enclosed is an article which summarizes some of the changes in the
model since 1981 and some pertinent research findings.
Sincerely,
DZ:JK
Drea Zigarmi, Ed.D.
Research Coordinator
Enc: Situational Leadership after 25 Years
November 22, 1994
Linda K Anderson
3420 Andover Drive
Bedford, TX 76021
Drea Zigarmi, Ed.D.
Blanchard Training and Development, Inc.
125 State Place
Escondido, CA 92029
Dear Dr. Zigarmi:
Thank you for the copy of the Validity and Reliability Study. I am hoping to
conduct my data gathering by administering the LBAII-Self and the MBTIForm G to eighty (80) school administrators during the month of January. I
completed the LBAII Self -A, 1991, instrument when I first became acquainted
with it in a doctoral level administration course in 1992 at University of
North Texas. That experience stimulated my interest in situational
leadership.
The purpose of my study is to determine if there is a relationship between
personality types of school administrators and dimensions of leader
effectiveness, flexibility, and style and to verify that experience and leadership
training are not variables contributing to the relationship. It is hoped that the
information obtained from this investigation can assist administrators in
their development of an attitude of continuous improvement, not just
school improvement but personal improvement of those who are in
leadership positions, providing vision for change.
I believe that the 20 situations provided on the LBAII Self will provide great
insight into the effectiveness of the school administrators in the sample. I
agree to carry out the stipulations in your October 12th letter. Is it possible to
receive this instrument during December so that plans can be made to
administer it to the 80 school administrators during January? Thank you for
your interest in my research.
Sincerely,
Linda K. Anderson
76
Blanchard Training
and Development, Inc.
•
,
November 29, 1994
•
77
125 State Place
Escondido,CA 92029
619 489-5005
Ms. Linda Anderson
3420 Andover Drive
Bedford, TX 76021
Dear Linda:
Thank you for your letter of November 22. It clarifies your dissertation topic more fully.
Enclosed you will find the 80 LBAIIs that you requested. Please
keep me informed as your dissertation progresses.
Yours truly,
odkjUU
Drea Zigarmi, Ed.D.
Research Coordinator
DZ:JK
Enclosures
June 15,1995
Linda K. Anderson
3420 Andaver Drive
Bedford, Texas 76021
Dr. Drea Zigarmi
Blanchard Training and Devieopment, Inc.
125 State Place
Escondido, California 92029
Dear Dr. Zigarmi:
Attached is the descriptive data which you requested from my research
conducted utilizing the LBAH® Self-A instrument. A complete and bound
copy of my dissertation will be provided to you afterfinalapproval by my
committee.
Data for my study was gathered in April and May utilizing 80 school
administrators from eleven Texas school districts in Dallas and Tarrant
counties. The dissertation was entitled, "An Investigation of School
Administrator Personality Type and Gender To Leader Effectiveness,
Flexibility, and Years of Experience.
Thank you for providing the instruments. Once again, I will send a
bound copy of the dissertation as soon as it is available.
Sincerely,
Linda K. Anderson
78
79
Scores requested by Blanchard Training and Development as condition of
utilizing LBA1I instrument.
1.
Average Flexibility Score and Standard Deviation -
2.
Average Effectiveness Score and Standard Deviation -
3.
Average Style Score Means and Standard Deviations
Styles 1-4
SIS2 -
1.25,1.28
4.62,2.73
S3S4 -
17.36,4.72
,
—
9.95,3.15
4.19,2.03
4.
Percent of Primary Styles 1-4
SlS2 -
0%
18%
53 54 -
73%
9%
5.
Percent of Secondary Styles 1-4
51 52 -
6%
33%
53 54 -
16%
45%
6.
Percent of Developing Styles 1-4
51 52 -
54%
25%
53 54 -
0%
21%
7.
Maximum and Minimum Scores
Variable
Maximum
Minimum
Flexibility
28
6
Effectiveness
74
40
*Style 1
4
0
*Style 2
12
0
"Style 3
17
4
*Style 4
10
0
"Style Score Maximums and Minimums indicate the frequency that each styl
was selected by respondents
80
8.
9.
10.
Average Flexibility Scores and Standard Deviation by Gender
Gender
X
S.D.
Male
Female
17.475
17.250
4.120
5.310
Average Effectiveness Scores and Standard Deviation by Gender
Gender
X
S.D.
Male
Female
51.975
51.275
6.015
6.280
Average Style Score Means and Standard Deviation by Gender
Style/Gender
X
S.D.
Male
1.30
1.14
Female
1.20
1.42
Male
5.10
2.88
Female
4.15
2.52
9.78
2.78
10.13
3.52
Male
3.85
1.82
Female
4.53
2.20
Style 1
Style 2
Style 3
Male
Female
Style 4
APPENDIX B
HUMAN SUBJECTS FORM
81
82
Dear Participant,
I am conducting a study to fulfill the final requirements of a Ph.D. at
University of North Texas. The title of my study is "An Investigation of
School Administrator Personality Type and Gender Relatedness to Leader
Effectiveness, Flexibility, and Years of Experience."
Your participation in this study is appreciated. There will be two instruments
which you will complete, the Myers-Briggs Type Indicator® and the Leader
Behavior Analysis II®. Total time for completion and scoring of the
instruments in 40-50 minutes. Feedback will be provided concerning
personality type and leadership style. The total time needed for your
participation in the study is no longer than one hour. Your responses will be
held in strictest confidence. In fact, no names are needed, only your gender
and number of years as a school administrator.
Once again, thank you for your willingness to participate in this research
study.
Sincerely,
Linda Anderson
CONSENT FORM
I agree to participate in the study, "An Investigation of School Administrator
Personality Type and Gender Relatedness to Leader Effectiveness, Flexibility,
and Years of Experience." I realize that my participation is completely
anonymous except for providing my gender and years of experience.
I understand that my participation is completely voluntary and I may choose
to withdraw at any time without penalty or prejudice.
Signature of Participant and Date
(If you have questions, please call Linda Anderson, 354-7233)
THIS PROJECT HAS BEEN REVIEWED BY THE UNIVERSITY OF NORTH
TEXAS COMMITTEE FOR THE PROTECTION OF HUMAN SUBJECTS.
APPENDIX C
SAMPLE INSTRUMENT - DEMOGRAPHICS
83
84
DEMOGRAPHIC DATA
Please complete the items below.
1.0
Number of years in administration, including current year.
1.1 Years
2.0
Gender
3.1 Male
3.2 Female
3.0
School District
APPENDIX D
COMPUTER PROGRAM
85
86
Computer Program
The SPSS program to analyze the research questions is provided below
with mock data included to assure that the program would work.
TITLE 'personality type and leadership style'.
DATA LIST fixed/ id 1-2 yrs 4-5 gender 7 myers 9 ei 11-13 sn 15-17 tf 19-21
jp 23-25 eff 27-28 flex 30-31 si 33-34 s2 36-37 s3 39-40 s3 42-43
psl 45 ps2 47 ssl 49 ss2 51 dsl 53 ds2 55.
VARIABLE LABELS
yrs 'yrs of school administrative experience'.
gender 'male or female'.
myers 'myers-briggs personality type'.
eff 'leadership effectiveness', flex 'leadership
flexibility', ei 'extravert or introvert', sn 'sensing
or intuitive', tf 'thinking or feeling', jp 'judging
or perceiving'.
si 'leader style 1'. s2 'leader style 2'. s3 'leader
style 3'. s4 'leader style 4'. psl 'primary style 1'.
ps2 'primary style 2'. ssl 'secondary style 1'. ss2
'secondary style 2'. dsl 'developing style 1'. ds2
'developing style 2'.
VALUE LABELS
gender 1 'male' 2 ' female'/.
myers 1 'istj' 2 'estj' 3 'intp' 4 'esfj'/.
BEGIN DATA
01 06 2 4 065 097129 095 48 26 03 05 06 06 3 4 2 0 1 0
02 05 1 3 109 101 09710754 2202 04 06 07 3 4 2 0 1 0
03 06 2 2 089 053 089 065 65 24 04 03 06 07 4 0 3 1 2 0
04 10 1 3 109 105 07315546 16 00 10 07 03 2 0 3 0 41
05 10 2 4 051 091123 095 40 20 03 02 08 07 3 4 0 0 1 2
06 14 21107 091 089 077 53 19 00 11 07 02 2 0 3 0 4 1
07 12 1 4 053 047131 069 56 22 03 03 09 05 3 0 4 0 21
08 011 1123 067 069 051 54 21 02 04 08 07 3 0 4 2 1 0
09 05 1 4 097 071103 055 5218 00 0610 04 3 0 2 4 1 0
10 10 2 3 103 131 081103 5118 00 04 10 06 3 0 4 2 1 0
1113 1 2 093 093 087 098 611802 03 11 04 3 0 4 0 21
12 25 2 3111133 091 109 571400 071102 3 0 2 0 4 1
13 05 2 3143 141 097145 51 08 00 0216 02 3 0 0 0 2 4
14 16 1 2 063 079 061 053 49 1401 03 13 03 3 0 0 0 2 4
15 08 21139 077 095 051 44 IS 00 0511 04 3 0 2 4 1 0
16 08 1 3113 109 087115 50 22 01 07 07 05 2 3 4 0 1 0
END DATA.
87
*hotelling's T2
manova eff flex yrs by gender(l,2)/print = cellinfcKmeans^ov.cor)
homogeneityCbartlett) signif(efsize)/ power.
manova eff flex yrs by gender(l,2) myers(l,4)/print = cellinfo(means,cov,cor)
homogeneity(bartlett) signif(efsize)/ power.
*manova simple effects tests.
anova eff by gender(l,2) myers(l,4)- anova flex by gender(l,2) myers(l,4).
anova yrs by gender(l,2) myers(l,4)t-test groups=gender(l,2)/variable=eff.
t-test groups=gender(l ,2) / variable=flex.
t-test groups=gender(l,2) / variable=yrs.
oneway eff by myers(l,4). oneway flex by myers(l,4). oneway yrs by myers(l,4).
regression variables= eff ei sn tf jp/
dependent=eff/
method=enter.
regression variables=flex ei sn tf jp/
dependent=flex/ method=enter.
regression variables=yrs ei sn tf jp/
dependent=yrs/ method=enter.
FINISH.
REFERENCES
Abrell, R.L.. "Educational Leadership Without Carrot and Club," Clearing
House, Vol. 52 (pp. 280-285). 1979.
Amburg, David Van. "Required Sample Size as a Function of Population
Size, Desired Accuracy (within 5, 3, or 1%) Level of Confidence."
Market Source, Inc.
Barr, Lee and Norma. Leadership Development Maturity and Power (pp.
2, 8, and 355). Austin, TX: Eakin Press, 1994.
Bass, Bernard M. Bass and Stogdill's Handbook of Leadership Theory,
Research, and Managerial Applications.. Third Edition (pp. 11-12 and
18-19). New York: Free Press, A Division of Macmillan, Inc., 1990.
Beck, John D.W. and Yeager, Neil M. The Leader's Window Mastering the
Four Styles of Leadership to Build High Performing Teams. New York:
John Wiley and Sons, Inc., 1994.
Bingham, W.V. "Leadership", In H.C. Metcalf, The Psychological Foundations
of Management (p. 7). New York: Shaw, 1927.
Blake, Robert R. and Mouton, Jane S., The Managerial Grid, Houston, Tx.:
Gulf Publishing, 1964.
Bowden, A.O. "A Study of the Personality of Student Leaders in the
United States," Journal of Abnormal Social Psychology, Vol. 21 (pp.
149-160). 1926.
Blanchard, Kenneth H.; Hambleton, Ron; Zigarmi, Drea; and Forsyth, Doug.
Leader Behavior Analysis (Self and Other), Escondido, CA: Blanchard
88
89
Training and Development, Inc., 1982; revised version, the LBAII Self and
Other, 1985.
Blanchard, Kenneth H., Zigarmi, Drea, and Nelson, Robert B. "Situational
Leadership After 25 Years: A Retrospective," The Journal of
Leadership Studies, Vol. 1, No. 1 (pp. 23-28 and 31-34). 1993.
Bogardus, E.S. Essentials of Social Psychology (p. 1). Los Angeles:
University of Southern California Press, 1918.
Burdin, Joel (ed.) School Leadership A Contemporary Reader. Sponsored
by the University Council on Educational Administration (pp. 406-407
and 411). Newbury Park, CA: Sage Publications, Inc., 1989.
Fiedler, Fred E. A Theory of Leadership Effectiveness. New York:
McGraw-Hill, 1967.
Gibb, C.A. "Leadership." In G. Lindzey and E. Aronson (eds.). The
Handbook of Social Psychology, 2nd ed., Vol. 4. Reading, Mass.:
Addison-Wesley,
1969a.
Gibb, C.A. Leadership: Selected Readings. Baltimore: Penguin Books, 1969b.
Good, Lael; Hill, Tom; and Blanchard, Ken. "The Leadership Bridge
Situational Leadership II and the Myers-Briggs Type Indicator
Synopsis and Sample Pages", (p. 77). Escondido, CA: Blanchard
Training and Development, 1992.
Graeff, Carl. "The Situational Leadership Theory: A Critical Review,"
Academy of Management Review (pp. 285-291). Vol. 8,1983.
Griffiths, D., (ed.) "Leadership and Administration," Behaviorial Science and
Educational Administration The Sixty-Third Yearbook of the National
Society for the Study of Education (p. 406). Chicago: The Society, 1964.
90
Haley, Mike. Relationship Between Internal-External Locus of Control
Beliefs. Self-Monitoring and Leadership Style Adaptability. Cleveland,
Ohio: Unpublished Doctoral Dissertation, Case Western Reserve
University, 1983.
Halpin, A.W. 'The Behavior of Leaders," Educational Leadership, Vol. 14,
(pp. 172-176). Alexandria, Va.: Association for Supervision and
Curriculum Development, 1956.
Hambleton, Ronald K. and Gumpert, Ray. "The Validity of Hersey and
Blanchard's Theory of Leader Effectiveness," Group and
Organization Studies, Vol. 7, No. 2, (pp. 225-242). June 1982.
Havighurst, R.J. and Russell M. "Promotion in the Armed Services in
Relation to School Attainment and Social Status," School Review, Vol.
53, (pp. 202-211). 1945.
Hersey, Paul and Blanchard, Kenneth H. "Life Cycle Theory of Leadership,"
Training and Development Journal, Vol. 23, (pp. 128- 133). May 1969.
Hersey, Paul and Blanchard, Kenneth H. Management of Organizational
Behavior: Utilizing Human Resources, 6th Edition, Englewood Cliffs,
N.J.: Prentice-Hall, 1993.
Kerlinger, Fred N. Foundations of Behavioral Research, Third Edition (p. 32).
Orlando, Florida: Holt, Rinehart, and Winston, Inc., 1986.
Kirk, Roger E. Experimental Design Procedures for the Behavioral
Sciences, Second Edition. Pacific Grove, Ca.: Brooks/Cole Publishing
Company, 1982.
Lewin, Kurt, Lippett, R., and White, R. "Leader Behavior and Member
Reaction in Three Social Climates," Group Dynamics: Research and
91
Theory, 2nd Edition, eds., D. Cartwright and A. Zander, Evanston,
Illinois: Row Peterson and Company, 1960.
Likert, R. "Management Styles and the Human Component, "Management
Review, Vol. 66 (pp. 23-28 and 43-45). 1977.
Martin, Julian. Self Reported Leadership Styles of Higher Education
Administration in Venezuela as Related to Selected Demographic
Variables. Kalamazoo, MI: Unpublished Doctoral Dissertation,
Western Michigan University, 1990.
Myers, Isabel Briggs and McCaulley, Mary H. Manual: A Guide to the
Development and Use of the Myers-Briggs Type Indicator (pp. 175,
243, and 244-292). Consulting Psychologists Press, Inc., 1993.
"Psychological Type and Perceived Problem-Solving Strategies," Paper
Presented at the Annual Meeting of the Mid-South Educational
Research Association, 12th Nashville, TN: November 16,1983.
Reddin, William J., "The 3-D Management Style Theory," Training and
Development journal (pp. 8-17). April 1967.
Stogdill, Ralph and Coons, Alvin (eds.). Leader Behavior: Its Description and
Measurement, Research Monograph No. 88, Columbus, Ohio:
Bureau of Business Research, Ohio State University, 1957.
Stoner-Zemel, Jessica. Visionary Leadership, Management and High
Performing Work Units: An Analysis of Workers' Perceptions.
Amherst, MA: Unpublished Doctoral Dissertation, University of
Massachusetts, 1988.
Tannenbaum, Robert and Schmidt, Warren. "How to Choose a Leadership
Pattern," Harvard Business Review, March-April, 1958.
92
Tead, O. The Art of Leadership. New York: McGraw-Hill, 1935.
Wilkinson, Allen. Perceived Supervisory Leadership Style, Flexibility and
Effectiveness, Counselor Locus of Control and Dimensions of job
Satisfaction for State Rehabilitation Counselors. Edwardsville, IL:
Unpublished Doctoral Dissertation Southern Illinois University, 1990.
Winer, B.J. Statistical Principles in Experimental Design. New York:
McGraw-Hill Book Company, 1962.
Zigarmi, Drea; Edeburn, Carl; and Blanchard, Kenneth H. Managerial SelfReported Effectiveness Ratings as Compared with Employee
Perceptions of Climate and Satisfaction. Escondido, CA: Blanchard
Training and Development, Inc., Unpublished Study, 1992.
Zigarmi, Drea; Edeburn, Carl; and Blanchard, Kenneth. Research on the LBAII A Validity and Reliability Study (pp. 5-11,92,102-103, and 142).
Escondido, CA: Blanchard Training and Development, Inc., 1993.
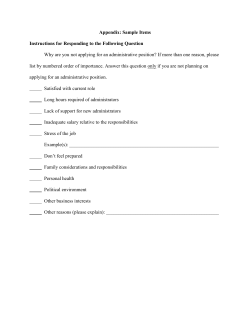


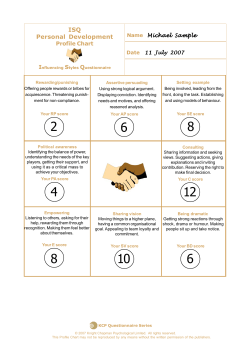


© Copyright 2026