
on the Analysis of Facebook and WhatsApp in Cellular Networks
Online Social Networks Anatomy: on the Analysis
of Facebook and WhatsApp in Cellular Networks
Pierdomenico Fiadino, Pedro Casas, Mirko Schiavone, Alessandro D’Alconzo
Telecommunications Research Center Vienna - FTW
{surname}@ftw.at
Abstract—Online Social Networks (OSNs) have rapidly become an integral part of our daily lives, and hundreds of millions
of people are nowadays remotely connected trough popular OSNs
such as Facebook, Google+, Twitter and WhatsApp. While much
has been said and studied about the social aspects of OSNs, little is
known about the network side of OSNs, specially regarding their
network and traffic footprints, as well as their content delivery
infrastructures. In this paper we study these networking aspects
of OSNs, vivisecting the most popular OSNs in western countries:
Facebook and WhatsApp. By analyzing two large-scale traffic
traces collected at the cellular network of a major European
ISP, we characterize and compare the networking behavior of
Facebook and WhatsApp, considering not only the traffic flows
but also the network infrastructures hosting them. Our study
serves the main purpose of better understanding how major OSNs
are provisioned in today’s Internet. To the best of our knowledge,
this is the first paper providing such an analysis using large-scale
measurements in cellular networks.
Keywords—Online Social Networks; Content Delivery Networks;
Network Measurements; Facebook; WhatsApp; Cellular Networks.
I.
I NTRODUCTION
A big share of today’s Internet ecosystem is shaped by
the success and influence of the most popular on-line services
(e.g., video and audio streaming, social networking, on-line
gaming, etc.). Online Social Networks (OSNs) such as Facebook make part of such highly popular services. Facebook is
the most popular and widely spread OSN in Europe and the
US, with hundreds of millions of users worldwide sharing and
accessing content on a daily basis [5]. Facebook content is
mainly hosted by the well known Akamai Content Delivery
Network (CDN) [15], which represents the most dynamic and
widely deployed CDN today, with more than 137,000 servers
in more than 85 countries across nearly 1,200 networks.
There also other types of modern OSNs which are becoming extremely popular, and are also changing the way
we use and think of the Internet. Among those, WhatsApp is
doubtlessly the leading modern OSN today. Initially developed
as an instant messaging application, WhatsApp is today a
dominant player in the communication and social sharing of
multimedia contents worldwide; with half a billion users, it
has become the fastest-growing company in history in terms
of users [1].
The research leading to these results has received funding from the European
Union under the FP7 Grant Agreement n. 318627, “mPlane”.
ISBN 978-3-901882-68-5 © 2015 IFIP
In this paper we focus on the characterization of the
traffic and the content delivery infrastructure of Facebook and
WhatsApp. While many studies have been conducted on the
analysis of the interactions among users and the popularity of
OSNs, little is known today about the networking and traffic
characteristics of such services. Shedding light on issues such
as usage patterns, content location, hosting organizations, and
addressing dynamics is highly valuable to network operators,
to better understand how these OSNs work and perform, to
better adapt and manage their own networks, and also to
have means to analyze and track their evolution inside their
networks. Our study is based on an extensive analysis of
network traffic flows observed at the core of an operational
European cellular network. The main findings of our study
are as follows:
(1) While Facebook’s content is hosted in multiple
geographical locations and it is provisioned through
highly dynamic addressing mechanisms, WhatsApp hosting
infrastructure is fully centralized at cloud servers exclusively
located in the US, independently of the geographical location
of the users. Such a geographical footprint makes users
traffic to be hosted in countries other than their local ones,
potentially raising concerns about privacy or legal jurisdiction.
(2) The highly dynamic and distributed content delivery
mechanisms used by Facebook are becoming more spread in
terms of hosting locations and hosting organizations, which
might have a direct impact on the transport costs faced by the
ISP providing the Internet access.
(3) While WhatsApp is mainly used as a text-messaging
service in terms of transmitted flows (more than 93%), videosharing accounts for about 36% of the exchanged volume
in uplink and downlink, and photo-sharing/audio-messaging
for about 38%. Such a usage of WhatsApp suggests that
the application is not only taking over the traditional SMS
service of cellular network providers, but it is also heavily
loading the access network, particularly in the uplink direction.
(4) Despite the complexity of the underlying hosting
infrastructures, traffic volumes and flows in both OSNs follow
a very predictable time-of-day pattern, enabling potential
scheduling mechanisms and dynamic traffic engineering
policies to optimize the resources of the access network for
such massive applications.
(5) Both OSNs are vulnerable to large-scale outages,
suggesting that ISPs are not always to be blamed by
customers when bad user experience events occur.
The remainder of the paper is organized as follows: Sec. II
presents an overview on the previous papers on Internet
services and OSNs characterization. Sec. III describes the
analyzed datasets and the methodologies we used in our study.
In Sec. IV we analyze the content delivery infrastructures
of both OSNs. Sec. V reports on the characterization of
the generated traffic flows, whereas Sec. VI focuses on the
content addressing and distribution dynamics. Sec. VII reviews
the occurrence of popular outages occurred in both OSNs,
complementing the traffic characterization. Discussion of the
obtained results and their practical implications are presented
in Sec. VIII. Finally, Sec. IX concludes this work.
II.
R ELATED W ORK
The study and characterization of the Internet traffic hosted
and delivered by the top content providers has gained important
momentum in the last few years [6], [7], [10], [15]. In [6],
authors show that most of today’s inter-domain traffic flows
directly between large content providers, CDNs, and the endusers, and that more than 30% of the inter-domain traffic
volume is delivered by a small number of content providers and
hosting organizations. Several studies have focused on CDN
architectures and CDN performance [10], [15]. In particular,
[10] focuses on user-content latency analysis at the Google
CDN, and [15] provides a comprehensive study of the Akamai
CDN architecture.
The analysis of OSNs has been a very fertile domain in
the last few years [19]–[24]. Authors in [19] study the powerlaw and scale-free properties of the interconnection graphs of
Flickr, YouTube, LiveJournal, and Orkut, using applicationlevel crawled datasets. In [20], authors present a study on
the privacy characteristics of Facebook. Some papers [21],
[22] study the new Google+ OSN, particularly in terms of
popularity of the OSN, as well as the evolution of connectivity
and activity among users. Authors in [23], [24] focus on the
temporal dynamics of OSNs in terms of user-interconnections
and visited links, using again public crawled data from popular
OSNs such as Facebook, Twitter, as well as a large Chinese
OSN. All these papers rely on crawled web-data and do not
take into account the traffic and networking aspects of OSNs.
In [5] we have started the analysis of the network-side characteristics of large OSNs such as Facebook, particularly focusing
on the study of the interplays among the multiple CDNs and
domains hosting and delivering the content. In this paper we
take a step further, by focusing on the temporal dynamics of
the traffic delivery and the traffic flow characteristics.
WhatsApp is a relatively new service, and its study has
been so far quite limited. Some recent papers have partially
addressed the characterization of its traffic [2], [3], but using
very limited datasets (i.e., no more than 50 devices) and
considering an energy-consumption perspective. We have been
recently working on the analysis of WhatsApp through large
scale network measurements [1], [4], considering in particular
the performance of the service, both in terms of network
throughput and quality as perceived by the end users. In [4]
we studied the Quality of Experience (QoE) requirements for
WhatsApp, reporting the results obtained from subjective QoE
lab tests. In this paper we do not focus on the performance
of WhatsApp but on its traffic and hosting infrastructure,
extending the initial results obtained in [1].
III.
DATASETS AND A NALYSIS M ETHODOLOGY
Our study is conducted on top of two large-scale network
traffic traces collected at the core of a European nationalwide cellular network in mid 2013 and early 2014. Flows
are monitored at the well known Gn interface, and analyzed
through the stream data warehouse DBStream [11]. Facebook
traffic is carried on top of HTTP (we do not consider HTTPS
for the study of Facebook, as its usage in 2013 was very
limited in mobile devices), so we rely on a HTTP-based
traffic classification tool for cellular traffic called HTTPTag
[12] to unveil the corresponding Facebook flows. HTTPTag
classification consists in applying pattern matching techniques
to the hostname field of the HTTP requests. The Facebook
dataset consists of one month of HTTP flow traces collected in
mid 2013. To preserve user privacy, any user related data (e.g.,
IMSI, MSISDN) are removed on-the-fly, whereas any payload
content beyond HTTP headers is discarded on the fly.
The WhatsApp dataset consists of a complete week of
WhatsApp traffic flow traces collected at exactly the same
vantage point in early 2014. In the case of WhatsApp all
communications are encrypted, so we extended the HTTPTag
classification tool to additionally analyze the DNS requests,
similar to [17]. In a nutshell, every time a user issues a
DNS request for a Fully Qualified Domain Name (FQDN)
associated to WhatsApp, HTTPTag creates an entry mapping
this user to the server IPs provided in the DNS reply. Each
entry is time stamped and contains the TTL replied by the
DNS server. Using these mappings, all the subsequent flows
between this user and the identified servers are assumed to be
WhatsApp flows. To avoid miss-classifications due to out-ofdate mappings, every entry expires after a TTL-based timeout. To increase the robustness of the approach, the list of
IPs is augmented by adding the list of server IPs signing
the TLS/SSL certificates with the string *.whatsapp.net.
Indeed, our measurements revealed that WhatsApp uses this
string to sign all its communications. Finally, we use reverse
DNS queries to verify that the list of filtered IPs actually
corresponds to a WhatsApp domain.
To identify the FQDNs used by the WhatsApp service, we
rely on manual inspection of hybrid measurements. We actively
generate WhatsApp text and media flows at end devices (both
Android and iOS), and passively observe them at two instrumented access gateways. We especially paid attention to the
DNS traffic generated by the devices. Not surprising, our measurements revealed that WhatsApp servers are associated to the
domain names whatsapp.net (for supporting the service)
and whatsapp.com (for the company website). In addition,
different third level domain names are used to handle different
types of traffic (control, text messages, and multimedia messages). Control and text messages are handled by chat servers
associated to the domains {c|d|e}X.whatsapp.net (X
is an integer changing for load balancing), whereas multimedia contents are handled by multimedia (mm) servers
associated to the domains mmsXYZ.whatsapp.net and
mmiXYZ.whatsapp.net for audio and photo transfers, and
mmvXYZ.whatsapp.net for videos. As we see next, chat
and mm servers have very different network footprints. While
connections to chat servers are characterized by low data-rate
and long duration (specially due to the control messages),
media transfers are transmitted in short and heavy flows.
100
90
90
80
80
70
70
60
60
% flows
% of flows
100
50
40
30
20
20
0
0
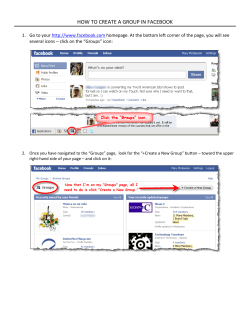
(b) Share of flows hosted per AS.
Figure 1. (a) Unique server IPs used by the top organizations/ASes hosting
Facebook and (b) flow shares per hosting AS. Akamai is clearly the key player
in terms of Facebook content delivery.
Country
Table I.
% hosted volume
Europe (generic)
46.8%
Local country
37.2%
Ireland
12.7%
Neighbor country
2.1%
United States
1.1%
Unclassified
0.1%
T OP FACEBOOK HOSTING COUNTRIES BY VOLUME .
To study the hosting infrastructures of both OSNs, we
complement the traffic datasets with the name of the organization and the Autonomous System (AS) hosting the content,
extracted from the MaxMind GeoCity databases1 .
IV.
C ONTENT D ELIVERY I NFRASTRUCTURE
We start by characterizing the Facebook dataset, with a
special focus on its underlying hosting/delivery infrastructure.
Due to the high number of daily users and the high volumes of
served traffic, Facebook uses a sophisticated content delivery
infrastructure. Indeed, we observed more than 6500 server IPs
hosting Facebook contents in our traces, distributed across 20
countries and more than 260 different ASes. This confirms
the wide-spread presence of several organizations hosting
Facebook contents. Fig. 1 shows the main organizations/ASes
hosting Facebook content, both in terms of number of unique
server IPs and share of delivered flows. Akamai is clearly the
key player in terms of Facebook content hosting, delivering
almost 50% of the flows in our traces, using more than 2260
different server IPs. Interesting enough is the large number
of server IPs observed from two organizations which actually
deliver a negligible share of the flows: the Tiscali International
Network (Tinet) and Cable & Wireless Worldwide (CWW). We
believe these organizations are only caching spurious Facebook
contents. In the remainder of the study we focus on the top 5
organizations/ASes in terms of served flows, depicted in Fig.
1(b): Akamai, Facebook AS, the Local Operator (LO) which
hosts the vantage point, and two Neighbor Operators, NO1 and
NO2.
In the case of WhatsApp, we observed a total of 386 unique
server IPs hosting the service, belonging to a single AS called
SoftLayer (AS number 36351)2 . To avoid biased conclusions
about the set of identified IPs from a single vantage point, we
performed an active measurements campaign using the RIPE
1 MaxMIND
2 SoftLayer:
GeoIP Databases, http://www.maxmind.com.
Cloud Servers, http://www.softlayer.com
40
30
10
(a) Server IPs per AS.
50
10
10
20
30
min RTT (ms)
40
50
(a) min RTT to all Facebook server IPs.
0
100
105
110
min RTT (ms)
115
120
(b) min RTT to all WhatsApp server IPs.
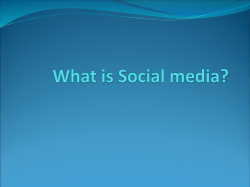
Figure 2. Distribution of overall min RTT to Facebook and WhatsApp server
IPs, weighted by the number of flows hosted.
Atlas measurement network3 , where we analyzed which IPs
were obtained when resolving the same FQDNs from 600
different boxes distributed around the globe during multiple
days. These active measurements confirmed that the same set
of IPs is always replied, regardless of the geographical location
of the requester. SoftLayer is a US-based cloud infrastructure
provider, consisting of 13 data centers and 17 Points of
Presence (PoPs) distributed worldwide.
A. Geographical Diversity of Content Hosting Servers
Tab. I provides an overview of the geographical diversity
of the Facebook hosting infrastructure, listing the top countries
where servers are located in terms of volume. Servers’ location
is extracted from the MaxMind GeoCity database, which is
highly accurate at the country level [25]. “Europe (generic)”
refers to a generic location within Europe for which MaxMind
did not return a more accurate information. Almost 99% of
the traffic comes from servers and data centers located in
Europe, close to our vantage point, while only 1% of the
traffic comes from other continents. This is due to three
factors: (i) Akamai, the biggest Facebook content provider, has
a very geographically distributed presence, pushing contents
as close as possible to end-users [15]; (ii) operators heavily
employ local content caching, and large CDNs like Akamai
tend to deploy servers inside the ISPs’ networks, explaining
the amount of traffic coming from the local country of the
vantage point; (iii) the rest of the traffic is handled directly by
Facebook, which has servers split between Ireland (headquarter
of Facebook International) and the US.
The WhatsApp hosting infrastructure is completely different. Following the same approach, we observed that despite its
geographical distribution, WhatsApp traffic is handled mainly
by data centers in Dallas and Houston, being as such a fully
centralized US-based service. While this is likely to change in
the future after Facebook’s WhatsApp acquisition, right now,
all messages among users outside the US are routed through
the core network, unnecessarily consuming additional network
resources and potentially impacting the quality of the service.
To complement the hosting picture of both services, we
investigate the location of the servers from a network topology
perspective, considering the distance to the vantage point in
terms of Round Trip Time (RTT). The RTT to any specific IP
address consists of both the propagation delay and the processing delay. Given a large number of RTT samples to a specific
IP address, the minimum RTT values are an approximated
3 The
RIPE Atlas measurement network, https://atlas.ripe.net/
1000
1000
All
Akamai
Facebook
NO1
NO2
350
800
600
400
all IPs
mm
mmv
mmi
mms
chat
web
300
250
600
srv IPs
SRV IPs per hour
SRV IPs per hour
800
400
200
150
100
200
200
0
0
50
2
4
6 8 10 12 14 16 18 20 22 24
Time of day (hourly time bins)
(a) # hourly unique IPs in Facebook.
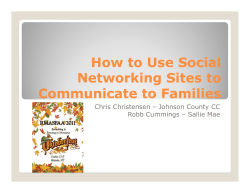
Figure 3.
2
4
6 8 10 12 14 16 18 20 22 24
Time of day (hourly time bins)
(b) # hourly unique IPs in WhatsApp.
0
00
12
time (10 min resolution)
00
(c) # IPs in WhatsApp per content type.
Active servers daily hosting Facebook and WhatsApp. Server IPs used by WhatsApp are further discriminated by type of content.
Service
AS/Organization
# IPs
#/24
#/16
Facebook
All
Akamai
Facebook AS
LO
NO1
NO2
6551
2264
294
26
368
374
891
132
57
8
26
33
498
48
5
6
14
9
WhatsApp
SoftLayer (AS 36351)
386
51
30
Table II.
N UMBER OF IP S AND PREFIXES HOSTING FACEBOOK AND
W HATS A PP. P REFIXES ARE NOT FULLY COVERED / OWN BY THE AS ES BUT
USED FOR AGGREGATION AND COUNTING PURPOSES .
measure of the propagation delay, which is directly related to
the location of the underlying server. Cellular networks usually
employ Performance Enhancement Proxies (PEPs) to speed-up
HTTP traffic, and therefore, passive min RTT measurements on
top of HTTP traffic provide incorrect results [16]. We therefore
consider an active measurement approach, running standard
pings from the vantage point to get an estimation of the min
RTT to the servers, similar to [8].
Fig. 2 plots the cumulative distribution of the minimum
RTT to (a) the server IPs hosting Facebook and (b) the server
IPs hosting WhatsApp. Values are weighted by the number
of flows served from each IP, to get a better picture of
where the traffic is coming from. As a further confirmation
of the geographical diversity in Facebook, the distribution
of min RTT presents some steps or “knees”, suggesting the
existence of different data centers and/or hosting locations.
The largest majority of Facebook flows are served by close
serves, located at less than 5 ms from the vantage point. In the
case of WhatsApp, the min RTT is always bigger than 100ms,
confirming that WhatsApp servers are located outside Europe.
Fig. 2(b) shows that the service is evenly handled between two
different yet potentially very close locations at about 106 ms
and 114 ms, which is compatible with our previous findings
of WhatsApp servers located in Dallas and Houston.
B. IP Address Space of Content Servers
We study now the server diversity through an analysis of
the IP address spaces covered by both OSNs as observed in
our traces. Tab. II summarizes the number of unique server IPs
hosting Facebook and WhatsApp, as well as the /24 and /16
IP blocks or prefixes covered by the top organizations hosting
Facebook and WhatsApp. Akamai and Facebook together
account for about 2560 servers scattered around almost 200
/24 IP blocks, revealing again their massively distributed
infrastructure. Even if WhatsApp servers are geographically
co-located, the range of server IPs handling the content is
highly distributed, and consists of 386 unique IPs covering
51 different /24 prefixes. However, only a few of them are
actually hosting the majority of the flows, and the same
happens for Facebook.
Fig. 3 shows the daily usage of these IPs on a single day,
considering the number of unique server IPs per hour. The
number of active IPs serving Facebook flows from Akamai
follows the daily utilization of the network, peaking at the
heavy-load time range. Interestingly, the IPs exposed by Facebook AS are constantly active and seem loosely correlated with
the network usage. This comes from the fact that Facebook AS
servers normally handle all the Facebook dynamic contents [7],
which include the user sessions keep-alive. Something similar
happens in WhatsApp, where the number of active IPs remains
practically constant during the day, mainly due to the same
keep-alive effect of chat and control sessions. However, if we
look a bit closer, we can see some important differences when
separately analyzing WhatsApp chat and mm servers.
Fig. 3(c) shows the dynamics of the active IPs used by
WhatsApp on a single day, but using now a finer-grained
temporal aggregation of 10 minutes instead of one hour, and
discriminating by server type. The mm category is further split
into photos/audio (mmi and mms) and video (mmv). Note that
no less than 200 IPs are active even in the lowest load hours.
When analyzing the active IPs per traffic type, we observe
that more than 200 IPs serve WhatsApp mm flows during
peak hours. In addition, we see how all the chat servers are
constantly active (there are about 150 of them), as they keep
the state of active devices to quickly push messages.
V.
N ETWORK T RAFFIC A NALYSIS
Let us know focus on the characteristics of the traffic flows
carrying Facebook and WhatsApp contents. Fig. 4 depicts the
volume share of Facebook contents hosted by each org./AS,
as well as the flow size distributions. Akamai hosts more than
65% of the total volume observed in our traces, followed by
Facebook AS itself with about 19%. Comparing the volume
shares in Fig. 4(a) with the flow shares in Fig. 1(b) evidences a
clear distinction on the content sizes handled by both Akamai
and Facebook AS: while Akamai hosts the bigger flows,
Facebook AS serves only a small share of the service content.
features
100
chat
mm
mmv
mmi
mms
# bytesdown
16.6%
83.0%
38.8%
12.8%
29.8%
# bytesup
29.5%
70.2%
35.2%
15.0%
17.9%
# flows
93.4%
6.2%
0.3%
2.9%
2.9%
60.6%
76.3%
75.1%
70.0%
81.9%
90
80
% flows
70
60
50
40
Akamai
Facebook
LO1
NO1
NO2
30
20
10
0
−3
10
(a) Shares of hosted volume per org./AS.
Figure 4.
−2
−1
10
10
Flow Size (MB − log scale)
# bytesdown
# bytesdown+up
Table III.
0
10
(b) Distribution of flow sizes.
Hosted volume and distribution of flow sizes per organization.
Indeed, as previously flagged by other studies [7], Akamai
serves the static contents of the Facebook service (e.g., photos,
songs, videos, etc.), whereas the Facebook AS covers almost
exclusively the dynamic contents (e.g., chats, tags, session
information, etc.).
To further explore this distinction, Fig. 4(b) reports the
distribution of the flow sizes served per organization. The
CDF reveals that Akamai clearly serves bigger flows than
Facebook AS. The remaining ASes tend to host bigger flows
than Facebook AS, which is coherent with the fact that ISPs
caching is generally done for bigger objects, aiming at reduce
the load on the core network.
In terms of WhatsApp traffic, Fig. 5 reports the characteristics of the corresponding flows in terms of size and duration.
Fig. 5(a) shows a scatter plot reporting the flow duration vs.
the flow size, discriminating by chat and mm flows. Whereas
mm messages are sent over dedicated connections, resulting
in short-lived flows, text messages are sent over the same
connection used for control data, resulting in much longer
flows. For example, some chat flows are active for as much as
62 hours. Fig. 5(b) indicates that more than 50% of the mm
flows are bigger than 70 KB, with an average flow size of 225
KB. More than 90% of the chat flows are smaller than 10 KB,
with an average size of 6.7 KB. In terms of duration, Fig. 5(c)
shows that more than 90% of the mm flows last less than 1
min (mean duration of 1.8 min), whereas chat flows last on
average as much as 17 minutes. The flow duration distribution
additionally reveals some clear steps at exactly 10, 15 and
24 minutes, suggesting the usage of an application time-out
to terminate long idle connections. This behavior is actually
dictated by the operating system of the device [1].
VI.
VOLUME AND FLOWS PER TRAFFIC CATEGORY.
C ONTENT D ELIVERY DYNAMICS
The characterization performed in previous sections mainly
considers the static characteristics of the traffic delivery in both
OSNs. In this section we focus on the temporal dynamics of
the content delivery. Fig. 6 shows the dynamics of WhatsApp
for three consecutive days, including the fraction of flows and
traffic volume shares, discriminating by chat and mm traffic.
Fig. 6(a) shows the flow count shares, revealing how chat flows
are clearly dominating. Once again we stop in the mmi and
mms servers, which seem to always handle the same share of
flows, suggesting that both space names are used as a mean
to balance the load in terms of photos and audio messages.
Finally, Figs. 6(b) and 6(c) reveal that even if the mm volume
is higher than the chat volume, the latter is comparable to the
photos and audio messaging volume, specially in the uplink.
Tab. III summarizes these shares of flows and traffic volume.
Given that the content delivery infrastructure of Facebook
is much richer then the one of WhatsApp in terms of geographical distribution, we study now the temporal evolution of
the servers selected for provisioning the Facebook flows. To
begin with, we focus on the temporal evolution of the min
RTT, as reported in Fig. 2. Fig. 7(a) depicts the temporal
variation of the CDF for all the Facebook flows and for a
complete day, considering a single CDF every three hours
period. The CDFs are rather stable during the day, but present
some slight variations during the night and early morning. To
get a better picture of such dynamics, Fig. 7(b) depicts the
hourly evolution of the min RTT for all the Facebook flows
during 3 consecutive days, being the first day the one analyzed
in Fig. 7(a). Each column in the figure depicts the PDF of
the min RTT for all the served flows, using a heat map-like
plot (i.e., the darker the color, the more concentrated the PDF
in that value). The flagged variations are observed during the
first day, with some slight shifts between 6am and 12am from
servers at 14ms and 20ms. The heat map also reveals some
periodic flow shifts between 9pm and midnight from servers
at 20ms, but impacting a small fraction of flows. Fig. 7(c)
presents the same type of heat map for Facebook flows, but
considering a dataset of 2012 from the same vantage point
[8]. The temporal patterns in 2012 show a much stronger
periodic load balancing cycle, focused in a small number of
hosting regions at 7ms, 14ms, and 37ms. Comparing the results
from 2012 with those in 2013 suggests that Facebook content
delivery is becoming more spread in terms of hosting locations,
and load balancing cycles are becoming a-priori less marked.
However, when deeply analyzing the complete dataset of 2013,
conclusions are rather different.
To drill down deeply into this issue, we analyze the
dynamics of the content delivery for the complete Facebook
dataset, spanning 28 consecutive days. Instead of considering
the variations of the min RTT, we consider now the variations
on the number of flows served by the observed IPs. Changes
in the distribution of the number of flows coming from the
complete set of 6551 server IPs reflect variations in the way
content is accessed and served from the hosting infrastructure
observed in our traces. For this analysis, we consider a time
granularity of one hour, and therefore compute the distribution
of the number of flows provided per server IP in consecutive
time slots of one hour, for the complete 28 days. This results
in a time-series with a total of 24 × 28 = 672 consecutive
distributions. To quantify how different are two distributions in
the resulting time-series, we use a symmetric and normalized
version of the Kullback-Leibler divergence described in [13].
To visualize the results of the comparison for the complete
time span of 28 days, we use a graphical tool proposed
in [13], referred to as Temporal Similarity Plot (TSP). The
TSP allows pointing out the presence of temporal patterns
and (ir)regularities in distribution time-series by graphical
90
80
80
70
70
60
60
% flows
100
90
% flows
100
50
40
30
all flows
chat
mm
10
0 0
10
1
10
(a) Flow duration vs. size.
2
10
flow size (KB)
3
20
0
0
4
10
all flows
chat
mm
10
10
10
(b) Flow size.
20
flow duration (min)
30
40
(c) Flow duration.
Characterization of WhatsApp flows. Whereas mm messages are sent over short-lived flows, text messages result in longer and much smaller flows.
100
all IPs
mm
mmv
mmi
mms
chat
80
70
60
100
all IPs
mm
mmv
mmi
mms
chat
90
bytes down (normalized)
90
50
40
30
20
10
80
70
60
80
50
40
30
20
12
00
12
00
time (10 min resolution)
12
60
50
40
30
10
0
00
00
70
20
10
0
00
all IPs
mm
mmv
mmi
mms
chat
90
bytes up (normalized)
100
num flows (normalized)
40
30
20
Figure 5.
50
12
(a) Flows.
00
12
00
time (10 min resolution)
12
0
00
00
12
00
12
00
time (10 min resolution)
(b) Bytes down.
12
00
(c) Bytes up.
Figure 6. WhatsApp traffic dynamics. mmi and mms servers constantly handle the same share of flows, suggesting that both space names are used as a means
to balance the load in terms of photos and audio messages.
40
90
35
80
min RTT (ms)
% flows
60
0−3
3−6
6−9
9−12
12−15
15−18
18−21
21−24
50
40
30
20
10
35
10
20
30
min RTT (ms)
40
30
25
60
20
40
15
10
20
5
50
(a) min RTT daily dynamics in 2013.
0
00
40
80
30
70
0
0
100
min RTT (ms)
100
25
20
15
10
5
12
00
12
00
Time of the day (hour)
12
00
(b) min RTT dynamics in 2013
0
0
00
12
00
12
00
Time of the day (hour)
12
00
(c) min RTT dynamics in 2012
Figure 7. Temporal variations of the min RTT to Facebook servers. In the heat maps of Figs. (a) and (c), the darker the color, the bigger the fraction of flows
served from the corresponding min RTT value.
inspection. In a nutshell, a TSP is a symmetrical heatmaplike plot, in which the value {i, j} reflects how similar are
the two distributions at time ti and tj . We refer the interested
reader to [13] for a detailed description of the TSP tool.
Fig. 8 gives an example of TSP for the distributions of all
the Facebook flows across all the server IP addresses providing
Facebook content, over the 28 days. Each plot is a matrix
of 672 × 672 pixels; the color of each pixel {i, j} shows
how similar are the two distributions at times ti and tj : blue
represents low similarity, whereas red corresponds to high
similarity. By construction, the TSP is symmetric around the
45◦ diagonal, and it can be interpreted either by columns or by
rows. For example, if we read the TSP by rows, for every value
j in the y-axis, the points to the left [right] of the diagonal
represent the degree of similarity to past [future] distributions.
The three TSPs in Fig. 8 represent the distribution variations for (a) all the observed IPs, (b) the Akamai IPs and (c) the
Facebook AS IPs. Let us begin by the TSP for all the observed
server IPs in Fig. 8(a). The regular “tile-wise” texture within
periods of 24 hours evidences the presence of daily cycles, in
which similar IPs are used to serve a similar number of flows.
The lighter zones in these 24 hour periods correspond to the
time of the day, whereas the dark blue zones correspond to
the night-time periods when the traffic load is low. The low
similarity (blue areas) at night (2am-5am) is caused by the
low number of served flows, which induces larger statistical
fluctuations in the computed distributions. This pattern repeats
almost identical for few days, forming multiple macro-blocks
(a) All IPs hosting Facebook
(b) Akamai
(c) Facebook AS
HTTP 5XX error messages
0.6
0.4
0.2
0
06:00
12:00
18:00
00:00
06:00
12:00
18:00
00:00
400
Akamai
Facebook
LO
NO
300
200
100
0
06:00
12:00
18:00
00:00
06:00
time [hh:mm]
12:00
18:00
00:00
(a) Facebook outages in September 2013.
Volume (bytes/time bin) − norm
To get a better understanding of such behaviors, Figs. 8(b)
and 8(c) split the analysis for Akamai and Facebook AS IPs
only. The figures reveal a different (re)usage policy of the
IPs hosting the contents. In particular, Akamai uses the same
servers for 4 to 7 days (see multi-days blocks around the main
diagonal). When it changes the used addresses, the shift is not
complete as we can observe the macro-blocks slowly fading
out over time. This suggests a rotation policy of the address
space of Akamai, on a time-scale of weeks. On the other hand,
Facebook AS does not reveal such a clear temporal allocation
policy. It alternates periods of high stability (e.g. between days
4 and 10) with highly dynamic periods (e.g., from day 18
onward). It is interesting noticing that Facebook AS is the
responsible for the abrupt change in the distributions observed
from the 18th day on, in the TSP of the overall traffic.
1
0.8
HTTP 5XX error messages
around the main diagonal of size ranging from 2 up to 6 days.
This suggests that during these periods, the same sets of IPs
are used to deliver the flows, with slight variations during
the night periods, similarly to what we observed in Fig. 7(a).
However, the analysis of the entire month reveals the presence
of a more complex temporal strategy in the (re)usage of the
IP address space. For example, there is a reuse of (almost)
the same address range between days 10-12 and days 1516. Interestingly, we observe a sharp discontinuity on days
18-19, as from there on, all the pixels are blue (i.e., all the
distributions are different from the past ones).
Volume (bytes/time bin) − norm
Figure 8. TSP of hourly flow count distributions over 28 days for all the observed IPs hosting Facebook, Akamai IPs, and Facebook AS IPs. A blue pixel at
{i, j} means that the distributions at times ti and tj are very different, whereas a red pixel corresponds to high similarity.
1
0.8
0.6
0.4
0.2
0
06:00
12:00
18:00
00:00
06:00
12:00
18:00
00:00
Akamai
Facebook
LO
NO1
80
60
40
20
0
06:00
12:00
18:00
00:00
06:00
12:00
18:00
00:00
time [hh:mm]
VII.
A NALYSIS OF L ARGE -S CALE O UTAGES ON OSN S
The complex and large-scale server architectures used by
Facebook and WhatsApp are not flawless and in some cases
the service goes down, heavily impacting the users. The last
part of the study focuses on the analysis of some of these
major outages detected in Facebook and WhatsApp traffic.
Fig. 9(a) depicts a very interesting event we detected in the
Facebook traffic served by Akamai, using the methodologies
and tools presented in [9]. As we discovered in [9], this event
corresponds to a large outage in Akamai servers during a time
frame of about 2 hours in September 2013. The total volume
served by Akamai, Facebook AS and LO abruptly drops during
this outage, being Akamai the organization showing the highest
change. No other organization takes over the dropped traffic,
suggesting the occurrence of an outage.
(b) Facebook outages in October 2013.
Figure 9. Outages in Facebook. In both (a) and (b), the upper Fig. shows the
downlink traffic volume per AS, and the lower one shows the HTTP server
error message counts (e.g. 5XX).
To further understand the root causes of the abrupt drop,
Fig. 9(a) additionally plots the time series of the count
of HTTP server error messages (i.e., 5XX HTTP answers)
corresponding to the Facebook HTTP flows served by the
aforementioned ASes. The high increase in the counts for
Akamai is impressive, meaning that during the volume drop,
the HTTP web traffic hosted by Akamai was not available for
many of users. The increase of the 5XX messages continues for
about half an hour after the apparent recovery, flagging some
transient effects which might be linked to the re-start of some
servers. Interestingly, there are no noticeable variations in the
counts for the other ASes, suggesting that the outage is only
Fig. 10 depicts the time series of the share of bytes
exchanged with the servers, the share of flows, as well as
the number of error tweets during two consecutive days
encompassing the outage. The traffic drastically dropped on
the 22nd at around 19:00 CEST (event B), and slowly started
recovering after midnight, with some transient anomalous
behaviors in the following hours (events C and D). Traffic
volumes in both directions did not drop completely to zero
but some non-negligible fraction of the traffic was still being
exchanged, suggesting an overloading problem of the hosting
infrastructure. In terms of number of flows, there is a clear
ramp-up on the flow counts. Very interestingly, there is a
clear correlation between the events B, C and D and the
number of WhatsApp-related error tweets. Users reacted in
the OSN immediately after the beginning of the outage, with
the viral effect reaching its highest point after one hour. There
is an additional outage event marked as A, which is clearly
observable in the error tweet counts and has exactly the same
signature of events B, C and D, i.e., a drop in the traffic volume
and an increase in the flows count.
VIII.
D ISCUSSION AND I MPLICATIONS OF R ESULTS
Let us now focus on the interpretation of the findings
presented so far. In this section we provide a comprehensive
discussion of the main take aways of the study, and particularly
elaborate on their implications for network dimensioning, operation and management tasks. Discussion is structured along
five specific topics covering the contributions flagged in Sec. I:
(i) geographical location of OSN servers and contents; (ii)
dynamics of the content delivery; (iii) traffic characteristics;
(iv) dynamics of the OSNs’ usage; (v) robustness of the OSNs.
A. Geolocation of OSN Servers
Finding: our study reveals that even if both OSNs are very
popular worldwide, their networking hosting infrastructures
follow very different paradigms: based on Akamai’s pervasiveness, Facebook is hosted by a highly distributed network
architecture, whereas WhatsApp follows a fully centralized
4 http://www.theguardian.com/technology/2013/oct/21/facebook-problemsstatus-updates
5 https://downdetector.com/
bytes down (%)
50
bytes down
bytes up (%)
100
50
bytes up
100
# flows (%)
To conclude, we focus on the analysis of the major WhatsApp worldwide outage reported since its beginning as observed in our traces. The outage occurred in February the 22nd
of 2014, and had a strong attention in the medias worldwide.
The event is not only clearly visible in our traces, but can
also be correlated with the user reactions on social networks.
Through the online downdetector service5 , and following the
approach proposed in [18], we accessed and processed the
counts of tweeter feeds containing the keyword “whatsapp”,
coupled with keywords reflecting service impairments such as
“outage”, “is down”, etc.. We refer to these as error tweets.
100
# total flows
50
0
1.000
# error tweets
part of the Akamai CDN and is not related to the Facebook
service itself. Fig. 9(b) shows a second outage of very similar
characteristics detected about one month later, suggesting that
the Facebook OSN is prone to bad experience issues. According to an international press release4 , this Facebook outage
was caused by maintenance issues, and impacted millions of
Facebook users on more than 3.000 domains.
A
B C
D
500
error tweets
0
0
6
12
18
0
6
time (hours)
12
18
0
Figure 10. The WhatsApp worldwide outage. The traffic trends suggest an
overloading problem of the hosting infrastructure.
hosting architecture at cloud servers exclusively located in the
US, independently of the geographical location of the users.
Implications: the first direct implication is in terms of service
performance. WhatsApp flows suffer an important additional
latency for users outside the US, which might impact their
Quality of Experience. Being Brazil, India, Mexico and Russia
the fastest growing countries in terms of users6 , such a centralized hosting infrastructure is likely to become a problematic
bottleneck in the near future. On the contrary, Facebook latency
due to propagation is highly reduced, enabling the usage of
latency-sensitive applications on top of this OSN (e.g., video
conversations or cloud gaming). The second implication is in
terms of traffic management. The Softlayer servers identified in
the study are exclusively used by WhatsApp, making it very
simple for an ISP to identify WhatsApp flows by server IP
address, similarly to [8]. While we do not expect it to happen,
a cellular ISP might intentionally degrade the performance of
WhatsApp flows to discourage its usage, similarly to what
many operators have done in the past with Skype traffic7 .
The final implication is about data privacy. The geo-location
of OSN servers makes users traffic to be hosted in countries
other than their local ones, thus data locality is probably not
maintained (in the case of WhatsApp, this is 100% confirmed).
In the light of the ever increasing concerns related to privacy
and data security, such a geographical distribution might even
cause legal jurisdiction issues due to different data privacy
protection laws in different countries.
B. Content Delivery Dynamics
Finding: the highly dynamic and distributed content delivery
mechanisms used by Facebook are becoming more spread in
terms of hosting locations and hosting organizations.
Implications: this makes of Facebook a very challenging
source of traffic for network dimensioning and traffic engineering. Indeed, it is very difficult for an ISP to properly engineer
its own network when surges of traffic come from potentially
6 WhatsApp
7 “Comcast
Blog, http://blog.whatsapp.com/
Blocks Some Internet Traffic”, the Whashington Post, 2007.
multiple ingress nodes at different times of day. A proper traffic
engineering policy must therefore be dynamic as well, to cope
with such traffic delivery behavior. Delivery dynamics might
even have an impact on the transport costs faced by the ISP
providing the Internet access; as we show in [5], traffic being
served from other neighboring ISPs for which uni-directional
peering agreements have been established results in extra costs
for the local ISP.
C. OSN Traffic
Finding: WhatsApp is not only about text-messaging, but
more than 75% of its traffic corresponds to multimedia file
sharing, both in the uplink and downlink directions.
Implications: the growing popularity of WhatsApp in cellular
networks might cause a serious performance issue for ISPs,
specially in the uplink direction, where resources are scarcer.
On the other hand, given that multimedia contents are static
and that many of them are shared multiple times among
WhatsApp groups, the usage of local caching techniques might
result in important savings and performance enhancement.
addressing mechanisms, the WhatsApp hosting infrastructure
is fully centralized at cloud servers exclusively located in the
US, independently of the geographical location of the users.
The Facebook analysis revealed a very structured yet
tangled architecture hosting the service, mainly due to the
pervasiveness and distributed nature of Akamai, its hosting
CDN. We have fully dissected the nicely structured internal
naming scheme used by WhatsApp to handle the different
types of connections, which shall enable an easy way to
monitor its traffic in the network. In addition, we have provided
an analysis of outages in Facebook and WhatsApp which
might have a very strong impact on the experience of its
users, evidencing that the networking architectures hosting
such large-scale services are not flawless but prone to errors
and anomalies.
We believe that the characterization provided in this paper
offers a sound basis to network operators to understand the
traffic dynamics behind popular OSNs, enabling a better traffic
engineering and network management for such applications.
R EFERENCES
D. OSN Usage Patters
[1]
P. Fiadino et al., “Vivisecting WhatsApp through Large-Scale Measurements in
Mobile Networks”, in SIGCOMM, 2014.
Finding: traffic volumes and flows in both OSNs follow a
very predictable time-of-day pattern, commonly observed in
user-generated traffic.
[2]
E. Vergara et al., “When Mice Consume Like Elephants: Instant Messaging
Applications”, in e-Energy, 2014.
[3]
A. Aucinas et al., “Staying Online While Mobile: The Hidden Costs”, in CoNEXT,
2013.
Implications: even if not simple to achieve, this type of
patterns suggest that an ISP might better optimize the resources
of the access network through time-based traffic engineering
mechanisms, dynamically adjusting network resources based
on load predictions for both OSNs.
[4]
P. Fiadino et al., “Vivisecting WhatsApp in Cellular Networks: Servers, Flows,
and Quality of Experience”, to appear in TMA, 2015.
[5]
P. Fiadino et al., “Characterizing Web Services Provisioning via CDNs: The Case
of Facebook”, in TRAC, 2014.
[6]
[7]
[8]
C. Labovitz et al., “Internet Inter-domain Traffic”, in SIGCOMM, 2010.
V. Gehlen et al., “Uncovering the Big Players of the Web”, in TMA, 2012.
P. Casas et al., “IP Mining: Extracting Knowledge from the Dynamics of the
Internet Addressing Space”, in ITC, 2013.
[9]
P. Fiadino et al., “On the Detection of Network Traffic Anomalies in Content
Delivery Network Services”, in ITC, 2014.
[10]
R. Krishnan et al., “Moving Beyond End-to-End Path Information to Optimize
CDN Performance”, in IMC, 2009.
[11]
A. B¨ar et al., “Large-Scale Network Traffic Monitoring with DBStream, a System
for Rolling Big Data Analysis”, in BigData, 2014.
[12]
P. Fiadino et al., “HTTPTag: A Flexible On-line HTTP Classification System for
Operational 3G Networks”, in INFOCOM, 2013.
[13]
A. D’Alconzo et al., “Distribution-based Anomaly Detection in 3G Mobile
Networks: from Theory to Practice”, in Int. J. Network Management 20, 2010.
[14]
P. Casas et al., “When YouTube Does not Work - Analysis of QoE-Relevant
Degradation in Google CDN Traffic”, in IEEE TNSM, vol. 11(4), 2014.
E. Nygren et al., “The Akamai Network: A Platform for High-Performance Internet
Applications”, in ACM SIGOPS 44(3), 2010.
A. Botta et al., “Monitoring and Measuring Wireless Network Performance in the
Presence of Middleboxes”, in WONS, 2011.
I. Bermudez et al., “DNS to the rescue: Discerning Content and Services in a
Tangled Web”, in IMC, 2012.
E. OSN Robustness
Finding: despite their massive delivery infrastructures and
popularity, both OSNs are vulnerable to large-scale outages.
Implications: the first implication is more a learning - the
poorly-distributed hosting architecture of WhatsApp might
become a single point of failure for such a worldwide service,
as evidenced by the major WhatsApp blackout. Attacking the
core WhatsApp servers through a Distributed Denial of Service
attack could potentially cause huge harm to the service. The
most important implication for the ISP is that his own network
is not always to be blamed as the source of bad Quality of
Experience by its customers. As we show in [14], customers
tend to complain to their ISP when such bad performance
events occur, as they see it difficult for massive services such
as YouTube, Facebook, WhatsApp, etc. to go down.
IX.
[15]
[16]
[17]
[18]
[19]
L. Grimaudo et al., “TUCAN: Twitter User Centric ANalyzer”, in ASONAM, 2013.
A. Mislove et al., “Measurement and Analysis of Online Social Networks”, in
IMC, 2007.
[20]
Y. Liu et al., “Analyzing Facebook Privacy Settings: User Expectations vs.
Reality”, in IMC, 2011.
G. Magno et al., “New Kid on the Block: Exploring the Google+ Social Graph”,
in IMC, 2012.
C ONCLUDING R EMARKS
In this paper we presented a characterization of the networking aspects of Facebook and WhatsApp, the most popular
OSNs in western countries. Through the analysis of two largescale traffic traces collected at the cellular network of a major
European ISP, we dissected and compared the networking
behavior of both OSNs, considering not only the traffic flows
but also the network infrastructures hosting them. We showed
that while Facebook’s content is hosted in multiple geographical locations and it is provisioned through highly dynamic
[21]
[22]
[23]
[24]
[25]
R. Gonzalez et al., “Google+ or Google-? Dissecting the Evolution of the New
OSN in its First Year”, in WWW, 2013.
X. Zhao et al., “Multi-scale Dynamics in a Massive Online Social Network”, in
IMC, 2012.
M. Allamanis et al., “Evolution of a Location-based Online Social Network:
Analysis and Models”, in IMC, 2012.
I. Poese et al., “IP Geolocalization Databases: Unreliable?”, in ACM CCR, 2011.


© Copyright 2026