
EARTHQUAKES - Food & Water Watch
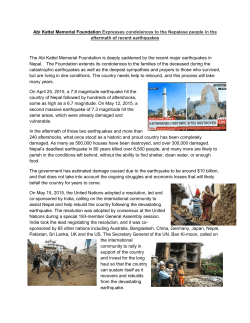
FRACKING AND EARTHQUAKES Issue Brief • May 2015 F racking, a process that intentionally causes thousands of “microearthquakes” when the rock containing oil or gas is fractured apart,1 is shaking things up — literally. Fracking,2 along with the disposal of toxic fracking waste through underground injection control wells,3 has been linked to induced seismicity — in other words, to human-caused earthquake activity.4 Although fracking itself can cause earthquakes, they are smaller and less frequently felt than earthquakes produced from underground injection control wells.5 A study in Seismological Research Letters found that fracking was the likely culprit of hundreds of small tremors in Ohio during 20136; another Ohio-based study that came out in 2015 pinpointed fracking as the cause of a 3.0 magnitude earthquake near Poland Township.7 In 2011, fracking was associated with a 3.8 magnitude earthquake in British Columbia, Canada8; that same year, in Blackpool, England, two earthquakes were directly linked to fracking operations.9 Fracking has also been linked to an earthquake that was felt in Garvin County, Oklahoma in 2011.10 the U.S. Geological Survey (USGS), this increased seismic activity is associated with wastewater disposal wells in states such as Oklahoma, Colorado, Arkansas, Ohio and Texas.13 The threat of increased earthquake activity is also of concern for the seismically active state of California, where the Monterey Shale overlaps the San Andreas Fault.14 Induced seismicity occurs when human activity triggers a dormant fault by adding or reducing stress and/or increasing pore pressure.15 When fluid is injected underground — as is done to fracture shale rock and for the disposal of fracking waste water — it can lubricate fault zones. As fluid moves into a fault zone, pore pressure increases, which can cause the fault to slip and result in an earthquake.16 More typically when talking about fracking-related earthquakes, the conversation is referring to the seismic events triggered by injection wells,11 a common method of disposal for fracking waste. In the eastern and central United States, earthquake activity has increased about fivefold, from an annual average of 21 earthquakes above a 3.0 magnitude between 1967 and 2000, to more than 300 earthquakes over three years from 2010 to 2012.12 According to scientists with It’s important to note that induced seismic events may not always strike soon after the injection activity begins; it may take a long time for an earthquake to trigger, and sometimes not until after the injection activity has ended.17 Fluid pressure from high-rate disposal wells can migrate, so even if an injection well is not very close to a fault line or to one that is susceptible to earthquakes, the fluid pressure can migrate long distances to reach a fault that is more susceptible.18 Food & Water Watch • 1616 P Street, NW, Suite 300 • Washington, DC 20036 • foodandwaterwatch.org Oklahoma Historically, Oklahoma is not a state known for its seismic activity. From 1975 to 2008, Oklahoma averaged only one to three 3.0 magnitude (or greater) earthquakes annually, but from 2009 to mid-2013, this annual average grew to about 40.19 As a 2014 Cornell University study points out, wastewater injection nearly doubled in central Oklahoma between 2004 and 2008.20 Katie Keranen, Cornell University geophysics professor and lead researcher of the study, explains: “Because we have such high volumes [of waste water] going in, the rocks are quite permeable, and the pressure is able to propagate to really far distances. If the fault is ready to fail, it doesn’t take a lot of change in pressure to trigger an earthquake.”21 Oklahoma Earthquake Trends22 • Oklahoma experienced a fivefold increase in magnitude 3.0 or greater earthquakes from 2013 to 2014. • From 2013 to 2014, the number of all earthquakes increased by 90 percent. • In 2014, there were 290 times more magnitude 3.0 or greater earthquakes than in 2005. • From 2009 to 2013, underground injection volumes increased by 50 percent.* Seismicity continues to skyrocket. As noted in a joint statement by the USGS and the Oklahoma Geological Survey, from October 2013 to May 2014, the rate of earthquakes increased by almost 50 percent.23 Previously, Oklahoma was ranked only 19th for seismic activity in the United States, based on averages from 1974 to 2003 of 3.5 or greater magnitude earthquakes.24 Within a year, the number of magnitude 3.0 or • Since 1997, underground injection volumes have increased by at least 160 percent.* * The actual increase is likely higher because data on the 2013 volume are incomplete, according to the Oklahoma Corporation Commission. Mechanics of Induced Earthquakes &KDQJHVLQVROLGVWUHVVGXHWR ȵXLGH[WUDFWLRQRULQMHFWLRQV SRURWKHUPRHODVWLFHHFWV FKDQJHVLQJUDYLWDWLRQDOORDGLQJ 'LUHFWȵXLGSUHVVXUH HHFWVRILQMHFWLRQV ȵXLGSUHVVXUHGLXVLRQ 3HUPHDEOH UHVHUYRLUDTXLIHU 9ROXPHDQGRUPDVVFKDQJH :HOO )DXOW )DXOW 3HUPHDEOH UHVHUYRLUDTXLIHU ΖQFUHDVHLQSRUH SUHVVXUHDORQJIDXOW UHTXLUHVKLJKSHUPHDELOLW\ SDWKZD\ &KDQJHLQORDGLQJ FRQGLWLRQVRQIDXOW QRGLUHFWK\GURORJLF FRQQHFWLRQUHTXLUHG INFORMATION SOURCE: U.S. Geological Survey (USGS) 2 Oklahoma Injection Well Volumes* (1997 - 2013) and Magnitude 3.0+ Earthquakes (1997 - 2014) 700 3000 585 Induced seismic events may not always strike soon after the injection activity begins. It may take a long time for an earthquake to trigger, and sometimes not until after the injection activity has ended.** 500 2500 2000 400 Fluid pressure from high-rate disposal wells can migrate, so even if an injection well is not very close to a fault line or to one susceptible to earthquakes, the fluid pressure can migrate long distances to reach a fault that is more susceptible.*** 112 2 2 1 2 1999 2000 2001 2002 2003 2004 2005 2006 2007 2008 2009 41 1000 500 2012 1 2011 2010 1998 0 1 1997 100 1500 2014 200 2013 300 :DVWHZDWHUΖQMHFWLRQ9ROXPH LQ0LOOLRQVRI%DUUHOV (DUWKTXDNHV0 600 0 * According to the OCC, the 2013 data are not complete and will be updated once available. Therefore, actual 2013 injection volume total may EHODUJHUWKDQZKDWLVUHSUHVHQWHGLQWKHȴJXUH ** Ellsworth, William L. “Injection-induced earthquakes.” Science. July 12, 2013 at 1225942 to 1225943. *** See Keranen, K.M. et al. “Sharp increase in central Oklahoma seismicity since 2008 induced by massive wastewater injection.” Science. July 3, 2014; Bui, Hoai-Tran. “Wastewater disposal tied to surge in Oklahoma earthquakes.” USA Today. July 3, 2014. SOURCES: Earthquake data from the Oklahoma Geological Survey. Earthquake Catalogue, Years 1997–2014. Available at http://www.okgeosurvey1.gov/pages/earthquakes/catalogs.php. Accessed January 23, 2015; wastewater injection data from Oklahoma Corporation Commission (OCC), Oil and Gas Division, Oil and Gas Data Files. UIC Injection Volumes 2006–2013. Available at http://www.occeweb.com/og/ogdaWDȴOHVKWP$FFHVVHG$SULOΖQMHFWLRQYROXPHVIRUȂDUH not downloadable on the OCC website but were provided upon request. Oklahoma Scientists Hid the Truth About Frackquakes for Five Years On March 3, 2015, a journalist at EnergyWire broke the news that for five years, scientists in Oklahoma had suspected that the state’s recent unprecedented swarms of earthquakes could be due to oil and gas operations. The information was uncovered after obtaining emails through a state Open Records Act request. 31 greater earthquakes in Oklahoma increased by 437 percent, from 109 in 2013 to 585 in 2014.25 In 2014, Oklahoma was more seismically active than California, topping all states in the lower 48.26 According to EnergyWire, in 2013, Austin Holland, a seismologist from the Oklahoma Geological Survey (OGS) who is based at the University of Oklahoma, raised the issue after the OGS signed on to a U.S. Geological Survey press release recognizing that injection is a possible cause of earthquakes. He was asked to meet with the president of the university and with “concerned” oil and gas industry officials, including with Mitt Romney’s 2012 campaign adviser on energy issues, Harold Hamm,32 who has donated over $30 million to the school.33 In November 2011, Oklahoma experienced a 5.7 magnitude earthquake in Prague — what researchers believe to be the largest earthquake associated with wastewater injection in history, according to a March 2014 study by USGS researchers in collaboration with scientists from various universities. The study suggested that an earlier 5.0 magnitude earthquake induced by wastewater injection had triggered the larger earthquake.27 “The more small earthquakes we have, it just simply increases the odds we’re going to have a more damaging event,” a USGS geoscientist explained in 2015, noting that minor earthquakes can lead to major ones. “To some degree, we’ve dodged a bullet in Oklahoma.”28 Before and after that meeting, the USGS and OGS have butted heads over the link between oil and gas activities and earthquakes, with the OGS pushing back against the idea that Big Oil and Gas could be to blame. 34 Along with the rise of earthquakes, the amount spent on earthquake insurance has increased rapidly. In 2008, Oklahoma residents spent $3.5 million for standalone earthquake insurance from 72 insurance companies. In 2012, residents spent $10.3 million for such insurance from 108 companies. In 2013, residents continued to increase their spending on earthquake insurance, with $11.4 million spent from 105 insur- Bob Jackman, a petroleum geologist, said that when he asked Holland about the earthquakes, Holland replied, “You don’t understand — Harold Hamm and others will not allow me to say certain things.”35 Holland disputed this, but did not offer a corrected statement to EnergyWire.36 3 Oklahoma Earthquake Trends, 2000 to 2014 6000 1XPEHURI(DUWKTXDNHV 5000 Earthquakes M3.0+ 4000 Earthquakes <M3.0 3000 2000 2014 2013 2012 2011 2010 2009 2008 2007 2006 2005 2004 2003 2002 2001 0 2000 1000 SOURCE: Analysis of earthquake data from Oklahoma Geological Survey. Earthquake Catalogue, Years 2000–2014. Available at http://www.okgeosurvey1.gov/pages/earthquakes/catalogs.php. Accessed January 23, 2015. ance companies.29 As of January 2015, roughly 15 percent of Oklahomans had earthquake insurance, compared to about 10 percent of residents in California, and up from around 2 percent in 2011.30 associated with the disposal of brine from the Barnett Shale at an injection well drilled south of the airport. The southern well was roughly 200 meters (0.12 miles) from the center of the Dallas-Fort Worth earthquakes, and it began accepting waste water in September 2008, about seven weeks before the first earthquake. Prior to the Dallas-Fort Worth swarm, there had been no “felt” earthquakes in the region.44 Another study by Southern Methodist University researchers, about the Reno-Azle swarm, is pending.45 Texas Texas, a state built on oil and gas activity and the birthplace of fracking, is no stranger to the precarious effect of induced seismicity. On January 6 and 7, 2015, twelve earthquakes, ranging in magnitude from 1.6 to 3.6, were recorded in Irving, a town just west of Dallas.37 A seismic swarm started in midApril 2014, and by January 2015 it had produced 38 earthquakes, many of which were felt, and 4 of which were greater than 3.0 magnitude.38 Northern Texas is not the only region being hounded by induced seismicity. Overall, earthquake activity is surging in the state. From 2000 to 2008, Texas had a total of 18 earthquakes of 3.0 magnitude or greater. In 2013 alone, the state had 16 earthquakes of 3.0 magnitude or larger.46 On May 17, 2012, East Texas experienced the largest earthquake ever to be recorded in the region, a 4.8 magnitude quake near Timpson. Researchers believe that wastewater disposal wells may have triggered the historic event. Like the aforementioned events that occurred in northern Texas, wastewater injection wells were in proximity to the quakes, within 3 kilometers (1.9 miles), and the area previously lacked seismic activity.47 The Irving earthquakes are one of four seismic swarms that have flooded northern Texas since 2008.39 Previous earthquake swarms occurred in the town of Cleburne from June 2009 to June 2010, close to the Dallas-Fort Worth International Airport from October 30, 2008 to May 16, 2009, and near Reno and Azle from November 2013 to January 2014.40 Prior to 2008, an earthquake large enough to be felt had not been reported in northern Texas in almost 60 years. Since October 2008, more than 120 earthquakes have been reported in the region.41 Texas Earthquake Trends48 Research conducted by Southern Methodist University’s Geological Sciences department found that earthquake swarms recorded by the airport and in the town of Cleburne are plausibly connected to wastewater disposal.42 Prior to the seismic outbreak in Cleburne, there had not been any recorded earthquakes, and the seismic events were within close proximity to two injection wells.43 The Dallas-Fort Worth swarm was • Texas experienced an eightfold increase in magnitude 3.0 or greater earthquakes from 2007 to 2013. • From 2007 to 2013, underground injection volumes increased by 18 percent. 4 18 7800 16 7600 14 7400 7200 12 7000 10 6800 8 6600 6 6400 4 6200 2 0 ΖQMHFWLRQ:HOO9ROXPH LQ0LOOLRQVRI%DUUHOV (DUWKTXDNHV0 Texas Injection Well Volumes and 3.0M+ Earthquakes, 2007–2013 6000 2007 2008 2009 2010 2011 2012 2013 5800 7KLVȴJXUHVWDUWVLQ\HDUEHFDXVHWKDWLVWKHHDUOLHVWDYDLODEOHLQMHFWLRQYROXPHGDWDRQWKH7H[DV5DLOURDG&RPPLVVLRQȇVRQOLQHGDWDEDVH SOURCES8QLYHUVLW\RI7H[DVΖQVWLWXWHIRU*HRSK\VLFV7H[DV'LYLVLRQRI(PHUJHQF\0DQDJHPHQWDQG86'HSDUWPHQWRI(QHUJ\7H[DV(DUWKTXDNHV&RPSOHWHOLVWRI7H[DVHDUWKTXDNHV!0ȂSUHVHQW$YDLODEOHDWKWWSZZZLJXWH[DVHGXUHVHDUFKVHLVPRORJ\7;(4$FFHVVHG0DUFK 7H[DV5DLOURDG&RPPLVVLRQΖQMHFWLRQ9ROXPH4XHU\Ȃ$YDLODEOHDWKWWSZHEDSSVUUFVWDWHW[XV+VHDUFK9ROXPHGR"PHWKRG ToCall=init&internalPath=false&sessionId=1425590491307112. Accessed March 5, 2015. Colorado 4.0 was produced from 1972 through July 2001, but 12 struck between August 2001 and 2013. The researchers determined, “The statistical likelihood that such a rate change would occur if earthquakes behaved randomly in time is 3.0%.”55 According to the USGS, Colorado tends to have “minor earthquake activity,” and the eastern portion of the state is considered “nearly aseismic.”49 However, injection disposal of fluid waste is linked to the largest earthquake in Denver’s history: a 4.8* magnitude quake in 1967.50 Earthquakes continue to increase in Colorado.56 Just miles northeast of the town of Greeley,57 amid drilling and fracking of the Niobrara Shale formation,58 a 3.4 magnitude earthquake rumbled on May 31, 2014. It is believed that injection wells, two of which are 1.5 miles away from the epicenter, may have induced the seismic event.59 This is the first earthquake in the area in about three decades.60 Just weeks later, on June 23, 2014, there was a second earthquake. In response, on June 24, the Colorado Oil and Gas Conservation Commission directed the company to temporarily halt, for 20 days, fluid injection into one of its wells while it undergoes investigation. Three weeks later, the company was allowed to begin injecting waste water at lower pressure and volume, and in early 2015 the Commission’s investigation determined that the company had not committed any violations and it was allowed to begin injecting at larger quantities.61 In March 1962, the U.S. Army began injecting fluids into a 12,045-foot well at its Rocky Mountain Arsenal, a chemical weapons manufacturing and disposal plant in the Denver area. Prior to the injection of chemical fluids, this area had low seismicity. From April 1962 to August 1967, however, more than 1,500 earthquakes rumbled through the Denver region.51 Injection of these fluids at the Arsenal stopped in February 1966, and earthquake activity began progressively declining after November 1967, and stopped by the late 1980s.52 Similarly, in 2011, a 5.3 magnitude earthquake, believed to have been triggered by wastewater injection, occurred in Raton Basin,53 where large quantities of waste water were produced from drilling for coalbed methane.54 According to researchers who studied the induced seismic swarm in the area, “…there was a marked increase in seismicity shortly after major fluid injection began in the Raton Basin in 1999.” Only one earthquake equal to or greater than a magnitude of Ohio Ohio has had its fair share of induced seismic activity, both from injection wells and from drilling and fracking wells. In 2011, in Youngstown, Ohio — a town where there had been no recorded earthquakes since recordkeeping began in 1776 — a series of earthquakes struck after an underground injection well for fracking fluid disposal opened nearby.62 Injection began in 6RXUFHVFRQȵLFWRQWKHH[DFWPDJQLWXGH$UHSRUWIURPWKH1DWLRQDO5HVHDUFK&RXQFLOVWDWHVWKDWLWZDVPDJQLWXGHWKH86*6 states that it was 5.3 magnitude. 5 quakes between 7.0 and 7.8 magnitude.77 The WVSZ, located in southern Illinois and Indiana, has caused several sizeable earthquakes.78 One of the most recent was an earthquake of between 5.2 and 5.4 magnitude that occurred in 2008 near Mt. Carmel, Illinois.79 December 2010, and the first two seismic activities happened three months later, in March 2011. By mid-January 2012, a total of 12 seismic events had occurred, with the largest earthquake a 4.0 magnitude on December 31, 2011.63 The underground injection well closed for investigation, and later a study confirmed that fluid injection at the well triggered the earthquakes.64 A 2009 study found that a 7.7 magnitude earthquake from the NMSZ could cause almost 86,000 casualties, which includes 3,500 fatalities, as well as the displacement of over 7 million people through lack of utility services. An estimated 2 million people would need to find temporary housing three days after the earthquake. It could also leave over 1 million households without water and 2.6 million without electricity, all while generating a direct economic loss of about $300 billion.80 The Illinois Emergency Management Agency notes: “A catastrophic seismic event on the NMSZ could directly impact more than 50% of the state’s population and could trigger a national response on a larger scale than any recorded earthquake event in modern United States history.”81 In 2014, a Seismological Research Letters study on frackinginduced earthquakes in Harrison County, Ohio identified about 400 small tremors from October to December 13, 2013. Of those, 190 occurred within a 39-hour period after fracking began at a nearby well.65 Although the tremors were not large enough to be felt by residents, one of the authors said in a press release, “…the earthquakes were three orders of magnitude larger than normally expected.”66 Then, in March 2014, two earthquakes of magnitudes 2.6 and 3.0, respectively, in Poland Township, Ohio caused the Ohio Department of Natural Resources to order a company in the vicinity to cease drilling and fracking in the Utica Shale until a cause was pinpointed.67 In early 2015, research published in the Bulletin of the Seismological Society of America indicated that these felt seismic events were induced by fracking, which activated a previously unknown fault.68 The researchers identified a swarm of 77 earthquakes ranging in magnitude from 1.0 to 3.0 from March 4 to March 12, 2014.69 Adding to the complexity of the issue, multiple nuclear power plants and storage facilities and gas pipelines are within the NMSZ and WVSZ and could be damaged during a seismic event, potentially releasing radiation and toxic pollution. There are 10 interstate natural gas pipelines that travel either through or near the NMSZ and WVSZ that are “at high risk for multiple damage” from earthquakes.82 Roughly 27 nuclear reactors are located near the NMSZ,83 with 15 nuclear power plants in the NMSZ.84 Within the NMSZ and WVSZ, there are 11 Independent Spent Fuel Storage Installation (ISFSI) facilities.85 Six of these 11 facilities are in Illinois.86 The U.S. Nuclear Regulatory Commission defines an ISFSI as: “A complex designed and constructed for the interim storage of spent nuclear fuel; solid, reactor-related, greater than Class C waste; and other associated radioactive materials.”87 In Illinois alone, there are 11 nuclear reactors located at six nuclear power plants.88 Illinois Southern Illinois and the region surrounding the New Albany Shale is being targeted for drilling and fracking by the oil and gas industry. The New Albany Shale covers a large portion of southern Illinois, as well as southern Indiana and western Kentucky.70 Most major fault systems in Illinois are located in the southeastern and southern portions of the state,71 along with two primary seismic zones known as the New Madrid Seismic Zone and the Wabash Valley Seismic Zone.72 The New Madrid Seismic Zone (NMSZ) is responsible for some of the largest historic seismic events in central and eastern North America, where, in 1811 and 1812, an estimated three to five earthquakes occurred. Although estimates vary for these significant quakes, they generally are believed to have ranged from between 7.0 and 8.0 in magnitude.73 Opening the New Albany Shale up to drilling and fracking — and the subsequent wastewater injection wells — would put millions of people at risk.89 Conclusion A review of the literature reveals that the disposal of waste water into injection wells has long been linked to humancaused earthquakes. As fracking proliferates, the amount of produced waste water grows, increasing the activity of injection wells. High-pressure injection well sites can trigger earthquakes, and, without action, they will continue to put our health, safety and water quality at risk. And while there is still much to be learned regarding the precise nature of the relationship between fracking and seismicity, there is enough evidence to know that the two are related. With countless people’s lives at stake, it would be irresponsible and shortsighted to allow oil and gas wastewater disposal methods that induce such damaging earthquakes. The NMSZ runs about 150 miles through several states including southern Illinois, western Kentucky, western Tennessee, northeastern Arkansas and southeastern Missouri.74 The zone has about 200 small earthquakes a year, and a 2014 study found that seismic activity is not slowing down. Instead, stress is building up and could result in a sizeable earthquake.75 The lead author of the study, a USGS geophysicist, told a reporter: “It’s not going to go off anytime soon, but we do have evidence that more stress is being built up now. Eventually, that energy will have to be released in a large earthquake.”76 Meanwhile, the Wabash Valley Seismic Zone (WVSZ) is the second most active seismic zone in the central United States, with the ability to generate recurrent large-scale earth- 6 Endnotes 1 U. S. Geological Survey (USGS). “Man-made earthquakes update.” January 17, 2014. Available at http://www.usgs.gov/blogs/features/usgs_top_story/ man-made-earthquake/. Accessed February 23, 2015; Ellsworth, William L. “Injection-induced earthquakes.” Science. July 12, 2013 at 1225942 to 1225943. 2 See Friberg, Paul A. et al. “Characterization of an earthquake sequence triggered by hydraulic fracturing in Harrison County, Ohio.” Seismological Research Letters. Vol. 85, No. 6. November/December 2014; Seismological Society of America. [Press release]. “Hydraulic fracturing linked to earthquakes in Ohio.” October 14, 2014; Davies, Richard et al. “Induced seismicity and hydraulic fracturing for the recovery of hydrocarbons.” Marine and Petroleum Geology. Vol. 45. 2013 at 171, 172, 178, 180 and 183. 3 Available at http://www.occeweb.com/og/ogdatafiles2.htm. Accessed April 16, 2015. Injection volumes for 1997–2005 are not downloadable on the OCC website but were provided upon request. According to the OCC, the 2013 data are not complete and will be updated once available. Therefore, actual 2013 injection volume total may be larger than what is represented in the figure. 23 USGS, OGS. [Press release]. “Record number of Oklahoma tremors raises possibility of damaging earthquakes.” October 22, 2013, updated May 2, 2014. 24 USGS. “Top Earthquake States.” Available at http://earthquake.usgs.gov/ earthquakes/states/top_states.php. Accessed July 9, 2014. 25 Analysis of earthquake data from OGS. Earthquake Catalogue, Years 2000–2014. Available at http://www.okgeosurvey1.gov/pages/earthquakes/ catalogs.php. Accessed January 23, 2015. See Keranen, K.M. et al. “Sharp increase in central Oklahoma seismicity since 2008 induced by massive wastewater injection.” Science. July 3, 2014; Ellsworth (2013); Soraghan, Mike. “Drilling-heavy Okla. ranked 2nd last year for quakes.” E&E News. February 20, 2014; USGS. [Press release]. “Earthquake swarm continues in central Oklahoma.” October 22, 2013. 4 Herringshaw, Liam. Durham Energy Institute, Durham University. [DEI Briefing Note]. “What size of earthquakes can be caused by fracking?” April 2013 at 1; Ellsworth (2013). 5 USGS (2014); Herringshaw. 2013 at 1 to 3; Ellsworth (2013). 6 Seismological Society of America (2014); Friberg et al. 2014 at 1 and 12. 7 “Fracking in Ohio confirmed as cause of rare earthquake strong enough to be felt.” Science Daily. January 5, 2015. 8 British Columbia (BC) Oil and Gas Commission. “Investigation of Observed Seismicity in the Horn River Basin.” August 2012 at Slide 14. 9 Haszeldine, Stuart. School of GeoSciences, University of Edinburgh. [Briefing note for DECC SAG]. “Shale gas, NW England earthquakes, and UK regulation.” April 2012 at 1, 2 and 9; BC Oil and Gas Commission. 2012 at Slide 12. 26 Soraghan, Mike. “Shaken more than 560 times, Okla. is top state for quakes in 2014.” E&E News. January 5, 2014; Baldacci, Marlena and Mariano Castillo. “Oklahoma quakes this year top tremors in California.” CNN. June 20, 2014. 27 USGS. [Press release]. “2011 Oklahoma induced earthquake may have triggered larger quake.” March 6, 2014. 28 Borenstein, Seth. “Study: Oklahoma’s daily small quakes raise risk of big ones.” Associated Press. February 14, 2015. 29 Food & Water Watch staff correspondence with Oklahoma Insurance Department. June 11, 2014. Note: These amounts are from standalone policies/ direct written premiums for earthquake coverage and do not account for homeowners insurers that may offer earthquake coverage through their homeowner programs. 30 Wilmoth, Adam. “Earthquake rate steadies in Oklahoma, experts say.” The Oklahoman. January 13, 2015. 31 Soraghan, Mike. “Okla. agency linked quakes to oil in 2010, but kept mum amid industry pressure.” EnergyWire. March 3, 2015. 32 Ibid. 10 National Research Council. “Induced Seismicity Potential in Energy Technologies.” [Pre-publication version]. Washington, DC: The National Academies Press. 2013 at 213; BC Oil and Gas Commission. 2012 at Slide 12. 33 University of Oklahoma. [Press release]. “$20 million gift from Harold and Sue Ann Hamm launches five-year, $100 million campaign for the Harold Hamm Oklahoma Diabetes Center.” March 14, 2011. 11 Ellsworth (2013). 34 Soraghan. March 3, 2015. 12 USGS. “Induced earthquakes.” Available at http://earthquake.usgs.gov/ research/induced/. Accessed November 5, 2014. 35 Jackman, Bob. “Hamm-made earthquakes.” The Oklahoma Observer. Vol. 46, No. 10. October 2014 at 9. 13 Ibid. 36 Soraghan, Mike. March 3, 2015. 14 Faulkner, Chris. “California’s Monterey Shale promises America’s biggest oil boom.” Oil & Gas Monitor. March 8, 2013; Cart, Julie. “Allure of vast oil reserves buried deep in Monterey Shale.” Seattle Times. April 19, 2014. 37 Davis, Todd. L. “4 More Earthquakes Strike Irving Wednesday, 12 in 2 Days.” NBC 5 (Dallas). January 8, 2015; Goldenberg, Suzanne. “Eleven earthquakes recorded in less than 24 hours near birthplace of fracking.” Guardian. January 7, 2015. 15 Herringshaw. 2013 at 1; Ellsworth (2013). 16 Ellsworth (2013); Herringshaw. 2013 at 1. 38 Stump, Brian. [Presentation to Irving City Council]. “Remarks prepared by SMU seismologists for Jan. 15 Irving City Council Meeting.” January 16, 2015; Davis (2015). 17 Ellsworth (2013). 18 See Keranen (2014); Bui, Hoai-Tran. “Wastewater disposal tied to surge in Oklahoma earthquakes.” USA Today. July 3, 2014. 39 Stump (2015). 19 Soraghan (2014); USGS (2013). 40 Ibid.; Southern Methodist University. North Texas Earthquake Study. “Understanding Recent North Texas Earthquakes.” Available at http://www. smu.edu/News/NewsIssues/EarthquakeStudy. Accessed January 21, 2015. 20 Keranen. 2014 at 1. 21 Bui (2014). 41 Stump (2015). 22 Earthquake data from Oklahoma Geological Survey. (OGS) Earthquake Catalogue, Years 1997–2014. Available at http://www.okgeosurvey1.gov/ pages/earthquakes/catalogs.php. Accessed January 23, 2015; wastewater injection data from Oklahoma Corporation Commission (OCC), Oil and Gas Division, Oil and Gas Data Files. UIC Injection Volumes 2006–2013. 42 Ibid. 43 Justinic, Ashley Howe et al. “Analysis of the Cleburne, Texas, earthquake sequence from June 2009 to June 2010.” Bulletin of the Seismological Society of America. Vol. 103, Iss. 6. December 2013 at Abstract. 7 63 Tomastik, at Slides 5, 7, 12 and 13. 44 Frohlich, Cliff et al. “Dallas-Fort Worth earthquakes coincident with activity associated with natural gas production.” The Leading Edge. March 2010 at 273 and 274. 64 Resnick (2013). 65 Seismological Society of America (2014); Friberg. 2014 at 1, 3, 5 and 12. 45 Southern Methodist University. North Texas Earthquake Study. 66 Seismological Society of America (2014). 46 Soraghan, Mike. “USGS to make separate risk map for man-made quakes.” E&E News. December 23, 2013; University of Texas Institute for Geophysics, Texas Division of Emergency Management and U.S. Department of Energy. Texas Earthquakes. Complete list of Texas earthquakes >M3 (1847–present). Available at http://www.ig.utexas.edu/research/seismology/TXEQ/. Accessed March 6, 2015. 67 Fountain, Henry. “Ohio looks at whether fracking led to 2 quakes.” New York Times. March 11, 2014. 68 “Fracking in Ohio confirmed as cause of rare earthquake strong enough to be felt.” Science Daily. January 5, 2015; Skoumal, Robert J. et al. “Earthquakes induced by hydraulic fracturing in Poland Township, Ohio.” Bulletin of the Seismological Society of America, Vol. 105, Iss. 1. February 2015 at abstract. 47 Frohlich, Cliff et al. “The 17 May 2012 M4.8 earthquake near Timpson, East Texas: An event possibly triggered by fluid injection.” Journal of Geophysical Research: Solid Earth. January 6, 2014 at 1 and 2. 69 “Fracking in Ohio confirmed as cause of rare earthquake strong enough to be felt” (2015). 48 University of Texas Institute for Geophysics, Texas Division of Emergency Management and U.S. Department of Energy. Texas Earthquakes; Texas Railroad Commission. Injection Volume Query. 2007–2013 data. Available at http://webapps.rrc.state.tx.us/H10/searchVolume.do?methodToCall=init&int ernalPath=false&sessionId=1425590491307112. Accessed March 5, 2015. 70 Bergstrom, R.E. and N.F. Shimp. Illinois State Geological Survey. Prepared for U.S. Department of Energy. “Geologic and Geochemical Studies of the New Albany Shale Group (Denovian-Mississippian) in Illinois.” June 30, 1980 at 7; Loomis, David G. Loomis Consulting. “The Potential Economic Impact of New Albany Gas on the Illinois Economy.” December 2012 at 2. 49 USGS. “Colorado. Earthquake History.” Available at http://earthquake.usgs. gov/earthquakes/states/colorado/history.php. Accessed July 1, 2014. 71 Bergstrom and Shimp. 1980 at 37 and 167. 50 Ibid.; National Research Council. 2013 at 21, Box 1.2. 72 Rogers, J. David and Deniz Karadeniz. “Overview of the seismic threat in the central United States.” Proceedings of the 5th International Conference on Recent Advances in Geotechnical Earthquake Engineering and Soil Dynamics, State of the Art and Practice (SOAP) Lecture. San Diego, CA. May 24–29, 2010 at 1 to 2; Hamburger, Michael et al. Department of Geological Sciences, Indiana University. “Observational and Geodynamic Constraints on Active Deformation in the Southern Illinois Basin.” Final Technical Report. January 1, 2007–December 31, 2009 at 1 to 3. 51 USGS. “Colorado. Earthquake History”; National Research Council. 2013 at 21, Box 1.2. 52 National Research Council. 2013 at 21, Box 1.2. 53 USGS. Research. “Induced seismicity.” Available at http://earthquake.usgs. gov/research/induced/. Accessed November 5, 2014. 54 Soraghan, Mike. “USGS links Colo. quakes to gas drilling.” E&E News. September 16, 2014. 73 Illinois Emergency Management Agency. About the New Madrid Seismic Zone. Available at http://iema.illinois.gov/disaster/e_newmadrid.htm. Accessed October 17, 2014; Missouri Department of Natural Resources. Facts about the New Madrid Seismic Zone. Available at http://www.dnr.mo.gov/ geology/geosrv/geores/techbulletin1.htm. Accessed October 17, 2014; Rogers and Karadeniz. 2010 at 5 to 6. 55 Rubinstein, Justin L. et al. “The 2001–present induced earthquake sequence in the Raton Basin of Northern New Mexico and Southern Colorado.” Bulletin of the Seismological Society of America. Vol. 104. No, 5. October 2014 at 1. 56 Soraghan (September 16, 2014); Colorado earthquake data from USGS, Earthquake Hazards Program, Earthquake Archives. Available at http:// earthquake.usgs.gov/earthquakes/search/. Accessed March 6, 2015. 74 “New Madrid Seismic Zone Catastrophic Planning Initiative updates.” The CUSEC Journal. Vol. 12. No. 1. Fall 2007 at 7; Missouri Department of Natural Resources. Facts about the New Madrid Seismic Zone; Illinois Emergency Management Agency. About the New Madrid Seismic Zone. 57 Sperry, Trenton. “Epicenter of Saturday earthquake in Greeley, CO was near oil, gas wastewater injection wells.” Greeley Tribune. June 1, 2014. 75 Page, Morgan T. and Susan E. Hough. “The New Madrid Seismic Zone: Not dead yet.” Science. Vol. 343. February 14, 2014; Oskin, Beck. “Thanks to active New Madrid Fault Zone, Midwest earthquake risk still looms.” LiveScience. January 24, 2014. 58 Colorado Geological Survey. Colorado Department of Natural Resources. “Colorado’s new oil boom – the Niobrara.” Rock Talk. Vol. 13, No. 1. Spring 2011 at 1, 3 and 7. 59 Sperry (2014); “Greeley seismic activity may be linked to injection well.” KUSA-TV/NBC 9News. June 24, 2014. 76 Oskin (2014). 77 Rogers and Karadeniz. 2010 at 9. 60 Hickey, Chuck. “CU team studying possible oil and gas connection to recent Greeley earthquake.” Fox31 Denver. June 9, 2014. 78 Ibid. at 7 to 9. 79 Central United States Earthquake Consortium. Wabash Valley Seismic Zone. Available at http://www.cusec.org/earthquake-information/wabashvalley-seismic-zone.html. Accessed October 21, 2014; Rogers and Karadeniz. 2010 at 9. 61 “Investigation continues into Greeley quake, wastewater injection well.” CBSDenver. June 27, 2014; Colorado Oil & Gas Conservation Commission, Department of Natural Resources. [Press release]. “COGCC halts activity at injection wells; seeks additional review.” June 24, 2014; Fortier, Jackie. “After Human-Caused Earthquakes, Company Injecting Wastewater Cleared of Wrongdoing.” KUNC, Community Radio for Northern Colorado. January 22, 2015. 80 Elnashai, Amr S. et al. Mid-America Earthquake Center, Civil and Environmental Engineering Department, University of Illinois. “Impact of New Madrid Seismic Zone earthquakes on the Central USA.” (MAE Center Report No. 09-03.) Vol. 1. October 2009 at v and 132. 62 Resnick, Brian. “Can fracking cause earthquakes?” National Journal. September 5, 2013; Tomastik, Tom. Geologist, Ohio Department of Natural Resources, Division of Oil and Gas Resources Management. [Presentation]. “Preliminary report on the Northstar #1 Class II injection well and the seismic events in the Youngstown, Ohio area.” At Slides 7 and 12. 81 Illinois Emergency Management Agency. About the New Madrid Seismic Zone. 82 Portante, Edgar C. Argonne National Laboratory. 2010 HAZUS MH 4th Annual Conference. [Presentation]. “New Madrid Seismic Study: Simulat- 8 Valley Seismic Zone (WVSZ).” 22nd Conference on Structural Mechanics in Reactor Technology. San Francisco, California, August 18-23. 2013 at 1. ing the impacts on NG transmission pipelines and downstream customers using HAZUS and NGfast.” 2010 at Slide 17. 86 Ibid. at 4. 83 “Fukushima Fallout. Regulatory Loopholes at U.S. Nuclear Plants.” Prepared by the staff of Congressman Edward J. Markey (D-MA.) May 12, 2011 at 16. 87 U.S. Nuclear Regulatory Commission. Independent spent fuel storage installation (ISFSI.) Available at http://www.nrc.gov/reading-rm/basic-ref/ glossary/independent-spent-fuel-storage-installation-isfsi.html. Accessed October 21, 2014. 84 Lieutenant Colonel Michael Bentley. U.S. Army. U.S. Army War College. [Strategy Research Project.] “The Role of Military Forces in Disaster Response: Remove the Impediments.” 2012 at 2; Lineback, Neal. “Geography in the News: New Madrid Earthquake.” News Watch (National Geographic). November 30, 2013. 88 Institute for Energy Research. “Illinois: An Energy and Economic Analysis.” March 11, 2011. Available at http://instituteforenergyresearch.org/analysis/ illinois-an-energy-and-economic-analysis/. 85 Tripathi, Bhasker (Bob). “Overview of Independent Spent Fuel Storage Installations (ISFSIs) in the New Madrid Seismic Zone (NMSZ) and Wabash 89 Elnashai et al. 2009 at v and 132. Food & Water Watch ZRUNVWRHQVXUHWKHIRRGZDWHUDQGȴVKZHFRQVXPH is safe, accessible and sustainable. So we can all enjoy and trust in what we eat and drink, we help people take charge of where their food comes from, keep clean, DRUGDEOHSXEOLFWDSZDWHUȵRZLQJIUHHO\WRRXUKRPHVSURWHFWWKHHQYLURQPHQWDO quality of oceans, force government to do its job protecting citizens, and educate about the importance of keeping shared resources under public control. Copyright © May 2015 by Food & Water Watch. All rights reserved. This issue brief can be viewed or downloaded at foodandwaterwatch.org. 9


© Copyright 2026