
Using a Recreational Marine Survey to Improve Spatial and Temporal... in the Houston-Galveston-Brazoria Area
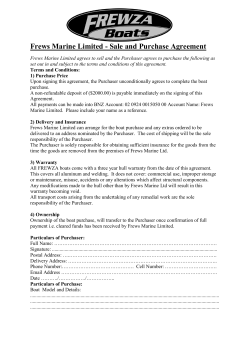
Using a Recreational Marine Survey to Improve Spatial and Temporal Allocations in the Houston-Galveston-Brazoria Area Rachel Anderson, Ph.D., Kirstin Thesing, and Jim Wilson E.H. Pechan & Associates, Inc. 5528-B Hempstead Way Springfield, VA 22151 [email protected] Theodore Kosub Texas Commission on Environmental Quality 12100 Park 35 Circle Austin, TX 78753 (512) 239-5609, x164 [email protected] ABSTRACT The temporal and spatial allocation of recreational marine vessel emissions in the greater Houston area was updated using data collected from a boat count survey. The number and types of boats entering and exiting the water were recorded in boat count logs from a sampling of marinas and ramps that serve as water entry sites around the Houston area. The boat counts were used to calculate the spatial allocation of recreational marine activity as well as diurnal and weekday/weekend temporal allocations. Boating accident data was used as a proxy for seasonal distribution of activity. The new allocations were used as inputs in the Texas NONROAD (TexN) model to estimate recreational marine vessel emissions. The data collected showed an increase in the percentage of emissions derived from weekend activity (Sat-Sun) versus weekday activity (Mon-Fri). The new spatial allocation of emissions showed a decrease in the fraction of activity attributed to Galveston County and an increase in Harris and Montgomery Counties. INTRODUCTION The purpose of this study is to update the recreational marine emissions inventory in the Houston-Galveston-Brazoria (HGB) 8-county ozone nonattainment area. The counties included in this study are shaded purple in Figure 1.1 This paper describes how improvements were made to the temporal and spatial allocations of recreational marine activities in this area. According to the EPA, recreational marine emissions are defined to be those from mobile, nonroad recreational marine vessels and include “pleasure boats and larger non-commercial vessels with inboard and outboard engines, stern drive engines, and sailboat auxiliary inboard and outboard engines”.2 In EPA’s NONROAD model, the recreational marine category is defined according to equipment type, as listed in Table 1. These designations are largely based on engine type (outboard versus inboard), coupled with fuel type. Diesel recreational marine engines are relatively small in number compared to gasoline engines (less than 1 percent of registered vessels in Texas). In EPA’s 1 model, auxiliary engines used primarily for larger sailboats or outboard motors are classified as either inboard or outboard engines Figure 1. Houston-Galveston-Brazoria 8-county area (shaded) Table 1. Recreational marine equipment types and descriptions from EPA's NONROAD model SCC Equipment Type Definition 2282005010 Gasoline Outboards 2282005015 Personal Watercraft 2282010005 Gasoline Inboards 2282020005 Diesel Inboards 2282020010 Diesel Outboards Standard outboard engines easily removed and replaced if needed Engines used to provide power to jet-powered small boats and riding watercraft (aka Jet Ski) Primarily 4-stroke engines mounted as an integral part of the vessel Diesel engines mounted as an integral part of the vessel Diesel powered outboard engines (Rare, but nonzero) Horsepower Range 1-300 HP 16-175 HP 3-750 HP 6-3000 HP 25-40 HP Within the general classifications used by EPA based on propulsion/fuel system, there are specific boat types designed for various uses. For example, outboard boats are small to mediumsized boats and include bass and other offshore fishing boats, pontoon boats, utility boats, and 2 runabouts. Inboards are comprised of mid-sized runabouts, which are primarily tournament ski boats, as well as larger inboard cruisers, which are typically powered by two engines. Some of the mid-sized inboards may also have a stern drive configuration (i.e., engine/propeller located at the rear of the boat). Personal watercraft are a separate category designated by EPA. These are small boats typically under 10 feet long and are powered by water jets. This paper describes the approach used to improve the temporal and spatial allocations of HGB recreational marine emissions, the methodology and results of a boating activity survey, the input and results of emissions modeled in TexN (the Texas NONROAD model), and recommendations for further improvement of the HGB recreational marine emissions inventory. RECOMMENDED IMPROVEMENTS TO TEMPORAL AND SPATIAL ALLOCATION Evaluation of Previous Allocation Scheme In 2002, the Texas Commission on Environmental Quality (TCEQ) funded a Texas recreational marine vessel (RMV) emissions inventory.3 The inventory updated EPA’s NONROAD model with Texas-specific recreational marine vehicle population data derived from Texas Parks and Wildlife Department (TPWD) boat registrations. This boat registration database includes some commercial marine vessel engines. However, their number is few and they tend to be small vessels under 60 feet in length, as opposed to the ships, ferries, and dredges, which can be up to 1,000 feet in length. The NONROAD default distribution of model year and horsepower profile was retained. The previous TCEQ-sponsored recreational marine inventory also used new spatial allocations derived from geographical information system (GIS) data for water body size and travel distances between counties and water bodies. The RMV emissions county allocations were calculated to be proportional to water body size and county boat registration number, but inversely proportional to distance between county and water body. This method allocates larger numbers of boats to large lakes located near counties with large boat registrations. Coastal waterways such as Galveston Bay were clumped into “nodes” based on the main coastal access points rather than allocating boats to all coastal counties. The 2002 TCEQ study covered all Texas counties, including the Houston 8-county (HGB) area of interest. The county allocation was refined based on TPWD registration data and GIS data on water acreage and distance between water bodies and counties. However, this methodology minimizes emissions contributions from RMVs towed in from adjacent counties, or even from other states. This may be a limitation when studying a region such as HGB that attracts RMVs from many geographic areas. Recommendations After assessing the possible data collection and methodological approaches E.H. Pechan & Associates, Inc. (Pechan) used the following approaches for improving the modeling of recreational marine vehicle emissions in the 8-county HGB area: 1) Field survey at boat ramps and marinas; and 2) Evaluation of boating accident statistics. 3 The first element of the recommended approach was a field survey at boat ramps and marinas where surveyors stationed at various ramps and marinas collected data on boats entering and leaving the water throughout the day, including boat size and time of entry. Surveyors were not required to speak with boat owners/operators. Instead, surveyors were stationed at access points to the major bodies of water in the study area. It was anticipated that this survey would provide raw activity information that could be used to calculate temporal and spatial distribution of activity. It was recommend that this data collection be performed over a span of several days at least twice during a given month to obtain weekday versus weekend activity levels and to minimize the influence of meteorological conditions on a given day or week. The 8-county area is well-suited for a field survey because besides the Bay and Gulf, there are only two major lakes and a small number of minor lakes and reservoirs that would need to be surveyed. The next element of the recommended approach relies on a ten-year dataset of boating accident statistics from the 8-county area compiled by the US Coast Guard. This dataset serves as a proxy for the monthly/seasonal distribution of activity by assuming that the number of accidents in a given month correlates with boating activity. The above data collection was designed to provide improved HGB area information for recreational boating activity data including diurnal, day-of-week, seasonal, and spatial distribution. This data collection described above was used to update model activity inputs for the years 2005, 2007, 2008, and 2011. FIELD SURVEY OF BOATING ACTIVITY To improve the temporal and spatial allocation of recreational marine activities, a field survey of boating activity in the HGB area was performed. This section summarizes the methodology and results of the recreational marine field survey conducted during the months of June-July 2008 at ramps and marinas in HGB. The results of the field survey were used to calculate a temporal and spatial distribution of recreational marine emissions using the TexN model. Survey Methodology The HGB area has two major coastal bodies of water – Galveston Bay and the Gulf of Mexico – as well as two large lakes and several small lakes and reservoirs. Water access points for these bodies of water were identified using the Texas Beach and Bay Access Guide,4 the Boat Ramp Locator at BoatUS.com,5 and the Texas Parks and Wildlife Department Texas Lake Finder.6 These sources listed a total of 74 ramps and 67 marinas in the HGB 8-county area, not including residential water access points, such as private docks. There are no access points listed for the counties of Ft. Bend, Liberty, and Waller. Of the 141 water access points identified, 26 were surveyed. These were selected based on geographic distribution around the 8-county area. Twenty-six alternate sites were also selected in case the primary survey site was inaccessible. A sample size of 26 sites out of a population of 141 sites represents a 17% margin of error with a 95% confidence interval. The field survey was conducted over several weeks in June-July 2008 by the subcontractor Texas Shoppers Network. The data collection was performed over a span of several days at least twice to obtain weekday versus weekend activity levels and to minimize the influence of meteorological conditions on a given day or week. In cases of inclement weather, the survey was cancelled and rescheduled for another day. Table 2 summarizes the sites, the survey dates, and HGB weather conditions on those days. 4 Table 2. Field survey sites, survey dates, and weather conditions County Brazoria Chambers Galveston Site Name Date of Weekend Survey Galveston Bay Outrigger Marina 6/29/2008 Mostly cloudy a.m. Rain p.m. 7/14/2008 Mostly cloudy West Bay Chocolate Bayou Boat Ramp 7/12/2008 Scattered clouds 7/11/2008 Scattered clouds Inlet from Bay to Gulf San Luis Pass 7/19/2008 Scattered clouds 7/17/2008 Partly cloudy a.m. Scattered clouds p.m. Gulf Bridge Bait Boat Ramp 7/19/2008 Scattered clouds 7/18/2008 Scattered clouds Gulf Bridge Harbor Yacht Club 7/12/2008 Scattered clouds 7/11/2008 Scattered clouds Wallisville Reservoir Wallisville Reservoir 7/13/2008 Mostly cloudy 7/14/2008 Mostly cloudy Cotton Lake Cotton Lake Ramp 7/19/2008 Scattered clouds 7/18/2008 Scattered clouds Trinity Bay Fort Anahuac Park 7/13/2008 Mostly cloudy 7/14/2008 Mostly cloudy Trinity Bay Crawley's Seafood Marina & Ramp 7/12/2008 Scattered clouds 7/11/2008 Scattered clouds West Bay Bay View Marina 6/29/2008 Mostly cloudy a.m. Rain p.m. 6/30/2008 Overcast a.m. Rain p.m. West Bay Pirates Beach Marina 6/29/2008 Mostly cloudy a.m. Rain p.m. 6/30/2008 Overcast a.m. Rain p.m. West Bay Sportsman Public Boat Ramp 7/12/2008 Scattered clouds 7/11/2008 Scattered clouds Galveston Bay Clear Lake Channel 6/29/2008 Mostly cloudy a.m. Rain p.m. 6/30/2008 Overcast a.m. Rain p.m. Galveston Bay GYB Bait Camp 6/29/2008 Mostly cloudy a.m. Rain p.m. 6/30/2008 Overcast a.m. Rain p.m. Gulf Erman Pilsner Boat Ramp 6/29/2008 Mostly cloudy a.m. Rain p.m. 7/14/2008 Mostly cloudy East Bay Stingaree Marina 6/29/2008 Mostly cloudy a.m. Rain p.m. 7/10/2008 Most cloudy/rain a.m. & p.m. Galveston Bay Highway 146 Ramp Dickinson Bayou 7/12/2008 Scattered clouds 7/11/2008 Scattered clouds Body of Water 5 Weather Date of Weekday Survey Weather County Harris Montgomery Site Name Date of Weekend Survey Galveston Bay Bayland Park Marina 6/29/2008 Mostly cloudy a.m. Rain p.m. 6/30/2008 Overcast a.m. Rain p.m. Lake Houston Lake Houston Marina 6/29/2008 Mostly cloudy a.m. Rain p.m. 6/30/2008 Overcast a.m. Rain p.m. Lake Houston Love's Marina 7/12/2008 Scattered clouds 7/11/2008 Scattered clouds Sheldon Reservoir Sheldon South Ramp 7/13/2008 Mostly cloudy 7/10/2008 Most cloudy/rain a.m. & p.m. Clear Lake Rosewood Boat Ramps Clear Lake Shores 7/12/2008 Scattered clouds 7/11/2008 Scattered clouds Lake Conroe Seven Coves Marina 6/29/2008 Mostly cloudy a.m. Rain p.m. 7/10/2008 Most cloudy/rain a.m. & p.m. Lake Conroe April Plaza 6/29/2008 Mostly cloudy a.m. Rain p.m. 7/14/2008 Mostly cloudy Lake Conroe FM 830 Boat Ramp 7/12/2008 Scattered clouds 7/11/2008 Scattered clouds Lake Conroe Scott's Ridge Ramp 7/19/2008 Scattered clouds 7/18/2008 Scattered clouds Body of Water Weather Date of Weekday Survey Weather A surveyor was stationed at each of the 26 sites from 5 am to 9 pm for two days: one weekday and one weekend day. At each site, the surveyor counted the number of recreational marine vessels (hereafter called “vessels”) entering and leaving the water at that access point during each hour of the day. The surveyors only recorded vessels entering or leaving the water at the assigned site and did not count other vessels visible from the access point. The surveyor recorded the boat counts on a log provided by Pechan. Each vessel was designated by the surveyor as one of the following: • • • • • • • Small motorized outboard boat; Large outboard boat; Large inboard boat; Small inboard boat; Sailboat; Personal watercraft; or Other. The surveyors were asked to note the types of vessels recorded as “other” (such as ferry, canoe, etc.) so that a determination could be made whether such vessels should be counted as recreational marine vessels. The surveyors were also asked to record whether the sailboats observed had visible motors. Data on vessel type was collected so it could be analyzed and compared with the distribution of motor types included in the TexN model. 6 Survey Results Fifty-two boat count logs were collected, representing two days of data collection for each of the 26 survey sites. The total number of boats on the water for each hour at each site-day was calculated by subtracting the number of boats leaving the water from the number of boats entering the water during each hour and adding that to the cumulative number of boats on the water from the previous hour. The cumulative number of boats on the water for each county was calculated by adding the number of boats for each survey site for each county. It is important to note that activity at each water access point was attributed to the county where the access point is located, regardless of the body of water entered or distance traveled. For example, although Galveston Bay is surrounded by three counties, boats entering the Bay at access points located in Harris County were allocated to Harris County even though the boat could circulate around the Bay or even travel out to the Gulf. The weekend/weekday temporal distribution was determined for each county. Saturday and Sunday are designated as weekend days, while Monday through Friday are designated as weekdays. The number of boats on the water each hour of the day were summed to produce a daily total for each weekend day and weekday and then divided by the 2-day total to determine the weekend and weekday fraction of activity. The weekend/weekday distribution for each county and for the HGB area in total is summarized in Table 3. For example, in Brazoria County, the average weekend day has approximately three times the activity of an average weekday. These were used as inputs for the TexN model. Note that the HGB distribution is used for counties that have no water access points to account for residual recreational marine activity. Table 3. Weekend/weekday temporal distribution by county County Weekend Fraction Weekday Fraction Brazoria 0.75 0.25 Chambers 0.83 0.17 Fort Bend 0.81 0.19 Galveston 0.88 0.12 Harris 0.71 0.29 Liberty 0.81 0.19 Montgomery 0.85 0.15 Waller 0.81 0.19 HGB 8-County Area 0.81 0.19 The weekend/weekday distribution was also calculated by setting the average weekday (Monday-Friday) value at one and then determining the multiplicative factor for the average weekend day (Saturday-Sunday) value. The results of this calculation are summarized in Table 4. 7 Table 4. Average weekend/weekday values by county County Average Weekend Value Average Weekday Value Brazoria 2.94 1.00 Chambers 4.94 1.00 Fort Bend 4.31 1.00 Galveston 7.69 1.00 Harris 2.47 1.00 Liberty 4.31 1.00 Montgomery 5.81 1.00 Waller 4.31 1.00 HGB 8-County Area 4.31 1.00 The total diurnal distribution for each county was determined by dividing the total for each hour by the cumulative number for the day. At some locations, the number of boats on the water in a given hour was negative. This could be attributed to boats leaving the water at a different access point from where they entered or boats being on the water before 5 a.m. when surveying began. These sites were corrected by adding the same number to each hour of the day so that there were no longer negative boat counts. To prevent the correction from skewing the county distribution, the correction was removed from the county total. In addition, boats that left the water during the 5 a.m. hour were counted as entering the water during the 4 a.m. hour. All other non-survey hours (9 p.m. through 4 a.m.) were counted as having no boating activity. Diurnal distributions were determined for each county and the HGB 8-county area. A diurnal distribution was also calculated for weekday versus weekend for each county and HGB. In some counties, the weekday diurnal distribution was very different than the weekend distribution. The cumulative diurnal distribution for the HGB 8-county area is summarized in Table 5. Note that this distribution is for Central Daylight Time, the standard time zone for June-July in Houston, and is appropriate for the time-of-year (June-July) when the sampling was performed. This assignment would need to be revised when applied to seasons with shorter daylight periods. These data were not used as inputs for TexN because the model does not currently accept diurnal distributions. 8 Table 5. HGB 8-County Diurnal Distribution Time of Day Average Diurnal Distribution Weekend Diurnal Distribution Weekday Diurnal Distribution Midnight 0 0 0 1:00 AM 0 0 0 2:00 AM 0 0 0 3:00 AM 0 0 0 4:00 AM 0.0246 0.0145 0.0678 5:00 AM 0.0234 0.0197 0.0395 6:00 AM 0.0331 0.0321 0.0378 7:00 AM 0.0407 0.0428 0.0318 8:00 AM 0.0504 0.0546 0.0326 9:00 AM 0.0621 0.0675 0.0386 10:00 AM 0.0698 0.0715 0.0627 11:00 AM 0.0689 0.0703 0.0627 12:00 PM 0.0723 0.0711 0.0773 1:00 PM 0.0706 0.0697 0.0747 2:00 PM 0.0747 0.0735 0.0798 3:00 PM 0.0726 0.0729 0.0712 4:00 PM 0.0721 0.0747 0.0609 5:00 PM 0.0742 0.0765 0.0644 6:00 PM 0.0690 0.0671 0.0773 7:00 PM 0.0639 0.0631 0.0670 8:00 PM 0.0575 0.0584 0.0541 9:00 PM 0 0 0 10:00 PM 0 0 0 11:00 PM 0 0 0 1.00 1.00 1.00 Total The county spatial distribution was determined by first calculating the survey site average for each county, multiplying that by the total number of water access points in the county, and then dividing that by the 8-county cumulative total. The county distribution is summarized in Table 6. 9 Table 6. HGB Boating Spatial Activity Distribution by County County 2008 Survey County Distribution, % Brazoria 12.2% Chambers 8.4 Fort Bend 0.0 Galveston 27.3 Harris 36.0 Liberty 0.0 Montgomery 16.1 Waller 0.0 Total 100% The updated spatial distribution showed a decrease in allocation to Galveston County and an increase in allocation to Harris and Montgomery Counties when compared with previous TCEQ studies. There are a large number of water access points on the short stretch of Bay and Clear Lake shoreline that falls in Harris County. Additionally there is a relatively high amount of boating activity at Lake Houston in Harris County. The previous allocation based on the TCEQ 2002 study used spatial allocations proportional to water body size and county boat registration number. In the previous study, coastal waterways, such as Galveston Bay, were grouped into “nodes” based on the main coastal access points rather than allocating boats to all coastal counties. Consequently, the previous methodology may have underestimated the Bay activity allocated to Harris County. The monthly and seasonal distribution of activity was estimated using a 10-year dataset of boating accident statistics from the 8-county area obtained from the U.S. Coast Guard.7 This dataset can serve as a proxy for boating activity. The number of accidents in each month was divided by the total number of accidents to determine the monthly distribution of accidents. This can be used to represent the monthly distribution of activity. The use of this dataset assumes that the number of accidents in a given month correlates with boating activity. A drawback to the use of this dataset is that winter or hurricane-season boating conditions may be more dangerous and result in more accidents per boating hour than other seasons where the weather and water are calmer. For the purposes of this study, it was assumed that number of boating accidents per boating hour remained the same across the seasons. Marina fuel sales may also serve as a proxy for boating activity. This is particularly true of lakes where a limited number of marinas serve as a major source of boating fuel for that body of water. We surveyed ten privately owned marinas for fuel sales information and were able to obtain fuel sales from one marina for 2007 broken down by month. A more complete dataset of marina fuel sales may provide a proxy for monthly boating activity. A drawback to this data collection approach is that it does not account for the many boaters that obtain their fuel from non-marina services stations. The monthly distributions of boating activity derived from reported accidents and fuel sales at one marina are shown in Table 7. 10 Table 7. HGB Monthly Boating Activity Distribution Month/Season Distribution Based on Reported Accidents, % Distribution Based on Lake Houston Fuel Sales, % Jan 2.9% 0.0% Feb 1.4 0.1 Mar 4.7 3.2 Apr 10.1 8.1 May 13.3 11.2 Jun 16.5 12.5 Jul 20.1 19.4 Aug 11.5 21.1 Sep 10.1 11.6 Oct 5.8 5.4 Nov 1.4 6.0 Dec 2.2 1.4 TOTAL 100% 100% The two datasets produce similar monthly boating activity distributions--differing by an average of 2.6% per month. Figure 2 illustrates the differences in the two datasets. The difference in the two datasets is most pronounced in the month of August where they differ by 10%. Figure 2. Monthly Boating Activity Distribution by Dataset 11 In this study Pechan based the monthly boating activity estimates for the area on boating accident statistics reported by the Coast Guard rather than fuel sales data. The Coast Guard dataset covers ten years and all HGB counties, whereas the fuel sales dataset is based on one marina at a single lake. Fuel prices can have an impact on boating activity levels. During the months of June-July, 2008 the average gasoline price in Houston was $3.94.8 For the same time period, the Gulf Coast (PADD 3) average diesel price was $4.66 (Houston diesel prices not available from EIA).9 Data on vessel type were collected by the surveyors. The distribution of vessel types from the field survey is illustrated in Figure 3. Sailboats with visible motors are noted in black representing 0.5% of all vessels surveyed and 7% of the surveyed sailboats. Figure 3. Vessel Type Distribution (Sailboats with visible motors are noted in black) TEXN MODELING MODIFICATION AND RESULTS Modified Inputs The results of the boating activity field survey were used to modify the inputs to the latest version of the TexN model obtained from TCEQ. The latest version of TexN includes inventory years through 2013. Based on the results of the field survey described in the previous section of this report, several of the default TexN inputs were modified. Pechan then generated updated emissions estimates for 4 inventory years. These included a base year of 2007, as well as 2005, 2008, and 2011. 12 Table 8a provides a summary of the previous 2007 annual criteria emissions by county based on the allocations calculated in the 2002 TCEQ study. These estimates are for all recreational marine SCCs combined, and reflect the current default TexN data inputs. Note that no activity and therefore zero emissions are reported for Liberty and Waller Counties. Table 8b shows the updated 2007 annual emissions, after incorporating data inputs based on the 2008 field survey reported here. Table 8a. Previous 2007 annual recreational marine emissions by HGB County, tons per year Brazoria Chambers Fort Bend Galveston Harris Liberty Montgomery Waller Total HGB VOC 912.05 401.70 43.16 4,475.17 438.85 0 342.51 0 6,613.44 NOx 74.94 33.36 3.54 367.36 36.02 0 28.12 0 543.34 CO 2,093.40 929.18 99.01 10,265.48 1,006.66 0 785.68 0 15,179.41 PM2.5 12.37 5.50 0.59 60.71 5.95 0 4.65 0 89.76 SO2 0.65 0.29 0.03 3.17 0.31 0 0.24 0 4.69 NH3 0.16 0.07 0.01 0.78 0.08 0 0.06 0 1.15 % of Total 14% 6 1 68 7 0 5 0 100% Table 8b. Updated 2007 annual recreational marine emissions by HGB County, tons per year Brazoria Chambers Fort Bend Galveston Harris Liberty Montgomery Waller VOC 806.88 550.66 0 1,805.56 2,380.96 0 1,064.80 0 6,608.86 NOx 65.85 45.38 0 147.24 194.16 0 86.82 0 539.45 CO 1,862.55 1,281.79 0 4,167.77 5,495.95 0 2,457.88 0 15,265.93 PM2.5 10.94 7.53 0 24.48 32.28 0 14.44 0 89.67 SO2 0.57 0.39 0 1.28 1.68 0 0.75 0 4.68 NH3 0.14 0.10 0 0.31 0.41 0 0.19 0 1.15 % of Total 12% 8 0 27 36 0 16 0 100% Since these are annual emissions, no temporal updates are reflected. In addition, because the overall population and activity in the HGB area was not changed, the total HGB emissions are comparable to the default emissions. However, the county allocation of emissions within the HGB area does reflect the new county distribution (see Table 6). Fewer emissions are reported in Galveston County (from 68% to 27%), and Harris County emissions increase from 7% to 36% of the total. Montgomery County emissions increased from 5% to 16%. In addition to Liberty and Waller Counties, zero emissions are reported for Fort Bend County in the updated inventory. The remaining counties of Brazoria and Chambers show less significant changes in their contribution to HGB area emissions. The updated monthly and weekly profiles are reflected in the seasonal emissions for a given model run, as well as the typical ozone season weekday emissions. Tables 9 and 10 show how the monthly and weekly profiles changed from the previous default values to the updated values based on the survey. Note that the summer season percentage of activity remains the same as the default. Variations by month in the summer and the other seasons were determined based on the field survey and boating accident statistics, but monthly modeling runs were not performed for this study (TexN assumes an equal distribution of activity by month within a season). Fall, winter, and spring seasonal percentages show some differences. The new monthly/seasonal profile was applied as an average 13 profile for all counties combined in the HGB area. Updated weekday and weekend day fractions were calculated by county based on the survey data. Table 9. Seasonal percentages of annual activity Winter (Dec-Feb) Spring (Mar-May) Summer (Jun-Aug) Fall (Sep-Nov) TexN Default (%) 7 23 48 23 2008 TCEQ Survey (%) 6 28 48 17 Note: The sums do not total to 100 due to independent rounding Table 10. Weekday and weekday fractions County Brazoria County Chambers County Galveston County Harris County Montgomery County Fort Bend County Liberty County Waller County Default in TexN Fraction of weekly activity in typical weekday (Mon-Fri) 0.05 0.03 0.02 0.06 0.03 0.04 0.04 0.04 0.06 Fraction of weekly activity in typical weekend day (Sat-Sun) 0.37 0.42 0.44 0.36 0.43 0.41 0.41 0.41 0.35 Table 11a presents a summary of the 2007 ozone season weekday recreational marine emissions by county based on the previous TCEQ study. Table 11b shows the effect that the data collected in the field survey reported here had on the relative county distribution of activity for summer weekday emissions. In addition, these updated emissions reflect the differences by county in the assumed weekday/weekend day allocations. Table 11a. Previous 2007 ozone season weekday emissions by county, tons per day Brazoria Chambers Fort Bend Galveston Harris Liberty Montgomery Waller Total HGB VOC 2.38 1.04 0.11 11.65 1.14 0 0.89 0 17.22 14 NOx 0.15 0.07 0.01 0.74 0.07 0 0.06 0 1.10 CO 4.77 2.12 0.23 23.39 2.29 0 1.79 0 34.58 Table 11b. Updated 2007 ozone season weekday emissions by county, tons per day VOC 1.89 0.98 0 2.75 6.13 0 1.89 0 13.64 Brazoria Chambers Fort Bend Galveston Harris Liberty Montgomery Waller Total HGB NOx 0.11 0.05 0 0.10 0.39 0 0.09 0 0.74 CO 3.55 1.47 0 3.21 12.22 0 2.76 0 23.21 Harris County showed the largest relative increase among the counties in terms of activity, and also has the least amount of change from the default values for assumed weekday activity. All the other counties showed a decrease in weekday relative to weekend day activity. Therefore, Harris County has the largest contribution to ozone season weekday emissions of the five counties in the HGB area reporting emissions. Note that in addition to Liberty and Waller Counties, zero emissions are reported for Fort Bend County in the updated inventory. Finally, Pechan ran the TexN model for alternate years besides 2007. These years included 2005, 2008, and 2011. Tables 12 and 13 show a summary of annual and ozone season weekday recreational emissions by year for the entire HGB area. The county distribution of emissions for these alternate years was verified and matched the county distribution for the base year. Note that model runs for 2007 were also performed for each of the four seasons, and these results reflected the updated monthly distribution. Table 12. Trend in annual recreational marine emissions for HGB area, tons per year Year 2005 2007 2008 2011 VOC 6,878.90 6,608.86 6,435.89 5,975.36 NOx 595.58 539.45 559.57 616.88 CO 13,128.57 15,265.93 15,109.99 14,672.12 PM2.5 97.17 89.67 85.97 76.41 SO2 8.85 4.68 2.83 2.50 NH3 1.28 1.15 1.09 0.99 Table 13. Trend in ozone season weekday recreational marine emissions for HGB area, tons per day Year 2005 2007 2008 2011 VOC 13.94 13.64 13.41 12.82 NOx 0.87 0.74 0.77 0.85 CO 18.85 23.21 22.97 22.31 Pechan did not update total State-level populations in TexN. An evaluation of the latest vessel registration data from TPWD showed that registered personal watercraft were not accurately identified as such until 2006, so the number of PWC reported was underestimated.10 Many of the PWC registered prior to 2006 were recorded as inboard motors. In addition, the boat type distribution observed in the field survey was comparable to the defaults in TexN. Likewise, a comparison of the distribution of 15 vessel types for the entire state versus coastal counties demonstrated that the populations are comparable. Consequently, Pechan did not update total State-level populations in TexN. A comparison of vessel engine type distributions based on data source is summarized in Table 14. Table 14. Engine type distribution based on data source Fuel SCC Type Type 2282005010 Outboard Gas 2282005015 PWC Gas 2282010005 Inboard & Stern Gas PWC and Inboard Gas combined 2282020005 Inboard Diesel 2282020010 Outboard Diesel Total * Not correctly identified in TPWD database Default in TexN for HGB 66.5% 14.6% 18.6% 33.2% 0.3% 0.0% 100% TPWD Current Registration 63.6% 3.8 * 31.5% 35.3% 1.0% 0.0% 100% From 2008 Field Survey 61% 13% 26% 39% n/a n/a 100% CONCLUSIONS This report summarizes the methodology and results of updates to the 2007 recreational marine emissions inventory for the Houston-Galveston-Brazoria 8-county ozone non-attainment area. As outlined in the previous section, data collected from a boating activity field survey were used to calculate new inputs for the TexN model and improve the spatial and temporal allocation of emissions in the 8-county area. The results of the boat count survey showed an increase in the percentage of activity in Harris and Montgomery Counties and a decrease in Galveston County. The survey also allocated an increased percentage of activity to the weekend days compared to the default allocations in the TexN model. Recommendations for future areas of improvement to recreational marine emissions modeling and inventories include: 1) Currently the TexN model does not include a provision for diurnal (hourly) distribution of activity. As part of this project, diurnal activity distributions were calculated for each county as well as the HGB total (data not included in this paper). Future updates to TexN could be improved to include diurnal distributions of activity, so diurnal emissions could be calculated. This could be informative when calculating future recreational marine emissions inventories and particularly for understanding the contribution of recreational marine emissions to daily ozone season emissions. Alternatively, these diurnal distributions can be applied during the emissions pre-processing step before photochemical modeling is performed. 2) No updates were made to the total number of vessels by SCC used as the basis for State-level equipment populations in TexN. The current (2008) registration data obtained from TPWD did not accurately identify registered personal watercraft. In the future, one may be able to distinguish the actual PWC populations (based on other available fields including manufacturer and boat length). This distribution could be compared to the default State-level distribution and updated, if warranted. In addition, data from the field survey on the distribution of vessel types operating in the HGB area alone was compiled and could potentially be used to adjust the 16 assumed distribution in the 8-county area. Note, however, that these data do not indicate the fuel type of the vessel, which is needed to model emissions. 3) For this project, neither the TexN defaults for total state recreational marine activity were modified, nor the proportion of recreational marine emissions contributed by the HGB 8-county area. Only the allocation of those emissions to the eight counties in HGB were updated. As part of this project, raw boating activity data were collected for the HGB area. However this data could not be used in the TexN model because there was no frame of reference to compare it to statewide raw boating activity. Modeling of recreational marine emissions for the HGB area could be improved if a statewide survey of recreational boating were conducted. 4) The weekday-weekend data analysis presented in this report was oriented towards the input needs of TexN. More data analysis could be performed using the existing data set to investigate Monday, Friday, Saturday and Sunday activity differences. Such analysis might provide better estimates of average weekday, Friday, Saturday and Sunday activity estimates for ozone episode day modeling. 5) A collection of year-round fuel sales data at several marinas in the greater Houston area could provide more information on seasonal boating activity outside the months when the field survey was conducted. ACKNOWLEDGEMENTS This study was funded by the Texas Commission on Environmental Quality, grant agreement number 582-7-84007. REFERENCES 1 8-hour Ozone Nonattainment Area Maps, U.S. Department of Transportation, Federal Highway Administration, Washington, DC, 2004; http://www.fhwa.dot.gov/environment/conformity/nonattain/8hrozonepages/pages/tx_houston_galvesto n_brazoria.htm. Mobile Source Emissions – Past, Present, and Future, U.S. Environmental Protection Agency, Research Triangle Park, NC, 2008; http://www.epa.gov/OTAQ/invntory/overview/examples.htm. 2 3 Wells, S.; Baker, R.; Feldman, R., “Recreational Marine Emissions Inventory”; Prepared for the Texas Commission on Environmental Quality by Starcrest Consulting Group, Poulsbo, WA, and ERG, Inc., Lexington, MA, 2002. 4 Texas Beach and Bay Access Guide, Second Edition, Texas General Land Office, Austin, TX, 2008; http://www.glo.state.tx.us/coastal/access/houston-galveston.html. 5 Boat Ramp Locator, BoatUS.com, 2008; http://www.boatus.com/trailerclub/locator.asp?WT.mc_id=400069. 6 Texas Lake Finder, Texas Parks and Wildlife Department, Austin, TX, 2008; http://www.tpwd.state.tx.us/fishboat/fish/recreational/lakes/index.phtml. 17 7 Boating Statistics 2006, United States Coast Guard, Washington, DC, 2006; http://www.uscgboating.org/statistics/accident_stats.htm. 8 Weekly Retail Gasoline and Diesel Prices, Gasoline – All Grades, Jun-08 and July-08, Energy Information Administration, Washington, DC, 2008; http://tonto.eia.doe.gov/dnav/pet/pet_pri_gnd_dcus_y44ho_m.htm. 9 Weekly Retail Gasoline and Diesel Prices, Diesel (On-Highway) – All Types, Jun-08 and July-08, Energy Information Administration, Washington, DC, 2008; http://tonto.eia.doe.gov/dnav/pet/pet_pri_gnd_dcus_r30_m.htm. 10 Active Boat Registration Database – June 30, 3008, Texas Parks and Wildlife Department, Austin, TX, 2008. 18


© Copyright 2026