
Inheritance of Seed Hardness and Seed Coat Weight in Faba Bean
Inheritance of Seed Hardness and Seed Coat
Weight in Faba Bean (Vicia faba L.)
A Thesis
Submitted to the University of Khartoum in
Fulfillment of the Requirements for the
Degree of Doctor of Philosophy (Agric.)
By
Ikram Elfadul Abdalla Eltayb
B.Sc.(Agric.) Honours University of Khartoum
(May 1987)
M.Sc.(Agric.) University of Khartoum (1993)
Supervisor :
Professor Farouk Ahmed Salih
Faculty of Agriculture
University of Khartoum
Department of Agronomy
2004
DEDICATION
To my family :
My Husband : Omer Elzein
To his continued interest ..
My Kids: with a lot love
unlimited
encouragements
SUMMARY AND CONCLUSION
1- The main objective of this research has been to study the
magnitude of gene action controlling the inheritance of seed
hardness and seed coat weight of faba bean (Vicia faba L.). in F1,
F2 and their respective parents. Eight genotypes of faba bean were
used as parents in this study. The eight parents were selected in
season 2000/2001 according to their
variability in seed hardness
and seed coat weight. They were divided into tow groups, low
hard seeded parents (< 5.0% hard seeds) and high hard seeded
parents ( > 12.0% hard seeds).
2- In the first season (2001/2002), the eight parents were crossed
in a half diallel way producing 28 F1 hybrids. In the second season
(2002/2003), the eight parents, together with the 28 F1 hybrids were
grown in a therano cage for selfing and the F2 seeds were obtained.
The parents, F1 hybrids and F2 i.e. a total of 64 genotypes, were
grown in the third season. A randomized complete block design
with two replications was used to test the material. At harvest, in
the later two seasons (the evaluation seasons), data were collected, on
mean bases, for the following four parameters:
1. number of pods/plant,
2. number of seeds/plant,
3. 100-seed weight(g), and
4. seed yield/plot (g).
The percentages of the two seed quality characters, seed hardness
and seed coat weight, were determined as described by Salih
(1982).
3- The genetical analysis was performed using Hayman (1954,
1958)
method
to
determine
the
magnitude
of
gene
action
controlling the inheritance of seed hardness and seed coat weight.
Also Griffing (1956) Method 2, Model 1, was used for combining
ability analysis.
Both analysis of components of genetic variations and the (wr,vr)
graphs revealed seed hardness as a dominant character and the nonadditive gene effects (b, H1 and H2) were more important in the
inheritance of this character. Ambidirectional dominance of the
character and un equal distribution of genes also were detected .
The mean degree of dominance [(H1/D)
½
ratio, and the interception
points, a ] indicated an over dominance in the inheritance of seed
hardness. Also a predominance of the dominant alleles in the parents
used was observed, where positive F and Fri estimates and negative
r values were obtained. A group of two to three genes were
detected
dominant
in the inheritance of seed hardness, among them a single
gene was detected.
Regarding the inheritance of seed coat weight, the results revealed
that the character was under the control of both additive and nonadditive
genotypic
gene
action.
ratio (H1)
However, the dominant component of the
was
more
important.
Ambidirectional
dominance of the character was observed (b1 is not significant) and
the non-additive genetic components , H2, b2, were significant in both
F1 and F2 indicating unequal
distribution of genes in the parents
used. Positive F estimates were obtained in the two generations
indicating that, dominant alleles were more frequent than recessive
ones. Three to four genes were found to control seed coat weight
indicating its quantitative inheritance. Among them one gene was
dominant.
Partial dominance was shown by F2 and F1 in the 2nd evaluation
season (F1 2004) , while F1 in the first evaluation season (F1 2003)
exhibited over dominance.
In the (wr,vr) graph analysis, different and contradicting results were
obtained. The slopes of the regression lines in F1 (2004) and F2
were significantly different from zero and unity indicating the
presence of gene interaction in the material used. The interception
points were below the origin in the three graphs indicating over
dominance in the two generations. The array points tacked nearly
constant orders between graphs.
4- By the combining ability analysis, seed hardness showed
significant specific combining ability (sca) in both evaluation seasons
and general combining ability (gca) in the first evaluation season
only. The contribution of gca and sca for both seed coat weight
and 100-seed weight were significant indicating that both additive
and non-additive gene actions determine the expression of these
traits. The non-additive genetic variance (sca) was found to be
more important than the additive genetic variance (gca) for number
of pods/plant and number of seeds/plant. For seed yield, both
components of genetic variance were nonsignificant.
The parents C.28 and C.86/1 gave the desirable gca effect for all
studied traits. Thus they were the good general combiners for these
traits in this research. On the other hand, the parent
showed undesirable effects for all studied characters.
Bulk/1/1/2
Most of the
crosses exhibited nonsignificant sca effects for all
traits. But, the crosses C.28 × C.86/1
and ZBF/1/1 × C.28
had
desirable sca effect for all characters.
5- Yield/plot exhibited significant associations with number of
pods/plant, number of seeds/plant and 100-seed weight. High
significant and positive
associations were observed
between
number pods/plant and number of seeds/plant. Seed hardness showed
positive
and significant correlation with seed coat weight and
nonsignificant associations with yield and its components in the two
seasons.
6- The effect of pods location on the stalk of the plant on the
seed hardness and seed coat weight was studied. The pod position
had a significant effect on seed hardness in the two seasons. The
lower pods showed the greater grand mean for hard seed percentage
in the two seasons. Neither the pods position, nor the interactions
had significant effect on seed coat weight.
7- Also the seed coat structure of faba bean seed was studied.
One line was selected from the high hard seeded
group, C.36, and
another one from the low hard seeded group, C.28. Transverse
sections were prepared from a soft
and hard seeds of each line, at
the micropyle region and regions away from the micropyle .
Photomicrographs
were
taken
from
these
two regions
measurements (in microns) were recorded about the
and
seed coat
thickness, palisade layer, hourglass cells layer, the micropyle and
the trachids for all four groups. The main difference between the
two lines and between the soft and hard seeds of each line was in
the
size of
micropyle
and trachids, which were responsible for
water intery to the seeds. The hard seeds had smaller micropyle
opening and smaller trachids than soft seeds.
Conclusion:
Although, seed hardness appeared as a dominant character in the
genetic analysis, the parents tacked different orders between the
(wr,vr) graphs, indicating fluctuation of the dominance in the two
growing seasons and in the two generations. Also indicate the
important effect of the environment on this character. The
pod
position on the stalk also had significant effect on the high
percentage of hard seeds. Therefore, the effect of long exposure to
temperature, the variability of maturity period, the extend of
flowering period and their relation with seed hardness should be
studied.
In seed coat weight, the parents tacked
nearly constant orders
between the (wr,vr) graphs, but the gene association had more
important role in the degree of dominance, and the pod position on
the stalk had no effect. Hence, selection for this character seemed
to be more effective and care should be taken since both additive
and non-additive factors are included.
CHAPTER ONE
INTRODUCTION
Faba bean is known, in the English Language, by many names,
e.g. broad bean, horse bean, field bean, faba bean,….., but the
name faba bean has recently been widely used. It is a diploid
species (2n = 2x = 12), belonging to the family Papilionasae and is
believed to have originated in South West Asia. Botanically, it is
divided into three types according to seed size, namely, major (large
flattened seed), equinia (medium – sized seed) and minor (rounded
small seed). The main cultivars grown in the Sudan belong to the
latter two type, but predominantly the medium.
Faba bean is the main pulse crop in the Sudan in terms of both
area and production, being the main staple food and the main
source of protein for millions of people. Its production and
consumption have been steadily rising during the last four decades
(1960 – 2000). Area and production are shown in appendix (13) for
three decades. The area planted to faba bean during the seasons
1999/2000, 2000/2001 and 2001/2002
were 58, 59 and 59 thousand
hectars (1 hectar = 2.38 feddans) producing nearly 146 thousand
metric tones, each season (FAO, 2002). However, the productivity of
this crop is low compared to other crops. Many constraints
contributing to this low productivity have been reported by Salih
and Salih (1985).
Breeding work in faba bean had started at Hudieba Research
Station since the early 1960′s and from 1980, the work was also
initiated at Shambat Research Station (Salih, 1981, 1983a, Salih and
Salih, 1985). The main objectives of the breeding programme
were
to develop high yielding and stable varieties, with good quality
characters and resistance to local diseases. The breeding research
programme
was
achieved
through
germplasm
introduction,
hybridization, selection and to a lesser extent mutation breeding.
Breeding for seed quality includes breeding for light seed colour
and soft seed traits. The local faba bean land races have narrow
genetic base, therefore, several hundred accessions were imported
from different sources including Egypt, ICARDA, USSR, Ethiopia
and Europe, and evaluated. The bulk of the introduced material was
not adapted, except those with small seeds. However, the breeding
work had resulted in the release
Hudeiba 72,
SM-L,
of many cultivars e.g. BF2/2,
Shambat 75, Shambat 104,
Shambat 616,
Basabeer and Hudieba 93 (Salih and Salih, 1985, 1996; Salih, 1995).
Faba bean are characterized by having high percentages of hard
seeds and a tough seed coat. Furthermore, most commercial cultivars
have not been favorably appraised by consumers tastes,
because
seeds imbibed water too slowly, which detracts their seed coat to
quickly soften and easily be removed during meal preparation.
Therefore, recent breeding efforts have been directed towards the
production of high yielding stable cultivars with improved quality
especially with regard to water imbibing capability and cooking
quality. Information on the genetic control of seed hardness, seed
coat weight, seed coat thickness and their association with yield
and its components
appears to be essential for such improvement.
The objectives of the present research study were to:
1. study the magnitude of gene action controlling the inheritance of
seed hardness and seed coat weight among F1 and F2 generations
and their respective parents, as an initial step for making
selection to improve these characters,
2. estimate the general and specific combing abilities of parents for
seed hardness, seed coat weight, yield and some of yield the
components,
3. study the association between these two characters (seed hardness
and seed coat weight) and seed yield and its components, and to,
4. study the structural layers of the seed coat to determine their
role in water imbibitions.
CHAPTER TWO
LITERATURE REVIEW
2.1 Seed Hardness
Seed
hardness is a type of seed dormancy
resulting from the
impermeability of the seed coat to water or gases from physical resistant
to embryo expansion (Salih, 1982 b). In faba bean the occurrence of
highly impermeable seed coat is one of the most important factors in
delaying germination, affecting cooking quality and reducing the
market price (El-Bagoury; 1975; Salih and Ali , 1986). The hard
seed character in legume seeds is thought to be due to the
thickened palisade layer which is almost impermeable to water and
resist the
imbibition of it (El-Bagoury, 1975; Esau, 1977; Jha and
Singha, 1989). Jha and Singha (1989) found that small incision on
the seed coat was most effective in breaking the hard seededness.
No single specific cause of hard seed was reported in the
literature but, genetic, environmental and crop husbandry factors are
thought
to
be
responsible
for
this
phenomenon.
Regarding
environmental factors, long growing periods resulted in a higher
proportion
of
hard
seed
(Quinlivan, 1965). Similar
El-Bagoury (1975) in
increased
markedly
at
maturity
in
subterranean
clover
finding was reported in faba bean by
Egypt : in that, the hard seed percentage
with
delaying
maturity.
This
might
be
attributed to the increase in the hardness of the seed coat tissue as
a result
of drying and fluctuation of humidity and temperature
during this period and their effect on the permeability of the seed
coat (Quinlivan, 1965, 1968) and Baciu- Miclaus (1970) showed that
the incidence of hard seed was correlated with air humidity. On the
contrary, Salih (1982b)
found that shortening the growing season
increased the amount of hard seed in the cultivar H-72. According
to Zenari (1929 ),
hard seed character in various Leguminous ,
Malvaceous and Cistaeous was due to the degree of maturation and
therefore
can
not
be considered
hereditary.
Aitken (1939)
demonstrated that the continuity of an impermeable suberized
thickening of the top of the malpighian cell, caused hard seed of
(Trifolium subterraneum L), and the condition
subterranean clover
of this thickening depends on genotype environmental conditions
and the subsequent degree of dehydration of the seed. High
temperature associated with low humidity resulted in maximum hard
seededness
.
Research in the Sudan pointed that, a number of crop husbandry
factors affect the proportion of hard seed e.g. sowing date,
fertilizer, irrigation and time of harvest (Ayoub, 1971, 1973; Salih,
1978a, 1978 b, 1983 b;
Salih and Ali, 1986;
Ageeb, 1980;
El-
Mubarak et al., 1988). Delaying sowing date increases the percentage
of hard seed. Salih (1979 a) reported a range of 3.73
to 7.97% of
hard
24
seed
from
respectively.
including
mid
october
Ayoub (1971)
up
showed
to
November
that
fertilizer
sowing,
treatments,
nitrogen, phosphorous, potassium, gypsum and animal
manure, had an effect on the percentage of hard seed, ranging
between 15.0 and 23.0%. Salih (1979 b) found that different levels
of nitrogen and phosphorus had no significant effect, but different
methods of applying the fertilizers, broad cast, band and placement
with seeds had significantly affected the percentage of hard seed. In
another experiment,
Salih and Ali (1986) showed that the hard
seed percentage had increased significantly with increasing levels of
phosphorus.
Salih (1978 a) reported
irrigation
that, at Hudeiba, early termination of
increased the percentage of hard seed and that by
enforcing earlier maturity. On the other hand, Ayoub (1973), at
Hudeiba working with BF2/2
increasing
watering intervals
and Selaim varieties, found that
from 8 to 23 days had very little
effect on the hard seed percentage.
In addition to the above mentioned husbandry practices, the
percentage of hard seed was found to be affected by the time of
harvest.
According to
Ageeb (1980), the lowest percentage of
hard seed was obtained when the crop was harvested
after full
maturity. Similarly, Salih (1983 b); Salih and Ali (1986) and ElMubarak et al. (1988) found
decreased
with
that the hard seed percentages
delaying harvesting from
90 to 120 days from
sowing. Also diseases were considered to be a factor in increasing
the percentage of hard seed (Saeed et al., 1987).
Considerable variation in the percentage of hard seed among faba
bean cultivars was reported in the Sudan. Salih (1976 ) reported a
range of 0.1 to 22.8%, and eleven years later, he
(Salih , 1987)
recorded a range of 1.4 to 13.5%. Smaller range of 5.1 to 11.6%
was also reported by Salih and Khairi (1990).
Cultivars differ in their hard seed percentage from location to
another. In a trial conducted at four locations, namely Shambat,
Wad Medani, El-Rahad and New Halfa, Salih and Khairi (1990)
recorded a range of 4.7 at New Halfa to 15.1% at Shambat. The
cultivar H-72 produced 19.0,
7.8,
and
4.4% and the
breeding
line 00104 produced 10.8, 7.6 and 5.8% of hard seed at Shambat,
Wad Medani and New Halfa, respectively.
2.2 Seed Coat Weight
The seed coat provides a considerable protection for the enclosed
cotyledons and the embryo (Mc Ewen et al., 1974). Faba bean has
a tough seed coat which is responsible for the higher fibre content
of the seed. This crude fibre detracts from the value of faba beans
as a feed and food (Rowland, 1970; Waly and Abdel Aal, 1987).
The seed coat accounts about 15% of the weight of the bean seed
(Mc Ewen et al., 1974).
However, Cerning et al. (1975) revealed
that, it constitute a 13.17% of the seed dry weight and it contains
89% of the seed protein.
A large variability in the seed coat percentage was reported by
many workers ( e.g. Marcellos, 1987; Shehata et al., 1987; Salih and
Khairi, 1990 ).
Marcellos (1987) examined 30 inbred lines from
different sources, viz Mediterranean, Middle East, North Africa and
India, for seed coat percentage. He reported a range of 12.2
to
18.2% in a cross locations and also found that the variance fraction
for the effect of genotypes was highly significant. Salih and Khairi
(1990) reported a range of 14.2% in line 00198 to 16.6% in H-72.
Beside that, they studied the variability in testa fraction of ten
genotypes at four locations, namely Wad Medani, New Halfa, El
Rahad and Shambat, and recorded 17.8, 17.5, 14.2 and 12.1%, for
the four sites, respectively.
Shaudary and Buth (1970) examined the seed coats of 14 Indian
pulses and found that, Vicia faba
had the largest palisde and
hourglass cells. These cells are primarily responsible for the
thickness of the seed coat. Mc Ewen et al. (1974), reported a wide
range of variation in thickness of hourglass cells of faba bean. A
significant variation
in the seed coat thickness was detected by
Rowland and Fowler (1977) in faba bean and that due to cultivars
and locations. Also, they revealed that the position of the seed on
the plant had no effect on the seed coat thickness.
2.3 Inheritance of Seed Hardness and Seed Coat Weight
2.3.1 Inheritance of Seed Hardness
The seed hardness character in legumes was reported by many
workers (e.g. Altiken, 1939; Forbes and Wells, 1968; Donnelly et al.,
1972), to be controlled by both environmental and genetic factors.
However, Zenari (1929), reported that, hard seed in various families
like leguminasae, Malvaceae and Cistaceae was due to the degree
of maturation and could not be considered hereditary. Lute (1928)
working with alfalfa (Medicago sativa L.) seed postulated that
genetic differences may be obscured by climatic factors.
Little work on the inheritance of seed hardness in Vicia faba was
reported in the world and no work was conducted in the Sudan.
All studies on inheritance of hard seed revealed that, hard seed is
dominant over soft seed, and only few genes are involved (e.g.
Dhirendra and Singh, 1984;
Ramsay, 1997, both working in faba
bean; Forbes and Well,1968, in blue lupin; Donnely et al., 1972, in
the genus Vicia).
In a crossing research work of six genotypes of Vicia faba.,
Dhirendra and Singh (1984), concluded that dormancy is controlled
by both physical and genetic factors. Also dormancy is dominant
over non-dormancy and governed by a single gene. Similarly,
Ramsay (1997), showed that the segregation patterns for seed
dormancy in faba bean is monogenic. This gene, was named doz,
and
was
linked
to
a gene
controlling
anthocyanin
and
proanthocyanidin synthesis.
The result of four crosses in the genus Vicia, let Donnelly et al.
(1972), to assume a two – gene inheritance for hard seed. Gene A
acts as simple dominant for hard seededness. Gene B is dominant
for soft seededness when the A locus is homozygous recessive (aa).
The double recessive genotype (aabb) is hard seeded. However,
they reported some exceptions in F2 as a double recessive epistasis
(7 : 9).
Lebedeff (1947),
in Phaseolus
vulgaris L reported that,
only a few genes are involved in the differentiation of hard and
soft – seeded selections.
Bennett (1959) found a rapid increase of hard seed percentage in
successive generations of crimson clover suggesting a good heritability
of the character. Similarly, Donnelly (1971), when crossed Vicia
sativa (2n = 12) with Vicia cordata (2n = 10 ) found that selection for
hard seed resulted in an increase in frequancy of plants that
produced 70 to 100% hard seed.
2.3.2 Inheritance of Seed Coat Weight
Most studies regarding the seed coat characteristics
in legumes
were concerned with the seed coat thichness (e.g. Rajendra et al,
1979; Ojomo, 1972; Rowland and Fowler, 1977;
El Shazly et al.,
1995) and colour ( e.g. Bassett, 1997, 1998; Klasinsko, 2000 ). Little
studies were converted towards the inheritance of seed coat weight.
Through the diallel crossing system, Waly and Abdel Aal (1987),
studied the inheritance of seed coat weight by using five parents,
and they revealed that the character was under the control of both
additive and non – additive gene action. Similar result was reported
by El Shazly et al. (1995) and also they concluded that, care showed
be taken when planning a breeding programme for selection of thin
seed coat, since the genetic behavior of this trait is related to the
use of specific genetic material. However, in cow peas, Ojomo
(1972) found that the inheritance of seed coat
thickness was
controlled by two major gene pairs, with a segregating ratios of 9:6:1
and suggesting a duplicate gene interaction.
2.4 Phenotypic and Genotypic Correlations
Phenotypic and genotypic correlations between characters give an
indication of the characters which may be used as indicators in
selection of desired traits (Johnson et al., 1955).
The genotypic correlations among characters for which selection is
practiced may have important implications in breeding procedures
and programmes. Usually the main
objectives of the breeding
programmes are to develop high yielding and stable varieties with
good quality characters. It is known that yield has low heritability
because of the strong influence of environment on it. Therefore,
determination
of
the
interrelationships with
yield
structure
of
a crop
and
its
its components and seed quality traits are
essential.
Kambal (1969) reported that number
of pods per plant had the
highest correlation with yield in faba bean. Results obtained by
Abdalla (1976) and
Magyarosi and Sjodin (1976)
confirmed
this
findng. In contrast Picard and Berthelem (1980) reported that seed
weight was the most valuable yield component which can be used
as a selection criterion for seed yield potential and yield stability in
faba bean.
Number of pods per plant is greatly dependent upon the magnitude
of the number of podded nodes per plant (Magyarosi and Sjodin,
1976). Strong positive correlations exist between seed yield and
number of pods per plant (e.g. Kambal, 1969; Neal and McVetty,
1984; Bakheit and Mahdy, 1988). On the other hand, many workers
pointed that number of pods per plant was negatively correlated
with number of seeds per pod and seed weight (Mutwakil, 1965;
Yassin, 1973; Abu El-Zahab et al., 1980).
Number of seeds per plant is an important character in determining
grain yield in faba bean and was found to be positively correlated
with number of pods per plant (Habetinek et al., 1983). Shalaby and
Katta (1976); Mahmoud et al. (1978); Naidu et al. (1985); and Bakheit
and Mahdy (1988) found a positive correlation between number of
branches and seed yield per plant. Positive significant correlations
of number of branches with seed yield, number of pods per plant
and number of seeds per plant were obtained by Kambal (1969);
Mahmoud et al. (1978) and Sindhu et al. (1985).
Seed weight is one of the
important yield components in faba
bean. Magyarosi and Sjodin (1976) ranked it as a third yield
contributing character, following number of
pods per plant and
number of seeds per pod. Magyarosi and Sjodin (1976); Habetinck
et al.(1983); Neal and McVetty (1984) and Hussain et al. (1988)
reported a positive relationship between yield and seed weight. 100 seed weight was found to be negatively correlated with number of
pods per plant and with seeds per pod (Kambal, 1969; Mahmoud
et.al., 1978; Neal and McVetty, 1984). Also negative genotypic and
phenotypic correlations of seed weight with number of pods per
plant were reported by Yassin (1973).
Regarding the seed quality character, Salih (1976), Ramsay (1997)
reported a negative association between the hard seed percentage
and seed weight. Also Salih (1976) and Rowland and Fowler (1977)
found that the final seed yield is not associated with seed coat
thickness. In the same experiment, Rowland and Fowler (1977)
found that the seed weight and seed coat thickness were not
correlated
varieties.
within
varieties
but
were
Waly and Abdel Aal (1987)
highly
reported
correlated
a positive
among
non-
significant correlation between seed coat weight and seed weight in
both the parents and F1 hybrids. Also, Ikram (1993) found that the
seed quality characters exhibited non-significant correlations with
yield
and
yield
related
characters.
Moreover,
the
correlations
between the seed quality characters themselves, were also non-
significant. In contrast, Rowland (1970) found that, 1000-seed weight
was negatively correlated with crude fiber and positively correlated
with seed coat thickness. Also, Marcellos (1987) found that testa
fraction increased as seed weight decreased and that was within the
tested 30 genotypes of diverse origins.
2.5 Combining Ability
The value of an A- or B- line for hybrid production depends on the
characteristics of the line as such, and its performance (Kambal,
1962). This latter trait has been called combining ability and is
usually subdivided in
plant breeding into two categories, general
and specific.
Spraque and Tatum (1942) defined general combining ability as "the
average performance of a line in hybrid combinations". Specific
combining ability is used to show those lines in which certain
combinations do relatively better or worse than would be expected,
on the bases of the average performance of the line involved.
General combining ability is associated with genes which are
additive in their effects. Specific combining ability, on the other
hand, is usually attributed to non-additive types of genes
dominance
and/or
epistasis (Kambal, 1962).
such as
Bond (1967)
and
Mahmoud and El-Ayoubi (1986) showed that, selection of an inbred
parent for F1 hybrid varieties of faba bean can be made on the bases
of its general and specific combining abilities.
Most of the studies in faba bean revealed a significant combining
abilities for seed yield and its components and seed quality traits
(e.g. Kaul and Vaid, 1996; El-Hosary et.al., 1997; Waly and AbdelAal, 1987; El-Hosary, 1984, 1985). However, the seed yield and its
components found more interest than seed quality traits in research.
2.6 Seed Coat Structure and its Anatomy
Faba bean
has been characterized as having
a tough seed coat
which causes difficulties in grinding and is responsible for seed
high in fibre content (Rowland and Fowler, 1977). Furthermore, Bell
(1975) and Rowland (1970) postulated that, seeds of faba bean have
much higher crude fibre level than the seeds of many other
legumes. This crude fibre is located mainly in the seed coat and
detracts from the use of faba beans as feed and food.
Esau (1979) reported that the presence of palisade layer in seed
coats of certain hard legume seeds is assumed to be causally
connected
with
their
degree
of
impermeability.
Before
that,
Shaudaey and Buth (1970) examined the seed coats of 14 Indian
pulses and found that, the Vicia faba had the largest palisade and
hourglass cells.
These cells are primarily responsible for the
thickness of the seed coat. A wide range of variation in the
thickness of hourglass cells and palisade of faba bean had bean
observed by Mc Ewen et.al. (1974) and.
Youssef and Bushuk
(1984)
Mc Ewen et.al.(1974) determined the structure of seed coat of faba
bean variety Akerprle using scanning electron microscope. The
photomicrographs showed no discontinuity in the thick seed coat.
Cross section of the seed coat showed characteristic palisade,
parenchyma, trachid and hourglass cell. They showed a full description
of faba bean seed layers. And they indicated that: The hilum or
seed scar, play an active role in the dehydration process of the
bean. Tissues on the surface of the hilum appears flaky and fold.
A cross-section of the seed coat in the hilum region showed several
distinct types of tissues. Immediately under the flaky surface layer
of the hilum there is a double layer of palisade cells, where as the
inner layer appears to be continuous with the single palisade layer
found throughout the seed coat. The trachid cells are below the
central groove of the hilum. Arround the trachid cells there are
loosely and irregularly structured parenchyma cells. In regions away
from the hilum, between the palisade and the parenchyma cells , the
hourglass cells are located, which show a variety of shapes and
sizes.
Youssef and Bushuk (1984) demonstrated that the micropyle is
situated just below the hilum in legume seed. Also they explained
that the hard - to cook Egyptian types, their seeds had smaller
micropyle opennings, shorter hourglass cells and thicker cell layer
than those of soft - to cook types. This micropyle governs water
entry to the cotyledon as shown by Powerie et.al. (1960) and
Yossef et.al. (1982).
CHAPTER FOUR
RESULTS
4.1 Inheritance of Seed Hardness and Seed Coat Weight
4.1.1 Inheritance of Seed Hardness
4.1.1.a
Using Genetic parameters
Analysis of variance according to Hayman(1954), (Table 2) and the
estimation of components of genetic variation (Table 3) revealed that
most variations in seed hardness
were attributed to non-additive
gene effect. In that, the items b, b2 and b3 (non-additive factors)
were significant in both F1 and F2. However, the item b1 showed
nonsignificant effect in the two generations.
The non-additive genetic components of variations, H1 and H2, were
significant in both F1 and F2, while the additive genetic component,
D, revealed nonsignificant effect (Table 3). The estimates of F
(average covariation of additive and dominance effect over all
arrays) had positive nonsignificant values in the two generations. The
estimates of h2 (weighted average dominance factor effect) were
positive in F1 and negative in F2. The environmental variance, E,
was also significant in the two generations.
Regarding the genetic parameters ratios (Table 3), the estimates of
½
average degree of dominance, (H1/D) , were 1.5, 3.9 and 2.28 for
the F1 in the first evaluation season (2003), F1 in the second
evaluation season (2004) and F2, respectively. Also, the average
values
for uv (frequencies of positive and negative alleles ) over all
loci were 0.15, 0.21 and 0.2, respectively, as presented by the ratio
H2/4H1 (Table 3).
Table 2: Analysis of variance and mean square
Of genetic variances for seed hardness in of faba bean
(V. faba L) in the two seasons, 2002/3-2003/4.
Sourse of variation d.f
F1(2003) F1(2004) F2
Treatments
35
22.52**
39.84**
36.75**
Replications
1
38.57**
3.45
30.36**
Error
35
5.83
17.14
11.28
LSD
4.90
8.4
6.72
C.V.%
36.0
35.1
26.7
S.E
2.42
4.14
3.36
Additive variance
a
7
58.067
67.46
42.730
b1
1
20.927
64.68
1.19
b2
7
92.639*
57.37*
33.67*
b3
20
24.880**
83.95**
66.02**
b
28
41.679*
76.61**
55.61**
total
35
78.30
136.07
97.53
a × blocks
7
24.73
23.16
16.81
b1 × blocks
1
10.67
6.57
13.09
b2 × blocks
7
25.23
12.62
8.39
b3 × blocks
20
5.44
18.97
18.13
b × blocks
28
14.58
16.47
14.58
total × blocks
35
28.27
30.98
26.69
non-additive
variance
*p ≤ 0.05, **p ≤ 0.01.
Table 3: Components of genetic variance, their standard errors
and the estimated genetic parameters for seed hardness in faba
bean (Vicia faba L.), in the two seasons,
2002/3-2003/4.
Genetic variance F1 (2003)
F1 (2004)
F2
additive genetic
variance D
18.91 ±10.56 4.17± 2.89
6.64±4.49
45.11*±10.53
25.92*± 9.16
1.1* ± 0 .179
32.91 ± 8.82
3.37* ± 1.53
63.71*±0.78
53.62*± .91
2.55 ± 7.38
7.56 ± 0.61
8.38*± .32
138.09*± 2.65
128.34*±7.44
-81.73*±5.11
16.26± 2.07
5.91*±1.56
1.5
0.15
3.9
0.21
2.28
0.20
3.2
-0.5*
0.25
0.05
20.9
1.6
-.35*
0.123
0.05
13.1
3.12
-0.34*
0.120
-0.64
11.7
non-additive
genetic variance
H1
H2
h2
F
E
genetic
!
parameters
( H1/D)½
H2/4H1
[(4DH1 ) ½ + F]/
[(4DH1 ) ½ - F]
r
r2
h2/H2
Heritability (%)
*p ≤ 0.05, **p ≤ 0.01.
for genetic parameters ratios in F2 see material an
methods pp 23
!
The
proportion
of
dominant
and
recessive
genes
[(4DH1))½+F]/[(4DH1)½–F], approximately, ranging between two to
three
genes and the ratio h2/H2 (number of genes which control
the character and exhibit dominance ) gave 0.05 and 0.64 values in
the two generations, respectively. The coefficient of correlation (r)
between the parental order of dominance (wri + vri) and the parental
measurement (yri) gave negative and significant values in the two
generations (Table 3). Heritability percentages were 20.9, 13.1 and
11.7 in F1 (2003), F1 (2004) and F2, respectively.
4.1.1.b using (wr,vr) Graph
To evaluate the inheritance of seed hardness of faba bean by means
of (wr,vr) graph analysis, the wr (covariance of arrays ) values were
ploted against the corresponding values of vr (variance of arrays ),
(appendix 3 for F1(2003), F1(2004) and F2) . From all, the three
graphs (figures 1, 2 and 3),
the following results could be readied.
The general picture of the graphs appeared to be similar. The array
point exhibited considerable scatter around the regression lines in each
graph, the regression line was not significantly different from zero
or unity i.e. b = 0.55 ± 0.45, 0.48 ± 0.52 and 0.404 ± 0.33 in the
three graphs, respectively. Also
each line intercept its wr axis a
short distance below the origin, in that, the interception
point, a,
had negative sign ( a = -3.66, -8.26 and -3.69), respectively. However,
the array point orders were different between graphs. In F1 (2003)
(Fig 1), the array points 2(C.28) and 4(C.36/1) are near to the origin
(P > 75% dominant genes), array 5(ZBF/1/1), 8(C.36),
3(C86/1), and 1(BB7) were middle
7(C.22),
in their positions (50 < P <
75%). On the other hand the point for array 6(Bulk/1/1/2) is far
(away) from the origin. In F1 2004 the array points 1, 3, 5 and 6
were near to the origin, while 4, 7 and 8 in the middle and 2 was
far away from the origin.
Regarding the F2 data, the array point 1 was near to the origin.
The points of the arrays 5, 6, 2, 3 and 7 were middle in their
position and also the point
for
array 3 was far away from the
origin.
4.1.2 Inheritance of Seed Coat Weight
4.1.2.a using genetic parameters
Hayman (1954) analysis of variance is presented in Table 4 and Table
5 showed the estimates of components of genetic variance in seed
coat weight.
Both additive (a) and non-additive (b) gene effects were significant
in F1 and F2. The items b and b3 had significant effects in the two
generations, while b1 showed non signification effect, and b2 had
significant effect in F1 only (Table 4).
The estimates of genetic variance component (Table 5), confirm the
results of the means of squares.
The statistics representing both, the
additive (D ) and non-additive (H2 and H1) gene effects were significant
in the two generations. The average dominance (h2) showed negative
values in the two generations, and the F estimates had significant and
positive values. The environmental variance (E) was also significant
in the two generations.
The genetic parameter ratio (H1/D)½ was 1.5 in F1 (2003), 0.57 in F1
( 2004) and 0.95 in the F2.
The gene frequency, uv, ratios
were
0.20, 0.19 and 0.12, respectively. Proportion of dominant and recessive
genes were three to four genes and the average dominant
gene
ratios (h2/H2) were -0.21, -0.2 and -0.35 values in F1 (2003), F1
(2004) and F2, respectively. The coefficients of correlation (r) between
parental order of dominance (wri+vri ) and the parental measurement (yri)
gave negative values in the two generations. The values of heritability
estimates were low to moderate as follows 13.7, 51.3 and 20.8% in
F1 (2003), F1 (2004) and F2, respectively.
4.1.2.b using (wr ,vr ) Graph
figures 4, 5 and 6 showed the (wr ,vr ) graphs for seed coat weight in
F1 (2003), F1 (2004) and F2 , respectively.
The regression lines slopes were 0.69 ± 0.42, 1.65 ± 0.45
± 0.31 in F1 (2003), F1 (2004) and F2, respectively.
and 1.69
The interception
points showed negative values, -1.14, -0.57 and -2.13, respectively.
However,
graphs
the array points tacked nearly constant orders
between
wr
25
20
15
6
10
4
5
0
-5
7
1
vr
3
2
-5 0
5
10
8
15
20
25
5
-10
-15
-20
-25
Fig 1: ( wr-vr) graph for hard seed of faba bean in F1 ( Season 2002/2003)
b = 0.55 ± 0.45
a = -3.66
— w
–⋅–⋅
. w
rei
ri
(expected regression line of b = 1 )
wreii (estimated regression line)
points orders of the arrays
wr
40
30
20
10
2
6
1
0
-10
7
3
4
5
0
10
20
30 8
40
50
60
-10
-20
-30
Fig 2 : (wr,vr )graph for hard seed of faba bean in F1( season2003/2004)
b = 0.48 ± 0.52
a = -8.26
— w
–⋅–⋅
. w
rei
ri
(expected regression line of b = 1 )
wreii (estimated regression line)
points orders of the arrays
7
wr
30
25
20
15
10
2
5
1
5
6
0
-10
7
-5 0
3
10
204
v
30
8
-10
-15
-20
Fig 3: ( wr, vr) graph for hard seed of faba bean in F2
b = 0.404 ± 0.33±
a = -3.69
— w
–⋅–⋅
. w
rei
ri
(expected regression line of b = 1 )
wreii (estimated regression line)
points orders of the arrays
40
Table 4: analysis of variance and mean squares of genetic
variances for seed coat weight in faba bean
(Vicia faba L) in the two seasons, 2002/3 - 2003/4.
Source of variation
Treatments
Replications
Error
LSD
C.V%
S.E
additive variance
a
non-additive
variance
b1
b2
b3
b
total
a × blocks
b1 × blocks
b2 × blocks
b3 × blocks
b × blocks
total × blocks
*p ≤ , **p ≤ 0.01
d.f
35
1
35
F1(2003)
3.76**
6.07**
1.23
2.25
8.9
1.11
F1(2004)
3.36**
0.52
0.97
2.003
7.2
0.99
F2
2.46**
0.03
0.58
1.52
5.95
0.76
7
11.602*
23.35*
8.89*
1
7
20
28
35
7
1
7
20
28
35
1.43
4.897*
7.83*
6.87*
13.31
3.36
1.82
1.46
2.67
2.21
4.6
0.097
2.93*
2.1**
2.24**
8.26
5.53
0.315
0.54
0.14
0.024
2.14
3.35
10.83
1.47**
3.87*
7.98
2.64
0.36
5.08
0.15
1.39
2.98
Table 5: Components of genetic variance, their standard errors
and the estimated genetic parameters for seed coat weight
in faba bean (Vicia faba L.), in the two seasons, 2002/3-2003/4.
Genetic
F1(2003)
variance
additive genetic
variance
D
2.48*±0.92
non- additive
genetic variance
H1
5.61*±2.13
H2
4.91*±1.85
h2
-1.01* 0.24
F
2.60 ±2.20
E
0.679* ± .31
genetic
!
parameters
( H1/D)½
H2/4H1
[(4DH1 ) ½ + F]/
[(4DH1 ) ½ - F]
r
r2
h2/H2
Heritability (%)
F1(2004)
F2
4.04*± 0.32
4.44* ± 0.31
1.32* ± 0.67
0.999* ± .52
-0.198 0.43
2.80* ± 0.76
0.48* ± 0.11
16.35* ± 2.81
7.31* ± 2.44
-2.61* ± 0.64
12.80* ± 1.44
0.27* ± 0.10
1.5
0.2
0.57
0.19
0.95
0.12
3.6
-0.5*
0.25
-0.21
13.7
4.01
-0.8**
0.64
-0.2
51.3
4.09
-0.6**
0.36
-0.35
20.8
*p ≤ 0.05, **p ≤
for genetic parameters in F2 see pp 23
!
wr
5
4
3
2
2
1
3
7
1
8
5
0
vr
6
-10
-5
-1
0
5
10
15
4
-2
-3
Fig 4: ( wr,vr) grahp for Seed coat weight of faba bean in F1 (season
22/2003)
b = 0.69 ± 0.42
a = -1.14
— w
–⋅–⋅
. wri
rei
(expected regression line of b = 1 )
wreii (estimated regression line)
points orders of the arrays
wr
6
4
1
3
2
4
0
-1
5
6
7
2
8
vr
0
1
2
3
-2
-4
-6 seed coat weight of faba bean in F1 ( Season
Fig 5: (wr,vr) graph for
2003/2004)
b = 1.65 ± 0.45
a = -0.57
— w
–⋅–⋅
. w
rei
ri
(expected regression line of b = 1 )
wreii (estimated regression line)
points orders of the arrays
wr
8
6
4
1
2
6
7
0
-1
-0.5
0
4
0.5
3
8
5
2
vr
1
1.5
2
2.5
3
-2
-4
-6
Fig 6: (wr,vr) graph for seed coat weight of faba bean in F2
b = 1.69±0.31
a = -2.13
— w
–⋅–⋅
. w
rei
ri
(expected regression line of b = 1 )
wreii (estimated regression line)
points orders of the arrays
3.5
4.2 Combining Ability
The investigated genotypes, F1 and their respective parents, showed
highly significant differences (Table 6) for seed hardness and seed
coat weight in the two evaluation seasons ( 2002/2003 and 2003/2004 ).
However, significant differences were observed for seed yield /plot,
number of pods/plant, number of seeds/plant and 100-seed weight
in the second season only. Combining ability analysis was restricted
only
in
F1 towards
characters
in
which
genotypes
exhibited
significant difference
Means
squares
for
combing
ability
for
all
characters
are
summarized in Table 7. Seed hardness exhibited significant specific
combing ability ( sca ) in both seasons and significant general
combing
ability ( gca)
in
the
first
season only. Moreover,
signification gca and sca were observed in seed coat weight and
100-seed weight in both seasons, but number of pods/plant and
number of seeds/plant gave only significant sca. However, seed
yield/plot had nonsignificant combing ability.
Estimates of gca effects for individual parents for all traits from
the F1 generation are presented in Table 8. The parental lines 2(C.28),
3(C.86/1)
and 4( C.36/1) gave significant positive gca effect for
number of pods/plant, number of seeds/plant and 100-seed weight.
Moreover, they showed negative significant effect in seed hardness
and seed coat weight, except the
showed negative significant
and
8(C.36) gave
4(C36/1) which
effect for seed coat weight in the
second season. On the other hand,
7(C.22)
parental line
the parental lines 5(ZBF/1/1)
significant
gca
effect
for
high
percentages of hard seed and seed coat weight in both seasons. Line
1(BB7) had the highest gca effect for lower seed coat weight
percentages
in the two seasons, but it gave negative values for
number of pods/plant and number of seed/plant. Furthermore it
gave positive effect for high percentages of hard seed in the
second season. The parental line 6( Bulk/1/1/2) showed undesirable
effects for all characters studied .
Table No. 9 spresent the estimates of sca effects of individual cross
combinations for all characters studied in F1. Most of the crosses
exhibited nonsignificant sca effect for all traits. For seed hardness
the crosses 1×3, 1×7, 2×5, 2×6, 3×5, 5×6, and 7×8 gave high positive
and significant sca effects.
The crosses 2×3, 2×7, 5×8, and 6×8,
showed negative significant sca effects. However the crosses 1×6,
3×7 and 5×7 had negative and significant effects in the first season
only.
Regarding
seed
coat
weight,
most
of
the
crosses
showed
nonsignificant sca effects. The highest negative values were given
by cross 4×7 followed by cross 1×3 in both seasons . However, crosses
1×6 and 2×6 gave the highest positive effects. The crosses 2×3,
2×4, 2×5, 2×6, 3×6, 4×5, 4×6, 4×8, 5×6,
and 5×8 showed
significant and positive effects for two or three traits of yield and
its components.
Table 6:
characters
Source
of d.f
vriation
Seed hardness
I
Treatments 35 22.53**
Replications 1 38.57
error 35 5.833
Lsd
C.V%
S.E.
Mean squares from analysis of variance for all characters studied in faba bean
(Vicia faba L) in the two seasons, 2002/203-2003/2004
4.903
36.0
2.42
II
39.84**
3.45
17.14
8.404
35.10
4.14
Seed coat
weight
I
II
Pods/plant
I
3.76** 3.36** 3.57
6.07
0.517 12.251
1.23
0.973
7.96
2.25
8.9
1.11
2.003
7.2
0.99
5.73
35.2
2.82
Seeds/plant
100-seed weight
II
I
II
I
II
74.72**
15.49
28.72
30.22
144.22
50.00
282.7**
33.6
131.00
54.17
22.67
42.89
38.77**
56.003
8.206
10.88
19.6
5.36
14.36
35.4
7.07
23.24
28.50
11.4
13.296
4.8
6.9
5.82
5.70
2.87
*p≤ 0.05, **p≤ 0.01.
I, II were the seasons 2002/2003 and 2003/2004, respectively.
Yield/plot
I
II
0.0396 0.221**
0.016
0.18
0.086 0.0794
0.597
8.10
1.106
0.573
7.3
0.99
characters
Source of
variation
General
combining
ability(gca)
Specific
combining
ability(sca)
Table 7: Mean squares from combining ability analysis for all characters.
(Seed hardness and seed coat weight in the two seasons, and other traits in the last season).
Seed hardness
Seed coat weight Pods/plant Seeds/plant
100Yield/plot
*p≤
seedweight
0.05,
F1(2003) F1(2004) F1(2003) F1(2004)
**p≤
d.f
0.01.
7
10.53**
17.31
2.66**
5.84**
26.89
108.88
42.59**
0.053
28
11.44**
19.43*
1.69**
1.89*
39.88**
149.15*
13.07**
0.14
105
2.9
8.57
0.62
0.487
14.36
6551
4.10
1.39
Component
due to gca
1.16
0.874
0.204
0.535
1.25
4.34
3.85
-0.039
Component
due to sca
7.5
10.86
1.07
1.4
25.52
83.64
8.96
-1.25
ratio
0.15
0.08
0.20
0.38
0.05
0.05
0.43
0.03
error
Table 8: Estimates of the general combining ability effects from the first generation
for all characters in the seasons 2002/2003-2003/2004
Characters
Seed coat weight
Seed hardness
parents
BB7
C.28
C.86/1
C.36/1
ZBF/1/1
Bulk/1/1/2
C.22
C.36
S.E(gca)
S.E(gi-gi)
F1(2003)
Pods/plant
F1(2004)
F1(2003)
Seeds/plant
F1(2004)
100-seed
weight
Yield/plot
0.556
- 2.57*
- 2.29
- 0.07
0.31
0.224
1.068*
1.369*
- 0.204
-1.131*
-2.104**
-1.104
1.696**
0.004
0.729
2.321**
- 0.97**
- 0.45*
0.00
- 0.22
0.54*
0.05
0.52*
0.53*
-1.124**
- 0.659*
- 0.624*
0.651*
1.016**
0.301
0.204
0.641*
- 0.495
1.82*
1.915*
1.595*
- 0.336
-2.395*
1.095
-2.20*
-5.861**
2.657*
2.542*
3.759**
1.347
- 4.278**
1.947
0.887
2.246**
1.266*
3.241**
-2.109**
-1.629*
-1.674*
0.291
-1.634*
0.068
0.018
0.069
0.069
-0.096
-0.11
0.018
-0.037
0.51
0.76
0.47
1.31
0.22
0.34
0.21
0.31
1.12
1.7
1.75
3.6
0.47
0.91
0.059
0.089
*p≤ 0.05, **p≤ 0.01
Table 9: Estimates of specific combining ability effects of individual cross
Combinations for all characters studied in F1 generation
Characters Seed hardness
cross
1×2
3
4
5
6
7
8
2×3
4
5
6
7
8
3×4
5
2003
0.094
3.79**
-0.21
-1.47
-4.5**
3.80**
4.25**
-2.67*
1.27
1.96*
1.95*
-2.42*
0.53
1.42
5.86**
Seed coat weight
2004
-4.43*
3.8**
1.3
1.00
0.7
4.32*
-1.37
-4.78
8.71**
4.42*
14.35**
-4.91*
11.04**
0.95
4.4*
2003
-1.31
-1.76
1.86*
1.29
1.89*
-0.08
1.106
-0.82
1.24
0.98
10.11**
. 039
1.29
0.087
-0.97
2004
-0.316
0.199
0.373
0.409
1.124*
0.179
1.134
-0.716
0.809
0.694
11.18**
0.264
0.769
0.324
0.009
Pods/plant
Seeds/plant
2004
-5.28*
-2.126
-3.606
-3.426
-1.466
5.64*
1.59
4.66*
5.48*
9.66**
25.5**
3.48
0.37
2.33
6.26*
2004
-8.29
-3.67
-4.27
-4.53
-2.05
9.77
-4.12
4.26
0.34
7.95
6.724
4.504
16.514*
10.557*
7.769
100-seed
weight
2004
1.45
2.225
5.325**
-0.405
4.39**
2.425
-2.15
6.205**
-3.445*
3.075*
2.62*
-2.595
-0.67
-1.42
-0.65
Yield/plot
2004
0.109
-0.191
-0.233
0.066
0.021
0.174
0.137
0.036
0.632**
-0.344
0.711**
0.078
0.247
0.12
0.315
Table 9: Cont.
6.32*
0.624
1.10
-0.48
2.02*
-2.605*
4.49
6
0.354
10.369*
0.03
0.579
0.83
1.125
-1.32
-1.96
7
0.121
3.38
0.584
0.78
0.137
-0.395
-1.621
0.03
8
0.136
*
*
-0.67
-0.667
-0.60
-0.35
2.95
11.102
0.159
4×5
0.35
**
*
9.49
-0.75
-1.401
1.44
2.695
-5.07
1.23
6
0.334
0.454
-4.17*
-3.63*
0.78
0.40
3.60
1.08
7
0.29
*
**
**
-1.24
1.28
-1.24
4.455
4.75
18.76
1.58
8
0.416*
0.034
3.8*
2.87
12.39*
3.9858
0.374*
-1.023
3.84**
5×6
*
-1.51
3.63
1.55
-2.38
0.307
1.03
0.76
-0.08
7
*
**
**
**
*
-0.41
8.23
2.725
-2.18
-0.403
-7.52
18.52
0.41*
8
0.54
-0.503
2.54
4.29
3.845**
-0.185
6 ×7
-1.11
-2.77
**
**
-1.14
-0.313
-2.96
-7.60
-0.32
8
-3.51
-5.32
0.52
**
**
*
-0.54
0.017
-3.85
13.73
-0.36
4.01
3.40
7 ×8
2.555
———————
————— ——— ———— —————
—————
—————
———— ————
0.63
0.7
1.07
1.83
0.181
S.E(sca)
5.1
2.36
1.3
0.76
0.58
1.87
3.2
0.22
S.E(sij-sij)
8.87
4.15
2.22
1,2,3,........,8 are the parents, BB7, C.28, C.86/1, ZBF/1/1, Bulk/1/1/2, C.22 and C.36, respectively.
*≤ 0.05; **p≤ 0.1.
4.3 Interrelationships Between the Different Characters
Estimates of phenotypic correlation coefficients for various pairs of
characters, in all possible combinations, are presented in Tables 10
and 11 for the two evaluation seasons (2002/2003, 2003/2004),
respectively.
In both seasons, yield/plot showed highly positive significant
correlations with number of pods/plant, number of seeds/plant and
100-seed weight. Also
highly significant and positive association
was observed between number of pods/plant and number of
seeds/plant in both seasons. However, 100-seed weight exhibited
nonsignificant
correlation with these two traits.
Seed hardness and seed coat weight exhibited significant and
positive correlation ( at 0.05) in both seasons. Seed hardness showed
nonsignificant association with yield and it′s components in the two
seasons, but at the same time, seed coat weight had significant
negative correlation with yield and it′s components in the second
season only
Table 10: Phenotypic correlations between six pairs of characters
in eight faba bean genotypes evaluated in
season 2002/203.
characters
Seed coat
weight
Seed hardness
Seed coat weight
Pods/plant
Seeds/plant
100-seed weight
*p≤ 0.05; **p≤ 0.1.
0.44*
Pods/
plant
Seeds/
plant
100-seed
weight
Yield/
plot
0.043
-0.047
0.162
0.004
-0.171
-0.155
- 0.099
0.215
0.923**
- 0.204
0.607**
- 0.102
0.592**
0.504**
Table 11: Phenotypic correlations between six pairs of characters
in eight faba bean genotypes evaluated in
season 2003/2004
characters
Seed hardness
Seed coat weight
Pods/plant
Seeds/plant
100-seed weight
*p≤ 0.05; **p≤ 0.1
Seed coat Pods/
weight
plant
Seeds/
plant
100-seed Yield/
weight
plot
0.328*
-0.068
-0.363*
-0.01
-0.653**
-0.679**
-0.095
0.91**
-0.035
0.851**
-0.091
-0.50** -0.383*
0.861**
0.338*
4.4 Effect of Pod Position on Seed Hardness and Seed
Coat Weight
The effect of pod position on the stalk of the plant on seed
hardness and seed coat weight was studied. The results were
presented in Table 12 and Appendices 11 and 12
For the two traits the lines exhibited variability in the two seasons.
The pod position had significant effect on seed hardness in the two
seasons. However, the interaction between the lines and pod
position was not significant. The lower pods showed the greater
grand mean for hard seed percentages in the two seasons. They
gave 8.5 and 9.2% in the first
and second season, respectively,
while the upper pods had 5.34 and 7.5% in the two seasons,
respectively (appendix 11).
Regarding
interaction
the
had
seed
coat,
neither
significant
the
effect.
pod
position,
nor
the
The two pod positions,
approximately, showed equal grand means (appendix 12).
Table 12: Mean squares for seed hardness and seed coat weight in faba bean, showing the significant effect of
pods position on the plant
Characters
Seed hardness
Seed coat weight
Source of variation
d.f
(2003)
(2004)
(2003)
(2004)
replication
1
13.78
40.86
0.42
0.085
Parents
7
80.56**
35.46*
11.74**
11.494**
Position
1
55.65
30.12*
0.061
0.72
parent×position
7
15.04
7.81
0.224
0.346
error
15
6.11
5.1
0.43
0.499
Lsd(parents)
3.73
5.66
0.98
1.064
Lsd(position)
1.86
2.83
0.49
0.532
S.E
0.93
3.76
0.65
0.706
C.V%
12.3
42.1
5.2
5.4
*p≤ 0.05; **p≤ 0.1.
4.5 Seed Coat Structure
Photomicrographs of cross sections of faba bean seed coat were
presented in figures 7 and 8. A cross sections of seed coat in
region away from the micropyle showed several distinct layers of
tissues (Fig 7 a). The outer most layer, the epidermis (cuticle),
followed by a single palisade layer of sclereids (macrosclereids),
hourglass cells, parenchyma cells and the endosperm. The micropyle
opening , which stay at one end of the hilum, appeared in a triangle
shape (Fig 8 a). This region consist mainly of a compact group of
trachids (Fig 8 d) surrounded by a pocket of parenchyma cells and
two palisade layers at the outer surface.
Measurements were recorded about seed coat thickness, length and
width of palisade cells, hourglass cell, trachids and the micropyle in
microns (1 micron =10-6 m) and tabulated separately (Tables 13, 14, 15,
and 16).
Seed coat thickness: Different values were obtained for seed coat
thickness in the four samples studied (the line C.28, soft and hard
seeds and line C.36, soft and hard seeds ). In C.28, thickness of the
soft seeds was 427.5 µm away from the micropyle and 549 µm
near to the micropyle. While the the thickness of the hard seeds
was 369 µm and 540 µm in the two regions, respectively. Line C.36,
which belongs to the hard seeded group,
recorded 405 µm away
from the micropyle and 535.5 µm near the micropyle in the soft
seeds. The hard seeds had a thickness of 360 µm away from the
micropyle and 472.5 µm near the micropyle region.
Table (13): seed coat thickness (in microns)
Soft
seeds
Hard seeds
Lines ↓
I
II
I
II
C.28
427.5
549
369
540
C.36
405
535.5
360
472.5
I: away from the micropyle, II: near the micropyle.
Palisade cells: Equal values of 360 µm for width of palisade cells,
in line C.36 for soft and hard seeds and also for hard seeds of line
C.28. Also, approximately near to equal length in the three samples
were measured ,198, 193.5 and 202.5 µm,
However,
the soft seeds of line C.28,
respectively (Table14).
measured 45 µ m in width
and 225 µm in length
Table (14): palisade cells (in microns)
Soft
seeds
Hard seeds
Lines ↓
Width
length
width
length
C.28
45.0
225
36.0
202.5
C.36
36.0
198
36.0
193.5
Hourglass cells: The hourglass cells showed different sizes and
shapes. The width measured
a range of 67.5 - 99 µm in all four
groups. Also the soft seeds
measured a range of 112.5 – 157.5 µm
in length.
Table (15): Hourglass cells (in microns)
Soft
Lines ↓
seeds
Hard seeds
Range
of Range
of Range of Range
width
length
width
length
C.28
67.5–99
112.5–157.5
67.5–99
67.5–157.5
C.36
67.5–99
112.5–157.5
67.5–99
67.5–157.5
of
Micropyle and trachids: A clear difference in measurements of the
micropyle and the trachids between the four groups and between
the soft and hard seeds in the same line were observed (Table 16).
In line C.28 the micropyle of the soft seeds measured 2070 µm in
width and 1540 µm in length, while the hard seeds measured 860
µm in width and 590 µm in length. Line C.36 had 1380 µm width
and 1280 µm length for soft seeds. However, the hard seeds gave
820 µm and 450 µm for width and length, respectively.
Table (16): micropyle and trachids measurements (in microns)
Soft
Line ↓
C.28
Width
Hard seeds
length
width
length
1541
860
590
989
270
295
micropyle 1380
1280
820
450
trachids 220
300
155
300
micropyle 2070
trachids
C.36
seeds
494.5
The trachid cells group in C.28 measured 494.5 µm in width and
989 µm in length in soft seeds and 273 µm in width and 295 µm
in length for hard seeds. The soft and hard seeds in C.36 measured
equal length
of the trachids. However, the two groups got different
widths, 220 µm in the soft seeds and 155 µm in the hard seeds.
Epiderms (Cuticle)
(Palisades)
(Hourglass cells)
(Parenchyma cells)
Hourglass cells
(a)
Palisade cells
(Endosperm)
(Cotyledon)
(b)
Fig (7): photomicrographs of cross section of faba bean seed coat,
showing several distinct types of cells. (b) Enlarged view of palisade
cells and hourglass cells.
(a)
(a)
(b)
(c)
(Parenchyma cells)
(Palisade layers)
(Trachid cells)
(d)
Fig (8): photomicrographs of cross - section in the micropyle region. (a) The
triangle shape of the micropyle, (b) Enlarged view of trachid cells, (c)
Enlarge view of parenchyma cells,
(d) A compact group of
trachids.
CHAPTER FIVE
DISCUSSION
5.1 Inheritance of Seed Hardness and Seed Coat Weight
5.1.1 Inheritance of Seed Hardness
5.1.1.1 Genetical parameters
It was clear from the results of both analysis of variance (Table 2)
and the components of genetic variations (Table 3), that seed
hardness was a dominant character and the non-additve gene
effects(b, H1 and H2) were more important in the inheritance of this
character.
The
nonsignificance of
b1
item
indicated
the
ambidirectional
dominance of the character. Moreover, the genetic variance item H2
showed significant values in both F1 and F2 indicating a dominance
asymmetry (unequal distribution) of positive and negative effects of
genes, and the resultant values for the dominant item b2 and
H2/4H1 ratios tend to confirm this result.
The values of H1/D (mean degree of dominance), provide evidence
for the prevalence of over dominance in the inheritance of seed
hardness
½
in
the experimental material, [( H1/D)
¼(H1/D) > 1 in F2].
½
> 1 in
F1
and
Positive F estimates were obtained in the
two generations indicating the
predominance of the dominant alleles
in the parents used, which was in line with the values obtained for
r (correlation coefficient between the parental mean, yri, and the
parental order of dominance, wri+vri, which showed negative and
significant estimates. Singh and Shaudary(1977) postulated that, if
the correlation is negative, it
means parents containing most
increasing genes have the lowest values of (wri+vri), and thus
contain most dominant genes and vise versa.
Agroup of 2 to 3 genes were observed in the inheritance of seed
½
½
hardness, in that the ratio [(4DH1)) +F]/[(4DH1) –F] exhibited a
range of 2.6 to 3.0 indicating its quantitative inheritance. However,
a single dominant gene was observed to control the character (h2/H2,
approx. = 1). Many workers reported a single dominant gene in
controlling seed hardness as indicated in the literature review.
Despite of the dominant effect of the gene, the character had low
heritability in this study. This showed that the environmental effect
was more important, which was confirmed by the significant values
of the environmental components
of variance (Table 3). Also, the
additive genetic variance estimates, D, were small compared to the
non-additive ones (H1 and H2). Falconer (1980) showed that the
heritability is a property not only of a character but also of the
population and the environmental condition to which the individuals
are subjected. Furthermore, Johnson el. al.(1955), in a study of a
number of characters in soybean, concluded that estimates of
heritability may vary greatly depending upon the character, the
population and the sample size.
5.1.1.2 (wr,vr) Graphs
The (wr,vr) graph provides tests of significance for the presence of
dominance (b ≠ 0) and the average degree of dominance (sign of a),
in which b is the slope of the regression line and a is the wr
intercept (Hayman, 1954).
The (wr,vr) graphs for seed hardness of faba bean (Figures 1, 2 and
3) in F1 and F2 also revealed
seed hardness as a dominant
character. In the three graphs, the slopes of the regression lines, b,
were not significantly different from zero or unity. This suggested
the absence of gene interaction in the expression of the character
(Hayman, 1954; Whitehouse et. al., 1958; Gomathinayagam
and
Dabholkar, 1992).
In
the experimental material
used, in the two generations, each
regression line intercepted the wr axis below the origin. Thus, the
(wr,vr) graphs also indicated that there was an over dominance in
the expression of seed hardness.
The position of the arrays points along the line of wr on vr depend
on the relative proportion of dominant and recessive alleles present
in the common parent of each array (Hayman,1954; Jinks,1954).
"Parents possessing excess of dominant alleles will have a low array
variance and covariance, and will lie near the origin. Highly
recessive parents will have a large array variance and covariance,
and will lie at the opposite end of
the regression line. If the
dominance effects of the genes are unequal, the position of an
array point will be weighted in favour of genes with large
dominant effects (Crumpacker and Allard, 1962)". The eight array
points exhibited considerable scatter around the regression lines.
This
provides
evidence
for
genetic
However, the order of these points
diversity
between
them.
differ in the three graphs.
Array 1(BB7) appeared to posses near to 50% dominant genes in
F1(2003), but, in F1(2004) and F2 appeared to have approximately
100% dominant genes. Similarly, parents 2(C.28) and 6(Bulk/1/1/2)
changed
their
orders.
Whitehouse
et al.(1958)
postulated
the
differences of array orders as a reflection of the different growing
conditions.
The correlation coefficients (r) of yri and (wri+vri) were found to be
negative and significant. This provides evidence that most of the
dominant alleles in the parents are acting in the direction of high
percentage of hard seed, which was also indicated by the positive
values of F estimates. Therefore, the majority of the arrays points
on the (wr,vr) graphs lie in the half closer to the dominant end.
5.1.2 Inheritance of Seed Coat Weight
5.1.2.1 Genetical parameters
The statistical analysis for seed coat weight revealed that the
character was under the control of both additive and non-additive
gene action. Waly and Abdel Aal (1987) and El-Shazly et. al.(1995)
reported similar results in faba bean.
The nonsignificant values of b1 item indicated ambidirectional
dominance of the character. The non-addidive genetic component of
dominance ,H2, and the mean
square of the genetic component b2
were significant in both F1 and F2 indicating an unequal distribution
of increasing and decreasing genes in the parents, which was in the
same line of the value of the uv ratio (H2/4H1 <0.25), (Table 5). The
significant and positive F estimates for seed coat weight in the two
generations indicated that, dominant alleles are more frequent than
recessive ones. At the same time, the coefficients of correlation (r)
tend to confirm this result, where they gave negative significant
values.
Average degree of dominance involved in the action of genes was
in the range of partial dominance in F1(2004) and F2 and over
dominance in F1(2003) as indicated by the ratio (H1/D)½. This
difference may be due to gene association. Gomathinayagam and
Dabholkar (1992) reported that, estimate of D will be zero when
the genes are equally dispersed among the parental lines, on the
other hand the estimate will be greater than ∑d2 (d is
the
phenotypic differences between the two homozygotes) if the genes
are associated. Thus, the measure of average degree of dominance,
½
(H1/D) , may either be inflated or reduced by the combined effect
of correlation of genes on estimates of H1 and D and hence partial
dominance may be converted into over dominance.
½
The (H1/D) ratio obtained in the material used, suggested that, the
dominance component of genotypic ratio was more important,
although both additive and non-additive components govern the
expression of the character. The ratio of heritability was low
indicating that large part of the variability for this trait was nonadditive in nature. However, in F1(2004), the additive variance was
more important compared to the non-additive part and a moderate
heritability estimate was observed (Table 5). Hence, mass selection is
not likely to lead to much genetic improvement ( Gomathinayagam
and Dabholkar,1992). El-Shazaly et al.(1995) concluded that, care
should be taken when planning breeding programme for selection of
thin seed coat, since the genetic behavior of the trait is related to
the use of specific
genetic material.
Three to four genes were
observed to control seed coat weight as indicated by the ratio
½
½
[(4DH1)) +F]/[(4DH1) –F] . Among them one gene was dominant
(h2/H2 approx. = 1).
5.1.2.2 (wr,vr) Graph
In F1(2003) graph, (Fig 4), the regression line had a slope of
0.69±0.41. This value was not significantly different from zero or
unity, indicating that the additive dominant model was satisfied in
this trial. However, in F1(2004) and F2 (Figures 5 and 6) the
regression lines slopes were 1.65±0.45 and 1.69±0.31, respectively.
These values were significantly different from zero and unity
indicating the presence of gene interaction in the material used
(Hayman,1954 and Whitehouse et al (1958).
The interception points were below the origin in the three graphs,
indicating over dominance of the character in the experimental
material. Hence, the results showed by the graphs (Figures 5 and 6)
were different from that expressed by the estimates of the genetic
½
parameter ratios,(H1/D) , in that the mean degree of dominance in
F1(2004) and F2 was less than one. In the diallel analysis, it
is
assumed that genes are independently distributed among parents,
failure of this assumption may result either due to linkage of genes
in the population from which parents were selected or due to the
effect of sample size when choosing the parents (Baker,1978). Also
Coughtrey and Mather (1970) postulated that, the (wr,vr ) graph
disturbed due to non-independent distribution of genes.
In all the graphs (Figures 4, 5 and 6), the array points scattered
around the regression lines indicating their variability. The array
points of 1(BB7) and 2(C.28) appeared to posses the least dominant
alleles. These two parents showed either negative or the smallest Fr
values (Appendix 5). On the other hand, array points 4(C.36/1) and
8(C.36) appeared to posses the most dominant alleles; these two
parents posses either large or the largest positive Fr values. The
array points 3(C.86/1), 5(ZBF/1/1), 6(Bulk/1/1/2) and 7(C.22) had
changed their orders and they were middle in position. The material
used in this experiment (which are from F6 and F7 generations) were
chosen in 2001/2002 season according to their genetic variability in
seed hardness and seed coat weight. Also, the evaluation in
previous
generations
was
concentrated
mainly
on
their
yield
performance. Eberhart and Gardner (1966) expressed the view that,
diallel parents are should be usually selected from material of interest
to the breeder, and thus cannot be regarded as a random sample.
Estimation of genetic variance components do not
provide any
useful information.
5.2 Combining Ability
In this investigation, seed hardness showed significant specific
combining ability (sca) in both seasons and general combining
ability (gca) in the first evaluation season only. This difference may
be due to the difference in value of error variance (Table 7). The
contribution of gca and sca for both seed coat weight and 100-seed
weight were significant indicating that both additive and nonadditive gene actions determine the expression of these traits. A
similar result was obtained by Waly and Abdel Aal (1987).
The
non-additive genetic variance was more important than the additive
genetic variance for number of pods/plant and number of seeds/plant
indicating the dominant effect on both traits. Moreover, the gca/sca
ratio confirm the importance of the non-additive effect (gca/sca ratio
<1 for all traits). For seed yield/plot both components of genetic
variance were nonsignificant. This reflects the importance
of the
effect of environment on yield. The results regarding yield and its
components were in accordance with those reported by El-Hosary
(1984,1985) and El-Hosary et al. (1997). Furthermore, El-Hosary et
al. (1997)
concluded that selection for these characters would be
effective in early generations.
Among the parents 2(C.28), 3(C.86/1) and 4(C.36/1)
gave the
desirable gca effect for all traits, except, in the parent the parent
4(C36/1) showed positive significant effect for seed coat weight in
the second season (Table 8). Thus, they were
good general
combiners for these traits.
For sca effect, in seed hardness, all crosses which exhibited the
positive significant effect (1×3, 1×7, 2×5, 2×6, 3 ×5, 5×6 and 6×8)
had one or both of their parents exhibiting positive gca effect,
except the cross I×3, in which both parents showed negative effect.
On the other hand, the crosses 1×6, 2×3, 2×7, 3×7, 5×7 and 5×8,
which showed negative significant sca effect had one or both of
their parents exhibiting positive gca effect except the cross 2×3 in
which both parents showed significant effect for low percentages of
hard seed. This either reflects the prevalence of the dominant genes
in all parents used (Figures 1,2 and 3), due to the ambidirection of
genes (b2 and H2 were significant, Tables 4 and 5) or the effect of
the environment on this character was large. El-Hosary (1985)
concluded that gca effects of the parental lines were generally
unrelated to sca values of their corresponding crosses. Moreover,
Bond (1967) and El-Hosary (1984, 1985) reported that parents with
significant gca effects did not necessarily produce hybrids with high
sca effects and vice versa.
For seed coat weight, the crosses 1×3 and 4×7 showed significant
negative sca effect. In these two crosses, the parents 1 ,3 and 4
showed desirable gca effect. On the other hand, the crosses 1×6
and 2×6 exhibited positive significant sca effect, in them the
parents 1 and 2 gave high negative gca effect.
Regarding the yield and its components, the crosses 4×8 and 5×6
showed significant positive sca effect but they exhibited significant
effect towards the high percentages of hard seed.
The crosses 2×3 and 5×8 had desirable sca effect for all characters.
Both of the parents of the cross 2×3 were good combiners.
However, the
parents of cross 5×8 were undesirable combiners. If
the cross exhibited high sca values and both of its parents also are
good general combiners, they could be exploited for breeding
varieties as well (El-Hosary, 1985).
5.3 Correlations
The results obtained in the present investigation indicated that
yield/plot
exhibited
significant
association
with
number
of
pods/plant, number of seeds/plant and 100-seed weight, and the
highest association was that with number of pods/plant, which was
generally in the same line with what was reported in the literature.
The correlations of 100-seed weight with number of pods/plant and
number of seeds/plant were negative. This result of negative
associations
was
confirmed
by
Kambal (1969);
Yassin (1973);
Magyarosi and Sjodin (1976); Mahmoud et al. (1978) and Neal and
Mc Vetty (1984). The negative association of number of pods/plant
with 100-seed weight is attributed to the competition for assimilates
(Adam, 1967).
The associations of seed hardness with yield and its components
were not significant. This was in accordance with what was
reported by Salih (1976) and Ramsay (1997). However, the seed
coat weight exhibited significant correlation with yield in the
second season only, which was in contrast with that reported in the
literature. This contradicting result may be due to the large
variability exhibited by the line used in the second season.
5.4 Effect of Pods
Position
on
Seed Hardness
and
Seed Coat Weight
a. Seed Hardness:
The result presented on the effect of pod position on the plant for
hard seed (Table 12 and Appendix 11)
showed that lower pods
gave high percentages of hard seeds than upper pods. In the first
experimental season parents were screened as with high hard seeds
percentages or with low hard seeds percentages. The same trend still
was observed in the two groups. All the parents with the high hard
seeded group gave high percentages in the lower pods and lower
percentages in the upper ones and the difference between the two
positions was large. However, the low hard seeded group showed
inconstant trend (Appendix 11). Zenari (1929); Quinlivan (1965) and
El- Bagoury (1975), reported that, seed dormancy depend on the
extend of seed maturity i.e. increased markedly with delayed
maturity. Thus, they assumed that long exposure
to temperature
during the growing period may affect the permeability of the seed
coat.
b Seed Coat Weight
The pod location on the stalk had no effect on seed coat weight.
This showed
that, the genetic factors play important role in the
expression of this trait. Rowland and Fowler (1977) found that the
position of the seed on the plant had no effect on the seed coat
thickness.
5.5 Seed coat structure
Seed hardness in faba bean is attributed to many causes, among
them the physical and morphological characteristics of seeds. The
palisade layer attracts much attention and its structure is connected
with the high degree of impermeability. A magnified view of the
palisade cells (Fig 7 b) showed their fibrous nature. They are highly
compact and devoted
of intercellular spaces.
The hard seeds
showed small length and width compared to the soft seeds (Table
14). The hourglass cells showed a variety of sizes and shapes. The
hard seeds measured small range compared to the soft seeds.
The seed coat thickness get wider near to the micropyle region in
the four groups. The hard seeds had small thickness compared to
the soft seeds in the two lines (Table13).
The micropyle opening is the only gate for water entery to the
seed. In this region, the trachid cells are found (Fig 8 d ). Water and
nutrients enter the maturing seeds through these trachids. Thus its
width and length play an important role in water absorption. Esua
(1979) reported that, this region acts like a hygroscopic valve. The
two lines exhibited a clear difference in measurements (Table 16).
The micropyle and trachids in the hard seeds got approximately
near half that of the soft seeds in the two lines. Also line 8(C.36 )
which belongs to the hard seeded group, got small measurement
compared to line 2(C.28) Youssef
and Bushuk (1984) found that,
the seeds of the hard - to cook Egyptian samples had smaller
micropyle opening, shorter hourglass cells and thicker cell layers
than those
of the
soft - to cook types. Similar observation was
published for dry field bean (P. vulgaris L) by Powrie et.al. (1960).
REFERENCES
Abdalla,M.M.F. (1976). Natural variability and selection in some
local and exotic populations of field beans (Vicia faba L.). Z.
Pflanzenzenzuchty 76: 336-343.
Abu El-Zahab,
A. A.;
A. A.
Ashore
nnd
K. H.
El-Hadedy
(1980).Comparative analysis of growth, development and yield
of five field bean cultivars (Vicia faba L.). Z. Acherund
pflanzenbu 149: 1 – 13.
Adam, M. W. (1967). Basis of yield components compensation in
crop
plants with special reference to field bean (Phaseoulus
vulgaris L.). Crop Sci. 7: 505-510.
Ageeb, O.A. A.(1980). Effect of harvest on grain yield and
percentage of hard seed of faba bean (Vicia faba L.). FABIS 2:
38-39.
Altikin, Yvorme (1939). The problem of hard seeds in Subterranean
clover. Proc. Ray. Sac.Vict. 51: 187-193.
Ayoub, A. T, (1971). Ful Masri (Broad bean) fertilizer experiment.
Auual Report (1970/197)1, Hudeiba Res. Station.
—————— (1973). Ful Masri watering experiment. Annual Report
(1972/73), Hudeiba Res. Station.
Baciu-Miclaus, D. (1970). Contribution to the study of the hard
seed and seed coat structure properties of soybean. Proc. Int.
Seed Test. Ass. 35: 366–617.
Baker, R. J. (1978). Issues in diallel analysis. Crop Sci. 18:
533–536.
Bakheit, R. B. and E. E. Mahdy (1988). Variation, correlation and
path coefficient analysis for some characters in collections of
faba bean (Vicia faba L.). FABIS 20: 9–13.
Bassett, M, (1997). A new allel (vwf) at the V locus for flower
and seed colour in common bean. J. of American Society
for Hort. Sci. 122(4): 519–521.
—————— (1998). Athird recessive allel, stomic, for seed
coat pattern at the stp locus in common bean. J. of
American Society for Hort. Sci. 123 (4): 404–406.
Bell, J. M. (1975). Utilization of protein supplements in animal
feeds. pp.633-668 in (J. T. Harapiak, ed.) Oil seed pulse
crops
in
Wesyern
Canada – Asymposium.
Western
Cooperative Fertilizers Ltd.
Bennett, H. W. (1959). The effectiveness of selection for the
hard seeded character in crimson clover. Agron. J. 51:
15–16.
Bond, D. A. (1967). Combining ability of winter bean (Vicia
faba L.) inbreds. J. Agric. Sci. Camb. 68: 179–185.
Cerning,
J. A.;
A.
Saposnik
and
A.
Guilabot
(1975).
Carbohydrate composition of horse bean (Vicia faba L.) of
different origins. Cereal Chemistry 52: 125–138.
Coughtrey, A. and K. Mather (1970). Interaction and gene
association and dispersion in diallel crosses where gene
frequances are unequal. Heredity 25: 79–88.
Crumpacker, D. W. and R. W. Allard (1962). A diallel cross
analysis
of heading date in wheat. Hilgardia 32(6): 275–
319.
Dhirendra, Kare and C. B. Singh (1984). Inheritance of seed
dormancy in Vicia faba L. FABIS 8: 4-5.
Donnelly, E. D. (1971) Breeding hard seeded vetch using
interspecific hybridization. Crop Sci. 11: 721–724.
————— ; J. E. Watson and John, A. Mc Guire (1972). Inheritance
of hard seed in vicia. Heredity 4: 361–365.
Eberhert, S. A. and C. O. Gardner (1966). A general model for
genetic effects. Biometrics 22: 864–881.
El-Bagoury, O. H. (1975). Effect of different fertilizers on the
germination and hard seed percentage of broad bean seeds (Vicia
faba L.). Seed Sci. Technol. 3: 569–574.
El–Hady, M. M.; M. Omer; S. Nasri; K. Ali and N. Essa (1998).
Gene action on seed yield and some yield components in F1
and F2 crosses among five faba bean (Vicia faba L.) genotypes.
Bulletin of Faculty of Agriculture, University of Cairo 49(3):
369–388.
El–Hosary, A. A. (1984). Heterosis and combining ability in diallel
crosses among seven varieties of faba bean. Egypt. J. Agron. 9
(1–2): 17–28.
———— (1985). Heterosis and combining ability in F1 and F2
diallel crosses of faba bean (Vicia faba L.). Egypt. J. Agron. 10
(1–2): 13–24.
————— : S. Shoker; A. A. El–Halim; S. M. Nasr and A. M.
El-Aziz (1997). Heterosis and combining ability in faba bean
(Vicia faba L.) Egypt. J. Agric. Res. 75(3): 811–826.
El–Mubarak, A. A.; A. F. Salih; A. N. El–Hud. and A. M. Gurashi
(1988). Effect of time of harvest on physical and chemical
composition, cookability and yield of faba bean. FABIS 20: 33–
36.
Esau, K. (1977). Anatomy of seed plants. 2nd Ed. John Wiley and
Sons, New York.
El-Shazly, M. S. ; M. M. El–Ashry ; El-Sayed M. Gaafar and Magdy
M. M. Mohamed (1995). Inheritance of some seed quality
characters in faba bean. FABIS 36/37: 8–13.
Falconer, D. S. (1980). Introduction to Quantitative Genetics. 2nd
Ed. Longman, London.
FAO (2002). Production Year Book 56: 111. FAO, Rome.
Forbs, I. and D. H. Well (1968). Hard and soft seededness in blue
lupine (Lupinnus angustifolius L.), inheritance and phenotype
classification. Crop Sci. 8: 195-197.
Gomathinayagam, P. and A. R. Dabholkar . (1992). Elements of
Biometrical Genetics. Concept Publishing Company, New Delhi
110059.
Griffing, B. (1959). Concept of general and specific combining
ability in relation to diallel crossing system. Aust. J. Biol. Sci. 9
: 461-493.
Habetinek, J. ; M. Ruzickoua
and J. Soucek (1983). Variability of
characteristic in and correlation between various cultivars of
horse beans (V. Faba L.). Faba bean Abstracts .3(1): 2–2.
Harrington, G. T. (1916). Agricultural values of impermeable seeds.
J. Agric. Res. 6: 761–795.
Hayman, B. I. (1954). I : The theory and analysis of diallel
crosses. Genetics 39: 789–809.
——————— (1958).
II : The theory and analysis of diallel
crosses. Genetics 43: 63–85.
Hussain, M. G. ; N. Hill and N. Gallage (1988). The response of
field bean (Vicia faba L.) to irrigation and sowing date. 2:
Growth and development in relation to yield. J. Agric. Res.
Camb. 111: 233–254.
Ikram,
A.
F. (1993).
Genetic
variability,
correlations
and
genotype×environment interaction in faba bean (Vicia faba L.).
M. Sc. U. of Kh.
Jha, B. N. and R. P. Singha (1989). Hard seededness in Vicia faba
L.. FABIS 24: 37–38.
Jinks, J. L. (1954). The analysis of continuous variation in diallel
crosses of Nicotiana rustica varieties. Genetics 39: 767–788.
Johnson, H. W. ; H. F. Robinson and R. E. Comstok (1955).
Genotypic and phenotypic correlations in soy bean and their
implications in selection. Agron. J. 47: 477–482.
Johnes, R. M. (1965). Analysis of variance of the half diallel table.
Heredity 20: 117–121.
Kambal, A. K. (1962). Astudy on combining ability in grain
sorghum. Ph. D., U. of Kalifornia.
—————— (1969). Components of yield in field bean (Vicia
faba L.). J. Agric. Sci. Camb. 72: 359– 363.
Kaul, D. K. and K. L. Vaid (1996). Combining ability in faba
bean. FABIS 38/39: 12–14.
Klasinsko, K. (2000). Seed sowing value and seed coat structure of
bean (Phaseolus vulgaris L.). Biuletin Institute. Hodowli. 2–
Aklimatyzoeji Roslin 214: 245–252.
Lebedeff, G. A. (1947). Studies on the inheritance of hard seed in
beans. J. Agric. Res. 74: 205–215.
Lute, A. M. (1928). Impermeable seed of alfalfa. Colorado Agri.
Exp. Sta. Bull. 326.
Magyarosi, T. and J. Sjodin (1976). Investigation of yield and yield
components in field bean (Vicia faba L.) varieties with different
ripening time. Z. Pflanzenzutechty 77: 133–144.
Mahmoud, S. A. and El-Ayoubi (1986). Seed yield and seed size
in diallel crosses between some cultivars of broad bean (Vicia
faba L.). Bulletin of Faculty of Agriculture, Cairo Univ. 37(2):
603–612.
——————;
Correlation
and
Y.
El–Hyatmey
and
F. M.
El Rayse
(1978).
and path coefficient analysis of yield components
chemical
composition
in
broad
bean (Vicia faba L.).
Agricultural Research Review (Egypt). 56(8): 117–125.
Marcellos, H. (1987). Variation in testa fraction with seed weight in
faba bean. FABIS 18: 33–34.
Mather, K. and J. L. Jinks (1949). Biometrical Genetics. Chapman
and Hall Ltd. London. EC4.
Mayer, A. N. and A. P. Mayber (1982). Germination of Seeds. 3rd. Ed.
Pergamon Press. New York, USA. pp. 53.
Mc Ewen, T. J.; B. L. Dranzek and W. Sushuk (1974). Scanning
electron microscope study of faba bean seed. Cereal Chem. 51:
750–757.
Mutwakil, A. M. (1965). Ful Masri variety trial at Hudiba and
Shendi. Annual Report (1964/65), Hudeiba Res. Station.
Naidu, M. R.; C. Ashok and V. P. Singh (1985). Analysis of yield
components in broad beans. Indian J. Agric. Sci. 55(4): 236–239
Neal, J. R. and P. B. Mc Vetty (1984). Yield structure of faba bean
(Vicia faba L.) grown in Manitoba. Fiela Crop Res. 8: 349–
360.
Ojomo, O. A. (1972). Inheritance of seed coat thickness in cow
peas. J. Heredity 63: 147–149.
Picard, J. and P. Berthelem (1980). Abrief comment on yield
stability and thousand grain weight in Vicia faba L. . FABIS 2:
20–20.
Povilaits, B. (1970). Diallel Analysis of crosses between Flue cured
and barley Tobacco cultivars. Can. J. Genet. Cytol. 12: 484–
489.
Powerie, W. D.; M. W. A. Adams and I. J. Pflug (1960). Chemical
studies on the navy bean seed. Agric. J. 52: 163–169.
Quinlivan, B. J. (1965). The influence of the growing season and
the
following
dry
season
on
the
hard
seededness
of
subeeanean clover in different environments. Aust. J. Agric.
Res. 16: 277–291.
—————— (1968). The softening of hard seeds of sand-plain
lupine (Lupinus varuis L.). Aust. J. Agric. Res. 19: 507–515.
Rajendra, B. R.; K. A. Mujeeb and L. S. Bates (1979). Genetic
analysis of seed coat types in interspecific vigna hybrids via
SEM. J. Heredity 70: 242–249.
Ramsay, G. (1997). Inheritance and linkage of a gene for testa –
imposed
seed dormancy in faba bean (Vicia faba L.). Plant
Breeding 116(3): 287–289.
Rowland, G. G. (1970). Seed coat thickness and seed crude fibre in
faba bean (Vicia faba L.). Can. J. Pl. Sci. 57: 951–953.
————— and D. B. Fowler (1977). Factors affecting selection for
seed coat thickness in faba bean (Vicia faba L.). Crop Sci. 17:
88–90.
Saeed, E, M.; S. O. Fregoun; M. E. Omer and S. B. Hanounik
(1987). Effect of wilt and root rot disease complex on some
quality parameters of faba bean (Ful Masi)
23–26.
seeds. FABIS 19:
Salih, F. A. (1976). Broad bean standard variety trial. Annual
Report (1975/76), Hudeiba Res. Station.
————— (1978 a). Broad bean water closure experiment. Anuual
Report (1977/78)., Hudeiba Res. Station.
————— (1978 b). Field beans time of harvest. Annual
Report
(1977/78), Hudeiba Res. Station.
————— (1979 a). Effect of sowing date, seed size and seed rate
on seed yield of broad bean. Annual Report (1978/79), Hudeiba
Res. Station.
————— (1979 b ). Effect of different nitrogen and phosphorous
levels and different methods of application on broad bean yield
and its components. Annual Report (1978/79), Hudeiba Res.
Station.
————— (1979). Hard seed problems with Vicia faba in the
Sudan. FABIS 1: 33.
––––––––– (1981).
Breeding work on Vicia faba in the Sudan.
FABIS. 3: 21–23.
————— (1982a). Influence of seed size and sowing date on
yield and yield components of faba bean. FABIS 5: 13–14.
————— (1982 b). Hard seeds in faba bean. In: Faba Bean
Improvement. (Ed. G. Hawtin and G. Webb). pp. 363–373,
Martinus Nijhaff, for the ICARDA/IFAD Nile Valley Project.
————— (1983a). Breeding work on Vicia faba in the Sudan. In:
More Food for Better Technology. (Ed. Holmes, J. C. and W.
M. Tahir). pp. 768–777. FAO, Rome, GCP/INT /387/SW.
—————— (1983b). Broad bean (Vicia faba L.) grain yield and
percentage of hard seed as affected by time of harvest. J.
Agronomy and Crop Sci. 152: 394–398.
—————— (1987). Effect of nitrogen application and plant
population per hill on faba bean (Vicia faba L.) yield. FABIS
17: 27–30.
——————
and
A. E. Ali
(1986).
Effect
application and time of harvest on seed yield
of
phosphorous
and quality of
faba bean. FABIS 15: 32–35.
—————— and N. E. A. Khairi (1990). Variation
in testa
fraction with some other seed quality attributes of faba bean
grown in the new production
areas in the Sudan. FABIS 27:
30–31.
Salih, S. H. (1995). Faba bean Research in the Sudan, an over view
. A paper presented in Rehabilitation of Faba Bean Seminar in
Rabat, Moroco,24–26 May.
————— and F. A. Salih (1985). Faba bean breeding, Back-up
research. ICARDA/IFAD NVP six Year Report.
————— and ————— (1996). Faba bean Improvement .In:
Production and improvement of Cool Season Food Legumes in
the Sudan (Ed. Salih, S. H.; A. O. Ageeb; C. M. Saxena and B.
M. Salih). pp. 19–32, Proceeding of the National Research
Review workshop, 27–30 August, 1995, Wad Medani, Sudan.
Sass, John, E. (1958). Botanical micro-technique. The Lowa State,
University Press.
Shalaby, I. A. and Y. S. Katta (1976). Path coefficient analysis of
seed yield and some agronomic characters in field beans (Vicia
faba L,). J. Agric. Res. (Egypt) 2 (2): 70–79.
Shaudary, K. A. and G. H. Buth (1970). Seed coat structure and
anatomy of Indian pulses. J. Linn. Soc. Soppl. 1(63): 169–179.
Shehata, A. M. E.; H. M. Zeinah and M.M. Youssef (19870). Effect
of seed coat cotyledon on the structure of cooked faba bean
(Medammis). FABIS 19: 20–22.
Sindhu, J. S.; O. P. Singh and R. P. Singh (1985). Selection indices
in faba bean (Vicia faba L.). FABIS 12: 7–7.
Singh, R. . and B. D. Shaudary (1977). Biometrical Methods in
Quantitative Genetic analysis. Kalyani Puplishers. New Delhi,
Ludhlana.
Spraque, G. F. and L. A. Tatum (1942). General vs. specifc
combining ability in single crosses of corn. J. Am. Soc. Agron.
34: 923–932.
Waly, E. A. and S. A. Abdel Aal (1987). Inheritance of seed coat
weight in faba bean (Vcia faba L.). FABIS 18: 4–5.
Whitehouse, R. N .H.; J. B. Thompson and M.A.M. Dovalleribeiro
(1958). Studies on the breeding of self- pollinating cereals. 2:
The use of a diallel cross analysis in yield production. Euhpytica
7: 147–169.
Yassin, T. E. (1973). Genotypic and phenotypic variances and
correlations in field beans (Vicia faba L.). J. Agric. Sci. Cam.
80: 445–448.
Youssef M. And M. Bushuk (1984). Microstructure of the seed coat
of faba bean (Vicia faba L.) seeds of different cookability.
Cereal Chem. 61(4): 381–383.
————— ; —————; E. D. Murray and A.M. El–Iabeshchata
(1982). Relationship between cookability and some chemical
and physical properties of faba bean (Vicia faba L.).
J. of
Food Sci. 47: 1695.
Zenari, S. (1929). The character hard seed in relation to heredity
and environment. Ann. Bot. 18: 174–215.


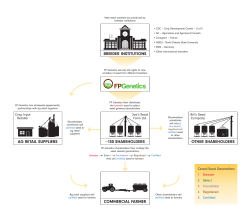
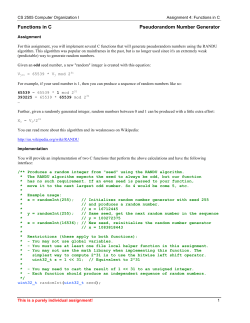
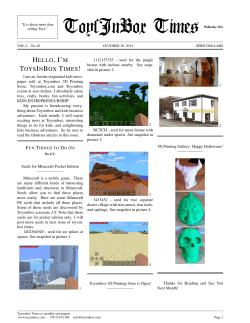

© Copyright 2026