
2009 Malcolm Baldrige National Quality Award Application
JUST ABOUT EVERYTHING for Shooting, Reloading, Gunsmithing and Hunting SM 2009 Malcolm Baldrige National Quality Award Application 5875 West Van Horn Tavern Rd. Columbia, MO 65203 Organizational Profile P.1a(1) What are your organization’s main product offerings? The vision of MidwayUSA is “To be the best-run business in America.” Our main product offering is the distribution of shooting, reloading, gunsmithing and hunting products, primarily to retail Customers who are the end users. Retail Customers represent approximately 90% of our total business and are our primary focus. Dealer and international Customers comprise the remainder of our business at 8% and 2% respectively. We distribute over 95,000 different products from over 700 different vendors. What are the delivery mechanisms used to provide your products to your Customers? We are a catalog/internetbased retail merchant, with no retail stores. Approximately 70% of our orders are placed on our website with the other 30% being placed through our Customer Contact Center (CC). UPS provides order delivery to Customers for 56% of our orders, USPS delivers 41%, FedEx delivers 2% (international orders only) and 1% of orders are picked up on-site by our Customers. We communicate to Customers via 2 annual catalogs, 12 monthly promotional flyers, weekly promotional emails that are targeted to our Customer groups, nonpromotional emails, television commercials, television vignettes, our website, the internet, trade shows, sponsorships of key conservation groups (KCGs) and press releases to trade publications and internet news sites. P.1a(2) What are the key characteristics of your organizational culture? MidwayUSA was founded in 1977 by Larry Potterfield and remains under the continuous ownership and leadership of the Potterfield Family. positions. By adhering to high standards for cultural fit, our high-performing employees add a tremendous amount of value for our stakeholders, are extremely Customer-focused, are highly engaged and our turnover is very low. MMP are so engrained in our culture that we adopted Baldrige as our business model. Part of implementing this model is the integration of our stakeholder key requirements (KRs) (Figure P.1-7) into our CGs (by meeting our stakeholder KRs, we accomplish our CGs). In addition, we adopted the Baldrige values as our Company values (CV). What are your stated Purpose, Vision, Mission and Values? Our vision, purpose, mission and CV are shown in Figure P.1-1. Our CoC, which contains our personal values, are shown in Figure P.1-2. Figure P.1-1 Mission Statement Vision To be the best-run business in America Purpose 1. To maximize long-term shareholder value 2. To support the NRA and the Second Amendment 3. To support the shooting sports industry 4. To serve as a role model for the shooting sports industry Mission We distribute shooting, hunting and outdoor products to our Customers, relying on high-performing Employees, Modern Management Practices and cutting-edge technologies. Values 1. Visionary leadership 2. Customer-Driven Excellence 3. Organizational and Personal Learning 4. Valuing Employees and Partners 5. Agility 6. Focus on the Future 7. Managing for Innovation 8. Management by Fact 9. Societal Responsibility 10. Focus on Results and Creating Value 11. Systems Perspective We are a family-owned company, governed by the Board of Directors (BOD). We have a culture deeply ingrained in Customer satisfaction (CS), continuous improvement, innovation and modern management practices (MMP). From our humble beginnings in 1977 as a retail gun shop to our current status as a leader in shooting, reloading, gunsmithing and hunting product distribution, we have developed an extremely engaged following of Customers. We adopted our values from the Malcolm Baldrige National Quality Award Program Criteria Revised by the Board of Directors January 30, 2009 Our Company culture is defined by our Mission Statement (MS) (Figure P.1-1), Code of Conduct (CoC) (Figure P.1-2) and Company Goals (CGs). Our CGs include Customer Satisfaction, Employee Satisfaction, Vendor Satisfaction, Shareholder Satisfaction and MMP. These documents are created and owned by the BOD, headed by our Founder, CEO and Chairman of the Board, Larry Potterfield. This culture is emphasized through the Communication Deployment Plan (CDP) (Figure 1.1-2) which, among other deployment methods, keeps these documents highly visible with postings in every department throughout the Company. We have a well-deployed and well-understood vision, purpose, mission and values. Figure P.1-2 Code of Conduct All members of the MidwayUSA Board of Directors and all employees, from entry level to the CEO, are committed to the following - both on and off the job: 1. A high level of integrity and honesty at all times 2. Respect for all stakeholders (Customers, Employees, Vendors, Shareholders) 3. Strict adherence to all laws, regulations and Company policies 4. Fairness in all dealings 5. Loyalty to the Company and coworkers 6. Candor with respect 7. Teamwork through participation 8. Conduct worthy of your trust and confidence 9. Friendly, helpful and courteous behavior 10. The promotion of safety through actions and instructions Please refer all violations to Human Resources Provided by the Board of Directors January 29, 2008 Another integral part of our culture is the passion and knowledge for our industry that is demonstrated by many of our employees. Because we operate within a hobby industry, it is very important that key positions within the Company (especially within Merchandising (ME), Marketing (MK) and our CC) are held by employees with a passion and knowledge for our industry. To accomplish this, we have incorporated screening for these factors into our hiring process for these What are your organization’s CORE COMPETENCIES and how do they relate to your MISSION? We define the processes that are central to fulfilling our mission as our key processes (KPs); these are the processes that directly relate to delivering Customer KRs (CKR) (Figure P.1-7). Our core competencies (CCS) align with our KPs and MS (2.1a2); they xix are ME, MK, Order Taking (OT) and Logistics (LO). The aggregate of the process strategies within our KP addresses CKRs, provides strategic advantages and is difficult for our competitors to imitate. P.1a(3) What is your workforce profile? What are your workforce or employee groups and segments? The Company’s workforce includes 243 full-time and 100 parttime employees. Employees are segmented by department and salaried/hourly (exempt/non-exempt) status. 67% of full-time employees are hourly and 33% are salaried Overall, 35% of salaried employees are trained as Missouri Quality Award (MQA) examiners or senior examiners, 3 are trained as Malcolm Baldrige National Quality Award (Baldrige) examiners and 1 is trained as an MQA Team Lead, Overseer and Judge (Figure P.1-3). It is in our long-term strategic plan to send the maximum allowed number of volunteers to MQA and Baldrige for employee development. Figure P.1-3 Examiners Participation History Year MQA Baldrige Total Trained Examiners Examiners Examiners 2005 2 2 2006 6 6 2007 15 1 17 2008 16 1 22 2009 19 1 33 paid-time off, matching 401k, profit sharing, industry involvement time, product and National Rifle Association (NRA) membership discounts, flexible spending accounts and tuition reimbursement. Health and safety requirement measures include Total Company TCIR Rate (OSHA Recordable) (Figure 7.4-8) and Total Company Lost Time Incident Rate (Figure 7.4-9). There are no special health requirements. Figure P.1-5 Workforce & Job Diversity Workforce Diversity White Black or African American Other Employment by Gender % of Salaried Staff 4% 9% 20% 25% 35% Count 5 71 13 12 % of Workforce 5.1% 72.4% 13.3% 12.2% 9 9.2% Columbia City Pop. % Boone County Pop. % 93.7% 82.1% 85.9% 3.8% 10.7% 8.4% 2.5% 8.6% 7.1% Pop. % Male 72% Female 28% Employment by Age Group Pop. % 18 - 22 28% 23 - 35 49% 36 - 50 17% 51+ 6% Pop. Employment by Employment by FT or PT % Department Full-time 81% Corporate Part-time 19% Merchandising Pop. Marketing Employment by Status Exempt (Salaried) 67% Contact Center Non-Exempt (Hourly) 33% Receiving Pop. Repack Employment by Tenure Less than 3 Months 12% Warehouse/Restock 3-6 Months 14% Shipping 6 Months to 1 Year 9% Financial Services 1-3 Years 40% Human Resources 3-5 Years 10% Information Systems 5+ Years 15% GunTec Quality Management What are their education levels? (Figure P.1-4) Figure P.1-4 Exempt Education Levels Type of Education Associates Degree Bachelor's Degree Graduate Degree Military Service Professional Certifications (Ex. CPA, SPHR, SSGB) MidwayUSA Pop. % What are the key factors that motivate them to engage in accomplishing your MISSION? Employee KRs (EKRs) (Figure P.1-7) are identified in our annual Employee Satisfaction survey. In this survey, several factors are identified as engagement factors and prioritized by employees. These factors motivate employees to become engaged in accomplishing our mission. The key factors for employee engagement are “Meaningful, Satisfying Job Assignment,” “Education, Training, and Development,” “Continuously Improving Work Systems,” and “Sense of Belonging.” These are maintained and reinforced through processes such as the performance management system (5.1a(3)), training and development processes (5.1b(1)), integration with compensation and reward and recognition (RR) processes (5.1a(3)) and process improvement processes (6.2c). What are your organization’s workforce and job diversity, organized bargaining units, key benefits and special health and safety requirements? Most importantly, all employees must value and respect our Customers (our Customer base is comprised of shooters, reloaders, gunsmiths and hunters). Our workforce diversity exists in our educational backgrounds, skill sets, work environments, genders, ethnicity and personalities, but we are unwavering in our passion for serving our Customers and for the shooting sports industry. This integrates with our CG “CS” and our CKRs (Figure P.1-7). Our job diversity varies from entry-level to SL/Vice Presidents (VPs) (Figure P.1-5). Pop. % 1% 7% 4% 24% 11% 3% 11% 27% 3% 2% 6% 2% 1% P.1a(4) What are your major facilities, technologies and equipment? We are located in Columbia, Missouri and occupy a modern 140,000 square-foot facility containing our Offices, CC, Warehouse and Distribution. We have one of the most sophisticated computer networks in the industry and have a staff of 16 dedicated to developing proprietary software applications to create systems that best meet our stakeholder KRs. We utilize cutting-edge technologies from leaders in the Information Technology industry such as Microsoft, HP, Cisco, Symbol, Interactive Intelligence and major logistics equipment companies such as Hytrol and Metler Toledo. Our in-house application development capability allows us to integrate multiple cutting-edge technologies together to create value-added innovation within our KPs. Examples of this value-added innovation include: within the OT process, a screen can preload Customer information from the inbound callerID; within LO we have completely integrated with major package carriers’ manifesting systems; within ME, purchase orders are electronically submitted to product vendors for fulfillment; and within MK, we provide a website that offers real-time processing of orders without delay or separation of systems information. P.1a(5) What is the regulatory environment under which your organization operates? What are the applicable We are a non-union company with satisfied, engaged employees. Key benefits include health and dental insurance, xx occupational health and safety regulations; accreditation, certification, or registration requirements; relevant industry standards and environmental, financial and product regulations? We maintain regulatory compliance with the U.S. Department of Transportation, Department of State, Internal Revenue Service, Department of Commerce, Bureau of Alcohol, Tobacco and Firearms (ATF), Occupational Safety and Health Administration and Missouri Department of Natural Resources. The compliance status of these agencies is reviewed monthly and reported quarterly to the BOD and Senior Leadership Team (SLT) in our Legal, Ethical and Regulatory Compliance (LERC) Report (Figure 7.6-4). What are their key requirements and expectations for your products, customer support services and operations? What are the differences in these requirements and expectations among market segments, customer groups and stakeholder groups? (Figure P.1-7) Figure P.1-7 Stakeholder/Company Goal Key Requirements Customer Key Requirements 1.Competitive Pricing 2.Product Availability CG: Customer Satisfaction 3.Accurate, Intact Shipments 4.Friendly, Courteous, Respectful, Ethical Service 5.Product Selection 6.Easy to Do Business With 7.Fast Delivery 8.Knowledge 9.Timely, Relevant, Quality, Marketing Communication 10.Industry Support 1.Friendly, Courteous, Respectful, Ethical Employee Key Requirements Environment 2.Meaningful, Satisfying Job Assignment CG: Employee Satisfaction 3.Candid Two-Way Communication 4.Rewards and Recognition 5.Advancement Opportunity 6.Good Salary and Benefits 7.Education, Training and Development 8.Safe and Comfortable Work Environment 9.Continuously Improving Work Systems 10.Sense of Belonging 1.Friendly, Courteous, Respectful, Ethical Vendor Key Requirements Relationship 2.Easy to Do Business With CG: Vendor Satisfaction 3.Timely Payment 4.Candid Two-Way Communication Shareholder Key 1.Financial Performance Requirements 2.Support the NRA and 2nd Amendment CG: Shareholder Satisfaction 3.Industry Support Modern Management 1.Receive Baldrige Award Practices Key Requirements 2.ISO Registration CG: MMP 3.Six Sigma Green Belt Certification We became ISO 9001:2000 registered in October 2008 and have completed a successful post registration audit with no findings that also registered us to the new ISO 9001:2008 standard. P.1b(1) What are your organizational structure and governance system? What are the reporting relationships among your governance board, senior leaders and parent organization, as appropriate? We are a private, familyowned business comprised of departments, areas and sections; departments are led by VPs, areas are led by managers and sections are led by supervisors. The VPs report to the President, the President reports to the CEO and the CEO reports to the BOD. The BOD is composed of family members and is chaired by the CEO. The BOD provides financial and directional oversight of the Company to ensure that stakeholder and family interests are protected (Figure P.1-6). Figure P.1-6 Organizational Governance Board of Directors (BOD) • Reviews LERC Report quarterly • Reviews performance to CGs • Reviews and sets key stakeholder and shareholder requirements • Provides Mission Statement, Company Goals and Code of Conduct • Reviews the SP and budget and hires and evaluates the CEO Chief Executive Officer (CEO) • Sets organizational priorities (SOs) • Approves the strategic plan and budget • Oversees monthly Company results • Hires and evaluates the President President • Sets organizational priorities (SOs) • Approves and executes the SP and the budget • Approves Company policies and department operating plans • Reviews performance against CGs and oversees daily operations • Hires and evaluates SLT Senior Leadership Team (SLT) • Reviews LERC Report quarterly • Reviews performance against CGs (MRR) • Develops, deploys and executes the SP and department OP • Develops the budget and Company policies Measures: Legal, Ethical and Regulatory Compliance Report Based on the 2009 KR survey results our Customer groups (Shooters, Reloaders, Gunsmiths and Hunters) currently have the same KRs. P.1b(3) What are your key types of suppliers, partners, and collaborators? What role do these suppliers, partners, and collaborators play in your work systems and the production and delivery of your products and customer support services? We have 2 different types of suppliers: product vendors and transportation suppliers. Our suppliers are our over 700 product vendors. We consider the top 20% of our vendors, based on volume, as key vendors. Their role in our work system is to provide product for resale to Customers. We have 3 transportation suppliers (UPS, USPS and FedEx) whose role is to provide delivery of product to Customers. We do not have any key partners or collaborators. What are your key mechanisms for communicating and managing relationships with suppliers, partners, and collaborators? Key mechanisms for communicating with suppliers include face-to-face meetings through trade show attendance and on-site visits, phone calls, emails, written contracts, Vendor Partnership Agreement (VPA) and our webbased Vendor Resource Center (VRC). Our product offering is segmented into 6 product categories (Shooting, Reloading, Gunsmithing, Hunting, Ammunition and Optics). Each product category has a product management team who is responsible for communicating and managing the relationship with the vendors within their product category. Our VP-LO is P.1b(2) What are your key market segments, customer groups, and stakeholder groups, as appropriate? We primarily sell to retail Customers who are the end users of the products we distribute. The retail market segment serves as our primary focus since it represents approximately 90% of our business and is key to our success. Our other two market segments are dealer (8%) and international (2%). Our key Customer groups are shooters, reloaders, gunsmiths and hunters. Our key stakeholder groups are Customers, employees, vendors and shareholders. Our CGs center around satisfying our stakeholders by meeting their requirements (Figure P.1-7) and this is how we determine our success. xxi responsible for communicating and managing the relationship with the transportation suppliers. What role, if any, do these organizations play in your organizational innovation processes? We solicit innovation ideas from our suppliers through our systematic Vendor Management process and Vendor Satisfaction survey. As innovation ideas or new services become available we evaluate the ability to impact stakeholder KRs (Figure P.1-7). Innovation ideas are referred to the SPP for implementation as appropriate. What are your key supply chain requirements? We take orders and ship packages every day. Using a state-of-the-art ordering system, we systematically place orders with our product vendors to replenish products in our warehouse. We survey our vendors on their KRs (Figure P.1-7) to determine their satisfaction with our ability to meet their KRs. We also survey our Customers on their KRs as they pertain to their product, service and delivery expectations to determine their satisfaction with our ability to meet their KRs. We maintain performance measures for product vendors that are derived from stakeholder KRs (Figure P.1-7). We have a vendor performance report generated weekly to monitor these vendor performance measures. Among other measures, sales growth, margin percent, return rate, inventory turns, in stock rate and purchase orders received on time are included in the report. We balance all of our stakeholder KRs when evaluating our vendors. P.2 a(1) What is your competitive position? MidwayUSA is a leader in shooting, reloading, gunsmithing and hunting product distribution with an extremely loyal following of Customers. CS is our #1 CG and “CustomerDriven Excellence” is one of our CVs. We are known for outstanding Customer service, great promotions, great product selection, first to market with new products, fast delivery, competitive prices, having products in stock, providing great product information and innovation (all are strategies contained in one or more of our processes). We have great relationships with our vendors, many of which consider us a favorite Company to do business with. What are you relative size and growth in your industry or markets served? Confidential. (Figure P.2-1). What are the numbers and types of competitors for your organization? Our key competitors are segmented by Customer group and listed in order of market share in Figure P.2-1. Each of our product categories represents a different segment of the overall industry and we treat each one as its own business unit. While there are many competitors in each market, from small gun shops to internet-only retailers and we pay attention to each of them, our main area of focus is on those competitors who command significant market share in our product categories, which closely align with our Customer groups (Figure P.2-1). Our types of competitors include catalog/internet-based retail, multi-channel retailers (retail store and catalog/internet-based retail), internet-only and retail store-only competitors. Figure P.2-1 Competitive Environment and Market Share Rank Shooting Mkt Rank Gunsmithing Share #1 Confidential --% #1 Confidential #2 Confidential --% #2 Confidential #3 Confidential --% #3 Confidential #4 Confidential --% Mkt Share --% --% --% Rank Reloading #1 #2 #3 #4 #5 Confidential Confidential Confidential Confidential Confidential Mkt Share --% --% --% --% --% Rank Hunting #1 #2 #3 #4 #5 Confidential Confidential Confidential Confidential Confidential Mkt Share --% --% --% --% --% P.2a(2) What are the principal factors that determine your success relative to your competitors? CS is our #1 CG and is central to our culture. Our success relative to our competitors is determined by our ability to meet our CGs of “CS,” “Employee Satisfaction,” “Vendor Satisfaction” and “Shareholder Satisfaction,” our ability to execute our strategic plan and our ability to achieve sustainability through our use of MMP. We achieve our CGs by meeting our stakeholder’s KRs (Figure P.1-7). While we have many performance and process measures, performance at the highest and most important level is measured by our Company Key Measures (CKMs), which are direct measures of performance toward our CGs. These 12 CKMs are shown in Figure P.2-2 and are how we define our success. Figure P.2-2 Company Key Measures Rank Company Key Measure* #1 Customer Satisfaction – Overall (Figure 7.2-1) CG: Customer Satisfaction #2 Company Goals Performance (Figure 7.5-1) CG: Customer, Employee, Vendor and Shareholder Satisfaction #3 Gross Sales – Overall (Figure 7.3-1) CG: Shareholder Satisfaction #4 Net Income % of Net Sales (Figure 7.3-2) CG: Shareholder Satisfaction #5 Earnings Distribution (Figure 7.3-3) CG: Shareholder Satisfaction #6 Inventory Turns (Figure 7.3-4) CG: Shareholder Satisfaction #7 Employee Satisfaction and Engagement (Figure 7.4-1) CG: Employee Satisfaction #8 Vendor Satisfaction (Figure 7.5-2) CG: Vendor Satisfaction #9 Baldrige Self Score (Figure 7.5-4) CG: Modern Management Practices #10 Strategic Plan Execution (Figure 7.6-1) CG: Customer, Employee, Vendor and Shareholder Satisfaction #11 Donations by Key Community (Figure 7.6-8) CG: Shareholder Satisfaction #12 % of Customer Orders with NRA Round-Up (Figure 7.6-10) CG: Shareholder Satisfaction * These Company Key Measures are denoted throughout the application by this symbol: Also included in the application is the following symbol: This “L” symbol represents cycles of learning. To attain our vision “To be the best-run business in America,” we believe we must continuously strive to improve and deploy MMP. Our measure for this is to receive the Baldrige Award every 5 years, the MQA every 3 years and on-going ISO registration. This aligns with our CG MMP and CKM #9. What are any key changes taking place that affect your competitive situation, including opportunities for innovation and collaboration, as appropriate? The greatest xxii change taking place in our industry today is the extreme surge in demand on certain ammunition, reloading and gun parts products that has taken place since the November Presidential election. Since that time, Customers within our industry have been purchasing these products at near “panic” levels for fear these products will not be available in the future or will be severely regulated by the current administration. This surge in demand has created demand far greater than the capacity available by our vendors for these products, creating the strategic challenge of limited product availability. This condition has created the opportunity for us to take advantage of our vendor relationships to get scarce products and to innovate our service by allocating/rationing certain products and limiting quantities. Another key change taking place, as a result of Voice of the Customer feedback, is the addition of USPS flat rate service to our shipping methods to provide a low cost option to better meet the CKR “Competitive Pricing.” P.2a(3) What are your key available sources of comparative and competitive data from within your industry? Our key available sources of comparative and competitive data from within our industry are our Shopzilla CS survey, vendors and annual reports from our publicly owned competitor, Competitor 1. We gather a majority of our financial comparisons from Competitor 1 who is the market dominant competitor and also happens to be our #1 overall competitor. What are your key available sources of comparative data from outside your industry? Comparative process information is actively sought in process improvement activities by benchmarking with organizations outside of the industry: Shopzilla CS survey, Gomez, Multichannel Merchant, National Conference on Operations and Fulfillment, MQA and Baldrige Award recipients. What limitations, if any, are there in your ability to obtain these data? Our industry is small enough that we don’t have an overarching organization that gathers and maintains data from the members, so any comparison data we want we must obtain on our own. An additional challenge arises because nearly all of the organizations within the industry are privately held and treat this information as confidential. To address this lack of information, many of our comparisons come from outside of our industry, from publicly traded competitors or from our vendors. P.2b What are your key business, operational and human resource strategic challenges and advantages? What are your key strategic challenges and advantages associated with organizational sustainability? Each strategic advantage and challenge contributes to or impacts our organizational sustainability, especially our commitment to MMP, see Strategic Objective Integration (Figure 2.1-1) for relationship to CCS. Figure P.2-3 Strategic Advantages and Strategic Challenges Area Strategic Advantage Strategic Challenge Industry is highly Business Privately held, profitable influenced by political Company, with owners willing climate to reinvest for growth Larry Potterfield positioned as Competition from internet- Operational (processes) Human Resources the face of MidwayUSA Industry support Modern Management Practices Just about everything (long tail) strategy (CKR Product Selection) Inventory management, including our “Never out” product strategy (CKR Product Availability) Strategy of frequently promoting popular products (CKRs Competitive Pricing and Product Selection) Vendor Relationship Management (CKRs Product Selection and Availability) Employees with a passion for our industry only retailers Increasing, changing or unknown regulations on products Shortages of certain products since November Presidential election (CKR Product Availability) Vendor MAP pricing (CKR Competitive Pricing) Entering new markets Difficulty finding highperforming recruits with a passion for our industry P.2c What are the key elements of your performance improvement system, including your evaluation, organizational learning and innovation processes? The key elements of our performance improvement system include: • Results Review meetings (monthly) both Company and department level (MRR) • Process Management meetings (monthly) both Company and department level (MPM) • Strategic Planning meetings (monthly) both Company and department level • Baldrige Category Meetings (BCM) (Figure 1.1-1) • Strategic planning process with strategic objective development and action plan (AP) implementation using Plan, Organize, Staff, Execute and Control (POSEC). • Strategic plan deployment process, including quarterly State of the Business and Department Knowledge meetings • Process management process (PMP) and ISO including Corrective Action and Preventive Action Reports to address process performance. • Systematic employee performance evaluations • Innovation process and Continuous Improvement Projects (CIP) lists We have an extensive Performance Improvement system for evaluating, improving and innovating our processes. Each department maintains a CIP list with innovative ideas from employees, vendors or Customers that are used to innovate processes. Our PMP includes maintaining ISO certification and includes a systematic review of the process strategies and written work instructions (WIs) that exist on all processes and process performance is subject to ISO audits. We use a POSEC model and Lean Thinking for designing, improving and innovating all processes and for developing our action plans to improve our processes. We attend the Baldrige conference each year to learn about best practices (BP) from Baldrige winners and use feedback from MQA and Baldrige examiners as we apply each year for one of these awards. To Baldrige examiners from Larry Potterfield: Our vision is “To be the best-run business in America” and we want your help! P.S. We hope that you enjoy the “examiner-friendly” application with the questions in the text. xxiii MQA and/or the Baldrige Award process, including participation for at least two years as an examiner. Another example of SLs actions that displays their commitment to “Customer-Driven Excellence” is taking phone orders as part of our Emergency Response Group (ERG) each week and when inclement weather prevents regular staffing. The founders created The Friends of the NRA (FNRA), a fundraising program that fosters community involvement and gives 100% of the net proceeds to qualified local, state and national shooting and educational programs. Our Founder and CEO works personally with select classes at University of Missouri to deploy the Baldrige criteria and values to students. In 2007, the founders established the MidwayUSA Foundation to provide financial support for education and training in the areas of shooting, hunting, firearms safety and outdoor skills. A component of the Foundation is the Scholastic Shooting Trust Endowment (SST) which provides alumni and other interested parties of any College, University or institution of secondary education in the US with the opportunity to provide financial support. Category 1: 1.1a(1) HOW do SENIOR LEADERS set organizational VISION and VALUES? The BOD reviews the MS, including the Vision and Values, quarterly and delivers it to the SLT annually, or as changes are made. SLT makes recommendations for changes as necessary. The President communicates any recommended changes to the BOD for approval. The MS is reviewed during the SPP to ensure that the context and direction of SOs and APs are aligned with the overall Company direction (2.1, 2.2). As a result of the addition of Modern Management Practices (MMP) as a CG and our pursuit of the Malcolm Baldrige Quality Award (Baldrige) criteria, our BOD and SLT revised the MS in 2008 to align our CVs with the Core Values and Concepts from the Baldrige criteria. HOW do SENIOR LEADERS DEPLOY your organization’s VISION and VALUES through your LEADERSHIP SYSTEM, to the WORKFORCE, to KEY suppliers and PARTNERS, and to CUSTOMERS and other STAKEHOLDERS, as appropriate? Our Vision and Values are part of the MS, which is systematically deployed internally per our CDP (Figure 1.1-2). Senior Leaders (SLs) deploy the MS in quarterly State of the Business (SOTB) and Department Knowledge Sharing (DKS) meetings with all employees. The MS is available on the internet for Customers and vendors and is included in the VRC and VPA for vendors. Our shareholders are on our BOD, which develops and updates the MS. SLT reviews and updates the deployment of the MS through the CDP, Figure 1.1-2, in the quarterly Leadership meeting (Figure 1.1-1). Figure 1.1-1 Baldrige Category Meetings; Agendas AOS Meeting Meeting Purpose Leadership Strategic Planning Figure 1.1-2 MidwayUSA Communication Deployment Plan Strategic SP Planning Deployment KCP MS Goals CoC Bulletin & Boards* Development Internal Postings Locations: Entrances X X X Conference Rooms X X X X Depts/Breakrooms X X X X X X X Hallways Other Print Badges (1) X X Vendor Agreement (1) X X X Verbal Orientation (2) X X X X DKS (2) X X X X SOTB (2) X X X X *SP Bulletin Board Content (1) - indicates one-way communication AOS (2) – indicates two-way communication Customer Focus Knowledge Management Workforce Focus HOW do SENIOR LEADERS’ personal actions reflect a commitment to the organization’s VALUES? SLs demonstrate their commitment to the CVs through a long history of active involvement in providing support, guidance and learning opportunities to MidwayUSA’s key communities, including the NRA, shooting sports industry, KCGs, local education institutions and at the state level through support of the Excellence in Missouri Foundation (Figure 1.2-3). These support activities are aligned with our CCS and CVs and are tailored to best support the individual community requirement. Process Management Results Review The CVs are derived from the Baldrige criteria and 100% of SLT support these values through their involvement in the 1 To review the leadership system including the approach SL deploy to guide and sustain our Company; to review the legal and ethical behavior report and support of key communities. To provide a process to create and manage the Company’s SP, creating an SP for the intermediate term (next year) and the long-term (2-3 years); to monitor the progress of the current year’s plan in addition to the results of completed APs; to review referrals from the MPM meeting. To examine, evaluate and validate how we determine product offerings and develop mechanisms to support Customers’ use of products; build a Customer-focused culture and listen to Customers; determine Customer satisfaction, dissatisfaction and engagement; use Customer information to improve marketplace success. Examine and evaluate the viability of the organizational performance measurement system and data, information and knowledge management practices. To provide a systematic review of key workforce processes against the competitive environment and to review those processes that drive employee satisfaction and engagement and satisfy each employee key requirement. Conduct ISO Management Review, review the effectiveness of the PM Process, determine Company core competencies and review performance of key and support processes; to review referrals from the MRR meeting and generate referrals to the SP meeting. To review performance to CGs, stakeholder KRs and processes and to analyze the effectiveness or appropriateness of measures and information presented; generate referrals to the MPM meeting. Frequency 4x/yr 12x/yr 4x/yr 4x/yr 4x/yr 12x/yr 12x/yr Integration. In addition, SLs participate in RR, performance reviews and ISO, which includes Corrective and Preventive Action Reports (CAR/PARs). HOW do they create an environment for organizational and WORKFORCE LEARNING? SLs support our CV “Organizational and Personal Learning” by promoting workforce engagement, RR, inviting select employees as guests to the BCM and establishing the annual Company training budget of 2.23% of payroll. (Figure 7.4-3) SLT approved the Tuition Reimbursement Policy in 2002. SLT provides learning opportunities throughout the year through SOTB, DKS, DBM, mentoring sessions and several informal learning methods. Examples include: 35% of our salaried staff are currently trained as MQA Examiners and two SLs are trained as Baldrige examiners. (Figure 7.4-5) Two managers were sent to graduate school full-time to receive their MBAs as part of their development plan. Each was promoted to VP after graduation. Each SL mentors employees and all salaried “A” players are mentored by one or more SL. HOW do they develop and enhance their personal leadership skills? SLT’s leadership skills are developed through MQA or Baldrige examiner participation, direct manager performance reviews (feedback from confidential reviews by their direct reports), 360 reviews and performance reviews as well as through mentoring sessions with the CEO, President and other SL. 1.1a(2) HOW do SENIOR LEADERS personally promote an organizational environment that fosters, requires, and results in legal and ETHICAL BEHAVIOR? The SLT created the CoC to foster and require ethical behavior within the Company. SLT members serve as role models by living the CoC. SLT reviews the CoC and the LERC from Human Resources (HR) in the quarterly Leadership meeting (Figure 7.6-4). The BOD also reviews the LERC report quarterly. SLT reviews the CoC in quarterly SOTB and DKS meetings with all employees. SLs serve on the Career Development Team (CDT, 5.2a2) to evaluate applicants against the CoC and CVs. We review the CoC and CV during the Employee Orientation Process. The CoC is on employee badges, posted in each department, on the internet for Customers and vendors and included in the VPA for vendors. When a breach of ethical behavior is suspected or reported, the organization utilizes our Employee Complaints, Harassment and Misconduct process to handle the report. SLT is informed during weekly SLT meetings and via email at the time of occurrence or report of any ethical or CoC violations. 1.1a(3) HOW do SENIOR LEADERS create a SUSTAINABLE organization? Sustainability starts with the Company’s SLT. MidwayUSA’s President and all 8 department heads comprise our SLT. SLT has a combined total of 89 years (an average of 11 years) of tenure with MidwayUSA. The SLs have participated in 19 MQA or Baldrige examiner cycles. (MQA uses the Baldrige Criteria verbatim, so both of these educate employees on the Baldrige Criteria.) The SLs also work together on a regular basis in the BCMs and outside of those meetings and are familiar with the business as a whole, not just their department. Figure 1.2-2 SLT Communication Message Communicatio Company SPP State of the and SP Business Company SPP, Department Company SP, Knowledge Department SP Sharing Strategic Department Planning, PM, Baldrige Results Meetings Task lists and Department department APs Meetings The most important thing we do to sustain our Company is the adoption and relentless deployment of MMP, including Baldrige, ISO and Lean. SLT creates a sustainable Company through the Strategic Planning Process (SPP) (including MSP meetings), Baldrige Alignment Process and the annual master planning calendar (MPC) which includes weekly Departmental Baldrige Meetings (DBM) to deploy processes for sustainability to departments. SLT executes APs to achieve the Strategic Objectives (SOs) in alignment with the MS and CGs (1.2c(1)). Other tools used to create sustainability include department MS and SWOT analyses, succession planning, mentoring and hiring individuals for key positions with a passion for our industry and a fit for our Company culture. HOW do they create an environment for organizational PERFORMANCE improvement, the accomplishment of your MISSION and STRATEGIC OBJECTIVES, INNOVATION, competitive or role-model PERFORMANCE leadership, and organizational agility? SLT deploys MMP, the Strategic Plan (SP) and the SPP through quarterly SOTB and DKS and weekly DBM. SLT reviews the Company results in the MRR meeting to evaluate organizational performance compared to CGs and KP performance in the MPM meeting. Both Company results and KP performance results integrate with stakeholder KRs. Through the SPP, SOs and APs are designed to maintain and improve performance to CGs. The SPP is mirrored at the department level to ensure performance improvement is integrated throughout the Company. See Figure 2.1-1 SO Freq. Quarterly Quarterly Weekly Weekly or bi-weekly Audience Middle Leadership All employees 2-way Q&A Department Leadership Team Variable by department Yes Q&A Yes Performance Reviews Employee performance Annually SLT direct reports Yes Mentoring Professional/ personal development Select salaried employees Yes Action Plan Meetings AP development and management Company MRR, SP,MPM and review of approach to performance excellence based on Baldrige categories Mentoring, knowledge sharing Mentoring, knowledge sharing AP owners, stakeholder s SLT and selected guests Yes Master Planning Calendar Meetings Company trips and mentoring per matrix Bi-weekly or as needed Monthly and quarterly 9-12 trips/show s per year MPC meetings SLT and selected guests SLT and selected employees Yes Company Trips Carpools (offsite events) Q&A Yes To better achieve our Vision “To be the best-run business in America,” the President and CEO set a 2010 SO as “Improve Leadership Skills” which has an AP (among others) to improve the Leadership Development process to include 2 hands-on training, reading and classroom activities to further enhance leadership skills. HOW do they participate in organizational LEARNING, in succession planning and the development of future organizational leaders? SLs and other select employees, including the CEO, have 12- and 24-month successors and each department maintains a 3-year organizational chart. There is annual mentoring, training and career development plans for each department. In the quarterly Workforce Focus meetings, each employee is ranked on the ABC scale for use in determining training and development priorities. HR establishes the career development plan in conjunction with department heads and SLT approves the plan. An example of SL participation in succession planning occurred over a 5-year period, with the identification of the VP-Sales & Marketing to succeed the President and CEO in the President’s position. He was developed for this position through extensive mentoring with the Founder and CEO and progressive responsibility until he took the President position in January 2009. 1.1b(1) HOW do SENIOR LEADERS communicate with and engage the entire WORKFORCE? SLT communicates through quarterly DKS and SOTB meetings using standardized agendas. At each SOTB, the CEO, President and at least half of the SLT address the Middle Leadership Team (MLT). Each SL presents to and answers questions from the MLT at least twice per year. At each DKS meeting, either the CEO or President delivers an address and answers questions in addition to the presentation given by the department SL. We have an “open-door policy” that allows any employee to bring concerns or ideas to an SLT member. SLT lists home and cell phone numbers on the intranet for employee use. The Company fosters innovation through department CIP lists, new hire orientation process including meetings with each SL for all new professional staff, intranet site, DBM, monthly newsletter and Strategic Planning Bulletin Boards in each department (Figures 1.1-2, 1.2-2). SLT communicates with and engages members of the workforce during mentoring sessions, Company trips, activities and carpools to Company events that are organized to foster interdepartmental communication. HOW do SENIOR LEADERS encourage frank, two-way communication throughout the organization? HOW do SENIOR LEADERS communicate KEY decisions? To reinforce our CoC item “Candor with Respect” and our EKR “Candid Two-Way Communication,” SLT utilizes multiple communication methods such as the “open-door policy,” DKS, SOTB, mentoring sessions, weekly DBM, e-mail, intranet, direct manager performance reviews, 360 review process and performance reviews to encourage two-way communication and deploy key decisions (Figure1.2-2). HOW do they take an active role in reward and recognition programs to reinforce HIGH PERFORMANCE and a CUSTOMER and business focus? SLs promote our RR process at every opportunity, including SOTB and DKS meetings. RR is a formal agenda item at each SOTB and we average 16 formal recognitions at these meetings. At the holiday party, the Founder and CEO recognizes employees with at least 5 years of tenure. The Founder and CEO and the President have mentoring sessions with “A” players. SLs and their departments RR innovation, safety, reliability, loyalty and performance using a bank of RR tools including sponsored lunches, cowboy cash, selecting employees for additional responsibility (i.e., MQA examiner participation), recognition in SOTB or DKS meetings, or by email. An example of RR is the Million Dollar Club. The President recognizes CC employees who have taken $1,000,000 in orders, or multiples of $1,000,000 with a trophy, a certificate and addition of their name to a plaque. We also use the intranet and newsletters to recognize employee birthdays, anniversaries, promotions, achievements and important business milestones. 1.1b(2) HOW do SENIOR LEADERS create a focus on action to accomplish the organization’s objectives, improve PERFORMANCE, and attain its VISION? Opportunities for improvement are identified in the MRR meeting, SP meeting, MPM meeting and innovation process. Members of SLT lead the SOTB, DKS and DBM. All DBMs and BCMs have an innovation and knowledge sharing agenda item. SLT is creating the University of MidwayUSA and support MMP including the MQA, Malcolm Baldrige National Quality Program, ISO and Lean to focus on action to achieve the Company Vision. The SOs focus on both current and future performance to CGs and our ability to meet them. Each SL leads his or her department to create a department SP that aligns with the Company SP. Results are reviewed in the weekly DBM. Weekly AP updates on AP progress are sent to SLT and the SP has a measure to indicate execution of the SP according to plan (Figure 7.6-1). What PERFORMANCE MEASURES do SENIOR LEADERS regularly review to inform them on needed actions? We have 12 CKMs Figure P.2-2. These are the most important measures to the Company and how we measure our success. These measures are denoted with a “Key” symbol ( ) in the results category. SLT reviews performance to CGs and KP measures in the MRR meeting. When unacceptable trends or performance below goal are reported in the MRR meeting, they are referred to the MPM meeting. SLT also reviews the KP Balanced Scorecard (BSC) (Figure 7.5-7), which includes KP measures, in the MPM meeting. If a Company AP (CAP) is needed, the item is referred to the SP Meeting. SLT also reviews department results and process measures monthly in the DBM. HOW do SENIOR LEADERS include a focus on creating and balancing VALUE for CUSTOMERS and other STAKEHOLDERS in their organizational PERFORMANCE expectations? A focus on value for stakeholders is integrated with organizational performance expectations through the MRR and MPM meetings. The MRR is a review of Performance to CGs (Figure 7.5-1, 1a), which includes survey results and process measures, showing performance toward CGs and stakeholder KRs. CGs cannot be achieved if the stakeholder KRs are not met. The MPM meeting Figure 7.5-7 KP BSC, is based on the process measures that deliver stakeholder KRs. 1.2a(1) HOW does your organization review and achieve the following KEY aspects of your GOVERNANCE system: • Accountability for management’s actions? The CEO makes quarterly presentations to the BOD on Company performance and ethical and regulatory compliance. The BOD 3 provides MS and CoC. To date there has never been a violation reported for any SL. • Fiscal accountability? Annually the BOD reviews and sets definable, measureable and achievable financial goals for the Company and reviews the performance against goals in quarterly BOD meetings. An independent firm audits our financial statements. A written report must be issued to the BOD for any year where a stakeholder goal is not achieved along with an AP to address the shortfall. This happened in 2007 when we did not meet the CG Shareholder Satisfaction because of Earnings Distribution (Figure 7.3-3). The cycle of learning resulted in APs to correct the shortfall which were successful and the measure achieved immediate, positive results. • Transparency in operations and selection of and disclosure policies for GOVERNANCE board members, as appropriate? BOD requires a full disclosure of all ethical, legal and regulatory issues quarterly through the LERC Report (Figure 7.6-4). BOD has access to all information in the Company at any time. • Independence in internal and external audits? Independence in auditing is addressed by selecting external audit companies and using internal resources outside the department being audited. We use internal and external resources for ISO and physical inventory audits and external auditors for financial audits. SLT reviews ISO internal audit results, annual physical inventory results, as well as external ISO surveillance audit results at the MPM meeting. • Protection of STAKEHOLDER and stockholder interests, as appropriate? SLT reviews CG Results (Figure 7.5-1) in the MRR meeting. CGs balance KRs of all stakeholders. The BOD reviews performance to CGs and Shareholder KRs (SKRs) quarterly. 1.2a(2) HOW do you evaluate the PERFORMANCE of your SENIOR LEADERS, including the chief executive? The BOD reviews performance to CGs and the LERC report quarterly to measure the effectiveness of SLs and CEO performance. The CEO evaluates the President on performance to CGs (Figure 7.5-1), SP execution (Figure 7.61) and adherence to budget. The President measures SLT on their department process scorecard performance, execution of department SP (including CAPs) and operating plans (OPs) and department adherence to budget. The CEO and President meet weekly to review results and the President meets with SLT individually and as a group in the MPM meeting, MRR meeting and SP meeting. On an annual basis, performance reviews are given to the President by the CEO and to each SL by the President. HOW do you evaluate the PERFORMANCE of members of your GOVERNANCE board, as appropriate? The BOD sets the overall vision for the Company and maintains a focus on future needs to ensure sustainability and continued success relative to CGs. Thus, the performance of the BOD is measured by the effectiveness of the CGs and SKR to sustain and improve Company performance and growth. HOW do SENIOR LEADERS and your GOVERNANCE board use these PERFORMANCE reviews to further their development and to improve both their personal leadership EFFECTIVENESS and that of your board and LEADERSHIP SYSTEM, as appropriate? Input from the performance reviews listed above in addition to 360 reviews and direct manager performance reviews are used to improve performance through SOs and APs and the personal development plan within the performance review for each SL. 1.2b(1) HOW do you address any adverse impacts on society of your products and operations? We create, deploy and continually improve processes dedicated to ensuring we adhere to all statutory and regulatory requirements. Examples include the Product Delivery Restrictions process which prevents the sale of product to restricted areas, the Customer Federal Firearms License (FFL) Administration process which qualifies dealers to purchase FFL-required products and the Product Hazmat Management process which determines shipping requirements for products classified as hazardous materials. We employ a full-time Legal and Regulatory Compliance Manager and an International Sales Manager to manage domestic and international destination restrictions and product regulations. We also employ a full-time Environmental Health and Safety Specialist to reinforce the CoC item “The promotion of safety through actions and instructions.” Unsafe actions or situations are addressed immediately. We recycle all of the cardboard used in our operations and in 2008 improved our packing material, as a result of Customer feedback gained through our Voice of the Customer (VOC) process, by replacing Styrofoam packing peanuts with inflatable air pillows made of recycled plastic. These initiatives reduce the amount of packing material needed annually. HOW do you anticipate public concerns with current and future products and operations? SLT systematically reviews information from Customer listening posts (CLPs) during the quarterly Customer Focus (QCF) meeting for changes in public concern. We have affiliations with major industry groups including the NRA and the National Sport Shooting Foundation (NSSF) and obtain information from vendors and from attending trade shows. Key members of MM also systematically review industry news wires such as the Shooting Wire, NRA-ILA Alerts and the weekly NSSF Bullet Points. These keep us abreast of major industry news or events that may affect our business. Due to the political nature of our business, Customer reaction to certain events within our industry can be powerful. In just the past year, two events happened within our industry that affected our business. One involved a public relations misstep by a company who chose the wrong spokesperson and the other involved an unpopular comment by a prominent TV personality. We immediately took action and created positions on both of these occurrences since one company was one of our vendors and the other was a personality on a TV show airing one of our commercials. We were able to eliminate any adverse Customer reactions to MidwayUSA as a result. This was verified by closely monitoring the reaction to our response through our CLPs. Concerns are also identified and evaluated during our departmental SWOT analysis process. HOW do you prepare for these concerns in a proactive manner, including conserving natural resources and using EFFECTIVE supply chain management PROCESSES, as appropriate? We design our processes with the flexibility to 4 modify them as needed to meet changing legal and societal concerns. Our Product Delivery Restriction process allows for rapid response to changes in regulations. It can immediately restrict the sale of any product nationwide, down to a residence. During the planning phase for new developments, the Director of Facilities, provides comprehensive site plans to State and Local authorities to ensure compliance with all applicable regulations and rulings. These plans are designed not only to meet current requirements, but in anticipation of potential future expansion needs and potential changes to Department of Natural Resources (DNR) rulings and regulations. We perform monthly testing to ensure storm water runoff meets or exceeds water quality requirements. We utilize ESS Engineering to monitor DNR activity to ensure that we are aware of any implemented or proposed changes to DNR ruling and regulations. What are your KEY compliance PROCESSES, MEASURES, and GOALS for achieving and surpassing regulatory and legal requirements, as appropriate? Our key compliance processes are Product Delivery Restrictions process, International Licensing process, Product Hazmat Management process, Hazmat Training process and Customer FFL Administration process. Each process has an associated measure: State Regulatory Compliance, ATF Regulatory Compliance (includes FFL), International Customs Fines and DOT Compliance. All are summarized and reported to SLT and BOD quarterly in the LERC (Figure 7.6-4). Each measure has a goal of 100% compliance. What are your KEY PROCESSES, MEASURES, and GOALS for addressing risks associated with your products and operations? Our KPs to manage the risks associated with our products are our Compliance, Risk Management, Legal Risk Management and Insurance Risk Management processes. Under each of these section processes, risk management activities are performed to further ensure adherence of managing both compliance and risk-related issues. For example, insurance is in-force to protect all assets, products and operations. All vendors who sell us high-risk products such as ammunition and gun parts are required to have certificates of insurance on file, with coverage amount dependent on the type of product. Our goals and measures include 100% legal and regulatory compliance and are reported quarterly to the BOD and SLT in the LERC report. 1.2b(2) HOW does your organization promote and ensure ETHICAL BEHAVIOR in all your interactions? Promoting ethical behavior begins with the interview process on prospective employees through pre-employment background checks, drug screenings and screening them for fit with our CV and CoC. We have ongoing random drug tests for all employees and BOD. We deploy the CoC through department and Company postings, DKS, SOTB, new hire orientation and to vendors with the VPA. The quarterly LERC report to the BOD and actions taken on violations help ensure ethical behavior. SLs lead by example by living the CoC. What are your KEY PROCESSES and MEASURES or INDICATORS for enabling and monitoring ETHICAL BEHAVIOR in your GOVERNANCE structure, throughout your organization, and in interactions with CUSTOMERS, PARTNERS, suppliers and other STAKEHOLDERS? CoC deployment and CoC Violation Reporting process is deployed to key stakeholders (Customers, Employees, Vendors and Shareholders). CoC is included in the VPA. See the LERC (Figure 7.6-4), for a listing of measures and indicators. Employees: Violations are handled by HR on a case by case basis. We monitor arrest records, loan defaults, run credit checks every 5 years and random drug tests with goals of 100% adherence for governance. Customers: We watch international do not sell lists, monitor for credit card fraud and address suspicious behavior. Suppliers: We survey our vendors and monitor industry news. See 1.2b1 for an example of handling a vendor ethics breach. HOW do you monitor and respond to breaches of ETHICAL BEHAVIOR? SLT and BOD review the CoC and LERC quarterly. HR and SLT are notified of all reports of potential CoC violations, which are responded to immediately. Incidents are reviewed on a case by case basis. If incidents indicate an opportunity for improvement, an AP is created to implement the improvement. An example of learning occurred in response to an employee theft. The incident led to the revision the process and associated WIs on the handling of employee orders within the facility. 1.2c(1) HOW does your organization consider societal well-being and benefit as part of your strategy and daily operations? How do you consider the well-being of environmental, social and economic systems to which your organization does or may contribute? 1.2c(2)HOW does your organization actively support and strengthen your KEY communities? As defined by our MS, part of our strategy and culture is to support our key communities including the NRA, 2nd Amendment and shooting sports industry (2.1b(2)). Some examples of how we actively support and improve our key communities include: founding and supporting the NRA Round-Up program (Figures 7.6-9 and 7.6-10) and FNRA program and SST, hosting venues for hunter’s education and Boy Scout sporting clays events, donating to 4-H shooting sports, hosting local blood drives, providing the Gunsmith Locator (to encourage safe gunsmithing by referring Customers to professionals), producing vignettes to educate the industry community, conducting local charity drives, sponsoring high school sports teams and supporting KCGs including Ducks Unlimited, National Wild Turkey Federation and Whitetails Unlimited. We make donations to industry events and gunsmithing schools (Figure 1.2-3). Since its creation in 1992 by our Founder and CEO, our Customers have donated over $4 million to the NRA Round-Up, a National Endowment for the Protection of the 2nd Amendment, through MidwayUSA (6.1b(2)). What are your KEY communities? Our key communities are the NRA, shooting sports industry, local community, KCGs and the State of Missouri. HOW do you identify these communities and determine areas of emphasis for organizational involvement and support, including areas related to your CORE COMPETENCIES? BOD creates the MS and SLT identifies and reaffirms the key communities and areas of emphasis using the MS during the quarterly Leadership meeting. Our CCS of ME, MK, OT and LO are leveraged to provide value to our key communities. For example, we used our LO CCS to assist the NRA in shipment of books for a fundraising 5 campaign; we use our OT CCS to collect money for donation to the NRA Round-Up program; we use our MK CCS to maintain sponsorships with KCGs. HOW do your SENIOR LEADERS, in concert with your WORKFORCE, contribute to improving these communities? SLT involvement in industry and the community is reviewed and revised in quarterly Leadership meetings (Figure 1.2-3). Over 55% of our employees are NRA members. 100% of SLT are NRA Life Members. In addition, the ME department, whose mission is to select and manage the product offering, employs 100% NRA members. This is a personal choice and is paid for by each employee. Category 2: 2.1a(1) HOW does your organization conduct its strategic planning? We conduct our strategic planning through a series of MSP meetings that are fully integrated with all BCMs (Figure 1.1-1) including our weekly DBM (4.2a). These meetings are part of the MPC and are scheduled in advance as part of the SPP (Figure 2.1-2). What are the KEY PROCESS steps? The KP steps are outlined in Figure 2.1-2. We have had many cycles of learning in our SPP over the past decade. In 2000, we prepared our first formal annual business plan including a budget, a MK plan and operating plans for each department. However, at that time there was no process in place to ensure the plans were met. In 2006, to continue aligning with the Baldrige criteria, we implemented the monthly SPP that we use today which includes steps to monitor progress of the SP. The SPP is conducted through our MPC which includes the BCMs (Figure 1.1-1). In 2009, we fully integrated the SPP, budgeting and Workforce Planning process (WPP) to improve overall planning. See Figure 2.1-3 for a snapshot of our 2009 SP. Who are the KEY participants? The key participants are SLT and the BOD. Additionally, middle management and professional staff participate through DBM, SOTB and DKS and as invited guests to the MRR, MPM and MSP meetings. HOW does your PROCESS identify potential blind spots? Blind spots are identified systematically by involving all SLs, middle management and professional staff in the SPP through the SOTB and DBM including the development of SOs and APs. All employees are included in the SPP through the DKS meetings. Key stakeholders for APs are also systematically involved in the planning process, including external stakeholders. As part of the SPP, each department conducts a SWOT analysis and updates it semi-annually for review by the SLT in the SP meetings. SWOTs are also reviewed in the DKS meetings with all employees to identify potential blind spots. Key Conservation Groups Local Community Shooting Sports Industry NRA Figure 1.2-3 SLT Community and Industry Involvement (Complete listing AOS) Key Communities: NRA * Shooting Sports Industry * Local Community * Key Conservation Groups * State of Missouri SLT # of Year Key Involvement Community Member Years Began Mid-MO Friends of the Stan Frink 15 1994 NRA Committee Larry & Friends of NRA Brenda 17 1992 Creation Potterfield Larry NRA Round-Up 17 1992 Potterfield Keystone Endowment Company 9 2000 First Shots Endowment Company 10 1999 NRA Lifetime (and SLT ---Various above) Membership NRA Membership Sales Company 1992 GunTec vignettes and Larry 4 2005 commercials Potterfield Larry & Brenda MidwayUSA Potterfield 1 2008 Foundation Board Sara Potterfield Larry SST Creation 1 2008 Potterfield Baldridge Free Trappers Stan Frink 20 1989 –Officer Advisory GroupJoel Felten 1 2008 University of Central Joel Felten 1 2008 Local Students Deanna (internships, Capstone 1 2008 Herwald projects, sports team Brenda sponsorships) 20 1989 Potterfield Brenda Boy Scout’s Shoot Potterfield 10 1999 Volunteer Linda Bounds Boy Scout Great River Brenda 5 2004 Council Board Potterfield Donations to Brenda 31 1978 Charitable/Education Potterfield Organizations Human Resource William 1 2009 Association of MO Burke Sponsorships (local and Company Various national) Annual membership, local banquet attendance SLT 31 1978 and donations Lifetime Memberships Rocky Mountain Elk Stan Frink 8 2001 Sara 9 2000 Potterfield Natl. Muzzleloading Stan Frink 20 1989 Rifle Assoc. Larry & Safari Club Brenda 11 1998 International Potterfield Matt Mule Deer Federation 5 2004 Fleming 2 yrs 2004MQA Examiner SLT ea 2009 Examiner/Overseer Linda 20046 /Judge Bounds 2009 Larry Board of Directors 1 2008 Potterfield Political Donations Larry & 16 1993 and Fundraising Brenda State of MO Blind spots are also identified through our Baldrige Alignment process. We develop and deploy a Baldrige-aligned business model within the Company to ensure consistency of plans, processes, measures and actions as validated through the MQA/Baldrige Award Application Process. While answering questions for the application and aligning processes with the Baldrige criteria, we identify blind spots. See the 2nd paragraph of 2.1a(2) for information on using input from Customers, vendors and employees. 6 competitive environment, SLT determines the longest time period that can be reasonably projected. The current determination is that three years out will be used as our time horizon because of rapid changes in technology and the marketplace. HOW does your strategic planning PROCESS address these time horizons? The SPP is conducted to create an SP for each year within the planning time horizon. This includes a Company and department SP. We review current and projected performance to benchmarks and CGs. SOs and APs are developed to achieve these projections. We maintain a Company CIP list that includes potential changes (technology, regulatory) for long-term planning. We review this list in the MSP meeting. 2.1a(2) How do you ensure that strategic planning addresses the KEY factors listed below? • Your organization’s strengths, weaknesses, opportunities, and threats? The Company SWOT, which is derived from the department SWOTs, is used to determine the SOs for the planning time horizons. APs are created to address a weakness or threat or to capitalize on a strength or opportunity. Department heads review and update SWOTs using information they systematically gather through analysis and stakeholder listening posts. Listening posts include: Customer surveys, trade shows, publications, professional organizations, vendor meetings, internet sources, employee surveys, DKS meetings and other two-way communication. Threats resulting from emergencies or disasters are addressed in our Integrated Contingency Plan (ICP) (see 6.1c). • Early indications of major shifts in technology, markets, CUSTOMER preferences, competition, or the regulatory environment? Department heads research for their respective areas of expertise through trade shows, industry affiliations, news wires, publications, surveys, annual market share analysis, vendors, internet sources, ATF emails on changing, new and potential regulations, CLP, web blogs and product requests. Employees collect and share information through DKS meetings, employee suggestion program or other avenues. Relevant information is captured in the department SWOT and is used to create the SP. • Long-term organizational SUSTAINABILITY, including needed CORE COMPETENCIES? Strategic planning is conducted for each time horizon to meet CGs and SOs. To ensure we address long-term sustainability within the SPP, the shareholders have provided the SKR, “Financial Performance” which provides measures for sustainability. Our CGs balance stakeholder KRs. By building an SP to meet all CGs and SOs we ensure long-term sustainability (P.1a(2)), (Figure 7.5-1). Potterfield HOW do you determine your CORE COMPETENCIES, STRATEGIC CHALLENGES and STRATEGIC ADVANTAGES (identified in your Organizational Profile)? CCS, strategic advantages (SAs) and challenges (SCs) are systematically determined during the SPP by SLT. We define the processes that are central to fulfilling our Mission as our KPs. It is our strategy to have a CCS in each KP. Currently our KPs are identified as ME, MK, OT and LO. To determine if we have a CCS in each KP, the 12-month historical results of the KPs are reviewed annually during the SPP. To maintain alignment of our KPs with CKRs, we conduct a review of the annual Customer requirements survey results. After this information is reviewed, we determine or validate the processes needed to deliver the CKRs as defined by the new survey results. SAs are determined through a systematic evaluation of the area and section processes and process strategies, within KPs, to determine those that provide a competitive advantage. SAs arise from our ability to execute a process, a process strategy, or an aggregate of process strategies. In addition, other internal and external factors are analyzed during our Company and department SWOT analyses, such as business positioning, competitive environment and Customer feedback, to determine other factors contributing to competitive leadership. For example, our Product Selection Management process (ME) is an SA because our process strategy is to offer “Just About Everything,” which is a “long-tail” approach to product selection. This provides an advantage over our competitors by fulfilling the CKR “Product Selection,” which helps us meet our CG “CS.” This SA, which helps us have a CCS in ME, was an important contributor to our decision to expand into the hunting market in 2007. SCs are also determined during the SPP through a review of department and Company SWOT analyses and a review of projected results against goals to determine if KP measures are not projected to meet CKRs. SCs generally occur as a result of external factors. For example, our industry has seen a surge in business since the November Presidential election. There is fear in our industry of increased regulation or ban of certain products we offer. As a result, demand for these products far exceeds supply and there are widespread outages throughout our industry. This external factor has created a SC for us in meeting our CKR “Product Availability.” As a result, we have had to exercise agility in our SP by creating new APs and modifying certain processes and process strategies to continue to meet CKRs. What are your short-and longer-term planning time horizons? We define our planning time horizon as: short-term current year (CY), intermediate-term as next calendar year (CY+1), long-term as intermediate-term plus 2 years, each has an associated SP. These planning horizons allow us to remain responsive to changes in the business needs and give us time to prepare for the future. HOW are these time horizons set? SLT, with BOD input, review and set these during the MSP meetings in the first quarter. Through a review of external factors, including the In 2008, to implement further systematic consideration for long-term sustainability, the CEO and SLT instituted a quarterly Focus on the Future (FOF) meeting which integrated with the SPP. Output from the FOF meetings is directed to the SP meeting as input to the long-term SP. In addition, we integrate the WPP (includes succession plans, 3-year department organizational charts and annual training plan) with our SPP. For example, during the 1st Quarter FOF in 2009, we determined the Operations department would need to be split into two departments to continue to support the Company’s growth. From this meeting, our Workforce Plan 7 was adjusted to split Operations into 2 departments (LO/CC) and reassign a VP to lead the CC. The need to develop a new CCS could arise from one of the following sources: a change in the MS as directed by the BOD, the determination of a new CKR, or a lack of performance within a KP. Each of these sources is systematically reviewed for changes that would require the development of a new CCS. If one of these sources identifies a needed CCS, this need is added to the SP as an AP to develop a CCS in the identified process. • Your ability to execute the strategic plan? We analyze our ability to effectively execute the current year’s SP through our MRR, MPM and QCF meetings. For future year SPs, a capacity and capability review is included as part of the SPP. This evaluates the resources needed to execute the processes in addition to the department SP against available resources to identify gaps. This process integrates with our WPP. 2.1b(1) What are your KEY STRATEGIC OBJECTIVES and your timetable for accomplishing them? The 20092012 SOs and the timetable are listed in Figure 2.1-1. What are your most important GOALS for these STRATEGIC OBJECTIVES? See Figure 2.1-1 2.1b(2) HOW do your STRATEGIC OBJECTIVES address your STRATEGIC CHALLENGES and strategic advantages? SOs are designed to either benefit from an SA or address a SC. Figure 2.1-1 demonstrates the linkage between the current year’s SOs and SAs and SCs. HOW do your STRATEGIC OBJECTIVES address your opportunities for INNOVATION in products, operations and your business model? In support of our CV “Managing for Innovation,” this concept is incorporated into our SPP through innovation and knowledge sharing during SP and BCM meetings, DKS, DBM and two-way communication with SLT. Part of our innovation process is the CIP list which SLs use to capture, maintain and share innovation and improvement ideas from sources such as the call for innovation during DKS meetings, employee suggestion program or vendor meetings. SLs review CIP lists as part of the SPP and PMP for ideas to improve processes or achieve an SO. Ideas that will help achieve an SO are used to create APs. Each SO has at least one AP and each AP considers innovation in its design. For example, a 2009 SO, “Improve Customer Satisfaction and Loyalty,” considers product (service) and operation innovations that will improve CS. Under this SO, the AP PHI-USPS Flat Rate will innovate our processes and product offering to systematically offer flat rate shipping to our Customers to help us better deliver the CKR “Competitive Pricing.” How do your STRATEGIC OBJECTIVES address current and future CORE COMPETENCIES? During the SPP the SOs are determined by the President and CEO after a review of the current and needed CCS in addition to the SAs and SCs. The SOs are then designed to leverage our CCS, create a new CCS, benefit from an SA or address a SC. Figure 2.1-1 SO Integration for the linkage between the current year’s SOs and SAs and SCs. HOW do you ensure that your STRATEGIC OBJECTIVES balance short- and longer-term challenges and opportunities? To achieve balance, we prioritize the SOs within each SP based on criticality to delivering CGs. SOs within each SP are balanced to address current performance shortfalls on CG, then projected performance to CGs. Each year’s SP has SOs and APs and all information is developed and reviewed concurrently for each year. This process ensures balance between SOs across the time horizon. In addition, we have a Rapid AP Approval process for changes to the SP to respond to new challenges or opportunities that may arise at any time during our planning horizon. HOW do you ensure that your STRATEGIC OBJECTIVES consider and balance the needs of all KEY STAKEHOLDERS? By developing a CG to represent each key stakeholder (P.1a(2)) and aligning our SPP to deliver CGs through meeting stakeholder KRs, we ensure that all stakeholder needs are balanced (Figure 2.1-1). 2.2a(1) What are your KEY short- and longer-term ACTION PLANS? See Figure 2.1-1 SO Integration What are the KEY planned changes, if any, in your products and services, your CUSTOMERS and markets, and how you will operate? Our key planned changes, as captured in 2009-12 SPs, are as follows (3.1a(1)): We will continue our 3-year plan to expand the hunting category (0911); expand MidwayUSA brand merchandise line (10); create MidwayUSA product knowledge database (11); create Customer relationship management application (10); continue LO facility reconfiguration (09-11); create sponsorship process for KCGs (09); create a series of pilot TV shows (09). SPs for 2009-12 AOS 2.2a(2)HOW do you develop and DEPLOY ACTION PLANS throughout the organization to your WORKFORCE and to KEY suppliers and PARTNERS, as appropriate, to achieve your KEY STRATEGIC OBJECTIVES? APs are developed by SLT during the SPP using an AP Charter template that includes POSEC (Plan, Organize, Staff, Execute, Control, see glossary), to achieve SOs. See 2.1b(2) regarding relationship between CIP and APs and SOs regarding innovation within SOs. APs are deployed to all employees through intranet, quarterly SOTB and DKS, weekly DBM and SP Bulletin Boards; to shareholders during October BOD meeting; and to vendors as appropriate through meetings, VPA and VRC (1.1a(1)). An example of learning occurred in 2008, we decided to implement DBMs to deploy the SPP and the Baldrige criteria to the department level. This led to the creation of department SPs that integrate to create the Company SP. HOW do you ensure that the KEY outcomes of your ACTION PLANS can be sustained? To ensure the key outcomes of our APs can be sustained, APs are created using a standard AP Charter template that includes important steps for sustainability. For example, in the Staffing section, training requirements are developed; in the Control section WIs and projected results and measures are documented. Results of our completed APs are reviewed in our MSP meeting to ensure that we are achieving and sustaining expected outcomes. For example, in 2007 we implemented an AP for Credit Card Point of Sale Capture. It was designed to reduce the amount of time spent calling Customers for credit card declines and reduce the number of canceled orders. After implementation, it delivered these results for 10 months. After 10 months, it was decided that the results were stable and that it could be monitored within the department by process measures. 8 2.2a(3) HOW do you ensure that financial and other resources are available to support the accomplishment of your ACTION PLANS, while meeting current obligations? The budgeting and WPP are integrated with the SPP. We identify resource requirements during AP development. The requirements for all APs are consolidated into an SP capacity matrix which is used by SL, in conjunction with resources needed to operate processes, to create a capacity plan by department. Detailed budgets, which include capital, workforce and facility resources are prepared by each department for the short term and three year top level plans are maintained for the intermediate and long term (Figure 2.1-2). HOW do you allocate these resources to support the accomplishment of the plans? HOW do you assess and manage the financial and other risks associated with the plans? The prioritization of SOs signifies the priority of our APs. We incorporate capability and capacity (C&C) planning into the SPP to ensure adequate resources to accomplish APs for each SO according to the set priority. See previous paragraph. Resource requirements are created as a part of the Organize section of AP. We manage SOs and APs priorities during MSP meetings, reviewing and allocating resources according to the priority set by SLT. We perform net present value and risk analyses on APs, in the Plan section of the AP to determine the long-term impacts of a proposed AP. 2.2a(4) HOW do you establish and DEPLOY modified ACTION PLANS if circumstances require a shift in plans and rapid execution of new plans? MSP meetings and the Rapid AP Approval process provide the agility to change or implement new APs quickly and weekly DBM allow us to deploy them in the same manner. In 2009, as a result of MQA feedback, we implemented a Rapid AP Approval process to allow for rapid changes to the SP in case of new challenges or opportunities that may arise an any time during our planning horizon. For example, in 2009 we identified an opportunity to mitigate a new SC (shortage of certain products). We designed and implemented a new AP to systematically limit order quantities on high-demand, lowsupply products in an effort to give more Customers the opportunity to purchase these products. The current SP was reprioritized to accommodate for the addition and a lower priority AP was moved to 2010 to create the capacity. 2.2a(5) What are your KEY human resource or WORKFORCE plans to accomplish your short- and longer-term STRATEGIC OBJECTIVES and ACTION PLANS? Our key workforce plans (5.2a(1)) include: 1. Staff Hunting Category (2010-11 SO: Grow the Business, AP: Hunting Category Expansion) for C&C (see 5.2a(1)) 2. Create eCommerce Department (2009-12 SO: Improve Website Performance) for C&C 3. Lean training (2008-09 SO: Improve Efficiency) for capability, learning and development 4. Six Sigma training (2011 SO: Improve Quality) for capability Also, our SPP identified a need to support workforce C&C through expansion and reconfiguration of office and operations space. These APs are in progress and scheduled for completion in line with the needs of the SOs. HOW do the plans address potential impacts on people in your WORKFORCE and any potential changes to WORKFORCE CAPABILITY and CAPACITY needs? The WPP is integrated with the SPP (5.2a(1)) to address potential impacts on people. It identifies the number of employees and skill sets required to meet CGs and SOs and conduct processes and develops an approach to meeting new capacity and capability needs. See above for examples. 2.2a(6) What are your KEY PERFORMANCE MEASURES or INDICATORS for tracking the achievement and EFFECTIVENESS of your ACTION PLANS? The SP (APs and SOs) are designed to deliver CGs, so the most important key measures (KM) for tracking the achievement and effectiveness of our APs are the CKMs, which are direct measures of performance toward our CGs (4.1a(1), 4.1b, 6.1b(2)). The 12 CKMs that determine our success are outlined in P.2a(2) and shown in Figure P.2-2. The CKMs are denoted with a “Key” symbol ( ) in Category 7. For leading indicators, our progress on APs is reviewed weekly through an AP update email to SLT. Progress reported is based on meeting milestones as set in the Organize section of the AP. APs not meeting milestones or completion deadlines are reviewed in the MSP meeting. An in-process measure for SP completion was developed in 2009 to monitor progress on the SP in relation to goal and is reviewed in the MSP meeting and available on the intranet at all times. After AP implementation, the results, as defined in the AP’s Control section, are reviewed in the MSP meeting until proven sustainable. Progress toward achieving SO goals is also reviewed in the MSP meeting. HOW do you ensure that your overall ACTION PLAN measurement system reinforces organizational ALIGNMENT? CGs are set by the BOD. SOs align with the CGs because they are designed to leverage our CCS, create a new CCS, benefit from an SA or address a SC to achieve CGs. APs are developed to deliver the SOs. We measure the results of APs and performance compared to CGs and SOs (Figure 2.1-1). Each department SP is aligned with the Company SP and CGs. HOW do you ensure that the measurement system covers all KEY DEPLOYMENT areas and STAKEHOLDERS? By aligning our measurement system with our CGs and representing each stakeholder with a CG, we ensure that the system covers all stakeholders. Deployment of performance measure results occurs in the MRR, MPM and MSP meetings with a review CG results and aligned KP measures (both link to stakeholder KRs) (Figure 7.5-1). 2.2b For the KEY PERFORMANCE MEASURES or INDICATORS identified in 2.2a(6), what are your PERFORMANCE PROJECTIONS for both your shortand longer-term planning time horizons? Our performance projections on the 12 CKMs for the planning time horizons are included in Category 7. The CKMs are shown in Figure P.2-2. The CKMs are denoted with a “Key” symbol ( ) in Category 7. 9 Figure 2.1-1 Strategic Objective Integration 2009 Strategic Objectives 1. Grow the business 2. Improve website performance, Customer interface and overall value 3. Improve Customer satisfaction and loyalty Timetable Complete 2009 SP AOS 2009 Strategic Objective Goal(s) Key Stakeholders /CG Core Comp. (CCS) Strategic Advantage MK, ME -Privately held, profitable Company -Larry Potterfield as the "Face of MidwayUSA" -Vendor Relationship Management -Product availability -Changing regulations -Competition from internet-only retailers -Entering new markets Hunting Category Expansion Modern management practices Competition from internet-only retailers 1. Improve Web Applications 2. Improve Homepage 3. Improve Media Linker -"Just about everything" process strategy -Industry support -Inventory management/Never out strategy -Popular product promotions strategy -Product availability -Changing regulations -Competition from internet-only retailers 1. Customer Complaint Mgt. 2. C-Sat Survey Improvement 3. Future Sales Multiplier 4. Delivery Restrictions 2009-2012 Grow sales by --% Shareholder Satisfaction 2009-2012 1. Improve "Ease of finding what you are looking for" from 87.67 to 88.67% 2. Improve "Overall look and design of site" from 88.33 to 89.33% 3. Improve website speed from 2 to 1.5 seconds Customer Satisfaction 2009 1. Satisfaction: Improve Overall Customer satisfaction from 91.75 to 92.25% 2. Loyalty: Improve "Would shop here again" from 93.5 to 94% 3. Retention: Improve Customer retention from 97.38 to 98% Customer Satisfaction OT, LO MK MK, ME, OT, LO 4. Improve efficiency in key areas 2009-2012 Reduce LO/CC Cost per Order from $-- to $-- Shareholder Satisfaction 5. Improve availability of data and information 2009-2010 Improve Vendor Satisfaction from 93.73 to 94.23% Vendor and Employee Satisfaction ME 6. Improve quality in key areas 2009-2012 Win Baldrige Shareholders OT, LO Strategic Objectives for Planning Time Horizons 1. Grow the business 2010, 2011, 2012 2. Improve website performance 2010, 2011, 2012 3. Improve efficiency in key areas 2010, 2011, 2012 4. Improve performance measurement system 2010, 2011, 2012 5. Improve availability of data and information 2010 6. Improve leadership skills 2010, 2011, 2012 7. Relocate administrative functions 2010 10 Modern management practices -Vendor Relationship Management -Modern management practices Modern management practices Strategic Challenge Key APs 1. Rewrite Returns Application 2. Lean Projects 3. Seasonal Product Mgt. 4. Customer Data Mgt. 1. Performance Measurement System 2. Vendor Resource Center 3. Data Warehouse Research 1. Baldrige Application 2. Gap Resolution 3. University of MidwayUSA Percent of Strategic Plan Completed Figure 2.1-3 2009 Strategic Plan – Snapshot (Entire SP AOS) Goal Priority Action Plan 1. Grow the business 1 3-Year Hunting Category Expansion Plan Owner(s) Plan Description Merchandising 2. Improve website performance, Customer interface and overall value n/a IS-Network Server Virtualization (2008 AP) 1 Improve Web App: Account Management Create a plan to expand the hunting category to continue growth to plan Continue to virtualize servers. Marketing Rewrite Account Management Application/Page 21% 21 Status Completed Completed Scheduled to begin 5/25/09 (4/30/10) 3. Improve Customer satisfaction and loyalty n/a Product Families/Attributes (2008 AP) Merchandising 1 Future Sales Multiplier (FSM) Modification Administration 2 Delivery Restrictions Merchandising 3 Quantity Limits Administration 4. Improve efficiency in key areas n/a Batch/Wave Picking Handheld technology (2008 AP) 1 Contact Center Move Logistics Contact Center Develop a new product numbering system to group similar products together with a common number Improve In-Stock Rate by changing FSM to reflect variation in product groups/types Improve Delivery Restriction Management process to allow for agility. Example: Cannot add NJ FPID card as a license to allow shipments to NJ Create the ability to systematically limit quantities on products Ability to use handheld for tote induction, batch/wave picking (reduce totes on the conveyor) Plan and implement new CC facility 11 Completed In progress, to complete 5/29/09 In progress to complete 6/25/09 Completed Completed In progress, to complete 12/31/09 HOW are these PROJECTIONS determined? During the SPP, each SL meets with the President to review projections and goals on KMs. Projections and goals are determined by reviewing historical performance, comparative analyses including benchmarks, resource constraints, overall market conditions, SWOT analyses and APs (SOs). How does your projected PERFORMANCE compare with the projected PERFORMANCE of your competitors or comparable organizations? We show very favorable results and continued favorable projections in the CKMs throughout our planning time horizon as compared to our competitors. (Figure 7.3-1). How does it compare with KEY BENCHMARKS, GOALS, and past PERFORMANCE, as appropriate? Our performance has had favorable trends, with significant increases over past performance and benchmarks. We continue to meet or exceed goals in most CKMs and as stated above, we have outperformed our competitors. If there are current or projected gaps in PERFORMANCE against your competitors or comparable organizations, HOW will you address them? Comparative and competitive information is compiled and analyzed as part of the SPP. Analysis of this information drives the development of SOs and APs designed to address the current or projected gaps. Category 3: 3.1.a(1) How do you identify and innovate product offerings to meet the requirements and exceed the expectations of your CUSTOMER groups and market SEGMENTS (identified in your Organizational Profile)? We identify and innovate our product offering through our VOC and Vendor Management processes and by systematically monitoring our competitors and industry. Inputs from CLPs, in conjunction with CKRs (Figure P.1-7), are taken into consideration in QCF meetings, which include an agenda item for innovating our product offerings. Other innovation inputs are our CIP lists (2.1.b(2)) and calls for innovation in Company meetings. Ideas from these sources are referred to the process owner for inclusion in the SPP (2.1b(2), P.1b(2)). expanded our product offerings, supported our CKR “Product Selection,” and gave us an exclusive service. How do you identify and innovate product offerings to attract new CUSTOMERS and provide opportunities for expanding relationships with existing CUSTOMERS, as appropriate? As part of our SPP, each KP department identifies improvements needed to attract new Customers, expand relationships with existing Customers and support CKRs and SKRs for different market segments and Customer groups. Inputs include ideas from CIP lists and VOC data. Our process to identify and innovate product offerings to attract new Customers was improved after a 2008 QCF meeting identified a gap in our MK operating plan. Resources were not allocated for attracting new Customers, but 100% of the budget was allocated to existing Customer groups and market segments. We improved the process, allocating 80% of the budget to current market segments and Customer groups and 20% to attract new Customers and expand relationships with existing Customers. As a result, we expect to lengthen the Customer life cycle and increase the number of new buying Customers. 3.1a(2) HOW do you determine your KEY mechanisms to support use of your products and enable CUSTOMERS to seek information and conduct their business with you? Key mechanisms for Customer support are determined during our QCF meetings, in which we evaluate inputs from our VOC process, competitive analysis, industry analysis and CIP lists to ensure we are meeting CKRs. Through our CLPs, we listen to our Customers to determine the information and mechanisms they require, review our competitive and industry analyses to ensure our services and key mechanisms align with competitor and industry standards, develop innovative ways to meet and exceed Customer expectations. Changes and innovation are referred to the SPP. Figure 3.1-1 Customer Key Communication Mechanisms Ordering Seeking Information Website/Product Landing Pages • Website/Product Landing Contact Center Pages o Phone • Contact Center o Incoming & Outgoing Email o Phone Catalogs/Flyers/eBlasts o Mail Television o Fax Trade Shows o Email o Walk-In/Pick Up Making Requests Making Complaints Larry Line Larry Line C-Sat Survey Website CCMA CCMA Contact Center Contact Center o Phone o Phone o Email o Email Trade Shows Trade Shows Our VOC process enables us to listen and learn from Customers through scheduled reviews of input received through CLPs (Figure 3.2-1) which are aligned with our CKRs. For example, through our VOC process, current Customers requested hunting products and accessories. Based on these requests, we completed a market analysis and created an AP in our 2007 SP to enter the hunting market. This innovation supported the CKR “Product Selection,” expanded our relationship with existing Customers, created a new Customer group (Hunters), attracted new buying Customers and will assist in meeting our SKR “Financial Performance” and aid in sustainability. What are your KEY means of CUSTOMER support including your KEY communication mechanisms? Our key means of Customer support are provided by our KPs (ME, MK, OT, LO) which are designed to meet CKRs. These processes support our Customers via pricing, shipment methods, same day shipping, payment methods and same day returns processing. We also support Customers with our Key We communicate with vendors through our Vendor Management process to learn about new products, industry trends and business opportunities. In 2007, we worked with a vendor to develop a unique process to drop ship gun powder, a product line we had never offered due to restrictive storage and transportation regulations, but that was requested by our Customers through our VOC process. This innovative idea 12 Communication Mechanisms (KCM) and CLPs (Figures 3.11, 3.2-1, 3.2-2). How do they vary for different CUSTOMERS, CUSTOMER groups, or market SEGMENTS? Customers tailor their method of doing business with us according to their needs (Figures 3.1-1, 3.2-1). For example, Customers are able to opt out of email or print marketing communication (MC). Customers can enter their birthdates via the website to receive special birthday promotions, place orders via numerous methods and choose from multiple shipping options (such as UPS, USPS, or on-site pick-up). Customers can pay by major credit/debit card, COD or check and make complaints via email, phone, mail or the Larry Line. We support different Customer groups with targeted MCs. For example, email and catalog promotions are tailored to specific Customer groups. We also attend Customer-group specific trade shows (Figure 3.2-2) Through our website and television, we also tailor our messages to specific Customer groups. Our market segments vary in some Customer support requirements. For example, some dealers expect lower prices than retail Customers and payment terms instead of paying by credit card, so we offer dealer discounts and billing with net terms to qualifying Customers. International Customers require export licensing from the State and Commerce Departments or consolidation of individual Customer orders for shipments, so we offer these services. We segment VOC information by Customer type and market segment based on information gathered in our Serve the Customer application. The data is reviewed in our QCF meetings and relevant data is referred to our SPP. changed our approach when the BOD and SLT determined that embracing MMP was key to long-term sustainability. As a result, a new CG of MMP was added. To support this new CG, we adopted Baldrige as our business model and revised our SPP to include BCM. See 3.1a(1) for our approach to innovating product offerings and providing Customer support. 3.1b(1) HOW do you create an organizational culture that ensures a consistently positive CUSTOMER experience and contributes to CUSTOMER ENGAGEMENT? We create an organizational culture by establishing our #1 CG as “CS” and a CVs as “Customer-Driven Excellence.” These are part of our culture from the top down, beginning with the Founder and CEO. Our Customer focus is modeled by SLT and other salaried employees through many actions. For example, all salaried employees answer Customer calls for an hour each week (ERG). This allows employees direct contact with our Customers. Customer focus is also reinforced through our hiring practices and new hire orientation. We actively pursue employees who have a passion for our industry, as a result, many of our employees are also Customers. Our CDT interviews all salaried candidates to ensure cultural fit. We offer paid time off for industry involvement activities to facilitate the acquisition of industry knowledge and our MRR review CS and engagement measures that are aligned with our CKRs (5.1b). How do your WORKFORCE PERFORMANCE management system and your WORKFORCE and leader development SYSTEMS reinforce this culture? To reinforce our Customer culture and our # 1 CG “CS,” we align employee performance reviews with individual process measures to deliver CKRs. For example, CSRs are evaluated on their performance in relation to the CKR “Friendly, Courteous, Respectful, Ethical Service.” Employees are evaluated on their support of CVs and this is reflected in profit sharing distribution. For example, an employee’s ERG reliability rating is a determining factor in profit sharing and an NRA membership is a requirement for leadership development selection (5.1a(3)). For example, in 2008 we improved and integrated our approach to communicating with Customer groups when we produced a turkey hunting commercial specifically targeted to hunters. It aired on turkey hunting shows during turkey season. The commercial directed hunters to a web page specifically developed for turkey hunters, resulting in increased sales. How do you determine your CUSTOMERS’ KEY support requirements? Our Customers' key support requirements are determined by our annual CKR survey. These are sent to Customers in each Customer group, for validation and prioritization by each group. Customers also have the opportunity to suggest additional CKRs. We review the results and consider additions and changes to CKRs in our QCF meetings, which integrates with our SPP. How do you ensure that CUSTOMER support requirements are DEPLOYED to all people and PROCESSES involved in CUSTOMER SUPPORT? We ensure CKR deployment through internal ISO audits, incorporated CKRs into related WI, monthly CSR call monitoring, training, new hire orientation and ongoing reinforcement through SOTB, DBM, DKS and postings on the intranet and SP bulletin boards. 3.1a(3) How do you keep your APPROACHES for identifying and innovating product offerings and for providing CUSTOMER support current with business needs and directions? Our SPDT (Figure 2.1-2) outlines reviews of the MS and CGs during the SPP. These reviews set the direction for our SP. Our SOs and corresponding APs are directly related to our CGs. For example, in 2008 we Workforce and leader development systems reinforce this culture by aligning 360 reviews with our CVs. We select employees for leadership development based on their support of our CV “Customer-Driven Excellence.” Employees are encouraged to become NRA members and participate in shooting sports. Most Company activities and venues for development are centered on our industry. We hold gunsmithing classes and use hunting trips as mentoring opportunities for leadership development. 3.1b(2) How do you build and manage relationships with CUSTOMERS to • acquire new CUSTOMERS: We acquire new Customers and build relationships with current Customers is through marketing and the positioning of Larry Potterfield as the “Face of MidwayUSA.” We use Larry in MCs such as “Wednesday Night At The Range” on Outdoor Life Network, to establish a personal bond with Customers. Larry is active in the industry, in shooting and key conservation organizations and represents the Company to new, prospective and current Customers. Larry is very well known and liked by our Customers who 13 frequently approach him in public wanting to shake his hand and repeat back to him his “catch phrases.” organizational agility allows for rapid response to changes in business needs and directions. For example, in 2007 input from the VOC process was used to innovate our approach for building Customer relationships. Using this input, we decided to use Larry Potterfield as the “Face of MidwayUSA” in all MCs because of his appeal to Customers. In alignment with our business need to position Larry as the “Face of MidwayUSA,” (a current SA), we created a new CLP that allowed Customers direct, 2-way contact with Larry (the “Larry Line”). 3.2a(1) How do you listen to CUSTOMERS to obtain actionable information and to obtain feedback on your products and your CUSTOMER support? We have deployed CLPs (Figure 3.2-1) aligned with our CKRs that provide input to the ME, MK and CC DBMs and QCF meetings. Our CS survey is administered electronically postorder for website Customers and semi-annually to phone Customers. Our Customer Complaint Management Application (CCMA) continuously collects and reports data from all KCM. CLP data is analyzed for use in CIP lists and SPP. The data is segmented by Customer group and market segment. How do your listening methods vary for different CUSTOMERS, CUSTOMER groups, or market SEGMENTS? How do your listening methods vary across the CUSTOMER life cycle? How do you follow up with CUSTOMERS on the quality of products, CUSTOMER support, and transactions to receive immediate and actionable feedback? We provide a full-feature website rich in product information and educational content, deliver great Customer service, offer free catalogs to new Customers, use Search Engine Optimization so new Customers can find us through internet searches, sponsor competitive shooting events and KCGs, are a leading supporter of the NRA and offer innovative and attractive promotions and specials. • meet their requirements and exceed their expectations in each stage of the CUSTOMER life cycle; and: We continue to develop relationships with current and potential Customers by understanding CKRs and exceeding expectations. Our Customer’s #1 KR is “Competitive pricing,” so we compare our prices against competitors (Figure 7.1-1) and deploy MMP to lower costs so we may offer the most competitive prices. In addition, our promotional business model ensures a wide variety of monthly product promotions for all Customer groups. Our New Product Addition process allows us to be first to market with new offerings from vendors. This agility allows us to take products to market the same day they are received. We combine industry leading product information, first to market strategies and our “Just About Everything” concept to ensure Customers get the products they want as soon as they are available. Because we offer “Just About Everything,” we satisfy Customers in all market segments and Customer groups, throughout all stages of the Customer life cycle. Figure 3.2-1 Examples of Customer Listening Posts Customer Segment Listening Post Current Potential C-Sat Survey X X CCMA X X Larry Line X X Phone X X E-mail X X Trade Shows X X Product Reviews X Sales Results X Web –“I Wish You Carried” X X Web – “Remind Me” X X We assign Customer characteristics to individual Customers based on information they provide, purchase history and other demographic information. Using these characteristics we target email and/or print communications to individual Customers based on their interests, meeting their CKR “Timely, Relevant, Quality, Marketing Communications.” For example, in 2009 we improved our Customer Relationship Management process by deploying a DAP to extend targeted, specific offers to prevent Customers from rolling from active to inactive status. • increase their ENGAGEMENT with you? Many of our approaches to acquire new Customers and exceed expectations also increase Customer engagement. Through our processes, we focus on CKRs to exceed Customer expectations and increase Customer engagement. We provide direct access to Larry Potterfield via our Larry Line. In addition, our industry leading support of the NRA, competitive shooting events and KCGs are powerful engagement tools. Since our industry is affected by political climate, our Customers are extremely passionate about our industry and maintaining their lifestyle. We are the industry leader in supporting causes important to our Customers and the originator of many programs designed to support and sustain our industry. For example, we created the FNRA program, the NRA Round-Up program and the SST (1.2c(1)). 3.1b(3) How do you keep your APPROACHES for creating a CUSTOMER-focused culture and building CUSTOMER relationships current with business needs and directions? Integrating the QCF meetings and SPP allows for systematic monitoring of business needs and Figure 3.2-2 Market Segment or Customer Group Gunsmiths Hunters Reloaders Shooters Dealers International Retail Past/Potential Past X X X X X X X Trade Show Listening Post SCI ATA X X X X X X SHOT ACGG NRA X X X X X X X X X X X X X X X X X IW A X X All Customers, Customer groups and market segments, at all stages of the Customer life cycle, have access to our diverse CLPs (Figure 3.2-1) and Customer KCM(Figure 3.1-1). One approach for listening to Customers regarding the quality of products is our Product Review feature. Product reviews are 14 used by other Customers for purchasing decisions and by Product Managers to determine product quality. Monthly sales, product return rates and other measures are reviewed to obtain feedback from Customers on the products we sell. Another approach to listening to Customers is our CS Survey, which provides feedback on the quality of products, the quality of Customer support and their transactions with us. This survey helps us to understand trends and make improvements to our products and services. For example, in 2009, we improved the survey process to include phone and web Customers and segment the results by Customer group so we can see any variation that might exist for our different types of Customer and any differences that may exist for Customers using different access mechanisms (phone or website orders). We also segment our Customer feedback through our VOC process. Listening methods vary based on the access mechanism our Customers choose and KRs are reviewed for appropriateness in the QCF meetings and updated as necessary. Additionally, we listen to and communicate with different Customer groups by attending Customer-group specific trade shows (Figure 3.2-2). 3.2a(2) How do you listen to former CUSTOMERS, potential CUSTOMERS, and CUSTOMERS of competitors to obtain actionable information and to obtain feedback on your products, CUSTOMER support, and transactions, as appropriate? We use the CS survey to listen to former, current and potential Customers and obtain actionable information on our products and services. Using benchmarking information from CS surveys enables us to listen to Customers of competitors (our Customers also purchase from Competitors) and former Customers. 3.2a(3) How do you manage CUSTOMER complaints? How does your CUSTOMER complaint management PROCESS ensure that complaints are resolved promptly and EFFECTIVELY? How does your CUSTOMER complaint management PROCESS enable you to recover your CUSTOMERS’ confidence, and enhance their satisfaction and ENGAGEMENT? How does your complaint management system enable aggregation and ANALYSIS of complaints for use in improvement throughout your organization and by your PARTNERS, as appropriate? Our CCMA uses a systematic Customer Complaint Management process, which is integrated with CKRs. It enables us to analyze trends and report from complaint categories that align with CKRs and tracks the Customer KCM (Figure 3.1-1). The CCMA allows us to contact the Customer directly for easy follow-up and share information with other departments for corrective actions. Distribution of information is critical for alignment with CGs. We have the ability to track the resolution to a Customer inquiry or complaint. Although our vendors do not handle complaints for us, we do communicate returns information to product vendors to improve products and packaging. The VRC allows vendors to see their return performance and the overall rating of their products based on product reviews. We also work with transportation partners to improve service and delivery. 3.2b(1) How do you determine CUSTOMER satisfaction and ENGAGEMENT? CS is determined by evaluating our CS survey results (3.2a(2)) (Figure 7.2-1, 1a), reported in the MRR and available to the public on BizRate’s website. More than 150,000 Customers have rated us using our BizRate CS survey since 2004 and we currently hold the highest rating provided by BizRate (“Outstanding”). In 2008, we were awarded our 4th straight Platinum Award for BizRate’s Circle of Excellence program. We determine Customer engagement through the Customer Retention process measure (Figure 7.22) and by measuring responses to the CS survey questions: “Willingness to Recommend” and “Willingness to Buy Again” (Figure 7.2-3). How do these determination methods differ among CUSTOMER groups and market SEGMENTS, as appropriate? We utilize the same determination methods within Customer groups and retail and dealer market segments because we have determined through our surveys that the KCMs do not vary. For international, we deploy a separate survey to determine satisfaction and engagement. How do your measurements capture actionable information for use in exceeding your CUSTOMERS’ expectations and securing your CUSTOMERS’ ENGAGEMENT? How do your determination methods enable aggregation and ANALYSIS of data for use in improvement throughout your organization and by your PARTNERS, as appropriate? Our CS survey captures Customer feedback by individual survey question, is segmented by Customer group and aggregated by CKR for analysis. Each CKRs is aligned with the processes responsible for delivering that CKR. Survey results, CKRs and associated process measures are reviewed in the MK DBM and the MRR. When unacceptable trends or performance below goal are reported in the MRR, they are referred to the MPM meeting for further analysis. In the MPM meeting, SLT also reviews the KP BSC (Figure 7.5-7), which includes KP measures. Feedback from our CLPs and other stakeholders is integrated into department and Company SWOTs for input into the SPP. This provides the opportunity to take advantage of any opportunities to improve and innovate our products and services in anticipation of new or changing CKRs (4.1b1). 3.2b(2) How do you obtain and use information on your CUSTOMERS’ satisfaction relative to their satisfaction with your competitors? How do you obtain and use information on your CUSTOMERS satisfaction relative to the satisfaction levels of CUSTOMERS of other organizations providing similar products or to industry benchmarks, as appropriate? We obtain competitor satisfaction data through our CS surveys. This data provides us with information on how our competitor’s Customers rate their service and how our Customers rate our competitors. We also collect data through our Trade Show and Vendor Communication processes. Data is systematically directed into ME and MK DBM and QCF meetings for review and action. For example, two of our major competitors assign shipping and processing charges as a percentage of the total invoice. While we believe our shipping and processing charges, representing the shipping charges of the specific box dimension and weight to the specific Customer address, is a more Customer-friendly solution, our processing and shipping charges are more difficult to explain. Review of CS data and 15 competitor analysis indicated some competitors offer USPS flat-rate shipping. The addition of this shipping option is included as an AP on the 2009 SP and represents an opportunity to improve CS with shipping charges (CKR “Competitive Pricing”). 3.2b(3) How do you determine CUSTOMER dissatisfaction? We analyze product return rate to determine Customer dissatisfaction (Figure 7.2-6). When a product is found to have a high return rate, we analyze Customer product reviews to get further Customer input. After the root cause has been identified a solution is implemented to resolve the reason for dissatisfaction. For example, in 2007 through this analysis we identified a shotgun barrel that had a high return rate. After an assessment of the Product Reviews, we determined that the information provided by the vendor was incorrect in regard to which shotgun models it fit. After verifying the correct information with the vendor, the information was updated in the product text to accurately reflect its compatibility. This process helps us deliver the CKR “Knowledge.” products? We systematically review data from our CS survey, CCMA, sales trends and results, Customer characteristics, information from vendors about competitors and industry trends, market information from NSSF, trade shows, newswires, political climate, gap analysis of competitors and new product requests from Customers to identify and anticipate future Customer groups and market segments. This data is reviewed during our QCF and DBM and findings are used to create SOs and APs during our SPP to improve our products and services. For example, in 3.1.a(1), we detailed the process to launch the Hunting product line and create the new Hunting Customer group. We listened to current Customers in the Shooting, Reloading and Gunsmithing Customer groups, who hunted and requested hunting products. A key opportunity evaluated when we entered the hunting market was that potential competitors were branding their own products and not supporting brand name manufacturers. We saw an opportunity to concentrate on high-end, brand-conscious Customers and focused our efforts on this niche. Through state hunting license sales data, we were able to determine the size of the entire hunting Customer group. By adding names from available state hunting license lists to our database, we were able pursue those hunting Customers as a new Customer group. By targeting individuals with hunting licenses who are not current buying Customers, we targeted Customers of competitors through direct mail, television and internet advertising campaigns designed to reach out to the specific hunting market. Similar analysis also helped us to determine not to launch into the waterfowl hunting market due to the high product return rates indicated during research. Customer complaints from our CLPs are aggregated by Customers, Customer groups and market segment are also reviewed for Customer dissatisfaction feedback. This data is directed into the SPP through QCF meetings for action. How do your measurements capture actionable information for use in meeting your CUSTOMERS’ requirements and exceeding their expectations in the future? By aligning our measurements with our processes and CKRs, we monitor measurements that are leading indicators of CS in our MRR and MPM meetings. CKRs missing or at risk of missing goals are referred to the MPM meeting for action. CS survey information is used to validate feedback received through CLPs (Figure 3.2-1) and KM that show performance against CKRs. Survey information is analyzed to determine any areas for improvement and leading indicators measuring CKRs are analyzed to validate the findings. For example, quick service in the CC is a component of the CKR is “Easy to do Business With.” As a result of monitoring CS surveys and business results, we determined CC service levels would be impacted in March 2009 due to sales exceeding original projections. As a result, ERG support was activated, requiring most salaried employees’ support for 2 hours per day through the busy period. How do your determination methods enable aggregation and ANALYSIS of data for use in improvement throughout your organization and by your PARTNERS, as appropriate? Aggregation and analysis of data is enabled due to tools such as the KP BSC (7.5-6), which utilizes multiple data sources to provide a complete picture of performance (4.1c). For example, a KM for ME is In Stock Rate (Figure 7.1-3). This rate is reviewed in the MRR and is used at the department level to work with vendors to make improvements. 3.2c(1) How do you use CUSTOMER, market, and product offering information to identify current and anticipate future CUSTOMER groups and market SEGMENTS? How do you consider CUSTOMERS of competitors and other potential CUSTOMERS and markets in this SEGMENTATION? How do you determine which CUSTOMERS, CUSTOMER groups, and market SEGMENTS to pursue for current and future A list of Customer groups and competitors ordered by market share is maintained by the ME department (P.2-1). By monitoring the size of our competitors through public information, we determine the size and growth potential of our competitors and the markets they serve. In addition, market research from industry participants such as the NSSF is used to obtain a profile of the market. Customers of competitors are obtained using industry information such as hunting license and FFL lists. With this information, we can determine the size and composition of each market within our industry and identify the best areas to leverage our CCS to expand our markets. In order to continue our solid growth trend to meet SKRs and expand our product and service offerings to meet our CKRs, we search for new areas to expand our product and service offerings. To select the best areas to pursue, we conduct a gap analysis of our competitors within the industry to determine the best application of our CCS to gain a competitive advantage and acquire new Customers. Integration of this information into the SPP allows planning for capital resources, workforce resources and training needed to successfully enter and serve these markets. 3.2c(2) How do you use CUSTOMER, market, and product offering information to identify and anticipate KEY CUSTOMER requirements (including products and product features) and changing expectations and their relative importance to CUSTOMERS’ purchasing or 16 relationship decisions? Analysis of our annual CKR survey (3.1a(2)), in addition to other CLP data provides input into our QCF meetings, where we determine and validate our CKRs. Input from review of industry and market listening posts (i.e. newswires), website “I Wish You Carried” (product requests), Customer Product Reviews and sales trends provide indicators of future or changing CKRs. For example, on February 25, 2009, Attorney General Holder commented on potential changes to current gun laws in a newswire. Anticipation that these comments would drive reactive Customer activity resulted in additional product orders and increased ERG assistance in March to meet the CKRs “Product Availability” and “Easy to do Business With.” Category 4: 4.1a(1) HOW do you select, collect, align and integrate data and information for tracking daily operations and for tracking overall organizational PERFORMANCE, including progress relative to STRATEGIC OBJECTIVES and ACTION PLANS? We choose data and information based on three criteria: Does it support a Company or department goal? Is it actionable? (Will we make decisions based on the information?) Is it cost effective? During the MPM and MRR, SLT identifies/reviews the KPs and defines and validates the measures that roll up into the performance against stakeholder KRs and CGs. AP measures are defined by the AP owner as part of the SPP. We measure the performance of all processes through the KP BSC Figure 7.5-7. Area processes are systematically measured by the respective departments and those deemed appropriate by department heads are measured by surveys. The data is stored in our information system and is available for analysis or performance review on our intranet site. Progress on AP milestones is tracked and reported weekly to SLT. SO goals are reported monthly in SP meetings. We pursue alignment and integration by identifying key stakeholders and their KRs in the MSP, the CGs results in the MRR and Process BSC in the MPM meeting and in the monthly President’s Department Results Review (PDRR). See Figures 7.5-7 and 1.1-1. CGs, stakeholder KRs and corresponding measures, KPs and corresponding measures, SOs and APs are all aligned. We deploy data and information through the intranet, regular performance reviews, quarterly DKS and SOTB and weekly DBM. As Customers ourselves, we are committed to satisfying our fellow Customers and strive to listen and learn from them to continually improve CS. We use CLPs to determine CKRs, needs and expectations, which are validated by the CS survey. We have KMs for measuring our ability to meet CKRs. We systematically review and evaluate our CLPs and data to identify required APs to meet our SOs. This review occurs in QCF, MM DKS meetings and during weekly MM DBM. In addition, salaried staff ERG participation provides contact with Customers to obtain real-time feedback on changing expectations. How do you identify and anticipate how these requirements and changing expectations will differ across CUSTOMERS, CUSTOMER groups, and market SEGMENTS and across the CUSTOMER life cycle? We identify and anticipate changing requirements and expectations across Customers, Customer groups and market segments by segmenting data (where appropriate) and applying historical data trends. For example, we know hunting Customers purchase fewer hunting products in a recession and shooting and reloading Customers tend to purchase more. 3.2c(3) How do you use CUSTOMER, market, and product offering information to improve marketing, build a more CUSTOMER-focused culture, and identify opportunities for INNOVATION? We use Customer and market information to identify opportunities for innovation through use of our CS survey and our Vendor Management processes. For example, based on Customer feedback regarding television and content, we withdrew from print advertising in 2009 and placed nearly all advertising dollars into TV. We continue to build our culture by our hiring and management practices, using employees as Customers to continue to improve our products and services offered. Innovation examples are listed throughout Category 3. 3.2c(4) How do you keep your APPROACHES for CUSTOMER listening; determination of CUSTOMER satisfaction, dissatisfaction, and ENGAGEMENT; and use of CUSTOMER data current with business needs and directions? Our approaches for Customer listening are kept current by integrating CLPs into our SPP. Through MSP, MPM, QCF and DBM meetings, we systematically review and deploy CKRs, KPs (ISO audits) and CLPs. We routinely conduct SWOT analyses, which serve as the basis for creating APs to improve our ability to meet our SOs and CGs. The frequencies of our MSP meetings provide agility to respond to rapid changes in business and Customer needs. An example of how we improved our process for tracking data and information occurred in early 2009 when we created a measure for tracking progress toward accomplishing our SP. In a 1st quarter SP meeting, we identified a gap in determining our overall progress toward accomplishing our SP. Although we tracked milestones on specific APs, we did not track overall progress on our SP throughout the year. Our innovative solution was to create a measure within the SP on the intranet that showed us real-time progress on our SP (% complete) (Figure 7.6-1). We now know at any given time throughout the year our progress toward accomplishing our SP and use this information in all our SP meetings to monitor progress and redirect or allocate resources as necessary. Our data is live, meaning our information systems are real-time. Relevant daily results are posted on the intranet and key results are physically posted in LO. Department heads and managers review results daily. Daily results are aggregated into monthly KMs, which are reviewed in MRR meetings, MPM meetings and in the monthly PDRR. For example, the How's Business report gives up-to-the-minute sales, number of invoices and package information, segmented by order source and by package carrier. We can also see current inventory dollars, in transit dollars and Customer backorder information. Our CC views service levels in 15-minute increments through Enterprise Interaction Center (EIC). LO views up to the minute shipping information through the LO Center to ensure same day shipping of orders, which links to our CKR “Fast Delivery” (Figure 7.1-7). eCommerce receives automated 17 messages if there is a disruption in web up-availability. Inprocess measures allow agility in staffing. What are your KEY organizational PERFORMANCE MEASURES, including KEY short-term and longer term financial MEASURES? Performance at the highest and most important level is measured by our CKMs, which are direct measures of performance toward our CGs. The principal factors (12 CKMs) that determine our success are outlined in P.2a(2) of the Organizational Profile and shown in Figure P.22. The CKMs are denoted with a “Key” symbol in Category 7. How frequently are these MEASURES determined? In the January BOD meeting, the shareholders discuss CGs and SKRs. In the MRR immediately following this 1st quarter BOD meeting, there is an agenda item to discuss any changes or additions to our key performance measures. These measures are then reviewed by SLT in the MRRs throughout the year and measures can be added, removed or modified each month as necessary. How do you use these data and information to support organizational decision making and INNOVATION? Performance issues or opportunities identified in the MRRs are referred to the MPM meeting. After SLT identifies the cause of the problem or opportunity in the MPM meeting or through RCA or CARs, department heads initiate a call for innovation in the weekly DBM through the PMP. Solutions requiring AP Charters are referred to the MSP meeting. Each AP considers innovation in its design. For example, in our 4th quarter 2007 MRR, we noted the downward trend on the SKR “Financial Performance” (Figure 7.5-1). This led to the implementation of several APs during the 1st quarter of 2008. In 2008 we met the set goals and current projections indicate 2009 will continue to meet goals. 4.1a(2) HOW do you select and ensure the EFFECTIVE use of KEY comparative data and information to support operational and strategic decision making and INNOVATION? To achieve our Vision “To be the best-run business in America,” we continuously seek comparative data on BP companies to assess our performance. During the SPP, comparative data is used for validation, for setting KM goals and to aid in determining SAs and opportunities for innovation. Comparative data is selected by department heads (SLT members) from the following criteria (in priority order): 1) Benchmarks (BP), world-class, Baldrige winners; may be outside the industry, but could be competitors, 2) Competitors, 3) Industry, 4) External Comparative (similar organizations) 5) Internal. SLT systematically reviews comparative data in our MRRs to ensure relevancy and accuracy. We require that all KMs have at least one source of comparative data when feasible. Our desired state is to have both a BP comparison and a competitor for all KMs. However, since nearly all of our competitors are privately held, comparative data on competitors is not always possible to obtain. Our Comparative Data WI, which outlines this process in detail, is AOS. Information to support operational and strategic decision making is systematically selected by department heads who select data that measures process performance and performance against CGs. Since all our processes are designed to deliver our stakeholder’s KRs, which ultimately delivers our CGs, data and information is selected if it measures our ability to meet stakeholder KRs. Innovation is measured by our ability to improve our KPs and ultimately our performance against CGs. 4.1a(3) HOW do you keep your PERFORMANCE measurement system current with business needs and directions? HOW do you ensure that your PERFORMANCE measurement system is sensitive to rapid or unexpected organizational or external changes? The performance measurement system is reviewed in our MRR and MPM meetings. Results of our performance measurement system are evaluated on CGs and KP measures in our MRRs and in the monthly PDRR. As the BOD changes CGs or as stakeholder KRs change, we update our MRR presentation, which provides agility in maintaining alignment with business needs. Most measures are available for review on the intranet (real-time data). Real-time daily monitoring, weekly SLT and DBM meetings and MSP, MRR and MPM meetings allow rapid response to unexpected organizational or external changes. An example of learning, leading to process improvement and integration, occurred in 2008 when the SLT recommended to the BOD that we add Vendor Satisfaction to our CGs because the satisfaction of this key stakeholder was not being measured. The BOD considered this recommendation in its 1st quarter meeting in 2008 and approved the recommendation. We then added the goal to our current CGs and immediately referred to SP the need to start measuring Vendor Satisfaction. An AP was created to implement a Vendor Satisfaction survey and KM. In addition, several APs have been created since then to improve Vendor Satisfaction (ex. VRC AP in 2009). 4.1b(1) HOW do you review organizational PERFORMANCE and capabilities? See Figure 1.1-1. Performance is reviewed in MRRs, MPM meetings and in the monthly PDRR (1.1b(2)). Capabilities are reviewed during the SPP and through SWOT analyses monthly in the DBM SP meetings. Weekly SLT meetings are also held every Monday to communicate current events and discuss tactical issues that might need immediate attention. SWOT analyses are designed to evaluate our ability to execute our SP, including achieving our CGs. Our quarterly Workforce Focus meeting reviews 3year organizational charts for each department and capacity and capability gaps, which are integrated into University of MidwayUSA. Current and future CCS are reviewed in the MPM meetings, addressing organizational capabilities. Workforce C&C are also discussed in quarterly DKS meetings to identify blind spots. Furthermore, a group of MQA-trained examiners performs a quarterly Baldrige self-scoring of our Company performance on categories 1 – 7 (Figure 7.5-4). What ANALYSES do you perform to support these reviews and to ensure that conclusions are valid? In the MRR, we compare results to benchmarks, competitors, industry, external comparative, internal and historical data to validate our conclusions. HOW do you use these reviews to assess organizational success, competitive PERFORMANCE, and progress relative to STRATEGIC OBJECTIVES and ACTION PLANS? Organizational success is assessed in the MRRs by reviewing performance against CGs and KP measures and comparative data. Our ability to sustain success is dependent upon completing our SP and successful operation of our processes (2.1b(2)). The SP is designed to achieve, sustain or 18 improve performance relative to CGs. We review progress on APs, SOs and CGs in our MSP meetings and weekly DBM. We send weekly AP status updates to SLT. These updates show whether each CAP is meeting milestones or needs more focus. We also track our execution of the SP with a measure that is attached to the SP and reviewed in the MSP meeting. (Figure 7.6-1) The SP, along with this measure, is on our intranet and shows the percent complete of our SP compared to where we should be at any time throughout the year. HOW do you use these reviews to assess your organization’s ability to respond rapidly to changing organizational needs and challenges in your operating environment? Regular monthly reviews of KP SWOTs in the SP meetings and within departments in DBM and DKS and the integration of information from SWOTs with the SPP provides the agility needed to respond rapidly to changing organizational needs and challenges. SOs and APs address these needs and challenges. An example of agility occurred in early 2009, during a MRR, we found that our Product Availability measure was performing below goal, analysis revealed the source was extremely high industry demand for certain gun parts, ammunition and reloading components. As a result, some Customers were buying large quantities of these limited products which meant we were serving fewer Customers. This condition impacted our CS in relation to the CKR “Product Availability” (Figure 7.2-1a). As a result, we re-prioritized our SP and created a new AP for setting quantity limits on these high demand, limited availability products so we could serve more Customers and better achieve the CKR “Product Availability.” 4.1c HOW do you translate organizational PERFORMANCE review findings into priorities for continuous and breakthrough improvement and into opportunities for INNOVATION? We refer issues or opportunities (including those identified through comparative data or performance projections) from the MRR to the MPM meeting (2.2b). PM meeting issues requiring CAPs are referred to SP meeting. We innovate through CAPs, DAPs and CIPs and calls for innovation in SOTB, DKS, SLT Meetings and weekly DBM. “Managing for Innovation” is a CV. Figure 4.1-1 highlights examples where we have used innovation to make meaningful change to improve our products, services, processes and operations to create new value for our stakeholders (6.2c). HOW are these priorities and opportunities DEPLOYED to work group and functional-level operations throughout your organization to enable EFFECTIVE support for their decision making? The SP, which contains our prioritized SOs and APs, are deployed through quarterly SOTB meetings, quarterly DKS meetings, weekly DBM and SP Bulletin Boards. At SOTB meetings, select SL, the President and CEO present the SP and other important topics. Shortly after these meetings, the department heads and either the President or CEO hold a DKS to ensure deployment and communication flows throughout the Company. At each meeting, there is a call for innovation and a question and answer session. These quarterly meetings are reinforced by deployment at weekly departmental meetings and postings on SP Bulletin Boards. When appropriate, HOW are the priorities and opportunities DEPLOYED to your suppliers, PARTNERS, and COLLABORATORS to ensure organizational ALIGNMENT? Priorities and opportunities are communicated to vendors through VPA, VRC, vendor meetings, email or phone calls, as appropriate. For example, we meet annually with key vendors to review product selection, pricing, vendor programs and changes to the VPA. We meet annually with key shipping vendors to review rates, new KRs, opportunities or changes in our priorities. We communicate with these vendors frequently to share BP and information on changing market and regulatory conditions. For example, to better provide the CKR “Fast Delivery,” our VP-LO worked with UPS, to understand their cut off times and modify the times they picked up packages for delivery. Another example of integrating vendors into improving our ability to meet a stakeholder KR was when our VP-ME communicated with our vendors regarding advertising opportunities in our Master Catalog. This opportunity offered us the ability to partially fund the catalog and allowed vendors an additional advertising channel for reaching their Customers. The identification of vendors as a source of funding for our Master Catalog was innovation which improved delivery of the SKR “Financial Performance.” 4.2a(1) HOW do you ensure the following properties of your organizational data, information, and knowledge: • Accuracy? We apply access levels and edit checks throughout applications as appropriate and conduct data hygiene monthly through our Customer Data Management process. When a measure is developed, we utilize statistical analysis validate the results. In addition, we compare the results against historical results to validate data accuracy and reliability. • Integrity and reliability? We apply access levels to each type of data, conduct data hygiene monthly and incorporate manual checks and reconciliation where appropriate. Examples include: hub / batch reconciliation of invoice totals to credit card deposit, inventory cycle counts and annual physical inventory. • Timeliness? Most data is real-time or is captured automatically. We continuously monitor key systems and applications for performance to maintain timeliness. • Security and confidentiality? We apply access levels to data and information and enforce employee password rotation quarterly. The information security policy is AOS. All credit card data is encrypted through Secure Socket Layer. Firewall breaches are monitored by Tipping Point (intrusion protection system). We maintain Payment Card Industry compliance. We use McAfee virus control, Bright Mail for spam filtering and spyware protection for confidentiality. We have controlled building and area access. Employees with access to confidential information sign a Confidentiality Agreement. 4.2a(2) HOW do you make needed data and information available? HOW do you make them accessible to your WORKFORCE, suppliers, PARTNERS, COLLABORATORS, and CUSTOMERS, as appropriate? We ensure accessibility to all segments by deploying through the following methods: Workforce: Intranet, multiple realtime software applications, reports, email, department bulletin boards, Company newsletter, DKS, weekly DBM, SOTB, also see Figures 1.1-2 and 1.2-2 Vendors: VPA, trade shows, vendor visits, representative meetings and VRC Customers: 19 Internet, CC Customer Service Representatives (CSRs), catalogs, commercials, vignettes, monthly flyers, email, eBlast, magazine advertisements. knowledge relevant to the SP is collected from employees. Additionally, including other sources of relevant knowledge such as department and Company SWOTs, stakeholder requirements and CGs, CIP lists within the SPP allow for the transfer of relevant knowledge to be used within the SPP. 4.2b Management of Information resources and Technology (1)HOW do you ensure that hardware and software are reliable, secure, and user-friendly? Hardware and software reliability, security and user-friendliness starts with software and hardware acquisition strategies in terms of brands and vendors, products, service and support. Maintenance agreements, contracts and updates are maintained on key items when available. IS systematically applies the latest security updates within 30 days on work stations and within 60 days on servers. IS replaces computers and other hardware every three years or as necessary to enhance speed, security and performance and to ensure reliability and current technology. A backup supply of key equipment including workstations and servers is maintained. Constant monitoring of key systems and processes occurs via SolarWinds. Network security includes quarterly password rotation and individual access levels. Nightly backups are completed and stored off-site. Helpdesk availability covers all hours of operation and provides emergency coverage 24x7. Helpdesk conducts walk-arounds to capture feedback from end-users on the user-friendliness of hardware and software. User-friendliness is also addressed by involving subject matter experts (SMEs), who are end users in application development for process design and improvement. 4.2b(2) In the event of an emergency, HOW do you ensure the continued availability of hardware and software systems and the continued availability of data and information? Our ICP contains procedures for information recovery. Data is backed up daily and backups are stored offsite. We do nightly test restores of our core database. Where appropriate, redundant systems are developed and stored in a storm-proof facility. A supply of backup equipment is maintained for KPs. The core systems are constantly monitored and IS is automatically notified of any unusual events, which they can address remotely. We have buildingwide, uninterruptible power source coverage for all computer systems and the capability for CSRs and ERG employee to login and answer calls from home during severe weather conditions. ERG employees are able to cover phones in case of emergency. Emergency preparedness is systematically reevaluated by SLT in PM meetings and SLT conducts annual ICP tabletop exercises. 4.2b(3) HOW do you keep your data and information availability mechanisms, including your software and hardware systems, current with business needs and directions and with technological changes in your operating environment? Business needs and directions are reviewed in MRR, PM and SP meetings. We keep data and information mechanisms current with technological changes through attending technology conferences, meeting with vendors and external user groups and maintaining subscriptions to information systems publications. Changes to systems are implemented through the SPP. An example of learning is our creation of a Columbia user information group consisting of four companies and a local college. This group The effectiveness of the above approaches is verified through the MRR, where SLT reviews communication deployment to Employees (Figure 7.4-1), Vendors (Figure 7.5-1) and Customers (Figure 7.2-1a). SLT reviews data accessibility in the quarterly Knowledge Management meetings to ensure appropriate stakeholders are considered. 4.2a(3) HOW do you manage organizational knowledge to accomplish the following: • The collection and transfer of WORKFORCE knowledge? In addition to collecting and transferring workforce knowledge as described in 4.2a2, the transfer of workforce knowledge is accomplished through our ISO certification. In 2008, MidwayUSA became ISO certified to ensure a systematic approach to documenting all processes and having procedures in place for sustainability. As a result, all processes have a process summary and strategy documented and section processes have written WI for employee training. This approach is a key element of our sustainability by preventing silos of “tribal knowledge” and is integrated with the establishment of the University of MidwayUSA (5.1b(1)). • The transfer of relevant knowledge from and to CUSTOMERS, suppliers, PARTNERS, and COLLABORATORS? The transfer of relevant knowledge is accomplished to Customers: via catalogs, flyers, emails, eBlasts, internet, TV commercials, TV vignettes; from Customers: via Customer Satisfaction Survey, CKR Survey, Larry Line, CSRs, email and mail (Figure 3.2-1). The transfer of relevant knowledge is accomplished to vendors: via regular vendor meetings and vendor hunts, VPA, VRC; from vendors: via regular vendor meetings, vendor hunts, written communication. Our Vendor Relationship Management process requires that regular communication with vendors to achieve the vendor KR (VKR) “Candid, Two-way Communication.” An example of a process improvement that was implemented as a result of candid, two-way communication with vendors is our VRC. Through communication with our vendors, we realized an opportunity to improve the data and information provided to them. As a result, an AP to create a state of the art internet site to house data requested by our vendors was included in our 2009 SP. This AP helped us better achieve the VKR “Candid, Two-way Communication.” • The rapid identification, sharing, and implementation of best practices? BP are identified through multiple methods: using comparative data with results, industry trade shows, MQA/Baldrige participation, MMP implementation and networking. BP are shared through BCM innovation, knowledge sharing agenda items, cross-functional meetings and CIPs. BP are implemented through integration of CIPs into the SPPs. • The assembly and transfer of relevant knowledge for use in your strategic planning PROCESS? Assembly and transfer of knowledge is an integral part of our SPP. Through systematic communication with all levels of our Company regarding the SP and the SPP (during SOTB, DKS and DBM), 20 shares their latest information and BP and tour each others’ facilities to further the learning process. When appropriate, APs are developed and implemented. Figure 4.1-1 Improvement and Innovation Highlights Improvement or Innovation Description of Project Year MidwayUSA Branded Product Distribution Only Barcodes on Products Computer Generated Invoices Electronic Backorders First Midway branded product was offered (357 magnum brass) Retail store was closed and business model became mail order distribution only. Implemented barcodes for products for inventory and shipping. First computer generated invoices used for ordering. Implemented the ability to electronically process backorders. Founders create a fund-raising program gives 100% of the net proceeds to qualified local, state and national shooting and educational programs 1979 1984 1987 1987 1990 Source of Innovation VOC CEO VOC Benchmarking VOC 1992 Industry 1992 Industry 1993 1999 2001 2003 2005 2005 2006 2007 VOC VOC VOC VOC VOC Benchmarking VOC VOC, SP 2007 Cust Focus FNRA NRA Round-Up Pictures and Tech Notes Website w/Ordering Capability Midway Europe Master Catalog GunTec Price Change Application Powder and Primers Hunting Product Line Gunsmith Locator Founders create a fund-raising program that allows Customers to round-up their purchase total to donate to the NRA Endowment Fund Created the first product pictures and technical notes to better answer Customer questions Upgraded our website to allow for on-line ordering Created an international business model Created first Master Catalog to include the majority of our products Created GunTec Division to produce videos, vignettes and commercials Implemented a price change software application to complete price changes in mass Primers and powder added to our product offering; powder ships directly from vendor Expanded into the hunting product line Created a web-based application to manage all available gunsmiths in US with search capabilities GunTec Dictionary Created a web-based application to store shooting and gun-related terminology and definitions 2007 Cust Focus Scholastic Shooting Trust Website Founders create a website for the SST to provide the vehicle for people to donate to educational shooting programs for any College, University or secondary education institution. 2008 Industry First Shots Program Employees launch an internal program that certifies 12 employees as NRA instructors. These instructors hold classes open to all employees to teach safe firearms handling. 2008 Employee in our industry. We foster open communication through mentoring, structured carpools, posting business performance and survey results and our “open-door policy,” which means appointments are rarely needed, even with SLs and department managers. ES&E Survey results for communication in 2008 against the EKR of “Candid, Two-Way Communication” scored 78% against a goal of 75%. We foster high performance work and an engaged workforce through employee orientation, performance reviews which include employee development plans, RR categories for performance and innovation, MQA examiner participation and quarterly communication from SLs in SOTB and DKS. Systematic deployment of these methods encourages and emphasizes twoway communication which leads to employee development, engagement and high performance work. How do you ensure your organizational culture benefits from the diverse ideas, cultures, and thinking of your WORKFORCE? By creating opportunities for employees to be involved in and learn about the Company and the SPP, providing for two-way communication and maintaining a systematic approach to capturing ideas (CIP lists, 2.1b(2)), we ensure employees with diverse cultures and backgrounds have the opportunity to provide input. For example, the SOTB is used to deploy the SPP and initiate a call for innovation ideas. In 2009, as a result of our Lean Thinking initiative, we improved the concept of project teams by creating teams that incorporated not only key stakeholders, but also employees from outside the process to capitalize on diverse thinking and our highly educated workforce (See P.1a(2)). 5.1a(3) How does your WORKFORCE PERFORMANCE management system support HIGH-PERFORMANCE WORK and WORKFORCE ENGAGEMENT? By Category 5: 5.1a(1) How do you determine the KEY factors that affect WORKFORCE ENGAGEMENT? How do you determine the KEY factors that affect WORKFORCE satisfaction? Key factors that affect Employee Satisfaction & Engagement (ES&E) are determined annually by utilizing a list of motivation and hygiene factors, through an EKR survey. The survey utilizes a 10-point scale to weight each factor. For example, in 2009, employees chose their key factors from a master list, where as in previous years SLT created the list and determined priority via employee vote. The master list is created from a review of the MS, CoC, previous survey results, employee exit interviews, postorientation surveys, the employee complaint resolution process and standard industrial and organizational psychology factors. The prioritized EKR lists for each department are posted on the department SP bulletin board and are reviewed annually along with the ES&E Survey data during DKS meetings for each department (Figures 7.4-1, 1a). How are these factors determined for different WORKFORCE groups and SEGMENTS? EKRs are determined for different groups (department) and segments (demographic) by including segmentation questions in the annual EKR survey. These segmentation questions determine department (primary segmentation), pay category, pay status, tenure, gender, age group and education. Each question on the annual ES&E is aligned with an EKR and survey results are presented as an indicator of meeting each EKR. 5.1a(2) How do you foster an organizational culture that is characterized by open communication, HIGH PERFORMANCE WORK, and an engaged WORKFORCE? Organizational culture starts with hiring employees whose values align with our CVs and are engaged 21 providing employees with candid performance feedback aligned with our MS, CoC, CGs and SOs, we empower employees to improve their performance with coordinated guidance from ABC evaluations, performance reviews, individual development plans, annual 360 reviews, annual direct manager evaluations, use of our resource library, posted career maps, coaching and mentoring and the University of Midway. In 2007 and 2008, we improved our performance review process by moving from annual to monthly evaluations for hourly employees. This improvement which led to higher levels of ES&E and better performance against measures (Figure 7.4-1). How does your WORKFORCE PERFORMANCE management system consider WORKFORCE compensation, reward, recognition, and incentive practices? Compensation, RR and incentive practices receive input from our quarterly ABC Evaluation process, which allows us to identify high-performing and under-performing employees. Compensation increases are based on the ABC evaluation, process performance, quality and quantity of work, team attitude, job knowledge, the ability to work independently, adaptability and attendance. RR is awarded for innovation, safety, reliability, loyalty and performance. SLs recognize individual performance and innovation efforts and achievements at quarterly SOTB and DKS meetings. Incentive Practices include our Profit Sharing process, which is available to all employees and based on multiple factors including ABC ranking, position within Company and assignment to a KP, employment tenure, organizational knowledge (those areas that directly align with an SO) and ERG reliability rate. How does your WORKFORCE PERFORMANCE management system reinforce a CUSTOMER and business focus and achievement of your ACTION PLANS? By aligning our employee performance reviews, 360 reviews, ABC evaluations, development plans, career maps and process performance reviews with our MS, CoC, CGs and SOs, we ensure the Workforce Performance Management System (WPMS) maintains a focus on the Customer, aligning with our #1 CG “Customer Satisfaction.” We also include ERG Reliability Rate (Figure 7.6-3) in employee performance reviews and the profit sharing distribution model. Business focus is maintained through monthly performance reviews of performance to CGs, which are displayed in each department and on the intranet. 5.1b(1) How does your learning & development system address the following factors for your WORKFORCE and your leaders? • your organization’s CORE COMPETENCIES, STRATEGIC CHALLENGES, and accomplishment of its ACTION PLANS, both short-term and long-term? C&C assessments integrate with the SPP and identify needs to address through learning and development (L&D) APs and recruitment; these needs are referred to HR for incorporation into the Workforce Plan (3-year hiring, C&C and training plans). These plans integrate with the Company’s short-, midand long-term SOs and are deployed during DKS, SOTB and DBMs. For example, in 2004 we identified the need to develop Baldrige knowledge and began volunteering MQA examiners. We currently have 33 MQA examiners and 3 Baldrige examiners. Our L&D system focuses efforts to maintain or develop CCS (where an AP will be developed as part of the SPP), identified systematically as described in Figure 2.1-2 through coordination with our WPMS, capability assessments and training processes. • organizational PERFORMANCE improvement and INNOVATION By integrating the L&D process with our SPP, the Company identifies L&D opportunities to capitalize on strengths (including CCS) and address weaknesses to help achieve SOs. These opportunities are included in the department training plan which is part of the Workforce Plan. Mentoring includes sessions for high-performers (those identified through evaluation processes including ABCs) with sessions with the President to discuss knowledge related to the individual’s specific position and organizational performance. We include a call for innovation in Company meetings, including the DKS, DBM and BCM which allows all members of the workforce to discuss BP and innovation ideas. • ethics and ETHICAL business practices We review and discuss our CV and CoC in the new hire orientation and in meetings such as the DKS, DBM, BCM; SLT and BOD review quarterly LERC report, which allows for a review of ethics and ethical business practices. The CGs, CVs and CoC are posted in every department, conference room and the CoC is on employee badges. In 2008 we added the CoC to every employee’s badge to facilitate greater deployment of ethics to our workforce. • the breadth of development opportunities, including education, training, coaching, mentoring, and workrelated experiences, as appropriate Each department evaluates their C&C assessments to create annual training plans, part of the Workforce Plan. Through L&D tools like examiner participation, Lean Thinking projects (See 5.1a ) and SSGB and SSBB certifications we build L&D 22 opportunities into our day-to-day business, as emphasized in our CV “Organizational and Personal Learning” and our CG, “Modern Management Practices.” Our systematic mentoring process includes an annual schedule of SL mentoring (AOS). This time is scheduled during the MPC process. 5.1b(2) How does your LEARNING and development system address the following factors for your WORKFORCE? • their LEARNING and development needs, including those that are self-identified and those identified by supervisors and managers We identify L&D needs, as they relate to the workforce characteristics discussed in P.1a3, by integrating the WPMS with C&C planning, skills inventories for LO and CC, mentoring and performance evaluations, which allows supervisors and managers to address employeeidentified L&D needs through such mechanisms as the performance review development plans and Employee Performance Improvement Plans (EPIP). EPIPs are the result of a process improvement in 2007. These allow supervisors/managers to address specific L&D needs for employees. • the transfer of KNOWLEDGE from departing or retiring workers Knowledge from key employees is captured in process summaries and WI, the Baldrige Application Writing process, SOTB, DKS, DBM, succession planning, Company Journal and cross-training. Specific processes for departing employees include exit interviews, which allow employees to share knowledge on processes such as performance reviews, training and promotions. In 2008, during a process review, we identified an opportunity to improve our Exit Interview process. The process was not systematically capturing knowledge from departing employees. To resolve this, we created a standard set of questions specifically designed to capture knowledge in the form of opinions, insights, experiences and innovation ideas. • the reinforcement of new KNOWLEDGE and skills on the job Starting with our new hire orientation, which includes subject matter reviews and a Q&A session, we continue to utilize methods that test for comprehension and proficiency levels in skill applications to evaluate employee’s performance in the WPMS and reinforce proficiency attainment through our RR process. Performance reviews exist to assess both old and newly acquired skills, specifically addressing those processes under the employee’s control. Group practice of newly acquired knowledge and skills is also used, for example we conducted Baldrige application team writing exercises after implementing Baldrige criteria training. As part of ISO, we conduct process audits for training retention, require periodic demonstration of skills or knowledge to reinforce learning and post WI in appropriate locations. 5.1b(3) How do you evaluate the EFFECTIVENESS and efficiency of your LEARNING and development SYSTEMS? Macro-level evaluations include performance to CGs; evaluating the performance of measures included in section 7.1 to 7.6 and performance of specific processes including Promotions from Within (Figure 7.4.4), L&D $ per FTE (AOS), L&D Hours per FTE (AOS), ERG Reliability Rate (Figure 7.6-3), Performance to CG (Figure 7.5-1) and KP BSC (Figure 7.5-7). At the micro level, we monitor and measure individual performance through systematic performance reviews (See 5.1a(3)). We also review specific survey questions, such as “The organization does a good job in training me on Customer service skills” (scored 75%) and “I receive training and development” (scored 77%). 5.1b(4) How do you manage EFFECTIVE career progression for your entire WORKFORCE? Career progression is managed through the selection of employees, aligned with the CVs “Organizational and Personal Learning” and “Focus on the Future.” Identified employees from our ABC process and performance management system utilize career maps to create their personal development plans. These plans allow an employee to manage career progression and incorporate supervisor/manager input. Career progression measures allow us to ensure career progression expectations are met. Measures include: Promotions from Within (Figure 7.4-4), Cross-trained Employees (AOS) and ES&E survey results for the EKRs “Advancement Opportunity” and “Education, Training, and Development.” In the 2008 survey, “Advancement Opportunity” scored 79% and “Education, Training, and Development” scored 86%. How do you accomplish EFFECTIVE succession planning for management and LEADERSHIP positions? We begin with the recruitment of candidates who embody the CVs and live by our CoC. Then high-performing employees, identified through the ABC process, receive mentoring from SLs, receive developmental assignments (i.e., owner of APs), internal training on management processes (i.e., SPP, MMP training) and outside training for development (i.e., MQA Examiner). During quarterly WF meetings, identified highperforming employees are aligned with key positions to create our succession plan. The succession plan is reviewed and maintained during the quarterly WF meeting. The succession plan was recently called into action to determine a candidate for addition to the SLT to run the newly formed eCommerce department in June of 2009. The integration of succession planning process with the WPMS is also utilized for the hourly workforce with the recent promotion of an employee to LO supervisor and 9 others to Level III positions. 5.1c (1) How do you assess WORKFORCE ENGAGEMENT? Through our annual EKR survey and its alignment with our annual ES&E Survey (Figure 7.4-1), questions specifically designed to determine workforce engagement permit us to evaluate engagement by groups and segments. In addition to the employee survey, we review department performance measures, Employee Reliability Rate (Figure 7.4-11) and Voluntary Turnover (Figure 7.4-2) in the MRR and PDRR. In 2008, during a quarterly WF meeting the Employee Survey process was evaluated and determined that the results were not available for analysis and response in a timely manner. To improve the process, a 2009 AP was created to outsource the annual employee survey to a 3rd party administrator to permit a rapid resolution to engagement discrepancies, ultimately satisfying the CG “Employee Satisfaction.” What formal and informal assessment methods and MEASURES do you use to determine WORKFORCE ENGAGEMENT and WORKFORCE satisfaction? Formal methods include the employee survey, individual and department performance productivity measures, formally recognized employees, Voluntary Turnover (Figure 7.4-2) and 23 exit interviews. We also review other indicators such as average tenure, NRA membership (Figure 7.6-7), participation in Industry Involvement activities, employee complaints (Employee Complaint Resolution process) and review of CoC violations. Informal methods include: participation in Company events, contributions to CIP lists, participation in department and Company meetings (DKS, SOTB, etc.) and day-to-day interactions with employees. How do these methods and MEASURES differ across WORKFORCE groups and SEGMENTS? Methods for determining ES&E do not differ by workforce groups (department) and segments (demographic), however the results are segmented for analysis of differences between groups and segments based on the determined EKRs for each group (see 5.1a). How do you use other INDICATORS, such as WORKFORCE retention, absenteeism, grievances, safety, and PRODUCTIVITY to assess and improve WORKFORCE ENGAGEMENT? We review individual and department performance productivity measures through our MRR and MPM meetings. In the HR DBM we review safety measures (EMOD Rate (AOS), TCIR Rate (Figure 7.48), Lost Time Case Incident Rate (Figure 7.4-9), DART Rate (Figure 7.4-10)), Reliability Rate (Figure 7.4-11), formally recognized employees, employee turnover, Voluntary Turnover (Figure 7.4-2) to look for indicators of engagement loss and refer relevant findings to our SPP. 5.1c(2) How do you relate your WORKFORCE ENGAGEMENT assessment findings to KEY business RESULTS reported in Category 7 to identify opportunities for improvement in both WORKFORCE ENGAGEMENT and business RESULTS? ES&E survey scores against the CG, including ES&E, are reported in our MRR. The process during these MRRs allows for the determination of relationships of workforce engagement assessment findings to business results. Segmented data is used to systematically target underperforming workforce areas and processes (utilizing trend data and available correlation measures). We use SMEs, comparative data including best-practice benchmarks, training, C&C assessments, CIP lists, innovation and knowledge sharing within meetings, capitalizing on “open-door” communication and mentoring. 5.2a(1) How do you assess your WORKFORCE CAPABILITY & CAPACITY needs, including skills, competencies, and staffing levels? SLs assess the C&C of their departments by reviewing current and projected process performance, employee skill and education inventories, CGs, SOs, projected sales growth and department and Company SWOT analyses (2.2a(5)). Findings are integrated into the Workforce Plan (Figure 5.2-1) and detailed budgets, which include workforce needs, are prepared by each department for the short-term and top-level plans for the long-term. C&C assessments are reviewed in bi-weekly (non-exempt) and quarterly WF meetings, where action items for resource shortfalls, both short and long-term, become input for the SPP. This frequency permits rapid response to Customer demand changes. Our APs include determinations for resource requirements (C&C assessments) from key stakeholders impacted by the AP. Through cause-based analysis of underperforming 2007 process measures in LO (Figure 7.1-7), we determined a major cause was the lack of response time to hourly staffing needs. As a result we improved our recruiting and staffing process for the hourly staff and added weekly WF meetings; quick success in 2008 allowed the meetings to become a bi-weekly meeting in 2009. 5.2a(2) How do you recruit, hire, place, and retain new members of your WORKFORCE? The Workforce Plan, in alignment with the SP, drives recruiting priority based on the priority of CGs and SOs. We recruit through our recruitment process which anticipates the hiring needs through 3-year models, defines the jobs through preferred candidate profiles, develops applicant pools, assesses candidates, closes the deal with our preferred candidate and includes a review of the recruitment cycle for improvement opportunities. We hire by assessing candidates, through a multi-stage process that includes a 1st Stage – Resume or application submission, 2nd Stage – Questionnaire, 3rd Stage - Phone Screen and/or Testing, 4th Stage – Multiple On-site Interviews (with HR, peers and department head, as applicable), 5th Stage – On-site interview with the Career Development Team (CDT) for salaried positions where cultural fit and embodiment of the CV and CoC are ensured. We place new employees through our Onboarding and Orientation processes that allow for a systematic follow-up with the candidate prior to their first day of employment. Through a review of turnover of employees who had been with the Company less than 90 days, we identified a gap in the non-exempt orientation process. (Analysis of 2005-2006 results in Figure 7.4-2) The non-exempt orientation process has gone through several cycles of learning since 2007. In 2007, the half-day orientation session was determined to be inadequate in helping our new employees gain a strong foothold within the Company. Today, the orientation consists of three half-day sessions, which include a thorough review of the MVV and CoC. We retain new employees from the beginning of the recruitment process, by integrating their employment with our WPMS and L&D systems. A recent review of leading research on the performance of talent 24 acquisition processes has shown that our “Offer Acceptance Rate” of 97.0% against a goal of 92%, exceeds the bestpractice benchmark range of 87.6% to 95.6%. How do you ensure your WORKFORCE represents the diverse ideas, cultures, and thinking of your hiring and CUSTOMER community? Advertising and recruitment are primarily focused on our local geographic community and industry community. We maintain heavy involvement in the industry and use industry recruitment tools such as the NSSF for posting open positions. We also utilize our employee referral program to maintain a pool of industry-engaged applicants. Our local hiring community includes 2 colleges and 3 universities, creating a diverse and highly-educated applicant pool (Figure P.1-4). By using multiple recruitment tools and mechanisms, such as career fairs and local newspapers, within our hiring communities we ensure diversity of our applicants and recruits. 5.2a(3) How do you manage and organize your WORKFORCE to accomplish the work of your organization, capitalize on the organization’s CORE COMPETENCIES, reinforce a CUSTOMER and business focus, exceed PERFORMANCE expectations, address your STRATEGIC CHALLENGES and ACTION PLANS, and achieve the agility to address changing business needs? The workforce is managed through our ISOcertified management process, utilizing process summaries and WIs (Examples, AOS) for every process within the Company and process maps and measures to direct, organize and measure the accomplishment of work. Our MVV/CG/SO aligned CCS are maintained within our KPs and by incorporating these into our work processes and ISO management process, we deploy the strategies and WIs necessary to maintain a Customer and business focus. Our APs addressing SCs are managed directly through our SPP, which is organized by department to permit agility in addressing challenges and the completion of identified APs. The Company also utilizes processes and functions of employment such as ERG, changing of business hours and overtime, to maintain a buffer of time in responding to the changing business needs. Exceeding performance expectations begins with hiring employees that embody our MVV and CoC and is managed and organized through the WPMS, specifically the personal development sections of each review that assist the employee in taking his/her performance to the next level and direct integration with the RR process. 5.2a(4) How do you prepare your WORKFORCE for changing CAPABILITY and CAPACITY needs? We create individual development plans using employee and superior input as part of the employee performance review (Figure 5.1-1). These are integrated with the SPP by aligning them with department and CGs and SOs. Through crosstraining, developmental assignments (i.e. Lean Thinking), direct L&D plans (i.e. pursuit of Six Sigma) and change communication during SOTB meetings, we maintain the sustainability of the Company, reduce the waste of our resources and allow employees to refine their personal development plans to prepare for upcoming changes. How do you manage your WORKFORCE, its needs, and your needs to ensure continuity, to prevent WORKFORCE reductions, and to minimize the impact of WORKFORCE reductions, if they do become necessary? Continuity of needs is managed through the SPP, where short, intermediate and long-term needs are identified and integrated into the Workforce Plan where L&D needs are addressed. Additionally, cross-training processes have resulted in 100% of our employees possessing a defined level of cross-training, which provides a buffer to respond to changing needs. To minimize the impact of reductions, we cross-train, redirect resources to other areas of the business, promote from within (Figure 7.4-4) and communicate major changes that would make skills or jobs obsolete during the SOTB, DKS and mentoring sessions. To prevent workforce reductions, we review C&C in bi-weekly and quarterly Workforce Focus meetings to evaluate current needs and plan for future needs or reductions. Fortunately we have no experience in workforce reductions, but should we find a workforce reduction necessary, we would provide severance, counseling and outplacement services as necessary. 5.2b(1) How do you address workplace environmental factors to ensure and improve WORKFORCE health, safety, and security? By aligning our workforce climate processes to EKRs, integrating improvements through the SPP, monitoring results through our ES&E survey and process measures and seeking input through our CIP lists we address: Workforce Health by maintaining a climate-controlled facility, building inspections, preventative maintenance processes (through integration with maintenance) and worklife benefits such as legal services, financial counseling and mental health services. Workplace Safety is ensured through an OSHA and NFPA compliant safety plan and fostered through integration with our RR process, comprised of numerous workforce climate processes designed to ensure a safe environment for our employees, ultimately satisfying the EKR “Safe and Comfortable Work Environment.” In 2007, we created the train-the-trainer concept for monthly safety training, where the EH&S Specialist began using supervisors as educators for the workforce, reducing the trainer-to-student ratio, improving comprehension and retention and permitting changes to the schedule to bring pertinent safety training to our employees should an incident or near-miss occur. Workplace Security is ensured through education on policies, procedures and systems that address building security including, identification badges, anti-harassment and violence prevention policies, Visitor Check-in process and alarm systems. What are your PERFORMANCE MEASURES and improvement GOALS for each of these workforce needs? Each workforce need is evaluated in the ES&E survey. Workforce Health measures include water testing, HVAC testing, mold testing and hearing conservation testing (All, AOS). The Company monitors “Reliability Rate” as an indicator of workforce health (Figure 7.4-11), which has a maintenance goal of 97.4% for the next three years. Workplace Safety measures include TCIR Rate (Figure 7.48) which has an improvement goal of a half-point in the next three years, DART (Figure 7.4-10), Lost Time Case Incident Rate (Figure 7.4-9) which has an improvement goal of a tenth of a point in the next three years, EMOD rate, Safety Incident rate, Ergonomic Safety Incident Rate and the number of first aid/CPR/blood-borne pathogen trained employees (Remaining 25 measures AOS). Workplace Security is measured by the number of security violations (our goal is to maintain our zero incident record), threats, alarms, false alarms and employee reports of non-compliance (all reported on LERC, Figure 7.64). Improvement goals for 2010 include an AP for the pursuit of OSHA Voluntary Protection Program certification at “star” status. What are any significant differences in these factors and PERFORMANCE MEASURES or targets for different workplace environments? Through data segmentation by department we determined that the primary difference in these factors is ergonomic concerns between our LO and office environments. The office environment design considers ergonomics for prolonged use of computers and the warehouse has ergonomic consideration for weight of items being relocated or shipped. Environmental safety and ergonomic concerns are evaluated using Employee Work Habits and Office Ergonomic inspections. 5.2b(2) HOW do you support your WORKFORCE via policies, services, and benefits? HR maintains, implements and annually reviews for improvements policies, services and benefits (Figure 5.2-2), that are in alignment with our EKRs and are approved by SLT and the BOD to ensure alignment with the MS, CoC, CGs and compliance with federal and state law. We communicate policies, services and benefits, through scheduled meetings, the intranet and in detail during new employee orientation. While evaluating benefit satisfaction scores from the ES&E survey, we identified a performance gap in 2007 (Figure 7.4-12). Further analysis of employee feedback collected through DKS meetings and the ES&E survey, resulted in the creation of a 2009 AP to establish and deploy an educational tool, the “Supervisor Factomatic,” for supervisors and managers so that they may better answer employee questions on policies, services and benefits. continually meet key stakeholder requirements. Sources of innovation come from employees, CLPs, ISO corrective and preventive action, MQA feedback reports, department CIP lists and other stakeholder input. Innovation opportunities are identified during MPC meetings and referred to the SPP for implementation as a DAP, CAP or Lean Kaizen event. Each DAP or CAP uses our AP Charter template which uses the POSEC model (see glossary). The AP Charter’s Organize phase identifies key stakeholders and their requirements, which are used during process and work system design. HOW do you decide which PROCESSES within your overall WORK SYSTEMS will be internal to your organization (your KEY work PROCESSES) and which will use external resources? Processes are reviewed annually by SLT in the February SP meeting for outsourcing consideration. Prior to this meeting, each department conducts an analysis of the processes within their department using the standardized consideration criteria. For example, the criteria includes a review of whether or not the process is critical to operations, CGs or SOs. During this annual review, each department submits a recommendation of processes within their department to consider for outsourcing. These recommendations are reviewed in the February SP meeting. Processes that are approved for further consideration are referred to the department SPP. If the department decides to pursue the outsourcing of a process it is then added to the SP which is reviewed by SLT for approval. For example, KPs are defined as the processes that deliver CKRs. In 2009 SLT decided these processes will remain internal in order to maintain our SAs; however, SLT decided the catalog printing process would continue to be outsourced because adding the ability to run this process would take excessive resources. 6.1a(2) How do your WORK SYSTEMS and KEY WORK PROCESSES relate to and capitalize on your CORE COMPETENCIES? We define the processes that are central to fulfilling our Mission as our KPs; these are the processes that directly relate to delivering CKRs. Our CCS that align with our KPs are ME, MK, OT and LO. The aggregate of our process strategies within the KPs address CKRs and are difficult for our competitors to imitate. To capitalize on our CCS, we review the annual determination of our CCS and SAs and SCs in the SPP. We use this information to create APs within our SP that capitalize on our CCS and SAs to accomplish SOs and CGs. 6.1b(1) What are your organization’s KEY work PROCESSES? Our KPs are the processes that deliver CKRs: ME selects and purchases the products; MK communicates product information to Customers; OT handles Customer orders; LO packages and ships orders to Customers. How do these PROCESSES contribute to delivering CUSTOMER VALUE, profitability or financial return, organizational success, and SUSTAINABILITY? Customer value is delivered by meeting CKRs. Our KPs are designed to deliver CKRs. For example, the CKR “Competitive Pricing” is obtained through our Pricing Management process within ME and “Fast Delivery” is obtained through our Shipping process within LO. (Figure 6.1-1 for complete list). Our KPs contribute to delivering profitability, organizational success and sustainability by ensuring the requirements of the stakeholders are met and therefore CGs are achieved. For Figure 5.2-2 Workforce Support (Policies, Services and Benefits) (Complete listing AOS) 1. Medical Insurance (POS, PPO) / Dental Insurance 2. Life, AD&D and Long-Term Disability Insurance 3. Optional Insurances (List AOS) 4. Flexible Spending Accounts 5. Paid Vacation / Holidays / Bereavement Leave 6. Flextime Schedules 7. S125 Flexible Spending Program 8. Matching 401(k) Retirement Plan 9. Tuition Reimbursement (Measure, AOS) 10. Employee Purchase Program 11. Industry Involvement Leave 12. Discount NRA Membership 13. Profit Sharing HOW are these tailored to the needs of a diverse WORKFORCE and different WORKFORCE groups and SEGMENTS? We offer a comprehensive benefit and service package with different options available to employees based on need, cost and personal preference; allowing employees to tailor their benefits. Policies are tailored as revisions to the MVV, CoC and EKRs are determined. Category 6: 6.1a(1) HOW do you design and innovate your overall WORK SYSTEMS? Our work system is product distribution which consists of our KPs: ME, MK, OT, LO. We design our work system and the processes that comprise it using our SPP and PMP. We innovate our work system to 26 example, the Pricing Management process delivers product margins, a major component of profitability (SKR, “Financial Performance”) (Figure 6.1-1). ICP. Our ICP, AOS, allows us to interface our BCP with outside state and federal agencies to further ensure our level of preparedness and to capitalize on BP. The SPP and PMP are aligned and integrated and therefore ensure that KPs remain aligned with current stakeholder requirements. Monthly review of Performance to CGs and KP BSC monitors our performance against meeting the current stakeholder requirements and creates the process to address shortfalls, either current or projected. By continuing to operate our processes to deliver key stakeholder requirements and systematically monitoring the results, sustainability is achieved. Additionally, sustainability is built into all KPs through ISO and MMP implementation, including Baldrige and Lean. We improve KP effectiveness and efficiency by incorporating MMP, which contributes to profitability, success and sustainability. 6.1b(2) HOW do you determine KEY work PROCESS requirements, incorporating input from CUSTOMERS, suppliers, PARTNERS, and COLLABORATORS, as appropriate? What are the KEY requirements for these PROCESSES? Key work processes are those processes that deliver CKRs. The requirements for key work processes are determined in the QCF meeting by reviewing the CKRs as defined and prioritized by our Customers during the semiannual Customer requirements survey. These results are segmented by Customer group to identify any significant differences between the CKRs of each Customer group. After this information is reviewed, SLT determines and/or validates the processes and process requirements needed to deliver the CKRs in MPM meetings and the results are reviewed in MRR (2.1b(2)). The CKRs are listed in Figure P.1-7. The risk evaluation within the BCP prioritizes risks on a scale of probability and impact. A higher risk evaluation indicates a higher priority. For example, while a tornado’s probability of occurring in our area is lower than that of a thunderstorm, the impact of the tornado is much greater than that of a thunderstorm. This gives the tornado a higher risk evaluation than a thunderstorm overall. Our ICP addresses prevention and management through a systematic monthly inspection process of business operations and general facility preparedness, as well as numerous employment policies (as noted in the Business Impact Analysis (BIA) and ICP, AOS). Continuity of operations and recovery are addressed in detail in the ICP through identification of chain of command, key roles, emergency response checklists, individual business unit requirements, recovery strategies and various emergency specific instructions. See Figure 6.2-1, RTOs, which gives the goals for returning to operational status in each business activity. For example, we want to be 50% operational in critical business activities within KPs within 2 days and 100% within 120 days. 6.2a(1) HOW do you design and innovate your work PROCESSES to meet all the KEY requirements? New process design is accomplished through the SPP as an AP. Within the AP (using POSEC), the process requirements are defined and incorporated into the design of the process. Process measures are established in the Control section to identify the measures that will be monitored on a monthly basis in the department and Company PM meetings as applicable to ensure that the process continues to meet the requirements after implementation. Process innovation is also accomplished through the SPP as an AP with requirements and process measures being part of the AP. Processes are identified for innovation through many avenues including: process performance reviews in the MPM meetings, ISO corrective and preventive action reports, MQA feedback reports, department CIP lists and other stakeholder input; these process improvement ideas are then referred to the SPP. HOW do you incorporate new technology, organizational knowledge, and the potential need for agility into the design of these PROCESSES? In support of our Mission, to rely on cutting-edge technologies, each process design and improvement includes an analysis of the opportunities to take advantage of new technology. This occurs during the creation of the AP. For example, a process review of the Shipping process revealed an opportunity for improvement within the pulling area process where the accuracy measure showed 91%, this measures the number of orders pulled correctly in the pulling area process). During the subsequent process improvement project in the form of a CAP, the VP-LO researched several different technologies that could be implemented. After an analysis of each, the decision was made to implement hand-held scanner technology into the pulling process. As a result of this CAP, the pulling accuracy rate was greatly improved from 91% to 94.5%. This innovative process During a MPM meeting, SLT identified the need for a process improvement in determining CKRs. To improve the process, in 2009 We directly surveyed our Customers regarding their KRs and the priority of these requirements. Key findings from this survey include the specification of Competitive Pricing, Product Availability and Accurate, intact shipments as the top-tier priorities for CKRs. These findings were then referred to the MPM meeting for further research and determination of a potential change in process requirements. 6.1c HOW do you ensure WORK SYSTEM and workplace preparedness for disasters or emergencies? HOW does your disaster and emergency preparedness system consider prevention, management, continuity of operations, and recovery? We systematically maintain a situational-independent and comprehensive ICP, which is comprised of our Business Continuity Plan (BCP), Disaster Recovery Plan (DRP) and numerous emergency specific plans. The ICP is reviewed for improvements during the MPM meetings and annually during an ICP exercise. Workplace preparedness is ensured through multiple annual drills, annual risk identification and analysis exercises. Work system preparedness is ensured through integration of department level processes with individual department bi-annual Business Unit Plans, which allow departments to incorporate their critical business functions and requirements, including Recovery Time Objectives (RTOs) (Figure 6.2-1), into the 27 improvement has generated a savings of $60,000 over the past 12 months by reducing the rework on orders. PM meetings at both the department and Company level (5.1b(1)). For example, from our workforce, input is received through our Suggestion Program, employee involvement in PM meetings and CIP lists (5.1c), from our Customers through the Customer Satisfaction Survey and Larry Line and from our suppliers through our Vendor Satisfaction Survey and vendor meetings. To incorporate organizational knowledge into the design of processes and process improvements, we systematically identify stakeholders through a review of the processes involved or impacted by an AP. Stakeholders are then involved in the development of the AP requirements. Key stakeholders are involved to help identify blind spots and process integration requirements which helps ensure a smooth implementation of the AP. HOW do you incorporate CYCLE TIME, PRODUCTIVITY, cost control, and other efficiency and EFFECTIVENESS factors into the design of these PROCESSES? We incorporate cycle time, productivity, cost control and other efficiency and effectiveness factors into the design of processes through the implementation of Lean Thinking principles. Using Lean, we compare actual cycle time with the planned volume to determine the appropriate resource allocation to meet or exceed CKRs and other key stakeholder requirements. This ensures that we design maximum efficiency and productivity into the process at the planning phase, as well as allowing for agility in dealing with future needs. For example, in the 2009 Lean ShipQC AP, the project team wanted to validate the improvement projections resulting from proposed process changes to ensure the effectiveness of the new process. Utilization of Lean principles (Takt Time and Actual Cycle Time) were used to verify the improvement projections as well as improve our accuracy when planning staffing requirements, both for current conditions and in the future. This supported both the CKR “Fast Shipping” and the SKR “Financial Performance,” and provided agility in managing the process in consideration of potential changes in future business needs. 6.2b(1) HOW do you implement and manage your work PROCESSES to ensure that they meet design requirements? HOW does your subsequent day-to-day operation of these PROCESSES ensure that they meet KEY PROCESS requirements? We identify process requirements in the Plan phase of POSEC (AP Charter) and address them during the Organize and Execute phases. The Control function of POSEC establishes the process measures from process requirements which are monitored after implementation to ensure design requirements are met and sustained. Process summaries and WI are written on all processes (a milestone in the AP) to provide instruction and guidance on the day-to-day operation of processes. Systematic ISO audits help ensure that employees follow these WI in dayto-day operations and require action on processes not consistently meeting goal. Process measures are monitored on a monthly basis in the department and/or Company PM meetings to ensure processes are continuously being operated to deliver on the design requirements. HOW is WORKFORCE, CUSTOMER, supplier, PARTNER, and COLLABORATOR input used in managing these PROCESSES, as appropriate? We have multiple sources of workforce, Customer and supplier input that provide information to help manage and continuously improve our processes. This input is integrated into our SPP and PMP through a review of the input in the monthly SP and Customer and Vendor Satisfaction surveys collect information regarding our performance against their respective KRs. This input is reviewed in the MRR. If a goal on a requirement is not being met, it is analyzed further by evaluating the related process measures (Figure 7.2-1a Customer Satisfaction by KR). If further analysis is required, it is referred to the PM meeting where decisions are made on the action to be taken within the process. In addition, SLT reviews input from other sources in MPM meetings and QCF meetings and makes a call for knowledge sharing and innovation in each BCM in which members of SLT and invited guests can share this input on processes with other departments. In all cases, items requiring APs are referred to the SPP. The following is an example of Customer-input-driven process improvement: A regular component of our PM meeting is the discussion of the output from our VOC process. One of the topics discussed was the addition of American Express to our credit card processing process. Customer feedback indicated Customer dissatisfaction regarding the inability to use American Express as a form of payment. This information was referred to the Comparative Data and Competitive Analysis processes to verify our competitive position. It was confirmed that our Customers had indicated an opportunity for process improvement. We reviewed our existing credit card acceptance process and made some modifications to allow the addition of American Express as a payment method. Since this improvement in 2006, we have been able to serve 33,220 new Customers who made their first purchase with American Express. This change improved our OT process, relating to the CKR “Easy to do Business With.” What are your KEY PERFORMANCE MEASURES or INDICATORS and in-process MEASURES used for the control and improvement of your work PROCESSES? The key performance measures that are used for the control and improvement of work processes are the Performance to CG measure (Figure 7.5-1), the KP BSC (Figure 7.5-7) and department process BSCs (see example of the LO Process BSC in Figure 6.2-2.). Each department has a process BSC that has key and in-process measures established for area and section processes. Additionally, each department has measures established that are used for further process monitoring and improvement called department measures. For our KPs, we have a KP BSC that is a roll-up of the KP department scorecards and is used to manage and improve our KPs. Processes are designed to deliver CGs and therefore the review of the Performance to CG measure is also key to evaluating process performance. For example lack of favorable performance in the Returns process (Figure 6.2-2) triggered an AP to improve the process. The AP calls for a Lean Thinking project to improve the process performance. The AP used Lean principles to 28 eliminate non-value added steps and is on track to greatly improve process efficiency, and help us meet the CKR “Easy to Do Business With” by providing same day returns. 6.2b(2) HOW do you control the overall costs of your WORK PROCESSES? HOW do you prevent defects, service errors, and rework and minimize warranty costs or CUSTOMERS’ PRODUCTIVITY losses, as appropriate? How do you minimize the costs of inspections, tests, and PROCESS or PERFORMANCE audits, as appropriate? To control overall process cost, department process BSCs include either a performance to budget or cost per invoice measure to help manage expenses and efficiencies. As an example of our commitment to our CV “Organizational and Personal Learning,” we deployed Lean training to the entire Company in a series of three Lean training sessions in 2008. In 2009, we further integrated the Lean concepts into our PM process through four Lean training projects (part of the SP) which includes active participation from all SLs and select salaried employees. This implementation and continued use will help us continually reduce process cost and improve efficiency. To prevent defects, service errors, and rework, a high level of technology is built into applicable processes. In addition, we systematically conduct package quality checks in Shipping and maintain a process measure of the results. WIs are written to prevent defects, service errors and rework, and regular internal ISO audits are conducted to ensure that processes are being performed per the WI. Systematic, internal bin checks are conducted for inventory verification throughout the year to ensure the requirements of the external financial audit on the physical inventory are met. Inventory shrinkage is reported in the LERC (Figure 7.6-4). ISO CAR. After the root cause of the process performance deficiency is identified, the solutions are developed and implemented as either a DAP, CAP or a Lean Kaizen event depending on the complexity of the solution. When all processes are performing at 100% of the goal, the PMP has a systematic process review schedule based on the priority of the processes, as identified by the VP, where process goals and BP data are reviewed, and continuous improvement opportunities are identified (4.1c). Improvements are implemented as a DAP, CAP or Lean Kaizen event. As the SPP dictates different directions or needs, this information is referred to the MPM meetings to ensure alignment and integration of processes with the business needs and directions as dictated by SOs. In the MPM meetings the impact on process requirements is reviewed and needed process changes are referred back to the SPP for the creation of an AP. HOW do you incorporate the RESULTS of the organizational PERFORMANCE reviews discussed in response to Item 4.1 into the SYTEMATIC evaluation and improvement of your WORK PROCESSES? The key organizational performance measures identified in 4.1 are Performance to CGs, CS (survey results), ES&E (survey results), Vendor Satisfaction (survey results), Shareholder Satisfaction, MMP Results and Financial Results. These results are reviewed in the MRR and referrals for lack of performance are made to the MPM meeting. Identified improvements are implemented as a DAP, CAP or Lean Kaizen event. The KRs for CG are directly linked to section processes within our key and support processes. HOW are WORK PROCESS improvements and lessons learned shared with other organizational units and PROCESSES to drive organizational LEARNING and INNOVATION? We systematically maintain several mechanisms to deploy improvements and lessons learned throughout the Company. We maintain a Company Journal on the intranet that includes a historical record of major changes within the Company. In addition the following information is maintained on the intranet site and is available to all employees: the completed standardized after-action reviews on APs, all completed Company and department APs (salaried employees only), completed Lean Thinking projects, and department CIP lists which capture employee suggestions and other innovation ideas. In addition, each BCM has an agenda item for innovation and knowledge sharing during which each SL and invited guest has the opportunity to share improvements and lessons learned. For example, the VPME shared with the VP-LO a correlation analysis tool that was used within ME to assign suggested products for use during Customer orders. The VP-LO implemented this shared innovation idea within the Pulling process to locate products adjacent to each other when there was a high correlation of products being purchased together. This correlation analysis tool was used to move thousands of products which reduced the distance required to pull products for orders and therefore greatly increased pulling efficiency. This improvement had an impact on our ability to deliver the CKR “Fast Shipping.” For example, to prevent service errors on packages being shipped to Customers, we have three separate system checks to ensure the accuracy part of the “Accurate, intact shipments” CKR is met. The first system check occurs during the pulling process. Handheld technology was added to this process as a process improvement in 2008. The handheld technology serves as a system check to ensure the correct product is being pulled (Figures 7.1-7, 7.5-15). The second system check at ShipQC process (packaging of the products) verifies the right product and quantity were pulled for shipment. The third system check occurs at manifesting after the package is created where the manifesting scale verifies package weight against system expected weights and identifies packages outside set tolerances. To minimize the cost of process audits and to ensure the audits are focused where needed, the ISO internal audit schedule is reviewed annually and the schedule is tailored based on previous findings and past process performance, with consideration given to processes that have experienced significant changes. 6.2c HOW do you improve your work PROCESSES to achieve better PERFORMANCE, to reduce variability, to improve products and services, and to keep the PROCESSES current with business needs and directions? We systematically monitor process performance through our PMP to identify opportunities to improve performance (P.2c). When performance is below goal or unacceptable trends are reported in the MPM meeting, a process improvement team is identified to conduct a root cause analysis and document an 29 Figure 6.1-1 Ke y Proce sse s and Stake holde r Value Ke y Proce ss Are a Proce ss Me asure Fig # Value Ke y Re quire me nt Stake holde r 7.1-7 7.1-5 7.1-4 AOS 7.5-13 7.5-14 7.1-6 7.1-3 7.1-1 7.3-1 Customer Value Customer Value Customer Value Profitability Customer Value Customer Value Customer Value Customer Value Customer Value Sustainability Fast delivery (7) Accurate, intact shipments (3) Accurate, intact shipments (3) Financial Performance T imely, relevant, quality, market ing communicat ion (10) T imely, relevant, quality, market ing communicat ion (10) Product selection (6) Product availability (2) Competitive pricing (1) Financial Performance Customer Customer Customer Shareholder Customer Customer Customer Customer Customer Shareholder Logistics Shipping Market ing Publications Merchandising Product Selection Management Invent ory Management Pricing Management Product Selection Management Same day shipping Shipping accuracy Package quality T otal Cost per invoice Response rat e-Flyer Response rat e-M cat alog Number of new product s In-stock rat e Competitive pricing Gross Sales Growt h Order T aking Pricing Management Net Income Percent of Net Sales Invent ory Management Inventory turns Floor Operations Floor Operations Results Management Earnings Dist ribution T ime Service Fact or Abandoned Calls T ot al cost per call Business Activity 50% 65% 80% 2 Days 3 Days 5 Days 7 Days 7 Days 10 Days 14 Days 28 Days 14 Days 21 Days 30 Days 60 Days Critical 5 Days Very Important 10 Days Important 28 Days Other 60 Days 25 Days 45 Days 60 Days 120 Days 60 Days 90 Days 120 Days 180 Days 100% Key Processes Critical Very Important Important Other 7.3-3 Financial return Financial Performance Shareholder 7.3-5 Financial Performance Shareholder Financial Performance Easy to do business with (4) Easy to do business with (4) Financial Performance Shareholder Customer Customer Shareholder Profitability 7.3-4 Financial return 7.1-9 Customer Value AOS Customer Value AOS Profitability Area Process Section Process Measures Figure # 120 Days Stocking 120 Days 120 Days Repack 120 Days Receiving 270 Days 270 Days 270 Days Product Control 270 Days Shipping 2 Days 3 Days 5 Days 7 Days Support Processes - Non-IT Support Processes - IT Critical Very Important Important Other Cost per Invoice AOS Cost per Invoice AOS Cost per Invoice Receiving Same Day AOS 7.5-13 Shrinkage AOS Same Day Shipping Shipping Package Quality Shipping Accuracy Picking Lines per Hour Cost per Invoice 7.1-7 7.1-4 7.1-5 7.5-14 7.5-15 Warehouse Cost per Invoice Returns Cost per Return Same Day Returns Training & DevelopmenERG Reliability Conduct DKS to Schedule Results Management ` 30 2007 96.16% 2008 2009 YTD Actual Goal March/Q1 Actual Goal Confidential Confidential Confidential Confidential Confidential Confidential Confidential Confidential Confidential Confidential Confidential Confidential Cnofidential Confidential 98.55% 99.72% 95.00% 99.81% 95.00% $ 17,133.03 $ 6,878.34 88.90% 98.68% 96.37% 137 98.29% 99.63% 96.79% 138 97.9% 99.6% 97.1% 158 99% 99.50% 97% 137 98.7% 99.8% 97.3% 154 99% 99.50% 97% 137 Confidential Confidential Confidential Confidential Confidential Confidential AOS Confidential Confidential Confidential Confidential AOS AOS Confidential Confidential Confidential Confidential 53% 100% 65% 100% 7.6-3 AOS 100% 100% 92% 100% 100% 100% 92% 100% Confidential Confidential Confidential Confidential Confidential Confidential Confidential Confidential Confidential Confidential Direct Labor Cost per Invoice AOS Total Cost per Invoice AOS Promotions Sales $ and Margin Better $65 26.0% Promo Sales $ $55 25.5% $5 24.0% $45 25.0% $35 $25 24.5% $15 2007 2008 2009 2010 Sales $ Actual Margin % Actual 7.1a. What are your current LEVELS and TRENDS in KEY MEASURES or INDICATORS of product PERFORMANCE that are important to your CUSTOMERS? How do these RESULTS compare with the PERFORMANCE of your competitors and other organizations with similar product offerings? We measure product performance using our process measures related to CKR pertaining to our work system which is product distribution. We measure Customer-focused outcomes using Customer perception regarding CKRs, as displayed in 7.2. CKRs relate to our #1 CG CS. Promo Sales Margin % Category 7: We continuously seek comparative data on BP companies to assess our performance. During the SPP, comparative data is used for validation for setting KM goals and to aid in determining SAs and opportunities for innovation. Comparative data is selected by department heads (SLT members) from the following criteria (in priority order): 1) Benchmarks (BP), world-class, Baldrige winners; may be outside the industry, but could be competitors, 2) Competitors, 3) Industry, 4) External Comparative (similar organizations) 5) Internal. 2011 Sales $ Goal Margin % Goal 2 CKR Product Availability 7.1-3 In Stock Rate is the number of products available for sale divided by the total number of products and directly relates to the CKR “Product Availability” and our SA of Inventory management, including “Never out” product strategy. Since the 2008 Presidential election, our industry has had a significant increase in demand which exceeds industry capacity which caused our decreased In Stock Rate for 2009. This is not a process or Company issue. It is an industry-wide strategic challenge. Since this is an industry-wide phenomenon, our analysis has shown that it does not affect Customer satisfaction. Regardless, we have created APs to do what we can to mitigate this measure. These include: Seasonal Start/Stop Dates, Future Sales Multiplier Improvement, Overstock Inventory Management and Quantity Purchase Limit. Segmentation by Promotional Products AOS. 1 CKR Competitive Pricing 7.1-1 Competitive Pricing is measured by comparing the prices of the 15 most popular products to those products’ prices for the top competitor for each product category and to Competitor 1. Our measure shows that our prices are extremely competitive to our top overall competitor (Competitor 1) and the top competitor in each category. This measure directly relates to the CKR “Competitive Pricing,” which helps us meet our #1 CG “Customer Satisfaction.” In Stock Rate Reporting Category Better 100% Competitive Pricing Better Compared to Competitor 1 and Top Competitor for Each Product Category 100% 80% 60% 90% 40% 80% 20% 70% 0% 60% 50% 40% Goal 1st Q '08 4th Q '08 3rd Q '09 2nd Q '08 1st Q '09 4th Q '09 2003 2004 2005 2006 2007 2008 2009 3 CKR Accurate, Intact Shipments 3rd Q '08 2nd Q '09 Goal 7.1-4 Shipping Package Quality is measured by checking a sample of packages that have been prepared for shipping and directly relates to the CKR “Accurate, Intact Shipments.” Packages are checked for accuracy and quantity of product as well as the quality of packaging to ensure that they will arrive intact for the Customer, fulfilling this CKR. 7.1-2 Promo Sales $ and Margin directly relates to our SA strategy of “frequently promoting popular products” and our CKR “Competitive pricing.” Due to our unique business model which gives us a competitive advantage, comparisons are not applicable. We set the percent of sales to be derived from promotions at --% in order to maintain our gross margin goal, which helps us meet our SKR “Financial Performance” while balancing our CKR “Competitive pricing.” 31 5 CKR Fast Delivery Shipping Package Quality Better 100% 7.1-7 Same Day Shipping directly relates to the CKR “Fast Delivery” and is an efficiency measure of the shipping process. It measures the number of invoices taken before 6 p.m. each day and shipped the same day divided by the total number of those invoices taken by 6 p.m. that day. In 1999, we had a goal of invoices taken by 2 p.m. shipped the same day, and by August 2004 we had improved our processes enough to change our goal to in by 4 p.m. shipped the same day. Performance below goal in 2007 was due to lack of planning and integration in LO, with the major issue being lack of staffing on the hourly and supervisory levels. As a result, we improved our Workforce Planning process for the hourly and supervisory staff. As demonstrated in the graph, this staffing process delivered near-goal performance in 2008 and is projected to deliver goal performance going forward. Our packages generally carry a mixture of product types, and all of our packages are shipped with the same sense of urgency, therefore segmentation is not applicable. Our performance is BP. The comparisons on this graph are in by noon out the same day, and our performance is in by 6 p.m. out the same day. 98% 96% 94% 92% 90% 05 06 07 08 MidwayUSA Actual 09 YTD 10 11 MidwayUSA Goal 12 7.1-5 Shipping Accuracy measures the number of correct scans of product by the shipping employee divided by the total number of scans and directly relates to the CKR “Accurate, Intact Shipments.” We perform at or slightly below goal for the past five years. We used the average of the top 25 internal performers as our comparison to the overall measure. Shipping Accuracy Better 100% 98% Shipping Same Day Better 100% 96% 9:00 PM 98% 6:00 PM 96% 94% 92% 90% 94% 3:00 PM 92% 12:00 PM 90% 05 06 07 08 09 YTD 10 11 12 86% MidwayUSA Actual MidwayUSA Goal Midway USA Top 25 Performers - Best Practice 6:00 AM 02 04 7.1-6 Number of Products directly relates to our CKR “Product Selection” and to our SA of “Just about everything (long tail) strategy.” Our product offering has increased dramatically since 2002, allowing us to better fulfill this CKR which helps us achieve our #1 CG CS and gives us a competitive advantage. Included is a competitor comparison for Competitor 2. BP comparisons are not relevant because number of products is industry-specific. Segmentation by Customer group AOS. 08 10 12 6 CKR Easy to do Business With 7.1-8 Website Speed relates to our CKR “Easy to Do Business With.” In order to support this goal we must provide speedy order taking. Order taking speed is segmented by web and phone (Figure 7.1-9 shows segmentation by phone). Website speed is the time in seconds that it takes for the home page to load. Website speed is segmented by Homepage Load Time and Search Speed (AOS). Homepage Load Time is measured from four locations across the U.S. every hour of every day. We compare favorably to Best Practice 1, a BP company and Competitor 1. Number of Products Overall 140 Website Speed Homepage Load Time Better Number of Products 120 3 80 2 Seconds 100 60 40 20 1 0 2007 0 2008 2009 YTD MidwayUSA Actual MidwayUSA Lower Goal Competitor 1 2002 2003 2004 2005 2006 2007 2008 2009 2010 2011 MidwayUSA Actual Competitor 2 06 MidwayUSA Actual MidwayUSA Goal (99% by 6pm) Spaide, Kuipers & Co-Industry (99% by 12pm) 4 CKR Product Selection Better 9:00 AM 88% MidwayUSA Goal 32 2010 2011 2012 MidwayUSA Upper Goal Best Practices 1 7.1-9 Time Service Factor (TSF) Annual relates to our CKR “Easy to Do Business With.” Phone Time Service Factor (TSF) represents order taking speed segmented by phone and is the percentage of inbound calls to our CC that are answered within 20 seconds. Even with the tremendous sales growth in recent years, we achieved a TSF at or very slightly below goal for many years. This goal is in line with our BP comparison. Since the 2008 Presidential election, our industry has had a significant increase in demand which exceeds industry capacity which caused a decrease in our TSF for 2009. As can be seen in 7.1-9a,TSF is moving in the right direction despite an increase in business than projected due to change in political situation for our industry. Segmentation by Average Speed to Answer and Abandoned Rate AOS. divided by the total hours in the time period. We have APs to rewrite the web shopping cart and checkout applications beginning in 2009 to improve our uptime and have adjusted our goal to reflect those expected gains. Better 99% 97% 95% 2007 Time Service Factor Annual 90% Better 2008 2009 2010 2011 MidwayUSA Actual MidwayUSA Goal Gomez Top Performer - Best Practice 2012 7.1-11 Phone Uptime relates to our CKR “Easy to Do Business With.” The application for this database tracks unplanned downtime, which is aggregated monthly, then subtracted from 100% to determine uptime. Phone uptime relates favorably to BP. 80% 70% Web Uptime Better Phone Uptime 60% 02 03 04 05 06 07 08 09 10 11 MidwayUSA Actual MidwayUSA Goal Benchmark Portal Inc 80% in 18.3 seconds BP Better 100.0% 12 99.8% 7.1-9a Time Service Factor Weekly relates to our CKR “Easy to Do Business With.” The graph above is an annual graph. The graph below is a weekly graph displaying our current trend due to our revised staffing planning and multiple APs. Segmentation by Average Speed to Answer and Abandoned Rate AOS. 99.6% 99.4% 99.2% Time Service Factor Weekly 99.0% 90% 70% Better May-08 Sep-08 Phone Uptime Jan-09 Goal May-09 Sep-09 Baldrige Recipient - BP Better 7 CKR Friendly, Courteous, Respectful, Ethical Service 50% See Figures 7.2-1 Customer Satisfaction and 7.2-1a Customer Satisfaction by KR, requirement #4. 30% Week Week Week Week Week Week Week Week 14 15 16 17 18 19 20 21 8 CKR Knowledge See Figures 7.2-1 Customer Satisfaction and 7.2-1a Customer Satisfaction by KR, requirement #8. Mar Apr 4 - Apr 11 Apr 18 Apr 25 May 2 - May 9 - May 16 28- Apr Apr 10 - Apr - Apr - May 1 May 8 May 15 - May 3 17 24 22 9 CKR Timely, Communication MidwayUSA Actual MidwayUSA Goal Benchmark Portal Inc 80% in 18.3 seconds BP MidwayUSA Goal Relevant, Quality Marketing 7.1-12 Flyer Response Rate relates to the CKR “Timely, Relevant, Quality Marketing Communications.” We measure response rates for all of our MCs as an indicator of how well we are meeting this CKR, which helps us meet our #1 CG CS. Response rate is segmented by flyer, master catalog, gunsmithing catalog and promotional email communication (AOS). Retail flyer response rate displays the percentage of Customers who receive the flyer and place an order from the flyer. Our response rate is BP and continues to improve. Web and Phone Uptime The uptime of our KCMs is critical to meeting our CKR “Easy to Do Business With.” We segment uptime by phone and web. 7.1-10 Web Uptime relates to our CKR “Easy to Do Business With” and is the number of hours the website was available 33 Our 2009 SP has an SO to Improve Customer Satisfaction and Loyalty to continue to work toward BP performance levels. We are a four-time Platinum Award winner of the BizRate Circle of Excellence Award, one of only 81 internet retailers to receive the award in 2008 and one of only 25 to have received the award for at least four consecutive years. Segmentation by Customer group and market segment AOS. Flyer Response Rate Better 15% 10% 5% Better Customer Satisfaction Overall 96% 0% 2005 2006 2007 2008 2009 2010 2011 MidwayUSA Actual MidwayUSA Goal Multi Channel Merchant-Industry 94% 2012 92% 90% 88% 86% 7.1-13 Master Catalog Response Rate relates to the CKR “Timely, Relevant, Quality Marketing Communications” and is the number of Customers ordering after receiving our master catalog divided by the total number of catalogs sent. As with our flyer response rate, we measure master catalog response rate as an indicator of how well we meet this CKR. This helps us meet our #1 CG “Customer Satisfaction.” Better 84% 82% 80% 2007 2008 MidwayUSA Actual Best Practice 1 2009 YTD 2010 2011 2012 MidwayUSA Goal Industry 1 Master Catalog Response Rate 70% 7.2-1a Customer Satisfaction by Customer Key Requirement is segmentation of 7.2-1 showing high performance in all CKRs. Reference Figure P.1-6 for names of the CKRs. We perform well on all nine of the currently measured CKRs. CKR 10, “Industry Support” was identified as a blind spot as part of our Baldrige Alignment process and we have added a question to our CS survey to measure Customer perception of our performance on this CKR. 60% 50% 40% 30% 20% Segmentation by Customer group and market segment AOS. 10% 0% 2005 2006 2007 2008 2009 2010 2011 MidwayUSA Actual MidwayUSA Goal Multi Channel Merchant - Industry 2012 Better Customer Satisfaction by Key Requirement 100% 9 CKR Industry Support 80% See Figures 7.6-8 Contributions by Key Community, 7.6-9 Total NRA Round-Up Contributions, 7.6-10 % Orders with NRA Round-Up 60% 40% 20% 7.2a (1) What are your current LEVELS and TRENDS in KEY MEASURES or INDICATORS of CUSTOMER satisfaction and dissatisfaction? How do these RESULTS compare with the CUSTOMER satisfaction LEVELS of your competitors and other organizations providing similar products? In addition to the measures listed here, another indication of CS is our gross sales results 7.3-1 and 7.3-1a. 0% 2007 2009 YTD Best Practice 1 2009 YTD 2008 Goal (2) What are your current LEVELS and TRENDS in KEY MEASURES or INDICATORS of CUSTOMER relationship building and ENGAGEMENT? How do these RESULTS compare over the course of your CUSTOMER life cycle, as appropriate? 7.2-1 Customer Satisfaction is our #1 CG. It is a CKM and is critical to our organizational success as stated in P.2a(2). Overall satisfaction is rated on our CS survey. Because Competitor 1 is a consistent high performer with Shopzilla, we use them as a BP comparison. Our performance exceeds the industry comparison, Orvis and nearly meets BP. 7.2-2 Customer Retention is an indicator of loyalty, relationship building and engagement as it measures the 34 percentage of Customers who continue to buy from us each year. This measure is also an indicator of our ability to meet all CKRs. Our performance has been trending upward over the past several years, exceeding our goals. Even though we have good levels and trends of Customer Retention, our 2009 SP has an SO to improve Customer Satisfaction and Loyalty because CS is our #1 CG as supported by our CV “CustomerDriven Excellence.” Segmentation by Customer group and market segment AOS. year. As we become a larger company and capture more market share, we must adjust projected growth rate based on realistic market share. Growth rate is only shown for comparison reasons. Segmentation by Customer group, market segment and tenure (life cycle stage) AOS. Active Customers Overall Better 1,000 100% 500 % Customers Retained 99% Active Customers 0.5 250 Growth Rate 98% - 0 750 Customer Retention Overall Better 04 05 06 07 08 Active Customers Competitor 2 % MidwayUSA Growth Rate 97% 96% 7.2-5 Average Purchase There are several ways we track Customers’ buying habits. One of those is Average Purchase. Another segmentation of buying habits is Frequency of Purchase, AOS. Average Purchase is the average dollar amount of our Customers’ invoice. Average Purchase increased steadily from 2004 to 2008 as we have increased our product offering to meet our CKR “Product Selection,” which gives our Customers more choices resulting in larger purchases. Segmentation by Customer group and market segment AOS. 95% 2004 2005 2006 2007 2008 2009 2010 2011 2012 YTD Actual Goal 7.2-3 Customer Loyalty measures Customer responses to the CS survey question “Likelihood to Shop Again?” and is an indicator of loyalty, relationship building and engagement. This measure is also an indicator of our ability to meet all of our CKRs. Even though we have good levels and trends of Customer Loyalty, our 2009 SP has an SO to improve Customer Satisfaction and Loyalty because “Customer Satisfaction” is our #1 CG as supported by our CV of “Customer-Driven Excellence.” Segmentation by Customer group and market segment AOS. Better $140 Average Purchase $120 Average Purchase $ Better 09 10 11 12 Active Customers Goal Competitor 1 % MidwayUSA Growth Goal $100 $80 Customer Loyalty Overall $60 100% $40 $20 95% Loyalty % $0 04 90% 05 06 MidwayUSA Actual Competitor 1 07 08 09 10 11 12 YTD MidwayUSA Goal Competitor 2 85% 2007 Actual 2008 Goal 2009 YTD 2010 Industry 1 2011 2012 7.2-6 Product Return Rate is a measure of Customer dissatisfaction. Our #1 CG is “Customer Satisfaction,” and continued progress in maintaining and improving this goal is evident, as we have consistently outperformed the industry benchmark since 2004. Segmentation of this data began in 2006, and trends indicate continued improvement in every category. The projection is increasing slightly due to a change in our product mix, but the overall projection is significantly lower than the industry benchmark. Best Practice 1 7.2-4 Active Customers is the total number of distinct buying Customers in a 12 month period and is an indicator of loyalty, relationship building and engagement. The growth rate for active Customers is projected to continue to increase and performance significantly exceeds both industry comparisons. Our goals are set based on the SKR “Financial Performance” and on how much we project we can reasonably grow each Product return rate is the percentage of products sold which are then returned. Our very low return rate can be attributed in 35 part to the quality of products that we offer and to the quality of knowledge and product information that we provide both on the web and on the phone, which also relates to the CKR “Knowledge.” This MCM comparison is a BP reported in a BP article, not the MCM industry average reported on some of our other measures. Better 7.3-1a Gross Sales by Product Category is segmentation of 7.3-1 Gross Sales Dollars. We have grown sales dramatically in all markets including the newly entered hunting market. We are unable to obtain comparisons on individual product categories, which closely align to our Customer groups. Product Return Rate Gross Sales by Product Category Better 3.5% 90 3.0% 80 2.5% 70 Gross Sales $ 60 2.0% 50 1.5% 40 30 1.0% 20 0.5% 10 02 03 04 05 06 07 MidwayUSA Actual MultiChannel Marketing BP 08 09 10 11 12 0 2003 MidwayUSA Goal 2005 Shooting Gunsmithing 7.3(1) What are your current LEVELS and TRENDS in KEY MEASURES or INDICATORS of financial PERFORMANCE, including aggregate MEASURES of financial return, financial viability, or budgetary PERFORMANCE, as appropriate? 2006 2007 Ammunition Optics 2008 2009 2010 Reloading Hunting 7.3-2 Net Income % of Net Sales is a CKM and is directly related to our SKR “Financial Performance,” making it critical to organizational success as stated in P.2a(2). It grew dramatically since 2004, indicating that we are holding expenses in line with our sales growth. Percent of net sales for Competitor 1, the industry’s largest company, has remained flat over the same period. 7.3-1 Gross Sales Dollars is a CKM and is directly related to our SKR “Financial Performance,” making it critical to achieving Shareholder Satisfaction as stated in P.2a(2). Since our competitors vary in size, we compare the rate of growth. Gross sales are depicted by the bar graph and the numbers on the left axis. % of growth for gross sales is depicted with the line graph and the numbers on the right. After a stagnant sales cycle for over ten years, our growth rate surpassed the growth rate of our competitors. This coincides with our improved business model from a monthly catalog to an all-product inclusive annual Master Catalog with monthly promotional flyers, the creation of our process strategies, which give us our SAs and our aggressive implementation of MMP, including adopting the Baldrige Criteria as our business model (Figure 7.6-2). We project that sales growth will continue, and we set our sales goals based on SKRs. Segmentation by market segment, AOS. Better 300 2004 Net Income % of Net Sales Overall Better 13% Net Income % 10% 8% 5% 3% 0% 03 04 05 06 07 MidwayUSA Income Net Income 1– Competitor 1 Competitor 08 09 10 11 12 YTD MidwayUSA Income Goal Gross Sales Overall Gross Sales Growth % 7.3-3 Earnings Distribution is a CKM and is directly related to our SKR “Financial Performance,” making it critical to organizational success as stated in P.2a(2) and is critical to achieving Shareholder Satisfaction. It increased steadily from 2004 to current. The projections are based on what both the BOD and SLT feel is an attainable level of controlled growth that we can maintain long-term. Segmentation of this result is not applicable. 45% Gross Sales $ 250 35% 200 150 25% 100 15% 50 5% ‐5% 0 03 04 05 06 07 MidwayUSA $ MidwayUSA % Growth Competitor 1 08 09 YTD 10 11 12 Goal $ Goal % Growth 36 Better Earnings Distribution Better 100% % Return on Assets 20% 18% 16% 14% 12% 10% 8% 6% 4% 2% 0% Return on Assets Before Tax % of Net Sales 80% 60% 40% 20% 0% 2004 2005 2006 2007 2008 MidwayUSA Actual 2003 2004 2005 2006 2007 2008 2009 2010 2011 MidwayUSA Actual Goal Competitor 1 RMA Industry Benchmark Mail Order 09 2010 2011 2012 YTD MidwayUSA Goal Competitor 1 7.3-6 Revenue per FTE measures revenue per full-time equivalent (FTE) and contributes to the SKR “Financial Performance.” Higher values represent high performance and proper C&C management and potential financial viability. Our performance has steadily improved, reaching BP levels. 7.3-4 Inventory Turns is a CKM and is critical to our organizational success as stated in P.2a(2), directly relating to our SKR “Financial Performance,” which is critical to achieving Shareholder Satisfaction. We are the industry leader in inventory turns which is a great indicator of the performance of our Inventory Management process and supports our SA of Inventory management, including our “never out” product strategy. Furthermore it relates to our CKR “Product Availability.” We project to be at goal at the end of 2009 due in large part to the many APs we created in 2008 to improve this process. Segmentation by vendor, product category (which closely align with our Customer groups) AOS. Better Revenue per FTE Revenue $ per FTE 600 500 400 300 200 Better Inventory Turns 100 0 2005 2006 2007 2008 2009 2010 2011 2012 Total Company Revenue Per FTE Total Copany Revenue per FTE Goal Total Company Revenue Per FTE Benchamrk (Comparative) Total Company Revenue Per FTE Benchmark (Best Practice) (2) What are your current LEVELS and TRENDS in KEY MEASURES or INDICATORS of marketplace PERFORMANCE, including market share or position, market and market share growth, and new markets entered, as appropriate? 7.3-7 Competitive Environment & Market Share % relates to our SA of “privately held, profitable Company, with owners willing to reinvest for growth.” This measures the percentage of the market that the competitors and Midway represent. We show continued favorable trend in increased market share as compared to these competitors, indicating that our APs are succeeding in growing the business which is SKR “Financial Performance” and critical to achieving the CG “Shareholder Satisfaction.” Also see Figure p.2-1, Competitive Environment & Market Share. 2002 2003 2004 2005 2006 2007 2008 2009 2010 2011 2012 MidwayUSA Actual MidwayUSA Goal Competitor 1 7.3-5 Return on Assets continues to increase and outperforms Competitor 1 by a wide margin. This contributes to the SKR “Financial Performance.” Our ROA has increased dramatically since 2003 and we outperform industry benchmarks making us BP. Competitive Environment & Market Share 37 Confidential 7.4a(1) What are your current LEVELS and TRENDS in KEY MEASURES or INDICATORS of WORKFORCE ENGAGEMENT and WORKFORCE satisfaction? We measure ES&E using process measures related to EKRs (Figure P.1-6). These EKRs relate to our ES CG. Better 100% 90% 80% 70% 7.4-1 Employee Satisfaction & Engagement is our #2 CG, a CKM and is critical to our organizational success as stated in P.2a(2). The questions align with the EKRs. ES&E annual survey results have a positive trend since 2002. 2008 performance exceeds benchmark. Result for 2007 was below goal, cause-based analysis revealed supervisor-to-staff ratio and feedback on performance and development. These causes have been corrected through recruitment and process improvement APs in 2008. Segmentation by department (Fig. 7.4-1a), AOS by Baldrige category, pay category, pay status, tenure, gender, age group and education level. 60% 50% 40% 30% Merchandising Contact Center Marketing Logistics Goal Hewitt Benchmark (National Best Practice) Annual Employee Satisfaction & Engagement Survey Results 7.4-2 Voluntary Turnover is an indicator of employee engagement and represents the rate of employees who have voluntarily left our organization. Results have continued to improve at a greater rate than our headcount growth (represented on the right vertical axis) and continue to outperform national industry comparative data, which was selected as a leading national average from the Bureau of Labor & Statistics. Segmentation AOS by department 95% 85% 75% 65% Better 100% 55% Total Company Voluntary Turnover 1000 80% 45% 60% 500 40% Annual Survey Score 20% Goal 0% Hewitt Benchmark (National Best Practice) 0 2005 2006 2007 2008 2009 2010 2011 2012 Voluntary Turnover 12-Month Rolling (Segmentation) Department - Contact Center (Segmentation) Baldrige Category - Business Results Total Company Headcount Employee Satisfaction Score as a % Better Annual Employee Satisfaction & Engagement Survey Results Segmented by Department Voluntary Turnover 12-Month Rolling GOAL 7.4-1a Employee Satisfaction by Department provides segmentation of CKM 7.4-1 ES. We have used segmentation of ES&E survey results by department since 2000 (Support departments, AOS). Positive trends can be seen in each segmented category. As we grew, we added new departments (e.g., MK in 2008). Trend data for the MK department is available by looking at ME for previous years. Segmentation by Baldrige category, pay category, pay status, tenure, gender, age group and education level AOS. HR.com National Industry Benchmark (Comparative) (Segmentation) Exempt Voluntary Turnover 12-Month Rolling (Segmentation) Non-Exempt Voluntary Turnover 12-Month Rolling Total Number of Employees (2) What are your current LEVELS and TRENDS in KEY MEASURES or INDICATORS of WORKFORCE and leader development? We use process measures related to pertinent EKRs (Fig. P.1-6, #5 and #7) and SOs. 7.4-3 Direct Training Expense as a % of Payroll supports the EKR “Education, Training and Development” and “Advancement Opportunity” and the CV “Organizational and Personal Learning.” In addition, having a workforce of highperforming employees helps us accomplish our mission and aids in sustainability. It measures Company fulfillment of the direct training expenses 2.23% goal. 2008 benchmark dropped as a result of economic conditions. Segmentation AOS by department. 38 Better Direct Training Expenses as a % of Payroll Better 40% 3.5% 3.0% MQA and Baldrige Examiners Trained 30% 2.5% 20% 2.0% 1.5% 10% 1.0% 0% 0.5% 2005 2006 2007 2008 2009 2010 2011 2012 % Salaried Actual % Salaried Goal Midway % Total Employees Best Practices Baldrige Winner % Total Employees 0.0% Direct Expenses Actual Direct Expenses Goal Direct Expenses / ASTD "BEST" Benchmark (3) What are your current LEVELS and TRENDS in KEY MEASURES of WORKFORCE CAPABILITY and CAPACITY, including staffing LEVELS and appropriate skills? We use process measures related to pertinent CGs and SOs. 7.4-4 Promotions from Within supports our EKRs “Advancement Opportunity” and “Education, Training and Development.” It measures our performance in the development of employees. Our goal is to fill 75% of all open positions (not including entry-level) with internal candidates. 2005, 2007, and 2008 performance exceeded goal (2006 result due to large number of entry-level exempt openings in expanding departments), and the measure has a positive trend. Better 100% 7.4-6 Overtime Worked as a % of Total Hours is an indicator of the EKR “Continuously improving work systems” and the SKR “Financial Performance.” It measures C&C planning, as some overtime is beneficial while too much is an indicator of poor planning. Goal is maintained by performance within a band of 1% to 4%. Performance has been within the band and outperformed benchmark each year. Comparative data represents Bureau of Labor & Statistics national industry averages. Promotions from Within 80% 60% Better 14% 12% 10% 8% 6% 4% 2% 0% 40% 20% 0% 2005 2006 2007 2008 2009 2010 2011 2012 Total Company Promotions from Within Total Company Promotions from Within Goal SHRM National Benchmark (Best Practice) Exempt Employees Promotions from Within (YTD) Non Exempt Employees Promotions from Within (YTD) Overtime as a Percent of Total Hours Worked 2005 2006 2007 2008 2009 2010 2011 2012 Total Company Overtime Percent of Total Hours Worked Total Company Overtime Percent GOAL LOW-END 7.4-5 MQA/Baldrige Examiner Examiners Trained supports our MMP CG, EKR “Education, training and development” and our CV Organizational and Personal Learning. Overall, 35% of salaried employees are trained as MQA examiners or senior examiners, 3 are trained as Baldrige examiners and 1 is trained as an MQA Team Lead, Overseer and Judge (See Fig. P.1-3). It is in our long-term strategic plan to send the maximum allowed number of volunteers to MQA and Baldrige for employee development. Having a significant portion of our workforce trained as Baldrige/MQA examiners is critical to our deployment of Baldrige within the organization. It also helps us reach our MMP CG which is how we will attain our Vision “To be the best-run business in America.” Total Company Overtime Percent GOAL HIGH-END BLS National Industry Overtime % Benchmark (Comparative) 7.4-7 Labor Cost Revenue Percent is an indicator of CKR “Financial Performance” and measures costs of labor as compared to revenue stream. Lower values represent highperformance and proper C&C management. It is also an indicator of efficiencies gained through our use of MMP. Benchmark represents Saratoga Institute national BP while the comparative data represents Saratoga Institute industryaverage performance. Segmentation by department AOS. 39 injuries resulting in time away from work. In 2005 and 2008 we had zero lost time injuries. Trend has improved each year and continues to outperform both Missouri Department of Labor (state) and OSHA (national) benchmark comparisons. Segmentation AOS by department. Better Company Labor Cost Revenue Percent 35% 30% 25% Better 20% 15% Total Company Lost Time Injury Rate 2.0 10% 1.5 5% 0% 1.0 2005 2006 2007 2008 2009 2010 2011 2012 Total Company Labor Cost Revenue Percent Total Company Labor Cost Revenue Percent Goal Saratoga Institute Benchmark (Industry Standard) Saratoga Institute National Benchmark (Best Practice) 0.5 0.0 2005 See Figure 7.3-7 Revenue per FTE which measures revenue per full-time equivalent (FTE). Higher values represent highperformance, efficiency and proper C&C management. 2006 2007 2008 2009 2010 2011 2012 Total Company Lost Time Injury Rate Goal Total Company Lost Time Injury Rate OSHA Lost Time Injury Rate Benchmark Missouri DOL Lost Time Injury Rate Benchmark (4) What are your current LEVELS and TRENDS in KEY MEASURES or INDICATORS of your WORKFORCE climate, including WORKFORCE health, safety, and security and WORKFORCE services and benefits, as appropriate? 7.4-8 TCIR Rate (OSHA Recordable) is an indicator of performance on the EKR “Safe and Comfortable Work Environment” and measures the number of OSHA recordable injuries occurring in a given period * 200,000 / Total hours worked by all employees in the same period. This measures the success of our safety program by evaluating the overall frequency of injuries. Trend has improved each year and continues to outperform both Missouri Department of Labor (state) and OSHA (national) benchmark comparisons. Segmentation AOS by department. 7.4-10 DART Rate is an indicator of performance on the EKR “Safe and Comfortable Work Environment” and measures the number of injuries resulting in days away from work, assigned job restriction time and/or job transfer occurring in a given period * 200,000 / Total hours worked by all employees in the same period. It allows us to measure the severity of injuries and focus safety program initiatives on solving high-cost causes, if any. Trend has improved each year and continues to outperform both Missouri Department of Labor (state) and OSHA (national) benchmark comparisons. Segmentation AOS by department. Better Total Company DART Rate 5 4 Total Company TCIR Rate Better 6 3 5 2 4 1 3 0 2 2005 1 2006 2007 2008 2009 2010 2011 2007 2008 2009 2010 2011 2012 Total Company DART Rate Total Company DART Rate Goal OSHA DART Rate Benchmark Missouri DOL DART Rate Benchmark 0 2005 2006 2012 Total Company TCIR Rate Total Company TCIR Rate Goal OSHA TCIR Rate Benchmark Missouri DOL TCIR Rate Benchmark 7.4-11 Reliability Rate is an indicator of EE&S, our CG, and measures the presence rating for all employees. Our goal is 97.4%, which allows for 53 unscheduled hours of sick time and tardiness per year. We have consistently beaten benchmark since 2002. 2007 result was linked to 2007 ES&E survey, performance corrected through APs and process improvements on workforce communication and R&R. Segmentation AOS by department and pay type. 7.4-9 Lost Time Case Incident Rate is an indicator of performance on the EKR “Safe and Comfortable Work Environment” and measures the number of Lost Time Injuries occurring in a given period * 200,000 / Total hours worked by all employees in the same period. It allows us to measure the success of our safety program by evaluating the frequency of 40 Better Total Company Reliability Rate 98% 97% 96% 95% CS ES 2006 2008 Goal 2011 Comparison (see text) 94% Total Company Annual Reliability Rate Total Company Reliability Rate Goal SHRM National Benchmark (Best Practice) Benefits Satisfaction Score % Employee Benefits Satisfaction 80% 70% 60% 50% 40% 30% 20% 10% 0% 2005 2006 2007 2008 2009 2010 2011 2012 Benefits Satsisfaction Goal Kenexa Research Benchmark (Industry Standard) Kenexa Research Benchmark (Best Practice) VS SS 2007 2009 YTD 2010 2012 MMP 7.5-1a Performance to Company Goals is a sample of the presentation that is reviewed in the MRR. Results shown on page 42 depict our overall performance to CGs. The second figure shows an example of the detail reviewed in the MRR. For example, for the CG “Customer Satisfaction” the CS survey results (Figure 7.6-12) segmented by CKR. The next figure shows the detail segmented by CKR, showing the resutls of each CS Survey question, in addition to the associated process measures that deliver the CG “Customer Satisfaction.” CS Survey results by question listed on detail figure below. Process measures are un derlined and CKRs are in blue font. Process results are only color-coded when red in this presentation but are reviewed. 7.4-12 Employee Benefit Satisfaction is an indicator of performance on the EKR “Good salary and benefits” and measures the ES&E survey score determining the level of satisfaction with our services and benefits. Continuing a positive trend, performance exceeded goal in 2008. 2007 result was corrected with process improvements on workforce communication. Segmentation AOS by department, pay category, pay status, tenure, gender, age group and education level. Better Company Goals Performance Better 100% 95% 90% 85% 80% 75% 70% 65% 60% 7.5(1) What are your current LEVELS and TRENDS in KEY MEASURES or INDICATORS of the operational PERFORMANCE of your WORK SYSTEMS, including WORK SYSTEM and workplace preparedness for disasters or emergencies? 7.5-2 Vendor Satisfaction is a CKM (P.2a(2)) and an indicator of how we meet or exceed our VKRs to achieve our CG “Vendor Satisfaction.” We enjoy a very healthy and profitable relationship with our product vendors which aligns with our CV “Valuing Employees and Partners.” This helps us in creating a unique product offering catering to the specific requirements of our Customer groups. In addition, it is critical to maintaining our SA strategy “frequently promoting popular products” as strong relationships with our vendors help us acquire great deals on products. Our VS has consistently exceeded that of our closest competitors. The Company has taken the initiative to measure the questions addressing the vendor requirements. In the survey we requested that our vendors rate us in comparison to our competitors. We administer these surveys on a quarterly basis. The feedback is reviewed in the MRR and the findings are referred to the SPP as appropriate. As noted in 6.2b1, vendor satisfaction used to measure one VKR; through cycles of learning we now measure all VKRs. Better 100% 7.5-1 Performance to Company Goals is a CKM (P.2a(2)) because it displays performance for all of our CGs. We measure the operational performance of our work system with CG Performance, since all of our processes are designed to meet stakeholder KRs which allow us to achieve CGs. CS, ES and VS are survey results. SS and MMP are process results. The comparisons for CS, ES, VS are displayed on the graph. SS and MMP are unique to us, so comparative data is not available. Vendor Satisfaction 50% 0% 1st Q 2nd Q 3rd Q 4th Q 1st Q 2nd Q 3rd Q 4th Q '08 '08 '08 '08 '09 '09 '09 '09 MidwayUSA 41 Competitor 1 Competitor 4 Competitor 2 Goal Figure 7.5-1a Performance to CG (7.0 Results) Measure 2007 2008 7.1 Customer Satisfaction 91.1% 91.3% 7.2 Employee Satisfaction 71% 82% 7.3 Vendor Satisfaction 99.2% 100% 7.4 Shareholder Satisfaction * 98% 100% 7.5 Modern Management Practices * n/a 100% Results for 7.1, 7.2 and 7.3 are survey results * Results for 7.4 and 7.5 are process results and are presented as a % of goal 2009 Actual Goal 92.5% 91.7% Coming July 09 91.8% 95% 100% 100% 98% 100% March/Q1 Actual Goal 92.7% 90.8% Coming July 09 83.3% 95% 100% 100% 98% 100% 100% of goal 85-99.99% of goal Below 85% of goal March/Q1 Best Practice 1 Actual Goal 2009 YTD 93% 91% 89% 90.5% 94% 93% 92% 89.9% 91.5% 94% 100% 100% 89% 92% 90% 85% 91% 86% 94.1% 94.2% 94% 100% 100% 79% 82% 85% 90.7% 92% 89% 7.1 Customer Satisfaction 2009 Measure 2007 2008 Actual Goal 93% 92% Overall Customer Satisfaction 91% 91% Rollup 90% 90% 89% 90.5% 7.1.1 Friendly, Courteous, Respectful, Ethical Service 93% 93% 94% 94% 7.1.2 Easy to Do Business With 91% 91% 89.8% 91.2% 7.1.3 Timely, Relevant, Quality Marketing 97% 102% 100% 100% 7.1.4 Product Selection 91% 91% 90% 92% 7.1.5 Product Availability 92% 91% 86% 91% 7.1.6 Fast Delivery 94% 94% 94% 94% 7.1.7 Accurate, Intact Shipments * 99% 100.0% 100% 100% 7.1.8 Competitive Pricing 82% 81% 79.8% 82% 7.1.9 Knowledge 91% 91% 91% 92% * indicates process measure only; process performance is calculated as a % of goal; not included in rollup 7.1 Customer Satisfaction Detail 2007 2008 2009 March/Q1 Measure Actual Goal Actual Goal Rollup -Customer Satisfaction All Survey Questions 90% 90% 89.1% 90.5% 89.0% 90.5% Survey Question #2: Overall rating 91% 91% 93% 92% 93% 91% 7.1.1 Friendly, Courteous, Respectful, Ethical Service 93% 93% 94% 94% 94% 93% Survey Question #1: Would shop here again (Loyalty) 93% 93% 94% 94% 94% 93% 7.1.2 Easy to Do Business With 91% 91% 90% 91% 90% 92% Survey Question #3: Ease of finding what you are 88% 88% 85% 88% 85% 89% Survey Question #7: Overall look and design of site 88% 88% 87% 89% 87% 89% Survey Question #9: Variety of shipping options 90% 89% 89% 90% 88% 90% Survey Question #10: Charges stated clearly before 94% 94% 93.6% 94% 93.3% 94% order submission Survey Question #12: Order tracking 93% 93% 92.7% 93% 93% 93% Survey Question #15: Customer support 94% 93% 92% 93% 92% 94% Calls Answered Within TSF 77.31% 73.68% 54% 80.00% 58% 80.00% Call Abandon Rate 2.68% 2.71% 4.61% 2-3% 3.26% 2-3% Web Uptime 100% 100% 99% 100% 100% 100% Site Speed 2.64 2.19 1.99 1.50 1.99 1.50 Product Return Rate 1.20% 1.12% 1.05% 1.25% 1.28% 1.25% Confidential Confidential Confidential Total Retention 12- Month Rolling Buyers Confidential Confidential Confidential 7.1.3 Timely, Relevant, Quality Marketing Comm. 97% 102% 100% 100% 100% 100% Confidential Confidential Confidential Response Rate – Flyer Response Rate Master Catalog Confidential Confidential Confidential 7.1.4 Product Selection 91% 91% 90% 92% 89% 92% CS Survey Question #4:Selection of Products 91% 91% 90% 92% 89% 92% Confidential Confidential Confidential Number of New Products 7.1.5 Product Availability 92% 91% 86% 91% 85% 91% Survey Question #11: Availability of product wanted 92% 91% 86% 91% 85% 91% Confidential Confidential Confidential In Stock Rate 7.1.6 Fast Delivery 94% 94% 94% 94% 94% 94% CS Survey Question #13: On-time delivery 94% 94% 94% 94% 94.1% 94.2% Same Day Shipping 88.90% 98.29% 97.92% 99.00% 98.73% 99% 7.1.7 Accurate, Intact Shipments 99% 99.96% 100.1% 100% 100% 100% Shipping Package Quality 98.68% 99.63% 99.62% 99.50% 99.76% 99.5% Shipping Accuracy 96.37% 96.79% 97.15% 97.00% 97.29% 97% 7.1.8 Competitive Pricing 82% 81% 80% 82% 79% 82% Survey Question #6: Prices relative to other online 88% 87% 85% 88% 85% 88% Survey Question #8: Shipping charges 76% 76% 75% 76% 74% 76% Competitive Pricing n/a n/a 89% 90% 91% 90% 7.1.9 Knowledge 91% 91% 91% 92% 91% 92% Survey Question #5: Clarity of product information 89% 89% 89% 90% 89% 89% Survey Question #14: Product met expectations 94% 93% 92% 94% 92% 94% 42 Best Practice 1 2009 YTD 92% 94% 90% 86% 94% 85% 89% 7.5-3 Dun & Bradstreet PayDex Rating is a rating given by Dun & Bradstreet to indicate if a company is paying its suppliers and vendors on time. This measures our performance on VKR “Timely Payment” and is validated by our VS Survey, helping us meet our CG VS. It is also an indicator of our Vendor Management process. We significantly outperform the industry and BP comparisons provided by Dun & Bradstreet, with the BP calculated using the upper 25% quartile at 78%. 80% 60% 40% 20% Dun & Bradstreet PayDex Rating 76 74 MidwayUSA D&B - Industry D&B - BP 7.5-4 Baldrige Self Score is a CKM (P.2a(2)) and measures performance on the MMP CG. In order to measure our progress on using Baldrige as our business model, a group of internal MQA and/or Baldrige-trained examiners performs quarterly Baldrige self-scoring of our Company performance on categories 1 – 7. Our self score was within 10 points of our Missouri Quality Award score in 2008. Segmentation by category AOS. Q4 09 Q3 09 Q2 09 Q1 09 Q4 08 Q3 08 Q2 08 Q1 08 Q4 07 Q3 07 Q2 07 MQA Score MidwayUSA Actual Baldrige Recipient1 - BP Dec-09 Nov-09 Oct-09 Sep-09 Aug-09 Jul-09 Jun-09 7.5-7 MidwayUSA Key Process Balanced Scorecard (KP BSC), page 44, explains the work system’s performance. This scorecard represents the cumulative performance of all the KPs. Since our KPs deliver the stakeholder requirements, we have developed the process scorecard to be a leading indicator for our performance on stakeholder KRs. It is reviewed in the MPM meeting and we have refined it through many cycles of learning. Figure 6.2-2 displays LO Process BSC. Remaining department BSCs AOS. Following the November 2008 Presidential election, there was a tremendous surge in demand in our industry. This surge impacted several of our OT area process measures. Due to the economic recession we were uncertain on how long this increase would last. Therefore, SLT decided to reevaluate the situation weekly and in early January 2009, SLT decided this surge in demand would last throughout the year and additional staffing was authorized to support the increase. However, until the required staffing level was reached, it was a challenge for us to meet our OT area process goals. As evident in TSF by Week (Figure 7.1-9a), we are starting to see vast improvements in our ability to meet our process goals as a result of the staffing level increase. Performance below goal in the Returns area process was identified within the MRR and MPM meeting. A referral to the SPP was made to create a 2009 AP to conduct a Lean project on the returns process to improve efficiency. Performance below goal in the ME Promo Product Management process has triggered the creation of a 2010 AP to improve results. Baldrige Self Score Better 7 6 5 4 3 2 1 0 Audit Goal BTI % Milestones Ach -Industry 7.5-6 % Compliance with Emergency Training/Disaster Preparedness page 45, supports our EKR “Safe and comfortable work environment.” Performance continues to exceed most of our comparisons. Processes in the left-hand column represent those that satisfy the EKR "Safe and comfortable work environment" (Fig. P.1-7), and ultimately our CG of ESAT as measured through our annual ES&E survey. Benchmark performance comparisons are made against previous Baldrige recipients and our performance levels either match or exceed benchmark. In 2010 we will transfer First Aid Responder meetings to quarterly, so that we ensure our training levels match the size of our workforce. 72 Scoring Band Apr-09 % of Milestones Achieved % of CARs/PARs Current BTI CAR's Current - Industry 78 May-09 80 Mar-09 Dec-08 82 Feb-09 0% 84 Jan-09 Better ISO Milestone Measure Better 100% MidwayUSA Goal Baldrige Recipient2 - BP 7.5-5 ISO Milestone Measure directly relates to our MMP CG. While ISO is used to deploy a systematic approach for process and process measure management, we also analyze the effectiveness of ISO itself as an integral component of the PMP. This analysis consists of ensuring that milestones are met, i.e. audits performed on time and all corrective actions are current, rather than past due. We have been tracking this measure since our successful ISO 9001:2000 registration in October 2008. Segmentation by department AOS. 43 7.5-9 Website Percentage of Sales supports our CKRs “Easy to Do Business With” since we offer many features and services on our website and it is available 24/7. This measure also indicates our ability to meet our SKR “Financial Performance” since it is much more cost effective than taking orders via CC. It has increased steadily since 2003. We significantly outperform our competitive comparison data and meet our goal on this measure. We have an SO and APs to improve the website to drive more Customers to the web. Note: The Competitor 1 data compares their % of web sales to their direct sales (Internet and Catalog). Is it ok to show numbers on this? 2) What are your current LEVELS and TRENDS in KEY MEASURES or INDICATORS of the operational PERFORMANCE of your KEY WORK PROCESSES, including PRODUCTIVITY, CYCLE TIME, and other appropriate MEASURES of PROCESS EFFECTIVENESS, efficiency, and INNOVATION? Many of these measures are shown in other Results Items AOS. 7.5-8 Gross Margin % is a measure of the SKR “Financial Performance” and has increased steadily since 2004. It is trending closely to the industry benchmark, while Competitor 1’s margins are showing a decline. This steady improvement is due to our Competitive Pricing process (CKR “Competitive Pricing”) and development of a pricing model which provides simulations of future margins based on the upcoming year’s cost from our vendors. The pricing model was an AP initiative. Better 50% Better 80% Web Dollars as a % of Overall Sales 70% 60% Gross Margin % 50% 40% Gross Margin % 40% 30% 30% 20% 20% 2006 10% 2007 2008 2009 YTD MidwayUSA Actual Competitor 1 0% 03 04 05 06 07 08 09 10 MidwayUSA % YTD Goal % Industry Benchmark (RMA) % Competitor 1 % 11 2010 2011 2012 MidwayUSA Goal 12 See Figure 7.3-4 Inventory Turns measures effectiveness of the Inventory Management process within the LO process. Directly meets SKR “Financial Performance,” which is critical to achieving Shareholder Satisfaction. 7.5-7 MidwayUSA Key Process Balanced Scorecard (KP BSC) Key Process 2008 2009 YTD Area Process Measures Vendor Management Product Selection Management Pricing Management Merchandising 92% 90% Purchasing Management Promo Product Management Training & Development Results Management eCommerce Publications Customer Relationship Mgmt Marketing 97% 98.8% Advertising Public Relations Training & Development Results Management Floor Operations Order Entry Order Taking 96% 77% Training & Development Results Management Stocking Repack Receiving Shipping Logistics 97% 93.9% Warehouse Returns Training & Development Results Management Results displayed as a % of goal 44 2009 YTD 100% 99% 99% 91% 76% 99.7% 100.0% 91% 100% 100% 100% 100% 100% 100% 71% 60% 100% 97% 81.3% 100% 100% 99.8% 100% 71% 100% 99.3% March/Q1 98% 99% 99% 94% 77% 99.8% 100.0% 92% 100% 100% 100% 100% 100% 100% 79% 66% 100% 94% 100% 100% 95% 95% 100% 81% 100% 97% Figure 7.5-6 MidwayUSA Workplace Emergency Preparedness Activities (Light Blue lettering indicates a projection) Evacuation & Shelter-inPlace (SIP) Drills ICP and Incident Command Training Monthly Training Plan Review Table Top Exercise Site Visit & Certification Monthly Inspection Fire Extinguisher Annual Certification Sprinklers Site Visit & Training Mtgs. with Fire & EMS Internal First Aid/CPR/ AED Responders Mtgs. ERG Reliability Rate Internal & 3rd-Party Environmental & Safety Mgmt. Systems Audits Property and Business Risk Insurance Review ▲ = Better than ►◄ = On par With ▼ = Improvements Needed Compared to Baldrige Recipients ▲ 2002 2003 2004 2005 2006 2007 2008 2009 2010 2011 2012 Participants Evacuation & SIP Evacuation & SIP Evacuation & SIP Evacuation & SIP Evacuation & SIP Evacuation & SIP Evacuation & SIP Evacuation & SIP Evacuation & SIP Evacuation & SIP Evacuation & SIP All Employees Mar/Apr Mar/Apr Mar/Apr Mar/Apr Mar/Apr Mar/Apr Mar/Apr Mar/Apr Mar/Apr (1) SLT ►◄ Aug Aug Aug Aug (1) SLT ►◄ (2) EH&S ▲ X X X X X X X X Monthly Monthly Monthly X X 10/11/04 11/9/05 8/15/06 10/16/07 11/6/08 4th Qtr 4th Qtr 4th Qtr 4th Qtr Annual Annual Annually Annually Annually Annually 6 ►◄ Annually Annually Quarterly Quarterly Quarterly Weekly Weekly Weekly (3) 40+ employees All salaried employees ►◄ Weekly Annually Sch. June Weekly Monthly Quarterly Annually Annually Monthly Quarterly Annually Annually Monthly Quarterly Annually Annually Monthly Quarterly Annually Annually Monthly Quarterly Annually Annually (2) EH&S ▲ SLT, 3rd Parties ▲ Annual Annually Monthly Quarterly Annually Annually Annually Monthly Quarterly, Annually Annually Annual Annually Monthly, Quarterly, Annually Annually Annually Monthly Quarterly Annually Annually Annually Monthly Quarterly Annually Annually Monthly Quarterly Annually Annually (1) SLT - 100%, employees - as identified (2) EH&S Specialist, Local Authorities, Inspectors (3) At least 10% of Employee population trained at any time (4) Frequency of meetings for responders will be increased in 2010 through process management process, current frequency is proper for existing headcount. Percent of Strategic Plan Completed Goal Figure 7.6-1 Strategic Plan Execution Strategic Objectives and Action Plans Segmented by Strategic Objective 1. Grow the business 2. Improve website performance, Customer interface and overall value 3. Improve Customer satisfaction and loyalty 4. Improve efficiency in key areas 5. Improve availability of data and information 6. Improve quality in key areas # of APs 1 7 9 13 4 5 # Complete 1 1 3 3 0 1 45 Goal 1 1 3 3 0 1 21% 21% % Complete 100% 14% 33% 23% 0% 20% ▲ n/a 7.5-10 Website Conversion is an indicator of our combined performance on all CKRs through the web. It is the percentage of visits to our website which resulted in an eCommerce transaction. We perform to goal and significantly higher than our benchmark comparison. Because of the industry’s extremely high demand and limited supply of certain ammunition, gun parts and reloading components, our conversion rate has gone down post election because of an increased fear of restricted access in the future. We have more Customers coming to our site searching for products and our decreased in stock rate means that fewer of them are able to place orders. Many of these Customers are visiting multiple times to see if products have come back in stock. This is an industry-wide phenomenon, not a process issue. Better SEO. However, we have not had a full time person in this position since June 2008 and results are relatively stable. In May 2009, we were able to fill the position and will be expanding and improving this KM in 2010. Segmentation by product category AOS. ). Search Engine Optimization Better 60% 40% 20% 0% 2007 Website Conversion Rate 2008 2009 YTD 2010 MidwayUSA Actual Competitor 1 2011 2012 MidwayUSA Goal Competitor 4 See Figure 7.1-3 Time Service Factor 7.5-13 Cost per Call is a measure of the SKR “Financial Performance” and is the total cost per call for our CC. Cost per call is also an indicator of efficiency. It shows an overall positive trend for the past four years. Segmentation by direct and indirect labor AOS. 2007 2008 2009 YTD 2010 2011 MidwayUSA Actual MidwayUSA Goal Fireclicks - Industry Average 2012 7.5-11 eCommerce Cost per Order (CPO) contributes to the SKR “Financial Performance” and is an efficiency measure of our overall performance. It measures the cost for each order taken. We track CPO and segment source of order by web and phone. Website cost per order is the total cost of the eCommerce area divided by the number of eCommerce invoices. Cost is projected to increase as we grow the size of the department in order to increase the quality of website that we offer our Customers. Segmentation by phone orders AOS. Better Cost per Call Better 05 06 07 08 09 10 MidwayUSA Actual Benchmark Portal - BP 11 12 MidwayUSA Goal 7.5-14 Receiving Same Day related to our CKR “Fast Delivery” and is a measure of cycle time of the Receiving process. Performance has steadily increased since 2005. eCommerce Cost Per Order Receiving Same Day Better 100% 95% 90% 2006 2007 2008 2009 MidwayUSA Actual 85% 2010 2011 2012 MidwayUSA Goal 02 7.5-12 Search Engine Optimization is a measure of the CKR “Easy to Do Business With” because it measures how easy it is to find our products on the internet. It is also a measure of the effectiveness of our MK department. It measures the number of search keywords returned as the first or second retail result in a Google search divided by the total number of keywords. In 2007, we began focusing on implementing SEO techniques on our website which improved our performance in 03 04 05 MidwayUSA Actual 06 07 08 09 10 11 YTD MidwayUSA Goal 12 7.5-15 Picking Lines per Hour is a productivity measure for the Product Picking process. This contributes to our CKR “Fast Delivery.” A process improvement in May 2008 implemented wireless handhelds in the Picking process, allowing for the measurement of picking lines per hour and greatly increasing the efficiency and effectiveness of the process as noted in the measure. 46 our Baldrige recipient benchmark’s percentage of innovation ideas implemented. Picking Lines per Hour Better 170 Better 160 Number of Innovation Ideas 150 140 130 120 110 100 May-08 Jul-08 Sep-08 Nov-08 Jan-09 Mar-09 MidwayUSA Actual MidwayUSA Goal Industry Benchmark (Spaide, Kuipers & Co) $0.95 $0.85 $0.75 MidwayUSA Actual 05 06 07 08 09 YTD MidwayUSA Goal 25% 20% 300 15% 200 10% 100 5% 0% 0 Midway Support Process 7.6-1 SP Execution page 45, is a CKM (P.2a(2)) and an indicator of our ability to improve our processes to meet our stakeholder KRs. In addition, the vast number of APs we accomplish each year supports all of our CVs, especially “Focus on the Future” and “Managing for Innovation.” All of this helps us accomplish our mission and achieve our vision. An example of how we improved our process for tracking data and information occurred in early 2009 when we created a measure for tracking progress toward accomplishing our SP. In a 1st quarter MSP meeting, we identified a gap in determining our overall progress toward accomplishing our SP. Although we tracked milestones on specific APs we did not track overall progress on our SP throughout the year. Our innovative solution was to create a measure within the SP on the intranet that showed us real-time progress on our SP (% complete). We now know at any given time throughout the year our progress toward accomplishing our SP and use this information in all our SP meetings to monitor progress and redirect or allocate resources as necessary. This is a measure unique to our SP, so comparisons are not applicable. $1.05 04 400 7.6 a (1) What are your RESULTS for KEY MEASURES or INDICATORS of accomplishment of your organizational strategy and ACTION PLANS? $1.15 03 30% Ideas Implemented Baldrige Winner % Implemented Midway % Implemented Shipping Cost per Invoice 02 500 Midway Key Process 7.5-16 Shipping Cost per Invoice contributes to our SKR “Financial Performance” and is a measure of productivity and efficiency. Through our integration of MMP, a lean analysis and the AP to implement wireless handhelds on shipping area process helped us improve the total cost per invoice significantly. While we had good trend in performance for the years 2004-2006, performance below goal in 2007 and 2008 was due to our continuous efforts to increase staffing to improve our service levels. This increase in staffing had an adverse effect on the cost per invoice shipped. Through our integration of MMP, a lean analysis and the AP to implement wireless handhelds on shipping area process helped us improve the total cost per invoice significantly. The lean analysis helped our staffing process based on the throughput requirements. The AP to implement wireless handhelds improved the accuracy of the pulling process which prevented defective packages getting to Shipping stations. Better Overall Innovation 10 7.6-2 Quality Initiatives and Sales Dollars indicates performance on our CG MMP and our SKR “Financial Performance.” As indicated in our MS, one of our primary organizational strategies is to rely on high-performing employees and MMPs to accomplish our mission. This measure illustrates how our quality initiatives have helped us achieve our growth. It also indicates our commitment to our CVs “Visionary Leadership,” “Organizational and Personal Learning” and “Focus on the Future.” Quality initiatives are new for the year listed in the graph. 7.5-17 Overall Innovation directly relates to our EKR “Continuously Improving Work Systems,” among other stakeholder KRs. It is an indicator of our reliance on highperforming employees to help achieve our mission, which aligns with our CVs “Valuing Employees and Partners” and “Managing for Innovation.” We implement a significant number of CIP ideas to improve our work systems and exceed 47 Better Quality Initiatives and Sales Dollars 180 Sales Dollars 160 140 120 100 80 60 40 20 0 2002 No formal quality initiative 2003 No formal quality initiative Sales 2004 No formal quality initiative 2005 2 MQA Examiners 2007 1 MBNQA, 15 MQA Examiners Goal 7.6-3 ERG Reliability Rate supports our #1 CG “Customer Satisfaction” not only now but also in the future in case of emergency or unexpected peaks in call volume. ERG keeps employees trained and allows personal contact with Customers. This measure shows the percentage of scheduled ERG hours met segmented by department. Since this measure is unique to our Company, external comparisons are not applicable. Segmentation by department allows internal comparisons. Better 100% 2006 4 MQA Examiners 2008 ISO Certified, MQA Recipient, 1 MBNQA Examiner 17 MQA Examiners, 4 CSSGBs 2009 Launched Lean Thinking, Applied for MBNQA, 1 MBNQA, 18 MQA Examiners, 2 CSSGBs, 1 CSSBB Figure 7.6-4 LERC lines 1-36 are used as a communication tool to identify processes not meeting the identified standards for regulatory and legal compliance. Results show 99% compliance since 2006, with 4 non-compliance findings in 13 quarters, line #6 – employee terminated for threats against another employee; line #9 - new PCI Compliance standards announced October 2008 with actual documentation on the standards provided March 23, 2009, review showed we were not in compliance with the new standards and a 2009 AP is on the SP to address these issues; and line #31 – 2 employees terminated for product theft. ERG Reliability 90% (4) What are your RESULTS for KEY MEASURES or INDICATORS of ETHICAL BEHAVIOR and of STAKEHOLDER trust in the SENIOR LEADERS and GOVERNANCE of your organization? What are your RESULTS for KEY MEASURES or INDICATORS of breaches of ETHICAL BEHAVIOR? See Figure 7.6-4 LERC lines 6-7 identify Employee Violations of CoC and Formal Complaints against the Company. Results show 96.2% compliance since 2006, with one non-compliance finding in 13 quarters, the listed non-compliance item is for line #6 – employee terminated for threats against another employee. 80% 70% 60% 50% 40% 30% 2008 2009 2010 2011 2012 Goal 7.6-5 Vendor Ethics Satisfaction measures the response to Question #2 - The level of ethical behavior you experience. This supports our VKR “Friendly, courteous, respectful, ethical relationship.” This is based on vendor perception and varies each quarter since we are surveying different vendors each quarter (100% for the year). We have favorable performance against our competitors and goal. (2) What are your KEY current findings and TRENDS in KEY MEASURES or INDICATORS of GOVERNANCE and fiscal accountability, both internal and external, as appropriate? 7.6-4 Legal, Ethical and Regulatory Compliance (LERC) Report – shown on page 50. Lines 1224 are used as a communication tool to identify processes within the organization not meeting the identified standards for governance and fiscal accountability from our external financial services audits. This information is reviewed quarterly by the BOD and SLT. Results show 100% compliance since 2006, with zero non-compliance violations and findings, the listed incident reports (shown as “R”) convey information to be reviewed by SLT and BOD. Better 100% Vendor Ethics Satisfaction 0% (3) What are your RESULTS for KEY MEASURES or INDICATORS of regulatory and legal compliance? See MidwayUSA 48 Competitor 1 Competitor 4 Competitor 2 Goal and CKR “Support the NRA and 2nd Amendment” and “Industry Support.” Our key communities were identified in 1.2c(1). This measure depicts monetary donations only. We are an industry leader in our support of the NRA and shooting sports industry. See Figure 7.6-4 LERC line 31 for reporting on Inventory Shrinkage. The listed non-compliance items are two separate instances when employees were terminated for product theft. Inventory Shrinkage measure AOS. 7.6-6 Employee Ethics Satisfaction measures response to the questions: 1. The information I receive, from those to whom I report, is honest 2. The organizations SLs exhibit a high degree of ethical behavior (added in 2008). This supports the CKR “Friendly, courteous, respectful, ethical service.” Our performance has steadily improved since 2002 and we meet or exceed goals and comparisons. Average Satisfaction Score % Better Donations by Key Community Better 500 Donated $ 400 300 200 100 Employee Ethics Satisfaction 0 100% 2002 2003 2004 2005 NRA Local Community 80% 2006 2007 2008 2009 YTD Shooting Sports Industry Conservation Groups 60% 7.6-9 NRA Round-Up Contributions shows Customer support of our industry and the 2nd Amendment, supporting our purpose and the SKR and CKR “Support the NRA and 2nd Amendment” and “Industry Support.” We founded the NRA Round-Up program and continue to be the leader in collecting Customer donations to the program when compared to all other contributors combined. 40% 20% 0% The information I receive, from those to whom I report, is honest The Organization's Senior Leaders exhibit a high degree of ethical behavior (New for 2008) Ethics Goal $ Thousands Ethics Benchmark (Ethics Resource Center) (5) What are your RESULTS for KEY MEASURES or INDICATORS of your organization’s fulfillment of its societal responsibilities and your organization’s support of its KEY communities? See Figure 1.2-3 SLT Community and Industry Involvement for a partial listing of SL involvement in key communities including KCG sponsorships. Complete listing AOS. 400 300 200 100 0 2002 2003 Midway 2004 2005 2006 2007 2008 Comparison - All Other Contributors 7.6-10 % Orders Rounded Up is a CKM (P.2a(2)) and shows Customer support of our industry and the 2nd Amendment, supporting our purpose and the SKRs “Support the NRA and 2nd Amendment” and “Industry Support.” It depicts the percentage of web and phone orders on which Customers rounded up to contribute to the NRA. According to the NRA we are an industry leader in Round-Up contributions. However, since other companies keep this information confidential, we are unable to obtain comparisons for % orders with Round-Up. 7.6-7 NRA Membership by Department directly relates to our purpose and to the SKR and CKR “Support the NRA and the 2nd Amendment” and “Industry Support.” Over 55% of our employees are NRA members. 100% of SLT are NRA Life Members. In addition, the ME department, whose mission is to select and manage the product offering, employs 100% NRA members. This is a personal choice and is paid for by each employee. NRA Membership by Department Corporate Merchandising Marketing Contact Center Logistics Financial Services Human Resources Information Systems GunTec Quality Management Systems NRA Round-Up Contributions Better 500 % Orders with NRA Round-Up Better Population % 100% 100% 94% 48% 56% 64% 100% 92% 100% 80% 100% 80% 60% 40% 20% 0% 06 7.6-8 Donations by Key Community is a CKM (P.2a(2)) and is central to supporting our purpose and the SKR 07 08 MidwayUSA Phone 49 09 YTD 10 11 MidwayUSA Web 12 Figure 7.6-4 LERC Report Department (Reporting Authority) MERCHANDISING (VP-ME) 1. ATF Compliance (Incl. FFL) 2. State Regulatory Compliance 3. Commerce Department HUMAN RESOURCES (VP-HR) 4. Litigation 5. EEO-1 Report 6. Employee Violations of CoC 7. Formal Complaints against Co. 8. Conflicts of Interest INFORMATION SYSTEMS (VP-IS) 9. Credit Card Security 10. Web Security (VeriSign) 11. Software Licensing FINANCIAL SERVICES (VP-FS) 12. Financial Audit Reports Employee Benefit Plan 13. 14. Income Tax Returns 15. Payroll Tax Returns 16. Sales Tax Returns 17. Use Tax Returns Excise Tax (Reporting started 18. 19. Form 1099 Reporting Real Estate & Personal Property 20. Federal Firearms 21. 22 Loan Covenants 23. Insurance Coverage & 24. Product Litigation SAFETY & SECURITY (VP-HR) OSHA 25. 26. OSHA Violations 27. State Compliance 28. State Violations 29. HAZMAT 30. Security OPERATIONS (VP-LO) 31. Shrinkage >$10,000 32. Dept. of Natural Resources 33. DOT 34. Import 35. Export International Operations 36. R: Incident Report √: In compliance. N: Not in compliance # of Compliance Issues Total LERC Categories Compliance % Year Averages 2006 2007 2008 Q1 Q2 Q3 Q4 Q1 Q2 Q3 Q4 Q1 Q2 Q3 Q4 Q1 √ √ √ √ √ √ √ √ √ √ √ √ √ √ √ √ √ √ √ √ √ √ √ √ √ √ √ √ √ √ √ √ √ √ √ √ √ R(28) √ √ √ √ √ √ √ √ √ √ √ √ √ √ √ √ √ √ √ √ √ √ √ √ √ √ √ √ √ √ √ √ √ √ √ √ √ √ √ √ √ √ √ √ √ √ √ √ √ √ √R(15) √ √ √ √ √R(15*) √ √R(21) √ N R(23) √R(15*) √ √R(21) √ √ √R(15,26) √ N/A N/A √ N/A √ √ √ √ √ √ √ √ √ √ √ √ √ √ √ √ √ √ R (8) √ √ √ √ √ √ √ √ √ √ √ √ √ √ N (25) √ √ √ √ √ √ √ √ √ √ √ √ √ √ √ √ √ √ √ √ √ √ √ √ √ √ √ √ √ √ √ √ √ √ √ √ √ √ √ √ √ √ √ √ √ √ √ √ √ √ √ √ √ √ √ √ √ √ √ √ √ √ √ √ √ √ √ √ R(1) √ √ √ √ √ √ R(2) √ √ √ √ √ √ R(2) √ √ √ √ √ √ R(2) √ √ √ √ √ √ √ √ √ √ √ √ R(4) √ √ √ √ √ √ R(4) √ √ √ √ √ √ R(9) √ √ √ √ √ √ R(9) √ √ √ √ √ √ R(9) √ √ √ √ √ √ N/A √ √ √ √ √ √ R(9) √ √ √ √ √ √ √ √ √ √ √R(22) √ √R(9) √ √ √ √ √ √ √ √ √ √ √ √ √R(9) √ √ √ √ √ √ √ √ √ √ √ √ √ √ √ √ √ √ √ √ √ √ √ √ √ √ √ √ √ √ √ √ √ √ √ √ √ √ √ √ √ √ √ √ √ √ √ √ √ √ √ √ √ √ √ √ √ √ √ √ R(16) √ √ √ √ √ √ R(19) √ √ √ √ √ √ √ √ √ √ √ √ √ √ √ √ √ √ √ √ √ √ √ √ √ √ √ √ √ R(3) √ √ √ √ √ √ √ √ √ R(5) √ √ √(R6) √(R6) √ R(7) √ √ √ √ √ √ √ √ √ √ √ √ √ √ √ R(17) √ √ √ √ N R(20) √ √ √ √ √ N R(24) √ √ √ √ √ √ R(27) √ √ √ √ √ 0 34 100% 0 34 100% 0 34 100% 0 34 100% 100% 0 34 100% 0 34 100% 0 34 100% 0 34 100% 100% 0 34 100% 0 34 100% 1 36 97% 2 36 94% 98% 1 36 97% 50 2009 Q2 0 0 Q3 Q4 0 0 0 0 99%

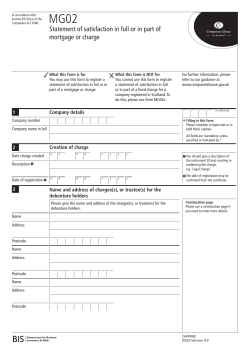
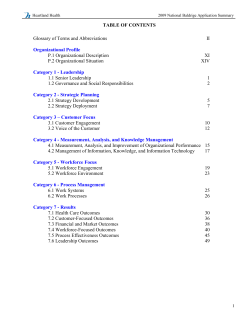


© Copyright 2026