
physiological characterization on seed aging of six native shrub
PHYSIOLOGICAL CHARACTERIZATION ON SEED AGING OF SIX NATIVE SHRUB SPECIES A Thesis Submitted to the College of Graduate Studies and Research in Partial Fulfillment of the Requirements for the Degree of Master of Science in the Department of Plant Sciences University of Saskatchewan Saskatoon By Yimeng Wang © Copyright Yimeng Wang, March 2015. All rights reserved PERMISSION TO USE In presenting this thesis in partial fulfillment of the requirements for a Postgraduate degree from the University of Saskatchewan, I agree that the Libraries of this University may make it freely available for inspection. I further agree that permission for copying of this thesis in any manner, in whole or in part, for scholarly purposes may be granted by the professor or professors who supervised my thesis work or, in their absence, by the Head of the Department or the Dean of the College in which my thesis work was done. It is understood that any copying, publication, or use of this thesis or parts thereof for financial gain shall not be allowed without my written permission. It is also understood that due recognition shall be given to me and to the University of Saskatchewan in any scholarly use which may be made of any material in my thesis. Requests for permission to copy or to make other use of material in this thesis in whole or part should be addressed to: Head of the Department of Plant Sciences University of Saskatchewan 51 Campus Drive Saskatoon, Saskatchewan S7N 5A8 i ABSTRACT Vegetation reclamation in oil-sands requires a consistent and adequate supply of seeds of native shrubs. However, annual seed production is erratic and seeds are usually short lived and insufficient for the reclamation projects. Seeds of six native shrub species including: Prunus virginiana, Prunus pensylvanica, Arctostaphylos uva-ursi, Shepherdia canadensis, Cornus sericea, and Viburnum edule were used to analyze physiological changes during storage and artificial aging processes. The shrub seeds were studied for one year during storage under eight different combinations of temperature (-20, 4, 22.5 °C), atmosphere (Air / N2) and relative humidity (RH; 7-8 % / 3-4 %). No significant differences were detected among the storage parameters after one year; however, sub-zero and N2 environments showed a potential in maintaining a higher seed vigour during storage. In the artificial aging experiment, seeds were subjected to 45 oC, 60 % RH for 5-25 d. For most shrub species, the seed viability decreased significantly after 10-15 d artificial aging and was down to 0 % after 20 d. The germination percentage declined already after 5 d; therefore, there was a delay in detecting viability loss using the tetrazolium test. Non-aged seeds and aged seeds of most collections showed significantly different seedling lengths, which indicated a negative effect of accelerated aging process on the seedling growth. The electrolyte conductivity, as well as seed dehydrin protein expression, is strongly correlated with the seed vigour, which can be used as seed quality assessment methods in seed longevity predicting. A loss of membrane integrity occurred during the accelerated seed aging processes, as indicated by an increased electrolyte conductivity that was negatively correlated with the seed viability and germination. During artificial aging process, heat stress of Prunus virginiana induced expression of dehydrins with a molecular mass of 27 kDa, which reached a detectable level after 5 d. ii The storage protocol developed in this study would benefit the adequate supply of viable shrub seeds for reclamation. With species-specific parameters taken into consideration, the artificial aging technique to predict seed longevity can be further expanded to other non-crop species used in reclamation of lands after oil extraction. iii ACKNOWLEDGEMENTS I would like to take this opportunity to thank the people who have supported me during my Master’s studies. First of all, I would like to express my gratitude to my supervisors, Dr. Yuguang Bai and Dr. Ravindra N. Chibbar for their persistent encouragement and invaluable advice throughout my graduate study. I am sincerely thankful to Drs. Bruce Coulman, Monica Båga, Karen Tanino and Pierre J. Hucl for their valuable time and constructive inputs as advisory committee members. I extend my special thanks to Dr. J. Hugo Cota-Sánchez from Department of Biology for acting as the external examiner for my M.Sc. thesis. The thesis will never be possible without them. I want to give my thanks to Drs. Sarita Jaiswal and Yongsheng Wei for their effective tutoring and suggestions on my experiments and facility management. I also like to express my appreciations to fellow graduate students and technicians, Jin Li, Yusuf Abu, Lei Ren, Ke Feng, Geetika Ahuja, and many others for their invaluable suggestions and assistance in my lab works. Special thanks goes to my lifetime friends Gang Li, Jinglan Zhang, and Shuang Wang for their company and constant support throughout the graduate study. I would like to thank all the wonderful fellow graduate students, faculty members and office members of Department of Plant Sciences. I am grateful for the financial support provided by the Canadian Oil-sands Network for Research and Development, and Natural Sciences and Engineering Research Council of Canada. Finally I would like to express my deepest thanks to my parents for their endless love, continuous support, and encouragement throughout my life. iv TABLE OF CONTENTS PERMISSION TO USE ....................................................................................................... I ABSTRACT ........................................................................................................................ II ACKNOWLEDGEMENTS .............................................................................................. IV TABLE OF CONTENTS ................................................................................................. VII LIST OF TABLES ............................................................................................................ IX LIST OF FIGURES .......................................................................................................... XI LIST OF ABBREVIATIONS ........................................................................................ XIII 1 INTRODUCTION ........................................................................................................ 1 2 LITERATURE REVIEW ............................................................................................. 4 2.1 Importance of shrubs in oil sand reclamation ........................................................ 4 Alberta oil-sands mining and the disturbance of boreal forest ecosystem...... 4 Conservation and reclamation of boreal forest ............................................... 4 Shrubs as a key component of boreal forest ................................................... 4 Challenges in shrub reclamation ..................................................................... 5 Ecology of native shrub species ...................................................................... 5 2.2 Storage conditions affecting seed longevity ........................................................ 10 Effects of temperature on seed longevity...................................................... 10 Effects of seed moisture levels and humidity on seed longevity .................. 10 Effects of storage atmosphere on seed longevity.......................................... 11 2.3 Changes of seed viability and vigour during the aging process ........................... 11 Seed dormancy .............................................................................................. 14 Seed membrane integrity .............................................................................. 17 Protein expression ......................................................................................... 17 2.4 Detecting seed aging ............................................................................................ 18 Seed vigour measurements ........................................................................... 18 Electrolyte conductivity test ......................................................................... 20 Methods of seed protein analysis .................................................................. 21 Artificial aging tests ...................................................................................... 25 3 MATERIALS AND METHODS ................................................................................ 27 3.1 Plant materials ...................................................................................................... 27 3.2 Methods................................................................................................................ 29 Initial seed quality assessments .................................................................... 29 Seed storage conditions ................................................................................ 30 Artificial aging .............................................................................................. 31 v Biochemical and molecular changes during seed storage............................. 33 Data analysis ................................................................................................. 37 4 RESULTS ................................................................................................................... 39 4.1 Effect of seed storage conditions on seed physiological properties .................... 39 Storage of chokecherry seeds ....................................................................... 39 Storage of pin cherry seeds ........................................................................... 43 Analysis of seed protein profiles after one-year storage treatments ............. 47 4.2 Accelerated seed aging ........................................................................................ 49 Seed viability and germination changes during accelerated seed aging ....... 49 Electrolyte conductivity changes during accelerated seed aging .................. 63 Effects of accelerated seed aging on seed properties .................................... 70 Seed protein changes during accelerated seed aging .................................... 84 5 DISCUSSION ............................................................................................................. 86 5.1 Seed properties as affected by one year storage under various temperature/ RH/ gas conditions................................................................................................................ 86 5.2 Seed viability and germination as affected by artificial aging process ................ 87 5.3 Seed electrolyte conductivity as affected by aging process ................................. 88 5.4 Rate of aging between species ............................................................................. 89 5.5 Seed protein changes as affected by aging process ............................................. 89 5.6 Discussion on methods ........................................................................................ 90 5.7 Conclusions and practical implications ............................................................... 92 6 REFERENCES ........................................................................................................... 94 7 APPENDIX ............................................................................................................... 104 vi LIST OF TABLES Table 3-1 Shrub seed lots collected from central mixed-wood region of northeastern Alberta from 2009 to 2012 used in the study. ........................................................... 28 Table 3-2 Seed germination conditions. ........................................................................... 28 Table 4-1 Effects of one-year storage treatments on seed vigour and viability in CHK 1410. Data are Means ± SE. Means with the same letters within a collection and parameter are not significantly different at P≤0.05. ................................................. 41 Table 4-2 Effects of one-year storage treatments on seed vigour and viability in CHK 6259. Data are Means ± SE. Means with the same letters within a collection and parameter are not significantly different at P≤0.05. ................................................. 42 Table 4-3 Effects of one-year storage treatments on seed vigour and viability in PIN 1298. Data are Means ± SE. Means with the same letters within a collection and parameter are not significantly different at P≤0.05. ................................................. 45 Table 4-4 Effects of one-year storage treatments on seed vigour and viability in PIN 1618. Data are Means ± SE. Means with the same letters within a collection and parameter are not significantly different at P≤0.05. ................................................. 46 Table 4-5 Seed germination rate index, seedling vigour and seed viability after various duration of accelerated seed aging treatment for chokecherry and pin cherry collections. ................................................................................................................ 52 Table 4-6 Regression equations for seed viability and total germination percentage as a function of artificial aging time. ............................................................................... 54 Table 4-7 Seed germination rate index, seedling vigour and seed viability after various durations of accelerated seed aging treatment for four buffalo berry collections..... 58 Table 4-8 Seed germination rate index, seedling vigour and seed viability after various duration of accelerated seed aging treatment for four dogwood collections. ........... 62 Table 4-9 Simple correlation coefficients between various measures of seed quality for BUF 14903 during accelerated seed aging. .............................................................. 71 Table 4-10 Simple correlation coefficients between various measures of seed quality for BUF 4096 during accelerated seed aging. ................................................................ 72 Table 4-11 Simple correlation coefficients between various measures of seed quality for BUF 9134 during accelerated seed aging. ................................................................ 74 Table 4-12 Simple correlation coefficients between various measures of seed quality for BUF 1424 during accelerated seed aging. ................................................................ 75 Table 4-13 Simple correlation coefficients between various measures of seed quality for CHK 1410 during accelerated seed aging. ................................................................ 77 Table 4-14 Simple correlation coefficients between various measures of seed quality for PIN 1298 during accelerated seed aging. .................................................................. 78 Table 4-15 Simple correlation coefficients between various measures of seed quality for DOG 3119 during accelerated seed aging. ............................................................... 80 vii Table 4-16 Simple correlation coefficients between various measures of seed quality for DOG 6930 during accelerated seed aging. ............................................................... 81 Table 4-17 Simple correlation coefficients between various measures of seed quality for DOG 3914 during accelerated seed aging. ............................................................... 82 Table 4-18 Simple correlation coefficients between various measures of seed quality for DOG 3259 during accelerated seed aging. ............................................................... 83 viii LIST OF FIGURES Figure 2-1 The relationship among seed vigour, viability, deterioration and the area application of seed vigour test (Delouche, 1960) ..................................................... 13 Figure 2-2 Model for the regulation of dormancy and germination by abscisic acid (ABA) and gibberellic acid (GA) in response to the environment (Finch-Savage et al., 2006). ........................................................................................................................ 16 Figure 2-3 Mechanism showing the role of dehydrogenase in the reduction of 2,3,5triphenyl-tetrazolium-chloride (TTC) to triphenyl formazan (TF) (Brooks, 2011) .. 19 Figure 4-1 Effects of one-year storage treatments on seed viability after germination percentage (including germinated seeds) (right) and percent of un-germinated but viable seeds (left) in two collections of chokecherry at two germination temperatures. Means with same letters within a collection, germination temperature and parameter are not significantly different at p≤0.05 ............................................ 40 Figure 4-2 Effects of one-year storage treatments on seed viability after germination percentage (including germinated seeds) (right) and percent of un-germinated but viable seeds (left) in two collections of pin cherry at two germination temperatures. Means with same letters within a collection, germination temperature and parameter are not significantly different at p≤0.05. ................................................................... 44 Figure 4-3 SDS-PAGE analysis of chokecherry and pin cherry seed proteins. The proteins were extracted using Tris-HCl buffer (M2) or phenol (M1) extraction method. The left lane indicates unigram of standard polypeptides. CHK: chokecherry, PIN: pin cherry.. .................................................................................. 48 Figure 4-4 Immunoblot analysis of dehydrins in chokecherry seeds upon different oneyear storage treatments. The western blot of total protein (35 μL/lane) was probed with antibodies against dehydrin proteins. The right lane indicates unigram of standard polypeptides ............................................................................................... 48 Figure 4-5 Observed (symbol) and simulated (solid line) seed viability and germination in chokecherry and pin cherry collections during artificial aging process at 45°C with 60 % RH. Values are mean ± SE (n=6). ................................................................... 50 Figure 4-6 Seed viability evaluation of chokecherry. Half seeds of CHK 1410 accession stained with TZ at various days of aging . ................................................................ 53 Figure 4-7 Observed (symbol) and simulated (solid line) seed viability and germination in four buffalo berry collections and during artificial aging process at 45 °C with 60% RH. Values are mean ± SE (n=6). ............................................................................ 58 Figure 4-8 Observed (symbol) and simulated (solid line) seed viability and germination in four dogwood collections during artificial aging process at 45 °C with 60 % RH. Values are mean ± SE (n=6). .................................................................................... 60 Figure 4-9 Electrolyte conductivity of four buffalo berry collections during artificial aging at 45°C with 60% RH. Values are mean ± SE (n=6). ‘*’ indicates significant difference among aging time within the same soaking time (P ≤ 0.05). .................. 64 ix Figure 4-10 Electrolyte conductivity of four dogwood collections during artificial aging at 45°C with 60% RH. Values are mean ± SE (n=6). ‘*’ indicates significant difference among aging time within the same soaking time (P ≤ 0.05). .................. 66 Figure 4-11 Electrolyte conductivity of a chokecherry and a pin cherry collection during artificial aging at 45°C with 60%RH. Values are mean ± SE (n=6). ‘ * ’ indicates significant difference among aging time within the same soaking time (P ≤ 0.05) . 68 Figure 4-12 Aged seeds were more vulnerable to fungi infection than non-aged seeds during germination. A: PIN 1298; B: LBC 7278, 0: 0 d, 5: 5 d, and 10: 10 d. Petridishes in the same column are aged for same duration. ............................................ 69 Figure 4-13 Accumulation of dehydrins during seed aging. The western blot of total protein (35 μL/ lane) was probed with antibodies against dehydrin protein. Numbers on the left indicate the approximate molecular weights. CHK = chokecherry; PIN = pin cherry. ................................................................................................................. 85 x LIST OF ABBREVIATIONS ANOVA RH CONRAD EC GLM GRI HSP LEA LSD MC MGT SDS-PAGE SVI Tris TZ UVS VAG VBG Analysis of Variance Relative humidity Canadian Oil-sands Network for Research and Development Electrolyte conductivity General Linear Model Seed germination rate index Heat shock protein Late embryogenesis abundant Least significant difference Seed moisture content Mean seed germination time Sodium dodecyl sulphate polyacrylamide gel electrophoresis Seed vigour index 2-Amino-2- (hydroxymethyl)-1,3-propanediol Tetrazolium Percentage of viable but un-germinated seed Seed viability after germination (including germinated seeds) Seed viability before germination test xi 1 INTRODUCTION The Alberta oil-sands contain an estimated 1.7 to 2.5 trillion barrels of oil (Alberta, 1999). Utilization of this vast natural reserve is contingent upon oil extraction, during which all vegetation and soil cover is removed. Therefore, responsible utilization of this resource requires adequate strategies to reclaim the oil-sands to their original boreal forest ecosystem. The boreal forest ecosystem is complex and primarily made up of grasses, forbs, shrubs, trees and other life forms including animals. Over the last 30 years, oil-sands reclamation in Alberta had been focusing more on grasses and forbs but less on shrubs and trees (Rowland et al., 2009). Shrubs are key to the successful re-establishment of the boreal forest ecosystem, but the natural regeneration of shrubs is low at oil-sands sites (Mackenzie et al., 2010). Successful establishment of native shrubs by planting accelerates soil development, plants and animals diversity and forage production and provides faunal cover and food for wildlife (Booth, 1985; Mech, 2011). A major limitation preventing the use of shrubs for oil-sands reclamation project is the unavailability of a consistent supply of high quality native shrub propagules. Native shrubs in this region are erratic in their seed production; the seed collection is costly, and the seeds have a relatively short longevity (Way, 2003; Price et al., 2010). Therefore, an understanding of the seed aging mechanism and proper storage protocols is ecologically and economically critical for efficient reclamation of oil-sands sites. Seed aging during storage is a complex process (Walters et al., 2010) that is affected by seed quality (Probert et al., 2009b), pre-storage treatments (drying process and desiccation tolerance of seeds), seed moisture content, storage temperature (Walters et al., 1998; Ellis et al., 2006), and the make-up of storage containers (Gómez-Campo, 2006). Generally, seeds from cool and wet environments are more short-lived than those 1 from hot and dry environments (Probert et al., 2009b). Seeds showing higher longevity at reduced moisture content and temperature are called orthodox seeds (Ellis et al., 1981; Mohammadi et al., 2011), which can be stored over a wide range of environments. However, the longevity of orthodox seeds differs quantitatively among diverse species and among seed lots within a species (Dickie et al., 1990; Bewley et al., 2013). The knowledge of physiological and biochemical changes during seed storage for nonagricultural crops, such as native shrubs in the boreal forest. In addition, there are no guidelines showing how to evaluate the variation in seed longevity within species. Therefore, understanding the process and mechanisms underlying seed aging will not only help to predict longevity of seeds and optimize seed storage protocols, but also to help the conservation of plant diversity. Subjecting seeds to elevated temperature and/or moisture (referred to as accelerated or artificial aging conditions) is often used to evaluate the seed responses to more conventional storage conditions (Powell et al., 1977; Hay et al., 2003; Rao et al., 2006). The procedure of accelerated seed aging has been standardized for several crops (Priestley, 1986; Rodo et al., 2003), but not for non-crop species. Objectives Six native shrub species from the boreal forest were selected for this study and included Prunus virginiana, Prunus pensylvanica, Arctostaphylos uva-ursi, Shepherdia canadensis, Cornus sericea, and Viburnum edule. For these native shrub species, the objectives of this study were to: 1) evaluate the effects of different storage conditions on seed viability, germination, and seedling vigour; 2 2) identify biophysical parameters for the prediction of seed viability loss by analysing physiological and biochemical changes in seeds exposed to accelerated aging; and 3) determine the optimal temperature,seed moisture content, and optimal atmosphere for seed storage with focus on identifying physiological and biochemical changes affecting seed longevity. Hypothesis It was hypothesized that: 1) low temperature and low oxygen and low seed moisture contents prolong seed viability during storage; 2) decreased viability in accelerated seed aging process is associated with the loss of membrane integrity; and 3) accumulation of LEA protein (dehydrins) is associated with seed viability loss. 3 2 2.1 LITERATURE REVIEW Importance of shrubs in oil sand reclamation Alberta oil-sands mining and the disturbance of boreal forest ecosystem Oil-sands contain an estimated 1.7 to 2.5 trillion barrels of oil in the north-eastern Alberta (Kelly et al., 2009). For oil extraction, all vegetation and soil cover is removed to create open pits several kilometers wide and up to 100 m deep (Rowland et al., 2009). Without a reclamation programme, the development scale of Alberta oil sand industry would lead to the loss of biodiversity and irreversible ecological damage of boreal forest ecosystem. However, the oil industry is obliged to reclaim land to its original state prior to oil extraction according to Land Surface Conservation and Reclamation Act 1973 and the Environmental Protection and Enhancement Act 1992 (Goverment-Alberta, 1999). Currently, only 1.04 km2 out of 686 km2 of land disturbed by oil-sands mining is certified as reclaimed by the Alberta government (Mech, 2011). Conservation and reclamation of boreal forest Barley (Hordeum vulgare L.) is always planted to provide a quick vegetation cover and soil erosion control during the first growing season after capping (Goverment-Alberta, 1999). However, barley is a poor competitor and could be invaded readily by domestic flora within the first year. Although reclamation in these areas has been underway since 1970s, reclamation treatments have left more bare ground, some grasses and forbs, but less shrubs, trees, woody debris, moss, and lichen than natural forests (Rowland et al., 2009). Shrubs as a key component of boreal forest Succession is a slow, natural, orderly change in plant and animal communities that occurs over time (Pérez et al., 2013). The earliest succession stage is dominated by herbs and 4 small shrubs, followed by an intermediate stage dominated by tall shrubs and young trees, and the final stage resulting in a mature forest. Fire, resource mining, flood, or extreme weather can disturb the existing environment. As a result, the ecosystem reverts to its earlier succession stage. The establishment of native shrubs accelerate soil development, enhance plant and animal diversity, and provide faunal cover and wildlife food (Booth, 1985; McKell, 2012). In a reclaimed ‘Mixed Wood Region’ of Alberta, shrubs enhance the development of soil organic matter (Rowland et al., 2009), which is the key component for a successful reestablishment of the natural ecosystem. Challenges in shrub reclamation There is a considerable variation in annual seed production in shrubs, thus often creating uncertain supply of seeds for a particular year when needed for reclamation. Seed collection of native shrub species is a resource demanding work, and seed longevity of native shrub species from this area is usually limited to 2-3 years after harvesting (Stevens et al., 1996; Shaw et al., 2012). Ecology of native shrub species 2.1.5.1 Bearberry (Arctostaphylos uva-ursi) Bearberry (Arctostaphylos uva-ursi) is a prostrate evergreen shrub with a number of ecotypes (Stebel et al., 2013). Bearberry can stay out of the wind chill and is widely distributed in Canada and the northern United States (Kaplan, 2012). Shade intolerant bearberry grows best in open areas and tolerant a wide range of soil type and pH. The species is frequently found on nutrition-poor dry soil with limited clay and silt (Kaplan, 2012) such as beaches, dunes and mountains where it may play an important role in preventing soil erosion (Stebel et al., 2013). Bearberry propagates vegetatively and regenerates rapidly from dormant buds especially after forest fires. Flowering occurs 5 between March and June (the precise period depends on location and altitude), and fruits ripen in autumn and stay on the plant throughout the winter (Kaplan, 2012; Stebel et al., 2013). 2.1.5.2 Buffalo berry (Shepherdia canadensis Nutt.) Buffalo berry (Shepherdia canadensis) is a native deciduous shrub present across the entire forest region in Canada and northern United States (Hamer, 1996). Buffalo berry’s height ranges from 1-9 m and is ideal for reclamation of disturbed areas as it provides food and cover for wildlife (Riedl et al., 2013). Buffalo berry can grow well in nutrient poor soils because of its nitrogen fixing ability, which also enhances the growth of associated species by enriching soil with nitrogen around its perimeter (Bourassa et al., 2011). Buffalo berry can regenerate by both sexual and vegetative means. Seed production begins at four to six years of age; the small seed size is always associated with delayed germination that requires 40 to 60 d cold stratification for embryo development (Rosner et al., 2003; Morales et al., 2012b). This species can also regenerate by producing sprouts from surviving root crowns and dormant buds. Buffalo berry plays a dominant role in all successional stages and it is also a dominant species in climax vegetation of ponderosa pine forest (Morales et al., 2012a; Morales Rivera, 2012). 2.1.5.3 Chokecherry (Prunus virginiana L.) Chokecherry is a medium to large multi-stemmed fruiting shrub (1-7 m) or a small tree (9-13 m) (St-Pierre, 1993). It is native to Canada with distribution from British Columbia to Newfoundland (Bainard et al., 2011). Chokecherry can out-compete shade-loving plants in well-lighted openings and clearings of forests (Wang et al., 2012). Chokecherry is usually dominant during secondary succession, since it is well adapted to disturbance 6 by fire and can recover rapidly (Webb et al., 1985; Wang et al., 2012). When light increases after opening of the forest canopy, sprouts can develop from the root crown of chokecherry stumps and dying bushes. Chokecherry can dominate a site for a prolonged period of time by continuously producing new sprouts (Johnson et al., 1995; SuarezGonzalez et al., 2013). When a large group of chokecherries grows together, they can provide habitat for larger mammals (Rurek, 2010). The fruit of chokecherry is a singleseed of 4-9 mm in diameter with color varying from yellow, orange, red to purple-black (St-Pierre et al., 2005). Preliminary experiments in our group showed that the thousand seed weight of chokecherry seed is usually between 60 g to 65 g. Optimal conditions for the germination of chokecherry seed require nine weeks of warm stratification at 30/20 °C day/night followed by 10 weeks of cold stratification at 4 °C (Lockley, 1980; Rowley et al., 2007). Chokecherry seeds can be subsequently germinated at 30-20 °C with 14 h photoperiod (Lockley, 1980; Wang et al., 2012). A previous study showed that subsequent growth conditions of 7/-4 °C day/night temperatures in vermiculite promoted maximal root growth and minimal root-tip browning (St-Pierre, 1993). 2.1.5.4 Dogwood (Cornus sericea L. ssp. sericea) Dogwood (Cornus sericea) is a medium to large multi-stem deciduous shrub with average height from 1.6 - 4 m (Shannon et al., 2012). This shrub is not only a beautiful ornamental for its red branches, but it also provides food and protection for wildlife (Charles-Dominique et al., 2014). North American aboriginal people use dogwood branches to make baskets, and fruit as food and in traditional medicine. The plant has also been combined with grasses to make a ceremonial tobacco (Fuchigami et al., 1971). Dogwood is a native species that is most common in boreal, temperate, and cool meso7 thermal climates (Davis et al., 2014). Dogwood can tolerate a wide range of soil conditions, ranging from moderately acidic to alkaline with moderate to high nutrient levels (Woźnicka et al., 2014). Dogwood is shade tolerant, however, generally grows better in intermediate to high light conditions. It occurs around communities such as grassland, forest, shrub land, and woodland (Shannon et al., 2012). Dogwood starts to produce seed at the age of three to four years and seeds require 60-90 d cold stratification before germination. Birds and mammal disperse dogwood seeds that naturally establish within one year (Woźnicka et al., 2014). Even though dogwood is typically present throughout all stages of succession, it is more abundant in the earlier stages (Shannon et al., 2012). 2.1.5.5 Low bush cranberry (Viburnum edule (Michx.) Raf. ) Low bush cranberry (Viburnum edule) is an erect, deciduous shrub with height from 0.6 to 2 m (Chai et al., 2013). It is widely distributed throughout Alaska and across Canada. Low bush cranberry is an important component of the forest edge and hedgerow habitats that provides cover for small mammals and birds (Wiese et al., 2012). The late fall ripened fruits are consumed by small mammals and foliage serves as habitat for beavers and rabbits (Solarik et al., 2010). Low bush cranberry can reproduce vegetatively by sprouting from damaged rootstock and stumps (Daust, 2013). Seeds are produced at the age of five years (Solarik et al., 2010) and require a two-stage stratification (a warm period followed by cold stratification) to break dormancy (Chai et al., 2013). Low bush cranberry is a seed banking species, as the cleaned and air-dried seeds can be stored up to 10 years without losing viability (Wiese et al., 2012). Low bush cranberry is moderately shade tolerant and important during all stages of forest succession (Clement et al., 2011). 8 2.1.5.6 Pin cherry (Prunus pensylvanica) Pin cherry is a short-lived native shrub or small tree, which has a narrow, round-topped crown (Allison et al., 2003). Pin cherry regenerates both by seeds and sprouts (Ghayyad et al., 2010). Seedlings of pin cherry have been found one year after clear-cut in a 25year-old Maine hardwood forest (White, 1991; Ghayyad et al., 2010). Sexual maturity can be reached as early as two years growth resulting in abundant seed production at early ages (Wendel, 1990). Pin cherry seeds are 4-6 mm in diameter with a thick seed coat (Halls, 1977; Belcher, 1985; Ghayyad et al., 2010). Dormancy of pin cherry seeds is usually caused by several years’ initial physiological inhibition and followed by a secondary dormancy that remains until germination is stimulated by disturbance (Marks, 1974; Ghayyad et al., 2010). Thus, there is often a long delay between pin cherry seed dispersal and germination. Germinate is stimulated by changes in light and soil temperature (Marks, 1974; Willis et al., 2012), but the specific aspect of the changed environment that triggers germination is not known (Canham et al., 1985). A break down of germination inhibitor or increase permeability is proposed mechanisms for germination initiation (Marks, 1974; Wendel, 1990; Callahan et al., 2009). A study in Nova Scotia on pin cheery stand development found higher frequency of regeneration on soil disturbed by logging machine than on undisturbed soil (Allison et al., 2003). Laboratory experiments revealed that germination in open areas might be related to more extreme temperature fluctuations (Marks, 1974; Callahan et al., 2009). According to Peterson et al., (1995), germination of pin cherry may also be promoted by nitrogen (especially nitrate) fertilization. 9 2.2 Storage conditions affecting seed longevity Seed storage is a major contributing factor to the quality of planting materials for propagation in subsequent seasons, and food storage and conservation of genetic recourses. The aging process of seeds during storage is complex (Walters, 2007) and it is affected by seed quality at harvest (Probert et al., 2009b), pre-storage treatments (drying process and desiccation tolerance of seeds) (Hong et al., 1998), seed moisture content, temperature (Walters et al., 1998; Willis et al., 2012), and type of seed containers used to maintain optimal moisture levels (Gómez-Campo, 2006; Walters, 2007). Probert et al., (2009a) concluded the three important environmental factors affecting seed storage: moisture content (RH), temperature, and gaseous environment. Effects of temperature on seed longevity The longevity of orthodox seeds decreases as the temperature increases when relative humidity is constant during storage (Dickie et al., 1990; Balešević-Tubić et al., 2010). This is primarily due to a higher respiration rate at higher temperature causing increased utilization of storage proteins and carbohydrates (Kochanek et al., 2009). High temperature also promotes protein denaturation and lipid peroxidation in seeds (Probert et al., 2009a) and increases infections by fungi, bacteria, and pests with negative effects on seed longevity. As orthodox seeds are well tolerant to low temperature, the use of subfreezing temperature may prolong seed life by up to 20 years (Nagel et al., 2010). Effects of seed moisture levels and humidity on seed longevity The relative humidity and seed moisture content are other important factors that affect the maintenance of seed viability. In a closed environment, seed moisture content changes according to the relative humidity in the storage container (Mayer et al., 2014). Therefore, in a high humidity environment, seed moisture content will increase due to 10 water absorption (Probert et al., 2009b). As seed moisture levels increase, the respiration rate increases and this activates various catabolic enzymes, which accelerate the consumption of storage proteins and carbohydrates (Bass, 1980; Nagel et al., 2010). A high relative humidity level in the storage environment also increases the activity of microorganisms, which severely affect seed storage life (Mayer et al., 2014). At ambient temperature, a reduction of seed moisture content by 4-7% essentially assures retention of high germination percentage for one or more years (Roberts, 1972). Effects of storage atmosphere on seed longevity Besides temperature and relative humidity, the gaseous composition of the storage environment has also been implicated in seed longevity. Under constant temperature and moisture conditions in a closed environment, the gaseous environment changes due to respiration by the seeds and associated micro-flora (Rao et al., 2006). For many species, a high oxygen concentration reduces seed viability (Bewley et al., 1982; Schwember et al., 2010). Thus, many seeds retain their viability better in sealed containers than in open storage conditions (Schwember et al., 2011). Roberts (1961) found that rice seeds were better preserved in N2 atmosphere with 12% relative humidity than stored with oxygen or air. In case of lettuce, seed of 5-6% moisture content deteriorates slower in sealed containers with CO2 atmosphere than in air (Pérez-García et al., 2009). However, Schwember et al. (2011), argued that there was limited advantage in using a controlled atmosphere for seeds stored at low temperature and low moisture conditions. 2.3 Changes of seed viability and vigour during the aging process The mechanisms by which seeds lose their germination potential are not well understood (Walters et al., 2010; Walters et al., 2011). Therefore, the knowledge of physiological and structural changes at the biochemical and molecular level during seed aging process 11 can help understand the reasons of seed viability loss and can be used to optimize seed storage protocols. Seed vigour is the sum of all seed properties and it can be used to determine the potential activity and performance of seeds (Baalbaki et al., 2009). To get accurate information on seed performance in storage or field, germination test, viability test, as well as other seed characteristics are needed to be assayed (Thuzar et al., 2010). The standard germination test is designed to provide a first and final count of germinated seeds, which are then interpreted as the germination percentage; it is the sum of both strong and weak seedlings (Pérez-García et al., 2009). Seed germinability represents the capacity of seed to retain enzymes activities needed to catalyze metabolic reactions, which determine the germination and seed growth (Basra, 1995). Seed viability test is a measure of viable and dead seeds. A viable seed is one that germinates under favorable conditions. Seeds that cannot germinate due to their age and / or dormancy, but have viable tissues and cells capable of metabolism are also considered viable (Priestley, 1986). There is no doubt that reduced seed vigour decreases the field emergence. A Strong but non-linear correlation is observed between percentage seed viability and various attributes of seed vigour (McDonald Jr et al., 1986; Pérez-García et al., 2009). Aged seeds that retain their capacity to germinate generally show a postponed and slower germination with an enhanced sensitivity to external stress. Aging is just one determinant of vigour, which is also influenced by seed genotype, degree of maturation, and physical integrity (Roberts, 1972; Mayer et al., 2014). Seed deterioration is used in this thesis in a general sense to indicate declining vigour or viability (Baalbaki et al., 2009). The relationship between the seed viability and the vigour of a hypothetical seed 12 lot with increasing seed deterioration is illustrated in Figure 2-1 (Ritenour et al., 2001). Since the standard germination test is conducted under optimal conditions, even weak seeds have the ability to germinate. In a vigour test, low quality seeds with reduced vigour will deteriorate more rapidly over time. Figure 2-1. The relationship among seed vigour, viability, deterioration and the area application of seed vigour test (Delouche, 1960) 13 Seed dormancy The term seed dormancy that may last for several hours to several years has been used to describe two inactive conditions, one resulting from unfavourable environmental conditions and the other due to cellular metabolism imposed germination blocks (Baskin et al., 1998; Nambara et al., 2010). In non-growing conditions, seed moisture content and metabolism rate are low, thus, seeds can survive on their nutrient reserves (Dickie et al., 1990; Desai, 2004). This process is a remarkably complex, effective, and the protective mechanism would ensure the long survival of seeds until when favourable conditions of germination and growth are available (Baskin et al., 1998; Desai, 2004). Such prolonged survival of the embryo within the seed ensures dispersal and distribution to long distance destinations. Many seeds have the ability to adapt to seasonal changes. For example, they have a delayed action mechanism that ensures that the seeds will remain dormant until another growing season comes. The length of dormancy differs greatly among various species and cultivars. For example, lotus seed can remain viable for hundreds of year (Desai, 2004). According to Black et al. (2000) the following factors may prevent the embryo germinate: interference with water uptake and gaseous exchange, presence of chemical inhibitors, seed coats functions as a barrier for release of inhibitors from the embryo, modification of light reaching the embryo, and seed coats exerting a mechanical restraint (Bewley et al., 1982; Dickie et al., 1990; Nambara et al., 2010). The dormancy process is reversible; sometimes, the seed may turn in to secondary dormancy by exposure to oxygen deficiency, an excess of water, or a temperature too high for germination (Desai, 2004). Dormancy can be terminated by some factors that are not required for germination, but are needed to prime the seed so that it can respond to conditions favourable for germination. Some seeds may need several weeks chilling at 14 4°C before germination; however, a higher temperature is generally needed to support germination (Baskin et al., 1998; Desai, 2004). Also dormancy can be broken by light, however, most seed germinate under a dark condition (Dickie et al., 1990). Previous studies suggest that chilling and light are factors not strictly required throughout germination but only to trigger or potentiate the process (Bewley et al., 1982; Walck et al., 2011). The mechanisms of dormancy and its release involve the interaction of inhibitors and growth-promoting hormones, such as gibberellins (GA), cytokines, ethylene, and abscisic acid (ABA) (Desai, 2004). According to this model illustrated in Figure 2-2, ambient environmental factors affect the balance of ABA and GA. The dormant state is induced by ABA synthesis and GA catabolism, whereas germination is promoted by ABA catabolism and GA synthesis. Hence the dormancy cycling is caused by a complex interplay among hormone degradation and synthesis pathways in accordance with ambient environmental changes (Finch‐Savage et al., 2006). 15 Figure 2-2 Model for the regulation of dormancy and germination by abscisic acid (ABA) and gibberellin acid (GA) in response to the environment (Finch-Savage et al., 2006). 16 Seed membrane integrity Cellular membranes are proposed as the primary sites of injury during storage of seeds (Bailly, 2004). The accelerated seed aging treatment reduces the cell membrane phospholipids, which leads to a reduction in seed viability. However, such marked changes do not occur during normal long-term aging. Seed aging at high relative humidity may cause hydrolysis of important cellular component including membranes, which cannot be replaced or repaired due to insufficient activity of appropriate synthetic processes (Powell, 1986; Morales et al., 2012b). Also, along the aging process, free radicles are formed and may cause damages to the membrane lipids. Therefore, the slow germination and growth, abnormal growth, or even no growth could have a strong link to fundamental changes in membranes and macromolecules (Bewley et al., 1982). Protein expression Changes characterized during the aging process in seeds include alterations in membrane protein composition, protein degradation, decreases in lipid content and decreases in mRNA translation (Noodén, 2012; Delahaie et al., 2013). Increased accessibility of proteins to proteinases due to decompartmentation, enhanced proteolysis by molecular modifications to polypeptides, and the increased activity of proteinases are considered to be three main leading reasons for protein degradation (Kumar et al., 1999; Shaban, 2013). Proteins in dry seeds are considered to be resistant to degradation in adverse environment conditions (Golovina et al., 1997) although current hypotheses on seed aging have implicated per-oxidative damage to enzymes as a major cause of seed aging (Walters, 2007). In orthodox seeds, the presence of specific proteins such as the late embryogenesis abundant (LEA) proteins, heat shock proteins (HSPs), and some seed storage proteins are associated with desiccation tolerance and maintenance of a quiescent 17 state. A close relationship seems to exist between the abundance of some of these stress proteins and seed longevity (Rajjou, 2008a). One of the most striking characteristics of mature orthodox seeds is their ability to withstand severe desiccation,as water content decreases during the late maturation stage of seed development. The ‘late embryogenesis abundant’ (LEA) proteins have been found associated with several kinds of desiccation tolerance, and they are especially more abundant during late embryogenesis than during mid-embryogenesis as their name indicates (Shih et al., 2008). Under stress conditions in seeds, specific stress proteins may be formed and be involved in avoiding stress, repairing damage, or protecting cellular machinery from the effects of stress (Rajjou, 2008b). 2.4 Detecting seed aging Because a standard germination test is a less sensitive index of seed quality than the vigour test, many studies suggest that the loss of germination could serve as a basis for vigour test. According to ISTA (International Seed Testing Association), vigour test can be classified into various categories based on the method (Baalbaki et al., 2009). For example, vigour test can be classified into physiological and biochemical test based on which component is measured. Biochemical tests look at protein analysis, respiration analysis, or reactions related to the gene expression, while physiological tests measure seedling vigour and viability (Moore, 1973). Seed vigour measurements The test relies on activity of dehydrogenase enzymes in the embryo tissue (Moore, 1973; Baalbaki et al., 2009) and provides a quick estimate of seed viability (Neljubow, 1925). In 2000, both AOSA (Association of Official Seed Analysts) and ISTA recommended the 18 Tetrazolium test (Baalbaki et al., 2009) for seed viability determination. All living tissues, display dehydrogenase activity, which in highly reduced state produces hydrogen ions that reduce the colorless tetrazolium salt 2,3,5-triphenyl-tetrazolium-chloride (TTC) to generate the stable, red-coloured product formazan (Figure 2-3). Five classes of staining patterns can be distinguished according to the intensity of red color by formazan in the seed tissues (Steiner, 2003). Figure 2-3 Mechanism showing the role of dehydrogenase in the reduction of 2,3,5triphenyl-tetrazolium-chloride (TTC) to triphenyl formazan (TF) (Brooks, 2011) When formazan is formed in the seed tissue, the resulting red colour is a positive indication of viability by indirectly detecting cellular respiratory activity occurring in the mitochondria. The non-viable seed and low-viable seed do not react with TTC and consequently do not show the red colour. Respiring tissue in seed can be found within the embryo of a seed, in cotyledons and radicle, in some nutritive endosperm tissues, and also in the female gametophyte tissue of gymnosperms. 19 The Tetrazolium test generally shows a significant correlation between reduction of the dye, respiration and seedling vigour. However, under aging treatments and particularly during accelerated seed aging, a loss of seed viability occurs without concomitant loss of dehydrogenase enzymes leading to an overestimating of seed viability (Bewley et al., 1982). Electrolyte conductivity test The electrolyte conductivity (EC) test is a simple valuable quantitative test to assess seed vigour for many plant species. The test measures seed electrolyte leakage caused by inorganic ions passing through cell membranes (Baalbaki et al., 2009). During seed soaking, ions diffuse out through the cell membrane that can be detected by monitoring electrolytes. Low quality seeds with membrane damage caused by stress or aging leak high amounts of solutes (Powell, 1986). In contrast, seeds with high vigour and germination ability show low electrolyte conductivity. In living cells, membrane integrity is not only important for keeping cellular compartmentalization but is also the site for biochemical reactions (Abdul-Baki, 1980). Leakage of soluble compounds also occurs during the rehydration of dry seeds. Seed membrane reorganize during this process, which means the sooner the seed membranes are reestablish, the lower is the electrolyte conductivity (Black et al., 2000). There are many factors that affect seed electrolyte conductivity test results. Since seed membrane integrity changes during the seed development as well as during storage, the seed mortality and quality are strongly associated with seed solute leakage (Powell, 1986). Loss of protection by seed coat or the presences of mechanically damaged seed significantly increase seed conductivity. To keep the accuracy of the electrolyte conductivity test, damaged seeds should be removed before the test (Desai, 2004). Large 20 seeds leak more electrolyte than the small seeds of equivalent quality. To eliminate the difference in seed size, the electrolyte conductivity tests are usually expressed per gram seeds. If the seeds have been fungicide treated before the test, the treated seeds need to be washed prior to the test (Baalbaki et al., 2009). Methods of seed protein analysis 2.4.3.1 SDS-PAGE Sodium dodecyl sulphate polyacrylamide gel electrophoresis (SDS-PAGE) is a widely used method to separate proteins according to their molecular mass (Schägger et al., 1987). It is reliable for determination of molecular weights for most polypeptides, but can also be used for assay of protein purity (Cohen et al., 1987). Protein samples are mixed with Tris buffer containing SDS and the reducing agent β-mercaptoethanol followed by boiling to denature the proteins and reduce their disulphide bonds. The anionic detergent SDS aids in the denaturation of secondary and non-disulphide- linked tertiary structures and adds negative charges to each polypeptide in proportion to their mass (Pitt-Rivers et al., 1968) (Bergfors, 2009). Electrophoresis using a gel composed of a lower resolving gel and an upper stacking gel with pH 8.8 and 6.8, respectively, separates individual polypeptides. The gel sections are made up by an acrylamide: bisacrylamide mixture that is polymerized to a network by the action of APS (Amonium persulphate) and TEMED (Tetramethylethylenediamine) in the presence of 10 % SDS and appropriate Tris-HCl buffer. The concentration of acrylamide in resolving gel may vary from 5% to 25 % (w/v) to generate different resolution power during electrophoresis (Raymond et al., 1959). A low percentage polyacrylamide gel generates larger pore sizes, which is preferred for separation of high molecular weight proteins. Bromophenol blue is commonly used as tracking dye for the electrophoresis as 21 the small negatively charged dye molecules migrate faster than the SDS-coated polypeptides (Flores, 1978). The separated polypeptides can subsequently be visualized as distinct bands in the gel with low background using the Coomassive brilliant blue staining technique (Steinberg, 2009). For low-abundant polypeptides, silver staining is preferred as it is a more sensitive protein staining method than Coomassive staining (Bergfors, 2009). 2.4.3.2 Two-dimensional polyacrylamide gel electrophoresis (2D–PAGE) Two dimensional gel electrophoresis (2-DE) is a well-established method for high resolution profiling of low abundance proteins (Issaq et al., 2008). 2-DE starts with onedimensional gel electrophoresis, and followed by separation of molecules are isoelectric point (isoelectric focusing, IEF) in a direction 90 degree from the first separation (Janson, 2012). Thereby, a gradient of pH is applied to the gel besides the applied electrical potential. In the pH gradient gel, proteins will be charged if the pH value different than their isoelectric points (Janson, 2012). The positive charged proteins will migrates towards the negative side of the gel according to their mass to charge ratio. Protein can be detected after the separation by silver or Commasive brilliant blue staining (Issaq et al., 2008). Even though the 2-DE technique is relative sensitive for protein analysis, however, it is still considered to be a time consuming and labour intensive technique. Also the potential of 2-DE for proteome analysis is limited to proteins of medium to low abundance (Janson, 2012). The difficulty in reproducibility between gels leads to increased system variations, which made it more difficult to tell whether the difference was caused by system or the biological change (Rabilloud et al., 2010). 22 2.4.3.3 Zymography Zymography is a widely used functional assay for analysing proteolytic activity; in particular for the matrix metalloproteinases (MMPs) (Kupai et al., 2010). This simple, sensitive quantitative standard method was first introduced by Granelli-Piperno and Reich, and modified by Heussen, which then became a routine technique in cancer research around the world (Granelli-Piperno et al., 1978; Heussen et al., 1980; Leber et al., 1997). The zymography provides reliable identification of proteolytic active polypeptide based on the molecular mass of inactive and active forms after SDS-PAGE. Proteases analyzed by zymography cleave protein by peptide bond hydrolysis, but can also after gel separation re-nature as well as exert proteolytic activity on a copolymerized substrate upon removal of the SDS (Hu et al., 2010). The size of proteolysis product can be revealed by Commasive blue staining of SDS-PAGE gel. The amount of proteases correlates linear with the band intensity within a certain size range (Leber et al., 1997). The zymography techniques offers several benefits features when compare to other methods, for example: no requirement of expensive materials such as antibodies, as well as the flexibility in changing of substrate types, and reaction buffers, etc. However, there still some concern about the accuracy of proteolytic activity determination (Hu et al., 2010). Besides, the two-steps standing/ distaining is critical and complicated for the accurate measurement of proteolytic activity (Hughes et al., 2010). 2.4.3.4 Western blot assay The Western blot (also called protein immunoblot) is a widely used technique to detect specific proteins in given samples, which was developed by Harry Towbin (Towbin et al., 1979). Proteins are separated by SDS-PAGE, and then transferred from gel to membrane 23 by electrophoretic transfer. Generally, two type of membranes are used in the western blot, the nitrocellulose and polyvinylidene fluoride (PVDF) membranes. The nitrocellulose membrane has high affinity for protein and preserves protein integrity and gives low background signals (Fernandez et al., 1992). However, nitrocellulose is fragile and does not allow for re-probing of membrane. Compared with the nitrocellulose membrane, PVDF membrane has a superior on protein retention capacity, and has high mechanical strength, but gives higher background signals (Fernandez et al., 1992). The membrane containing bound proteins is incubated with primary antibody specific for the target protein (Towbin et al., 1979). Subsequently, un-bound proteins are washed off before membrane is incubated with the secondary antibody specific for target primary antibody. The identification of the target is ensured by the specificity of the antibody- antigen interaction, and the thickness of the band can be a good indicator of protein concentration. 2.4.3.5 MudPIT (Multidimensional Protein Identification Technology) Multidimensional protein identification technology is a widely used non-gel technique for separating and identifying individual components of the mixture of protein and peptide (Kislinger et al., 2005). It has been proven to be a qualitative and quantitative tool for proteomic analyses (Chen et al., 2006). In MudPIT, a complex mixture of protein and peptide is digested and loaded directly to a triphasic micro capillary column packed with reversed phase, strong cation exchange, and high-pressure liquid chromatography (HPLC) grade materials (Delahunty et al., 2007). The column is placed directly in-line with a tandem mass spectrometer after the load of complex peptide mixture onto the triphasic micro capillary column. The tandem mass spectrometry peptide data generated 24 from a MudPIT run is then analyzed to determine the protein composition of the original sample (Delahunty et al., 2007). Artificial aging tests Seeds can be subjected to rapid aging processes (artificial aging) by accelerated seed aging, saturated salt seed aging or controlled seed deterioration procedures. In most artificial aging tests, seeds are exposed to high temperature and high humidity conditions, followed by physiological and biochemical tests. High quality seed lots can withstand those stress conditions and show slower deterioration rate and germinate faster than seeds with poor vigour (Ching, 1972; Rice et al., 2001; Rodo et al., 2003). Thus, artificial aging test is an indicator of seed quality and vigour. Compared with the natural aging test, artificial aging tests are rapid and correlate with field performance of seeds. Therefore, artificial aging can provide valuable information of both storage potential of seeds and their field emergence (Baalbaki et al., 2009). 2.4.4.1 Accelerated aging test Accelerated seed aging test was initially developed to estimate the longevity of seed in commercial storage (Delouche et al., 1973), but has also been used to predict the life span of a number of other seeds. In the accelerated aging test, seeds are exposed to high temperature (45C) and high humidity (95% RH), which are the two main factors causing seed aging (Walters, 1998). When conducting accelerated seed aging test, seeds are place inside a two layer sealed plastic box (one layer is for water) or a desiccator. The two layer plastic box/desiccator is placed in a water jacketed accelerated aging chamber. The temperature is controlled at 41-45 C and relative humidity is maintained at 95%. Seeds 25 are sampled during the selected aging period and tested by germination and seedling number as well as by biochemical tests (Baalbaki et al., 2009). 2.4.4.2 Saturated salt accelerated seed aging test Saturated salt accelerated seed aging test is a modification of accelerated seed aging, where saturated salt solutions such as LiCl, NaCl or KCl are used instead of water to create a suitable aging environment for both large and small seeds. The saturated salt solution reduces the relative humidity, allowing soaking, and thus slows down the seed deterioration rate. The relative humidity below 80% prevents the storage fungal growth, which can influence the accelerated seed aging process (Zhang et al., 1997). 2.4.4.3 Controlled deterioration test The controlled deterioration test was initially developed to estimates the difference in seed vigour among small seeded species (Hampton et al., 1995). It is also a modification of accelerated seed aging test where seeds are placed in high temperature and high humidity stress for a short period of time. The main difference between controlled deterioration and accelerated seed aging tests is that in the controlled aging test, seeds are pre-moist at a certain level before being subjected to high temperature stress conditions. The equilibrium process minimizes the seed moisture change that would cause the difference in seed deterioration but not the real difference in seed quality (Baalbaki et al., 2009). Besides, the equilibrated seeds eliminate the difference in water absorbance, electrolyte leakage and conductivity test, thus enhancing the accuracy of the test. One limitation of controlled deterioration test is that it may need a long time to reach the equilibrium moisture stage (Rodo et al., 2003). 26 3 3.1 MATERIALS AND METHODS Plant materials Six shrub species identified by the vegetation cooperative of CONRAD (Canadian Oilsands Network for Research and Development) were used in this study. The species included Prunus virginiana, Prunus pensylvanica, Arctostaphylos uva-ursi, Shepherdia canadensis, Cornus sericea, and Viburnum edule. Seeds were collected from the species grown in the central mix-wood region of north-eastern Alberta during 2009 to 2012 (Table 3-1) and seed lots were cleaned following the procedures described in the fact sheets from Wild Rose Consulting. Cleaned seeds were air dried at room temperature to constant weight (approximately 7-8% dry weight water content) and then transported to Department of Plant Sciences, University of Saskatchewan for initial seed quality assessment and storage. 27 Table 3-1 Shrub seed lots collected from central mixed-wood region of north-eastern Alberta from 2009 to 2012 used in the study. Species Bearberry (Arctostaphylos uva-ursi) Buffalo berry (Shepherdia canadensis) Chokecherry (Prunus virginiana) Dogwood (Cornus sericea) Low bush cranberry (Viburnum edule) Pin cherry (Prunus pensylvanica) 1984 BUF 8484 Seed lot and collection year 2009 2010 2012 BEAR 1117 BEAR 1618 BUF 14093 BUF 9134 BUF 4906 BUF 1424 CHK 1410 CHK 1114 CHK 6259 DOG 3914 DOG 3119 DOG 6930 DOG 3259 LBC 3119 LBC 7278 PIN 8484 PIN 1298 Table 3-2. Seed germination conditions. Stratification Germination (weeks) Species Light temperature Wa day/night (°C) Cold rm Bearberry (Arctostaphylos uva-ursi) 9 7 NO 15/5 Buffalo berry (Shepherdia canadensis) 0 3 YES 15/5 Chokecherry (Prunus virginiana) 9 8 NO 30/20 Dogwood (Cornus sericea) 3 0 NO 30/20 Low bush cranberry (Viburnum edule) 16 2 NO 15/5 Pin cherry (Prunus pensylvanica) 9 10 NO 15/5 Warm stratification was conducted at 30/20 °C and cold stratification was conducted at 4°C. 28 3.2 Methods Initial seed quality assessments 3.2.1.1 Determination of seed moisture content Determination of the initial seed moisture content (MC) by the oven-drying method (Baalbaki et al., 2009) was done before storage and within one month of seeds being received. The analysis included three samples of 10-30 seeds per collection depending on seed size and seed availability. Moisture content was calculated using the formula: 𝑀𝐶 % = 𝐹𝑟𝑒𝑠ℎ 𝑊𝑒𝑖𝑔ℎ𝑡 − 𝐷𝑟𝑦 𝑊𝑒𝑖𝑔ℎ𝑡 × 100 𝐹𝑟𝑒𝑠ℎ 𝑊𝑒𝑖𝑔ℎ𝑡 Equation 3-1 3.2.1.2 Determination of thousand seed weight According AOSA (Baalbaki et al., 2009), the determination of thousand seed weight was completed by weight 100 seeds for eight replicate samples, separately; then calculate the average weight of 100 seeds, and multiply by 10. 3.2.1.3 Analysis of seed viability by TZ test Tetrazolium (TZ) tests were conducted to assess seed viability following procedures established by the International Seed Testing Association (1985). Three replicates of 10 seeds were placed in Petri dishes containing two layers of filter papers soaked with 5 mL distilled water. Upon 24 h incubation at room temperature, the seeds were cut and submerged in a 1% (w/v) solution of 2,3,5 triphrnyl tetrazolium chloride (TTC) for 24 h at room temperature. The production of the red substance formazan from TTC in living tissues by the action of dehydrogenase enzymes was examined on the radicle, plumule and cotyledons. 29 3.2.1.4 Cold and warm stratification of seeds Seeds of all shrub species were in different degrees of dormancy. Thus, treatments such as cold stratification (4 °C) and/or warm stratification (30/20 °C, 12/12 h) were required to break dormancy before subjecting the seeds to germination tests (Table 3-1) (Baskin et al., 1998). 3.2.1.5 Seed germination Seeds were germinated at different sets of alternating temperatures (15/5, 20/10, 25/15, 30/20, and 35/25 °C) with or without light (12 h) depending on the dormancy-breaking requirements of each species. The seeds were placed on top of two layers of filter papers moistened with 5 mL distilled water and kept in 9 cm Petri dishes. The Petri dishes were enclosed in clear plastic bags to reduce the evaporation. During the course of the experiments, the seeds with any sign of fungal infection were sprayed with 0.05% Benomyl 50 Systemic Fungicide solution. The germinated seeds were counted and removed every 24 h. The seeds were considered germinated when the radicle was no less than 2 mm in length. These Un-germinated seeds at the end of the germination test were used by TZ test for viability. The seed viability of each collection was then corrected using germination data. The germinated seeds were incubated at 30/20 °C with light. Seedling length, as an indicator of seed vigour, was measured after 7 d (Vertucci et al., 1990). Seed storage conditions 3.2.2.1 Effects of moisture and temperature on seed longevity during storage Two chokecherry and two pin cherry seed collections: CHK 1410, CHK 6259, PIN 1298, PIN 1618 were used for this experiment (Table 3-1). The seeds obtained from 2010 were 30 stored at various storage conditions with target seed moisture contents (MC) of 1-3% and 7-8%, respectively, within one month after receiving. The target seed moisture content was achieved by placing seeds in sealed glass desiccators with re-generable humidity sponges (VWR international, Mississauga, Ontario, Canada). They were then stored in separate vacuum desiccators. Six spot humidity indicator cards (6HIC200-SCC, Static Control Components, USA) and Incand multi-channel in-out thermo-hydrometers (Traceable® 15551-258, Control Company, USA) were placed in desiccators to monitor relative humidity (RH) and temperature, respectively. The RH inside desiccators was maintained at 20 % and 30 % for target seed moisture contents 1-3 % and 7-8 %, respectively, by changing humidity sponges when needed. Three replicates were used for each storage treatment. 3.2.2.2 Gas storage experiment In the N2 treatment, air in desiccators was drawn out and N2 was injected into desiccators, which was repeated three times. A small balloon was placed inside the desiccator as an indicator for air pressure. N2 was replaced monthly. The seeds with moisture content of 78% and stored at room temperature in air are set to be the control group. Artificial aging Seventeen collections of six native shrub species from boreal forest region, BEAR 1117, BEAR 1618, BUF 14903, BUF1424, BUF 4906, BUF 9134, BUF8484, CHK 1410, CHK 1114, PIN 1298, PIN 8484, DOG 3119, DOG 3259, DOG 6930, DOG 9314, LBC 7278 and LBC 3119, were used for this experiment. The seeds were first rehydrated at 22.5 °C with 45% RH, and then aged at 45 °C with 60% RH by using lithium chloride to provide the desired RH environments (Zhang et al., 1997; Rodo et al., 2003). 31 3.2.3.1 Rehydration Seeds were placed in paper envelopes over chemical-porcelain desiccator plates placed in sealed KIMAX desiccators with detachable stopcock valve (VWR international, Mississauga, Ontario, Canada) for four weeks, following a procedure developed by Butler (2009). The 45% RH inside the desiccator was generated by placing 1L 40.5 % w/v lithium chloride solution at the bottom of the desiccator. Seed moisture content was monitored every two days. 3.2.3.2 Accelerated seed aging Equilibrated seeds were subject to accelerated aging treatments in growth chamber (Sanyo Versatile Environment Chamber MLR-350H, Sanyo Scientific, USA) set at 60 % RH, 45°C on chemical-porcelain desiccator plates (VWR desiccator plates, VWR International, Mississauga, Ontario, Canada) in sealed glass desiccators (KIMAX Desiccators with detachable stopcock valve, Kimble Chase) following a method described by Kochanek (2009). The 60 % RH was generated by 1L, 30 % w/v LiCl solution placed at the bottom of the desiccator. The relative humidity and temperature inside the desiccator monitored by using radio-signal remote hygrometer/thermometer (Traceable® 15551-258, VWR International, Mississauga, Ontario, Canada). Three samples of 25-30 seeds for each collection were removed after each of 0, 5, 10, 15, and 20 d, respectively, for seed viability, germination, electrolyte conductivity and protein analysis. This experiment was repeated once. 0 d aged seeds are considered to be controlled group. 32 Biochemical and molecular changes during seed storage 3.2.4.1 Analysis of electrolyte conductivity Three replicates of 15 seeds were weighted and soaked in 10 mL distilled water for 48 h at 22.5 °C (Baalbaki et al., 2009). The conductivity of seed soaked water was measured using an Oakton portable waterproof pH/CON 300 Meter (Oakton Instruments, Vernon Hills, IL, USA) after 0, 2, 5, 12, 24 and 48 h soaking, respectively. Total ion leakage was expressed as per g of seeds (μS cm-1g-1). Average electrolyte conductivity was calculated using mean and SE of 0, 2, 5, 12, 24 and 48 h ion electrolyte conductivity measurements. 3.2.4.2 Phenol extraction of seed proteins Total proteins from seeds were extracted using a modified phenol extraction procedure described by Van Etten et al (1979). Seed samples (0.5 g) were pulverized by mortar and pestle grinding, and then transferred to test tubes containing 50 mg polyvinylpolypyrrolidone (PVPP). In rapid succession, 2.5 mL of cold (4 °C) extraction buffer (250 mM Tris-HCl, pH 7.5, 700 mM sucrose, 100 mM KCl, 50 mM EDTA) and 25 μl β-mercaptoethanol were added. Samples were then homogenized for 30 sec using a Polytron homogenizer (Polytron Corp, Elkhart, Ind. USA) at high-speed setting. Thereafter, 5 mL of Tris-HCl (Molarity mass: 121.4 g mol−1) buffered phenol (pH 7.9) was added and homogenates were vortexed for 2 min. After centrifugation at 5,000 ×g for 30 min, the upper phenol layer was recovered. To further purify the phenol-soluble proteins, the phenol solution was re-extracted twice adding an equal volume extraction buffer, vortexing for 1 min followed by 20 min centrifugation at 5,000 ×g. A 12.5 mL cold methanol solution containing 100 mM ammonium acetate and 10 mM β- 33 mercaptoethanol was added to the phenol solution followed by overnight precipitation of proteins at 4 °C. Precipitated proteins were recovered by centrifugation at 12,000 ×g for 10 min and washed twice with 1 mL methanol, and twice with 1 mL acetone containing 10 mM βmercaptoethanol. Sample protein (dissolved in sample buffer) concentration was determined in triplicates by a dye-binding assay (Bradford, Bio-Rad. Hercules, CA, USA) using Coomassie Blue reagent (Bradford, 1976). 3.2.4.3 Tris-HCl buffer extraction of seed proteins Seed samples (1 g) were crushed in liquid nitrogen into fine powder using a mortar. Proteins were extracted from 500 mg powder by re-suspension in 2 mL extraction buffer (0.5 M Tris-HCl pH 6.8, 10 % (w/v) sodium-dodecyl-sulphate, 10 % (v/v) glycerol, 25 μL β-mercaptoethanol and 0.05 % bromophenol blue) followed by boiling for 5 min, cooling on ice for 5 min and centrifugation at 12,500 ×g, 12 min, room temperature. The protein concentration in soluble extract was determined in triplicates using a Coomassie brilliant blue dye-binding assay (Bradford, 1976). 3.2.4.4 SDS-PAGE Protein samples (35 μg) were analyzed by one-dimensional sodium-dodecyl-sulphate polyacrylamide gel electrophoresis (SDS-PAGE), as described (Demeke et al., 1997). For SDS-PAGE, the seed protein pellet was air-dried, re-suspended in SDS buffer (25 mM Tris, pH 7.5, 1% (w/v) SDS, 10% (v/v) glycerol, 5% (v/v) β-mercaptoethanol, and 0.002% (w/v) bromphenol blue), and boiled for 2 min. The 12% resolving gel contained acrylamide/ bis-acrylamide (37.5:1), 1.5 M Tris-HCl pH 8.8, 10% (w/v) sodium-dodecylsulphate, 10% ammonium persulphate, 34 and 0.05% N, N, N’, N’- tetramethylethylenediamine (TEMED). The 5% stacking gel contained 30% acrylamide/ bisacrylamide, 1 M Tris-HCl pH 6.8, 10% (w/v) sodium-dodecyl-sulphate, 10% ammonium persulphate and 0.05% TEMED. Running buffer contained 25 mM TRISbase, 192 mM glycine and 0.1% sodium-dodecyl-sulphate. A 35 μL of the extracted protein was loaded and proteins were separated using a Bio-Rad electrophoresis unit (Protean II, Bio-Rad. Hercules, CA, USA) for 15 h at 10 mA. Following electrophoresis, the stacking gel was removed and resolving gel was soaked in fixative (40% methanol, 10% glacial acetic acid) for 1/2 h. Separated polypeptides were then visualized by Coomassie blue staining as described by Fenner (1975). The gel was destained by agitation in 40% methanol, 10% glacial acetic acid) solution for 4 to 8 h as described by Demeke (1997). 3.2.4.5 Western blotting of dehydrins The stacking gel was removed from the SDS-PAGE gel with separated polypeptides and a notch was made at the bottom left corner to mark gel orientation. The gel was equilibrated in transfer buffer (40 mM TRIS/ 20 mM NaAc3H2O pH 7.4, 2 mM EDTA, 20% methanol, 0.05% (w/v) sodium-dodecyl-sulphate) for 30 min. Four, 1.5 mm blotting papers and 1 nitrocellulose (NC) membrane (0.45 m, GE Healthcare, Montreal, Quebec, Canada) pre-soaked in transfer buffer were assembled into a sandwich in tray with transfer buffer to minimize the risk of trapping bubbles during assembly. The transfer sandwich was assembled as follows: support pad, two sheets blotting paper, nitrocellulose membrane, polyacrylamide gel, two sheets blotting papers and support pad. The complete sandwich was placed in the transfer tank (Protean II, Bio-Rad. Hercules, CA, USA) with the membrane closest to the positive electrode, and the tank was filled 35 with cooled transfer buffer (4 °C). Electro-blot was done at 10 volts with 1.4-1.7 v/cm for at least 4 h. Membrane was dried at room temperature and stored in a dry place (Ganeshan et al., 2008). The membrane was placed in 200 mL blocking buffer [5% (w/v) low fat Carnation Milk, 137 mM NaCl, 2.68 mM KCl, 10 mM Na2HPO4/1.76 mM KH2PO4 pH 7.4, 0.1% Tween 20], and incubated with slow agitation for at least 2 h at room temperature Then the nitrocellulose membrane was incubated with 50 mL 1:5,000 diluted anti-dehydrin antibodies (StressGen, Ann Arbor, Michigan, USA) in blocking buffer for at least 2 h (Ganeshan et al., 2008). To remove excess primary antibodies, the membrane was washed four times with blocking buffer. The membrane was then incubated for 2 h with 50 mL 1:5000 diluted secondary antibodies (alkaline phosphatase labelled goat anti-rabbit IgG (KPL, Inc., Maryland, USA) in blocking buffer with slow agitation. The membrane was washed four times with blocking buffer, and then washed three times with New Buffer [50 mM TrisHCl (pH 7.5), 150 mM NaCl]. The BCIP (5-bromo-4-chloro-3'-indolyphosphate p-toluidine salt) -NBT (nitro-blue tetrazolium chloride) color substrate solution was prepared just prior to use and protected from light. NBT stock (75 mg/mL Nitroblue tetrazolium in 70% N, Ndimethylformamide) was diluted in color development solution to a final concentration of 0.3 mg/mL BCIP (50 mg/mL) was added to a final concentration of 0.15 mg/mL. To remove excess buffer, the membrane was blotted with Whatman 3 mm paper, and then immersed in 25 mL color development solution for color band developement in darkness. When desired development was reached, usually within 20-30 min, membrane was rinsed 36 twice with New buffer before immersing the membrane in (20 mM Tris-HCl (pH 2.9), 1 mM EDTA) to stop color development (Ganeshan et al., 2008). Data analysis The speed of germination was calculated by using germination rate index (G.R.I.) (Caldwell, 1960; Brar et al., 1991), which is computed by using the following formula: 𝑁 𝑖 G.R.I=∑𝑐𝑖=1 𝑁 ∗𝑇 *100% 𝑡 𝑖 Equation 3-2 Where, Ni is the number of seeds germinated in day i, Nt is the total number of seed germination, Ti is the ith day since germination started and c is the number of days counted in the experiment (Baalbaki et al., 2009). Seed vigour index (S.V.I) was calculated using the following formula (Baalbaki et al., 2009): S.V.I= Final germination percentage* Seedling length Equation 3-3 Mean seeds germination time (MGT) was proposed by Ellis and Roberts (1980) as an indicator of vigour, calculated as following: MGT = ∑ Ni Ti ∑ Ni Equation 3-4 where Ni is the number of normal seedlings present on day i, Ti is the ith day since germination begins and ΣNi is final germination. The Viability after germination (including germinated seeds) after germination test (VAG) was calculated as following: 37 𝑁𝐺 +𝑁𝑉 VAG = 𝑁𝐴 *100 % Equation 3-5 where NG is the number of total germinated seeds; NV is the number of viable ungerminated seeds, NA is the total number of seeds. Analysis of Variance was conducted using general linear model (GLM) to determine the difference in one-year storage experiment and artificial aging treatments on seed viability, final germination percentage, mean germination time, electrolyte conductivity, Germination rate index and vigour index for shrub species. Seed species, storage temperature, germination temperature, gas, and moisture content were considered as fixed factors in the storage experiment; while duration of aging and species were considered as fixed factors in artificial aging test. Final germination percentage, viability, electrolyte conductivity value, mean germination time, un-germinated viable seeds, germination rate index, vigour index and radicle / hypocotyl were treated as response variables. Pearson’s bivariate correlations were performed for all the measurement in accelerated seed aging test. All analysis for this study was done using in R 3.0.2 (R Development Core Team 2013). 38 4 4.1 RESULTS Effect of seed storage conditions on seed physiological properties Storage of chokecherry seeds Storage of two chokecherry collections under different conditions revealed no significant difference (P>0.05) on most vigour and viability attributes of seeds after one-year (Figure 4-1, Table 4-1, Table 4-2). Furthermore, total germination percentage was not significantly (P>0.05) altered upon one-year storage. For the CHK 1410 seed lot, the viability after germination percentage (including germinated seeds) was 30-58% at 5/15 °C, and 7-61% at 15/25 °C, respectively. For CHK 6259, seed viability after germination percentage (including germinated seeds) was 40-67% at 5/15 °C, and 45-71% at 15/25 °C, respectably. For CHK 1410, seeds stored in air at 22.5 °C with 7-8% as well as seeds stored in N2 at 4 °C showed significant higher values in percentage of un-germinated but viable seeds than seeds stored in air at -20 °C with 1-3% moisture content when germinated at 15/5 °C. For CHK 6259, seeds stored in air at 4 °C with 7-8% moisture content showed significantly higher percentage of un-germinated but viable seeds than seeds stored in air at -20 °C with 1-3% moisture content, 25 °C with two moisture contents and in N2 at 4 °C when germinated at 25/15 °C. 39 100 CHK 1410 15/5 CHK 1410 15/5 80 ab ab ab a a 60 ab ab 40 b 20 1000 CHK 1410 25/15 Ungerminated viable seeds (%) 60 40 20 NA 100 0 CHK 6259 15/5 CHK 6259 15/5 CHK 6259 25/15 CHK 6259 25/15 80 60 40 Viability after germination test (including germinated seeds) (%) CHK 1410 25/15 80 20 100 0 80 60 40 a 20 ab ab b b b b NA 0 A B C D E F G A H B C D E F G H Storage treatments o A: Air/-20 C/1-3% o E: Air/22.5 C/1-3% B: Air/-20 oC/7-8% o F: Air/22.5 C/7-8% C: Air/4 oC/1-3% o G: N2/4 C/7-8% D: Air/4 oC/7-8% H: N2/22.5 oC/7-8% Figure 4-1 Effects of one-year storage treatments on seed viability after germination percentage (including germinated seeds) (right) and percent of un-germinated but viable seeds (left) in two collections of chokecherry at two germination temperatures. Means with same letters within a collection, germination temperature and parameter are not significantly different at p≤0.05 40 Table 4-1 Effects of one-year storage treatments on seed vigour and viability in CHK 1410. Data are Means ± SE. Means with the same letters within a collection and parameter are not significantly different at P≤0.05. GT (15/5°C) GT (15/25°C) Gas UVS GRI VI UVS GRI G (%) G (%) (%) (%*d-1) (mm*%) (%) (%*d-1) Initial 93±3a 10±2a 33±17a 7/8 109±14a 92±5a 37±34a 29±34ab 1.3±1.1a 831±774a 28±36a 15±23a 3.7±3.4a -20 1/3 104±14a 96±4a 30±27a 23±5b 1.5±1.4a 731±635a 38±33a 12±14a 2.3±2.1a 7/8 106±3a 92±2a 16±17a 49±2ab 0.6±0.6a 393±352a 12±21a 3±5a 1.2±2.1a Air 22.5 1/3 112±25a 93±5a 10±9a 53±9a 1.1±1.5a 206±189a 27±29a 0±0a 2.1±2.6a 7/8 87±5a 83±5a 30±7a 43±21ab 1.5±0.2a 710±570a 32±41a 9±8a 2.3±3.1a 4 1/3 106±9a 96±2a 32±30a 28±18ab 1.0±1.0a 621±928a 24±29a 7±8a 1.9±1.9a 4 7/8 91±23a 93±7a 17±15a 54±9a 1.5±1.9a 373±578a 8±7a 20±28a 0.8±0.7a N2 22.5 7/8 105±12a 93±5a 26±37a 20±19b 1.6±2.7a 805±961a 28±45a 3±5a 3.0±4.9a T= storage temperature, MC=Seed moisture content, G=Final germination percentage, EC=Electrolyte conductivity, UVS= Un-germinated viable seeds, GT= Germination temperature, V= Viability, GRI= Germination rate index, index EC MC T(°C) (μS*cm- V (%) (%) 1 -1 g ) 41 VI (mm*%) 801±959a 1067±929a 474±822a 662±657a 833±976a 745±757a 255±274a 1043±1794a VI= Vigour Table 4-2 Effects of one-year storage treatments on seed vigour and viability in CHK 6259. Data are Means ± SE. Means with the same letters within a collection and parameter are not significantly different at P≤0.05. Gas T (°C) Initial MC (%) GT (15/5°C) EC (μS*cm1 -1 g ) V (%) - 98±1a GT (15/25°C) G (%) UVS (%) GRI (%*d-1) VI (mm*%) G (%) 16±5a - - - 53±4a UVS (%) GRI (%*d-1) VI (mm*%) - 42 6±5a 7/8 96±13a 95±3a 21±20a 38±3a 1.6±1.5a 478±500a 35±42a 2.3±2.0a 793±807a b -20 1/3 93±17a 95±4a 29±26a 26±13ab 2.4±2.6a 1040±979a 24±37a 2±3b 1.5±2.3a 936±1502a 7/8 107±23a 97±1a 17±22a 27±14ab 1.1±1.0a 233±222a 20±22a 2±3b 1.6±1.7a 958±1223a Air 22.5 1/3 115±16a 100±0a 13±22a 44±32a 0.7±1.3a 388±672a 25±25a 2±3b 2.2±2.0a 688±678a 17±2 7/8 98±14a 97±1a 37±36a 31±8ab 1.5±1.6a 699±623a 21±28a 1.8±2.6a 320±437a 2a 4 4±7a 1/3 93±17a 99±1a 45±40a 19±3b 3.8±3.3a 940±851a 33±29a 1.9±1.9a 877±774a b 4 7/8 115±11a 95±3a 31±28a 38±20a 2.4±2.5a 774±677a 28±26a 2±3b 2.2±1.9a 806±750a N2 22.5 7/8 126±5a 98±2a 46±40a 31±28ab 2.0±1.8a 1364±1186a 28±37a 0±0b 2.1±2.5a 300±325a T= storage temperature, MC=Seed moisture content, G=Final germination percentage, EC=Electrolyte conductivity, UVS= Un-germinated viable seeds, GT= Germination temperature, V= Viability, GRI= Germination rate index, VI= Vigour index Storage of pin cherry seeds The germination and viability of PIN 1298 did not show any significant difference (P>0.05) between fresh and one-year-stored seeds (Table 4-3, Table 4-4). The highest vigour and highest total germination percentage was found in PIN 1298 stored at -20 °C with 1-3% moisture content comparing to other storage treatments (Figure 4-2). The seed viability after germination (including germinated seeds) was significantly lower than the viability before germination. For PIN 1298, seed viability after germination percentage (including germinated seeds) was 9-60% at 5/15 °C, and 17-34% at 15/25 °C, respectively. For PIN 1298, seeds stored in air with 1-3% at – 20 °C and 4 °C showed higher percentage in un-germinated but viable seed than seeds stored in N2 at 22.5 °C. For PIN 1618, seeds stored in air with 1-3% moisture content at – 20 °C had higher value in un-germinated but viable seeds than seeds stored at 22.5 °C. There was no germination at 25/15 °C for PIN 1298 stored at 4 °C with 1-3% moisture content, and PIN 1618 stored at 4 °C with 7-8% moisture content at both 15/5 °C and 25/15 °C, or stored at 22.5 °C with 1-3% moisture content, stored in nitrogen with germination temperature of 15/5 °C. 43 80 PIN 1298 15/5 60 a PIN 1298 15/5 ab ab a ab bc 40 b bc b bc b b bc bc 20 c b 80 0 ab ab ab a ab ab Ungerminated viable seeds (%) 40 b 20 80 0 PIN 1618 15/5 PIN 1618 15/5 60 40 a a ab ab ab ab ab 20 b ab ab ab ab ab b ab b 80 0 PIN 1618 25/15 Viability after germination (including germinated seeds) (%) 60 PIN 1298 25/15 PIN 1298 25/15 a PIN 1618 25/15 60 40 a a ab ab ab ab 20 b b 0 A B C D E F G H A B C D E F G H Storage treatments o A: Air/-20 C/1-3% B: Air/-20 oC/7-8% C: Air/4 oC/1-3% D: Air/4 oC/7-8% E: Air/22.5 oC/1-3% F: Air/22.5 oC/7-8% G: N2/4 oC/7-8% H: N 2/22.5 oC/7-8% Figure 4-2 Effects of one-year storage treatments on seed viability after germination percentage (including germinated seeds) (right) and percent of un-germinated but viable seeds (left) in two collections of pin cherry at two germination temperatures. Means with same letters within a collection, germination temperature and parameter are not significantly different at p≤0.05. 44 Table 4-3 Effects of one-year storage treatments on seed vigour and viability in PIN 1298. Data are Means ± SE. Means with the same letters within a collection and parameter are not significantly different at P≤0.05. Gas EC T MC (μS*cm(°C) (%) 1 -1 g ) Initial Air -20 GT (15/5°C) V (%) G (%) UVS (%) GRI (%*d-1) GT (15/25°C) VI (mm*%) G (%) UVS (%) GRI (%*d-1) VI (mm*%) 45 95±2a 8±2b 5±3a 7/8 190±28a 88±4ab 9±8b 15±4bc 0.5±0.5a 476±541b 7±3a 26±16ab 0.5±0.3a 62±17a 1/3 204±14a 96±4a 24±4a 35±13a 1.9±1.3b 1354±56a 3±5a 29±18ab 1.2±2.1a 96±166a 22.5 7/8 206±39a 93±4ab 1±8b 8±0c 0.1±0.2a 27±46b 1±2a 27±22ab 0.2±0.3a 129±223a 1/3 189±37a 92±4ab 4±9b 17±12bc 0.2±0.2a 246±262b 4±0a 29±19ab 0.4±0.1a 74±27a 4 7/8 185±16a 87±5ab 5±5b 21±13bc 1.8±2.8a 485±767b 3±0a 16±18ab 1.0±1.1a 258±357a 1/3 219±52a 92±0ab 8±4b 31±10ab 0.6±1.1a 116±200b 0±0a 35±25a N2 4 7/8 182±4a 83±4b 7±2b 12±7c 0.3±0.3a 114±130b 8±5a 33±16a 0.2±0.4a 59±102a 22.5 7/8 192±24a 97±1a 13±2b 16±6bc 0.3±0.2a 143±58b 7±2a 11±3b 0.7±0.5a 305±384a T= storage temperature, MC=Seed moisture content, G=Final germination percentage, EC= Electrolyte conductivity, UVS= Un-germinated viable seeds, GT= Germination temperature, V= Viability, GRI= Germination rate index, VI= Vigour index Table 4-4 Effects of one-year storage treatments on seed vigour and viability in PIN 1618. Data are Means ± SE. Means with the same letters within a collection and parameter are not significantly different at P≤0.05. Gas T (°C) Initial -20 MC (%) EC (μS*cm1 -1 g ) GT (15/5°C) V (%) G (%) UVS (%) GRI (%*d-1) GT (15/25°C) VI (mm*%) G (%) UVS (%) GRI (%*d-1) VI (mm*%) 46 98±1a 25±3a 8±1a Air 7/8 165±30a 97±1a 3±5b 9±11ab 0.1±0.1a 19±32a 1±2b 19±10a 0.2±0.3a 70±121a 1/3 158±11a 95±3a 2±3b 18±14a 0.3±0.5a 116±202a 3±5b 19±18a 0.5±0.8a 61±105a 22.5 7/8 145±10a 99±1a 0±2b 8±4ab 0.1±0.1a 5±9a 1±0b 8±11b 0.1±0.2a 7±12a 1/3 168±24a 97±3a 7±4b 1±4b 8±0b 0.2±0.4a 21±36a 4 7/8 166±19a 97±3a 14±12ab 10±6ab 1/3 156±13a 94±6a 1±0b 7±6b 0.1±0.1a 35±61a 3±2b 13±4ab 0.1±0.2a 59±102a N2 4 7/8 190±12a 94±6a 8±8ab 1±6b 13±10ab 0.4±0.6a 28±48a 22.5 7/8 175±4a 97±1a 15±9ab 4±2ab 3±5b 0.5±0.7a 110±156a T= storage temperature, MC=Seed moisture content, G=Final germination percentage, EC=Electrolyte electrolyte conductivity, UVS= Un-germinated viable seeds, GT= Germination temperature, V= Viability, GRI= Germination rate index, VI= Vigour index Analysis of seed protein profiles after one-year storage treatments 4.1.3.1 Comparison of two protein extraction methods Two methods were tested and compared for protein extraction from chokecherry and pin cherry seeds. Analysis of proteins extracted by phenol and Tris-HCl extraction methods by SDS-PAGE revealed both methods extracted polypeptides with a wide range of molecular weights from 10 to 120 kDa (Figure 4-3). However, the phenol extraction method showed slightly more polypeptide bands in the 15 and 80 kDa size range, and was therefore used in subsequent experiments. 4.1.3.2 Analysis of seed protein profiles after one year storage treatments Total phenol-soluble proteins were extracted from chokecherry seeds stored for one year under different combinations of temperature, humidity and gaseous environments. Western blot analyses using dehydrin specific antibodies revealed detecteble amounts of dehydrin proteins in seeds stored under different storage conditions (Figure 4-4). The highest abundance of the 25.9 kDa polypeptide band was observed in two N2 treatments stored at different temperatures with 7-8% moisture content, and air treatment stored at 20 °C with 7-8% moisture content; no band was detected above the 25.9 kDa for these three treatments. Seeds stored at room temperature (22.5°C ) in the air showed lower accumulation of 25.9 kDa dehydrin protein and seeds stored with 1-3% moisture content tended to have less dehydrin polypeptides with molecular masses lower than 25.9 kDa. Therefore, the different storage conditions had effects on the production of dehydrins. 47 Figure 4-3 SDS-PAGE analysis of chokecherry and pin cherry seed proteins. The proteins were extracted using Tris-HCl buffer (M2) or phenol (M1) extraction method. The left lane indicates unigram of standard polypeptides. CHK: chokecherry, PIN: pin cherry. Figure 4-4 Immunoblot analysis of dehydrins in chokecherry seeds upon different oneyear storage treatments. The western blot of total protein (35 μL/lane) was probed with antibodies against dehydrin proteins. The right lane indicates unigram of standard polypeptides 48 4.2 Accelerated seed aging Seed viability and germination changes during accelerated seed aging Seed viability before germination test decreased with increasing aging duration in both pin cherry and chokecherry collections (Figure 4-5). A significant decrease in viability and germination showed after 10 d aging PIN 1298 and CHK 1410. No seeds were viable in chokecherry and pin cherry after 25 d aging treatment. Both germination and viability (before and after germination test) declined during accelerated seed aging duration with high R2 (0.59-0.86) (Table 3-1). Seed viability after germination test, which included germinated seeds and un-germinated but viable seed, was lower than the viability before germination test. CHK 1410 collection showed a significant (P≤0.05) decline in seed viability after 5 d accelerated aging. The percentage of viable un-germinated seed was also significantly reduced after 10 d aging treatment in two chokecherry collections, and after 15 d in pin cherry (Table 4-5) 49 100 PIN 1298 CHK 1410 50 Germination &Viability (%) 80 60 40 20 0 0 10 Seed viability before germination test Seed total germination percentage Seed viability after germination test 20 30 0 10 20 30 Duration of aging (d) Figure 4-5 Observed (symbol) and simulated (solid line) seed viability and germination in chokecherry and pin cherry collections during artificial aging process at 45°C with 60 % RH. Values are mean ± SE (n=6). No germination was found in CHK 1410 and PIN 1298 collection after 10 d aging treatments (Figure 4-5). For CHK 1410, the total germination percentage was significantly reduced from 25% to 10% (P≤0.05); the germination rate index declined from 1.0 to 0.4% / d, and the vigour index decreased from 279 to 26 mm×% after 5 d aging treatment (Table 4-5). The length of radicle and hypocotyl also decreased with accelerated aging from 7 mm to 1 mm, and 9 mm to 1 mm after 5 d aging, respectively. No significant increase was found in the mean germination time between non-aged and 5 d aged seeds. For PIN 1298, the total germination percentages were 15% for 0 d and 5 d aged seeds (Table 4-5, Figure 4-5). No germination was observed after 10 d aging duration. No significant (P≤0.05) difference was found between non-aged and 5 d aged seeds in germination rate index, seedling length, vigour index, and mean germination time. Regression equations represent total germination percentage and viability [before and after (including germinated seeds) germination test] list in the Table 4-6. 51 Table 4-5 Seed germination rate index, seedling vigour and seed viability after various duration of accelerated seed aging treatment for chokecherry and pin cherry collections. Duration (d) GRI (% *d-1) R (mm) H (mm) TT (mm) VI (mm*%) UVS (n) MGT (d) 0 1.0±0.6a 7±6a 9±7a 16±12a 279±209a 3±1a 27±7a 5 0.4±0.3b 1±0b 1±0b 2±0b 26±15b 3±1a 19±10a 10 1±1b 15 0±1b 20 PIN 1298 0 0.7±0.7a 6±4a 9±5a 15±6a 262±264a 3±1a 30±8a 5 0.6±0.7a 4±4a 7±4a 11±8a 183±292a 2±1ab 25±6a 10 2±1bc 15 0±1c 20 R=Radicle length, H=Hypocotyl length, TT =Total seedling length, GRI = Germination rate index, VI = Vigour index, UVS = Ungerminated viable seed, MGT=Mean germination time; “-” indicates data are not available. Values are mean ± SE; values with the same letter within a collection and parameter are not significantly different at p≤0.05. Collections CHK 1410 52 TZ tests showed evenly stained entire embryo in non-aged chokecherry seeds (Figure 4-6.). After 10 d aging treatment, part of the embryo and cotyledon could not be stained. Embryo was completely unstained after 20-25 d aging treatment, which indicated the total loss of seed viability. Figure 4-6 Seed viability evaluation of chokecherry. Half seeds of CHK 1410 accession stained with TZ at various days of aging. 53 Table 4-6 Regression equations for seed viability and total germination percentage as a function of artificial aging time. Equation R2 P-value 2 VBG=88.04-2.65t-0.03t 0.84 <0.0001 2 VAG=55.62-5.36t+0.13 t 0.84 <0.0001 CHK 1410 2 G=22.56-2.76t-0.08 t 0.60 <0.0001 2 VBG=100-3.89t-0.02 t 0.81 <0.0001 2 VAG=44.43-3.41t+0.06 t 0.76 <0.0001 PIN 1298 2 G=18.25-1.89t-0.05 t 0.59 <0.0001 2 VBG=91.67-2.15t-0.06 t 0.93 <0.0001 2 VAG=68.80-5.15t+0.09 t 0.84 <0.0001 BUF 1424 G=57.23-4.50t+0.08 t2 0.75 <0.0001 2 VBG=92.86-2.21t+0.06 t 0.92 <0.0001 2 BUF 14903 VAG=67.57-5.01t+0.08 t 0.75 <0.0001 2 G=51.69-4.43t+0.08 t 0.69 <0.0001 2 VBG=97.20-1.59t+0.09 t 0.97 <0.0001 2 VAG=47.39-3.91t+0.09 t 0.73 <0.0001 BUF 9134 2 G=29.81-3.27t+0.09 t 0.79 <0.0001 2 VBG=90.89-2.16t-0.07 t 0.91 <0.0001 2 VAG=67.34-5.71t+0.12 t 0.76 <0.0001 BUF 4096 2 G=52.82-4.62t+0.09 t 0.68 <0.0001 2 VBG=61.24-2.47t+0.26 t 0.82 <0.0001 2 VAG=59.64-5.03t+0.11 t 0.75 <0.0001 DOG 3259 2 G=36.98-3.43t+0.13 t 0.69 <0.0001 2 VBG=76.00-1.21t+0.13 t 0.78 <0.0001 2 VAG=72.64-6.71t+0.16 t 0.87 <0.0001 DOG 3119 2 G=33.02-4.11t+0.12 t 0.82 <0.0001 2 VBG=64.38-0.52t+0.12 t 0.87 <0.0001 2 VAG=59.01-4.44t+0.08 t 0.76 <0.0001 DOG 6930 2 G=55.67-6.65t+0.19 t 0.89 <0.0001 2 VBG=71.62-0.15t+0.18 t 0.94 <0.0001 2 VAG=51.18-5.15t+0.10 t 0.78 <0.0001 DOG 3914 2 G=41.81-5.01t+0.14 t 0.74 <0.0001 VAG: Viability after germination (including germinated seeds), VBG: Viability before germination, G: total germination percentage Species 54 All buffalo berry collections showed high viability before aging treatment, especially BUF 14903 with 100% viability before germination test (Figure 4-7). Seed viability of BUF 1424 and BUF 4096 showed significant (P≤0.05) decline after 10 d aging while that of BUF 14093 and BUF 9134 decreased after 5 d aging treatment. All buffalo berry collections lost their viability after 25 d accelerated aging. Seed viability after germination (including germinated seeds) was lower than the viability before germination test in all buffalo berry collections. In BUF 4096, BUF 1424, and BUF 14093 collections, viability after germination (including germinated seeds) decreased significantly after 10 d aging; seed viability after germination (including germinated seeds) declined after 5 d aging in BUF 9134 (Table 4-7). The percentage of viable but un-germinated seeds was also significantly reduced after 5 d for BUF 9134, 15 d for BUF 14093, BUF 1424, and BUF 4906, respectively. Regression equations represent total germination percentage and viability [before and after (including germinated seeds) germination test] list in the Table 4-6. 55 100 BUF 4096 BUF 1424 80 60 Germination & Viability (%) 40 20 0 100 BUF 14093 BUF 9314 80 60 40 20 0 0 10 20 30 0 10 20 30 Duration of aging (d) Seed viability before germination test Seed total germination percentage Seed viability after germination Figure 4-7 Observed (symbol) and simulated (solid line) seed viability and germination in four buffalo berry collections and during artificial aging process at 45 °C with 60% RH. Values are mean ± SE (n=6). 56 Seeds failed to germinate in BUF 1424 and BUF 4906 after 20 d aging treatments, and BUF 14903 and BUF 9134 after 15 d aging treatments (Figure 4-7). The total germination percentage of non-aged seeds was high, 50%, 42%, 45%, for BUF 1424, BUF 14093, and BUF 4906 collection, respectively. In BUF 1424, BUF 14903, and BUF 4906, no significant decrease was found between 0 d and 5 d aged seeds in total germination percentage (P≤0.05). After 10 d of aging treatment, however, the total germination percentage was reduced significantly (P≤0.05). In BUF 9134 collection, total germination percentage was significantly reduced from 30% to 19% after 5 d of aging treatment (P≤0.05). The germination rate index was significantly (P≤0.05) decreased from 2.7-5.2 to 0.2-0.4 %/d after 10 d accelerated seed aging treatments (Table 4-7). In BUF 9134 collection, the vigour index was significantly decreased from 249 to 103 mm*% after 5 d aging treatments. In BUF 14093, BUF 4906, and BUF 1424 collections, the average vigour index was significantly decreased from 348-532 to 18-20 mm*% after 10 d aging treatment (P<0.05). Hypocotyl and seedling length was significantly reduced after 15 d aging treatment in BUF 1424 and BUF 4096 (P<0.05). However, no significant difference was found in radicle length in the accelerated aging duration in all buffalo berry collections (P >0.05). No significant difference was found in the mean germination for BUF 1424 collection. After 10 d aging treatments, the mean germination time increased significantly from 11 to 26 d in BUF 14903 and from 10 to 21 d in BUF 9134, respectively. In BUF 4906 collection, significant difference was found after 15 d aging treatment with an increase in the meantime from 12 d (non-aged) to 21 d (15 d aged). 57 Table 4-7 Seed germination rate index, seedling vigour and seed viability after various durations of accelerated seed aging treatment for four buffalo berry collections Duration (d) GRI (% *d-1) VI (mm*%) UVS (%) R (mm) H (mm) TT (mm) MGT 0 4.8±1.3a 348±96a 13±6a 3±3a 5±4a 8±6a 13±4a 5 4.8±1.1a 284±93a 4±3ab 2±1a 3±3ab 6±4ab 14±2a 10 0.4±0.5b 32±50b 10±13ab 2±1a 2±2ab 4±2ab 18±5a 15 0.2±0.4b 28±45b 3±5b 1±1a 1±1b 2±1b 18±0a 20 3±4b BUF 14093 0 5.0±1.2a 403±195a 16±4a 4±4a 6±5a 10±8a 11±2a 5 4.7±2.1a 447±272a 12±8ab 3±2a 6±4a 9±6a 13±2a 10 0.2±0.3b 18±21b 11±12ab 3±2a 4±2a 7±3a 26±12b 15 7±4b 20 4±5b BUF 4096 0 5.2±2.4a 532±409a 15±13a 4±3a 7±5a 11±7a 12±3a 5 3.9±1.1a 399±195a 8±12ab 3±2a 5±4ab 8±5ab 15±3a 10 0.3±0.3b 20±30b 9±10ab 2±2a 3±1ab 5±3ab 15±5a 15 0.1±0.2b 13±33b 2±4b 1±1a 1±1b 2±0b 31±9b 20 3±4b BUF 9134 0 2.7±1.5a 249±144a 22±9a 3±2a 6±3a 8±5a 10±2a 5 2.0±0.8a 103±88b 11±5b 2±1a 3±3a 5±3a 11±3a 10 0.2±0.5b 13±22b 13±9b 2±1a 2±2a 4±2a 21±14b 15 8±10b 20 3±6b R=Radicle length, H=Hypocotyl length, TT =Total seedling length, GRI = Germination rate index, VI = Vigour index, UVS = Ungerminated viable seed, MGT=Mean germination time; “-” indicates data are not available. Values are mean ± SE; values with the same letter within a collection and parameter are not significantly different at p≤0.05. Collections BUF 1424 58 The initial seed viability (before germination test) was around 80% before the aging test, and then decreased in all collections of dogwood with increased aging duration (Figure 4-8). After 10 d aging treatment, DOG 3914, DOG 6930 and DOG 3119 showed significant decline in seed viability (before germination test) (P<0.05); and DOG 3259 decreased after 15 d accelerated aging. After 25 d aging, all dogwood collections lost their viability. In non-aged seeds, the viability after germination (including germinated seeds) was similar to before germination viability in non-aged DOG 3119, DOG 3259 and DOG 6930 collections, while the viability after germination (including germinated seeds) of DOG 3914 was significant lower than the original one. Seed viability after germination (including germinated seeds) decreased after 5 d aging for DOG 3119 and DOG 3419, and 10 d aging for DOG 3259 and DOG 6930, respectively. The percentage of un-germinated but viable seeds declined after accelerated aging of 10 d for DOG 3259, and 20 d for DOG 6930, DOG 3914, DOG 3119, respectively. Regression equations represent total germination percentage and viability [before and after (including germinated seeds) germination test] list in the Table 4-6. 59 80 DOG 3259 DOG 3119 60 40 Germination & Viability (%) 20 0 80 DOG 6930 DOG 3914 60 40 20 0 0 5 10 15 20 25 0 5 10 15 20 25 Duration of aging (d) Seed viability before germination test Seed total germination percentage Seed viability after germination Figure 4-8 Observed (symbol) and simulated (solid line) seed viability and germination in four dogwood collections during artificial aging process at 45 °C with 60 % RH. Values are mean ± SE (n=6). 60 No seeds germinated for DOG 6930 and DOG 3259 collections after 15 d aging treatment and for DOG 3119 and DOG 3914 after 10 d aging treatments (Figure 4-8). The total germination percentage of non-aged seeds were 53% for DOG 6930, 42% for DOG 3914, 32% for DOG 3119, and 36% for DOG 3259, respectively. Total germination percentage were significantly reduced to 36% for DOG 6930 (P<0.05), 28% for DOG 3914, and 20 for DOG 3119 after 5 d aging treatments, respectively. In DOG 3259 collection, no significant difference was observed between 0 d and 5 d aged seed in total germination percentage (P>0.05), and significant difference was found after 10 d aging treatments (P<0.05). There was significant (P<0.05) difference in germination rate index of all dogwood collections after 10 d accelerated aging treatments (Table 4-8). The four collections gradually reached their germination peak around 40-45 d after three weeks warm stratification with the average germination index of 0.1-10.8 %/d. Seed vigour index was observed significantly decreased in DOG 6930, DOG 3914, and DOG 3119 after 5 d aging treatments (P<0.05), and 10 d for DOG 3259. Seed radicle length, hypocotyl length, seedling length, and radicle -hypocotyl length also showed significant decrease after the 10 d aging treatments (P<0.05). No significant increase was observed in mean germination time for all dogwood collections in non-aged and 5 d aged seeds. The mean germination time increased significantly from 10 to 23 d for DOG 6930 and DOG 3259 after 10 d accelerated aging (P<0.05), respectively. 61 Table 4-8 Seed germination rate index, seedling vigour and seed viability after various duration of accelerated seed aging treatment for four dogwood collections. Duration (d) GRI (%*d-1) R (mm) H (mm) TT (mm) VI (mm* %) UVS (n) MGT (d) 0 10.8±6.7a 7±3a 13±6a 19±8a 1003±225a 3±1a 11±5a 5 4.4±0.8b 4±2a 9±5a 13±6a 457±79b 1±1b 12±5a 10 0.1±0.2b 0±1b 2±4a 2±5a 14±35c 2±1b 24±2b 15 1±1b 20 1±1b DOG 3259 0 4.7±3.1a 4±2a 15±12a 20±13a 577±247a 2±1a 14±2a 5 3.4±0.4a 3±2a 9±5ab 12±7ab 450±208a 1±1b 14±8a 10 0.1±0.3b 2±1a 2±1b 4±2b 9±22b 1±1b 24±1b 15 1±1b 20 DOG 3914 0 9.9±3.6a 5±3a 12±6a 17±8a 625±182a 2±1a 11±9a 5 7.1±6.2a 4±2a 10±5a 14±6a 393±114b 2±1ab 10±4a 10 2±2ab 15 1±1ab 20 DOG 3119 0 7.4±4.6a 5±3a 13±10a 18±12a 570±259a 2±1a 10±2a 5 3.4±1.2a 3±2a 9±5a 12±7a 252±199b 2±1a 10±3a 10 1±1a 15 1±1a 20 R=Radicle length, H=Hypocotyl length, TT =Total seedling length, GRI = Germination rate index, VI = Vigour index, UVS = Un-germinated viable seed, MGT=Mean germination time; “-” indicates data are not available. Values are mean ± SE; values with the same letter within a collection and parameter are not significantly different at p≤0.05. Collections DOG 6930 62 Electrolyte conductivity changes during accelerated seed aging The electrolyte conductivity of buffalo berry seeds soaked in water increased with increasing aging and soaking time in all collections (Figure 4-9). Significant difference was found in electrolyte conductivity after accelerated aging of 20 d for BUF 4093, 15 d for BUF 4096, 5 d for BUF 1424, 10 d for BUF 9134 comparing to the control (P<0.05), respectively. After 20 d aging treatment, average electrolyte conductivity was elevated to 632, 276, 312, and 539 μS∙cm-1g-1 in BUF 1424, BUF 14093, BUF 4906, and BUF 9134, respectively. For BUF 9134 and BUF 1424, seed electrolyte conductivity was significantly higher in 20 d aged seeds than the 0 d aged seeds when soaked for 48 h with distilled, deionized water (P<0.05). For BUF 9134, significant difference was found after 10 d ageing treatments after soaked for 2-48 h (P<0.05). For BUF 4906, however, only the electrolyte conductivity of 0 h and 12 h soaking didn’t show significant difference among different aging duration. In BUF 4096, no significant difference was found in electrolyte conductivity among 0-10 d aged seeds after soaked for 0-12 h. However, significant difference was found between 0 d and aged seeds after soaked for 48 h (P<0.05). In BUF 14903, no significant difference was found in electrolyte conductivity of 0-15 d aged seed’s when soaked for 0-24 h. After soaked for 48 h, significant difference was found between non-aged and aged seeds (P<0.05). 63 1000 800 600 BUF 14093 BUF 4906 0d 5d 10 d 15 d 20 d * * * -1 -1 Leakage conductivity ( s*cm g ) * * 400 * * * * 200 10000 BUF 9134 BUF 1424 800 * 600 * * * * * * * 2 5 * * * 400 200 0 0 2 5 12 24 0 48 12 24 48 Soaking time (h) Figure 4-9 Electrolyte conductivity of four buffalo berry collections during artificial aging at 45°C with 60% RH. Values are mean ± SE (n=6). ‘*’ indicates significant difference among aging time within the same soaking time (P ≤ 0.05). 64 The electrolyte conductivity of dogwood seed increased with soaking time in all collections (Figure 4-10). For DOG 3914, the highest electrolyte conductivity appeared to 20 d aged seeds, however, 5 d and 10 d aged seeds showed significantly higher than other aged seeds after soaking for 24 h (P<0.05). In DOG 3119, significant difference was found after 10 d aging treatment in 0 h soaking, after 20 d aging during 2-5 h soaking, and after 15 d aging treatment during 12-48 h soaking (P<0.05). For DOG 3259, significant difference was observed after 5 d aging treatment during 0 and 12-48 h’s soaking; significant difference was also found after 10 d aging during 2-5 h soaking (P<0.05). For DOG 6930, no significant difference was found among electrolyte conductivity of different aging duration when soaking for same time until 24 h’s soaking. After 20 d aging treatments, the average electrolyte conductivity was elevated to 201, 168, 296, and 118 μS∙cm-1g-1 in DOG 6930, DOG 3259, DOG 3914 and DOG 3119 respectively .The leakage was significantly elevated after 15 d aging treatment for DOG 3119, 5 d for DOG 3259, and 10 d for DOG 3914, respectively (P≤0.05). 65 600 DOG 3119 DOG 3259 0d 5d 500 * 10 d 15 d 20 d 400 * -1 -1 Leakage conductivity ( s*cm g ) 300 200 * * * * * * * 100 0 600 * DOG 3914 * DOG 6930 * 500 * Col Col Col Col Col * 400 300 * * * 32 vs 32 vs 32 vs 32 vs 32 vs Col Col Col Col Col 33 - Col 39 - Col 45 - Col 51 - Col 57 - Col 38 44 50 56 62 * 200 100 0 0 2 5 12 24 0 48 2 5 12 24 48 Soaking time (h) Figure 4-10 Electrolyte conductivity of four dogwood collections during artificial aging at 45°C with 60% RH. Values are mean ± SE (n=6). ‘*’ indicates significant difference among aging time within the same soaking time (P ≤ 0.05). 66 The electrolyte conductivity in all chokecherry and pin cherry collections increased with soaking time (Figure 4-11). Electrolyte conductivity significantly increased after 5 d aging for CHK 1410, and 10 d for PIN 1298. For CHK 1410 and PIN 1298, the electrolyte conductivity significantly increased with the increment of the aging duration after the same soaking time (P≤0.05). After 15 d aging treatment, significant differences were detected in seed electrolyte conductivity for CHK 1410, and PIN 1298(P≤0.05). In CHK 1410, electrolyte conductivity of 5 d and 10 d aged seeds showed significantly higher values than seeds of other durations. For PIN 1298, no significant difference was detected between 0 d and 5 d, 10d and 15 d aged seeds at any soaking time. Due to the increased leakage, aged pin cherry seeds (5 d &10 d) became more vulnerable to fungi infection during the germination period than non-aged seeds (0 d). (Figure 4-12, A) 67 300 CHK 1410 0d 5d 10 d 15 d 20 d -1 -1 Leakage conductivity ( s*cm g ) 250 200 150 * * * PIN 1298 * * * 100 * 68 * * 12 24 * * * 50 0 0 2 5 12 24 48 0 2 5 48 Soaking time (h) Figure 4-11 Electrolyte conductivity of a chokecherry and a pin cherry collection during artificial aging at 45°C with 60%RH. Values are mean ± SE (n=6). ‘ * ’ indicates significant difference among aging time within the same soaking time (P ≤ 0.05) 69 Figure 4-12 Aged seeds were more vulnerable to fungal infection than non-aged seeds during germination. A: PIN 1298; B: LBC 7278, 0: 0 d, 5: 5 d, and 10: 10 d. Petri-dishes in the same column are aged for same duration. Effects of accelerated seed aging on seed properties For BUF 14903, significant correlations were observed between aging durations (Table 4-9). Electrolyte conductivity showed a strong, negative correlation with seed viability, and positive correlations with aging duration and mean germination time. Viability before and after (including germinated seeds) germination test showed strong correlations with most parameters, except mean germination time. For BUF 4096, negative correlations were found between aging duration and most measurements; strong, positive correlations were observed between aging duration and mean germination time and electrolyte conductivity (Table 4-10). Positive correlation was also found between electrolyte conductivity and mean germination time. The viability after germination (including germinated seeds) showed significant correlations with germination rate index, viability before germination test, and aging duration. 70 Table 4-9 Simple correlation coefficients between various measures of seed quality for BUF 14903 during accelerated seed aging. Correlations G V ** -.81 -.89** .85** .71** ** .84 .73** .82** .66** 1 .71** 1 71 BUF 14903 UVS VAG GRI EC TT VI MGT ** ** ** ** * * AD -.82 -.86 -.81 .49 -.59 -.55 .67** UVS 1 .86* .89** -0.2 0.39 .52* -.58* ** * VAG 1 .90 -0.3 0.43 .52 -.62* GRI 1 -0.29 0.18 0.34 -.66** G -0.36 .63** .88** -.63* V -.54** .63** .48* -0.21 EC 1 -0.17 -0.29 .51* TT 1 .87** -0.42 VI 1 -0.48 MGT 1 ** Significant at P ≤ 0.01 (2-tailed). *. Significant at P ≤ 0.05 (2-tailed). UVS= Un-germinated but viable seeds, VAG= Viability after germination (including germinated seeds), GRI=Germination rate index, G= Total germination percentage, V=Viability before germination, EC=Electrolyte conductivity, TT= Seedling length, VI=Vigour index, MGT=Mean germination time. Table 4-10 Simple correlation coefficients between various measures of seed quality for BUF 4096 during accelerated seed aging. Correlations 72 BUF UVS VAG GRI G V EC TT VI MGT 4096 AD -.83** -.85** -.81** -.80** -.81** .78** -.66** -.58* .82** UVS 1 .96** .86** .78** .61** -.68** 0.42 0.39 -.54* ** ** ** ** * ** VAG 1 .81 .85 .60 -.69 .58 .62 -.56* GRI 1 .73** .54** -.63** 0.15 0.12 -.54* G 1 .55** -.65** .62** .84** -0.37 ** V 1 -.76 0.29 0.12 -.78** EC 1 -0.46 -0.36 .80** TT 1 .86** -0.42 VI 1 -0.28 MGT 1 ** Significant at P ≤ 0.01 (2-tailed). *. Significant at P ≤ 0.05 (2-tailed). UVS= Un-germinated but viable seeds, VAG= Viability after germination (including germinated seeds), GRI=Germination rate index, G= Total germination percentage, V=Viability before germination, EC=Electrolyte conductivity, TT= Seedling length, VI=Vigour index, MGT=Mean germination time. For BUF 9134, negative correlations were found between aging duration and most measurements (UVS, VAG, G, V), and a strong, positive correlation was observed between aging duration and electrolyte conductivity; however no significant correlations were found with mean germination time (Table 4-11). Mean germination time did not show any significant correlation with any measurements. Electrolyte conductivity showed significant negative correlations with percentage of un-germinated but viable seeds, germination rate index, total germination percentage and viability after germination. For BUF 1424, a strong, positive correlation was observed between aging duration with electrolyte conductivity, and negative correlations were found between aging duration and most measurements (Table 4-12). However, no significant correlation was found between aging duration with seedling length and mean germination time. Electrolyte conductivity showed significant negative correlations with viability after germination, percentage of un-germinated but viable seeds, and final germination percentage. No significant correlation was found between seedling lengths and all other measurements. 73 Table 4-11 Simple correlation coefficients between various measures of seed quality for BUF 9134 during accelerated seed aging. Correlations 74 BUF UVS VAG GRI G V EC TT VI 9134 AD -.81** -.83** -.77** -.82** -.85** .92** -.58* -.61* UVS 1 .95** .71** .74** .69** -.82** 0.26 0.22 VA 1 .61** .78** .69** -.82** .63* .56* G GRI 1 .78** .64** -.79** -0.19 0.01 ** ** * G 1 .68 -.82 .53 .85** V 1 -.83** 0.47 0.21 EC 1 -0.13 -0.26 TT 1 .87** VI 1 MG T ** Significant at P ≤ 0.01 (2-tailed). *. Significant at P ≤ 0.05 (2-tailed). UVS= Un-germinated but viable seeds, VAG= Viability after germination (including germinated seeds), GRI=Germination rate index, G= Total germination percentage, V=Viability before germination, EC=Electrolyte conductivity, TT= Seedling length, VI=Vigour index, MGT=Mean germination time. MGT 0.52 -0.06 -0.21 -0.48 -0.45 -0.16 0.42 -0.26 -0.34 1 Table 4-12 Simple correlation coefficients between various measures of seed quality for BUF 1424 during accelerated seed aging. Correlations 75 BUF UVS VAG GRI G V EC TT VI MGT 1424 AD -0.91** -0.90** -.84** -.84** -.92** .93** -0.32 -.80** 0.48 ** ** ** ** ** ** UVS 1 .92 .94 .94 .81 -.85 0.28 .85 -.59* ** ** ** ** ** VAG 1 .92 .92 .81 -.82 0.28 .84 -.66** GRI 1 .90** .70** -.81** 0.13 .62** -.72** G 1 .75** -.82** 0.18 .83** -0.44 ** ** V 1 -.88 0.26 .77 -0.39 EC 1 -0.2 -.69** 0.33 * TT 1 .58 -0.14 VI 1 -0.42 MGT 1 ** Significant at P ≤ 0.01 (2-tailed). *. Significant at P ≤ 0.05 (2-tailed). UVS= Un-germinated but viable seeds, VAG= Viability after germination (including germinated seeds), GRI=Germination rate index, G= Total germination percentage, V=Viability before germination, EC=Electrolyte conductivity, TT= Seedling length, VI=Vigour index, MGT=Mean germination time. For CHK 1410, negative correlations were found between aging duration and most measurements (Table 4-13). However, no significant positive correlation was found between aging duration and electrolyte conductivity and mean germination time Electrolyte conductivity showed strong, negative correlations with germination rate index, final germination percentage, and viability before germination. The viability after germination (including germinated seeds) showed positive correlations with germination rate index, viability before germination, and seedling length. The total germination percentage showed strong negative correlation with electrolyte conductivity and aging duration; and strong positive correlations with the percentage of un-germinated but viable seeds, and viability before germination. For PIN 1298, strong negative correlations were found between aging duration with the percentage of un-germinated but viable seeds, viability before / after germination, final germination percentage, and positive correlations between aging duration and electrolyte conductivity (Table 4-14). Electrolyte conductivity tests showed strong negative correlations with the percentage of un-germinated but viable seeds, viability before/ after germination, and final germination percentage. 76 Table 4-13 Simple correlation coefficients between various measures of seed quality for CHK 1410 during accelerated seed aging. Correlations 77 CHK UVS VAG GRI G V EC TT VI MGT 1410 AD -.88** -.89** -.74** -.67** -.86** 0.36 -0.58 -.66* -0.34 ** ** ** ** * UVS 1 .90 .76 .64 .77 -0.29 .64 0.37 0.42 VAG 1 .78** .67** .78** -0.32 .61* 0.37 0.47 ** ** ** GRI 1 .85 .65 -.49 0.2 0.35 0.02 ** ** G 1 .63 -.53 0.22 0.53 0.49 ** * ** V 1 -.56 .68 .76 0.47 EC 1 0.14 -0.06 -0.05 TT 1 .88** .65* VI 1 .61* MGT 1 ** Significant at P ≤ 0.01 (2-tailed). *. Significant at P ≤ 0.05 (2-tailed). UVS= Un-germinated but viable seeds, VAG= Viability after germination (including germinated seeds), GRI=Germination rate index, G= Total germination percentage, V=Viability before germination, EC=Electrolyte conductivity, TT= Seedling length, VI=Vigour index, MGT=Mean germination time. Table 4-14 Simple correlation coefficients between various measures of seed quality for PIN 1298 during accelerated seed aging. Correlations 78 PIN UVS VAG GRI G V EC TT VI MGT 1298 AD -.75** -.74** -0.45 -.54** -.87** .77** -0.04 0.02 -0.39 ** ** ** ** UVS 1 .94 0.42 .63 .70 -.55 0.23 0.56 .70* * ** ** ** ** VAG 1 .57 .84 .68 -.63 0.54 .85 0.4 ** * GRI 1 .62 0.42 -.51 0.32 0.48 -0.03 ** ** ** ** G 1 .47 -.62 .78 .96 -0.17 ** V 1 -.75 0.06 0.21 0.44 EC 1 -.68* -0.26 0.67 ** TT 1 .81 -0.38 VI 1 -0.03 MGT 1 ** Significant at P ≤ 0.01 (2-tailed). *. Significant at P ≤ 0.05 (2-tailed). UVS= Un-germinated but viable seeds, VAG= Viability after germination (including germinated seeds), GRI=Germination rate index, G= Total germination percentage, V=Viability before germination, EC=Electrolyte conductivity, TT= Seedling length, VI=Vigour index, MGT=Mean germination time. For DOG 3119, strong negative correlations were observed between aging duration and most measurements (Table 4-15). The electrolyte conductivity showed a strong positive correlation with aging duration, and negative correlation with viability before germination. No significant correlations were found between mean germination times and other measurements. For DOG 6930, negative correlations were found between aging duration and most measurements; however, no significant positive correlation was found between aging duration and electrolyte conductivity, and mean germination time (Table 4-16). Negative correlation was observed between electrolyte conductivity and viability before germination. For DOG 3914, negative correlations were found between aging duration and most measurements (Table 4-17); however, no significant strong positive correlations were found between aging duration with before germination viability, electrolyte conductivity, and mean germination time. Strong negative correlations were also observed between electrolyte conductivity and total germination percentage and viability before germination. The viability after germination (including germinated seeds) was positively correlated with germination rate index, seedling length, and vigour index. For DOG 3259, negative correlations were found between aging duration and most measurements (Table 4-18). However, a strong positive correlation was observed between aging duration and electrolyte conductivity, and no significant correlations were found between aging duration and vigour index and mean germination time. Strong negative correlations were observed between electrolyte conductivity with the percentage of un-germinated but viable seeds, viability before/ after germination, final germination percentage, and germination rate index. 79 Table 4-15 Simple correlation coefficients between various measures of seed quality for DOG 3119 during accelerated seed aging. Correlations 80 DOG UVS VAG GRI G V EC TT VI MGT 3119 AD -.87** -.84** -.72** -.83** -.90** .47** -0.51 -.60* -0.11 ** ** ** ** UVS 1 .96 .79 .89 .72 -0.24 0.31 0.48 0.09 VAG 1 .69** .83** .69** -0.34 -0.25 -0.06 0.41 ** ** ** GRI 1 .90 .62 -0.18 0.47 .77 -0.49 ** ** G 1 .71 -0.22 0.52 .84 -0.04 ** * V 1 -.63 0.54 .59 0.25 EC 1 .66* 0.36 -0.29 TT 1 .87** -0.21 VI 1 -0.22 MGT 1 ** Significant at P ≤ 0.01 (2-tailed). *. Significant at P ≤ 0.05 (2-tailed). UVS= Un-germinated but viable seeds, VAG= Viability after germination (including germinated seeds), GRI=Germination rate index, G= Total germination percentage, V=Viability before germination, EC=Electrolyte conductivity, TT= Seedling length, VI=Vigour index, MGT=Mean germination time. Table 4-16 Simple correlation coefficients between various measures of seed quality for DOG 6930 during accelerated seed aging. Correlations 81 DOG UVS VAG GRI G V EC TT VI MGT 6930 AD -.89** -.88** -.72** -.87** -.66** 0.25 -.91** -.89** 0.42 ** ** ** ** ** ** UVS 1 .97 .83 .92 .52 -0.19 .81 .84 -0.36 VAG 1 .79** .92** .57** -0.27 .63* .78** -0.27 ** * * ** GRI 1 .82 .41 -0.07 .68 .71 -0.42 ** * ** G 1 .51 -0.16 .68 .93 -0.37 ** V 1 -.62 -0.05 0.08 0.37 EC 1 0.41 0.31 -0.53 TT 1 .88** -0.48 VI 1 -0.41 MGT 1 ** Significant at P ≤ 0.01 (2-tailed). *. Significant at P ≤ 0.05 (2-tailed). UVS= Un-germinated but viable seeds, VAG= Viability after germination (including germinated seeds), GRI=Germination rate index, G= Total germination percentage, V=Viability before germination, EC=Electrolyte conductivity, TT= Seedling length, VI=Vigour index, MGT=Mean germination time. Table 4-17 Simple correlation coefficients between various measures of seed quality for DOG 3914 during accelerated seed aging. Correlations 82 DOG UVS VAG GRI G V EC TT VI MGT 3914 AD -.88** -.89** -.74** -.79** -0.34 0.14 -.76** -.83** -0.09 ** ** ** ** * UVS 1 .95 .74 .75 0.2 0.17 .89 .61 0.17 VAG 1 .75** .85** 0.3 -0.14 .69** .75** 0.3 ** ** ** GRI 1 .85 .48 -0.21 0.42 .74 -0.31 ** * ** G 1 .53 -.36 0.31 .94 0.04 ** V 1 -.52 -0.34 0.32 0.03 EC 1 0.33 -0.37 0.05 * TT 1 .54 0.04 VI 1 0.02 MGT 1 ** Significant at P ≤ 0.01 (2-tailed). *. Significant at P ≤ 0.05 (2-tailed). UVS= Un-germinated but viable seeds, VAG= Viability after germination (including germinated seeds), GRI=Germination rate index, G= Total germination percentage, V=Viability before germination, EC=Electrolyte conductivity, TT= Seedling length, VI=Vigour index, MGT=Mean germination time. Table 4-18 Simple correlation coefficients between various measures of seed quality for DOG 3259 during accelerated seed aging. Correlations 83 DOG UVS VAG GRI G V EC TT VI MGT 3259 AD -.86** -.85** -.76** -.81** -.93** .49** -.62* -0.51 0.25 ** ** ** ** * UVS 1 .96 .83 .85 .74 -.42 0.55 0.51 -0.11 VAG 1 .83** .82** .74** -.49** 0.09 0.04 0.31 ** ** ** GRI 1 .87 .63 -.47 -0.01 0.32 -0.13 ** ** ** G 1 .72 -.48 0.14 .69 -0.55 ** V 1 -.54 0.43 0.25 -0.4 EC 1 0.08 0.02 -0.23 TT 1 .79** -0.43 VI 1 -.61* MGT 1 ** Significant at P ≤ 0.01 (2-tailed). *. Significant at P ≤ 0.05 (2-tailed). UVS= Un-germinated but viable seeds, VAG= Viability after germination (including germinated seeds), GRI=Germination rate index, G= Total germination percentage, V=Viability before germination, EC=Electrolyte conductivity, TT= Seedling length, VI=Vigour index, MGT=Mean germination time. Seed protein changes during accelerated seed aging Proteins extracted from all treatments in chokecherry and pin cherry showed a 25.9 kDa polypeptide that reacted with dehydrin antibodies (Figure 4-13). In chokecherry species, the dehydrin antibodies recognized two clear bands around 25.9 kDa non-aged seeds. One clear band appeared above the two already exsisting bands after 5 d aging treatment. For the pin cherry collection, the protein patterns of seed changed after artificial aging. The concentration of 25.9 kDa protein increased steadily with aging period, and a new protein band appeared after 10 d aging treatments at 19.4 kDa. 84 85 Figure 4-13. Accumulation of dehydrins during seed aging. The western blot of total protein (35 μL/ lane) was probed with antibodies against dehydrin protein. Numbers on the left indicate the approximate molecular weights. CHK = chokecherry; PIN = pin cherry. 5 5.1 DISCUSSION Seed properties as affected by one year storage under various temperature/ RH/ gas conditions One-year storage of two chokecherry collections and two pin cherry collections did not reveal any significant differences in most seed biochemical and physiological properties with the exception of total seed viability. Seeds stored at -20 C had higher final germination and vigour index, and lower percentage of un-germinated but viable seeds than seeds stored at room temperature (22.5 C). Seeds lose vigour and become more sensitive to stresses during storage (Butler et al., 2009; Ballesteros et al., 2011). Storage temperature, relative humidity, and atmosphere are considered to be the main factors affecting seed aging (Ballesteros et al., 2011). Elevated temperatures can increase seed deterioration rate (Priestley, 1986; Ballesteros et al., 2011) while sub-zero temperatures may prolong seed survive for several decades (Roberts, 1972; Vertucci et al., 1990; Walters, 2007). According to Stevens et al. (1981), shrub seeds can maintain germination ability up to 10 years when stored in an open, unheated and uncooled warehouse. The two seed moisture contents tested in these experiments, 3~4% (ultra-dry) and 7~8% (normal), did not have significant effects on seed properties after one-year storage. Seeds with high moisture content may be damaged during freezing due to the presence of free water (Roberts, 1972; Vertucci et al., 1990; Coolbear, 1995; Schwember et al., 2011). On the other hand, desiccation damage may occur when seeds are too dry (Hong et al., 1996; Bewley et al., 2013). One year after storage, N2 treatment showed a trend of higher total germination percentage and seed vigour index. The presence of O2 during storage not only accelerates seed respiration rate, but also stimulates the growth of aerobic microorganisms (Roberts, 86 1961; Osonubi et al., 1980; Schwember et al., 2011). CO2 can also promote the growth of obligate anaerobes (Negm et al., 1972; Reilly, 1980; Mohammadi et al., 2011). Hence, the replacement of O2 and CO2 with N2 in storage can extend seed viability (Bass et al., 1978; Bass, 1980; Schwember et al., 2011) Even though one-year storage is not long enough to observe significant changes in seed quality of native shrubs, the trends observed in sub-zero temperature N2 treatments showed potential to slow down seed deterioration rate and prolong seed longevity. 5.2 Seed viability and germination as affected by artificial aging process Seed vigour can be predicted by subjecting seeds to a precise degree of aging in controlled deterioration tests (Ching, 1972; Gidrol et al., 1989; Rao et al., 2006). In the current study, native shrub seeds showed a decline in seed vigour after artificial aging treatment based on germination and tetrazolium tests. Most seeds failed to germinate after 10 to 15 d aging treatments at 45 oC and 60% RH. Seeds deteriorate rapidly after exposure to both high temperature and high humidity under laboratory conditions (Gidrol et al., 1989; Hyatt et al., 2008). Vegetative seeds such as carrot (Daucus carota), onion (Allium cepa), or lettuce (Lactuca sativa) lose vigour rapidly after being exposed to high temperature (45 oC) and high humidity (100%) conditions for 72 h (Delouche et al., 1973; Bailly et al., 1996; Rodo et al., 2003). Shrub seeds are more resistant than crop seeds to accelerated aging since most of them have hard seed coats. Generally seeds with hard seed coats are long lived (Bass, 1980; Priestley, 1986; Rao et al., 2006) because hard seed coats prevent seeds not only from mechanical injury, but also temperature and humidity stress as well as the invasion of microorganisms (Mohamed-Yasseen et al., 1994). Aged seeds exhibited delayed and reduced germination especially after 10 d aging treatments. Slower germination is considered an indicator of vigour loss (Ching, 1972; 87 Carjuzaa et al., 2008; Hyatt et al., 2008). The prolonged germination period /slower growth caused by artificial aging in soybean (Glycine max II Mef. var. Wayne) and onion seeds is contributed by reduced vigour (Berjak et al., 1972; Parrish et al., 1978; Priestley, 1986; Rice et al., 2001). Fresh seeds usually germinate faster and more uniformly than stored / aged seeds (Demir et al., 2008). This kind of delay is considered to be associated with the time required for internal repair of damaged membranes (Rice et al., 2001). In most shrub species in this study, no germination was observed after 15 d aging, possibly due to degradation of nucleic acids, proteins and/or membranes (Priestley, 1986; Mtwisha et al., 1998; Bewley et al., 2013), accumulation of toxic compounds (Butler et al., 2009), and loss of vitamins or hormones (Walters, 2007). There was a delayed response to aging treatments in seed viability compared to germination as reported by several researchers (Delouche et al., 1973; Rodo et al., 2003; Hyatt et al., 2008). Accelerated aging reduced seedling length of shrubs, likely due to degradation of mitochondria DNA in membrane (Gidrol et al., 1989; Bailly, 2004; Bewley et al., 2013). DNA degradation leads to impaired transcription causing incomplete or faulty enzyme synthesis essential for earlier stages of germination (Walters et al., 2010; Schwember et al., 2011). 5.3 Seed electrolyte conductivity as affected by aging process During accelerated seed aging process, the electrolyte conductivity was negatively correlated with seed viability and germination. Aging can cause inability of seeds to maintain membrane integrity and cause reduction in germination ability (Fessel et al., 2006). Seeds lose vigour and become more vulnerable to stresses due to leaky membranes, accumulated chromosome mutations, and enzymes losing catalytic activity (Walters, 1998). Biological membranes support the transportation of chemicals and ions 88 thus play a key role in maintaining seed vigour (Rahoui et al., 2010). The damage on cell membrane determines the rate of solute leakage in response to seed aging, which can be an indication of seed deterioration (Priestley et al., 1979; Thuzar et al., 2010). The increased leakage associated with aging may be the result of a more permeable membrane or a larger pool of electrolytes (Powell, 1986; Takos et al., 2012). Ching (1972) considered this possibility in amino acid leakage studies of vigorous and aged, nongerminable seeds. The increase of membrane permeability caused by artificial aging was also indicated by the stimulated fungal infection in our study. Leakage substances include ionic solutes, small organic molecules such as amino acids and sugar (Lee et al., 1995), which are favourable for fungi growth (Overath et al., 1973; Rahoui et al., 2010). 5.4 Rate of aging between species Buffalo berry and dogwood have thin seed coats and lower electrolyte leakage rates than other shrub species studied. The hard, thick seed coat serves as primary defense against adverse environmental conditions and leakage, but also inhibits germination (MohamedYasseen et al., 1994; Butler et al., 2009). Seeds of dogwood and buffalo berry are ‘shallow’ dormant than other shrub species studied and only required 2-3 weeks of stratification to break the dormancy. These two species also showed a more uniform and rapid seedling growth. 5.5 Seed protein changes as affected by aging process Dehydrins are proteins that are induced and accumulate during seed maturation, which protect tissues from abiotic stresses (Delahaie et al., 2013). According to Yamane et al. (2006), dehydrins play an important role in Prunus species during the dormancy period. Cold stress can induce dehydrins production, which can enhance the performance of 89 future seedlings (Delseny et al., 2001; Brooks, 2011). After one-year storage treatments, the accumulation of dehydrins was greater in chokecherry seeds that were stored with N2 at room temperature, as well as seeds stored at sub-zero temperature. In response to stress, plants may produce specific proteins to protect the cellular machinery and damage repair (Rajjou, 2008b). Immunological detection by western blot revealed the expression of dehydrins with a molecular mass of ~27 kDa under heat stress. In both species chokecherry and pin cherry, the concentration of dehydrins increased after aging treatments, indicating a protective role of these proteins just like other heat stress proteins (Wang et al., 2003; Rurek, 2010). Dehydrins share many physiological properties such as function and structure with small heat shock proteins (Mtwisha et al., 1998; Delahaie et al., 2013). This kind of water-soluble and heat stable proteins showed maintenance of structural stability under a variety of stresses (Delseny et al., 2001). According to Wahid et al. (2007), an increase in leaf water pressure potential is correlated with the expression of dehydrins and heat shock proteins under heat stress. It has been suggested that dehydrins can bind to macro molecular structures to prevent cellular damage during stresses conditions, serving as molecular chaperones and being associated to the cytoplasmic membranes (Sales et al., 2000; Wahid et al., 2007; Carjuzaa et al., 2008; Delahaie et al., 2013). 5.6 Discussion on methods The extraction and preparation of protein samples are two critical steps in the proteomic study. Different protein extraction methods promote certain groups of proteins, which may not be identified by all extraction methods. There is no universe protein extraction method that can capture all the proteomes due to the diversity of cellular proteins (Saravanan et al., 2004). Degradation minimization, reproduction comprehensiveness and 90 contaminant removal are considered to be the main characteristics of ideal extraction methods. In this study, two widely used protein methods were assessed by examining characterises of extracts quantitatively and qualitatively. Different solubilisation of protein in different extraction buffers are the foundation of protein extraction protocols (Isaacson et al., 2006). Unlike Tris-HCl buffer extraction method, in which proteins are obtained from cellular extracts used directly for further analysis, the phenol extraction method result relies on precipitating proteins from the phenol extract. According to Saravanan (2004), the phenol extraction method is ideal to extract proteins from resistant tissues such as wood, olive leaves and seeds (Ritenour et al., 2001; Saravanan et al., 2004). Phenol extraction method is more time consuming and laborious than the Tris-HCl extraction method. However, the phenol extraction is more efficient than Tris-HCl in generating high purity protein as determined by SDS-PAGE analysis, especially in the region 14.5 kDa to 82.2 kDa. The high protein purity obtained by phenol extraction is mainly because the water-soluble contaminants are eliminated from the non-water based protein-enriched phenol layer (Benndorf et al., 2009). Seeds viability from tetrazolium test after artificial aging test showed a delay and overestimation in viability as validated by germination. The level of overestimation in triphenyl-tetrazolium chloride assay was greater for heat tolerance estimates than for salt and freezing tolerance estimates (Ishikawa et al., 1995). According to (Bewley et al., 1982), the overestimating of seed viability using TZ test was caused by the delay in concomitant loss of dehydrogenase enzymes. Similar observation was also found in accelerated aging experiments in pea and onion seeds (Bass et al., 1978; Rodo et al., 2003; Hyatt et al., 2008). 91 5.7 Conclusions and practical implications Six shrub species identified by the vegetation cooperative of CONRAD, Prunus virginiana, Prunus pensylvanica, Arctostaphylos uva-ursi, Shepherdia canadensis, Cornus sericea, and Viburnum edule were used in this study. Two Prunus virginiana and two Prunus pensylvanica collections were stored under different gas-temperature-RH conditions for one year. The mechanism of seed aging was studied by subjecting seventeen collections of all the shrubs mentioned above to the accelerated aging test. In general, the duration seeds can be stored without serious loss of viability is determined largely by storage environment. The effects of storage conditions including the combination of gas, relative humidity, as well as temperature on seed physiological properties did not show significantly different changes after one-year storage. However, seed storage at room temperature with N2, as well as sub-zero temperature showed a trend of reduced deterioration. One year aged pin cherry showed significant decrease in total germination percentage after one year storage while seed viability remains very high, which indicate the low vigour seeds might experience deep dormancy. Aged seeds consistently exhibited lower performance when controlled and aged seeds were compared on the basis of several criteria of seed vigour. Changes in seeds of native shrub species that occur during accelerated aging (45oC, 60% relative humidity) showed subsequent loss of vigour, a decline in seedling length, germination percentage, viability, and overexpression of protein band at 27 kDa that was recognised by dehydrin antibody. The current study also suggests that electrolyte conductivity values were strongly correlated with seed vigour. Increased leaching of electrolytes was observed in the artificial aged seeds. High electrolyte conductivity in solution of aged seeds indicates faster deterioration. The weakening of cell membrane might have caused increased 92 leaching of metabolites and electrolyte through the semi permeable membrane into the inhibiting medium. In conclusion, this study found the trend of optimal storage protocol for seed storage and improved the basic understanding of physiological and biochemical for native shrub species. The storage protocol developed by this study can ensure an adequate supply of viable shrub seeds for reclamation, which can be immediately transferred for the use by industrial partner. Artificial aging technique for predict seed longevity can also be expended for other non-crop species that can be used in reclamation of lands related to oil extraction; however, species specific parameters must be taken into consideration. 93 6 REFERENCES Abdul-Baki, A. A. (1980). Biochemical aspects of seed vigour. HortScience, 15(6), 756770. Allison, T. D., et al. (2003). Forty-two years of succession following strip clearcutting in a northern hardwoods forest in northwestern Massachusetts. Forest ecology and management, 182(1), 285-301. Baalbaki, R., et al. (2009). Seed vigour testing handbook. Ithaca, NY: Association of Official Seed Analysts. Bailly, C. (2004). Active oxygen species and antioxidants in seed biology. Seed Science Research, 14(02), 93-107. Bailly, C., et al. (1996). Changes in malondialdehyde content and in superoxide dismutase, catalase and glutathione reductase activities in sunflower seeds as related to deterioration during accelerated aging. Physiologia Plantarum, 97(1), 104-110. Bainard, L. D., et al. (2011). The mycorrhizal status and colonization of 26 tree species growing in urban and rural environments. Mycorrhiza, 21(2), 91-96. Balešević-Tubić, S., et al. (2010). Seed viability of oil crops depending on storage conditions. Helia, 33(52), 153-160. Ballesteros, D., et al. (2011). Effect of storage temperature on green spore longevity for the ferns Equisetum ramosissimum and Osmunda regalis. CryoLetters, 32(2), 8998. Baskin, C. C., Baskin, J. M. (1998). Seeds: ecology, biogeography, and evolution of dormancy and germination: Academic press. Basra, A. S. (1995). Seed quality: basic mechanisms and agricultural implications: Food Products Press. Bass, L. (1980). Seed viability during long–term storage. Horticultural Reviews, Volume 2, 117-141. Bass, L., Stanwood, P. (1978). Long-term preservation of sorghum seed as affected by seed moisture, temperature, and atmospheric environment. Crop Science, 18(4), 575-577. Belcher, E. (1985). Handbook on seeds of browse-shrubs and forbs. Tech. Pub. R8-TP8. Atlanta: USDA Forest Service, Southern Region. Benndorf, D., et al. (2009). Improving protein extraction and separation methods for investigating the metaproteome of anaerobic benzene communities within sediments. Biodegradation, 20(6), 737-750. Bergfors, T. M. (2009). Protein crystallization: Techniques, Strategies and Tips. La Jolla, CA: Internat'l University Line. Berjak, P., Villiers, T. (1972). Aging in plant embryos II. age-induced damege and its repair during erley germination. New Phytologist, 71(1), 135-144. Bewley, J. D.(1982). Physiology and biochemistry of seeds in relation to germination. Vol. 2. Viability, dormancy and environmental control: Springer-Verlag. Bewley, J. D. (2013). Longevity, storage, and deterioration. Seeds (pp. 341-376): Springer Black, M., Bewley, J. D. (2000). Seed technology and its biological basis: CRC PressI Llc. 94 Booth, D. A. (1985). Food-conditioned eating preferences and aversions with interceptive elements: Conditioned appetite and satieties. Annals of the New York Academy of Sciences, 43, 22-41. Bradford, M. M. (1976). A rapid and sensitive method for the quantitation of microgram quantities of protein utilizing the principle of protein-dye binding. Analytical Biochemistry, 72(1), 248-254. Brar, G., et al. (1991). Germination of twenty forage legumes as influenced by temperature. Agronomy Journal, 83(1), 173-175. Brooks, S.-L. (2011). A dehydrogenase activity test for monitoring the growth of streptomyces venezuelae in a nutrient rich medium. Journal of Bioprocessing & Biotechnique, 1, 1-10. Butler, L., et al. (2009). Priming and re-drying improve the survival of mature seeds of Digitalis purpurea during storage. Annals of Botany, 103(8), 1261-1270. Caldwell, W. P., Delouche J. C. (1960). Seed vigour and vigour test. Proceedings of the Association of Official Seed Analysts, 50, 124-129. Callahan, A. M., et al. (2009). Characterization of ‘Stoneless’: A naturally occurring, partially stoneless plum cultivar. Journal of the American Society for Horticultural Science, 134(1), 120-125. Canham, C. D., et al. (1985). The response of woody plants to disturbance patterns of establishment and growth. The Ecology of Natural Disturbance and Patch Dynamics, 197-216. Carjuzaa, P., et al. (2008). Detection and subcellular localization of dehydrin-like proteins in quinoa (Chenopodium quinoa Willd.) embryos. Protoplasma, 233(12), 149-156. Chai, S. L., et al. (2013). Seed transfer of woody shrubs in alberta-are current seed zones applicable (pp. 41). Edmonton, AB: Alberta innovates-technology futures, Vegreville, Alberta and Alberta enviroment and sustainable resource development Charles-Dominique, T., et al. (2014). Using intra ‐ individual variation in shrub architecture to explain population cover. Oikos. doi: 10.1111/oik.01654 Chen, E. I., et al. (2006). Large scale protein profiling by combination of protein fractionation and multidimensional protein identification technology (MudPIT). Molecular & Cellular Proteomics, 5(1), 53-56. Ching, T. (1972). Aging stresses on physiological and biochemical activities of crimson clover (Trifolium incarnatum L. var. Dixie) seeds. Crop Science, 12(4), 415-418. Clement, W. L., Donoghue, M. J. (2011). Dissolution of Viburnum section Megalotinus (Adoxaceae) of Southeast Asia and its implications for morphological evolution and biogeography. International Journal of Plant Sciences, 172(4), 559-573. Cohen, A., Karger, B. (1987). High-performance sodium dodecyl sulfate polyacrylamide gel capillary electrophoresis of peptides and proteins. Journal of Chromatography A, 397, 409-417. Coolbear, P. (1995). Mechanisms of seed deterioration. Seed quality: basic mechanisms and agricultural implications,(ed AS Basra). The haworth Press Inc. pp, 223-227. Daust, K. (2013). Impact of the rust Puccinia linkii on Highbush Cranberry, Viburnum edule, near Smithers, British Columbia. The Canadian Field-Naturalist, 127(3), 270-273. Davis, L., et al. (2014). Salinity-induced changes in the root development of a northern woody species, Cornus sericea. Botany, 92(8), 597-606. 95 Delahaie, J., et al. (2013). LEA polypeptide profiling of recalcitrant and orthodox legume seeds reveals ABI3-regulated LEA protein abundance linked to desiccation tolerance. Journal of Experimental Botany, 64(14), 4559-4573. Delahunty, C. M., Yates III, J. R. (2007). MudPIT: multidimensional protein identification technology. Biotechniques, 43(5), 563. Delouche, J. C. (1960). Seed vigour and vigour tests. Proceedings of the Association of Official Seed Analysts of North America, 50(1), 124-129. Delouche, J., Baskin, C. (1973). Accelerated aging techniques for predicting the relative storability of seed lots. Seed Science and Technology, 1(2), 427-452. Delseny, M., et al. (2001). Late Embryogenesis Abundant (LEA) protein gene regulation during Arabidopsis seed maturation. Journal of Plant Physiology, 158(4), 419427. Demeke, T., et al. (1997). Evaluation of Canadian and other wheats for waxy proteins 1. Cereal chemistry, 74(4), 442-444. Demir, I., et al. (2008). Mean germination time of pepper seed lots (Capsicum annuum L.) predicts size and uniformity of seedlings in germination tests and transplant modules. Seed Science and Technology, 36(1), 21-30. Desai, B. B. (2004). Seeds handbook: biology, production, processing, and storage. Marcel Dekker, NY: CRC Press. Dickie, J., et al. (1990). Temperature and seed storage longevity. Annals of Botany, 65(2), 197-204. Ellis, R., Hong, T. (2006). Temperature sensitivity of the low-moisture-content limit to negative seed longevity–moisture content relationships in hermetic storage. Annals of botany, 97(5), 785-791. Ellis, R., Roberts, E. (1981). The quantification of ageing and survival in orthodox seeds. Seed Science and Technology (Netherlands), 9, 373-409. Fenner, C. (1975). Quantification of Coomassie Blue stained proteins in polyacrylamide gels based on analyses of eluted dye. Analytical biochemistry, 63(2), 595-602. Fernandez, J., et al. (1992). Internal protein sequence analysis: enzymatic digestion for less than 10 μg of protein bound to polyvinylidene difluoride or nitrocellulose membranes. Analytical Biochemistry, 201(2), 255-264. Fessel, S. A., et al. (2006). Electrical conductivity testing of corn seeds as influenced by temperature and period of storage. Pesquisa Agropecuária Brasileira, 41(10), 1551-1559. Finch-Savage, W. E., Leubner‐Metzger, G. (2006). Seed dormancy and the control of germination. New Phytologist, 171(3), 501-523. Flores, R. (1978). A rapid and reproducible assay for quantitative estimation of proteins using bromophenol blue. Analytical Biochemistry, 88(2), 605-611. Fuchigami, L., et al. (1971). Induction of cold acclimation in Cornus stolonifera Michx. Plant Physiology, 47(1), 98-103. Ganeshan, S., et al. (2008). Quantitative expression analysis of selected COR genes reveals their differential expression in leaf and crown tissues of wheat (Triticum aestivum L.) during an extended low temperature acclimation regimen. Journal of Experimental Botany, 59(9), 2393-2402. 96 Ghayyad, M., et al. (2010). Effect of endocarp removal, gibberelline, stratification and sulfuric acid on germination of mahaleb (Prunus mahaleb L.) seeds. Seeds, 9(2), 163-168. Gidrol, X., et al. (1989). Biochemical changes induced by accelerated aging in sunflower seeds. I. Lipid peroxidation and membrane damage. Physiologia Plantarum, 76(4), 591-597. Golovina, E. A., et al. (1997). Long-term stability of protein secondary structure in dry seeds. Comparative Biochemistry and Physiology Part A: Physiology, 117(3), 343-348. Gómez-Campo, C. (2006). Erosion of genetic resources within seed genebanks: the role of seed containers. Seed Science Research, 16(04), 291-294. Goverment-Alberta. (1999). Conservation and reclamation information letter guidelines for reclamation to forest vegetation in the Athabasca oil-sands region. In G. O. Alberta (Ed.), C and R/IL/99–1. Edmonton, AB. Granelli-Piperno, A., Reich, E. (1978). A study of proteases and protease-inhibitor complexes in biological fluids. The Journal of Experimental Medicine, 148(1), 223-234. Halls, L. K. (1977). Southern fruit-producing woody plants used by wildlife. New Orleans, Louisiana: Southern Forest Experiment Station,US Department of Agriculture Hamer, D. (1996). Buffaloberry [Shepherdia canadensis (L.) Nutt.] fruit production in fire-successional bear feeding sites. Journal of Range Management, 520-529. Hampton, J. G., TeKrony, D. M. (1995). Handbook of vigour test methods The Internatinal Seed Testing Association (pp. 117). Zurich. Hay, F. R., et al. (2003). One‐step analysis of seed storage data and the longevity of Arabidopsis thaliana seeds. Journal of Experimental Botany, 54(384), 993-1011. Heussen, C., Dowdle, E. B. (1980). Electrophoretic analysis of plasminogen activators in polyacrylamide gels containing sodium dodecyl sulfate and copolymerized substrates. Analytical Biochemistry, 102(1), 196-202. Hong, T., et al. (1998). Compendium of information on seed storage behaviour. Hong, T., Ellis, R. H. (1996). A Protocol to Determine Seed Storage Behaviour: Bioversity International. Hu, X., Beeton, C. (2010). Detection of functional matrix metalloproteinases by zymography. Journal of Visualized Experiments: JoVE(45). Hughes, A. J., Herr, A. E. (2010). Quantitative enzyme activity determination with zeptomole sensitivity by microfluidic gradient-gel zymography. Analytical Chemistry, 82(9), 3803-3811. Hyatt, J., Tekrony, D. (2008). Factors influencing the saturated salt accelerated aging test in tomato and onion. Seed Science and Technology, 36(3), 534-545. Isaacson, T., et al. (2006). Sample extraction techniques for enhanced proteomic analysis of plant tissues. Nature Protocols, 1(2), 769-774. Ishikawa, M., et al. (1995). Comparison of viability tests for assessing cross-adaptation to freezing, heat and salt stresses induced by abscisic acid in bromegrass (Bromus inermis) suspension cultured cells. Plant Science, 107(1), 83-93. Issaq, H. J., Veenstra, T. D. (2008). Two-dimensional polyacrylamide gel electrophoresis (2D-PAGE): advances and perspectives. Biotechniques, 44(5), 697. 97 Janson, J. C. (2012). Protein purification: principles, high resolution methods, and applications (Vol. 151): John Wiley & Sons. Johnson, D., et al. (1995). Plants of the western boreal forest & aspen parkland. Edmonton, Alberta: Lone Pine publishing. Kaplan, B. (2012). Species productivity schedule: Arctostaphylos uva-ursi. from Biological Station, University of Michigan Kelly, E. N., et al. (2009). Oil-sands development contributes polycyclic aromatic compounds to the Athabasca River and its tributaries. Proceedings of the National Academy of Sciences, 106(52), 22346-22351. Kislinger, T., et al. (2005). Multidimensional protein identification technology (MudPIT): technical overview of a profiling method optimized for the comprehensive proteomic investigation of normal and diseased heart tissue. Journal of the American Society for Mass Spectrometry, 16(8), 1207-1220. Kochanek, J., et al. (2009). Variation in seed longevity among different populations, species and genera found in collections from wild Australian plants. Australian Journal of Botany, 57(2), 123-131. Kumar, G. M., et al. (1999). Age-induced protein modifications and increased proteolysis in potato seed-tubers. Plant Physiology, 119(1), 89-100. Kupai, K., et al. (2010). Matrix metalloproteinase activity assays: Importance of zymography. Journal of Pharmacological and Toxicological Methods, 61(2), 205-209. Leber, T. M., Balkwill, F. R. (1997). Zymography: a single-step staining method for quantitation of proteolytic activity on substrate gels. Analytical Biochemistry, 249(1), 24-28. Lee, S., et al. (1995). Sugar leakage from aged leek, onion and cabbage seeds. Plant Varieties and Seeds, 8(2), 81-86. Lockley, G. (1980). Germination of chokecherry (Prunus virginiana) seeds. Seed Science and Technology, 8(3), 237-244. Mackenzie, D. D., Naeth, M. A. (2010). The role of the forest soil propagule bank in assisted natural recovery after oil-sands mining. Restoration Ecology, 18(4), 418427. Marks, P. L. (1974). The role of pin cherry (Prunus pensylvanica L.) in the maintenance of stability in northern hardwood ecosystems. Ecological Monographs, 73-88. Mayer, A. M., Poljakoff-Mayber, A. (2014). The Germination of Seeds. New York, NY: Pergamon Press. McDonald Jr, M., Nelson, C. J. (1986). Physiology of Seed Deterioration (Vol. 11). Madison, WI: Crop Science Society of America Inc. McKell, C. (2012). The Biology and Utilization of Shrubs. San Diego, CA: Academic press, INC,. Mech, M. (2011). A Comprehensive guide to the alberta oil sands. Mohamed-Yasseen, Y., et al. (1994). The role of seed coats in seed viability. The Botanical Review, 60(4), 426-439. Mohammadi, H., et al. (2011). Effects of seed aging on subsequent seed reserve utilization and seedling growth in soybean. International Journal of Plant Production, 5(1), 65-70. Moore, R. (1973). Tetrazolium staining for assessing seed quality. Seed ecology, 11-23. 98 Morales, B. M., et al. (2012). Improving Germination of Red Elm (Ulmus rubra), Gray Alder (Alnus incana) and Buffaloberry (Shepherdia canadensis) Seeds with Gibberellic Acid. USDA Forest Service Proceeding, 88-95. Morales, B. M., et al. (2012). Sexual and Asexual Propagation of Red elm (Ulmus rubra), Grey alder (Alnus incana), and Buffaloberry (Shepherdia canadensis). Kansas State University. Mtwisha, L., et al. (1998). HSP 12 is a LEA-like protein in Saccharomyces cerevisiae. Plant Molecular Biology, 37(3), 513-521. Nagel, M., Börner, A. (2010). The longevity of crop seeds stored under ambient conditions. Seed Science Research, 20(01), 1-12. Nambara, E., et al. (2010). Abscisic acid and the control of seed dormancy and germination. Seed Science Research, 20(2), 55. Negm, F. B., et al. (1972). Interaction of carbon dioxide and ethylene in overcoming thermodormancy of lettuce seeds. Plant Physiology, 49(6), 869-872. Noodén, L. D. (2012). Senescence and Aging in plants: Elsevier. Osonubi, O., Davies, W. (1980). The influence of plant water stress on stomatal control of gas exchange at different levels of atmospheric humidity. Oecologia, 46(1), 16. Overath, P., Traeuble, H. (1973). Phase transitions in cells, membranes, and lipids of Escherichia coli. Detection by fluorescent probes, light scattering, and dilatometry. Biochemistry, 12(14), 2625-2634. Parrish, D. J., Leopold, A. C. (1978). On the mechanism of aging in soybean seeds. Plant Physiology, 61(3), 365-368. Pérez, H. E., et al. (2013). An analysis of embryo development in palm: interactions between dry matter accumulation and water relations in Pritchardia remota (Arecaceae). Seed Science Research, 1(1), 1-15. Pérez-García, F., et al. (2009). Successful long-term ultra dry storage of seed of 15 species of Brassicaceae in a genebank: variation in ability to germinate over 40 years and dormancy. Seed Science and Technology, 37(3), 640-649. Peterson, G., Mallik, A. (1995). Pin cherry (Prunus pensylvanica.) Seed Germination. http://www.cfs.nrcan.gc.ca/pubwarehouse/pdfs/32409.pdf. Pitt-Rivers, R., Impiombato, F. (1968). The binding of sodium dodecyl sulphate to various proteins. Biochemical Journal, 109, 825-830. Powell. M. S. (1986). Cell membranes and seed leachate conductivity in relation to the quality of seed for sowing. Journal of Seed Technology, 10(2), 81-100. Powell, M. S. (1977). Deteriorative changes in pea seeds (Pisum sativum L.) stored in humid or dry conditions. Journal of Experimental Botany, 28(1), 225-234. Price, J. S., et al. (2010). Landscape restoration after oil-sands mining: conceptual design and hydrological modelling for fen reconstruction. International Journal of Mining, Reclamation and Environment, 24(2), 109-123. Priestley, D. A. (1986). Seed Aging: Implications for Seed Storage and Persistence in the Soil. Ithaca, NY. : Comstock Associates. Priestley, D. A., Leopold, A. C. (1979). Absence of lipid oxidation during accelerated aging of soybean seeds. Plant Physiology, 63(4), 726-729. Probert, R.J. et al. (2009a). Ecological correlates of ex situ seed longevity: a comparative study on 195 species. Annals of botany, 104(1), 57-69. 99 Rabilloud, T., et al. (2010). Two-dimensional gel electrophoresis in proteomics: past, present and future. Journal of Proteomics, 73(11), 2064-2077. Rahoui, S., et al. (2010). Membrane damage and solute leakage from germinating pea seed under cadmium stress. Journal of Hazardous Materials, 178(1), 1128-1131. Rajjou, L. (2008a). Proteome-wide characterization of seed aging in Arabidopsis: a comparison between artificial and natural aging protocols. Plant Physiology, 148(1), 620-641. Rajjou, L. (2008b). Seed longevity: survival and maintenance of high germination ability of dry seeds. Comptes Rendus Biologies, 331(10), 796-805. Rao, R., et al. (2006). Storability of onion seeds and effects of packaging and storage conditions on viability and vigour. Scientia Horticulturae, 110(1), 1-6. Raymond, S., Weintraub, L. (1959). Acrylamide gel as a supporting medium for zone electrophoresis. Science, 130(3377), 711-711. Reilly, S. (1980). The carbon dioxide requirements of anaerobic bacteria. Journal of Medical Microbiology, 13(4), 573-579. Rice, K. J., Dyer, A. R. (2001). Seed aging, delayed germination and reduced competitive ability in Bromus tectorum. Plant Ecology, 155(2), 237-243. Riedl, K. M., et al. (2013). Variation in Lycopene and Lycopenoates, Antioxidant Capacity, and Fruit Quality of Buffaloberry (Shepherdia argentea [Pursh] Nutt.). Journal of Food Science, 78(11), 1673-1679. Ritenour, M. A., et al. (2001). Characterization of heat shock protein expression in apple peel under field and laboratory conditions. Journal of the American Society for Horticultural Science, 126(5), 564-570. Roberts, E. (1961). The viability of rice seed in relation to temperature, moisture content, and gaseous environment. Annals of Botany, 25(3), 381-390. Roberts, E. (1972). Storage environment and the control of viability Viability of Seeds (pp. 14-58). London: Springer Rodo, A. B., Filho, J. (2003). Accelerated aging and controlled deterioration for the determination of the physiological potential of onion seeds. Scientia Agricola, 60(3), 465-469. Rosner, L. S., Harrington, J. T. (2003). Optimizing Acid Scarification and Stratification Combinations for Russet Buffaloberry Seeds. Native Plants Journal, 4(2), 81-86. Rowland, S., et al. (2009). Recreating a functioning forest soil in reclaimed oil-sands in northern Alberta: An approach for measuring success in ecological restoration. Journal of Environmental Quality, 38(4), 1580-1590. Rowley, L., et al. (2007). Seed stratification of an Intermountain West chokecherry ecotype. Journal of the American Pomological Society, 61(4), 179. Rurek, M. (2010). Diverse accumulation of several dehydrin-like proteins in cauliflower (Brassica oleracea var. botrytis), Arabidopsis thaliana and yellow lupin (Lupinus luteus) mitochondria under cold and heat stress. BMC Plant Biology, 10(1), 181. Sales, K., et al. (2000). The LEA-like protein HSP 12 in Saccharomyces cerevisiae has a plasma membrane location and protects membranes against desiccation and ethanol-induced stress. Biochimica et Biophysica Acta (BBA)-Biomembranes, 1463(2), 267-278. Saravanan, R. S., Rose, J. K. (2004). A critical evaluation of sample extraction techniques for enhanced proteomic analysis of recalcitrant plant tissues. Proteomics, 4(9), 2522-2532. 100 Schägger, H., Von-Jagow, G. (1987). Tricine-sodium dodecyl sulfate-polyacrylamide gel electrophoresis for the separation of proteins in the range from 1 to 100 kDa. Analytical Biochemistry, 166(2), 368-379. Schwember, A. R., Bradford, K. J. (2010). Quantitative trait loci associated with longevity of lettuce seeds under conventional and controlled deterioration storage conditions. Journal of Experimental Botany, 61(15), 4423-4436. Schwember, A. R., Bradford, K. J. (2011). Oxygen interacts with priming, moisture content and temperature to affect the longevity of lettuce and onion seeds. Seed Science Research, 21(03), 175-185. Shaban, M. (2013). Review on physiological aspects of seed deterioration. International Journal of Agriculture and Crop Sciences, 6(13), 627-631. Shannon, S., et al. (2012). Competitive context alters plant–soil feedback in an experimental woodland community. Oecologia, 169(1), 235-243. Shaw, N., et al. (2012). A collaborative program to provide native plant materials for the Great Basin. Rangelands, 34(4), 11-16. Shih, M. D., et al. (2008). Late embryogenesis abundant proteins. Advances in Botanical Research, 48, 211-255. Solarik, K. A., et al. (2010). Seed tree density, variable retention, and stand composition influence recruitment of white spruce in boreal mixedwood forests. Canadian Journal of Forest Research, 40(9), 1821-1832. St-Pierre, R. (1993). Biology and culture of the chokecherry, Prunus virginiana L. var.melanocarpa (A. Nelson). http://www.prairie-elements.ca/chokecherry.html. St-Pierre, R., et al. (2005). Evaluation of growth, yield, and fruit size of chokecherry, pin cherry, highbush cranberry, and black currant cultivars in Saskatchewan. Canadian Journal of Plant Science, 85(3), 659-664. Stebel, A., et al. (2013). Interesting locality of medicinal plant Arctostaphylos uva-ursi (Ericaceae) in Silesia Province (Poland). Casopis Slezskeho Zemskeho Muzea (A), 62(2), 190-192. Steinberg, T. H. (2009). Protein gel staining methods: an introduction and overview. Methods in Enzymology, 463, 541-563. Steiner, A. M., Kruse, M. (2003). On the origin and rise of topographical tetrazolium testing - a brief historical restrospect. Paper presented at the ISTA working sheets on tetrazolium testing, Bassersdorf. Switzerland. Stevens, R., et al. (1981). Viability of seed from thirty-two shrub and forb species through fifteen years of warehouse storage. Western North American Naturalist, 41(3), 274-277. Stevens, R., et al. (1996). Forb and shrub seed production guide for Utah (Vol. 501, pp. 51). Utah State University. Suarez-Gonzalez, A., Good, S. V. (2013). Pollen limitation and reduced reproductive success are associated with local genetic effects in Prunus virginiana, a widely distributed self-incompatible shrub. Annals of Botany, 289-300. Takos, et al. (2012). Can Electrical Conductivity Predict Seed Germination of Three Pinus Species Silvae Genetica, 61(4), 168-170. Thuzar, M., et al. (2010). The effects of temperature stress on the quality and yield of soya bean [(Glycine max L.) Merrill.]. Journal of Agricultural Science, 2(1), 172179. 101 Towbin, H., et al. (1979). Electrophoretic transfer of proteins from polyacrylamide gels to nitrocellulose sheets: procedure and some applications. Proceedings of the National Academy of Sciences, 76(9), 4350-4354. Vertucci, C. W., Roos, E. E. (1990). Theoretical basis of protocols for seed storage. Plant Physiol, 94(3), 1019-1023. Wahid, A., Close, T. (2007). Expression of dehydrins under heat stress and their relationship with water relations of sugarcane leaves. Biologia Plantarum, 51(1), 104-109. Walck, J. L., et al. (2011). Climate change and plant regeneration from seed. Global Change Biology, 17(6), 2145-2161. Walters, C. (1998). Understanding the mechanisms and kinetics of seed aging. Seed Science Research, 8(2), 223-244. Walters, C. (2007). Materials used for seed storage containers: response to GómezCampo [Seed Science Research 16, 291–294 (2006)]. Seed Science Research, 17(04), 233-242. Walters, C., et al. (2010). Structural mechanics of seed deterioration: Standing the test of time. Plant Science, 179(6), 565-573. Walters, C., Engels, J. (1998). The effects of storing seeds under extremely dry conditions. Seed Science Research, 8(1), 13-30. Walters, C., et al. (2011). Long-term survival of cryopreserved germplasm: contributing factors and assessments from 30 year old experiments. Acta Horticulturae, 908, 113-120. Wang, et al. (2012). Food and Biomass Potential of Prunus virginiana L.(Chokecherry). Journal of Agricultural and Food Chemistry, 60(10), 2525-2530. Wang, X., et al. (2003). Plant responses to drought, salinity and extreme temperatures: towards genetic engineering for stress tolerance. Planta, 218(1), 1-14. Way, M. J. (2003). Collecting seed from non-domesticated plants for long-term conservation. Seed Conservation: Turning Science into Practice, 163-201. Webb, S. L., Willson, M. F. (1985). Spatial heterogeneity in post-dispersal predation on Prunus and Uvularia seeds. Oecologia, 67(1), 150-153. Wendel, G. (1990). Prunus pensylvanica L. f. Pin cherry. Silvics of North America, 2, 587-593. White, A. (1991). The importance of different forms of regeneration to secondary succession in a Maine hardwood forest. Bulletin of the Torrey Botanical Club, 303-311. Wiese, J. L., et al. (2012). Seed weights for northern Rocky Mountain native plants with an emphasis on Glacier National Park. Native Plants Journal, 13(1), 39-50. Willis, J. L., et al. (2012). Effects of scrification and harvest gap size on tree seedling establishment. Paper presented at the 18th Central Hardwood Forest Conference, Morgantown, WV. Woźnicka, A., et al. (2014). Quantitative and qualitative differences in morphological traits of endocarps revealed between Cornus L. species. Plant Systematics and Evolution, 1-18. Yamane, H., et al. (2006). Differential expression of dehydrin in flower buds of two Japanese apricot cultivars requiring different chilling requirements for bud break. Tree physiology, 26(12), 1559-1563. 102 Zhang, J., McDonald, M. (1997). The saturated salt accelerated aging test for smallseeded crops. Seed Science and Technology, 25(1), 123-131. 103 7 APPENDIX 104 Appendix 1: Influence of one-year storage treatments on protein patterns of chokecherry collected in 2010. An equal amount (35 μL) of total soluble protein extracts was loaded on each lane. Numbers on the left lane indicates the approximate molecular weights. 100 LBC 7278 V 81.49 1.52t 0.06t 80 LBC 3119 V 86.19 2.09t 0.05t 2 2 2 Radj 0.92 Viability (%) 2 Radj 0.88 P 0.0001 P 0.0001 60 Vf 29.18 1.96t 0.04t 2 40 105 Vf 40.67 3.9t 0.11t 2 2 Radj 0.51 2 Radj 0.66 p 0.0017 P 0.0003 20 0 0 10 20 30 0 10 20 30 Duration of aging (d) Appendix 4: Observed (symbol) and simulated (solid line) viability before germination and viability after germination (including germinated seeds) test of two low bush cranberry collections during artificial aging process at 45 °C with 60 % RH. Data are Means ± SE. Bars are standard errors (n=6). 100 Bear 1117 Bear 1618 V 82.86 0.13t 0.13t 2 80 V 87.86 1.04t 0.1t 2 106 Viability (%) 2 Radj 0.83 2 Radj 0.85 P 0.0001 60 40 20 P 0.0001 Vf 38.69 4.06t 0.12t 2 Vf 55.52 5.79t 0.15t 2 2 Radj 0.71 2 Radj 0.65 P 0.0001 P 0.0001 0 0 10 20 30 0 10 20 30 Duration of aging (d) Appendix 5: Observed (symbol) and simulated (solid line) viability before germination test and viability after germination (including germinated seeds) test of two bearberry collections during artificial aging process at 45°C with 60%RH. Data are Means ± SE (n=6). 107 Leakage conductivity ( s*cm-1g-1) 700 600 BEAR 1117 0d 5d 10 d 15 d 20 d 500 400 * * BEAR 1618 * * 300 200 100 0 0 2 5 12 24 48 0h 2h 5h 12h 24h 48h Soaking time (h) Appendix 6: Electrolyte conductivity of two bearberry collections after different artificial aging duration at 45°C with 60% RH. Bars are ±SE (n=6). ‘ * ’ indicates statistically significant difference in same soaking time (P < 0.05). -1 -1 Leakage conductivity ( s*cm g ) 500 0d 5d 10 d 15 d 20 d 400 300 * 200 LBC 7278 * * LBC 3119 * * * 108 * 100 0 0 2 5 12 24 48 0 2 5 12 24 48 Soaking time (h) Appendix 7: Electrolyte conductivity of two low bush cranberry collections after different artificial aging duration at 45°C with 60% RH. Bars are ±SE (n=6). ‘ * ’ indicates statistically significant difference in same soaking time (P < 0.05). * * -1 -1 Leakage conductivity ( s*cm mg ) 600 CHK 1114 PIN 8484 500 * * * * 400 * 300 109 200 100 0 2 5 12 24 48 0 2 5 12 24 48 Soaking time (h) Appendix 8: Electrolyte leakage conductivities of low bush cranberry collections after different artificial aging duration at 45°C with 60% RH. Bars are ±SE (n=6). ‘ * ’ indicates statistically significant difference in same soaking time (P < 0.05). Appendix 9: Simple correlation coefficients between various measures of seed quality for several low bush cranberry, bear berry and chokecherry collections during accelerated seed aging. VAG= Viability after germination, V=Viability before germination, EC=Electrolyte conductivity 110 Correlation Species VAG V EC Species ** ** AD -.50 -.85 -0.02 VAG 1.00 .34 .24 LBC 3119 LBC 7278 V 1.00 -.38* EC 1.00 ** ** AD -.76 -.94 -.11 ** VAG 1.00 .61 .22 BEAR 1117 BEAR 1618 V 1.00 -.17 EC 1.00 ** ** AD -.62 -.88 .67** VAG 1.00 .55** -.44* CHK 1114 V 1.00 -.87** EC 1.00 **. Correlation is significant at the 0.01 level (2-tailed). *. Correlation is significant at the 0.05 level (2-tailed). AD VAG V EC AD VAG V EC VAG -.61** 1.00 V -.82** .43* 1.00 -.77** 1.00 -.74** .51** 1.00 EC .12 -.06 -.53** 1.00 .32 -.39* -.60** 1.00 111 Appendix 10: Accumulation of dehydrins in dogwood seeds during seed aging process. The western bolt of total protein (35 μL/lane) was probed with antibodies against dehydrin protein. Numbers on the right lane indicate approximate molecular weights. 112 Appendix 11: Protein profiles of two dogwood collections during seed aging process. An equal amount (35 μL) of total soluble protein extracts was loaded on each lane. Numbers on the left indicate the approximate molecular weights. 113 Appendix 12: Changes of protein patterns of CHK 1410 and CHK 1114 after different aging duration. Numbers on the left indicate the approximate molecular weights. M: Marker, lane 1-5: 0 day aged CHK 1410 with different loading concentration; lane 1: 10 μL, lane 2: 15 μL, lane 3: 25 μL, lane 4: 30 μL, lane 5: 20 μL. Lane 6-7:5 d aged CHK 1410 with different loading concentration,lane 6: 30 μL, lane 7: 20 μL. Lane 8-13: CHK 1114 with different aging duration, an equal amount (35 μL) of total soluble protein extracts was loaded on each lane; lane 8: 0 d aged, lane 9: 5 d aged, lane 10: 10 d aged, lane 11: 15 d aged, lane 12: 20 d aged, lane 13: 25 d aged. 114 Appendix 13 Protein profiles of chokecherry and pin cherry seeds samples collected at different accelerate aging duration. An equal amount (35 μL) of total soluble protein extracts was loaded on each lane. Numbers on the left indicate the approximate molecular weights.


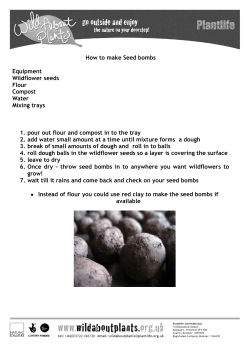


© Copyright 2026