
PDF presentation
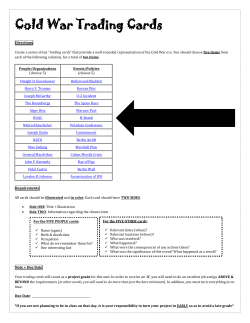
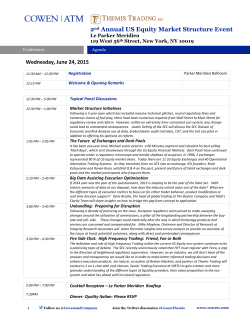
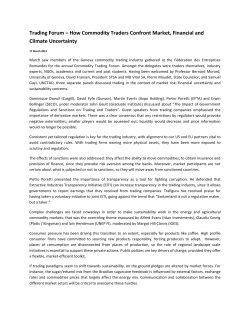
VR MATRIX
A short-term program for major currencies
with high level of risk diversification
CFTC REQUIRED RISK WARNING
FUTURES AND CURRENCIES TRADING INVOLVES SUBSTANTIAL RISK OF LOSS AND IS NOT SUITABLE FOR ALL INVESTORS. THERE
ARE UNIQUE RISKS ASSOCIATED WITH UTILISING INTERNET-BASED ORDER EXECUTION TRADING SYSTEMS INCLUDING, BUT
NOT LIMITED TO, THE FAILURE OF HARDWARE, SOFTWARE AND INTERNET CONNECTION. EDGINESS SOLUTIONS DOES NOT
CONTROL SIGNAL POWER, ITS RECEPTION OR ROUTING VIA INTERNET, CONFIGURATION OF YOUR EQUIPMENT OR
RELIABILITY OF ITS CONNECTION. EDGINESS SOLUTIONS IS NOT RESPONSIBLE FOR COMMUNICATION FAILURES,
DISTORTIONS OR DELAYS WHEN TRADING VIA THE INTERNET.
THE RETURNS SHOWN IN THIS REPORT ARE HYPOTHETICAL IN THAT THEY REPRESENT RETURNS IN A MODEL ACCOUNT. THE
MODEL ACCOUNT RISES OR FALLS BY THE EXACT SINGLE CONTRACT PROFIT AND LOSS. THE HYPOTHETICAL MODEL
ACCOUNT BEGINS WITH THE INTIAL CAPITAL LEVEL LISTED, AND IS RESET TO THAT AMOUNT EACH MONTH. THE RETURNS
REFLECT INCLUSION OF COMMISSIONS.
HYPOTHETICAL PERFORMANCE RESULTS HAVE INHERENT LIMITATIONS SOME OF WHICH ARE DESCRIBED BELOW. NO
REPRESENTATION IS BEING MADE THAT ANY ACCOUNT WILL OR IS LIKELY TO ACHIEVE PROFITS OR LOSSES SIMILAR TO THOSE
SHOWN. IN FACT, THERE ARE FREQUENTLY SHARP DIFFERENCES BETWEEN HYPOTHETICAL PERFORMANCE RESULTS AND THE
ACTUAL RESULTS SUBSEQUENTLY ACHIEVED BY ANY PARTICULAR TRADING PROGRAM. ONE OF THE LIMITATIONS OF
HYPOTHETICAL PERFORMANCE IS THAT THEY ARE PREPARED WITH THE BENEFIT OF HINDSIGHT. IN ADDITION, HYPOTHETICAL
TRADING DOES NOT INVOLVE FINANCIAL RISK, AND NO HYPOTHETICAL TRADING RECORD CAN COMPLETELY ACCOUNT
FOR THE IMPACT OF FINANCIAL RISK IN ACTUAL TRADING. FOR EXAMPLE, THE ABILITY TO WITHSTAND LOSSES OR TO ADHERE
TO A PARTICULAR TRADING PROGRAM IN SPITE OF TRADING LOSSES ARE MATERIAL POINTS WHICH CAN ADVERSELY AFFECT
ACTUAL TRADING RESULTS. THERE ARE NUMEROUS OTHER FACTORS RELATED TO THE MARKETS IN GENERAL OR TO THE
IMPLEMENTATION OF ANY SPECIFIC TRADING PROGRAM THAT CANNOT BE FULLY ACCOUNTED FOR IN THE PREPARATION OF
HYPOTHETICAL PERFORMANCE RESULTS AND ALL OF WHICH CAN ADVERSELY AFFECT ACTUAL TRADING RESULTS.
WHAT IS VR MATRIX?
VR Matrix is a fully automated trading program for
major fx pairs and their crosses.
Every pair is traded by a number or strategies,
therefore the whole program is a portfolio, or a
matrix of instruments and strategies.
WHY VR MATRIX?
Risk
diversification
High scalability
and robustness
Following the
market
Reduces risk using
different instruments
and different
variations of strategies
Large average trade
value and insensitivity
to execution make VR
Matrix highly scalable
The program aims to
capture short-term
trends which take up
to 70% of time in fx
DIVERSIFICATION
How it works?
The portfolio of strategies is
made so that to diversify risks
using different instruments
and different parameters.
Therefore when some
strategies are in drawdown
others help minimising it to
the maximum possible extent.
While some strategies are in a drawdown
others are trying to compensate
Strategy 1
Strategy 2
Strategy 3
SCALABILITY
With the increase of trading
size trading costs also increase, 1000
but the average trade value is
750
high enough to withstand
excessive trading costs
including commissions and
500
higher slippage. Low trading
frequency also allows partial
250
fills and use of algos to fill
very large orders.
0
Hypothetical trading costs vs
average trade value
Trading costs
Average trade
FOLLOWING THE MARKET
•
VR Matrix is not only designed as a mathematical
model: it aims to follow the micro- and mediumterm trends that are the essence of currency
market.
•
Since VR Matrix tries to exploit a universal
approach to most major currencies, it is not very
dependent on specific features of every currency.
RISKS
•
Systemic risks are mostly associated with low
volatility: since VR Matrix exploits volatility, it
struggles in low volatile markets.
•
Operational risks are associated with the need of
careful monitoring of positions since the program
is of “always in-the-market” type.
HOW ARE RISKS MANAGED?
SYSTEMIC RISKS
•
Since it is known that VR Matrix underperforms in
low volatile markets, it is possible to apply
appropriate money management during these
periods.
•
We support our clients with current market
analysis and advice on suggested money
management.
VOLATILITY TAKES OFF IN 2014
Since the market has broken out of the historically unprecedented low volatility,
it’s reasonable to look forward to increased productivity in the nearest future.
OPERATIONAL RISKS
The best way to manage operational risks is to
follow the trading signal subscription. In this case the
program is executed in a Tier 1 environment which
guarantees100% uptime and supervised by
professional traders.
300 000
280 000
260 000
240 000
220 000
200 000
180 000
160 000
140 000
120 000
100 000
80 000
60 000
40 000
20 000
0
Mar 2001 Jun 2002 Sep 2003 Dec 2004 Mar 2006 Jun 2007 Sep 2008 Dec 2009 Mar 2014 Jun 2014 Sep 2014 Dec 2014
PERFORMANCE
Performance chart based on 15 years of data, P/L in pips
KEY METRICS
General performance metrics
Holding period
Trade frequency
Average trade
value
Percent winners
Ratio avg.win/avg.
loss
Profit factor
Hours to weeks
1 trade a week to
4 trades a day
24 pips
42%
1.96
1.5
Return on drawdown metrics
Max. historical
drawdown
Avg. monthly
dradwown
Avg. annual
drawdown
Avg. monthly
return
Avg. annual
return
8700 pips
450 pips
5100 pips
1500 pips
17900 pips
Avg. return on Avg. return on
drawdown,
drawdown,
monthly
annual
3.33
3.5
ANNUAL PERFORMANCE
What to expect during low and high volatility
1. Net profit shown in pips
and should be multiplied
by 10 for a minimum
contract of 100K base
currency
2. Percent gain shown for an
account of $100K without
reinvestment
3. 2014 data is incomplete
Year
Net Profit 1
% Gain 2
Profit Factor
# of Trades
2014
2351 3
2.35
1.08
693
2013
17320
17.32
1.49
741
2012
3770
3.77
1.11
758
2011
14891
14.89
1.35
715
2010
25094
25.09
1.59
740
2009
36200
36.20
1.61
743
2008
59367
59.37
1.95
715
2007
20470
20.47
1.41
795
2006
11122
11.12
1.32
724
2005
11234
11.23
1.33
722
2004
14549
14.55
1.36
695
2003
18631
18.63
1.48
742
2002
8283
8.28
1.25
769
2001
6846
6.85
1.24
579
WHY ALL REPORTING IN PIPS?
•
Spot fx is highly leveraged, and changing leverage could
dramatically change all performance metrics.
•
Therefore it is incorrect to present any P/L figures as
percentage or money.
•
A report in pips gives a clear idea of performance and
can easily be recalculated to money using comfortable
risk profile.
HOW TO USE IT
Here’s how to calculate actual
P/L based on your comfortable risk profile
Avg. annual
drawdown, pips
Leverage
Account size
Avg. annual
Expected avg. annual
drawdown, percent
return, percent
5100
1:1
100,000
5.1%
17.9%
5100
1:2
100,000
10.2%
35.8%
5100
1:5
100,000
25.5%
89.5%
5100
1:10
100,000
51%
179%
You can choose whatever leverage that is comfortable
VR Matrix was developed using proprietary
Edgesense Research Framework — a unique tool
that allows to generate highly diversified robust
portfolios of strategies for various markets.
Learn more at http://edgesense.net/research
THANK YOU
For further information contact Edgesense Solutions
http://edgesense.net
[email protected]
US and Canada toll free: 888 333 78 58


© Copyright 2026