
LW Trading A Approach Style Region
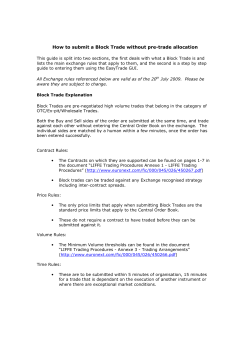
LW Trading A
Approach
Trend
Style
Scalping
Region
China
Investors
2011
After creating several automated trading systems and extensive research, LW Trading designed and developed the A strategy, composed of two systems based on very successful equities
approaches. Cost averaging is explicitly avoided in this scalping program. The main short-term price action based strategy system is designed to utilize a target of up to 10% of the balance at a time.
The target max drawdown is planned to be less than 20%. The strategy generally uses tight stop losses and take profits, however, positions are also closed via trade management and it is rare to hit
the stop. The LW Trading team has been primarily focused on trading in currencies for the last four years including EUR/USD, USD/CHF, USD/CAD and USD/JPY pairs and will, at times, include
GBP and NZD pairs. LW Trading’s O strategy focuses on EUR/USD, GBP/USD and AUD/USD pairs. After creating several automated trading systems and performing extensive research for others,
LW designed and developed their own automatic trading platform. The 'O' strategy is a mixed system which includes several strategies including pullback, breakout and scalping. The different systems
open positions on different conditions in order to hedge risk. LW optimizes the system according their backtest and forward test on each sub-strategy. They aim to control the drawdown of each sub
system to less than 6%-8% and limit the max loss of a single trade to less than 2%. LW Trading targets maximum drawdown of no more than 20%. The strategy operates with a maximum of 8
positions open at any time. The strategy typically executes 3 to 10 trades per day with leverage of 1:1 to 5:1. LW Trading’s Q strategy, called “Beyond Manual” is based on classic harmonic patterns
including Gartley, Butterfly, Crab, Bat and Cypher, and also some new harmonic patterns. The strategy opens positions when the harmonic patterns are observed and targets no more than five open
positions at a time. Leverage is typically 5:1 with a target maximum of 20:1. This manual system trades mainly on EUR/USD and aims to contain drawdown to no more than 20%. The lead trader at
LW Trading has over five years of experience trading Forex. | A Trade Leader's noted strategy is a guideline to how that Trade Leader thinks about trading and the market. This information is provided
to help investors choose among the various strategies. The Trade Leader reserves the right to makes changes to the trading strategy at any time, without notice, based on current market conditions. It
is your responsibility to change your personal program if you do not wish to continue following a Trade Leader after such a change. Trade Leaders are not required to adhere to the described strategy
and may engage in trading activity that varies materially.
Growth of initial $1,00019
Performance
$60,000
150%
100%
$40,000
50%
Annualized
156.9%
Last 12 Months
-14.0%
Last 3 Months
3.4%
Year - To - Date
1.8%
2013
6.3%
2012
18.7%
Trading Strategy
$20,000
0%
LIWWK.A
13
20
12
20
20
20
11
-50%
10
$0
S&P 500
LIWWK.A Monthly
Pairs Traded2
EUR/USD, USD/CAD
Avg. Duration3
3 hours
Avg. Gain4
10 pips
Avg. Loss5
19 pips
Win Rate6
65.2%
Frequency7
214 trades/mo
Automation8
Full
YEAR JAN
FEB
MAR
APR
MAY
JUN
JUL
AUG
SEP
OCT
NOV
DEC
YTD
Risk Management
2014
-4.4%
-1.2%
6.2%
-1.5%
-
-
-
-
-
-
-
1.8%
Max Drawdown9
23%
7/14/13
3.0%
2013
3.6%
7.0%
-0.8%
8.8%
5.1%
5.0%
-3.1%
0.9%
-7.3%
5.3%
-8.0%
-8.3%
6.3%
Start of max DD10
2012
-6.1%
-0.1%
11.9%
1.4%
4.7%
-4.9%
2.3%
3.3%
4.8%
3.8%
-1.1%
-1.5%
18.7%
End of max DD11
03/17/14
2011
31.0%
19.7%
-8.1%
10.5%
16.9%
12.7%
10.6%
-2.1%
-6.1%
10.2%
-6.6%
5.4%
131.4%
Recovery Date12
N/A
2010
-
-
-
-
-
109.4%
62.4%
21.0%
20.6%
83.0%
60.7%
0.5%
1,366.7% Max. Pos. Open13
Past performance is no indication of future results. Trading Strategy and Risk Management Target figures are based on
historical data or the trader’s stated strategy, and are not necessarily predictive of future results.
1. As of 6/3/2014
2. Pairs Traded: the currency pairs most commonly traded as part of Leader’s strategy
3. Avg. Duration: the average amount of time Leader holds a trade over the last 12 months
4. Avg. Gain: the average pip gain of wining trades, calculated over the last 12 months
5. Avg. Loss: the average loss in pips of losing trades over the last 12 months
6. Win Rate: the percentage of trades won by Leader, over the last 12 months
7. Frequency: the average number of trades executed per month over the last 12 months
8. Automation: the level of automation in Leader’s strategy
9. Max. Drawdown: trailing 12 month, the largest drawdown incurred by Leader, calculated over the last 12 months
10. Start of max DD: initial date of decline of highest strategy value (peak value) in the last 12 months
11. End of max DD: date in which maximum drawdown for period ceases (trough value) in the last 12 months
12. Date in which strategy reaches prior peak value in the last 12 months
13. Max. Positions open: the greatest number of positions open at the same time in Leader’s account, calculated over the period shown
14. Daily Volatility: standard deviation of daily Net ROI
15. Max. Leverage: maximum leverage typically experienced on the account since inception
16. Typical Leverage: average leverage for the previous six months, rounded up
17. Performance figures over the period 10 June 2010 - 31 May 2014
18. Source: Yahoo! Finance
19. Estimated performance of $1,000
5
Daily Volatility14
3%
Max Leverage15
17
Typical Leverage16
5
Investing Basics
Service Fee
2%
Performance Fee
20% Monthly
High Water Mark
Yes
© 2014 Currensee Limited is authorised and regulated by the Financial Conduct Authority (FCA), Firm Reference Number 518648 and Registered in England and Wales,
Companies House Number 07025997 | Please note that over the counter retail foreign currency (Forex) trading involves significant risk of loss. It is not suitable for all
investors and you should make sure you understand the risks involved before trading, and seek independent advice if necessary. Any opinions, news, research, analyses,
performance strategies, prices, charts or other information are not necessarily predictive of any particular result and do not constitute advice. Past performance is no
indication of future results. Investor returns may vary materially from Trade Leader returns based on slippage, broker spreads, volatility or other market conditions. If you
place additional trades in your account or you modify or cancel an order generated by your program you may achieve a materially different result than the Trade Leader(s)


© Copyright 2026