
The research impact of school psychology faculty
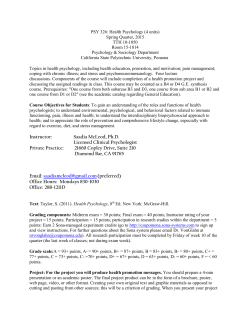
Journal of School Psychology 53 (2015) 231–241
Contents lists available at ScienceDirect
Journal of School Psychology
journal homepage: www.elsevier.com/locate/jschpsyc
The research impact of school psychology faculty
Marley W. Watkins a,⁎, Christina Y. Chan-Park b
a
b
Department of Educational Psychology, Baylor University, USA
University Libraries, Baylor University, USA
a r t i c l e
i n f o
Article history:
Received 30 September 2014
Received in revised form 11 February 2015
Accepted 20 March 2015
Available online xxxx
Keywords:
h-Index
Research
Faculty
Higher education
School psychology
a b s t r a c t
Hirsch's (2005) h index has become one of the most popular indicators of research productivity for
higher education faculty. However, the h index varies across academic disciplines so empirically
established norms for each discipline are necessary. To that end, the current study collected h
index values from Scopus and Google Scholar databases for 401 tenure-track faculty members
from 109 school psychology training programs. Male faculty tended to be more senior than female
faculty and a greater proportion of the male faculty held professorial rank. However,
female faculty members outnumbered males at the assistant and associate professor
ranks. Although strongly correlated (rho = .84), h index values from Google Scholar
were higher than those from Scopus. h index distributions were positively skewed with
many faculty having low values and a few faculty having high values. Faculty in doctoral
training programs exhibited significantly larger h index values than faculty in specialist
training programs and there were univariate differences in h index values across academic
rank and sex, but sex differences were not significant after taking seniority into account. It
was recommended that the h index be integrated with peer review and diverse other
indicators when considering individual merit.
© 2015 Society for the Study of School Psychology. Published by Elsevier Ltd. All rights reserved.
1. Introduction
There are approximately 315 school psychology training programs in the United States, of which 59 are accredited by the
American Psychological Association (APA) and around 225 are approved by the National Association of School Psychologists
(NASP; Rossen & von der Embse, 2014). In total, these programs serve more than 9500 students and are staffed by more than 600
faculty (Merrell, Ervin, & Peacock, 2012).
Faculty in school psychology programs, similar to faculty in other disciplines, are regularly evaluated, both pre- and post-tenure
(Fagan & Wise, 2007). Those evaluations traditionally encompass research, teaching, and service activities (Fagan & Wise, 2007;
McCormick & Barnes, 2008). However, research productivity often dominates the promotion and tenure process (Carter, 1989;
Green, 2008), and administrators typically agree that it would be difficult to achieve tenure in the absence of publications in refereed
journals (Balogun, Sloan, & Germain, 2007; Marchant & Newman, 1994). Research productivity has also been shown to affect salary
(Mittal, Feick, & Murshed, 2008), research support (McGrail, Rickard, & Jones, 2006), and hiring decisions (Fuerstman & Lavertu, 2005;
Martínez, Floyd, & Erichsen, 2011).
Given that journal articles are the most prestigious form of publication in most of the social sciences (Byrnes, 2007; Whitley & Kite,
2013), the research productivity of school psychology faculty has typically been quantified by their number of peer-reviewed journal
⁎ Corresponding author at: Department of Educational Psychology, Baylor University, Waco, TX 76798-7301, USA. Tel.: +1 254 710 4234.
E-mail address: [email protected] (M.W. Watkins).
Action Editor: Michelle K. Demaray
http://dx.doi.org/10.1016/j.jsp.2015.03.003
0022-4405/© 2015 Society for the Study of School Psychology. Published by Elsevier Ltd. All rights reserved.
232
M.W. Watkins, C.Y. Chan-Park / Journal of School Psychology 53 (2015) 231–241
publications. To that end, publication rankings of school psychology faculty have periodically been reported (Carper & Williams, 2004;
Grapin, Kranzler, & Daley, 2013; Little, 1997; Roberts, Davis, Zanger, Gerrard-Morris, & Robinson, 2006; Wagner, Lail, Viglietta, &
Burns, 2007). These reports have consistently revealed that school psychology faculty members publish, on average, 1 to 2 peerreviewed journal articles per year with considerable variability among authors. The most recent report indicated that faculty in
APA-accredited school psychology programs published an average of 1.2 journal articles per year but more than 50% of them published fewer than 1 article per year (Grapin et al., 2013). This pattern is consistent with surveys of the research productivity of academic psychologists in other specialty areas (Joy, 2006; Stewart, Roberts, & Roy, 2007) and of academics in other disciplines (RuizCastillo & Costas, 2014), which seems to roughly follow Lotka's (1926) inverse square law where the proportion of persons making
n contributions is about 1/n2 of those making one contribution.
The peer review process with its high rejection rates (e.g., 70% to 90% in the social sciences) would seem to ensure that
published research papers are of high quality and will positively impact scientific theory, research, and practice (Lee, 2012).
Unfortunately, peer review cannot detect studies that are based on inadequate or fraudulent data, report inaccurate results,
etc. (Bornmann & Daniel, 2008; Fanelli & Ioannidis, 2013; Flaherty, 2011; Kepes & McDaniel, 2013). Additionally, peer reviews
might be unreliable, biased, or invalid (Bohannon, 2013; Bornmann, 2011; Lee, Sugimoto, Zhang, & Cronin, 2013; Triggle &
Triggle, 2007), making the total number of publications a potentially misleading measure of research productivity (Aguinis,
Suárez-González, Lannelongue, & Joo, 2012).
Given these limitations, peer usage (the citation of a published research paper by other researchers) has been recommended to
supplement or replace publication numbers as an index of research productivity (Bornmann & Marx, 2014; Charlton, 2007; Duffy,
Jadidian, Webster, & Sandell, 2011). The most obvious quantification of peer usage is total citation count (Hargens, 1990), i.e., the
total number of times that a publication has been cited in other publications. It is assumed that high quality publications will generate
more citations from scientific colleagues than low quality or flawed publications (Bornmann & Daniel, 2008). To that end, one recent
report of the research productivity of school psychology faculty included citation counts (Grapin et al., 2013). In general, citation
counts for school psychology faculty follow the same pattern as publication counts, with many faculty members having few citations
and a few faculty members accumulating a large number of citations.
Unfortunately, the total number of citations may not reflect sustained or programmatic impact. For example, a student may coauthor an influential paper with a mentor but never author another cited paper. In this and other situations, the total citation
count is too sensitive to highly cited publications and may be inflated by a small number of influential papers. Thus, total citation
count may also be an imperfect indicator of research productivity (Coupe, 2013; Cronin & Meho, 2006).
Hirsch (2005) recognized the limitations of publications and citations as quantitative measures of research productivity and proposed a new bibliographic index to quantify “the scientific output of a researcher” (p. 16569). His h index is computed as the h number
of N papers that have at least h citations. For example, a researcher has published 8 papers with 3, 11, 2, 1, 9, 14, 10, and 1 citations,
respectively. After being rank ordered from highest to lowest, the citation counts for the 8 papers are 14, 11, 10, 9, 3, 2, and 1. The first
four papers have at least 4 citations each but the paper at rank 5 has fewer than 5 citations (e.g., 3), resulting in an h of 4. Thus, an h
index of 4 means that the researcher has authored at least 4 papers that have each been cited at least 4 times. Those 4 papers make up
the h core for this hypothetical scholar.
Although more than 50 variants of the h index have subsequently been proposed (Bornmann, 2014), analyses of quantitative
indices of research productivity have found that most are redundant with the h index (Bornmann & Marx, 2011) and that “the
easiest of the valid measures to understand and calculate is the h index” (Ruscio, Seaman, D'Oriano, Stremlo, & Mahalchik, 2012,
p. 142). Consequently, the h index has become one of the most popular indicators of research productivity (Egghe, 2010). It
combines an indicator of quantity (publications) and an indicator of quality (citations) into a single metric. Although not
universally endorsed (Waltman & van Eck, 2011) and not without limitations (Bornmann & Marx, 2011; Egghe, 2010), the h
index has exhibited several important strengths: (a) agreement with other measures of research productivity; (b) robustness
to erroneous or missing publications; (c) prediction of future research productivity; (d) discriminant validity with groups of
known high performers, (e) insensitivity to rarely cited as well as infrequent but highly cited publications; (f) computational
simplicity; and (g) resistance to self-citations and multi-authored publications (Egghe, 2010; Engqvist & Frommen, 2008;
Hirsch, 2005; Ruscio et al., 2012; Wainer & Vieira, 2013).
Although robust, the h index is dependent on the bibliographic database from which it was computed (Egghe, 2010). h
values and rankings for the same individual have been shown to vary across Scopus, Web of Science, and Google Scholar databases because the coverage of each database is different (Bar-Ilan, 2008). For example, Scopus does not index citations before
1996 and does not include books or conference presentations whereas Google Scholar includes over 30 different document
sources in its coverage, including books and conference presentations (Meho & Yang, 2007; Ruscio et al., 2012). Additionally,
the h index is field dependent: it varies across academic disciplines due to different publication and citation practices in
those disciplines (El Emam, Arbuckle, Jonker, & Anderson, 2012). For example, Hirsch (2005) applied the h index to physicists
at research universities and found that highly productive physicists had h values of around 45. In contrast, highly productive life
scientists had h values of around 57. Subsequent research has found widely varying h index levels across other academic
disciplines (Barner, Holosko, & Thyer, 2014; Duffy et al., 2011; Egghe, 2010; Ponterotto, Fingerhut, & McGuinness, 2012;
Wainer & Vieira, 2013).
Ruscio et al. (2012) concluded that “to evaluate individuals' scholarly impact we believe that in most cases Hirsch's (2005) h index
should be seriously considered” (p. 143). However, the discipline-specific sensitivity of the h index requires that h index values “be
accompanied by empirically established norms to contextualize their meaning objectively” (p. 125). Accordingly, the purpose of
this study is to provide h index norms for school psychology faculty.
M.W. Watkins, C.Y. Chan-Park / Journal of School Psychology 53 (2015) 231–241
233
2. Method
2.1. Participants
Participants in this study were core faculty members in school psychology programs: 261 from 59 doctoral programs accredited by
APA and another 140 from 50 specialist programs (47 approved by NASP). The demographic characteristics of those 401 faculty are
presented in Table 1.
2.2. Procedures
There were 59 APA accredited school psychology programs in the U.S. at the end of 2012 as listed on the web pages of the APA
Office of Program Consultation and Accreditation (http://www.apa.org/ed/accreditation/programs/accred-school.aspx). At the
same time, details on the faculty of approximately 175 specialist school psychology programs were listed by NASP (http://www.
nasponline.org/graduate-education/grad-edu.aspx). Based on the NASP list, one specialist program was randomly selected from 39
of the states plus the District of Columbia and two programs were randomly selected from each of the four most populous states
(CA, TX, NY, FL) for a total of 50 specialist programs. Five states had no program or only an APA accredited doctoral program (AK,
HI, MS, VT, WY).
The names of 401 core school psychology faculty were subsequently extracted from the web pages of those 109 school psychology
programs. Those with titles of lecturer, visiting, clinical, supervisory, teaching, retired, adjunct, instructor, emeritus, etc. were excluded
leaving only tenure-track or tenured faculty. Rank, doctoral granting institution, and graduation year were collected for each faculty
member. The Proquest Dissertation and Theses database was consulted when the doctoral granting institution or year were not found
on program web pages or in online curriculum vita. Sex was inferred from names and online pictures and descriptions. Data for each
participant was independently collected by the authors and disagreements were resolved by consensus.
Two non-overlapping additional samples of school psychology faculty were selected for validation purposes: 17 senior scientist
award recipients of the school psychology division of APA and 25 randomly selected members of the Society for the Study of School
Psychology (SSSP). Given their elected status, these faculty were expected to exhibit h values considerably higher than the average
school psychology faculty member.
2.3. Sources
There are a number of bibliographic databases that might serve as the source of h index values for school psychology faculty including ERIC, Scopus, Google Scholar, PsycINFO, and the Web of Science, which includes both the Social Sciences Citation Index (SSCI) and
the Science Citation Index (SCI). Each database has a distinct scope of subject coverage, retrospective span, type of publication included in the database (e.g., books, book chapters, dissertations, articles, etc.), and searchable fields (e.g., abstracts, full text, authors, citations, etc.). Several databases were ruled out due to these factors. For example, ERIC does not report citations and PsycINFO only began
to report citations in 2002 (Reed & Baxter, 2009). Likewise, the natural and life sciences coverage of the SCI is not compatible with the
typical research topics investigated by school psychology faculty.
The SSCI includes subject coverage appropriate for school psychology. However, it covers fewer than 3000 journals across more
than 50 disciplines. In contrast, Scopus indexes more than 21,000 titles in the life, social, physical, and health sciences with most journal content going back to 1995 (Harzing, 2014). Additionally, the Scopus database provides a unique identification number for each
author and it has been shown to be more accurate and reliable than other databases (Bornmann & Marx, 2014; Jacso, 2008, 2011,
2012; Meho & Rogers, 2008; Meho & Yang, 2007). Given these strengths, the Scopus database was selected as one source of h
index values for school psychology faculty.
Although considered to be less accurate than Scopus (Jacso, 2008, 2012; Meho & Yang, 2007) and vulnerable to manipulation (Beel
& Gipp, 2010), Google Scholar has become popular, does not require a subscription fee, contains data prior to 1996, indexes a wide
range of sources, and may therefore offer better coverage for some academic disciplines (Amara & Landry, 2012). Although the
ratio of journal to non-journal entries in Google Scholar is unknown, one study found that 92% of Google Scholar citations were
from journal articles (Vaughan & Shaw, 2008). Thus, there is substantial journal content in Google Scholar and it was selected as
Table 1
Number of school psychology faculty and median years since doctorate by sex, rank, and level of training program.
Specialist
Doctoral
Male
Rank
Assistant
Associate
Professor
Total
N
8
26
26
60
Female
Years
5.5
16.5
27.5
21
N
33
29
18
80
Note. Years = years since award of doctoral degree.
Total
Male
Years
5
15
23.5
13.5
N
17
38
66
121
Female
Years
5
14
31.5
23
N
39
50
51
140
Male
Years
6
15
25
16
N
25
64
92
181
Female
Years
5
15
30
22
N
72
79
69
220
Years
6
15
24
15
234
M.W. Watkins, C.Y. Chan-Park / Journal of School Psychology 53 (2015) 231–241
the second source for school psychology faculty h index values. Google Scholar was accessed through the Scholarometer program
(http://scholarometer.indiana.edu/).
Data were collected from both Scopus and Google Scholar during the second quarter of 2014 to ensure that all 2013 citations were
posted. For Scopus, first and last names were used in its author search option. Author middle initial and affiliation were subsequently
used to identify the target author if multiple authors with the same name were initially selected. The Scopus citation view was selected and publications through 2013 for each faculty member were sorted in descending citation order. After deletion of incorrect entries, the h index was extracted from each sorted citation list. Scholarometer author searches were conducted with first and last
names. If known, a middle initial was also used. Data were restricted to the years of 1960 through 2013 and four discipline ‘tags’
were applied to focus the search: educational and educational research, psychology, psychiatry, and medicine. Author affiliation
was subsequently used to identify the target author if multiple authors with the same name were initially identified. After deletion
of incorrect entries, citation values were extracted from the sorted citation lists. For both Scopus and Google Scholar, data for each participant was independently collected by an author and a research assistant with agreement of rho = .91. Disagreements were resolved
by consensus of the authors.
2.4. Analyses
Given the non-normality of the h index (skew = 1.88 and kurtosis = 8.24), non-parametric statistical tests were employed.
Depending on the number of samples and the nature of their relationships, these tests included the Kruskal–Wallis test for comparison of multiple independent samples and the Wilcoxon signed ranks test for comparison of related samples (Fahoome, 2002).
Relationships were quantified with the Spearman rank order correlation coefficient and complex relationships were analyzed with
quantile regression.
Quantile regression tries to minimize the sum of the absolute residuals and makes no assumptions about the distribution form of
variables (Petscher & Logan, 2014). In its most basic form, quantile regression estimates the median of the dependent variable conditional on the values of the independent variables. Uniquely, quantile regression allows for the estimation of the relationship between
dependent and independent variables at multiple locations of the independent variable. Analyses for this study were conducted with
the simultaneous-quantile regression routine in Stata to estimate the 25th, 50th, and 75th percentile locations and standard errors
computed with 100 bootstrap replications (Petscher & Logan, 2014). Sample sizes were too small to allow convergence on precise
and stable estimates of more extreme locations (Koenker & D'Orey, 1987). Each regression was followed by an omnibus test of the
statistical significance of the difference of the three slopes. If not significant, only results for the median regression were reported.
3. Results
3.1. Demographics
School psychology faculty members tended to be experienced (Range = 1–48, Md = 18.8 years since doctoral degree) and disproportionately of full professor rank (40%). As expected (see Table 1), years since doctoral degree were significantly different across assistant, associate, and professor ranks (X2 = 245.5, df = 2, p b .001). Years since doctoral degree were also significantly different for
males and females (X2 = 27.6, df = 1, p b .001) in favor of males (Md = 22 years for males and 15 years for females). In contrast, the
senior scientist awardees were on average 34 years post-doc and SSSP members were 29 years post-doc, significantly longer than all
APA and NASP faculty (X2 = 35.6, df = 1, p b .001), but not significantly different from APA and NASP full professors (X2 = 2.4, df = 1,
p = .12). Faculty web pages and online curriculum vita revealed that a number of school psychology faculty held post-doctoral or
clinical practice positions before assuming an academic appointment. Thus, years after receiving a doctoral degree were not always
congruent with years of professorial experience.
Consistent with demographic trends in school psychology (Castillo, Curtis, & Tan, 2014), female faculty members outnumbered
male faculty members at the assistant (72 vs. 25, respectively) and associate (79 vs. 64, respectively) professor ranks. Although
male faculty members were more numerous at the full professor rank, they received their doctoral degrees around 5 years prior to
the female full professors. Thus, it appears that academic school psychology will become more female over the coming decade as
the current assistant and associate professors advance in rank and the current full professors retire.
Doctoral training programs typically were housed in institutions with Carnegie classifications (http://classifications.
carnegiefoundation.org/) of high (22%) to very high (63%) research whereas the specialist training programs were predominantly
housed in institutions with doctoral or lower research classifications (70%). Taken at the individual level, training program research
classification was strongly related to h index values (rho = .51 and .56 for Scholarometer and Scopus databases, respectively).
3.2. Scholarometer h index
3.2.1. Specialist training faculty
Means, medians, and standard deviations of Scholarometer h index values of the 140 school psychology faculty in specialist training programs are presented in Table 2. There was a significant difference across ranks (X2 = 134.8, df = 2, p b .001). Likewise, there
was a significant difference between males and females (X2 = 10.2, df = 1, p = .001) in favor of males (Md = 4 for males and 2.5 for
females). However, sex was no longer significant after years since doctoral degree was covaried via quantile regression (t = −0.82,
M.W. Watkins, C.Y. Chan-Park / Journal of School Psychology 53 (2015) 231–241
235
Table 2
Median (95% standard error) and mean (standard deviation) h index values from scholarometer and scopus of school psychology faculty by rank and level of training.
Specialist
Rank
Scholarometer
Assistant
Associate
Professor
Total
Scopus
Assistant
Associate
Professor
Total
Doctoral
Total
Median
Mean (SD)
Median
Mean (SD)
Median
Mean (SD)
1 (0.33)
4 (0.52)
5.5 (1.13)
3 (0.50)
1.97 (2.27)
4.05 (3.27)
8.70 (8.09)
4.91 (5.77)
4 (0.77)
10 (0.56)
17 (1.15)
11 (0.59)
4.93 (3.97)
10.45 (6.13)
19.22 (11.51)
13.20 (10.42)
3 (0.65)
7 (0.95)
14 (1.00)
8 (0.70)
3.68 (3.65)
7.99 (6.07)
16.35 (11.65)
10.30 (9.89)
1 (0.22)
2 (0.46)
3 (0.64)
2 (0.43)
1.66 (2.16)
2.40 (2.30)
3.57 (3.27)
2.55 (2.70)
3 (0.46)
6 (0.74)
7 (0.54)
6 (0.48)
3.39 (2.91)
6.77 (4.34)
8.69 (5.80)
6.91 (5.21)
2 (0.54)
4 (0.38)
6 (0.52)
4 (0.29)
2.66 (2.75)
5.09 (4.26)
7.29 (5.70)
5.39 (4.95)
p = .41). Nor were there significant differences between the slopes at the 25th, 50th, and 75th percentiles of the Scholarometer h
index distribution for males and females, F (2,137) = 0.19, p = .83, after seniority was considered.
3.2.2. Doctoral training faculty
Means, medians, and standard deviations of Scholarometer h index values of the 261 school psychology faculty in doctoral training
programs are presented in Table 2. There was a significant difference across ranks (X2 = 106.1, df = 2, p b .001). Likewise, there was a
significant difference between males and females (X2 = 13.7, df = 1, p b .001) in favor of males (Md = 12 for males and 10 for females).
However, sex was no longer significant after years since doctoral degree was covaried via quantile regression (t = −1.70, p = .09). Nor
were there significant differences between the slopes at the 25th, 50th, and 75th percentiles of the Scholarometer h index distribution
for males and females, F (2, 258) = 0.95, p = .39, after seniority was considered.
3.2.3. Combined doctoral and specialist training faculty
A histogram of Scholarometer h index values for all 401 school psychology faculty is provided in Fig. 1 and box plots of
Scholarometer h index values for male and female faculty across assistant, associate, and professor ranks are included in Fig. 2.
Table 3 provides a cumulative frequency distribution of h index values for faculty in training programs at both doctoral and specialist
levels. Faculty from doctoral training programs exhibited significantly larger Scholarometer h index values than faculty from specialist
training programs (X2 = 95.9, df = 1, p b .001).
There were significant differences across ranks (X2 = 134.8, df = 2, p b .001) and between males and females (X2 = 22.8, df = 1,
p b .001) in favor of males (Md = 10 for males and 6 for females). However, sex was no longer significant after years since doctoral
degree was covaried via quantile regression (t = −1.76, p = .08). Nor were there significant differences between the slopes at the
25th, 50th, and 75th percentiles of the Scholarometer h index distribution for males and females, F (2, 398) = 0.46, p = .63, after
seniority was considered.
0
50
Frequency
100
150
3.2.4. Validity sample
As expected, the Scholarometer h index values of the validity sample (senior scientists and SSSP members) were significantly
higher (Md = 29.5) than those of the total school psychology training faculty (Md = 8.0, X2 = 78.6, df = 1, p b .001) and the school
psychology training faculty with the rank of full professor (Md = 14.0, X2 = 41.6, df = 1, p b .001).
0
20
40
Scholarometer h−Index
60
80
Fig. 1. Histogram of h index values from Scholarometer for 401 faculty in school psychology training programs.
M.W. Watkins, C.Y. Chan-Park / Journal of School Psychology 53 (2015) 231–241
0
10
Scholarometer h−Index
20
30
40
50
60
70
236
Assistant Associate Professor
Assistant Associate Professor
Male
Female
Fig. 2. Box plots of h index values from Scholarometer for 401 male and female faculty in school psychology training programs across assistant, associate, and professor
ranks.
3.3. Scopus h Index
3.3.1. Specialist training faculty
Means, medians, and standard deviations of Scopus h index values for the 140 school psychology faculty in specialist training programs are presented in Table 2. There was a significant difference across ranks (X2 = 10.5, df = 2, p = .005). Likewise, there was a
significant difference between males and females (X2 = 6.6, df = 1, p = .010) in favor of males (Md = 2 for males and 1 for females).
However, sex was no longer significant after years since doctoral degree was covaried via quantile regression (t = −1.25, p = .21).
Nor were there significant differences between the slopes at the 25th, 50th, and 75th percentiles of the Scopus h index distribution for
males and females, F (2, 136) = 0.15, p = .86, after seniority was considered.
3.3.2. Doctoral training faculty
Means, medians, and standard deviations of Scopus h index values of the 261 school psychology faculty in doctoral training programs are presented in Table 2. There was a significant difference across ranks (X2 = 48 .8, df = 2, p b .001). Likewise, there was a
significant difference between males and females (X2 = 7.7, df = 1, p = .005) in favor of males (Md = 6 for males and 5 for females).
However, sex was no longer significant after years since doctoral degree was covaried via quantile regression (t = −1.41, p = .16).
Nor were there significant differences between the slopes at the 25th, 50th, and 75th percentiles of the Scopus h index distribution for
males and females, F (2, 258) = 0.51, p = .60, after seniority was considered.
3.3.3. Combined doctoral and specialist training faculty
A histogram of Scopus h index values for all 401 school psychology faculty is provided in Fig. 3 and box plots of Scopus h index
values for males and females across assistant, associate, and professor ranks are included in Fig. 4. Table 3 provides a cumulative
frequency distribution of Scopus h index values for faculty in training programs at both doctoral and specialist levels. Faculty from
doctoral training programs exhibited significantly larger Scopus h index values than faculty from specialist training programs
(X2 = 95.8, df = 1, p b .001).
There was a significant difference across ranks (X2 = 63.6, df = 2, p b .001) with median Scopus h indexes of 2, 4, and 6 for assistant, associate, and professors, respectively. Likewise, there was a significant difference between males and females (X2 = 11.9, df = 1,
p = .001) in favor of males (Md = 5 for males and 3.5 for females). However, sex was no longer significant after years since doctoral
degree was covaried via quantile regression (t = −1.11, p = .27). Nor were there significant differences between the slopes at the
25th, 50th, and 75th percentiles of the Scopus h index distribution for males and females, F (2, 398) = 1.11, p = .33, after seniority
was considered.
3.3.4. Validity sample
As expected, the Scopus h index values of the validity sample (senior scientists and SSSP members) were significantly higher
(Md = 12.5) than those of the total school psychology training faculty (Md = 4.0, X2 = 59.1, df = 1, p b .001) and the school psychology training faculty with the rank of full professor (Md = 6.0, X2 = 34.0, df = 1, p b .001).
3.3.5. Scholarometer and Scopus h index comparison
Summary statistics for the h index values from both Scholarometer and Scopus are presented in Table 2. Frequency distributions
are reported in Table 3. The h index values derived from Scopus and Google Scholar via Scholarometer were strongly correlated
(rho = .84) but values from Scholarometer were significantly higher than the values from Scopus (Z = −14.75, p b .001). For example, an h index value of 8 would be at the 53rd percentile for Scholarometer but the 79th percentile for Scopus. These results are
M.W. Watkins, C.Y. Chan-Park / Journal of School Psychology 53 (2015) 231–241
237
Table 3
Distribution of h index values for faculty in school psychology training programs at both doctoral and specialist levels.
Scholarometer percentiles
Scopus percentiles
h Index
Specialist
Doc
Combined
Specialist
Doc
Combined
0
1
2
3
4
5
6
7
8
9
10
11
12
13
14
15
16
17
18
19
20
21
22
23
24
25
26
27
28
29
30
31
32
33
34
35
36
37
38
39
40
41–47
48+
15
29
39
51
64
73
77
82
84
86
87
88
89
91
94
95
96
97
97
97
98
98
98
98
99
99
99
99
99
99
99
99
99
99
99.9
2
6
11
15
18
23
26
31
36
40
47
53
58
63
66
69
71
74
79
80
83
84
87
88
89
89
90
92
92
93
93
94
94
95
95
96
97
97
97
98
98
98
99.9
6
14
20
28ae
34
41
44
49f
53b
56
61
65
69
73
76g
78
79c
82
85
86
88
89
90
91
92
93
93
94
94
95
95h
96d
96
97
97
97
98
98
98
98
98
99
99.9
21
46
61
74
84
87
91
92
95
96
98
99
99
99.9
3
11
18
28
36
49
58
64
70
73
78
83
88
89
92
94
95
96
97
98
98
99
99
99
99
99
99
99
99
99
99.6
99.9
10
24
33e
44a
53f
62b
70g
74c
79
81
85
89
92
93h
95d
96
97
98
98
98
99
99
99
99
99
99
99
99.5
99.5
99.5
99.75
99.9
Note.
a
Mean of assistant professors
b
Mean of associate professors.
c
Mean of professors.
d
Mean of validity sample.
e
Median of assistant professors.
f
Median of associate professors.
g
Median of professors.
h
Median of validity sample.
illustrated in Fig. 5. Discrepant results between these databases are consistent with studies in other disciplines (Bar-Ilan, 2008; Meho
& Yang, 2007; Mikki, 2010) and may reflect the influence of duplicate records, false-positives, and inaccuracies previously reported for
Google Scholar as well as its coverage of a wider range of sources (El Emam et al., 2012; Jacso, 2008, 2012; Ruscio et al., 2012).
4. Discussion
The purpose of this study was to provide h index norms for faculty in both doctoral and specialist school psychology training
programs. Accordingly, the h index of 401 school psychology faculty members were extracted from the Scopus and Google Scholar
(via Scholarometer) databases for those faculty. Male faculty tended to have more years of post-doctoral experience than female
faculty and a greater proportion of the male faculty held professorial rank. h index values were significantly different between
male and female faculty, in favor of the males, when tested univariately. However, sex was no longer a significant predictor of h
index values after faculty seniority was taken into account.
M.W. Watkins, C.Y. Chan-Park / Journal of School Psychology 53 (2015) 231–241
0
50
Frequency
100
150
238
0
10
20
30
Scopus h−Index
Fig. 3. Histogram of h index values from Scopus for 401 faculty in school psychology training programs.
0
Scopus h−Index
10
20
30
As expected, h index values were significantly different across assistant, associate, and professor ranks. The rank distinction was
most apparent with h indexes from the Google Scholar database, but variability among faculty caused index values from both databases to overlap. In contrast, superior research productivity was clearly delimited with the validity sample of senior scientists and
SSSP members that performed significantly above the school psychology training program faculty.
Also expected, the h index values for school psychology faculty derived from Scopus and Google Scholar via Scholarometer were
strongly correlated but values from Scholarometer were higher than the values from Scopus. Google Scholar indexes more journals
and sources than Scopus and may contain more errors, but h index values are relatively robust to bibliographic errors and missing information (Egghe, 2010; Ruscio et al., 2012) and, consequently, tend to rank order authors similarly with Scopus (Meho & Yang,
2007). Some evidence suggests that Google Scholar has become more accurate in recent years (Harzing, 2013, 2014), and its broader
source coverage may more accurately reflect the contributions of some researchers. For example, scholars who are invested in solving
practical problems may disseminate their results via outlets that are more likely to be used by practitioners, which may impact on
public policy or clinical practice without extensive citation in traditional journals (Amara & Landry, 2012). Consequently, selection
of an appropriate database is dependent on context.
Previous surveys of the scholarly productivity of school psychology faculty have tended to focus on the number of scholarly
publications and none have reported h index values. The most recent survey of publications found that the number of papers was
positively skewed with many faculty publishing few papers and a few faculty publishing many papers (Grapin et al., 2013). A similar
skewed distribution was found for the number of citations. The current study also found a positively skewed distribution of h index
values (see Figs. 1 and 3).
Grapin et al. (2013) did not consider years of experience nor rank and found significant differences between male and female
school psychology faculty members in favor of males, but the amount of variance explained by sex differences was small (≈2–4%).
Other studies of academic psychologists have found that seniority or rank accounted for most of the difference in male–female
research productivity (Duffy et al., 2011; Nosek et al., 2010). In the current study, sex differences were not statistically
Assistant Associate Professor
Assistant Associate Professor
Male
Female
Fig. 4. Box plots of h index values from Scopus for 401 male and female faculty in school psychology training programs across assistant, associate, and professor ranks.
239
0
10
20
30
40
50
60
70
M.W. Watkins, C.Y. Chan-Park / Journal of School Psychology 53 (2015) 231–241
Assistant
Associate
Scholarometer h−Index
Professor
Scopus h−Index
Fig. 5. Box plots of h index values from Scopus and Google Scholar (via Scholarometer) for 401 faculty in school psychology training programs across assistant, associate,
and professor ranks.
significant after seniority was considered. Thus, sex differences may not be a major influence on the research productivity of
school psychology faculty.
4.1. Limitations
Although we tried to fairly sample the population of school psychology faculty, it is always possible that those faculty not included
in our sample are somehow different and would have produced disparate results. It is also possible that program websites from which
we extracted information were out of date or inaccurate. Additionally, significant changes may have occurred in publication or citation
patterns since 2013. For instance, the recent proliferation of open-access journals and “predatory” publishers (Beall, 2014; Bohannon,
2013). It is also possible that the increasing number of journals, articles, and researchers as well as enhanced bibliographic database
coverage will make the current h index norms inaccurate at some point in time (Michels & Schmoch, 2012). Consequently, these
norms should be updated periodically to ensure validity.
Quantile regression has less power to detect differences than linear regression and the relatively small number of school psychology faculty made it difficult to reliably estimate stable results for extremely high performers. Consequently, there may be differences
between male and female scholars at some extreme but this study was unable to detect them. For example, small gender differences
were found when the research productivity of the entire population of more than 58,000 Italian university professors was analyzed
(Abramo, Cicero, & D'Angelo, 2015).
Only two prior studies of academic psychologists have utilized the Google Scholar database and none have used the Scopus database. The first study analyzed the scholarly productivity of 611 social and personality psychologists and found a mean h index value of
21.3 (Nosek et al., 2010). The second study computed the h index for 1080 academic psychologists in selected departments and found
a mean value of 11.32 (Barner et al., 2014). The current study found a mean h index of 10.3 and a median index of 8 with Google Scholar
for school psychology faculty. It is unclear if these widely varying h index values among academic psychologists are due to differences
in rank and years in the field for each sample, different publication and citation practices in specialty areas of psychology, different
databases, or a combination of all these factors. In any case, it is clear that both the reference database and the scholarly discipline
exert a major influence on h index values. Therefore, any comparison of h index values must take those factors into consideration.
Finally, the validity of the h index must be considered. The h index is only one metric and one number cannot conceivably capture
all the information that exists about an individual's career-long research productivity (Adler, Ewing, & Taylor, 2009). Books, book
chapters, grants, software, articles in non-English journals, etc. could be overlooked by this metric. Likewise, a particular sub-field
may be too small to produce frequent citations (Nosek et al., 2010). Conversely, an h index might be inflated by several illconceived articles that generated numerous refutations by other authors (Blyth, Shardlow, Masson, Lyons, Shaw, & White, 2010) or
by faulty citation practices (Simkin & Roychowdhury, 2003). Additionally, there may be a ceiling effect where two authors with the
same h index may differ substantially. For example, one author with an h index of 10 may have published 10 papers with 10 citations
each whereas a second author with an identical h index of 10 may have published 10 papers with 100 citations each.
5. Conclusions
The h index is easy to calculate and understand. Given these attributes, Selek and Saleh (2014) recommended that rank normative
median h index values be used as standards for academic promotion. The current study found significant differences in median h index
values between assistant, associate, and professors in school psychology training programs. These values might be used as national
norms for the discipline (see Tables 2 and 3). However, h index values vary between specialist and doctoral programs as well as across
bibliographic databases. Values and standards may also differ across departments and institutions (Lazaridis, 2010) so local h index
norms might be useful supplements to national norms. Previous researchers have described the perils of relying too heavily on one
240
M.W. Watkins, C.Y. Chan-Park / Journal of School Psychology 53 (2015) 231–241
source or one measure when making high stakes decisions and recommended that bibliographic metrics be supplemented with other
indicators (Adler et al., 2009; Bornmann & Marx, 2011, 2014; Costas & Bordons, 2007; Ruscio et al., 2012; Sahel, 2011; Waltman,
Costas, & van Eck, 2012). Following this advice, the h index values found in Tables 2 and 3 should not be used in isolation to judge
an individual school psychologist's research productivity. Although many quantitative measures of research productivity are highly
correlated (Duffy et al., 2011; Grapin et al., 2013; Nosek et al., 2010), each accounts for unique variance and should be integrated
with peer review and other diverse indicators when considering individual merit.
Acknowledgments
The contributions of Wencong Chen, Laura Knowles, Helene Okpere, and Katie Yarbro are gratefully acknowledged.
References
Abramo, G., Cicero, T., & D'Angelo, C. A. (2015). Should the research performance of scientists be distinguished by gender? Journal of Informetrics, 9, 25–38. http://dx.
doi.org/10.1016/j.joi.2014.11.002.
Adler, R., Ewing, J., & Taylor, P. (2009). Citation statistics. Statistical Science, 24, 1–14. http://dx.doi.org/10.1214/09-STS285.
Aguinis, H., Suárez-González, I., Lannelongue, G., & Joo, H. (2012). Scholarly impact revisited. Academy of Management Perspectives, 26, 105–132. http://dx.doi.org/10.
5465/amp.2011.0088.
Amara, N., & Landry, R. (2012). Counting citations in the field of business and management: Why use Google Scholar rather than the Web of Science. Scientometrics, 93,
553–581. http://dx.doi.org/10.1007/s11192-012-0729-2.
Balogun, J. A., Sloan, P. E., & Germain, M. (2007). Core values and evaluation processes associated with academic tenure. Perceptual and Motor Skills, 104, 1107–1115.
http://dx.doi.org/10.2466/PMS.104.4.1107-1115.
Bar-Ilan, J. (2008). Which h-index? — A comparison of WoS, Scopus and Google Scholar. Scientometrics, 74, 257–271. http://dx.doi.org/10.1007/s11192-008-0216-y.
Barner, J. R., Holosko, M. J., & Thyer, B. A. (2014). American social work and psychology faculty members' scholarly productivity: A controlled comparison of citation
impact using the h-index. British Journal of Social Work, 44, 2448–2458. http://dx.doi.org/10.1093/bjsw/bct161.
Beall, J. (2014). Unintended consequences: The rise of predatory publishers and the future of scholarly publishing. Editorial Office News, 2014(2), 4–6.
Beel, J., & Gipp, B. (2010, June). The robustness of Google Scholar against spam. In the proceedings of the 21st ACM Conference on Hypertext and Hypermedia, Toronto,
Canada.
Blyth, E., Shardlow, S. M., Masson, H., Lyons, K., Shaw, I., & White, S. (2010). Measuring the quality of peer-reviewed publications in social work: Impact factors —
Liberation or liability? Social Work Education, 29, 120–136. http://dx.doi.org/10.1080/02615470902856705.
Bohannon, J. (2013). Who's afraid of peer review? Science, 342, 60–65. http://dx.doi.org/10.1126/science.342.6154.60.
Bornmann, L. (2011). Scientific peer review. Annual Review of Information Science and Technology, 45. (pp. 199–245). http://dx.doi.org/10.1002/aris.2011.1440450112.
Bornmann, L. (2014). h-index research in scientometrics: A summary. Journal of Informetrics, 8, 749–750. http://dx.doi.org/10.1016/j.joi.2014.07.004.
Bornmann, L., & Daniel, H. -D. (2008). What do citation counts measure? A review of studies on citing behavior. Journal of Documentation, 64, 45–80. http://dx.doi.org/
10.1108/00220410810844150.
Bornmann, L., & Marx, W. (2011). The h index as a research performance indicator. European Science Editing, 37, 77–80.
Bornmann, L., & Marx, W. (2014). How to evaluate individual researchers working in the natural and life sciences meaningfully? A proposal of methods based on
percentiles of citations. Scientometrics, 98, 487–509. http://dx.doi.org/10.1007/s11192-013-1161-y.
Byrnes, J. P. (2007). Publishing trends of psychology faculty during their pretenure years. Psychological Science, 18, 283–286. http://dx.doi.org/10.1111/j.1467-9280.
2007.01889.x.
Carper, R. M., & Williams, R. L. (2004). Article publications, journal outlets, and article themes for current faculty in APA-accredited school psychology programs: 1995–
1999. School Psychology Quarterly, 19, 141–165. http://dx.doi.org/10.1521/scpq.19.2.141.33312.
Carter, R. E. (1989). Comparison of criteria for academic promotion of medical-school and university-based psychologists. Professional Psychology: Research and
Practice, 20, 400–403. http://dx.doi.org/10.1037//0735-7028.20.6.400.
Castillo, J. M., Curtis, M. J., & Tan, S. Y. (2014). Personnel needs in school psychology: A 10-year follow-up study on predicted personnel shortages. Psychology in the
Schools, 51, 832–849. http://dx.doi.org/10.1002/pits.21786.
Charlton, B. G. (2007). Peer usage versus peer review. British Medical Journal, 335, 451. http://dx.doi.org/10.1136/bmj.39304.581574.94.
Costas, R., & Bordons, M. (2007). The h-index: Advantages, limitations and its relation with other bibliometric indicators at the micro level. Journal of Informetrics, 1,
193–203. http://dx.doi.org/10.1016/j.joi.2007.02.001.
Coupe, T. (2013). Peer review versus citations — An analysis of best paper prizes. Research Policy, 42, 295–301. http://dx.doi.org/10.1016/j.respol.2012.05.004.
Cronin, B., & Meho, L. (2006). Using the h-index to rank influential information scientists. Journal of the American Society for Information Science and Technology, 57,
1275–1278. http://dx.doi.org/10.1002/asi.20354.
Duffy, R. D., Jadidian, A., Webster, G. D., & Sandell, K. J. (2011). The research productivity of academic psychologists: Assessment, trends, and best practice recommendations.
Scientometrics, 89, 207–227. http://dx.doi.org/10.1007/s11192-011-0452-4.
Egghe, L. (2010). The Hirsch index and related impact measures. Annual Review of Information Science and Technology, 44. (pp. 65–114). http://dx.doi.org/10.1002/aris.
2010.1440440109.
El Emam, K., Arbuckle, L., Jonker, E., & Anderson, K. (2012). Two h-index benchmarks for evaluating the publication performance of medical informatics researchers.
Journal of Medical Internet Research, 14(5). http://dx.doi.org/10.2196/jmir.2177 e144.
Engqvist, L., & Frommen, J. G. (2008). The h-index and self-citations. Trends in Ecology and Evolution, 23, 250–252. http://dx.doi.org/10.1016/j.tree.2008.01.009.
Fagan, T. K., & Wise, P. S. (2007). School psychology: Past, present, and future (3rd ed.). Bethesda, MD: National Association of School Psychologists.
Fahoome, G. (2002). Twenty nonparametric statistics and their large sample approximations. Journal of Modern Applied Statistical Methods, 1, 248–268.
Fanelli, D., & Ioannidis, J. P. A. (2013). US studies may overestimate effect sizes in softer research. Proceedings of the National Academy of Sciences, 110, 15031–15036.
http://dx.doi.org/10.1073/pnas.1302997110.
Flaherty, D. K. (2011). The vaccine-autism connection: A public health crisis caused by unethical medical practices and fraudulent science. Annals of Pharmacotherapy,
45, 1302–1304. http://dx.doi.org/10.1345/aph.10318.
Fuerstman, D., & Lavertu, S. (2005). The academic hiring process: A survey of department chairs. PS: Political Science & Politics, 38, 731–736. http://dx.doi.org/10.1017/
S1049096505050225.
Grapin, S. L., Kranzler, J. H., & Daley, M. L. (2013). Scholarly productivity and impact of school psychology faculty in APA-accredited programs. Psychology in the Schools,
50, 87–101. http://dx.doi.org/10.1002/pits.21658.
Green, R. G. (2008). Tenure and promotion decisions: The relative importance of teaching, scholarship, and service. Journal of Social Work Education, 44, 117–127.
http://dx.doi.org/10.5175/JSWE.2008.200700003.
Hargens, L. L. (1990). Citation counts and social comparisons: Scientists' use and evaluation of citation index data. Social Science Research, 19, 205–221. http://dx.doi.
org/10.1016/0049-089X(90)90006-5.
Harzing, A. -W. (2013). A preliminary test of Google Scholar as a source for citation data: A longitudinal study of Nobel prize winners. Scientometrics, 94, 1057–1075.
http://dx.doi.org/10.1007/s11192-012-0777-7.
M.W. Watkins, C.Y. Chan-Park / Journal of School Psychology 53 (2015) 231–241
241
Harzing, A. -W. (2014). A longitudinal study of Google Scholar coverage between 2012 and 2013. Scientometrics, 98, 565–575. http://dx.doi.org/10.1007/s11192-0130975-y.
Hirsch, J. E. (2005). An index to quantify an individual's scientific research output. Proceedings of the National Academy of Sciences, 102, 16569–16572. http://dx.doi.org/
10.1073/pnas.0507655102.
Jacso, P. (2008). Testing the calculation of a realistic h-index in Google Scholar, Scopus, Web of Science for F. W. Lancaster. Library Trends, 56, 784–815. http://dx.doi.
org/10.1353/lib.0.0011.
Jacso, P. (2011). The h-index, h-core citation rate and the bibliometric profile of the Scopus database. Online Information Review, 35, 492–501. http://dx.doi.org/10.
1108/14684521111151487.
Jacso, P. (2012). Using Google Scholar for journal impact factor and the h-index in nationwide publishing assessment in academia — Siren songs and air-raid sirens.
Online Information Review, 36, 462–478. http://dx.doi.org/10.1108/14684521211241503.
Joy, S. (2006). What should I be doing, and where are they doing it? Scholarly productivity of academic psychologists. Perspectives on Psychological Science, 1, 346–364.
http://dx.doi.org/10.1111/j.1745-6916.2006.00020.x.
Kepes, S., & McDaniel, M. A. (2013). How trustworthy is the scientific literature in industrial and organizational psychology? Industrial and Organizational Psychology, 6,
252–268. http://dx.doi.org/10.1111/iops.12045.
Koenker, R., & D'Orey, V. (1987). Algorithm AS 299: Computing regression quantiles. Journal of the Royal Statistical Society: Series C: Applied Statistics, 36, 383–393.
Lazaridis, T. (2010). Ranking university departments using the mean h-index. Scientometrics, 82, 211–216. http://dx.doi.org/10.1007/s11192-009-0048-4.
Lee, C. J. (2012). A Kuhnian critique of psychometric research on peer review. Philosophy of Science, 79, 859–870. http://dx.doi.org/10.1086/667841.
Lee, C. J., Sugimoto, C. R., Zhang, G., & Cronin, B. (2013). Bias in peer review. Journal of the American Society for Information Science and Technology, 64, 2–17. http://dx.
doi.org/10.1002/asi.22784.
Little, S. G. (1997). Graduate education of the top contributors to the school psychology literature: 1987–1998. School Psychology International, 18, 15–27. http://dx.doi.
org/10.1177/0143034397181002.
Lotka, A. J. (1926). The frequency distribution of scientific productivity. Journal of the Washington Academy of Sciences, 16, 317–323.
Marchant, G. J., & Newman, I. (1994). Faculty activities and rewards: Views from education administrators in the USA. Assessment and Evaluation in Higher Education,
19, 145–152. http://dx.doi.org/10.1080/0260293940190207.
Martínez, R. S., Floyd, R. G., & Erichsen, L. W. (2011). Strategies and attributes of highly productive scholars and contributors to the school psychology literature:
Recommendations for increasing scholarly productivity. Journal of School Psychology, 49, 691–720. http://dx.doi.org/10.1016/j.jsp.2011.10.003.
McCormick, C. B., & Barnes, B. J. (2008). Getting started in academia: A guide for educational psychologists. Educational Psychology Review, 20, 5–18. http://dx.doi.org/
10.1007/s10648-007-9058-z.
McGrail, M. R., Rickard, C. M., & Jones, R. (2006). Publish or perish: A systematic review of interventions to increase academic publication rates. Higher Education
Research and Development, 25, 19–35. http://dx.doi.org/10.1080/07294360500453053.
Meho, L. I., & Rogers, Y. (2008). Citation counting, citation ranking, and h-index of human-computer interaction researchers: A comparison of Scopus and Web of
Science. Journal of the American Society for Information Science and Technology, 59, 1711–1726. http://dx.doi.org/10.1002/asi.20874.
Meho, L. I., & Yang, K. (2007). Impact of data sources on citation counts and rankings of LIS faculty: Web of science versus Scopus and Google Scholar. Journal of the
American Society for Information Science and Technology, 58, 2105–2125. http://dx.doi.org/10.1002/asi.20677.
Merrell, K. W., Ervin, R. A., & Peacock, G. G. (2012). School psychology for the 21st century: Foundations and practices (2nd ed.). New York, NY: Guilford.
Michels, C., & Schmoch, U. (2012). The growth of science and database coverage. Scientometrics, 93, 831–846. http://dx.doi.org/10.1007/s11192-012-0732-7.
Mikki, S. (2010). Comparing Google Scholar and ISI Web of Science for Earth Sciences. Scientometrics, 82, 321–331. http://dx.doi.org/10.1007/s11192-009-0038-6.
Mittal, V., Feick, L., & Murshed, F. (2008). Publish and prosper: The financial impact of publishing by marketing faculty. Marketing Science, 27, 430–442. http://dx.doi.
org/10.1287/mksc.1080.0361.
Nosek, B. A., Graham, J., Lindner, N. M., Kesebir, S., Hawkins, C. B., Hahn, C., et al. (2010). Cumulative and career-stage citation impact of social-personality psychology
programs and their members. Personality and Social Psychology Bulletin, 36, 1283–1300. http://dx.doi.org/10.1177/0146167210378111.
Petscher, Y., & Logan, J. A. R. (2014). Quantile regression in the study of developmental sciences. Child Development, 85, 861–881. http://dx.doi.org/10.1111/cdev.12190.
Ponterotto, J. G., Fingerhut, E. C., & McGuinness, R. (2012). Legends of the field: Influential scholars in multicultural counseling. Psychological Reports, 111, 364–382.
http://dx.doi.org/10.2466/02.49.11.PR0.111.5.364-382.
Reed, J. G., & Baxter, P. M. (2009). Using reference databases. In H. Cooper, L. V. Hedges, & J. C. Valentine (Eds.), Handbook of research synthesis and meta-analysis
(pp. 73–101) (2nd ed.). New York, NY: Russell Sage Foundation.
Roberts, G. A., Davis, K. S., Zanger, D., Gerrard-Morris, A., & Robinson, D. H. (2006). Top contributors to the school psychology literature: 1996-2005. Psychology in the
Schools, 43, 737–743. http://dx.doi.org/10.1002/pits.20183.
Rossen, E., & von der Embse, N. (2014). The status of school psychology graduate education in the United States. In P. L. Harrison, & A. Thomas (Eds.), Best practices in
school psychology: Foundations (pp. 503–512). Bethesda, MD: National Association of School Psychologists.
Ruiz-Castillo, J., & Costas, R. (2014). The skewness of scientific productivity. Journal of Informetrics, 8, 917–934. http://dx.doi.org/10.1016/j.joi.2014.09.006.
Ruscio, J., Seaman, F., D'Oriano, C., Stremlo, E., & Mahalchik, K. (2012). Measuring scholarly impact using modern citation-based indices. Measurement, 10, 123–146.
http://dx.doi.org/10.1080/15366367.2012.711147.
Sahel, J. -A. (2011). Quality versus quantity: Assessing individual research performance. Science Translational Medicine, 3(84), 1–4. http://dx.doi.org/10.1126/
scitranslmed.3002249.
Selek, S., & Saleh, A. (2014). Use of h index and g index for American academic psychiatry. Scientometrics, 99, 541–548. http://dx.doi.org/10.1007/s11192-013-1204-4.
Simkin, M. V., & Roychowdhury, V. P. (2003). Read before your cite! Complex Systems, 14, 269–274.
Stewart, P. K., Roberts, M. C., & Roy, K. M. (2007). Scholarly productivity in clinical psychology PhD programs: A normative assessment of publication rates. Clinical
Psychology: Science and Practice, 14, 157–174. http://dx.doi.org/10.1111/j.1468-2850.2007.00075.x.
Triggle, C. R., & Triggle, D. J. (2007). What is the future of peer review? Why is there fraud in science? Is plagiarism out of control? Who do scientists do bad things? Is it
all a case of: “All that is necessary for the triumph of evil is that good men do nothing?”. Vascular Health and Risk Management, 3, 39–53.
Vaughan, L., & Shaw, D. (2008). A new look at evidence of scholarly citations in citation indexes and from web sources. Scientometrics, 74, 317–330. http://dx.doi.org/
10.1007/s11192-008-0220-2.
Wagner, A. R., Lail, K. E., Viglietta, E., & Burns, M. K. (2007). Faculty publications in APA-accredited school psychology training programs between 2000 and 2005. The
School Psychologist, 61(1), 16–21.
Wainer, J., & Vieira, P. (2013). Correlations between bibliometrics and peer evaluation for all disciplines: The evaluation of Brazilian scientists. Scientometrics, 96,
395–410. http://dx.doi.org/10.1007/s11192-013-0969-9.
Waltman, L., Costas, R., & van Eck, N. J. (2012). Some limitations of the h index: A commentary on Ruscio and colleagues' analysis of bibliometric indices. Measurement,
10, 172–175. http://dx.doi.org/10.1080/15366367.2012.716260.
Waltman, L., & van Eck, N. J. (2011). The inconsistency of the h-index. Journal of the American Society for Information Science and Technology, 63, 406–415. http://dx.doi.
org/10.1002/asi.
Whitley, B. E., & Kite, M. E. (2013). Principles of research in behavioral science (3rd ed.). New York, NY: Routledge.


© Copyright 2026