
FUNDING GAPS 2015 - The Education Trust
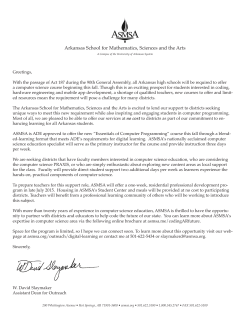
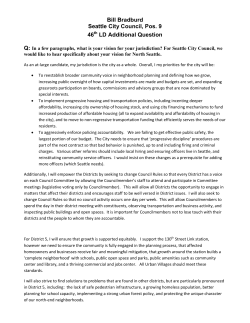
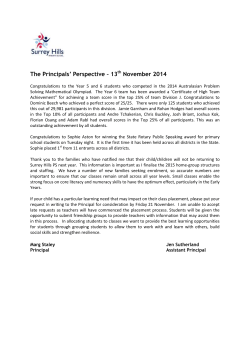
P O LI CY K- 12 FUNDING GAPS 2015 TOO MANY STATES STILL SPEND LESS ON EDUCATING STUDENTS WHO NEED THE MOST MARCH 2015 TO THE POINT Nationally, the highest poverty school districts receive about 10 percent less per student in state and local funding than the lowest poverty districts. School districts serving the most students of color nationwide receive roughly 15 percent less per student in state and local funding than those serving the fewest. There is a great deal of variation between states when it comes to funding equity: While some states provide more funding to their highest poverty districts and to districts serving the most students of color, others provide substantially less. As Americans, we love to think of ourselves as living in the land of equal opportunity, a country where anyone willing to work hard can make it. But we have to look no further than our schools to know that today, the opportunities that our country provides are anything but equal. © Copyright 2015 The Education Trust. All rights reserved. FUNDING GAPS 2015 TOO MANY STATES STILL SPEND LESS ON EDUCATING STUDENTS WHO NEED THE MOST B Y N ATA S H A U S H O M I R S K Y A N D D A V I D W I L L I A M S Every day, millions of students all around the U.S. pledge their allegiance to our nation and “liberty and justice for all.” As they speak these words, some stand in stateof-the-art classrooms with brand new smartboards and bookshelves stuffed to the brim. Others, however, gaze at peeling paint and water stains on the ceiling, at empty shelves and blackboards with no chalk. Some see before them a fully equipped laboratory; others, a tattered textbook they aren’t allowed to take home. And right now, which of those classrooms a child stands in has a lot to do with his family’s wealth or the color of her skin. As Americans, we love to think of ourselves as living in the land of equal opportunity, a country where anyone willing to work hard can make it. But we don’t have to look any further than our schools to know that today, the opportunities that our country provides are anything but equal. In fact, our education system has a history of providing low-income students and students of color with less of everything they need to succeed in school. In this report, we focus on one of the most important of these “lesses” — school funding. Although money isn’t the only thing that matters for student success — districts with similar funding levels and similar demographics, for example, can produce vastly different results for their students — inequities in funding are foundational to all sorts of other inequities in our school system. A district with more resources, for example, can pay teachers more, making it easier to attract the strongest educators. It can also offer students more support and enrichment, which are critical to the success of all children, but are especially important for those students who may not have access to these opportunities outside of school. We ask: • How do the revenues of districts serving the most students in poverty (the highest poverty districts) compare with those serving the fewest students in poverty (the lowest poverty districts) in each state and across the country? • How much funding does the state provide to districts, and how does it distribute those dollars? • How do the revenues of districts serving the most students of color compare with those of districts serving the fewest students of color? We focus specifically on state and local revenues and exclude federal sources because federal dollars are intended — and targeted — to provide supplemental services to such specific groups of students as those in poverty, English learners, and students with disabilities. In this analysis, we are interested in learning how states allocate the resources that they oversee. Our analysis finds that nationally, funding inequities are devastatingly large. The highest poverty districts in our country receive about $1,200 less per student than the lowest poverty districts. The differences are even larger — roughly $2,000 per student — between districts serving the most students of color and those serving the fewest. Importantly, these numbers reflect differences between the quartile of districts with the most children in poverty (or students of color) and the quartile with the fewest.1 At the extremes, of course, the differences can be much larger. When we look at funding gaps within each state, we find a great deal of variation. While some states provide substantially more funding to their highest poverty districts, others provide substantially less. The trends look even worse when we consider that students in poverty are likely to need additional supports in order to succeed academically; in other words, simply offering equal funding isn’t enough. Moreover, some states that fund their highest poverty districts equally, or even progressively (meaning, they allocate more funding to these districts), are still providing substantially fewer dollars to districts that serve the most students of color than to those that serve the fewest. There are many terrific researchers and advocates working at the local and national levels to understand and improve education funding for our most vulnerable students, including Bruce Baker, David Sciarra, and Danielle Farrie, whose regular reports are always worth reading.2 The Education Trust, too, has been documenting school funding inequities for years, focusing specifically on how these disparities may affect the education of low-income students and students of color. Our goal is to add to this rich body of work an up-to-date, straight-forward analysis of funding equity that is comparable across states and will allow advocates and policymakers to understand how their state fares in a national context against a few key criteria. This report gives an overview of funding equity by race and poverty concentration across states, while our interactive, online data tool offers more detailed information for each state. We hope this work will help advocates keep the focus on equity, especially as state budgets begin to improve post-recession and lawmakers are signaling an interest in re-examining funding decisions.3 Natasha Ushomirsky is senior data and policy analyst and David Williams is K-12 data analyst at The Education Trust. THE EDUCATION TRUST | FUNDING GAPS | MARCH 2015 1 What This Analysis Does (and Doesn’t Do) In this analysis, we look specifically at the relationship between funding and the demographics of the students that districts serve. In other words, we are not trying to measure whether all districts in a state receive the same amount of money, but rather how the revenues of districts that serve higher percentages of low-income students or students of color compare with those of their counterparts. In addition, our analysis compares the average revenues of groups of districts (the quartiles with the highest poverty and lowest poverty, for example), rather than the revenues of individual districts. Within each group, some districts may be receiving substantially more or less funding than these averages. What we do not attempt to do is discern whether the total amount of funding given to districts is adequate. While this question is crucial, especially given the recent declines in school funding across the country, it is beyond the scope of this analysis.4 Readers also should not assume that just because a high-poverty district gets more money per student, every school in that district is more generously funded. Previous research shows that even when funding is progressive at the state level, dollars may be distributed regressively within districts.5 Our analysis also does not seek to explain why we see the results that we see. We do not look at individual state In Brief: What We Did This section briefly describes our data sources, methodology, and key analytic decisions. For more detailed documentation, please see the technical appendix to this report. We used the following data to analyze the state of funding equity across the U.S. and within each state: • Data on each district’s state and local revenues per student: These data were obtained from the 2012, 2011, and 2010 U.S. Census Bureau’s Public Elementary–Secondary Education Finance Data files, the most recent ones available.6 To limit the impact of year-to-year fluctuations in revenues, which can arise from such one-time investments as renovations or capital projects, we used threeyear averages of state and local funds. We also adjusted these dollar figures for both inflation (using the Bureau of Labor Statistics’ Consumer Price Index) and for geographic differences in labor market costs (using the Comparable Wage Index published by Dr. Lori Taylor at Texas A&M University).7 • Data on the percent of children in poverty for each district: Poverty data were obtained from the 2012 U.S. Census Bureau’s Small Area Income and Poverty Estimates.8 • Data on the percent of students of color for each district: Enrollment data by student ethnicity were obtained from the 2012 National Center for Education Statistics’ Common Core of Data.9 To calculate the percent of students of color for each district, we added the numbers of African American, Latino, and Native students enrolled in the district and divided this sum by the total number of enrolled students whose ethnicity was known.10 To calculate gaps between the highest and lowest poverty districts, we: • Sorted all districts by the percentage of students below the poverty line; • Divided districts into four groups (quartiles) so that each group had approximately the same number of students; • Calculated the average state and local revenue per student across all the districts in each quartile; and • Compared the state and local revenues per student in the highest and lowest poverty quartiles. We used the same methodology to compare per-student revenues in districts serving the most and the fewest students of color, except that districts were sorted by the percentage of students of color, rather than the percentage of students below the poverty line. 2 THE EDUCATION TRUST | FUNDING GAPS | MARCH 2015 When we compare the revenues of the highest and lowest poverty districts across the country, we find that the highest poverty districts receive about $1,200, or 10 percent, less per student than the lowest poverty districts. funding formulas in depth. Rather, we hope that this analysis will support the work of state advocates who know their local context far better than we do. How Do the Revenues of High-Poverty Districts Compare With Those of Low-Poverty Districts? Finally, any changes in funding policy or distribution that happened after 2012 are not reflected in our results because 2012 is the latest school year for which data are available. When we compare the revenues of the highest and lowest poverty districts across the country, we find that the highest poverty districts receive about $1,200, or 10 percent, less per student than the lowest poverty districts. Additional data notes: Our analysis of gaps between the highest and lowest poverty districts uses the percent of students living below the poverty line as an indicator of income. We rely on the poverty rate, rather than the percent of students qualifying for free/reduced price lunch — a commonly used measure of family income — because of concerns about the quality of the free/reduced price lunch data in the national demographics dataset. It is important to note, however, that the percent of students in poverty and the percent qualifying for free/reduced price lunch are highly correlated. In other words, districts with high poverty rates also tend to have high free/reduced price lunch rates, and vice versa. These gaps add up. For a middle school with 500 students, for example, a $1,200 funding gap per student means a shortage of $600,000 per year. For a 1,000-student high school, it means $1.2 million in missing resources. Because the Census Bureau’s Public Elementary–Secondary Education Finance Data — our source of funding information — does not include charter schools unless they are operated by a traditional school district, our analysis excludes independently operated charters, as well as districts that only operate charter schools. In addition, although all states’ districts were included in the nationwide analyses, some were excluded from withinstate funding gap analyses. These include Hawaii, which has only one school district, as well as Alaska and Nevada, whose student populations are heavily concentrated in certain districts and could not be sorted into quartiles. Within-state analyses that compare revenues of districts serving the most and the fewest students of color also exclude Maine, Vermont, New Hampshire, and West Virginia because students of color make up less than 10 percent of enrollment in these states. Finally, because so many New York students are concentrated in New York City, we sorted districts in that state into two halves, as opposed to four quartiles, for all within-state analyses. THE EDUCATION TRUST | FUNDING GAPS | MARCH 2015 3 The within-state funding gap analysis shows a great deal of variation among states in the progressiveness — or regressiveness — of funding (Figure 1). In 17 states, highpoverty districts receive substantially (at least 5 percent) more in state and local funds than low-poverty districts. Ohio and Minnesota are the most progressive; in these states, high-poverty districts receive about 22 percent more dollars per student from state and local sources than districts with the fewest students in poverty. On the other end of the spectrum, in six states, the highest poverty districts receive substantially fewer state and local funds than their lowest poverty counterparts. By far the largest gap is in Illinois, where the highest poverty districts receive nearly 20 percent less state and local funding than the lowest poverty districts. The next two most regressive states are New York and Pennsylvania, followed by Texas, Maryland, and Michigan. The remaining 24 states provide similar amounts of funding (a difference of less than 5 percent) to high- and lowpoverty districts. What Happens When the Needs of Low-Income Students Are Taken Into Account? So far, we’ve been looking at whether the funding that high- and low-poverty districts receive is equal. But to close achievement gaps, schools need funding that is equitable — funding that accounts for the fact that it simply costs more to educate low-income students, many of whom start school academically behind their more affluent peers. Beyond standard curricula, these schools may need, for example, materials to help build vocabulary and background knowledge, extra learning time, or liaisons with outside service providers, such as the healthcare or foster care systems. Figure 1: Gaps in State and Local Revenues per Student Between Districts Serving the Most and the Fewest Students in Poverty11 Reading this figure: In Ohio, the highest poverty districts receive 22 percent more in state and local funds per student than the lowest poverty districts. In states shaded in green, the highest poverty districts receive at least 5 percent more in state and local funds per student than the lowest poverty districts; in states shaded in red, they receive at least 5 percent less. Gray shading indicates similar levels of funding for the highest and lowest poverty districts. States are ranked and classified as providing substantially more or substantially less funding to their highest poverty districts based on unrounded funding gaps. See endnote 11 for state exclusions and additional data notes. 4 THE EDUCATION TRUST | FUNDING GAPS | MARCH 2015 To account for these additional needs, we repeated our analysis with a very conservative assumption: that it costs a district 40 percent more to educate a student in poverty than a student not in poverty. This figure is based on the federal Title I formula, and, in all likelihood, is an underestimate. Some studies show that it costs about twice as much, or more, to educate a low-income student to the same standards as a higher income student.12 Even with this conservative assumption, however, we already see a big change in the state of funding equity. Nationally, once we account for the additional needs of low-income students, we see that the highest poverty districts receive about $2,200, or 18 percent, less per student than lowpoverty districts. And while 17 states appeared to provide substantially (at least 5 percent) more funding to the highest poverty districts before accounting for the additional needs of low-income students, after the adjustment, only four still do (Figure 2). Moreover, the number of states that are regressive (i.e., provide at least 5 percent fewer dollars to the highest poverty districts) increases from six to 22. The Role of State Dollars So far, we’ve been looking at the distribution of state and local funds combined. Now, let’s look exclusively at state dollars. Why? While local dollars are derived mainly from property taxes, which can vary widely from district to district, state dollars are the funds that state legislatures can and should use to counteract these disparities. In this section we will examine the share of funding that comes from the state and how progressively states distribute these dollars. Figure 2: Gaps in State and Local Revenues per Student Between Districts Serving the Most and the Fewest Students in Poverty (Adjusted to Account for Additional Needs of Low-Income Students) Reading this figure: In Minnesota, the highest poverty districts receive 14 percent more in state and local funds per student than the lowest poverty districts (adjusting for the additional needs of low-income students). In states shaded in green, the highest poverty districts receive at least 5 percent more in state and local funds per student than the lowest poverty districts; in states shaded in red, they receive at least 5 percent less. Gray shading indicates similar levels of funding for the highest and lowest poverty districts. States are ranked and classified as providing substantially more or substantially less funding to their highest poverty districts based on unrounded funding gaps. See endnote 11 for state exclusions and additional data notes. THE EDUCATION TRUST | FUNDING GAPS | MARCH 2015 5 How Much Funding Comes From the State? Figure 3 shows the percentage of K-12 revenues that districts derive from state (as opposed to local) sources. Although states vary quite a bit in the share of school funding they provide, all contribute at least a third of funds. About half of the states provide a bigger share of school funds than localities do, with Arkansas providing the largest. How Progressively Is State Money Distributed? States make decisions about how to allocate the funds they contribute. They could, for example, choose to distribute dollars based on student enrollment — that is, provide all districts with an equal amount for every student they serve. Or, they could allocate dollars based on district need, taking into account each district’s fiscal capacity and the characteristics of the students it serves. These decisions can have a profound effect on the resources districts receive and the educational opportunities they provide. So are states allocating more state dollars to their highest poverty districts? And if so, how much more? Figure 4 shows the differences in the amount of state funds that states provide to their highest and lowest poverty districts. While the overwhelming majority of states do provide more state dollars to their highest poverty districts than their lowest poverty districts, the relative size of those additional allocations varies greatly. Nine states, for example, provide more than twice as much (i.e., more than a 100 percent difference) in state funds to their highest poverty districts than their lowest poverty districts. On the other end of the spectrum, five states provide roughly the same amount to districts, regardless of poverty. To see the impact of these decisions, consider Connecticut and Illinois (Figure 5). In both, state funds make up just under 40 percent of non-federal dollars (Figure 3). But in Connecticut, the legislature directs more than three times as much state funding per student to the highest poverty districts as it does to the lowest poverty districts. As a result, even though they receive fewer local dollars, the highest poverty districts still receive 5 percent more in overall (state and local) funding than their lowest poverty counterparts because the state fills in the gap. In Illinois, however, the legislature does not distribute state funds progressively enough to counteract disparities in local dollars, so the highest poverty districts end up receiving 19 percent less in overall funding than the lowest poverty districts — one of the biggest funding gaps in the country. Figure 3: Percent of District Revenues Derived From State (as Opposed to Local) Sources Reading this figure: In Arkansas, 86 percent of districts’ non-federal revenues come from state (as opposed to local) sources. Hawaii, Alaska, and Nevada were excluded from this analysis because they do not appear in any of the other state-by-state analyses. In addition, Vermont was excluded because the state tabulates revenue sources differently than do other states.13 States are ranked based on unrounded percentages. 6 THE EDUCATION TRUST | FUNDING GAPS | MARCH 2015 Figure 4: Difference in State Revenues per Student Between Districts Serving the Most and the Fewest Students in Poverty Reading this figure: In New Jersey, the highest poverty districts receive 431 percent more in state dollars per student than the lowest poverty districts. As in Figure 3, Vermont was excluded because the state tabulates revenue sources differently than do other states. States are ranked based on unrounded differences in state funding. See endnote 11 for additional state exclusions and data notes. Figure 5: State and Local Funding for the Highest and Lowest Poverty Districts in Connecticut and Illinois CONNECTICUT ILLINOIS Numbers may not add up due to rounding. THE EDUCATION TRUST | FUNDING GAPS | MARCH 2015 7 Figure 6: Gaps in State and Local Revenues Between Districts Serving the Most and the Fewest Students of Color14 Reading this figure: In Ohio, districts serving the most students of color receive 26 percent more in state and local funds per student than districts serving the fewest students of color. In states shaded in green, districts serving the most students of color receive at least 5 percent more in state and local funds per student than districts serving the fewest; in states shaded in red, they receive at least 5 percent less. Gray shading indicates similar levels of funding for districts serving the most and the fewest students of color. States are ranked and classified as providing substantially more or substantially less funding to districts serving the most students of color based on unrounded funding gaps. See endnote 14 for state exclusions and additional data notes. What About Students of Color? Conclusion Inequities in funding don’t only occur based on poverty. Previous studies have shown that districts serving the most students of color also tend to receive less state and local funding than districts serving the fewest.15 Our latest findings confirm this pattern. In fact, when we looked at state and local funding for districts serving the largest concentrations of African American, Latino, and Native students, we found inequities to be more prevalent, and more substantial, than those based on poverty. The inequities described in this report are not new. They have been documented and debated for decades. And, in many states, state courts have declared inequitable funding systems unlawful. Yet despite all that attention — and real progress in some states — too many states continue to spend less on educating low-income students and students of color. This contradicts a national commitment to equality of opportunity, and it deprives students of learning experiences, enrichment, and support they need to succeed. We hope that these latest data will bolster the work of advocates and state leaders working hard to turn these patterns around. Nationally, districts serving the most students of color receive about $2,000, or 15 percent, less per student than districts serving the fewest students of color.16 Funding differences within states show a great deal of variation (Figure 6): In 14 states, districts that serve the most students of color receive substantially more money; and in 18 states, they receive substantially less. These patterns are troubling for many reasons, but particularly because research shows that many students of color start school academically behind their peers.17 If the goal of our education system is to ensure that all students leave high school ready for what’s next — be it college or a meaningful career — we need to provide students who need the most (and the schools that educate them) with more support — not less. 8 THE EDUCATION TRUST | FUNDING GAPS | MARCH 2015 Every day, students around the country pledge their allegiance to the American ideal of “liberty and justice for all.” Isn’t it time we fulfill our pledge of equal opportunity to them? Notes 1. Each quartile is comprised of districts that serve roughly a quarter of all students nationwide (for the national analysis) or statewide (for the within-state analyses). 2. This body of work includes, but is not limited to: Bruce D. Baker, David G. Sciarra, and Danielle Farrie, “Is School Funding Fair? A National Report Card,” (Newark, N.J.: Rutgers Graduate School of Education and Education Law Center, third edition, 2014), http://www.schoolfundingfairness.org/; Raegen Miller and Diana Epstein, “There Still Be Dragons: Racial Disparity in School Funding Is No Myth,” (Washington, D.C.: Center for American Progress, July 2011), https://www.americanprogress.org/issues/ education/report/2011/07/05/9943/there-still-be-dragons/; U.S. Department of Education, United States Education Dashboard, “Percent difference in current expenditures minus federal revenues (other than Impact Aid) per pupil between high- and low-poverty districts,” 2007-08, http://dashboard.ed.gov/statecomparison. aspx?i=ac&id=0&wt=40; and U.S. Department of Education, National Center for Education Statistics, “Inequalities in Public School District Revenues,” (Washington, D.C.: Thomas B. Parrish and Christine S. Hikido of the American Institutes for Research, and William J. Fowler, Jr., of the National Center for Education Statistics, July 1998), http://nces.ed.gov/pubs98/98210.pdf. Examples of organizations working to increase funding equity in their states include Advance Illinois, The Education Trust–West, Education Law Center, and Mexican American Legal Defense and Education Fund. 3. Andrew Ujifusa, “Politics, Fiscal Issues Frame Pa. School-Aid Debate,” Education Week, Jan. 2, 2015, http://www.edweek.org/ ew/articles/2015/01/02/politics-fiscal-issues-frame-pa-school-aiddebate.html; Kerry Lester, “Lawmakers refocus on state school funding formula,” Associated Press, Nov. 17, 2014, http://www. dailyherald.com/article/20141117/news/141118612/; and Ray Hagar, “Sandoval says he wants major state funding overhaul in 2015,” Reno Gazette-Journal, Oct. 26, 2014, http://www.rgj.com/ story/news/2014/10/26/sandoval-says-wants-major-state-fundingoverhaul/17867297/. 4. Michael Leachman and Chris Mai, “Most States Funding Schools Less Than Before the Recession,” (Washington, D.C.: Center on Budget and Policy Priorities, May 2014), http://www.cbpp.org/ files/9-12-13sfp.pdf. 5. Marguerite Roza, Larry Miller, and Paul Hill, “Strengthening Title I to Help High-Poverty Schools: How Title I Funds Fit Into District Allocation Patterns” (Seattle: Center on Reinventing Public Education, August 2005), http://www.crpe.org/publications/briefstrengthening-title-i-help-high-poverty-schools-how-title-i-fundsfit-district; and Daria Hall and Natasha Ushomirsky, “Close the Hidden Funding Gaps in Our Schools” (Washington, D.C.: The Education Trust, April 2010), http://edtrust.org/resource/close-thehidden-funding-gaps-in-our-schools/. 6. U.S. Census Bureau, “Public Elementary and Secondary Education Finance Data, 2010-2012,” http://www.census.gov/govs/school/ (Downloaded June 2014). 7. Bureau of Labor Statistics, “Consumer Price Index — All Urban Consumers, U.S. City Average,” http://data.bls.gov/pdq/querytool. jsp?survey=cu, (Downloaded June 2014) and Lori Taylor, The Bush School of Government and Public Service at Texas A&M University, “Comparable Wage Index Data: Extending the NCES CWI,” http:// bush.tamu.edu/research/faculty/Taylor_CWI/ (Downloaded June 2014). 8. U.S. Census Bureau, “Small Area Income and Poverty Estimates by School District, 2012,” http://www.census.gov/did/www/saipe/ data/schools/data/index.html (Downloaded June 2014). 9. National Center for Education Statistics, “Common Core of Data, Local Education Agency (School District) Universe Survey Data, 2012,” http://nces.ed.gov/ccd/pubagency.asp (Downloaded June 2014). 10. The count of students of color for Hawaii includes Asian and Pacific Islander students, in addition to African American, Latino, and Native. Hawaii is not included in the within-state funding gap analysis since it has only one district, but it is included in the national analysis. 11. Hawaii was excluded from the within-state gap analysis because it is one district. Alaska and Nevada are also excluded because their student populations are heavily concentrated in certain districts and could not be sorted into quartiles. Because so many New York students are concentrated in New York City, we sorted that state into two halves, as opposed to four quartiles. In Maryland, the highest poverty quartile contains only 21 percent of students, and in South Dakota, only 20 percent. In Utah, the highest poverty quartile contains 31 percent of students. In New Mexico, the lowest poverty quartile contains only 20 percent of students. 12. William D. Dumcombe and John Yinger, “How Much More Does a Disadvantaged Student Cost?” (Syracuse, N.Y.: Center for Policy Research at Syracuse University, July 2004), http://surface.syr.edu/ cgi/viewcontent.cgi?article=1102&context=cpr. 13. Lawrence O. Picus, Allan Odden, William Glenn, Michael Griffith, and Michael Wolkoff, “An Evaluation of Vermont’s Education Finance System,” working draft, January 2012, http://www.leg.state. vt.us/jfo/Education%20RFP%20Page/Picus%20and%20Assoc%20 VT%20Finance%20Study%20with%20Case%20Studies%201-212a.pdf. 14. Hawaii was excluded from the within-state gap analysis because it is one district. Alaska and Nevada were excluded because their student populations are heavily concentrated in certain districts and could not be sorted into quartiles. In addition, New Hampshire, Vermont, Maine, and West Virginia were also excluded because students of color make up less than 10 percent of enrollment in these states. Because so many New York students are concentrated in New York City, we sorted that state into two halves, as opposed to four quartiles. In Alabama and Delaware, districts serving the most students of color enroll about 29 percent of all students, while in South Dakota they enroll only 21 percent. In Utah, districts serving the fewest students of color enroll 31 percent of all students. 15. Miller and Epstein, “There Still Be Dragons: Racial Disparity in School Funding Is No Myth”; and Ross Wiener and Eli Pristoop, “How States Shortchange the Districts That Need the Most Help” in “Funding Gaps 2006” (Washington, D.C.: The Education Trust, 2006), http://edtrust.org/resource/the-funding-gap-2/. 16. The count of students of color for Hawaii includes Asian and Pacific Islander students, in addition to African American, Latino, and Native. Hawaii is not included in the within-state funding gap analysis since it has only one district, but it is included in the national analysis. 17. Roland G. Fryer and Steven D. Levitt, “The Black-White Test Score Gap Through Third Grade,” NBER Working Paper 11049, (Cambridge, Mass.: National Bureau of Economic Research, January 2005), http://www.nber.org/papers/w11049; and Sean F. Reardon and Claudia Galindo, “Patterns of Hispanic Students’ Math and English Literacy Test Scores in the Early Elementary Grades: A Report to the National Task Force on Early Childhood Education for Hispanics,” October 2006, https:// lesacreduprintemps19.files.wordpress.com/2012/05/patterns-ofhispanic-students-math-and-english-literacy-test-scores-in-theearly-elementary-grades.pdf. THE EDUCATION TRUST | FUNDING GAPS | MARCH 2015 9 ABOUT THE EDUCATION TRUST The Education Trust promotes high academic achievement for all students at all levels, pre-kindergarten through college. We work alongside parents, educators, and community and business leaders across the country in transforming schools and colleges into institutions that serve all students well. Lessons learned in these efforts, together with unflinching data analyses, shape our state and national policy agendas. Our goal is to close the gaps in opportunity and achievement that consign far too many young people — especially those who are black, Latino, American Indian, or from low-income families — to lives on the margins of the American mainstream. 1 2 5 0 H S T R E E T, N W, S U I T E 7 0 0 , WA S H I N G T O N , D . C . 2 0 0 0 5 P 2 0 2 - 2 9 3 - 1 2 1 7 F 2 0 2 - 2 9 3 - 2 6 0 5 W W W . E D T R U S T. O R G


© Copyright 2026