
Antiangiogenic Therapy for Colorectal Cancer Thanks to the investigators for providing their slides.
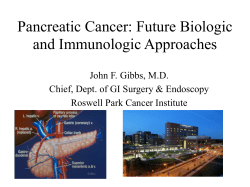
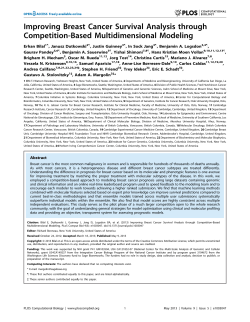
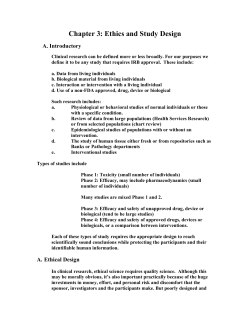
Antiangiogenic Therapy for
Colorectal Cancer
Thanks to the investigators for
providing
p
g their slides.
Al B. Benson III, MD, FACP
Professor of Medicine
Feinberg School of Medicine
Associate Director for Clinical Investigations
Robert H. Lurie Comprehensive Cancer Center
of Northwestern University
Combination Bevacizumab Plus
IFL: Overall Survival
Impact of Targeted Agents:
Adding Bevacizumab to Cytotoxics
100
n=411
Previously
untreated mCRC
(n=923)
(n
923)
IFL +
Bevacizumab*
n=402
402
PD*
PD*
Overall su
urvival (%)
IFL + Placebo
Primary
Endpoint:
Survival
5-FU/LV +
Bevacizumab*
PD*
n=110
15.6
80
20.3
60
IFL + Bevacizumab
40
20
IFL + placebo
0
0
* 5.0 mg/kg q2w
†
Patients receiving bevacizumab could continue therapy past disease progression in combination with
second line therapy
Hurwitz H, et al. N Engl J Med. 2004;350:2335-2342.
10
No. at Risk
IFL + bevacizumab
IFL + placebo
402
411
362
363
20
Months
320
292
30
178
139
73
51
20
12
1
0
0
0
Hurwitz H, et al. N Engl J Med. 2004;350:2335-2342.
Period 2: Overall Survival
Data thru Mar 1, 2006 (ITT)
BICC-C Trial: Addition of Bevacizumab
FOLFIRI
Irinotecan: 180 mg/m2 (D1)
LV: 400 mg/m2 over 2 h (D1)
5-FU: 400 mg/m2 (bolus) (D1)
5-FU: 2400 mg/m2 (46(46-h infusion) (D1)
q2wks
+ 5 mg/kg bevacizumab q 2wks
mIFL
Irinotecan: 125 mg/m2 (D1, 8)
5-FU: 500 mg/m2 (bolus) (D1, 8)
LV: 20 mg/m2 (D1, 8)
q3wks
+ 7.5 mg/kg bevacizumab q 3wks
Median
OS
(Months)
1 Year
FOLFIRI+ BEV
NR
87%
--
--
mIFL + BEV
18.7
61%
2.5
(1.3,5.0)
0.01
Regimen
R
A
N
D
O
M
I
Z
A
T
I
O
N
Celecoxib
400 mg bid
Placebo
CapeIRI
mg/m2
Irinotecan: 250
(D1)
Capecitabine: 1000 mg/m2 bid (D1(D1-14)
q3wks
Stratification: Age, PS, Low dose aspirin use
Proportion of
Patients Who Survive
ed
R
A
N
D
1st1st-line
O
mCRC
M
N = 117
I
5/04–
5/04–12/04
12/04 Z
A
T
I
O
N
40
1
HR
(95% CI)
P
Value
0.8
0.6
0.4
FOLFIRI + bevacizumab
0.2
mIFL + bevacizumab
0
0
5
10
15
20
25
30
Months
1
E3200: FOLFOX + Bevacizumab
in Second-Line mCRC
FOLFOX-4
FOLFOXFOLFOX-4 +
FOLFOX-4 Bevacizumab
bevacizumab FOLFOX-
PD
FOLFOX-4 +
bevacizumab
g g q2wk
q
10 mg/kg
Previously
treated mCRC
(n=880)
(n
880)
E3200: FOLFOX + Bevacizumab
in Second-Line mCRC Results
PD
Bevacizumab
monotherapy*
10 mg/kg q2wk
Primary
Endpoint:
Response Rate (%)
22%*
9%
3%
Survival
S
i l
Median PFS (mos.)
7.2*
4.8
2.7
Median OS (mos.)
12.9*
10.8
10.2
PD
*Statistically significant compared with FOLFOX or bevacizumab alone.
• Bevacizumab monotherapy arm discontinued at planned interim
Giantonio BJ, et al. Proc Am Soc Clin Oncol. 2005;23:248s. Abs #2.
Giantonio BJ, et al. Proc Am Soc Clin Oncol. 2005;23:248s. Abs #2.
Randomized Phase II: Final
TREE 1 and 2 Trial Results
NO16966 study design
Oxaliplatin+
5-FU (TREE(TREE-1)
Confirmed ITT
ORR
Median TTP (mo)
mFOLFOX
n=45
41%
bFOL
n=44
20%
CapeOx
n=39
27%
87
8.7
69
6.9
59
5.9
(TREE(TREE-1) +
Bevacizumab
FOLFOXFOLFOX-B
n=71
52%
bFOLbFOL-B
n=70
39%
CapeOxCapeOx-B
n=72
46%
9.9
8.3
10.3
Confirmed ITT
ORR
Median TTP (mo)
Recruitment
June 2003 – May 2004
Recruitment
Feb 2004 – Feb 2005
XELOX
N=317
XELOX + placebo
N=350
XELOX +
bevacizumab
N 350
N=350
FOLFOX4
N=317
FOLFOX4 + placebo
N=351
FOLFOX4 +
bevacizumab
N=350
Protocol amended to 2x2 placebocontrolled design after bevacizumab
phase III data1 became available
(N=1401)
Initial 2-arm
open-label study
(N=634)
Hochster HS, et al. Journal of Clinical Oncology, 2006 ASCO Annual Meeting Proceedings Part I. 2006; 24 (suppl. 18S):3510.
1Hurwitz
PFS XELOX non-inferiority:
primary objective met based on ITT
PFS chemotherapy + bevacizumab
superiority: primary objective met
1.0
1.0
HR = 1.04 [97.5% CI 0.93–1.16]
0.8
0.6
0.4
0.2
8.0
8.5
5
10
0.6
0.4
0.2
8.0
0
0
0
HR = 0.83 [97.5% CI 0.72–0.95] (ITT)
P = .0023
0.8
Upper limit ≤ 1.23
(non-inferiority margin)
PFS estiimate
PFS estimate
H, et al. Proc ASCO 2003;22 (Abstract 3646)
15
Months
20
FOLFOX/FOLFOX+placebo/FOLFOX+bevacizumab
XELOX/XELOX+placebo/XELOX+bevacizumab
25
30
N=1017; 826 events
N=1017; 813 events
0
5
9.4
10
15
20
25
Months
FOLFOX+placebo/XELOX+placebo
N=701; 547 events
FOLFOX+bevacizumab/XELOX+bevacizumab N=699; 513 events
2
Figure 3. Separation after ~6 months in
bevacizumab-containing arms between
‘general’ and ‘on treatment’ PFS
XELOX / FOLFOX-4 + bevacizumab
XELOX / FOLFOX-4 + placebo
PFS estima
ate
1.0
0.8
ON TREATMENT: HR
HR=0.63
0.63
(97.5% CI 0.52–0.75, p<0.0001)
0.6
GENERAL: HR=0.83
(97.5% CI 0.72–0.95, p=0.0023)
0.4
0.2
0
0
Figure 4. Overall survival (ITT
population)
XELOX / FOLFOX-4 + bevacizumab
XELOX / FOLFOX-4 + placebo
n=699 (420 events)
Survival estim
mate
15
•
Duration of treatment was similar in bevacizumab- and placebocontaining arms.
•
Median treatment duration:
n=701 (455 events)
– Bevacizumab + XELOX
HR=0.89 (97.5% CI 0.76–1.03)
p=0.0769
0.6
0.4
•
0.2
19.9
10
Months
20
Treatment exposure
1.0
0.8
5
6.1 months (range 0–15.3)
– Placebo + XELOX
5 4 months (range 0–15.7)
5.4
0 15 7)
– Bevacizumab + FOLFOX-4
6.3 months (0–14.9)
– Placebo + FOLFOX-4
6.0 months (range 0–15.6).
Only 29% of bevacizumab recipients and 44–50% of placebo
recipients were treated until disease progression.a
21.3
0
0
6
12
18
24
30
Months
Safety
•
A higher proportion of patients discontinued therapy because of AEs in the
bevacizumab-containing arms vs. the placebo-containing arms (31% vs.
21%).
•
Most treatment discontinuations were due to chemotherapy-rather than
bevacizumab-related events.
•
Most common reasons for treatment discontinuation were neurotoxicity, GI
events, general disorders and hematological events.
•
Predefined grade 3/4 AEs of interest to bevacizumab and chemotherapy
are presented in Table 3.
36
aIncludes
non-progressive patients stopping treatment at week 48
(end of primary treatment phase)
Conclusions
• The addition of bevacizumab to front-line oxaliplatin-based
chemotherapy significantly improves PFS.
• The overall safety profile is in line with previous trial experience in
colorectal cancer.
• Analysis of ‘on treatment’ PFS vs. ‘general’ PFS suggests that
continuation of bevacizumab until disease progression may be
necessary to optimize the effect of bevacizumab on PFS.
• The observed overall survival difference did not reach statistical
significance (p=0.077).
3
BRiTE Registry: Study Schema
Evaluable
patients
(n=1953)
BRiTE:
•932 deaths
(1/21/07 cut-off)
•Median followup 19.6 mo
1st Progression
( 1445)
(n=1445)
Physician decision - no randomization
Axel Grothey, M.D.
Mary Sugrue, M.D. Ph.D.
for the BRiTE Investigators
No Post-PD
Treatment
(n=253)
*BBP=bevacizumab
beyond first progression
19
19
BRiTE ASCO Presentations To Date*
No BBP*
(n=531)
BBP*
(n=642)
Grothey, ASCO 2007, abstract #4036
1st Line Chemotherapy Use in BRiTE
HTN management
Preliminary
Safety/Effectiveness
Overall safety
Study Start
2004
Preliminary
Safety/Effectiveness
Overall survival
Elderly(>75):
Safety and
Effectiveness
Elderly (>65): Safety
and Effectiveness
GI perforation
ATE
Bleeding
Overall effectiveness
BBP
Wound healing
complications
2007
2008
2005
2006
Confirmed FOLFOX as most common 1st line CT in
combination with Bevacizumab for mCRC in US.
Kozloff et al. 2007 Gastrointestinal Cancers Symposium, Orlando, Jan. 19-21, 2007.
* Novel presentations; does not include encore presentations
22
BRiTE Safety: Overview
Figure 1. Schematic of Disease Progression and Interim Disposition of
Patients in BRiTE
All Patients
(N=1953)
New or worsened HTN
(requiring medication), %
ATE, %
Bleeding events (grade 3/4), %
19.4
1.8
2.4
GI Perforation, %
1.8
Figure 1. Schematic of Disease Progression;
OS=overall survival; TTP=time-to-progression
*Nineteen patients received post-progression
treatment with BV only and have been excluded
from the BBP analysis. The remaining 508 patients
have not yet had PD noted by investigator assessment.
Incidence of Bevacizumab-related safety events in BRiTE is similar
to incidence of events reported in pivotal trials
Grothey et al. ASCO, Chicago, June 1-5, 2007.
Figure 2. Interim Disposition of
Patients in BRiTE (N=1953 with 1445
1st PD and 932 Deaths Reported as of
the January 21, 2007 Data Cutoff)
Grothey ASCO 2007
23
4
Figure 3. A) Graphical Representation of BV Use in BBP Patients and
B) Frequency Distribution of Time from 1st PD to Start of BV Post 1st PD
for Patients in the BBP Subgroup
RESULTS (continued)
•
The proportion of patients with ECOG PS 0 was higher in the BBP than in
the No BBP subgroup (50.2% versus 39.9%) (Table 3).
•
The BBP and No BBP subgroups were balanced on:
–
–
–
–
Figure 3A. Graphical Representation of BV Use in BBP Patients Figure 3B. Frequency Distribution of Time from 1st PD to Start of BV Post 1st PD for
Orange lines represent the time course of treatment with BV in
Patients in the BBP Subgroup
days for each patient who has progressed (n=642) with overlay
of time of 1st PD (blue asterisks]
•
The pattern of BV use for patients who used BBP is shown in Figure 3.
– 312 of 642 (49%), received BV continuously from 1st-line to beyond 1st PD (Figure 3A).
– The majority of patients in the BBP subgroup (n=571, 89%) either used BV continuously into
2nd-line, or restarted BV within the 1st 4 months post-1st PD (Figure 3B).
– 132 of the 642 BBP patients (20%) discontinued BV prior to 1st PD and restarted BV within 28
days of 1st PD.
– 198 of the 642 BBP patients (31%) discontinued BV either prior to or at 1st PD and restarted
BV >28 days after 1st PD.
Grothey ASCO 2007
Figures 4, 5. Kaplan-Meier Estimates of A) Survival Beyond 1st PD
and B) OS
•
Figure 4 displays the Kaplan-Meier curve for survival beyond 1st PD by subgroups
based on treatment beyond 1st PD (1st PD occurred at 0 months).
•
Figure 5 displays the Kaplan-Meier curve for OS by subgroups based on treatment
beyond 1st PD.
Use of 1st-line CT
Proportion of patients exposed to all 3 active CT agents
TTP
1st-line exposure to BV
•
Total duration of BV use was longer in the BBP subgroup, as expected.
•
Of the 1445 patients with PD, 542 (37.5%) used an EGFR inhibitor post 1st
PD (including BBP and No BBP); 489 of these (90%) used cetuximab.
Grothey ASCO 2007
Preliminary efficacy of bevacizumab
with first-line FOLFOX, XELOX,
FOLFIRI and fluoropyrimidines for
mCRC: First BEAT
S. Berry, D. Cunningham, M. Michael, A.
Kretzschmar, F. Rivera, M. DiBartolomeo, M. Mazier,
E. Van Cutsem, on behalf of the First BEAT
investigators
Abstract #350
Figure 4. Kaplan-Meier Estimates of Survival Beyond
Figure 5. Kaplan-Meier Estimates of OS by Subgroups
1st PD by Subgroups Based on Post-PD Therapy
Based on Post-Progression Therapy
Grothey ASCO 2007
Serious Bevacizumab-Related
Adverse Events
First BEAT: Study Schema
First-line
metastatic CRC
(1,965)
Bevacizumab + standard
chemotherapy
PD
• Bevacizumab: 5mg/kg Q2W or 7.5mg/kg Q3W
• Endpoints: safety and efficacy
• Median follow-up 22.9 months
Berry 2008 ASCO GI abstract #350
Event (%)
Any AE or SAE
(n=1,914)
CTC grade 3–5 or SAE*
(n=1,914)
Hypertension
29.9
Proteinuria
10.4
5.3
1.1
Bl di
Bleeding
31 0
31.0
34
3.4
Wound-healing complications
4.0
1.1
Arterial thromboembolic events
1.5
1.5
GI perforation
1.9
1.8
Berry 2008 ASCO GI abstract #350
5
The Angiogenic Switch
Angiogenesis
• Physiologic
Angiogenic
1-2 mm
Switch
Small tumor
• Nonvascular
• “Dormant”
Larger tumor
• Vascular
• Metastatic potential
• Pathologic
– Longitudinal bone growth
– Tumor growth
– Wound healing
– Rheumatoid arthritis
– Secondary sexual development – Psoriasis
• Corpus luteum formation
– Retinopathies
– Age-related macular
degeneration
Targeted Therapy: Bevacizumab
Indications
Angiogenesis: A Balanced Process
Activators
VEGF and receptors
• In combination with chemotherapy:
– Advanced colorectal cancer
– Advanced breast cancer
– Advanced lung cancer
Inhibitors
TSP-1
bFGF and receptors
Angiostatin
TGFβ and receptors
Endostatin
Others
Interferons-α, -β, and -γ
• Monotherapy:
Interleukins-4, 12, 18
• Indications pending:
– Early stage colon cancer
– Glioblastoma
– Renal cell cancer
uPAR
Others
TSP-1 = thrombospondin-1; uPAR = urokinase plasminogen activator receptor.
The Angiogenic Switch In
Hepatic Micrometastasis
180 uM
290 uM
520 uM
2 mm
We can hypothesize that Bev prevented the “angiogenic
switch” and kept tumors beneath the threshold of detection by
imaging.
Avascular
Within the
limits of O2
diffusion
Portal
Perfusion
Mixed Portal
and Arterial
Perfusion
Arterial
Perfusion
Liu, Matsui. Radiology 2007
6
The Mechanism of Action of Bev in the
Adjuvant Setting is Likely to be Different Than
in the Advanced Stage Setting
There Are No Known Predictive
Biomarkers for Anti-VEGF Therapy
IFL +/- Bev Trial
Mechanism
Advanced Disease*
Adjuvant
Anti-angiogenic
(block new blood vessel
growth)
Possible,
(no direct evidence)
Probable, based on C08
findings
(no direct evidence)
Induction of EC Apoptosis
Possible
Not likely, cooption likely to
provide nutrients in small
volume disease
Vasoconstriction
Possible
Unlikely, changes in tumor
blood flow not relevant when
tumor is microscopic
Normalization
Maybe
Probably not relevant for
microscopic tumors
Direct Effect on Tumor
Cells
Maybe
✔
Maybe
*Ellis, Hicklin. Nat Rev Ca 2008
Proposed Biomarker
Outcome
Plasma VEGF
Not Predictive
Primary Tissue VEGF
(ISH, IHC)
Not Predictive
Upstream Mediators of VEGF
(ras, raf, P53)
Not Predictive
Other Angiogenic Mediators
(TSP-2)
Not Predictive
Jubb et al. J Clin Oncol 24:217-227, 2006
Ince et al. J Natl Cancer Inst. 97(13):981-9, 2005
Holden et al. ASCO. Abstract: 3555, 2005
Specific imaging of VEGF-A expression with
radiolabeled anti-VEGF monoclonal antibody
Thamar H. Stollman, Marian G.W. scheer,
William P.J. Leenders, Kiek C.N. Verrijp,
Annemieke C. Soede, Wim J.G. Oyen, Theo
J.M. Ruers, and Otto C. Boerman
Kaplan-Meier estimates for progression-free survival (PFS) of patients with low and high baseline volume
transfer constant of contrast agent (Ktrans) and blood plasma volume fraction (Vp)
Hahn, O. M. et al. J Clin Oncol; 2008
Figure 3. Biodistribution of In-111 bevacizumab in athymic male
mice with s.c. LS174T tumors at 1, 3 and 7 days post injection (5
mice/group).
Figure 4. Scintigraphic images of athymic male mice with s.c. LS174T
tumors immediately after injection and at 1, 3 and 7 days post injection of
In-111-bevacizumab (25 Ci/mouse, 3g/mouse).
7
Association of Vascular Endothelial
Growth Factor and Vascular Endothelial
Growth Factor Receptor-2 Genetic
Polymorphisms With Outcome in a Trial
of Paclitaxel Compared With Paclitaxel
Plus Bevacizumab in Advanced Breast
Cancer: ECOG 2100
Bryan P. Schneider, Molin Wang, Milan Radovich, George W. Sledge,
Sunil Badve, Ann Thor, David A. Flockhart, Bradley Hancock, Nancy
Davidson, Julie Gralow, Maura Dickler, Edith A. Perez, Melody
Cobleigh, Tamara Shenkier, Susan Edgerton, Kathy D. Miller
Schneider, et al. JCO 2008, 26(28), 4672-4678
Fig 1. Kaplan-Meier curve for overall survival (OS) in experimental arm by genotype; (A) vascular
endothelial growth factor (VEGF)-2578 C/A; (B) VEGF-1154 G/A
Candidate Single Nucleotide Polymorphisms
Gene and Single Nucleotide
Polymorphism
White: Frequency
of Rare Allele
African American:
Frequency of Rare Allele
-2578 C/A
Promoter
A = 49%
A = 24%
-1498 C/T
Promoter
C = 49%
C = 33%
-1154 G/A
Promoter
A = 33%
A = 10%
-634 G/C
5’ Untranslated
region
C = 32%
C = 35%
936 C/T
3’ Untranslated
region
T = 15%
T = 13%
889 G/A (V297I)
Exon 7
A = 9%
A = 20%
1416 A/T (Q472H)
Exon 11
T = 25%
T = 10%
VEGFR-2
Schneider, B. P. et al. J Clin Oncol; 26:4672-4678 2008
Fig 2. Kaplan-Meier curve for overall survival (OS) in the experimental arm (by vascular endothelial
growth factor genotype) compared with the control and combination arms (not subdivided by genotype)
Schneider, B. P. et al. J Clin Oncol; 26:4672-4678 2008
Copyright © American Society of Clinical Oncology
Location
VEGF
Schneider, B. P. et al. J Clin Oncol; 26:4672-4678 2008
Copyright © American Society of Clinical Oncology
Hypertension and Overall Survival:
Axitinib
Rini, BI et al. Proc. ASCO 2008, Abstract 3543
Relationship Between HTN and the Efficacy of Anti-VEGF Rx
Reference
N
Scartozzi et
al.
39;25;1
1
Malignancy
Treatment
Colorectal
cancer
5-FU, irinotecan
+ bevacizumab
Main Findings
20% grade 2-3 HT; response in patients with grade 2-3 HT:
75% (n = 8) versus 32% (n = 31), P = 0.04
Rixie et al.
40; 32
mRCC
Sunitinib
22.5% grade 3 HT; response in patients with grade 3 HT: OR
5.69 (95% CI 2.51-12), P = 0.03
Rini et al.
52
Cytokineresistant
mRCC
Axitinib
Overall survival in patients with DBP ≥90 mmHg: not reached
(n = 32) versus 12.9 months (n = 20)
Rini et al.
62
Sorafenibresistant
mRCC
Axitinib
Overall survival in patients with DBP ≥90 mmHg: not reached
(n = 39) versus 8.4 months (n = 23)
Spano et al.
69
Pancreatic
carcinoma
Gemcitabine +
Axitinib
6% grade 3 HT, 22% all-grade HT; overall survival in patients
with DBP ≥90 mmHG: 13.0 months (95% CI 8.5-16.6) versus
5.6 months (95% CI 4.8-7.2)
Friberg et al.
52
Pancreatic
carcinoma
Gemcitabine +
bevacizumab
19% grade 3 HT; overall survival in patients with early HT
(<56 days of treatment): 13.7 months versus 8.7 months (P =
0.007)
Rini et al.
32
Melanoma
Axitinib
Overall survival in patients with DBP ≥90 mmHg: 13 months
(n = 19) versus 6.4 months (n = 13)
Rini et al.
32
NSCLC
Axitinib
Overall survival in patients with DBP ≥90 mmHg: 15 months
(n = 19) versus 11.6 months (n = 13)
Rini et al.
60
Thyroid
cancer
Axitinib
Overall survival in patients with DBP ≥90 mmHg: not reached
(n = 39) versus 21.6 months (n = 21)
Schneider et
al.
345
Breast cancer
Paclitaxel +
bevacizumab
Overall survival in patients with grade 3-4 HT (n = 52): 38.7
months versus 25.3 months (n = 293), P = 0.02
Mir et al. Ann Onc 2009
8
Angiogenic Cytokines Are Increased Prior to
Disease Progression In Metastatic Colorectal
Cancer Patients Treated With Bevacizumab
Proposed Mechanisms of Bevacizumab Resistance
Scott Kopetz, Paulo M. Hoff, Cathy Eng,
Michael Overman,
Overman Katrina Y
Y. Glover
Glover, David Z
Z. Chang
Chang,
Robert A. Wolff, James L. Abbruzzese,
Lee M. Ellis, John V. Heymach
The University of Texas, M.D. Anderson Cancer Center, Houston, Texas
Centro de Oncologia, Hospital Sírio Libanês, Sao Paulo, Brazil
Ellis, Hicklin, Clin Cancer Res, 2008
Study Purpose and Methods
Cycle 2
Day 15
Bevacizumab
Bevacizumab
FOLFIRI
FOLFIRI
placental growth factor [PlGF]
matrix metalloprotease 9 [MMP-9]
b i fibroblast
basic
fib bl t growth
th factor
f t [bFGF]
I t l ki 8 [IL-8]
Interleukin
[IL 8]
hepatocyte growth factor [HGF]
Eotaxin / CCL11
platelet derived growth factor-BB [PDGF]
stromal derived factor 1a/CXCL12 [SDF-1]
stem cell factor/KIT ligand [SCF]
monocyte chemotactic protein 3 [MCP-3]
Interleukin 1-beta [IL-1β]
macrophage colony stimulating factor [M-CSF]
†
†
0.5
*
– p<0.05 for a priori primary cytokines, multiple
comparison adjusted for exploratory cytokines.
†
†
†
0.25
Pl
• Comparisons by nonparametric Wilcoxon
paired test
†
1
G
granulocyte colony stimulating factor [G-CSF]
2
After Bevacizumab
After FOLFIRI + Bev
*
IL
-8
E-Selectin
*
P9
Exploratory Cytokines
4
M
M
Primary Cytokines
Every 2 weeks
Cytokine Modulation after Single-agent
Bevacizumab, and after FOLFIRI + Bevacizumab
n
• Multiplex bead assay, ELISA for panel of 38
cytokines, 6 identified for a priori evaluation:
After FOLFIRI + Bev
• Subsequent samples were obtained every two
weeks
• n=40 with evaluable samples at the selected time
points
F
Study Methods
After Bevacizumab
Eo
ta
xi
Kopetz, et al. ASCO ’07 Abs 4089
Baseline
Median ffold change
from baseline
43 previously untreated patients
First cycle consisted of single agent bevacizumab
Response rate of 60%
Progression-free survival of 12.8 months
Overall survival of 30.7 mos.
Cycle 4+
Day 43
Bevacizumab
• Trial: Phase II of FOLFIRI + Bevacizumab
–
–
–
–
–
Cycle 3
Day 29
le
ct
in
2) just prior to progressive disease on a bevacizumabcontaining regimen
• Sample Collection Study Aim 1:
Cycle 1
Day 1
ESe
1) after treatment with bevacizumab
bF
G
F
• Purpose: To evaluate circulating levels of cytokines:
Study Methods
There were no significant changes in the other cytokines
•p<0.05; † p<0.05 after multiple comparison correction
•Error bars represent a nonparametric estimate of SD
9
PlGF and bFGF are Increased
Prior to Progression
p=0.04
40
p<0.01
30
p<0.01
bFGF
F (ng/mL)
30
20
ULN
20
10
ULN
as
e
B
as
el
in
ev
e
ac
A
iz
fte
um
rF
ab
O
Pr
LF
io
IR
rt
I+
o
B
Pr
og
re
ss
io
n
B
fte
rB
A
B
lin
ev
e
ac
A
iz
fte
um
rF
ab
O
Pr
LF
io
IR
rt
I+
o
B
Pr
og
re
ss
io
n
0
0
• PlGF, bFGF, and HGF were increased prior to
progression on a bevacizumab-containing
regimen
– PlGF increased after single-agent
bevacizumab an peaked prior to progression
bevacizumab,
• There is considerable variation in the magnitude
of these changes between patients
• Myeloid lineage activators and chemotactic
cytokines are increased prior to progression
A
fte
r
PlGF ((pg/mL)
p<0.01
Conclusions
ULN = upper limits of normal for healthy controls
Implication of Findings
• Markers for early detection of resistance
• Provides therapeutic targets to reverse resistance to antiangiogenic therapy
• Individualize continued anti-angiogenic therapy after
progression
i
• PlGF signaling may be inhibited by VEGF tyrosine
kinase inhibitors
• bFGF receptor tyrosine kinase inhibitors are in clinical
development
• Absence of alternate angiogenic signaling at
progression may represent opportunity for continued
benefit from bevacizumab
10


© Copyright 2026