
ECONOMIC STATEMENT
ECONOMIC STATEMENT
AUGUST 2013
STATEMENT BY
THE HONOURABLE CHRIS BOWEN MP
TREASURER OF THE COMMONWEALTH OF AUSTRALIA
AND
SENATOR THE HONOURABLE PENNY WONG
MINISTER FOR FINANCE AND DEREGULATION
OF THE COMMONWEALTH OF AUSTRALIA
© Commonwealth of Australia 2013
ISBN 978-0-642-74924-6
This publication is available for your use under a Creative Commons Attribution 3.0
Australia licence, with the exception of the Commonwealth Coat of Arms,
photographs, images, signatures and where otherwise stated. The full licence terms are
available from http://creativecommons.org/licenses/by/3.0/au/legalcode.
Use of Commonwealth of Australia material under a Creative Commons
Attribution 3.0 Australia licence requires you to attribute the work (but not in any way
that suggests that the Commonwealth of Australia endorses you or your use of the
work).
Commonwealth of Australia material used ‘as supplied’.
Provided you have not modified or transformed Commonwealth of Australia material
in any way including, for example, by changing the Commonwealth of Australia text;
calculating percentage changes; graphing or charting data; or deriving new statistics
from published Commonwealth of Australia statistics — then Commonwealth of
Australia prefers the following attribution:
Source: The Commonwealth of Australia.
Derivative material
If you have modified or transformed Commonwealth of Australia material, or derived
new material from those of the Commonwealth of Australia in any way, then
Commonwealth of Australia prefers the following attribution:
Based on Commonwealth of Australia data.
Use of the Coat of Arms
The terms under which the Coat of Arms can be used are set out on the It’s an Honour
website (see www.itsanhonour.gov.au).
Other Uses
Inquiries regarding this licence and any other use of this document are welcome at:
Manager
Communications
The Treasury
Langton Crescent Parkes ACT 2600
Email: [email protected]
Notes
(a) The following definitions are used in the Economic Statement:
– ‘real’ means adjusted for the effect of inflation;
– real growth in expenses and payments is calculated using the Consumer Price
Index (CPI) deflator;
– one billion is equal to one thousand million; and
– the Budget year refers to 2013-14, while the forward years refer to 2014-15,
2015-16 and 2016-17.
(b) Figures in tables and generally in the text have been rounded. Discrepancies in
tables between totals and sums of components are due to rounding:
– estimates under $100,000 are rounded to the nearest thousand;
– estimates $100,000 and over are generally rounded to the nearest tenth of a
million;
– estimates midway between rounding points are rounded up; and
– the percentage changes in statistical tables are calculated using unrounded
data.
(c) For the budget balance, a negative sign indicates a deficit while no sign indicates a
surplus.
(d) The following notations are used:
-
nil
na
not applicable (unless otherwise specified)
$m
millions of dollars
$b
billions of dollars
nfp
not for publication
(e)
estimates (unless otherwise specified)
(p)
projections (unless otherwise specified)
NEC/nec
not elsewhere classified
iii
(e) The Australian Capital Territory and the Northern Territory are referred to as ‘the
Territories’. References to the ‘States’ or ‘each State’ include the Territories. The
following abbreviations are used for the names of the States, where appropriate:
(f)
NSW
New South Wales
VIC
Victoria
QLD
Queensland
WA
Western Australia
SA
South Australia
TAS
Tasmania
ACT
Australian Capital Territory
NT
Northern Territory
In this paper the term Commonwealth refers to the Commonwealth of
Australia. The term is used when referring to the legal entity of the
Commonwealth of Australia.
The term Australian Government is used when referring to the Government
and the decisions and activities made by the Government on behalf of the
Commonwealth of Australia.
iv
FOREWORD
The Government has released the August 2013 Economic Statement (ES) to provide an
update of its economic forecasts and key fiscal aggregates.
The document contains:
•
Part 1 Overview —summary information on the budget situation.
•
Part 2 Investing in Australia’s future —an overview of the key elements of the
Government’s reform agenda, including key achievements.
•
Part 3 Economic Outlook —an update on the international and domestic economy.
•
Part 4 Fiscal Outlook —an update of the budget outlook.
v
CONTENTS
FOREWORD
.............................................................................................................. V
OVERVIEW
.............................................................................................................. 1
INVESTING IN AUSTRALIA’S FUTURE ................................................................................... 5
Ensuring rising Australian living standards ................................................................ 7
Sharing the benefits of a growing economy ............................................................. 13
Avoiding the economic costs of climate change ...................................................... 17
Advancing our National Security interests ............................................................... 18
ECONOMIC OUTLOOK ...................................................................................................... 21
FISCAL OUTLOOK ............................................................................................................ 29
APPENDIX A: FINANCIAL STATEMENTS ............................................................................. 47
APPENDIX B: POLICY DECISIONS TAKEN SINCE THE 2013-14 BUDGET ............................... 53
APPENDIX C: HISTORICAL AUSTRALIAN GOVERNMENT DATA............................................ 69
vii
OVERVIEW
The Government is on track to achieve a modest budget surplus within the forward
estimates, while at the same time ensuring the economy is supported in the short term
with accommodating fiscal policy, and in the longer term with new policy directions to
lift productivity, economic growth, and therefore Australian living standards now and
into the future.
With moderate unemployment, contained inflation, and low public debt, Australia
currently has some of the strongest economic fundamentals in the developed world
(Table 1).
Table 1: Major economic parameters
(a)
Projections
Forecasts
2016-17
2013-14
2014-15
2015-16
3
3
3
2 1/2
Real GDP
Employment
1
1 1/2
1 1/2
1 1/2
Unemployment rate
6 1/4
6 1/4
5
5
Consumer Price Index
2 1/2
2
2 1/2
2 1/2
Nominal GDP
3 3/4
4 1/2
5 1/4
5 1/4
Terms of trade
-5 3/4
-3 3/4
-1 1/2
-1 1/2
(a) Real and nominal GDP are year average growth. Employment and CPI are through-the-year growth to
the June quarter. The unemployment rate is the rate in the June quarter.
Source: ABS cat. nos. 5206.0, 6202.0 and 6345.0, Treasury.
While prospects remain favourable, the economic outlook has softened further since
the Budget, particularly for nominal GDP. The outlook for world growth has
weakened, including in China, and the world price of key commodities has fallen
leading to lower forecast terms of trade. This, along with lower forecast real GDP
growth and a weaker outlook for wage growth, has led to a substantial downgrade to
nominal GDP growth over the forecast period.
Nominal GDP is now forecast to grow by 3¾ per cent in 2013-14 and 4½ per cent in
2014-15, well below its 20-year average of 6½ per cent. This, in turn, has had a major
impact on expected tax receipts, which, since Budget, have been revised down as a
result of the softer economic outlook by $33.3 billion over the forward estimates.
Table 2: Summary of budget aggregates
Estimates
2013-14
2014-15
-24.0
-30.1
-1.9
-1.5
Underlying cash balance ($b)(a)
Per cent of GDP
Fiscal balance ($b)
Per cent of GDP
(a) Excludes net Future Fund earnings.
-25.6
-1.6
1
-22.2
-1.4
Projections
2015-16
2016-17
-4.7
4.0
-0.3
0.2
1.8
0.1
7.6
0.4
Economic Statement
The Government remains committed to the medium-term fiscal strategy that has
steered Australia’s successful response to the Global Financial Crisis, and which
provides the basis for the Government’s decision to keep the budget on track to return
to surplus and keep Australia’s fiscal position strong (Table 2).
The Government has already undertaken a significant fiscal consolidation since
2009-10. It is now using the flexibility in the fiscal strategy to respond to the changes in
the economic outlook, while strengthening fiscal sustainability in the medium term.
The Government has ensured that the pace of fiscal consolidation carefully balances
the importance of a sustainable fiscal position with the risks to jobs and growth that
have been seen internationally from too fast a consolidation.
With the economy currently facing a period of transition and falling terms of trade,
cuts in the near term to offset the lower than expected tax receipts and other variations
in the budget would put jobs and growth at risk. With the forecast moderate
slowdown, and the unemployment rate expected to increase slightly over the next
year, the Government has made the clear decision to allow the tax write-downs to flow
through to the budget balance in 2013-14 and 2014-15. As a result, the expected deficit
in 2013-14 is now $30.1 billion, and the expected deficit in 2014-15 is $24.0 billion.
From 2015-16 more significant savings take effect and mostly offset the slower growth
in tax receipts so that there is a modest deficit in 2015-16 and a modest surplus in
2016-17. The Government considers that these savings can be managed while
maintaining growth in jobs and the broader economy.
A medium-term consolidation and path back to budget surplus is appropriate to
strengthen medium-term budget sustainability, and is made possible by Australia’s
strong economic fundamentals. The Government has made $17.4 billion of responsible
savings decisions to provide a pathway to expected surplus in 2016-17. The majority of
the required consolidation is planned to occur in 2015-16 and 2016-17 when the
economic transition is further progressed, allowing for a pick-up in the pace of
consolidation. The savings decisions make a significant structural improvement to the
Government’s fiscal position over the medium and longer term.
Preliminary estimates indicate that the underlying cash deficit in 2012-13 will be
around $18.8 billion (around 1.2 per cent of GDP), which suggests a slightly improved
outcome from previous estimates. The final results for 2012-13 will be determined
following the finalisation of audit cleared financial statements and will be published in
the 2012-13 Final Budget Outcome by 30 September 2013.
MANAGING THE TRANSITION
Over the past decade, the resources sector has been a major contributor to Australian
economic growth. Increasing demand for Australia’s mineral and energy resources
pushed up export prices and prompted a massive expansion of investment in iron ore,
2
Economic Statement
coal and LNG projects. This combination of higher prices and increased investment in
the resources sector resulted in a period of very strong income growth for Australia.
This abnormal period of heavy reliance on one part of the economy will come to an
end, and managing the transition back to more normal, broader based growth will be a
key economic challenge over the next few years. The prices of Australia’s resource
exports peaked in 2011 and have fallen since then. While the level of investment is
expected to remain at historically elevated levels over the forecast period, investment
in iron ore and coal projects has probably already peaked, with future investment
underpinned by LNG projects already under construction. Economic growth will
increasingly depend on renewed growth in other sectors of the economy, like
manufacturing, tourism and services.
Australia embarks on this transition from a position of strength with some of the
strongest economic fundamentals in the developed world.
As the transition unfolds, the Australian economy is forecast to grow by a solid
2½ per cent in 2013-14 and 3 per cent in 2014-15. To ensure that the transition is as
smooth as possible, we must preserve and build upon Australia’s strengths as an open,
flexible and competitive economy. But even with relatively smooth growth, it is likely
that export prices will continue to fall over the medium term as the global supply of
resources increases.
In these circumstances, higher productivity growth will be the key to improving living
standards.
In response, the Government has committed to a new National Competitiveness
Agenda, to lift productivity, economic growth, and Australian living standards now
and into the future. The Government is working cooperatively with business and the
unions to lift Australia's annual productivity growth rate to 2 per cent or better. This
collaborative
approach
maximises
the
opportunity
that
significant
productivity-enhancing reforms can be agreed and implemented.
3
INVESTING IN AUSTRALIA’S FUTURE
This Government has a strong record in meeting economic challenges. We have
managed the structural economic transitions of recent years and we have navigated
the challenges of the Global Financial Crisis (GFC) and the ongoing bouts of economic
and financial volatility.
Our action during the GFC saved Australia from the recessions seen across the world
in other OECD nations. While these countries are either just recovering, or still
struggling to recover from the effects of the GFC, we have some of the strongest
economic fundamentals in the developed world — economic growth close to trend;
moderate unemployment; a prudent fiscal position and contained inflation.
As Australia embarks on a new era of economic transition marked by a shift from the
largest investment boom in our history to more of our economic growth being sourced
from the non-resource sectors of the economy, we start from a position of economic
strength and resilience.
Managing this transition will be fundamental to Australia’s economic prosperity. In
order to ensure continued growth, productivity has to be front and centre of
Australia’s economic agenda. Australians deserve a Government with a proven record
of successful economic management and a clear plan to ensure the current economic
transition is managed smoothly.
That is why the Government is working closely with business and unions to develop
and implement a new national competitiveness agenda. Only through collaboration
between business, unions and government can we effectively implement the
wide-ranging reforms needed to boost productivity and ensure more broad-based
economic growth. This plan will build on our existing productivity enhancing policies.
Under our policies, the Australian economy has grown by around 14 per cent since we
came to power; and we have laid the foundations for higher productivity and labour
force participation growth in the future. This growth has occurred during the worst
global recession since the Great Depression of the 1930s, continued international
economic instability and rapid economic change both at home and abroad. These
policies include:
•
investing in traditional economic infrastructure like roads, rail and ports to increase
the economy’s productive capacity;
•
investing in new infrastructure like the National Broadband Network (NBN) so
Australia can thrive in a globalised digital economy;
5
Economic Statement
•
ensuring our workforce has the skills needed for the jobs of today and tomorrow by
increasing funding for higher education, vocational education and training and
schools, and providing additional student access and places;
•
supporting all parts of the innovation chain from basic research to
commercialisation through initiatives like Industry Innovation Precincts and
Venture Australia;
•
recognising the importance of small business to the economy by assisting people to
invest in their businesses and improve their competitiveness through expanded tax
arrangements and support services;
•
working with Australian industry to ensure that Australia has world class
businesses and high skill, high wage jobs for the future;
•
empowering regional Australia to reach its potential by improving infrastructure
and employment services through initiatives like the Regional Australia
Development Fund; and
•
commissioning and undertaking fundamental tax reform to enhance Australia’s
investment and productivity.
Maintaining macroeconomic stability through a prudent and sensible path to surplus
over the forward estimates will provide an environment conducive to sustained
economic growth. This Economic Statement reflects maintained fiscal restraint, while
still funding economic and social reforms and investing in the infrastructure of the
future. A gradual return to surplus will support jobs and economic growth, especially
in the near term, and deliver sustainable public finances.
Our financial position is the envy of other advanced economies. Australia has one of
the lowest levels of government debt as a percentage of GDP among the advanced
economies. The budget deficit as a proportion of GDP is also one of the lowest among
the advanced economies. We are also one of only 8 countries in the world to enjoy both
a stable outlook and a AAA credit rating from all three major international rating
agencies.
All Australians should share in the opportunities and benefits that come with a strong
economy. This Government’s policies will ensure all Australians experience the
benefits of rising living standards, both directly and through more efficient and
accessible government services.
Significant reforms in health, education and disability services have been achieved and
will be continued. The Government has introduced Australia’s first national Paid
Parental Leave scheme and increased assistance to families to meet the costs of child
care, primary and secondary education. Record increases to age pension payments and
6
Economic Statement
the Superannuation Guarantee will result in higher standards of living for Australians
in retirement.
Economic prosperity depends also on protecting our environment. The potential
impacts on our economy of unmitigated climate change and water scarcity are severe.
Our commitment to an internationally linked market-based emissions trading scheme
and the finalisation of the Murray-Darling Plan are essential components of ensuring
Australia continues its economic growth in an environmentally sustainable way.
Ensuring rising Australian living standards
Australia has experienced 22 years of continuous economic growth but we do face
challenges in coming years. Sustaining growth in living standards in the context of
declining terms of trade and an ageing population will require an improvement in
Australia’s productivity growth performance and international competitiveness.
NATIONAL COMPETITIVENESS AGENDA
The core of the Government’s national competitiveness agenda will be an agreement
between government, business and unions to lift our annual productivity growth rate
to two per cent per annum or more.
This collaborative approach is crucial to ensure all sectors of the economy have a
shared sense of ownership of the reform agenda so that reforms are developed
collaboratively and implemented smoothly. Thus far, the Government has agreed on
seven priority areas to boost Australia’s productivity performance.
1.
A key priority is reforming domestic electricity price regulation, moving to an
emissions trading scheme, and ensuring the future availability of competitively
priced domestic gas supplies.
2.
The Government will continue to examine any unintended rigidities arising in
the labour market and will work with businesses and unions to harness the full
productive potential of the Fair Work Act 2000.
3.
The Government will consider improvements to business productivity, with the
Business Council of Australia recently identifying project management and
effective use of capital by management as areas for improvement. Businesses also
need to improve company board and executive-level Asia-relevant experience if
Australia is to capitalise on opportunities in the Asian region.
4.
The Government recognises that Australia needs a new approach to the
regulatory impost on business from all levels of government. This particularly
7
Economic Statement
applies to multiple and conflicting environmental assessment requirements for
state and territory governments and the Australian government.
5.
Australia’s national objective must be to build the best-educated, best-trained,
and best-skilled workforce in the world. Vocational education and training is
particularly important, given the recent withdrawal of effort by many of the
states.
6.
Australia needs to embrace new forms of infrastructure financing.
7.
We must improve the operating environment for small business in this country.
This involves access to capital and other productivity drivers, such as the
effective take-up of the NBN.
BETTER SCHOOLS PLAN
The Government’s Better Schools Plan will provide a historic investment in Australian
schools, delivering over $15 billion additional funding over the next six years if all
states and territories sign up to the agreement.
In partnership with participating states and territories, the Government is putting in
place reforms of Australian school funding arrangements to better align funding with
student needs, delivering greater consistency in the distribution of funding and
helping drive improvement at the student, school and national levels. The extra
funding will enable more one-on-one individual attention for school students. It will
also help Australian children compete with those in Asia, and get highly skilled,
highly paid jobs for the future. This reform is critical to boost Australia’s future
productivity and, thus, its prosperity.
To date, partnerships have been settled with New South Wales, South Australia, the
Australian Capital Territory, and Tasmania. The Government has also reached
agreement with the Catholic and independent schooling sectors. The Better Schools
Plan now covers 63 per cent of Australian students.
IMPROVING VOCATIONAL EDUCATION AND TRAINING
The Government has a track record of reform and investment in vocational education
and training (VET), skills and workforce development, with total annual Australian
Government funding growing from $2.3 billion to $3.4 billion between 2006-07 and
2012-13, an increase of about 25 per cent in real terms.
To drive VET reform, the Government entered into a five-year, $1.75 billion National
Partnership Agreement on Skills Reform with the states and territories, with
implementation plans now signed with all jurisdictions.
8
Economic Statement
A new skills and workforce development partnership with industry was also created
through the Building Australia’s Future Workforce package, which includes a National
Workforce Development Fund to support training and workforce development for
more than 170,000 workers across six years, and additional funding to expand the
Workplace English Language and Literacy Program, which trained more than
72,000 employees between 2007 and 2011.
HIGHER EDUCATION REFORM
The Government has implemented a suite of reforms to higher education that will
create the educated and productive workforce of the future, including an uncapped
funding model for undergraduate university places; generous indexation
arrangements across learning, teaching and research; and stronger support for research
excellence.
This has resulted in a 75 per cent increase in Commonwealth funding for university
places between 2007 and 2013, from $3.5 billion to $6.1 billion, supporting an
additional 190,000 students to access higher education. Greater, more equitable access
to university means that Australia is on track to achieve the goal of 40 per cent of the
25-34 year old population holding a bachelor degree qualification or above by 2025.
INVESTING IN INFRASTRUCTURE
The Government has, and continues to, invest strongly in nationally significant
economic infrastructure. Since coming to Government we have allocated around
$60 billion to roads, rail and public transport through the Nation Building programs.
One of the Government’s key achievements has been completing the full duplication of
the Hume Highway, Australia’s most important freight corridor.
We established Infrastructure Australia (IA) in 2008 to help drive the development of a
long-term, coordinated national approach to infrastructure planning and investment.
IA has put in place a National Priority List to guide investment in the projects that
offer the highest economic and social returns. The Government has continued to
prioritise funding for projects ranked as ‘ready-to-proceed’ by IA.
The Government recognises that the future growth of infrastructure will require a new
approach to funding and financing. We will need to foster greater private sector
involvement in infrastructure and unblock the current bottlenecks that are preventing
the construction of new infrastructure projects.
9
Economic Statement
BUILDING THE NBN
The NBN is the largest single nation-building infrastructure project in Australia's
history. It will underpin productivity improvements across the economy, transforming
the way business operates. It will deliver download speeds of up to one gigabit per
second to 93 per cent of homes, schools and businesses via optical fibre. The remaining
seven per cent of premises will have access to a combination of next-generation fixed
wireless and satellite technologies, providing peak download speeds of up to
25 megabits per second. On 4 July 2013, NBN Co announced that it had met its revised
fibre rollout targets, passing around 207,500 homes and businesses. Fibre rollout to
over 4.8 million Australian homes and businesses is scheduled to be underway or
completed by the middle of 2016.
BUILDING AN INNOVATION CULTURE IN AUSTRALIA
Innovation is essential to the future success of Australian businesses.
The Government has increased overall funding for science, research and innovation by
30 per cent from $6.6 billion in 2007–08 to $8.6 billion in 2013-14, supporting all parts of
the innovation chain from basic research to commercialisation. Funding for university
research has increased by 58 per cent, from $1.8 billion to $2.8 billion.
This is crucial for developing the new technologies, products and processes that will
underpin more broad-based growth in the coming years and decades. Innovation
enables businesses to increase productivity through the development and adoption of
new technologies and it allows new products, markets and jobs to be created.
HELPING AUSTRALIAN INDUSTRY THRIVE
The Government wants to ensure that Australia has competitive industries and high
skill, high wage jobs for the future. Attracting investment and helping firms adjust to
changes in the economy is necessary to achieve this.
The $1 billion Plan for Australian Jobs will ensure Australian firms get fair access to
work on major projects, win new business abroad and help small businesses grow. It
will create internationally competitive businesses and jobs by promoting collaboration
between businesses and research institutions through Industry Innovation Precincts.
The Government is investing $500 million to establish up to 10 precincts around
Australia. We have established the Advanced Manufacturing and Food Industry
Innovation Precincts in Melbourne, with eight more Industry Innovation Precincts to
be announced in coming months. These new precincts will allow industry to lead
research and innovation priorities and will involve collaborations with Australia’s top
researchers, ensuring innovation is focused on real economic outcomes.
10
Economic Statement
Small and medium-sized businesses and start-up companies will also be provided
with a broader set of business services through Enterprise Connect and better access to
finance through the $378 million Venture Australia package to stimulate Australia’s
venture capital market.
TAX REFORM TO SUPPORT INVESTMENT AND PRODUCTIVITY
The Government has delivered a substantial and continuing program of tax reform,
starting with the Rudd Government’s first budget in 2008 when it commissioned the
Australia’s Future Tax System (AFTS) Review — the most comprehensive review of
the tax and transfer system in a generation. The Government has already implemented
more than one third of the 138 recommendations contained in the AFTS Report and is
continuing to add to that record.
A key focus of the Government’s tax reform agenda has been reforms aimed at
ensuring the tax system better supports national productivity. The Government
recognises how important productivity growth is for higher living standards. That is
why we are implementing reforms to support businesses responding to changes in the
economy and investment.
The Government is supporting businesses to invest and adapt to a transitioning
economy through reforms to allow companies to carry back losses to get a refund of
past tax paid, worth $150 million in 2013-14 and growing to $300 million in 2015-16; an
instant asset write-off for small business, worth $1.2 billion in 2013-14; and an
accelerated deduction for motor vehicles worth $200 million in 2013-14.
The Government is also improving incentives to support up to $25 billion in nationally
significant infrastructure spending by the private sector, by preserving the real value
of tax losses over time and making it easier for investors to access these losses.
The Government is supporting investment in research and development (R&D) by
doubling the rate of assistance for small and medium-sized companies and improving
cash flow by providing a 45 per cent refundable tax offset. Further refinements
commencing from 1 July 2013 will ensure the incentive is targeted at small and
medium companies more likely to undertake additional R&D as a result of the
incentive.
The Government has also acted to promote greater fairness and sustainability in the
tax system by removing out-dated or poorly targeted tax concessions.
Recent reforms include phasing out the dependent spouse tax offset which imposes
high effective marginal tax rates on secondary earners and dates back to a time when
male breadwinners supported a housewife. The Government has also consolidated
other dependency offsets into a single offset that targets assistance to taxpayers
supporting carers and relatives with a disability.
11
Economic Statement
The Government has introduced a number of reforms to better target fringe benefits
tax (FBT) exemptions and ensure they operate as intended, including by:
•
ensuring the tax concessions for living-away-from-home allowances and benefits
can only be used for the expenses of people who are legitimately maintaining a
second home in addition to their actual home in Australia, for a maximum period
of 12 months;
•
removing the concessional FBT treatment for ‘in-house’ fringe benefits that are
accessed by way of a salary sacrifice arrangement; and
•
targeting the FBT exemption for car fringe benefits to actual business use rather
than including personal use, providing a more level playing field for all workers.
The Government’s vision for a stronger tax system that supports productivity and
economic growth also extends to reform at the state and territory level. The AFTS
Review found that some of the most inefficient taxes are levied by the states and
territories and identified reforms to improve or abolish taxes that are a drag on the
economy. The Government supports the efforts of state and territory governments to
reform their tax system, in line with the Government’s vision in commissioning the
AFTS Review.
SUPPORTING AUSTRALIAN SMALL BUSINESSES
The Government assists small business in improving its management and business
processes through Small Business Advisory Services and the Enterprise Connect
programs. It also established the first national Small Business Commissioner to
provide a one-stop shop for small business services and information, and to ensure
that the interests of small business remain at the forefront of Government policy
making.
The Government has implemented a number of substantial and ongoing reforms to
assist small businesses including: personal income tax cuts as part of the tax plan for
Australia’s future and, as noted above; an instant asset write-off for small business,
worth $1.2 billion in 2013-14; the accelerated deduction for motor vehicles worth
$200 million in 2013-14; and loss carry-back.
The Small Business Superannuation Clearing House is a free service that takes the
pressure off small business owners and reduces the time spent by employers on
paying different superannuation funds for different employees. It has distributed more
than $1 billion in superannuation payments on behalf of small business owners across
the country.
The Government has delivered a national business names registration system. This
saves businesses both time and money by replacing separate state and territory
12
Economic Statement
systems with a single national system. Previously the cost of registering a business
name in every state and territory was over $1000 for three years, now it is only $76.
The national business names registration system is complemented by a new online
Australian Business Account to help businesses manage online interactions with all
levels of government in a smarter way. The new Australian Business Licence and
Information Service also enables businesses to access licence, permit and other
important information through one online portal.
The Government is also expanding the online Standard Business Reporting (SBR)
initiative, which makes it simpler, easier and faster for businesses to meet reporting
obligations. Under SBR, businesses are able to use SBR-enabled accounting software to
prepare and lodge key government forms directly from their software to agencies
participating in the SBR program.
Sharing the benefits of a growing economy
DISABILITYCARE AUSTRALIA
The Government will provide more than $14 billion in new funding over seven years
from 2012-13 to roll out DisabilityCare Australia across the country by July 2019.
DisabilityCare Australia, the national disability insurance scheme, will provide people
with significant and permanent disability with reasonable and necessary support over
their lifetimes, and more choice and control over how their support is delivered. As
well as improving the lives of hundreds of thousands of Australians with disability,
their families and carers, this reform will create opportunities for many of those people
to participate more fully in the community and in the economy.
BETTER QUALITY HEALTH AND AGED CARE
Since 2007, the Government has made significant investments in the healthcare system
and undertaken a series of fundamental reforms to drive better quality healthcare for
all Australians.
The Government established the Health and Hospitals Fund (HHF) in 2009 to invest
$5 billion in major health infrastructure programs to make strategic investments that
underpin significant improvements in efficiency, access and outcomes in healthcare.
One priority of the HHF has been cancer centres and health infrastructure in regional
areas.
In 2011, the Government and all states and territories signed the National Health
Reform Agreement to increase accountability and transparency, reduce waste and
waiting times, and continue to ensure future generations enjoy world-class patient
13
Economic Statement
care. Under this agreement the Commonwealth will share the burden of funding
growth in the costs of providing public hospital services, easing the pressure on public
hospitals and state budgets. The agreement guarantees that hospitals will receive a
minimum of $16.4 billion in additional Commonwealth funding from 2014-15 to
2019-20 than would otherwise have been received.
In 2011, the Government made mental health a national priority by investing
$2.2 billion over five years in mental health reform to deliver additional services, a
greater focus on prevention and early intervention, and a better integrated system.
The Government announced a $4.1 billion dental health reform package in 2012 to
improve access to dental services and boost the dental workforce, including $2.7 billion
for a Child Dental Benefits Scheme (Grow up Smiling).
In 2012, the Government unveiled the Living Longer Living Better aged care reform
package with $3.7 billion over five years to provide more support and care in the
home, better access to residential care and strengthen the aged care workforce.
The Government has also invested almost $1.5 billion over four years in new listings
and amendments to listings on the Pharmaceutical Benefits Scheme (PBS) since the
2013-14 Budget.
SUPPORTING REGIONAL COMMUNITIES TO REACH THEIR FULL
POTENTIAL
The Government has worked closely with local communities to support better
economic, social and environmental outcomes for Australia’s regional communities, as
well as to develop region-specific solutions for communities in transition. This has
included:
•
almost $1 billion through the Regional Development Australia Fund to support
specific regional, economic and community infrastructure needs;
•
$2.9 billion under the Health and Hospitals Fund to improve access to essential
health services for rural, regional and remote communities;
•
$1.5 billion under the Remote Jobs and Communities Program to provide a more
integrated and flexible approach to employment and participation services;
•
approximately $400 million to support the historic Tasmanian Forests Agreement,
Australia’s presence in Antarctica and the development of jobs, skills and
accelerated investment in key sectors of the Tasmanian economy;
•
continuing the underwriting of essential air services to Norfolk Island and the
Indian Ocean Territories;
14
Economic Statement
•
providing $4.0 million over two years from 2013-14 for the Lord Howe Island
Aerodrome Improvement Works project; and
•
supporting northern Australia to realise its potential for growth by taking
advantage of the opportunities presented by the Asian century and diversifying
and expanding exports and services into Asian markets.
INVESTING IN OUR CHILDREN’S FUTURE
The Government’s National Quality Framework commenced on 1 January 2012 for
most long day care, family day care, preschool (or kindergarten) and outside schools
hours care services. The Framework aims to raise quality and to drive improvement
and consistency in these services. Key initiatives include the introduction of a national
legislative framework and a National Quality Standard for services. Specific
requirements, such as educator qualifications and educator-to-child ratios, are being
gradually phased in between 2012 and 2020.
The introduction of the National Assessment Program — Literacy and Numeracy
(NAPLAN) in 2008 has provided nationwide data on literacy and numeracy for the
first time. NAPLAN tests give parents, teachers, schools, governments and students
valuable insights into how well students and schools are performing compared to their
peers across Australia.
As a key element of the Government’s 2009 Nation Building and Jobs Plan,
$16.2 billion was provided to update school infrastructure as part of the Building the
Education Revolution initiative. This initiative supported jobs during the Global
Financial Crisis and will deliver ongoing benefits through improved school facilities in
around 9,500 schools, supporting student achievement and bringing communities
together.
SUPPORTING AUSTRALIAN FAMILIES
Since 2007 the Government has taken significant steps to improve and better target
assistance to families, making sure assistance goes to families who need it most, when
they need it most, and supporting them to participate in the workforce.
Availability of quality child care is vital to many Australian families and, since 2007,
the Government has more than doubled support for child care, an increase of
115 per cent. A key part of this is the Government’s improvements to the Child Care
Rebate, which has been increased from 30 per cent to 50 per cent of out-of-pocket child
care expenses, up to an increased cap of $7,500 per child per year (increased from
$4,354 in July 2008).
15
Economic Statement
In 2011, the Government also committed $731 million over five years to establish
Australia’s first Paid Parental Leave (PPL) scheme. Now, around 95 per cent of
working women have access to paid leave (an increase from around 50 per cent) and,
as of March 2013, over 280,000 families have benefitted from PPL.
The Government has also invested $2.1 billion to replace the Education Tax Refund
(ETR) with the Schoolkids Bonus of $410 per year for primary school students and
$820 per year for secondary school students. The Schoolkids Bonus is paid directly to
all eligible FTB-A families as an automatic payment rather than a tax refund, providing
more flexible and timely assistance.
From 1 January 2012, the Government also increased FTB-A for dependent teenagers
in full-time secondary school by up to $4,208 a year for 16 and 17-year olds, and up to
$3,741 a year for 18 and 19-year olds, recognising the higher costs of older children and
helping families to support their teenagers to stay in school.
Since 2008, the Australian Government has invested $31 billion to make housing more
affordable and assist people to move out of homelessness, the largest single investment
in housing and homelessness in Australian history. As part of this, the Government
has directly contributed to the construction of one in every 20 new homes since 2008,
through programs such as the Social Housing Initiative, the Housing Affordability
Fund, the Building Better Regional Cities program, and the National Rental
Affordability Scheme.
Australians value a fair society that rewards hard work and provides opportunity for
all Australians. The Government has taken steps to increase the reward for effort and
encourage workforce participation through successive rounds of tax cuts.
From 1 July 2012, the tax free threshold has more than tripled from $6,000 to $18,200,
the largest increase in Australia’s history. Together with the Low Income Tax Offset,
this reform has increased the effective tax free threshold to $20,542 which means
people with annual taxable income below this threshold will no longer pay any tax or
Medicare Levy on that income. As a result, tax time will be made simpler, with up to
one million taxpayers no longer needing to lodge a tax return.
All taxpayers with incomes up to $80,000 received a tax cut in 2012-13, with around
60 per cent of taxpayers getting a tax cut of at least $300. Many part-time workers,
including many women, will receive a tax cut of up to $600, further encouraging
workforce participation. These tax cuts build on the three previous rounds of tax cuts
delivered by the Government since 2008, worth $47 billion, which have benefitted all
Australian taxpayers.
16
Economic Statement
REFORMS TO RETIREMENT INCOMES
Australians are living longer and they need to feel that the retirement incomes system
is fair and sustainable. Since 2007, the Government has undertaken important reforms
to ensure that all Australians can enjoy a dignified and assured retirement.
The Government’s 2009 Secure and Sustainable Pension Reforms provided the largest
single increase in the age pension in its 100-year history and improved indexation
arrangements for the base pension to better reflect changes in pensioners’ living costs.
We also need to do more to lift private retirement savings. In the long term, the most
significant reform is the gradual increase in the Superannuation Guarantee (SG) rate
from 9 per cent of wages in 2012-13 to 12 per cent of wages in 2019-20. This will boost
the retirement savings of an estimated 8.6 million Australians.
In addition, the Government has acted to boost the superannuation savings of
3.6 million workers who earn up to $37,000, by cutting the contributions tax on SG
contribution from 15 per cent to zero and placing the money into their superannuation
accounts. This measure commenced on 1 July 2012 and the first of these payments will
be made in the next few months. The reform will benefit 3.6 million workers, including
sales assistants, cleaners, electricians and child care workers.
To ensure that members who do not choose a particular fund have a simple, low-cost
default superannuation option, the Government has introduced MySuper products,
which authorised funds have been able to offer from 1 July 2013. Other measures will
help older workers continue to save for their retirement by increasing the cap on
concessional contributions for older Australians, making excess contributions tax fairer
and removing the maximum age limit on receiving the Superannuation Guarantee.
These long-term reforms will ensure that the superannuation system continues to
support Australians’ retirement incomes as our population ages.
The Government has announced it will establish a Super Council to ensure any future
changes to superannuation are consistent with an agreed Charter of Superannuation
Adequacy and Sustainability. The Charter will be legislated and include a commitment
to a five year moratorium on changes to superannuation tax policy.
Avoiding the economic costs of climate change
A LOWER CARBON PRICE
The Government will bring forward the start date of emissions trading by one year to
1 July 2014. Based on current forecasts, this will result in a lower carbon price of
around $6 in 2014-15, compared to $25.40 under the original fixed price arrangements,
due to the link with the European Union Emissions Trading Scheme. It is estimated
17
Economic Statement
that this will reduce the growth in overall consumer prices by around ½ of
a percentage point through the year to June 2015.
A lower carbon price of around $6 will result in reduced costs to households and
businesses through lower electricity, gas and other prices. It would be expected to
reduce average household expenditure by around $3 a week, or over $150 in a year, on
electricity bills, and around $1.10 per week, or $57 over the year, on gas bills. In total,
Australian households will see their costs fall by around $380 next financial year, on
average.
Businesses and the economy will also benefit from a lower carbon price, while still
allowing Australia to transform the economy away from carbon-intensive energy and
meet internationally agreed emission reduction targets. This is because under
emissions trading, net carbon pollution is capped. The annual pollution cap will
continue to be set in light of the advice of the independent Climate Change Authority.
An internationally-linked emission trading scheme means Australia will be part of an
international solution to the global problem of climate change. Australian businesses
will be able to take advantage of low cost international abatement and Australia will
share the same carbon price as some of our most important trading partners.
MURRAY-DARLING BASIN PLAN
The Government is committed to a better approach to balancing the water needs of
communities, farmers and the environment.
Since 2007, the Australian Government has delivered a plan to restore the
Murray-Darling Basin’s rivers and wetlands while supporting strong regional
communities and sustainable food production.
To support the implementation of the Murray-Darling Basin Plan, the Government
provided $3.5 billion in the 2013-14 Budget to improve the environmental outcomes of
the Basin Plan, improve the efficiency of the Commonwealth’s water holdings, and
support further research and community engagement in the Basin.
The Government is also investing in a South Australian River Murray Sustainability
Program, which will further South Australia’s contribution to a healthy working
Murray-Darling Basin through investments in water efficiency and improvements in
the productivity of the South Australian River Murray irrigation industry.
Advancing our National Security interests
Since the 2009 National Security Statement, the Government has focussed on building
a cohesive approach to national security, as epitomised in the 2013 National Security
18
Economic Statement
Strategy. The Government has released a series of documents, including the Defence
White Paper 2013, the 2011 Independent Review of the Intelligence Community and
the Cyber Security Strategy (2009), and has strengthened legal frameworks and powers
to ensure enforcement agencies have the appropriate tools to fight terrorism and
combat organised crime.
The Government has also ensured that Defence is adequately resourced, providing
more than $100 billion across the forward estimates for Defence in recent Budgets, and
ensuring new capabilities such as the new Growler electronic warfare aircraft
announced in the 2013-14 Budget.
While the Australian Defence Force’s (ADF) mentoring role in Afghanistan will come
to an end in 2013, the Government has confirmed Australia’s continuing commitment
to Afghanistan, with the ADF focussed on a training role at the Afghan National Army
Officer Academy, and through civilian efforts on development and capacity building.
The Government has also acted to address people smuggling in our region, and to
prevent further deaths on our seas. The Government is implementing the Regional
Resettlement Arrangement with Papua New Guinea to remove the incentive for
people to risk their lives on dangerous boat journeys to Australia.
19
ECONOMIC OUTLOOK
Australia’s economic fundamentals are strong and the outlook remains positive, with
solid growth, moderate unemployment and contained inflation. The Australian
economy is in a strong position to withstand any further global volatility and is
expected to continue outperforming most of the developed world over the forecast
period. The transition is underway from the resources investment boom towards the
non-resources sectors and the economy is well positioned to manage this transition.
While prospects remain favourable, the challenges of transitioning away from the
resources mining investment boom towards broader based growth are clear. Forecast
real GDP growth in both 2012-13 and 2013-14 has been lowered by ¼ of a percentage
point since Budget. As the transition unfolds, the unemployment rate is expected to
reach 6¼ per cent by mid-2014 and then stabilise at that level in 2014-15 as growth
returns to around trend. There have also been significant changes to forecast nominal
GDP growth. Significant revisions to the terms of trade on the back of weaker Chinese
growth, and lower forecast wage growth, have weighed heavily on nominal GDP and
the fiscal position.
In recent years, strong economic outcomes have been supported by a record surge in
resources investment, as businesses responded to high commodity prices driven by
strong growth in China and other emerging market economies. However, with
investment in iron ore and coal projects likely to have already peaked, future resources
investment will be underpinned by LNG projects already under construction.
While the level of investment is expected to remain at historically elevated levels over
the forecast period, managing the passing of the resources investment peak is the key
near-term economic challenge facing Australia. The record surge in investment has
more than doubled the resource capital stock over the past decade, and this will
support strong growth in non-rural commodity exports for years to come.
The resources sector will therefore continue to make an important contribution to
growth as it transitions to the production and exports phase. Nevertheless, higher
exports are not expected to be sufficient to fully offset the impact on growth of the
decline in resources investment. A rebalancing of economic growth towards
non-resources sectors is needed to fill the gap.
Low interest rates will support this transition, and there are signs that housing
construction is responding to supportive monetary policy. The recent fall in the
Australian dollar should also help, by increasing the competitiveness of Australian
goods and services at home and abroad. However, recent softness in household
consumption and business confidence have been weighing on growth.
The Australian real economy is expected to grow a little below trend as the transition
unfolds, with real GDP expected to increase by 2½ per cent in 2013-14, rising to
3 per cent in 2014-15 (Chart 1). Compared with Budget, forecast growth has been
21
Economic Statement
revised lower by ¼ of a percentage point in both 2012-13 and 2013-14, with weaker
household consumption and business investment only partly offset by lower import
growth and stronger non-commodity exports owing to the lower Australian dollar.
Chart 1: Real GDP growth over the forward estimates
6
5
Per cent
Per cent
Forw ard
estimates
30-year average
6
5
4
4
3
3
2
2
1
1
0
0
-1
1986-87
1991-92
1996-97
Source: ABS cat. no. 5206.0, Treasury.
2001-02
2006-07
2011-12
-1
2016-17
The outlook for world growth in 2013 has weakened since Budget, with a larger
economic contraction and slower recovery now likely in the euro area and more
moderate growth expected in emerging Asia, most notably in China and India.
Looking forward, the Australian economy is expected to be supported by
strengthening global economic growth over the forecast period, as the United States’
economy continues to recover, conditions in Europe begin to improve and growth in
emerging Asia remains solid. The global economy is now expected to grow by
3 per cent in 2013, recovering to 3¾ per cent in 2014 and 4 per cent in 2015 (Table 3).
22
Economic Statement
Table 3: International GDP growth forecasts
(a)
Forecasts
Actuals
2012
2013
2014
2015
7 1/4
China (b)
7.8
7 1/2
7 1/2
5
India(b)
3.8
6 1/2
6 1/2
1 3/4
Japan
1.9
1
1
1 1/2
United States
2.8
2 1/2
2 1/2
- 3/4
Euro area
-0.6
3/4
1 1/4
3 3/4
Other East Asia(c)
3.9
4 3/4
5
4
Major trading partners
4.1
4 1/2
4 3/4
3
World
3.3
3 3/4
4
(a) World, euro area, and other East Asia growth rates are calculated using GDP weights based on
purchasing power parity (PPP), while growth rates for major trading partners are calculated using export
weights.
(b) Production-based measure of GDP.
(c) Other East Asia comprises the Newly Industrialised Economies (NIEs) of Hong Kong, South Korea,
Singapore and Taiwan and the Association of Southeast Asian Nations group of five (ASEAN-5), which
comprises Indonesia, Malaysia, the Philippines, Thailand and Vietnam.
Source: National statistical publications, Thomson Reuters and Treasury.
More moderate growth is now expected for China, with authorities’ actions to address
financial market risks and promote more sustainable growth expected to result in less
accommodative credit conditions than assumed at Budget (Box 1). Concerns around
the outlook for economic growth in China have contributed to significant falls in world
commodity prices including for Australia’s key commodity exports (Chart 2).
Box 1: China in transition
The more moderate growth outlook
for China reflects an expectation that
recent policy actions to address
growing risks in China’s financial
system will mean a less supportive
credit environment than assumed at
Budget. While contributing to a more
stable and efficient financial system,
and hence more sustainable mediumto longer-term growth, tighter credit
conditions are likely to weigh on
China’s economic activity in the near
term.
The more moderate growth forecast for
2013 also reflects weaker than
anticipated demand for Chinese
exports, especially from advanced
economies. Still, China’s medium term
growth potential remains strong, with
growing
signs
that
the
new
government will make the necessary
structural reforms to secure this
potential. Supported by a modest
pick-up in China’s exports to advanced
economies, solid growth in China is
forecast to underpin strengthening
growth among Australia’s major
trading partners in 2014 and 2015.
23
Economic Statement
Box 1: China in transition (continued)
Concerns around the outlook for
economic growth in China have
contributed to significant falls in world
commodity prices. The changing
composition of growth in China is also
expected to place downward pressure
on commodity prices, with planned
structural reforms to support China’s
longer term growth prospects expected
to encourage a move away from
investment led growth, and contribute
to a less resource intensive pattern of
activity in coming years.
While iron ore and other bulk
commodity prices have been volatile,
recent developments have prompted a
reassessment of the level commodity
prices will reach at the end of the
forecast period. A softer outlook for
Chinese economic growth, increased
supply and lower global costs of
production have lowered the expected
profile of prices for key commodities in
US dollars, but the implications for
export earnings are partly offset by the
lower Australian dollar.
Chart 2: Bulk non-rural commodity prices
(average unit export prices)
160
140
A$/tonne
Iron ore
A$/tonne
Metallurgical
350
coal (LHS)
A$/tonne
160
(f)
140
400
A$/tonne
200
(f)
175
120
300
100
100
250
80
80
200
60
60
150
40
40
100
50
20
20
50
25
120
150
125
Thermal
coal (RHS)
100
75
0
0
0
0
Jun-00
Jun-05
Jun-10
Jun-15
Jun-00
Jun-05
Jun-10
Jun-15
Source: Based on ABS data and Treasury. Export prices differ from the more-widely quoted spot prices.
Export prices reflect the actual price foreigners pay for our exports and reflect the quality of the resource
being provided (such as the iron ore content), long-term contracts, and exchange rate movements.
The terms of trade are expected to fall 5¾ per cent in 2013-14 and 3¾ per cent in
2014-15 after declining 10½ per cent in 2012-13 (Chart 3). The significant revisions to
the terms of trade, along with a weaker outlook for wage growth, have led to a
substantial downward revision to forecast nominal GDP growth. Wage growth has
slowed over the past year, as businesses have adjusted to the ongoing impact of the
elevated Australian dollar and other competitive pressures by containing wages and
other costs.
Nominal GDP is forecast to grow by 3¾ per cent in 2013-14 and 4½ per cent in 2014-15,
significantly weaker than at Budget. The implications of this for expected revenue, and
the budget bottom line, are discussed in the Fiscal Outlook Part.
24
Economic Statement
Chart 3: Terms of trade
120
Index (2010-11 = 100)
Index (2010-11 = 100)
120
(f)
100
100
80
80
60
60
40
Jun-1965
Jun-1975
Jun-1985
Source: ABS cat. no. 5206.0 and Treasury.
Jun-1995
Jun-2005
40
Jun-2015
The labour market is expected to remain resilient with slower wage growth, an
important mechanism for supporting employment growth in the rest of the economy
as the relatively employment-intensive resources construction phase passes its peak.
Nevertheless, the unemployment rate is now expected to reach 6¼ per cent by
mid-2014, owing to lower forecast real GDP growth and the current rate of
unemployment being a little higher than expected. The unemployment rate is expected
to stabilise at that level in 2014-15 but remain one of the lowest in the developed
world, with many countries still feeling the effects of the global financial crisis
(Chart 4).
Chart 4: Unemployment rates
14
Per cent
Per cent
12
14
12
euro area
10
8
10
US
Canada
6
Australia
4
Japan
2
Dec-07
Oct-09
Source: Thomson Reuters, ABS cat. no. 6202.0.
Aug-11
25
8
6
4
2
Jun-13
Economic Statement
Inflation is expected to remain contained within the RBA’s target band. Headline
inflation is forecast to be 2½ per cent through the year to the June quarter 2014, slightly
stronger than at Budget, reflecting the effect of higher import prices from the lower
Australian dollar. Headline inflation is then expected to ease to 2 per cent through the
year to the June quarter 2015 owing to the lower forecast carbon price. Underlying
inflation is expected to be 2½ per cent through the year to the June quarter of 2014 and
2¼ per cent through the year to the June quarter of 2015. 1
The global environment continues to pose significant risks to the outlook, and
domestic risks have also become more pronounced since Budget. Internationally, the
crisis in the euro area remains unresolved and constitutes the key risk to the global
recovery. Elsewhere, the United States will need to face the eventual challenge of
unwinding unconventional monetary policy, while uncertainty exists in Japan over
whether the authorities will successfully rid Japan of deflation and sustain the
economic recovery.
More importantly for Australia, it is still unclear how successful recent actions by
Chinese authorities will be in addressing the build-up of risks in China’s financial
sector that have accumulated in recent years. Moreover, in taking steps to address
these risks, there is a danger that a policy misstep could lead to more extensive,
unintended financial market disruptions.
Domestically, the transmission of volatility abroad to commodity prices presents a
considerable risk to nominal GDP. In addition, the decline in resources investment
following its peak could be more pronounced than expected, and the transition to new
drivers of growth may be less than seamless. It is also possible for weak income
growth to weigh more heavily on domestic demand than currently expected. That
said, Australia confronts these challenges with some of the strongest economic
fundamentals in the developed world and is well placed to manage the transition.
1
The move to a floating carbon price in 2014-15 is expected to lower headline inflation by
around ½ of a percentage point and underlying inflation by less than ¼ of a percentage point
through the year to the June quarter 2015. The staged increases in tobacco excise (see Fiscal
Outlook chapter) are expected to raise headline inflation by less than ¼ of a percentage point
through the year to both the June quarter 2014 and 2015, and leave underlying inflation
unchanged.
26
Economic Statement
DETAIL OF SECTORAL FORECASTS FOR THE AUSTRALIAN ECONOMY
Table 4: Domestic economy forecasts
(a)
Estimate
2012-13
2013-14
Forecasts
2014-15
Budget
ES (b)
Panel A - Demand and output(c)
Household consumption
2 1/2
2 1/2
3
2 1/2
3
3
Private investment
Dwellings
Total business investment(d)
Non-dwelling construction(d)
Machinery and equipment(d)
Private final demand(d)
Public final demand(d)
Total final demand
Change in inventories(e)
Gross national expenditure
Exports of goods and services
Imports of goods and services
Net exports(e)
Gross domestic product
Non-farm product
Farm product
Nominal gross domestic product
1/2
10 1/2
18 1/2
1 1/2
4
- 1/2
3
0
3
7
5
1/2
3
3
-8
3 1/4
1 1/2
6 1/2
14 1/2
-2 1/2
3 1/2
-1 1/2
2 1/4
- 1/4
2
7
0
1 1/2
2 3/4
3
-6
2 1/2
5
4 1/2
5
2 1/2
3 1/2
0
2 3/4
0
2 3/4
6 1/2
6
0
2 3/4
2 3/4
4
5
5
1 1/2
1
1/2
2 1/4
3/4
2
0
2
6 1/2
4
1/2
2 1/2
2 1/2
4
3 3/4
5 1/2
1
-2 1/2
5
2 3/4
1/2
2 1/4
0
2 1/4
7
3
1
3
3 1/4
0
5
5 1/2
- 1/2
-4 1/2
3
2 1/2
1
2
0
2
7
3
1
3
3
1
4 1/2
-7 1/2
-3 1/2
-10 1/2
-3
- 3/4
-3 3/4
-5 3/4
-3 3/4
-1 3/4
-3 1/4
-3 3/4
-3 3/4
1 1/4
5 1/2
65
1.3
5.6
65.3
1 1/4
5 3/4
65
1
6 1/4
65 1/4
1 1/2
5 3/4
65
1 1/2
6 1/4
65 1/4
2 1/2
0
3 1/2
2.4
- 1/2
3 1/4
2 1/4
2
3 1/2
2 1/2
1 1/4
3 1/4
2 1/4
1 3/4
3 1/2
2
1 1/4
3 1/4
Panel B - Other selected economic measures
External accounts
Terms of trade
Current account balance (per cent of GDP)
Labour market
Employment (labour force survey basis)(f)
Unemployment rate (per cent)(g)
Participation rate (per cent)(g)
Prices and wages
Consumer Price Index (h)
Gross non-farm product deflator
Wage Price Index(f)
Budget
ES
Budget
ES
(a) Percentage change on preceding year unless otherwise indicated.
(b) Employment growth, the unemployment rate, the participation rate and the consumer price index are
ABS outcomes.
(c) Chain volume measures except for nominal gross domestic product, which is in current prices.
(d) Excluding second-hand asset sales from the public sector to the private sector.
(e) Percentage point contribution to growth in GDP.
(f) Seasonally adjusted, through the year growth rate to the June quarter.
(g) Seasonally adjusted, estimate for the June quarter.
(h) Through the year growth rate to the June quarter.
Note: The domestic economy forecasts are based on several technical assumptions. The exchange rate is
assumed to remain around its recent average level — a trade weighted index of 71 and a United States
dollar exchange rate of around 92 US cents. Interest rates are assumed to move broadly in line with market
expectations. Oil prices (Malaysian Tapis) are assumed to remain around US$114 per barrel. The farm
sector forecasts are based on an assumption of average seasonal conditions.
Source: ABS cat. nos. 5206.0, 5302.0, 6202.0, 6345.0, 6401.0, unpublished ABS data and Treasury.
27
FISCAL OUTLOOK
The Government has continued to implement sound fiscal policy. In the face of lower
terms of trade, lower expected nominal GDP, and further write-downs in tax receipts,
the Government remains committed to supporting jobs and growth in the short term
while keeping the budget on track to return to a surplus of $4.0 billion in 2016-17.
The Government’s medium-term fiscal strategy guided Australia’s successful response
to the global financial crisis and provides the basis for the Government’s determination
to strike the right balance between supporting the economy in transition and the
return to surplus.
Consistent with this strategy, the Government delivered its fiscal stimulus at the height
of the global financial crisis and committed to return to surplus as the economy
recovered. This stimulus prevented a recession in Australia and saved up to 210,000
jobs. In the current situation, short term support for the economy while remaining on
track to return to surplus over the forward estimates is the appropriate fiscal policy
response given Australia’s current economic outlook.
G20 Finance Ministers and Central Bank Governors recently affirmed jobs and growth
as global priorities in the current economic circumstances. These are priorities for the
Government, and have influenced the rate of fiscal consolidation reflected in this
Economic Statement. The meeting also agreed on the importance of governments
adopting a credible fiscal strategy that is flexible to economic circumstances. This
approach to fiscal strategy has guided the Government. It is supported by the
international consensus among groups such as the G20 and IMF that fiscal
consolidation is important, but it should be carefully managed to suit economic
conditions.
Since the Budget, lower terms of trade and weaker than expected wages growth — and
hence weaker nominal GDP growth — have led to further write downs in tax receipts.
Lower wages growth has resulted in downward revisions to individuals’ income tax
receipts. Falling commodity prices have resulted in a weakened outlook for company
tax and the minerals resource rent tax. Capital gains tax receipts are also expected to be
weaker.
With the unemployment rate expected to be higher in 2013-14 and 2014-15, the
Government has exercised restraint in a way that does not put Australia’s growth and
employment at risk by making drastic cuts in the near term. The majority of the
revenue write-downs have been passed through to the budget bottom line to support
growth in the short term. Almost all of the deterioration in the budget balance in
2013-14 and 2014-15 reflects variations in receipts and payments rather than
Government decisions.
29
Economic Statement
This approach is consistent with the Government’s fiscal strategy, and the Government
has found the savings necessary to put the budget on track to surplus by 2016-17. To
ensure that unemployment remains relatively low, that households and businesses are
not hurt by excessive cuts to spending and services, and that the transition away from
the mining investment boom is as smooth as possible, it would not be prudent to offset
the entire fall in revenues since the Budget in the near term.
The Government is still on track to return to surplus at the end of the forward
estimates. Since the Budget, the Government has made $17.4 billion of responsible
savings decisions, which have made a significant contribution to offsetting the impact
of revenue write-downs in 2015-16 and 2016-17 (Table 5). This return to surplus is
achieved with lower terms of trade, which means that, compared to the Budget, the
structural position of the budget has been improved at the end of the forward
estimates.
Table 5: Effect of spending and savings decisions since the 2013-14 Budget
Estimates
2012-13 2013-14 2014-15
$m
$m
$m
Projections
2015-16 2016-17
$m
$m
(a)
Total
$m
Effect of policy decisions since Budget
Spends
Saves
Total effect of policy decisions
since Budget
Add Contingency Reserve
offsets to policy decisions
Net budget impact of policy decisions
(a) On an underlying cash basis.
-90
-1,370
-4,518
-2,446
-823
-9,247
7
998
2,910
5,810
7,633
17,357
-84
-373
-1,607
3,364
6,811
8,111
0
23
23
23
23
92
-84
-349
-1,584
3,387
6,834
8,203
Australia is on track to return to surplus years ahead of most other advanced
economies (Chart 5).
30
Economic Statement
Chart 5: Budget balances of Australia and the G7, 2013-2016
2
Percent
centofofGDP
GDP
Per
Per cent
GDP
Per of
cent
of GDP
2
0
0
-2
-2
-4
-4
-6
-6
-8
-8
-10
-10
-12
-12
Australia
euro area
Japan
US
UK
Note: Australian data are for the Australian Government general government sector underlying cash balance
and refer to financial years beginning 2013-14. Data for all other economies are total government and refer
to calendar years beginning 2013.
Source: IMF Fiscal Monitor April 2013 and Treasury.
Australia is one of only eight sovereigns globally to be rated AAA with a stable
outlook by all the major credit rating agencies. This is a ringing endorsement of the
Government’s fiscal strategy as it has been implemented in recent years, the strength
of Australia’s fiscal position and the resilience of the Australian economy.
31
Economic Statement
VARIATIONS AND DECISIONS SINCE THE 2013-14 BUDGET
Table 6 provides a reconciliation of the variations in the underlying cash balance
estimates since the Budget.
Table 6: Reconciliation of the 2013-14 Budget and Economic Statement
underlying cash balance estimates
Estimates
2013-14 2014-15
$m
$m
-10,888
-18,043
-1.1
-0.6
2013-14 Budget underlying cash balance(a)
Per cent of GDP
Changes from 2013-14 Budget to ES
Effect of policy decisions(b)(c)
Receipts
Payments
Total policy decisions impact on underlying cash balance
Effect of parameter and other variations(c)
Receipts
Payments
Total parameter and other variations impact on
underlying cash balance
Projections
2015-16 2016-17
$m
$m
6,591
849
0.0
0.4
1,067
1,440
-373
-1,492
116
-1,607
1,813
-1,551
3,364
5,412
-1,398
6,811
-7,805
3,922
-9,571
1,905
-7,533
1,388
-8,408
966
-11,727
-11,477
-8,921
-9,374
-4,708
4,027
ES underlying cash balance(a)
-30,142
-23,972
0.2
-0.3
Per cent of GDP
-1.9
-1.5
(a) Excludes expected Future Fund earnings.
(b) Excludes secondary impacts on public debt interest of policy decisions and offsets from the contingency
reserve for decisions taken.
(c) A positive number for receipts indicates an increase in the underlying cash balance, while a positive
number for payments indicates a decrease in the underlying cash balance.
Changes to receipts since the Budget
Since the Budget, parameter and other variations have resulted in a $33.3 billion write
down in receipts over the forward estimates. Tax receipts (including GST) have been
revised down by $7.8 billion in 2013-14, and $33.3 billion over the four years from
2013-14.
Although a well-performing real economy is fundamental to jobs and economic
growth, it is the nominal economy that matters for government tax receipts and the
Government’s fiscal position.
Since the Budget, lower terms of trade have resulted in estimates of nominal GDP
growth being revised down from 5 per cent to 3¾ per cent in 2013-14 and from
5 per cent to 4½ per cent in 2014-15.
Lower wages growth and unincorporated business income since the 2013-14 Budget
has resulted in weaker individuals’ income tax receipts. Compared to Budget, total
individuals’ income tax receipts are expected to be $18.1 billion lower over the four
years to 2016-17.
32
Economic Statement
Faster than expected falls in commodity prices have resulted in a weaker outlook for
company tax, with company tax receipts expected to be $9.7 billion lower over the four
years to 2016-17 compared to Budget. Resource rent taxes are now expected to be
$560 million lower over the four years to 2016-17 compared to the Budget.
Capital gains tax has been revised down by around $1.5 billion over the forward
estimates due to lower than expected share prices as well as a downgrade in our
growth assumption for asset prices (in line with the fall in nominal GDP growth).
Policy decisions since the 2013-14 Budget are expected to increase receipts by
$1.1 billion in 2013-14, by $1.8 billion in 2015-16 and $5.4 billion in 2016-17. Policy
decisions reduce receipts by $1.5 billion in 2014-15, driven by the move to bring
forward the start date of the carbon emissions trading scheme by one year.
Policy decisions expected to increase receipts include:
•
Consistent with the Government’s anti-smoking strategies, excise and
excise-equivalent customs duty on tobacco and tobacco-related products will be
increased under a staged process, with a 12.5 per cent increase to occur on
1 December 2013 and further 12.5 per cent increases on 1 September 2014,
1 September 2015 and 1 September 2016. These increases are in addition to the
increases in the duty that occur under indexation arrangements and are expected to
increase tax receipts by $5.8 billion over the forward estimates period (including
payments to the states and territories of $490 million).
•
The Government will make the tax system fairer by ensuring the fringe benefits tax
exemption for cars is targeted to actual business use rather than including personal
use. The reform will apply to all new commitments for car fringe benefits entered
into after 16 July 2013 and will take effect from 1 April 2014, after which only the
operating cost method will be allowed. This measure, announced on 16 July 2013, is
expected to provide net savings of $1.8 billion over the forward estimates.
•
The Government is also providing the ATO with an additional $99 million over
four years to address the levels of unpaid tax and superannuation in the
community. This measure will return $45 million in superannuation to Australian
workers and ensure a level playing field for Australian businesses. This measure is
expected to improve the underlying cash balance by $827 million over the forward
estimates.
•
The Government will progress a recommendation from the Council of Financial
Regulators, which includes the Reserve Bank of Australia and the Australian
Prudential Regulation Authority, to establish a dedicated Financial Stability Fund
to help meet any future cost of the Financial Claims Scheme (FCS), as well as the
cost of other resolution activities that protect depositors. The dedicated Fund will
build gradually over time to a target size of 0.5 per cent of total deposits protected
33
Economic Statement
by the FCS. Establishing the Fund is expected to have a net positive impact on the
budget of $733 million over the forward estimates, from 1 January 2016.
•
The threshold below which small inactive superannuation accounts, including
inactive accounts of uncontactable members, are required to be transferred to the
Australian Taxation Office will be increased to protect the real value of more lost
superannuation accounts. The threshold will increase from $2,000 to $4,000 from
31 December 2015, and then to $6,000 from 31 December 2016. This measure is
estimated to have a net positive impact on the budget in underlying cash balance
terms of $582 million over the forward estimates.
There are also a small number of policy measures since the 2013-14 Budget that reduce
receipts:
•
The Government’s decision to terminate the fixed carbon price and bring forward
the start date of emissions trading by one year to 1 July 2014 has a net cost to the
budget of approximately $3.8 billion over the forward estimates, in underlying cash
balance terms. This cost has been more than offset by savings measures (see Box 1
on page 38 below).
•
The Government has decided to defer the introduction of the $2,000 cap on work
related education expense deductions until 1 July 2015. This will allow for further
consultation on how best to target excessive claims while ensuring the impact on
university enrolments and genuine continuing professional development is
minimised. This measure is expected to decrease receipts by $250 million over the
forward estimates period.
34
Economic Statement
Table 7 shows cash receipts by type of revenue.
Table 7: Australian Government general government (cash) receipts
Individuals' and other withholding taxes
Gross income tax withholding
Gross other individuals
less: Refunds
Total individuals' and other withholding tax
Fringe benefits tax
Company tax
Superannuation funds
Minerals resource rent tax(a)
Petroleum resource rent tax
Income taxation receipts
Goods and services tax
Wine equalisation tax
Luxury car tax
Excise and customs duty
Petrol
Diesel
Other fuel products
Tobacco
Beer
Spirits
Other alcoholic beverages(b)
Other customs duty
Textiles, clothing and footwear
Passenger motor vehicles
Other imports
less: Refunds and drawbacks
Total excise and customs duty receipts
Carbon pricing mechanism
Agricultural levies
Other taxes
Indirect taxation receipts
Taxation receipts
Sales of goods and services
Interest received
Dividends
Other non-taxation receipts
Non-taxation receipts
Estimates
2013-14 2014-15
$m
$m
Projections
2015-16 2016-17
$m
$m
160,600 174,000
33,700 37,000
27,500 28,300
166,800 182,700
4,160
4,580
69,250 70,150
7,620
9,090
800
1,000
2,390
2,440
251,020 269,960
188,300 201,100
41,400 45,750
30,100 31,400
199,600 215,450
4,840
5,120
75,900 80,100
11,600 13,090
1,400
2,300
2,670
2,550
295,890 318,730
50,633
760
380
53,559
810
350
56,739
850
380
59,909
900
400
5,850
8,980
3,800
8,330
2,390
2,040
1,010
5,750
9,180
3,620
9,120
2,420
2,170
1,060
5,850
9,370
3,690
10,070
2,570
2,310
1,120
5,950
9,680
3,750
10,950
2,730
2,430
1,180
720
920
1,600
260
35,380
6,435
461
2,971
97,020
570
980
1,670
260
36,280
2,805
451
3,135
97,391
410
440
1,140
1,060
1,790
1,930
260
260
37,980 39,920
2,675
3,995
458
464
3,500
3,618
102,581 109,206
348,040 367,351
398,471 427,936
8,686
3,768
2,706
6,164
21,325
8,519
3,676
2,444
8,170
22,809
8,691
4,123
2,690
9,312
24,817
8,852
4,338
2,729
6,882
22,800
Total receipts
369,364 390,160 423,288 450,736
Memorandum:
Total excise receipts
26,530 27,050
28,260 29,490
9,230
9,720 10,430
Total customs duty receipts
8,850
Capital gains tax(c)
7,900 10,700
13,200 15,400
Medicare and DisabilityCare Australia levy receipts
9,960 10,470
14,480 15,190
(a) Net receipts from the MRRT are expected to be $0.6 billion in 2013-14, $0.7 billion in 2014-15,
$1.0 billion in 2015-16 and $1.7 billion in 2016-17 which represent the net receipt impact across different
revenue heads. These include offsetting reductions in company tax (through deductibility) and
interactions with other taxes.
(b) Other alcoholic beverages are those not exceeding 10 per cent by volume of alcohol (excluding beer,
brandy and wine).
(c) Capital gains tax is part of other individuals, companies and superannuation funds tax.
35
Economic Statement
Since the 2013-14 Budget, non-tax receipts have increased by $185 million in 2013-14,
largely reflecting higher royalties from changes in forecast prices for crude oil and
condensate; increased net receipts from unclaimed superannuation monies; and
increases to the heavy vehicle road user charge and Visa Application Charge.
Appendix B provides a list of all policy decisions taken since the Budget.
Changes to payments since Budget
Since the Budget, total cash payments in 2013-14 have increased by $5.3 billion
comprised of new policy decisions, which have increased payments by $1.4 billion,
and parameter and other variations, which have increased payments by $3.9 billion.
Major increases in expected payments as a result of parameter and other variations
since the Budget include:
•
Research and Development Tax Incentive payments, which are expected to be
$304 million higher in 2013-14 ($1.2 billion over four years to 2016-17), reflecting
strong claims in the first year of operation of the 45 per cent refundable tax offset
for companies with a turnover of less than $20 million. It is expected that the higher
level of claims will continue across the forward estimates;
•
offshore asylum seeker management costs, which are expected to be $351 million
higher in 2013-14 ($1.3 billion over four years to 2016-17), reflecting updated actual
and projected unauthorised maritime arrivals and the cost of regional processing
centres;
•
Private Health Insurance rebate payments, which are expected to increase by
$184 million in 2013-14 ($769 million over the four years to 2016-17) reflecting
higher take-up rates;
•
child care costs, which are expected to be $104 million higher in 2013-14
($512 million over the four years to 2016-17), reflecting an increase in the number of
children expected to use child care;
•
Tertiary Student Assistance payments for Youth Allowance and Austudy, which
are expected to be $120 million higher in 2013-14 ($475 million over the four years
to 2016-17), reflecting a higher than expected number of recipients and higher than
expected average payment rates;
•
payments of Family Tax Benefits (FTB) and the Schoolkids Bonus, which are
expected to be $93 million higher in 2013-14 ($392 million over the four years to
2016-17), largely reflecting higher than previously projected numbers of eligible
children for FTB Part A and Part B and the Schoolkids Bonus; and
36
Economic Statement
•
payments under the Natural Disaster Relief and Recovery Arrangements (NDRRA),
which are expected to be $284 million higher in 2013-14, reflecting changes in the
timing of payments for the NDRRA provision, particularly payments for
New South Wales.
Major reductions in expected payments as a result of parameter and other variations
since the Budget, include:
•
payments under the Pharmaceutical Benefits Scheme (PBS), which are expected to
be $388 million lower in 2013-14 ($2.0 billion over the four years to 2016-17), largely
reflecting higher than expected savings from existing pricing policy;
•
increased payments to Defence in 2013-14 and 2014-15 of $359 million and
$304 million respectively with an associated reduction in funding of $89 million and
$1.0 billion in 2015-16 and 2016-17 respectively and with an increase in Defence’s
six-year funding guidance beyond the forward estimates of $426 million in 2017-18
to better match expected capital acquisitions, support the purchase of important
Defence capabilities and accelerate investment in critical supporting capabilities
and facilities;
•
Income Support for Seniors, which is expected to be $132 million lower in 2013-14
($593 million over the four years to 2016-17), reflecting lower than projected
recipient numbers; and
•
Disability Support Pension payments, while expected to be $41 million higher in
2013-14, will be $457 million lower over the four years to 2016-17, resulting from a
continued fall in take-up rates following the introduction of the new impairment
tables on 1 January 2012.
Since the Budget, policy decisions have decreased the underlying cash balance by
$373 million in 2013-14 but increased the underlying cash balance by $8.2 billion over
the four years of the forward estimates.
Major policy decisions that have increased cash payments over the four years to
2016-17 include:
•
the bring forward of the start of the Emissions Trading Scheme (Box 1 below);
•
the Australian and Papua New Guinea Regional Resettlement Arrangement (Box 2
on page 40 below);
•
additional Official Development Assistance to PNG (Box 3 on page 41 below); and
•
new and amended listings on the Pharmaceutical Benefits Scheme and Repatriation
Pharmaceutical Benefits Scheme, which are expected to increase payments by
$276 million in 2013-14 ($1.5 billion over the four years to 2016-17).
37
Economic Statement
The impact of these policy decisions on payments has been more than offset over the
four years to 2016-17 by a number of other decisions that have reduced cash payments,
including:
•
increasing the public service efficiency dividend to 2 ¼ per cent for three years from
1 July 2014, which is expected to decrease payments by $262 million in 2014-15
($1.8 billion over three years from 2014-15 to 2016-17); and
•
slowing the growth rate of Australia’s aid budget whilst still meeting the target of
0.5 per cent of Gross National Income by 2017-18. This measure is expected to
decrease payments by $879 million over the four years to 2016-17. Aid spending
will still increase by around 26 per cent over this period.
Box 1: Budget impacts of bringing forward the start of the Emissions Trading
Scheme (ETS)
The net cost to the budget of bringing forward emissions trading by one year is
approximately $3.8 billion over the forward estimates, in underlying cash balance
terms. This reflects lower receipts from the sale of carbon permits and from the
application of an equivalent carbon price to fuel taxation and synthetic greenhouse
gases, partly offset by lower expenses from the carbon unit buyback facility and a
reduction in expenses across a range of government programs as a result of the
impact of this measure on the consumer price index.
The estimated carbon price in 2014-15 is based on the same methodology used in the
2013-14 Budget. This methodology uses average market futures prices, with
projections of carbon prices for 2015-16 and 2016-17 incorporating the
straightforward approach of a linear transition from market prices in 2014-15 to the
modelled price of $38 in 2019-20. For further information, see Box 9 of Budget
Statement 2 in the 2013-14 Budget.
This cost of bringing forward emissions trading has been more than offset by
$3.9 billion of responsible savings measures, while protecting assistance to
households, the renewable energy sector and emission-intensive trade exposed
industries.
38
Economic Statement
Box 1: Budget impacts of bringing forward the start of the Emissions Trading
Scheme (ETS) (continued)
Savings measures from within the Clean Energy Future Plan (CEF) include:
•
amending the Energy Security Fund by bringing forward the 2015-16 free permit
allocation to 2014-15 and discontinuing the program from 1 July 2015, saving
$770 million;
•
returning unallocated funding from the Biodiversity Fund, saving $213 million;
•
returning unallocated funding from the Carbon Farming Futures program,
saving $143 million;
•
updating the Coal Sector Jobs package allocation in 2014-15, consistent with
lower expected carbon prices, saving $186 million; and
•
rephasing $200 million of funding from the Clean Technology Program and
returning $162 million of unallocated funding to the budget.
Additional savings from outside the CEF Plan involve:
•
rephasing $224 million from the Carbon Capture and Storage program to align
funding with expected expenditure on projects;
•
abolishing the statutory formula method for calculating the taxable value of car
fringe benefits tax for new commitments entered into after 16 July 2013, with
effect from 1 April 2014, saving $1.8 billion; and
•
reforming public service management structures and more efficient procurement
of agency software to generate additional public service efficiencies, saving
$248 million.
These changes were announced on 16 July 2013.
39
Economic Statement
Box 2: Australia and Papua New Guinea Regional Resettlement Arrangement
On 19 July 2013, the Government announced and signed a new arrangement with
Papua New Guinea (PNG) — the Regional Resettlement Arrangement — for
unauthorised maritime arrivals to be sent to PNG for assessment and, if found to be
a refugee, to be settled there.
Major elements include:
•
regional processing centres in PNG — operating costs are dependent on site
configuration and topology, transport and support costs;
•
support for unauthorised maritime arrivals living in community based
arrangements, including ongoing support provided by service providers;
•
assistance to the PNG Government to implement a refugee status determination
process; and
•
support for arrangements to facilitate the voluntary return of unauthorised
maritime arrivals to their country of origin.
The total estimated operating cost of the Arrangement is $175 million in 2013-14,
and $1.1 billion over four years, partially funded from a $423 million reduction in
the operating costs of the onshore detention network (a net impact of $632 million)
over the four years to 2016-17. Capital costs of $194 million are included in 2013-14
to expand Manus Island facilities.
Included in the operating costs is support for unauthorised maritime arrivals living
in community-based arrangements of $13 million in 2013-14 and $236 million over
four years. This has been offset from a reduction in AusAID’s budget. Assistance to
the PNG Government to develop and implement a refugee status determination
process will be funded from the provision for expanded aid funding held in the
contingency reserve.
The remaining costs of this package have been offset from whole-of-government
savings.
The Government will continue to review initiatives to ensure this policy is effective
in sending the message that coming to Australia by boat is not the way to gain
Australian residency.
40
Economic Statement
Box 3: Additional Official Development Assistance (ODA) to PNG
The Government will provide $420 million over four years of additional ODA to
PNG (and additional non-ODA eligible funding of $18 million over four years for
law and order). This is principally comprised of:
•
Health — rebuilding the Lae hospital ($207 million over four years);
•
Education — rehabilitation of the University of PNG ($62 million over four
years);
•
Justice — deployments to the PNG Department of Corrections and the Royal
PNG Constabulary, as well as scoping and design for the Magisterial Services
Court ($19 million over four years);
•
Transport — scoping and design for the Madang-Ramu highway ($0.8 million
over four years); and
•
Law and Order — deployment of 50 Australian Federal Police officers for
advisory and mentoring roles in local police stations ($132 million of ODA).
This is in addition to the existing $500 million per annum aid commitment to PNG
($507 million in 2013-14).
The additional development assistance to PNG will be met from within existing
AusAID resources.
Responsible savings
Since the Budget, the Government has made $17.4 billion of responsible savings
decisions, including changes to the FBT treatment of car fringe benefits, increased
tobacco excise, a recalibration in the rate of growth of ODA expenditure, and an
increase in the public service efficiency dividend.
In this Economic Statement the Government has identified savings of $17.4 billion
across the forward estimates. These savings build on previous saves of over
$180 billion identified by the Government in the six budgets since 2008-09.
The Government’s fiscal strategy includes a strong focus on the medium-term
sustainability of the budget. When making decisions, the Government considers not
only the financial impact on the forward estimates period, but also the longer-term
budgetary and economic effects.
Since its first budget in 2008-09, the Government has made savings decisions that will
continue to improve the budget position well beyond the end of the forward estimates.
These include increasing the pension age to 67, increasing the Medicare Levy and
reforms to the private health insurance rebate and to the family payments system. The
41
Economic Statement
decisions in this Economic Statement build on these earlier decisions to help improve
the structural position of the budget and provide space for significant new priorities.
Without the net impact of new policy decisions since the Budget, there would have
been underlying cash deficits of $29.8 billion in 2013-14, $22.4 billion in 2014-15,
$8.1 billion in 2015-16 and $2.8 billion in 2016-17 (Chart 6).
Chart 6: Underlying cash balance with and without Government decisions
5
$billion
$billion
5
0
0
-5
-5
-10
-10
-15
-15
-20
-20
-25
-25
-30
-30
-35
2013-14
2014-15
2015-16
Underlying cash balance with Government decisions
-35
2016-17
Underlying cash balance without Government decisions
Fiscal balance estimates
The fiscal balance deficit is expected to be $25.6 billion (1.6 per cent of GDP) in 2013-14,
$12.1 billion higher than the $13.5 billion deficit expected at Budget.
Movements in accrual revenue and expenses over the forward estimates are broadly
similar to the movements in cash receipts and payments. More detailed information on
differences can be found in Statement 3: Fiscal strategy and outlook of the 2013-14 Budget
Paper No. 1.
Table 8 provides a reconciliation of the fiscal balance estimates since the Budget.
42
Economic Statement
Table 8: Reconciliation of the 2013-14 Budget and ES fiscal balance estimates
Estimates
2013-14 2014-15
$m
$m
-13,497
-6,255
-0.8
-0.4
2013-14 Budget fiscal balance
Per cent of GDP
Changes from 2013-14 Budget to ES
Effect of policy decisions(a)(b)
Revenue
Expenses
Net capital investment
Total policy decisions impact on fiscal balance
Effect of parameter and other variations(b)
Revenue
Expenses
Net capital investment
Total parameter and other variations impact on
fiscal balance
(a)
Projections
2015-16 2016-17
$m
$m
5,955
10,819
0.3
0.6
699
1,129
317
-747
-5,466
-1,688
2
-3,779
3,145
-1,615
0
4,761
4,210
-2,201
0
6,411
-8,547
2,080
681
-8,625
1,967
1,594
-8,148
1,439
-651
-8,229
2,149
-713
-11,308
-12,186
-8,936
-9,666
ES fiscal balance
-25,553
-22,220
1,780
7,564
Per cent of GDP
-1.6
-1.4
0.1
0.4
(a) Excludes secondary impacts on public debt interest of policy decisions and offsets from the contingency
reserve for decisions taken.
(b) A positive number for revenue indicates an increase in the fiscal balance, while a positive number for
expenses and net capital investment indicates a decrease in the fiscal balance.
MEDIUM-TERM FISCAL STRATEGY
Box 4: Government’s medium-term fiscal strategy
The Government’s medium-term fiscal strategy is to:
•
achieve budget surpluses, on average, over the medium term;
•
keep taxation as a share of GDP, on average, below the level for 2007-08
(23.7 per cent); and
•
improve the Government’s net financial worth over the medium term.
To ensure a timely return to surplus and recovery in the fiscal position, since the
beginning of the global financial crisis the Government has further committed to:
•
allow the level of tax receipts to recover naturally as the economy improves,
while maintaining the Government’s commitment to keep taxation as a share of
GDP below the 2007-08 level on average; and
•
build growing surpluses by holding real growth in spending to 2 per cent a year,
on average, until the budget surplus is at least 1 per cent of GDP, and while the
economy is growing at or above trend.
43
Economic Statement
The Government’s responsible savings decisions provide a pathway to budget surplus
in 2016-17, which will improve the Government’s net financial worth over the medium
term.
In 2013-14, the economy is expected to grow at 2½ per cent — below trend rate. In
2014-15, the economy is expected to grow around trend. From 2014-15 onwards, real
growth in payments is estimated to be less than 2 per cent per annum in each year.
Average real spending growth over the five years from 2012-13 is only 1.3 per cent per
annum, the same level as reported in the Budget (Table 9).
In years where economic growth is more constrained, due to the challenges facing the
Australian economy, the Government is not making drastic cuts to payments which
would come at a significant cost to households, services, jobs and growth.
Table 9: Real spending growth
Real payment growth
2012-13(a)
2013-14
2014-15
2015-16
2016-17
-3.2
5.7
1.6
0.8
1.8
Average real growth in payments
1.3
(a) Based on 2013-14 Budget data.
NET DEBT, NET FINANCIAL WORTH AND NET WORTH
Table 10 provides a summary of the Australian Government general government
sector net financial worth, net worth, net debt and net interest payments.
Table 10: Australian Government general government sector net worth, net
financial worth, net debt and net interest payments
Estimates
2013-14
2014-15
$b
$b
261.2
280.1
113.6
116.7
374.7
396.9
Financial assets
Non-financial assets
Total assets
Total liabilities
Projections
2015-16
2016-17
$b
$b
306.8
345.3
118.9
120.4
425.6
465.6
555.1
596.4
622.5
655.5
Net worth
-180.4
-199.6
-196.9
-189.9
Net financial worth(a)
Per cent of GDP
-294.0
-18.8
-316.3
-19.3
-315.8
-18.3
-310.3
-17.0
184.1
11.7
212.2
13.0
219.1
12.7
217.6
12.0
Net debt(b)
Per cent of GDP
Net interest payments
8.4
9.5
11.5
10.0
0.5
0.6
0.7
0.5
Per cent of GDP
(a) Net financial worth equals total financial assets minus total liabilities. That is, it excludes non-financial
assets.
(b) Net debt equals the sum of deposits held, government securities, loans and other borrowing, minus the
sum of cash and deposits, advances paid and investments, loans and placements.
44
Economic Statement
Net debt for the Australian Government general government sector is estimated to be
$184.1 billion (11.7 per cent of GDP) in 2013-14, compared to $178.1 billion estimated at
Budget.
As a share of GDP, net debt is expected to peak at 13.0 per cent in 2014-15, and then
reduce to 12.0 per cent by 2016-17.
The increase in 2013-14 net debt since the Budget is primarily driven by more issuance
of Commonwealth Government Securities (CGS). This increase has been partially
offset by higher yields (interest rates) on CGS on issue than were assumed at the time
of the Budget, which results in a lower market value of CGS on issue.
The changes to net debt also impact on net financial worth and net worth.
•
Net financial worth is estimated to be -$294.0 billion in 2013-14, compared to the
Budget estimate of -$286.1 billion.
•
Net worth is forecast to be -$180.4 billion in 2013-14, compared to the Budget
estimate of -$173.5 billion.
Australian Government net debt remains very low by international standards. The
expected peak in net debt as a share of GDP in 2014-15 is a fraction of the average net
debt in major advanced economies (Chart 7).
Chart 7: Comparison of Government net debt for selected economies, 2013-2016
175
Per cent of GDP
Per cent of GDP
175
150
150
125
125
100
100
75
75
50
50
25
25
0
0
Australia
euro area
Japan
US
UK
Note: Australian data are for the Australian Government general government sector and refer to financial
years beginning 2013-14. Data for all other economies are total government and refer to calendar years
beginning 2013.
Source: IMF Fiscal Monitor April 2013 and Treasury.
45
Economic Statement
Commonwealth Government Securities
The Australian Government issues debt securities to the public in the form of Treasury
Bonds, Treasury Indexed Bonds (TIBs) and Treasury Notes, collectively known as
Commonwealth Government Securities (CGS). CGS are reported on the balance sheet
in market value terms, consistent with the relevant accounting standards. The market
value of CGS reflects prices in the secondary market, which are constantly changing
with market conditions.
The face value of CGS on issue is the amount that the Government owes to investors,
and is independent of fluctuations in market prices. The face value of CGS on issue
fluctuates depending on the issuance of new securities and maturities of securities
outstanding. The ‘peak’ amount of CGS on issue in any given year will depend on the
timing of revenue, expenditure and CGS maturities.
The Commonwealth Inscribed Stock Act 1911 places a limit of $300 billion on the face
value of CGS outstanding. As stated in the 2013-14 Budget, the Government will
legislate to increase the limit as it becomes necessary.
Based on current estimates, CGS outstanding is expected to reach the limit within the
2013-14 financial year (around December 2013) and will remain around that level from
December 2013 onwards. CGS on issue is expected to increase over the forward
estimates.
Table 11 contains projections of the face value of CGS on issue subject to the legislative
limit. It is important to note that there is a debt issuance strategy for the budget year
only. Projections beyond the budget year are based on a set of technical assumptions
and will vary significantly with changes to budget estimates and projections
Table 11: Projected face value of Commonwealth Government Securities
2013-14
$b
2014-15
$b
2015-16
$b
(a)(b)
2016-17
$b
End-of-year amount
290
330
350
370
Within-year peak(c)
300
350
370
Not available
Month of peak
Dec-13
Apr-15
Apr-16
Not available
(a) Data in this table are rounded to the nearest $10 billion.
(b) These figures exclude TIBs issued before July 2008 which are not subject to the legislative limit.
$4.6 billion of TIBs are not subject to the legislative limit in 2013-14 and 2014-15, and following a
maturity in August 2015, $2.5 billion of TIBs will not be subject to the limit in 2015-16 and 2016-17.
(c) The precise within-year timing of cash outlays and receipts are not known. Estimates of projected peaks
of CGS on issue are therefore subject to considerable uncertainty.
Source: Australian Office of Financial Management.
46
APPENDIX A: FINANCIAL STATEMENTS
The financial statements consist of an operating statement, including other economic
flows, a balance sheet, and a cash flow statement for the Australian Government
general government sector (GGS).
The Charter of Budget Honesty Act 1998 (the Charter) requires reports to be based on
external reporting standards and departures from applicable external reporting
standards to be identified.
The external standards used for reporting purposes are:
•
the Australian Bureau of Statistics’ (ABS) accrual Government Finance Statistics
(GFS) publication, Australian System of Government Finance Statistics: Concepts,
Sources and Methods, (cat no. 5514.0), which in turn is based on the International
Monetary Fund (IMF) accrual GFS framework; and
•
the Australian Accounting Standards (AAS) issued by the Australian Accounting
Standards Board (AASB), which includes International Financial Reporting
Standards (IFRS) as adopted in Australia and the public sector specific standard
AASB 1049 Whole of Government and General Government Sector Financial Reporting.
The financial statements have been prepared on the same basis as the budget papers.
The statements reflect the Government’s accounting policy that ABS GFS remains the
basis of budget accounting policy, except where the Government applies AAS because
it provides a better conceptual basis for presenting information of relevance to users of
public sector financial reports.
Fiscal reporting focuses on the GGS. The GGS provides public services that are mainly
non-market in nature and for the collective consumption of the community, or involve
the transfer or redistribution of income. These services are largely financed through
taxes and other compulsory levies, user charging and external funding. This sector
comprises all government departments, offices and some other bodies. In preparing
financial statements for the GGS, all material transactions and balances between
entities within the GGS have been eliminated.
47
Economic Statement
Table A1: Australian Government general government sector operating
statement
Revenue
Taxation revenue
Sales of goods and services
Interest income
Dividend income
Other
Total revenue
Expenses
Gross operating expenses
Wages and salaries(a)
Superannuation
Depreciation and amortisation
Supply of goods and services
Other operating expenses(a)
Total gross operating expenses
Superannuation interest expense
Interest expenses
Current transfers
Current grants
Subsidy expenses
Personal benefits
Total current transfers
Capital transfers
Mutually agreed write-downs
Other capital grants
Total capital transfers
Total expenses
Net operating balance
Other economic flows - included in
operating result
Net write-downs of assets (including bad
and doubtful debts)
Assets recognised for the first time
Liabilities recognised for the first time
Actuarial revaluations
Net foreign exchange gains
Net swap interest received
Market valuation of debt
Other gains/(losses)
Total other economic flows - included
in operating result
Operating result(b)
Non-owner movements in equity
Revaluation of equity investments
Actuarial revaluations
Other economic revaluations
Total other economic flows - included in equity
Comprehensive result Total change in net worth
48
Estimates
2014-15
2013-14
$m
$m
Projections
2016-17
2015-16
$m
$m
358,898
8,638
3,990
2,252
6,123
379,900
376,258
8,569
4,025
2,409
6,260
397,521
410,503
8,750
4,437
2,657
6,746
433,094
441,096
8,903
4,924
2,771
6,856
464,549
19,543
4,095
5,840
76,426
5,706
111,610
8,462
14,230
19,494
4,119
6,117
78,084
5,953
113,768
8,839
15,269
20,087
4,229
6,405
81,803
6,201
118,724
9,160
16,030
21,091
4,211
6,600
84,696
6,266
122,864
9,496
16,189
118,981
15,206
122,716
256,903
125,421
12,988
129,150
267,560
130,587
13,463
134,342
278,391
139,470
14,828
143,872
298,170
2,277
8,028
10,305
401,510
-21,610
2,457
8,049
10,506
415,941
-18,421
2,648
5,886
8,533
430,839
2,255
2,823
5,153
7,976
454,695
9,854
-7,565
560
0
0
132
0
397
3,672
-2,803
-6,631
587
0
0
106
0
956
3,793
-1,189
-7,618
613
0
0
65
0
511
6,511
81
-8,609
640
0
0
11
0
325
3,412
-4,219
-24,413
-19,609
2,336
5,635
-2,223
-936
568
-2,591
0
181
258
440
0
218
91
309
0
252
1,124
1,376
-27,005
-19,170
2,645
7,011
Economic Statement
Table A1: Australian Government general government sector operating
statement (continued)
Estimates
2013-14
2014-15
$m
$m
-21,610
-18,421
Net operating balance
Net acquisition of non-financial assets
Purchases of non-financial assets
less Sales of non-financial assets
less Depreciation
plus Change in inventories
plus Other movements in non-financial assets
Total net acquisition of non-financial assets
Fiscal balance (Net lending/borrowing)(c)
10,251
357
5,840
274
-386
3,943
-25,553
9,729
264
6,117
236
216
3,800
-22,220
Projections
2015-16
2016-17
$m
$m
2,255
9,854
9,479
2,626
6,405
323
-297
475
1,780
8,880
227
6,600
369
-131
2,290
7,564
(a) Consistent with ABS GFS classification, other employee related expenses are reported under other
operating expenses. Total employee expenses equal wages and salaries plus other operating expenses.
(b) Operating result under AAS.
(c) The term fiscal balance is not used by the ABS.
49
Economic Statement
Table A2: Australian Government general government sector balance sheet
Estimates
2013-14
2014-15
$m
$m
Projections
2015-16
2016-17
$m
$m
Assets
Financial assets
Cash and deposits
Advances paid
Investments, loans and placements
Other receivables
Equity investments
Investments in other public sector entities
Equity accounted investments
Investments - shares
Total financial assets
2,560
40,698
111,337
44,838
2,740
46,621
114,497
45,086
3,018
52,936
120,451
50,490
3,253
61,188
135,454
57,005
26,287
331
35,105
261,155
32,925
334
37,932
280,135
38,632
337
40,888
306,753
43,688
340
44,348
345,276
Non-financial assets
Land
Buildings
Plant, equipment and infrastructure
Inventories
Intangibles
Investment property
Biological assets
Heritage and cultural assets
Assets held for sale
Other non-financial assets
Total non-financial assets
Total assets
8,719
25,158
55,890
7,210
5,426
182
37
10,463
83
409
113,576
374,731
8,663
25,729
58,426
7,045
5,422
182
37
10,474
121
624
116,724
396,858
8,634
25,920
60,756
6,975
5,472
182
37
10,486
83
327
118,872
425,624
8,603
26,232
61,991
6,931
5,612
182
37
10,499
83
197
120,366
465,643
192
324,358
12,581
1,529
338,659
192
362,499
12,001
1,412
376,104
192
382,179
11,786
1,361
395,519
192
404,382
11,672
1,282
417,528
149,786
14,891
4,266
13,879
3,614
15,592
14,436
216,463
555,122
155,143
15,080
4,316
14,142
3,605
13,105
14,925
220,315
596,419
160,562
15,104
4,365
14,392
4,223
11,640
16,735
227,021
622,540
166,077
15,556
4,394
14,848
5,224
12,275
19,645
238,019
655,547
-180,391
-199,561
-196,916
-189,904
Liabilities
Interest bearing liabilities
Deposits held
Government securities
Loans
Other borrowing
Total interest bearing liabilities
Provisions and payables
Superannuation liability
Other employee liabilities
Suppliers payable
Personal benefits provisions and payable
Subsidies provisions and payable
Grants provisions and payable
Other provisions and payables
Total provisions and payables
Total liabilities
Net worth(a)
Net financial worth(b)
-293,967
-316,284
-315,787
-310,271
Net financial liabilities(c)
320,254
349,209
354,420
353,959
Net debt(d)
184,065
212,246
219,114
217,634
(a) Net worth is calculated as total assets minus total liabilities.
(b) Net financial worth equals total financial assets minus total liabilities.
(c) Net financial liabilities equals total liabilities less financial assets other than investments in other public sector
entities.
(d) Net debt equals the sum of deposits held, government securities, loans and other borrowing, minus the
sum of cash and deposits, advances paid and investments, loans and placements.
50
Economic Statement
Table A3: Australian Government general government sector cash flow
(a)
statement
Estimates
2013-14
2014-15
$m
$m
Projections
2015-16
2016-17
$m
$m
Cash receipts from operating activities
Taxes received
Receipts from sales of goods and services
Interest receipts
Dividends and income tax equivalents
Other receipts
Total operating receipts
348,040
8,686
3,768
2,706
5,748
368,948
367,351
8,519
3,676
2,444
5,941
387,931
398,471
8,691
4,123
2,690
6,686
420,662
427,936
8,852
4,338
2,729
6,654
450,509
Cash payments for operating activities
Payments for employees
Payments for goods and services
Grants and subsidies paid
Interest paid
Personal benefit payments
Other payments
Total operating payments
-26,736
-76,901
-142,093
-12,119
-123,444
-5,458
-386,750
-26,892
-78,045
-148,191
-13,161
-129,199
-5,791
-401,280
-28,030
-81,918
-149,672
-15,631
-134,432
-6,002
-415,684
-29,003
-84,938
-157,014
-14,307
-143,567
-5,793
-434,622
Net cash flows from operating activities
-17,802
-13,349
4,978
15,886
416
-9,342
2,229
-9,890
2,626
-9,122
227
-8,693
-8,926
-7,661
-6,496
-8,466
-9,966
-12,575
-12,491
-13,541
-786
-3,899
-6,077
-14,758
Cash flows from investments in
non-financial assets
Sales of non-financial assets
Purchases of non-financial assets
Net cash flows from investments in
non-financial assets
Net cash flows from investments in
financial assets for policy purposes
Cash flows from investments in
financial assets for liquidity purposes
Increase in investments
Net cash flows from investments in
financial assets for liquidity purposes
-786
-3,899
-6,077
-14,758
Cash receipts from financing activities
Borrowing
Other financing
Total cash receipts from financing activities
39,474
0
39,474
40,035
0
40,035
22,839
0
22,839
24,252
0
24,252
Cash payments for financing activities
Borrowing
Other financing
Total cash payments for financing activities
0
-2,011
-2,011
0
-2,371
-2,371
0
-2,474
-2,474
0
-3,139
-3,139
Net cash flows from financing activities
37,463
37,663
20,365
21,113
-17
180
278
235
Net increase/(decrease) in cash held
51
Economic Statement
Table A3: Australian Government general government sector cash flow
(a)
statement (continued)
Estimates
2013-14
2014-15
$m
$m
Projections
2015-16
2016-17
$m
$m
Net cash flows from operating activities
and investments in non-financial assets
(Surplus(+)/deficit(-))
-26,727
-21,010
-1,518
7,421
Finance leases and similar arrangements(b)
-469
0
0
0
GFS cash surplus(+)/deficit(-)
-27,196
-21,010
-1,518
7,421
2,946
2,962
3,189
3,393
less Net Future Fund earnings
-30,142
-23,972
-4,708
4,027
Equals underlying cash balance(c)
plus Net cash flows from investments in
financial assets for policy purposes
-9,966
-12,575
-12,491
-13,541
2,946
2,962
3,189
3,393
plus Net Future Fund earnings
-37,162
-33,585
-14,009
-6,120
Equals headline cash balance
(a) A positive number denotes a cash inflow; a negative number denotes a cash outflow.
(b) The acquisition of assets under finance leases decreases the underlying cash balance. The disposal of
assets previously held under finance leases increases the underlying cash balance.
(c) The term underlying cash balance is not used by the ABS.
52
APPENDIX B: POLICY DECISIONS TAKEN SINCE THE
2013-14 BUDGET
Table B1: Revenue measures since the 2013-14 Budget
(a)
2012-13 2013-14 2014-15 2015-16 2016-17
$m
$m
$m
$m
$m
AGRICULTURE, FISHERIES AND FORESTRY
Department of Agriculture, Fisheries and Forestry
Agricultural production levies
– changes to banana levy(b)
– changes to sugar levy(b)
Portfolio total
-
17.4
17.4
17.4
17.4
17.9
17.9
17.9
17.9
-
-0.1
..
-0.1
-0.1
-0.1
-
130.0
129.9
360.0
359.9
550.0
549.9
740.0
739.9
CROSS PORTFOLIO
Various Agencies
Establishment of a Financial Stability Fund(b)
Portfolio total
-
-
-
407.9
407.9
325.0
325.0
EDUCATION, EMPLOYMENT AND WORKPLACE
RELATIONS
Department of Education, Employment and Workplace
Relations
Fraud Prevention and Compliance — increase
compliance of customers with earned income(b)
Portfolio total
-
-
6.6
6.6
6.6
6.6
6.6
6.6
FAMILIES, HOUSING, COMMUNITY SERVICES AND
INDIGENOUS AFFAIRS
Department of Families, Housing, Community Services
and Indigenous Affairs
Fraud Prevention and Compliance — increase
compliance of customers with earned income(b)
Portfolio total
-
-
-
-
-
nfp
-
nfp
-
nfp
-
nfp
-
nfp
-
-
-
-
-
-
ATTORNEY-GENERAL'S
Australian Customs and Border Protection Service
Carbon pricing mechanism — replacing fixed price
with an emissions trading scheme from
1 July 2014(b)(c)
Import duty exemption — mastectomy bras
Staged increase in the excise and excise-equivalent
customs duty on tobacco products(b)
Portfolio total
HEALTH AND AGEING
Department of Health and Ageing
Pharmaceutical Benefits Scheme — new and
amended listings(b)
Portfolio total
HUMAN SERVICES
Department of Human Services
Fraud Prevention and Compliance — increase
compliance of customers with earned income(b)
Portfolio total
53
Economic Statement
(a)
Table B1: Revenue measures since the 2013-14 Budget (continued)
2012-13 2013-14 2014-15 2015-16 2016-17
$m
$m
$m
$m
$m
IMMIGRATION AND CITIZENSHIP
Department of Immigration and Citizenship
Reform of the Migration Zone for offshore workers
Visa Application Charges — increase
Portfolio total
-
INDUSTRY, INNOVATION, CLIMATE CHANGE,
SCIENCE, RESEARCH AND TERTIARY EDUCATION
Clean Energy Regulator
Carbon pricing mechanism — replacing fixed price
with an emissions trading scheme from
1 July 2014(b)(c)
Portfolio total
SUSTAINABILITY, ENVIRONMENT, WATER,
POPULATION AND COMMUNITIES
Department of Sustainability, Environment, Water,
Population and Communities
Carbon pricing mechanism — replacing fixed price
with an emissions trading scheme from
1 July 2014(b)(c)
Portfolio total
TREASURY
Australian Office of Financial Management
South Australian Government housing stimulus
assistance(b)
Australian Prudential Regulation Authority
MoneySmart teaching and online MoneySmart
program(b)
Australian Securities and Investments Commission
Banks accounts — further reform of arrangements
relating to transfer of unclaimed monies(b)
Australian Taxation Office
Addressing the level of unpaid tax and
superannuation in the community(b)(d)
Allow new companies to carry back losses against
first year profits
Carbon pricing mechanism — replacing fixed price
with an emissions trading scheme from
1 July 2014(b)(c)
Fairer excess contributions tax — refinements to
exposure draft
Fringe benefits tax — better targeting actual business
use for car fringe benefits(b)
GST refund amendments — new transitional rules(b)
Indirect Tax Concession Scheme — diplomatic and
consular privileges(b)(e)
International tax — revised Australia-Switzerland tax
treaty
Managed investment trust withholding tax —
providing certainty for foreign pension funds
Native Title Benefits — Clarifying eligible trusts
54
0.5
114.9
115.4
0.5
140.5
141.0
0.5
142.6
143.1
0.5
144.5
145.0
-
- -6,970.0
- -6,970.0
-
-
-
-
-150.0
-150.0
-
-
-
-16.7
-16.0
-15.4
-14.6
-
-
-
-
-
-
-7.4
-8.1
-8.8
-8.8
-
-
-
-
-
-
-
-
-
-
-
-
-200.0
-
-
-
-
15.0
26.0
26.0
-
75.0
..
410.0
..
750.0
-
960.0
-
-
-
-
-
-
-
-
-10.0
-10.0
20.0
..
..
..
..
..
Economic Statement
(a)
Table B1: Revenue measures since the 2013-14 Budget (continued)
2012-13 2013-14 2014-15 2015-16 2016-17
$m
$m
$m
$m
$m
Offshore Banking Unit reforms — fairer alignment of
start dates
Personal income tax
– deferring the cap on work-related self-education
expenses(b)(c)
– exemption of pay and allowances for Operation
PALATE II personnel
Philanthropy — updating the list of specifically listed
deductible gift recipients(f)(g)
Staged increase in the excise and excise-equivalent
customs duty on tobacco products(b)
Superannuation — reform of arrangements relating to
transfer of lost member accounts to the ATO(b)(h)
Portfolio total
-
*
*
-
-
-
-
-
-250.0
-
-
-0.1
-0.1
-
-
-
-
..
..
..
-
280.0
810.0
1,230.0
1,670.0
-
330.8
1,000.8
155.0
1,876.8
165.0
2,817.5
VETERANS' AFFAIRS
Department of Veterans' Affairs
Fraud Prevention and Compliance — increase
compliance of customers with earned income(b)
Portfolio total
Decisions taken but not yet announced
105.2
128.6
142.9
157.6
Total impact of revenue measures(i)
698.7 -5,465.8 3,145.0 4,209.6
* The nature of the measure is such that a reliable estimate cannot be provided.
.. Not zero, but rounded to zero.
- Nil.
nfp not for publication.
(a) A minus sign before an estimate indicates a reduction in revenue, no sign before an estimate indicates a
gain in revenue.
(b) These measures can also be found in the expense measures summary table.
(c) These measures can also be found in the capital measures summary table.
(d) The impact of this measure is a net gain of $826.5 million in underlying cash terms over the forward
estimates.
(e) Provision for this measure was included as a ‘decision taken but not yet announced’ in the 2013-14
Budget which includes a negligible cost to revenue over the forward estimates period.
(f) Since the 2013-14 Budget, the following organisations have been approved as deductible gift recipients
(DGRs): Social Traders Limited and Make a Mark Australia.
(g) The following organisations were approved as DGRs prior to the 2013-14 Budget: Australian
Neighbourhood Houses and Centres Association; Layne Beachley — Aim for the Stars Foundation
Limited; The Australia Foundation in support of Human Rights Watch Limited; Australian Council for
Social Service; The Charlie Perkins Scholarship Trust; Roberta Sykes Indigenous Education Foundation;
Aurora Education Foundation Limited; Bali Peace Park Association Inc and the Schools Philanthropy
Fund. Provision for these DGRs was included as a ‘decision taken but not yet announced’ in the
2013-14 Budget which includes a cost to revenue of $10.2 million over the forward estimates period.
(h) The impact of this measure is a net gain of $582.5 million in underlying cash terms over the forward
estimates.
(i) Measures may not add due to rounding.
55
Economic Statement
Table B2: Expense measures since the 2013-14 Budget
(a)
2012-13 2013-14 2014-15 2015-16 2016-17
$m
$m
$m
$m
$m
AGRICULTURE, FISHERIES AND FORESTRY
Department of Agriculture, Fisheries and Forestry
Agricultural Cooperation and Investment in Indonesia
— additional funding(b)
Agricultural production levies
– changes to banana levy(c)
– changes to sugar levy(c)
Beef Australia 2015 — Rockhampton — contribution
Carbon Farming Futures — return of unallocated
funds
Farm Finance — concessional loans —
administration
Foreign Ownership Register for Agricultural Land —
establishment(d)(e)
Independent Inspector General of Animal Welfare and
Live Animal Exports — establishment
Live Animal Exports — business assistance —
reduced funding
Murray-Darling Basin Plan — South Australian River
Murray Sustainability Program — establishment(f)
National Food Plan — initiatives(g)
Portfolio total
ATTORNEY-GENERAL'S
Attorney-General's Department
National Partnership Agreement and trials between
Commonwealth and Queensland for natural disaster
recovery — extension
Natural Disaster Recovery and Rebuilding — Port of
Bundaberg(f)
Australian Commission for Law Enforcement Integrity
Australian Commission for Law Enforcement Integrity
— strengthening investigative capabilities
Australian Customs and Border Protection Service
Papua New Guinea Regional Resettlement
Arrangement — communication campaign
Australian Federal Police
Official development assistance — Papua New
Guinea expanded aid package(b)
People smugglers — bounties for arrest and
conviction
People smuggling operational capabilities in
Indonesia — enhancement
Family Court and Federal Circuit Court
Reform of Australia's Protection Status Determination
System
Federal Court of Australia
Reform of Australia's Protection Status Determination
System
Insolvency and Trustee Service Australia
Australian Commission for Law Enforcement Integrity
— strengthening investigative capabilities
Portfolio total
56
nfp
nfp
nfp
nfp
nfp
-
18.4
2.5
18.4
-
18.7
-
18.7
-
-
-29.2
-30.9
-43.2
-39.7
nfp
nfp
nfp
nfp
nfp
-
-
-
-
-
-
1.0
1.0
1.0
1.0
-2.5
-
-
-
-
-2.5
-7.3
-11.5
-23.5
-20.1
-
-
-
-
-
-
-
-
-
-
-
1.2
2.2
2.3
2.3
-
5.0
-
-
-
-
29.1
37.7
42.6
40.4
-
-
-
-
-
-
-
-
-
-
-
-
0.8
0.8
0.3
-
-
0.4
0.4
0.2
-
-1.2
34.1
-2.2
39.0
-2.3
43.8
-2.3
40.9
Economic Statement
Table B2: Expense measures since the 2013-14 Budget
(a)
(continued)
2012-13 2013-14 2014-15 2015-16 2016-17
$m
$m
$m
$m
$m
BROADBAND, COMMUNICATIONS AND THE
DIGITAL ECONOMY
Department of Broadband, Communications and the
Digital Economy
Community broadcasting — additional funding
Digital business kits — establishment
Digital careers — establishment
National ICT Australia — funding extension
Townsville telehealth trial — extension
Portfolio total
CROSS PORTFOLIO
Various Agencies
Efficiency Dividend — temporary increase in the rate
Reforms to APS management and efficient
procurement of agency software
Portfolio total
DEFENCE
Department of Defence
Military Superannuation — higher indexation for
DFRB and DFRDB pensioners over 65 years of
age(h)(i)
Papua New Guinea Regional Resettlement
Arrangement — accommodation support services
Portfolio total
EDUCATION, EMPLOYMENT AND WORKPLACE
RELATIONS
Asbestos Safety and Eradication Agency
National Strategic Plan for Asbestos Awareness and
Management in Australia and asbestos safety
assurance model — implementation
Comcare
National Strategic Plan for Asbestos Awareness and
Management in Australia and asbestos safety
assurance model — implementation
Department of Education, Employment and Workplace
Relations
Better Schools
– National Plan for School Improvement — Centre for
Quality Teaching and Learning
– National Plan for School Improvement — funding
for independent schools
– National Plan for School Improvement — new
school funding model — updated data
– treatment of payments for non-participating States
and Territories
Community Development and Employment Projects
— extension
Early Childhood Education — additional support for
Tasmania(f)
Ford Australia — assistance to workers
57
-
2.8
0.7
3.4
1.9
1.9
1.4
21.0
22.4
-
-
-
-261.5
-588.8
-972.0
-
-37.9
-37.9
-56.3
-317.8
-83.9
-70.2
-672.7 -1,042.2
-
-
68.0
70.0
75.2
-
15.0
15.0
68.0
70.0
75.2
-
2.1
2.2
1.0
1.0
-
1.4
1.4
1.5
-
-
-
-
-
-
-
-
-
-
-
-
-
-
-
-
nfp
nfp
nfp
nfp
nfp
-
-1.3
-
-
-
-
1.0
1.4
1.4
1.4
Economic Statement
Table B2: Expense measures since the 2013-14 Budget
(a)
(continued)
2012-13 2013-14 2014-15 2015-16 2016-17
$m
$m
$m
$m
$m
Fraud Prevention and Compliance — increase
compliance of customers with earned income
Improving educational outcomes — various grants
Mature Age Participation — job seeker assistance —
early cessation
Migrant Communities' Employment Fund
Tasmanian Government — economic assistance(f)
Portfolio total
FAMILIES, HOUSING, COMMUNITY SERVICES AND
INDIGENOUS AFFAIRS
Department of Families, Housing, Community Services
and Indigenous Affairs
Aboriginal and Torres Strait Islander Healing
Foundation — continuation
Community Development and Employment Projects
— extension
DisabilityCare Australia — full scheme
implementation assistance
Fraud Prevention and Compliance — increase
compliance of customers with earned income
Fringe benefits tax — better targeting actual business
use for car fringe benefits(c)
Portfolio total
FINANCE AND DEREGULATION
Department of Finance and Deregulation
Bureau of Meteorology — supercomputing capability
— second pass business case(g)
Standard terms and conditions for procurement
contracts — implementation cost
Portfolio total
FOREIGN AFFAIRS AND TRADE
AusAID
Agricultural Cooperation and Investment in Indonesia
— additional funding(b)
Official development assistance
– further Australian support for polio eradication(b)
– Papua New Guinea expanded aid package(b)
– slowing growth to 2017-18
Papua New Guinea Regional Resettlement
Arrangement — processing and resettlement(d)
Portfolio total
HEALTH AND AGEING
Department of Health and Ageing
Aboriginal and Torres Strait Islander Suicide
Prevention strategy funding
Aged Care — transition of Home and Community
Care in Victoria to the Commonwealth(f)
Australian Neighbourhood Houses and Centres
Association — granting Deductible Gift Recipient
status
58
-
-
0.1
-
0.1
-
0.1
-
-
3.4
-30.0
-23.5
3.2
8.3
-10.7
-6.8
2.5
-
-
-
-
-
-
1.3
-
-
-
-
-
-
-
-
-
-
-6.7
-8.3
-8.9
-
1.3
-20.9
-27.6
-37.2
-45.5
-51.8
-60.7
-
-
-
-
-
-
1.2
1.2
0.8
0.8
0.6
0.6
0.6
0.6
-
-
-
-
-
-
-17.2
-
-28.6
-
-21.3
-168.4
-20.6
-710.1
-
-17.2
-28.6
-189.7
-730.7
-
-
-
-
-
-
1.4
2.3
-
-
-0.4
-
-
-
-
Economic Statement
Table B2: Expense measures since the 2013-14 Budget
(a)
(continued)
2012-13 2013-14 2014-15 2015-16 2016-17
$m
$m
$m
$m
$m
Charles Sturt University — dental and oral health
clinic developments in New South Wales
Dental Reform — communications
Female Genital Mutilation — education and
awareness — additional funding
Health and Hospitals Fund — facilities at the Chris
O'Brien Lifehouse cancer treatment centre
Healthy Communities — Casino District and Memorial
Hospital
Living Longer. Living Better
– Commonwealth Home Support Program —
nationally fair and consistent fee policy
– expanding eligibility for Dementia and Veterans'
Supplements
– Homeless Supplement
– improved consistency in leave arrangements for
residential care
– improving the operation of the Workforce
Supplement
Medicare Benefits Schedule — new and amended
listings
Pharmaceutical Benefits Scheme
– additional funding for legal action seeking
compensation
– new and amended listings
– price changes
– simplified price disclosure(j)
Rheumatic Fever Strategy — inclusion of South
Australia(f)
Tobacco plain packaging — compliance, enforcement
and litigation — additional funding
Type 1 Diabetes Insulin Pump Program — waiting list
reduction funding
World Leading Cancer Care package — additional
funding for prostate cancer nurses
Independent Hospital Pricing Authority
Health and Hospitals Fund — facilities at the Chris
O'Brien Lifehouse cancer treatment centre
Portfolio total
HUMAN SERVICES
Department of Human Services
Call Centre — supplementation
Fraud Prevention and Compliance — increase
compliance of customers with earned income
Living Longer. Living Better
– Homeless Supplement
– improved consistency in leave arrangements for
residential care
Medicare Benefits Schedule — new and amended
listings
Pharmaceutical Benefits Scheme — new and
amended listings
Portfolio total
59
-3.3
3.2
-
-
-
-
-
-
-
-
-4.1
7.6
-
-
-
-
-
-
-
-
-
-
0.2
-43.8
-127.4
-
0.5
4.2
0.4
6.2
0.4
6.9
0.5
7.4
-
-3.5
-7.6
-8.0
-8.4
-
-
-
-
-
-
-1.1
-0.3
0.3
0.9
-
nfp
276.3
4.1
-
340.2
5.1
-
379.5
5.3
-
420.4
5.7
-
-
-0.4
-0.4
-0.4
-
nfp
nfp
nfp
nfp
nfp
-
-
-
-
-
-
-
-
-
-
-3.5
-11.3
292.3
346.1
340.2
299.1
-
-
20.0
20.0
20.0
-
-
2.6
2.5
2.6
-
1.1
-
-
-
-
0.6
-
-
-
-
..
..
..
..
-
0.4
2.0
..
22.5
-0.1
22.5
..
22.5
Economic Statement
Table B2: Expense measures since the 2013-14 Budget
(a)
(continued)
2012-13 2013-14 2014-15 2015-16 2016-17
$m
$m
$m
$m
$m
IMMIGRATION AND CITIZENSHIP
Department of Immigration and Citizenship
Building Socially Inclusive Communities — additional
funding
Capacity Building Program for Indonesia
Humanitarian Settlement Services — reduction of
support for those already in the community
Immigration Detention Network
– Blaydin Point
– short-term onshore contingency
– Singleton(d)
Management of Unauthorised Maritime Arrivals —
failed asylum seekers
Papua New Guinea Regional Resettlement
Arrangement
– communication campaign
– processing and resettlement(d)
Reform of Australia's Protection Status Determination
System
Reform of the Migration Zone for offshore workers(c)
Migration Review Tribunal and Refugee Review
Tribunal
Reform of Australia's Protection Status Determination
System
Portfolio total
INDUSTRY, INNOVATION, CLIMATE CHANGE,
SCIENCE, RESEARCH AND TERTIARY EDUCATION
Australian Research Council
National ICT Australia — funding extension
Clean Energy Regulator
Carbon Pricing Mechanism — reforms to Energy
Security Fund(k)
Carbon pricing mechanism — replacing fixed price
with an emissions trading scheme from
1 July 2014(c)
Department of Industry, Innovation, Climate Change,
Science, Research and Tertiary Education
Australian Apprenticeships Incentives Program —
better targeting
Bindaree Beef — assistance
Clean Technology Programs — reduce and reprofile
funding
Ford assistance
– Automotive New Markets Program — additional
funding(l)
– Innovation and Investment Funds for Geelong and
Melbourne North — establishment(l)
Higher Education Loan Program — access for New
Zealand Special Category Visa holders brought to
Australia as dependent minors
Latrobe Valley economic diversification
60
-
10.0
22.8
28.3
-
-
-
-28.4
-30.6
-31.2
-31.7
-
58.6
55.3
43.5
27.9
5.1
-
-
-
-
0.2
0.3
0.3
0.3
-
7.0
42.9
91.0
84.0
163.2
-
0.5
0.2
1.3
0.2
5.0
0.2
5.6
0.2
-
212.7
-0.8
122.6
-0.8
57.6
-0.8
136.8
-
-
-
12.8
-
-
-
245.2
-513.0
-781.1
3.7 -3,137.8
0.7
-
-
-
-24.4
-
-67.6
-
-66.1
-
-83.5
-
-
20.0
-240.0
-138.0
-4.0
-
-
-
-
-
-
-
-
-
-
-
-
-
-
-
Economic Statement
Table B2: Expense measures since the 2013-14 Budget
(a)
(continued)
2012-13 2013-14 2014-15 2015-16 2016-17
$m
$m
$m
$m
$m
Lowy Institute — Engaging Asia Project —
contribution
National Centre for Asia Capability — establishment
South Australian Health and Biomedical Precinct —
contribution
Tasmanian Economic Diversification Projects(f)(g)
Textile, Clothing and Footwear Structural Adjustment
Program — closure of the Restructuring Initiative
Grants Scheme and increase in Employment Fund
Pathway credits
IP Australia
IP Australia — Patent Audit Committee —
establishment
Portfolio total
INFRASTRUCTURE AND TRANSPORT
Department of Infrastructure and Transport
Building Australia Fund
– rail infrastructure — bring forward(f)
– road infrastructure — bring forward(f)
Nation Building Program
– rail infrastructure projects — bring forward(f)
– road infrastructure projects — bring forward(f)
Regional Development Australia Fund — additional
funding(f)(m)(k)
Regional Infrastructure Fund — road infrastructure —
bring forward(f)
Sustainable Australia — Liveable Communities
Program — additional funding and bring forward(f)
Portfolio total
REGIONAL AUSTRALIA, LOCAL GOVERNMENT,
ARTS AND SPORT
Department of Regional Australia, Local Government,
Arts and Sport
Bellambi Surf Club — contribution
Darrel Baldock Memorial — contribution
Hanging Rock Sports Precinct — contribution
Indian Ocean Territories — essential air services
Latrobe Valley economic diversification
Longford Velodrome upgrades — contribution
Lord Howe Island aerodrome improvement works
Murray-Darling Basin Plan — South Australian River
Murray Sustainability Program — establishment(f)
National Live Music Office — establishment
Netball Australia — contribution
New sporting facilities for Fraser Park Football and
Social Club — contribution
Parramatta Stadium — contribution(f)(g)
Referendum on recognition of local government
Regional Development Australia Fund — additional
funding(f)(m)
Regional Development Projects in Northern Australia
61
-
-
-
-
-
100.0
-
-
-
-
-
-
-
-
-
-
-0.7 -3,200.1
-703.6
-868.6
100.0
-
-
-
-
-
-
-
-
-
-
-
-
-7.5
-
-
-
-
-
-
-
-
20.0
20.0
20.0
12.5
-10.0
-10.0
-20.0
-20.0
-
nfp
-
-
-
-
-
-
-
-
-
-
0.5
-
-
-
-
-
15.0
-
-
-
Economic Statement
Table B2: Expense measures since the 2013-14 Budget
(a)
(continued)
2012-13 2013-14 2014-15 2015-16 2016-17
$m
$m
$m
$m
$m
Rockhampton Stadium Development — feasibility
assessment
Special Olympics Asia Pacific Games — contribution
Surfing Australia High Performance Centre
Tasmanian Economic Diversification Projects(f)(g)
Tasmanian Jobs and Growth Package
Zodiac Gymnastics — contribution
Portfolio total
RESOURCES, ENERGY AND TOURISM
Department of Resources, Energy and Tourism
Carbon Capture and Storage Flagships — deferral of
funding
Coal Sector Jobs Package — reduction in funding
Cooperative Research Centre for Greenhouse Gas
Technologies — additional funding
Domestic gas market — study(g)
Former Rum Jungle uranium mine site —
rehabilitation(f)(g)
National Low Emissions Coal Initiative — additional
funding
Portfolio total
SUSTAINABILITY, ENVIRONMENT, WATER,
POPULATION AND COMMUNITIES
Bureau of Meteorology
Bureau of Meteorology
– increased frontline capabilities and National Centre
for Extreme Weather(d)(g)
– supercomputing capability — second pass business
case(g)
Department of Sustainability, Environment, Water,
Population and Communities
Biodiversity Fund — reduction in funding and
termination
Caring for our Country — redirection of funding
International Whale and Marine Mammal
Conservation Initiative — extension(g)
Murray-Darling Basin Plan — South Australian River
Murray Sustainability Program — establishment(f)
Tasmanian Economic Diversification Projects(f)(g)
Portfolio total
TREASURY
Australian Office of Financial Management
South Australian Government housing stimulus
assistance
Australian Securities and Investments Commission
Banks accounts — further reform of arrangements
relating to transfer of unclaimed monies
MoneySmart teaching and online MoneySmart
program(n)l
62
-
0.5
15.0
-
5.0
5.0
-
-12.0
-
-112.0
-186.4
-100.0
-
-
-
5.0
-
-5.0
-
-
-
-
-
-
-
-
-
13.0
6.0
-303.4
-100.0
-13.0
-13.0
-
-
-
-
-
-
-
-
-
-
-
-32.9
-1.1
-59.9
-0.6
-55.2
-1.1
-64.6
-1.1
-
-
-
-
-
-
-34.0
-60.5
-100.0
-156.4
-20.0
-85.7
283.9
-
-
-
-
-
-4.3
-4.7
-5.1
-5.1
-
-
-
-
-
Economic Statement
Table B2: Expense measures since the 2013-14 Budget
(a)
(continued)
2012-13 2013-14 2014-15 2015-16 2016-17
$m
$m
$m
$m
$m
Australian Taxation Office
Addressing the level of unpaid tax and
superannuation in the community(c)
Carbon pricing mechanism — replacing fixed price
with an emissions trading scheme from
1 July 2014(c)
Personal income tax — deferring the cap on
work-related self-education expenses(c)
Superannuation — reform of arrangements relating to
transfer of lost member accounts to the ATO(c)
Department of the Treasury
Addressing the level of unpaid tax and
superannuation in the community(c)
Aged Care — transition of Home and Community
Care in Victoria to the Commonwealth(f)
Australian Neighbourhood Houses and Centres
Association — granting Deductible Gift Recipient
status
Building Australia Fund
– rail infrastructure — bring forward(f)
– road infrastructure — bring forward(f)
DisabilityCare Australia — full scheme
implementation assistance
Early Childhood Education — additional support for
Tasmania(f)
Establishment of a Financial Stability Fund(c)
Foreign Ownership Register for Agricultural Land —
establishment(d)(e)
Former Rum Jungle uranium mine site —
rehabilitation(f)(g)
Fringe benefits tax — better targeting actual business
use for car fringe benefits(c)
Group of 20 meeting in 2014 — contribution to the
Queensland Government communications
network(f)
GST refund amendments — new transitional rules(c)
Indirect Tax Concession Scheme — diplomatic and
consular privileges(c)
Living Longer. Living Better — Commonwealth Home
Support Program — nationally fair and consistent
fee policy
Murray-Darling Basin Plan — South Australian River
Murray Sustainability Program — establishment(f)
Nation Building Program
– rail infrastructure projects — bring forward(f)
– road infrastructure projects — bring forward(f)
Natural Disaster Recovery and Rebuilding — Port of
Bundaberg(f)
Parramatta Stadium — contribution(f)(g)
Regional Development Australia Fund — additional
funding(f)(m)
Regional Infrastructure Fund — road infrastructure —
bring forward(f)
63
-
15.6
34.8
44.8
49.1
-
-
350.0
-
-
-
-
-0.7
-1.2
-
-
-
..
12.8
9.6
-
69.3
74.2
122.5
153.1
-
-1.4
-2.3
-
-
-
-
-
-
-
-
100.0
-
100.0
20.0
-200.0
-20.0
-
-
-
-
-
-
-
1.0
-
-
0.1
0.3
-
-
-
-
-
-
-
-
-
-
-
-
100.0
170.0
240.0
-
nfp
..
-
-
-
-
-
-
-
-
-
-
-
-20.0
-50.4
-
28.0
51.0
70.0
45.0
-
65.0
25.0
200.0
194.6
-265.0
96.4
-190.1
-
-
6.0
-
-
-
-
-
-7.5
-
-
-
20.0
143.9
-102.4
-61.5
Economic Statement
Table B2: Expense measures since the 2013-14 Budget
(a)
(continued)
2012-13 2013-14 2014-15 2015-16 2016-17
$m
$m
$m
$m
$m
Rheumatic Fever Strategy — inclusion of South
Australia(f)
Staged increase in the excise and excise-equivalent
customs duty on tobacco products(c)
Super Council — funding
Sustainable Australia — Liveable Communities
Program — additional funding and bring forward(f)
Tasmanian Economic Diversification Projects(f)(g)
Tasmanian Government — economic assistance(f)
Portfolio total
-
0.4
0.4
0.4
-
-
30.0
1.8
100.0
1.9
150.0
1.9
210.0
1.9
283.9
30.0
380.3
1,361.6
55.1
401.8
VETERANS' AFFAIRS
Department of Veterans' Affairs
Avenue of Honour Memorial — contribution
0.1
Fraud Prevention and Compliance — increase
compliance of customers with earned income
-0.2
-0.5
-0.6
Living Longer. Living Better
– Homeless Supplement
0.7
1.1
1.2
1.3
– improved consistency in leave arrangements for
residential care
-0.6
-1.3
-1.4
-1.5
Medicare Benefits Schedule — new and amended
listings
..
..
..
..
Pharmaceutical Benefits Scheme
– new and amended listings
12.7
15.4
17.3
19.2
– price changes
0.5
0.5
0.5
0.5
– simplified price disclosure(j)
Portfolio total
13.3
15.4
17.0
18.9
Decisions taken but not yet announced
-2.3
267.7
247.5
-336.5
-363.2
Total impact of expense measures(o)(m)
367.7 1,129.4 -1,688.4 -1,615.5 -2,201.0
* The nature of the measure is such that a reliable estimate cannot be provided.
.. Not zero, but rounded to zero.
- Nil.
nfp not for publication.
(a) A minus sign before an estimate indicates a reduction in expenses, no sign before an estimate indicates
increased expenses.
(b) The cost of this measure will be met from within existing AusAID resources.
(c) These measures can also be found in the revenue measures summary table.
(d) These measures can also be found in the capital measures summary table.
(e) The impact of this measure is a cost of $3.2 million over four years ($1.2 million for the Department of
the Treasury and $2.0 million for DAFF). This measure has been funded by the removal of a previous
decision taken but not yet announced.
(f) Funding is provided to Treasury as payment to states and territories.
(g) Provision for this funding has already been included in the forward estimates.
(h) The impact of this measure is $19.2 million in underlying cash terms over the forward estimates.
(i) DFRB refers to the Defence Forces Retirement Benefits Scheme and DFRDB refers to the Defence
Force Retirement and Death Benefits Scheme.
(j) This decision will save $835.0 million over four years.
(k) The impact of this measure is a net gain to receipts of $770.0 million in underlying cash terms over the
forward estimates.
(l) The cost of this measure will be met from within the existing resources of the New Car Plan for a
Greener Future package.
(m) The 2013-14 Budget included re-profiled net savings of $62.9 million from the program between 2013-14
and 2017-18 from a ‘decision taken but not yet announced’. The Government has since redirected
$45.0 million ($30.0 million beyond the forward estimates) from the Liveable Cities program to the RDAF
to support Round 5 of the Fund.
64
Economic Statement
(n) This measure provides $22.1 million over four years for ASIC. This is fully offset by levies and therefore
has no net impact on the budget. This measure was previously recorded as a decision taken but not yet
announced.
(o) Measures may not add due to rounding.
65
Economic Statement
Table B3: Capital measures since the 2013-14 Budget
(a)
2012-13 2013-14 2014-15 2015-16 2016-17
$m
$m
$m
$m
$m
AGRICULTURE, FISHERIES AND FORESTRY
Department of Agriculture, Fisheries and Forestry
Foreign Ownership Register for Agricultural Land —
establishment(b)
Portfolio total
-
-
-
-
-
HEALTH AND AGEING
Department of Health and Ageing
Pharmaceutical Benefits Scheme — simplified price
disclosure(b)
Portfolio total
-
-
-
-
-
-
2.6
10.9
14.5
-
-
-
-
0.5
-
-
-
-
194.4
222.9
-
-
-
-
5.3
5.3
2.0
2.0
-
-
-
-
-
-
-
-
-
-
-
-
TREASURY
Australian Taxation Office
Personal income tax — deferring the cap on
work-related self-education expenses(c)
-0.3
Portfolio total
-0.3
Decisions taken but not yet announced
-0.2
88.4
Total capital measures(d)
-0.2
316.6
1.7
* The nature of the measure is such that a reliable estimate cannot be provided.
.. Not zero, but rounded to zero.
- Nil.
-
-0.2
-0.2
IMMIGRATION AND CITIZENSHIP
Department of Immigration and Citizenship
Immigration Detention Network
– Blaydin Point(b)
– short-term onshore contingency(b)
– Singleton
Management of Unauthorised Maritime Arrivals —
failed asylum seekers(b)
Papua New Guinea Regional Resettlement
Arrangement — expansion of regional processing
centre capacity
Portfolio total
INDUSTRY, INNOVATION, CLIMATE CHANGE,
SCIENCE, RESEARCH AND TERTIARY EDUCATION
Clean Energy Regulator
Carbon pricing mechanism — replacing fixed price
with an emissions trading scheme from
1 July 2014(c)
Portfolio total
SUSTAINABILITY, ENVIRONMENT, WATER,
POPULATION AND COMMUNITIES
Bureau of Meteorology
Increased frontline capabilities and National Centre
for Extreme Weather(b)
Department of Sustainability, Environment, Water,
Population and Communities
International Whale and Marine Mammal
Conservation Initiative — extension(b)
Portfolio total
66
Economic Statement
nfp not for publication.
(a) A minus sign before an estimate indicates a reduction in capital, no sign before an estimate indicates
increased capital.
(b) These measures can also be found in the expense measures summary table.
(c) These measures can also be found in the revenue measures summary table.
(d) Measures may not add due to rounding.
67
APPENDIX C: HISTORICAL AUSTRALIAN
GOVERNMENT DATA
Appendix C reports historical data for selected fiscal aggregates of the Australian
Government general government sector.
DATA SOURCES
Data are sourced from Australian Government Final Budget Outcomes, the Australian
Bureau of Statistics (ABS) and Australian Government Consolidated Financial Statements.
•
Accrual data from 1996-97 onwards, and cash data and net debt data from
1999-2000 onwards are sourced from Australian Government Final Budget Outcomes.
Back-casting adjustments for accounting classification changes and other revisions
have been made from 1998-1999 onwards where applicable.
•
Cash data prior to 1999-2000 are sourced from ABS data, which have been
calculated using methodology consistent with that used for later years in
ABS cat. no. 5512.0 Government Finance Statistics.
•
Net debt data prior to 1999-2000 are from ABS cat. no. 5512.0 Government Finance
Statistics 2003-04 in 1998-99, ABS cat. no. 5501.0 Government Financial
Estimates 1999-2000 and ABS cat. no. 5513.0 Public Sector Financial Assets and
Liabilities 1998 in 1987-88 to 1997-98, and Treasury estimates (see Treasury’s
Economic Roundup, Spring 1996, pages 97-103) prior to 1987-88.
COMPARABILITY OF DATA ACROSS YEARS
The data set contains a number of structural breaks owing to accounting classification
differences and changes to the structure of the budget which cannot be eliminated
through back-casting because of data limitations. These breaks can affect the
comparability of data across years, especially when the analysis is taken over a large
number of years. Specific factors causing structural breaks include:
•
from 2005-06 onwards, underlying Government Finance Statistics (GFS) data are
provided by agencies applying Australian Accounting Standards (AAS) which
includes International Financial Reporting Standards (IFRS) as adopted in
Australia. Prior to 2005-06, underlying GFS data are based on data provided by
agencies applying AAS prior to the adoption of IFRS;
•
most recent accounting classification changes that require revisions to the historical
series have been back-cast (where applicable) to 1998-1999, ensuring that data are
69
Economic Statement
consistent across the accrual period from 1998-1999 onwards. However, because of
data limitations, these changes have not been back-cast to earlier years;
•
prior to 1999-2000, Australian Government general government sector debt
instruments are valued at historic cost, whereas from 1999-2000 onwards they are
valued at market prices (consistent with accrual GFS standards). This affects net
debt and net interest payments;
•
cash data up to and including 1997-98 are calculated under a cash accounting
framework, while cash data from 1998-99 onwards is derived from an accrual
accounting framework. 1 Although the major methodological differences associated
with the move to the accrual framework have been eliminated through
back-casting, comparisons across the break may still be affected by changes to some
data sources and collection methodologies;
•
changes in arrangements for transfer payments, where tax concessions or rebates
have been replaced by payments through the social security system. This has the
effect of increasing both cash receipts and payments, as compared with earlier
periods, but not changing cash balances. Changes in the opposite direction (tax
expenditures replacing payments) reduce both cash payments and receipts; and
•
classification differences in the data relating to the period prior to 1976-77 (which
means that earlier data may not be entirely consistent with data for
1976-77 onwards).
REVISIONS TO PREVIOUSLY PUBLISHED DATA
Under the accrual GFS framework and generally under AAS, flows are recorded in the
period in which they occurred. As a result, prior period outcomes may be revised for
classification changes relating to information that could reasonably have been expected
to be known in the past, is material in at least one of the affected periods, and can be
reliably assigned to the relevant period(s).
1
Prior to the 2008-09 Budget, cash data calculated under the cash accounting framework was
used up to and including 1998-99. In the 2008-09 Budget, cash data prior to 1998-99 was
replaced by ABS data derived from the accrual framework.
70
Economic Statement
DEFLATING REAL SPENDING GROWTH BY THE CONSUMER PRICE INDEX
The 2013 Economic Statement, including the historical series, calculates real spending
growth using the Consumer Price Index (CPI) as the deflator. This is also the
benchmark against which the Government’s fiscal strategy is based. Prior to the
2008-09 Budget the non-farm GDP (NFGDP) deflator was used and has therefore been
shown in this appendix for comparative purposes.
The use of the CPI, rather than the non-farm GDP deflator, provides a more accurate
depiction of real government spending growth, especially in the current economic
climate. The non-farm GDP deflator incorporates fluctuations in global commodity
prices which are not relevant for Government expenditures. Therefore, deflating
government spending by the non-farm GDP deflator distorts trends in real spending
growth.
DATA SOURCE FOR 2012-13
The fiscal estimates for 2012-13 in the historical series are as published in the
2013-14 Budget. The 2012-13 outcome will be published in the 2012-13 Final Budget
Outcome by 30 September 2013.
71
Economic Statement
Table C1: Australian Government general government sector receipts,
(a)
payments, net Future Fund earnings and underlying cash balance
Net Future
Payments(c)
Receipts(b)
Underlying
Fund
cash
earnings
balance(d)
Per cent
Per cent
Per cent
real growth
real growth
(NFGDP
Per cent
$m
of GDP
$m
(CPI)
deflator)(f)
of GDP
$m
$m
1970-71
8,290
20.6
7,389
na
na
18.3
-
901
2.2
1971-72
9,135
20.5
8,249
4.1
4.7
18.6
-
886
2.0
Per cent
of GDP
1972-73
9,735
19.6
9,388
7.7
7.8
18.9
-
348
0.7
1973-74
12,228
20.3
11,078
4.2
3.6
18.4
-
1,150
1.9
1974-75
15,643
22.0
15,463
19.9
14.5
21.7
-
181
0.3
1975-76
18,727
22.5
20,225
15.7
13.5
24.3
-
-1,499
-1.8
1976-77
21,890
22.8
23,157
0.6
1.9
24.1
-
-1,266
-1.3
1977-78
24,019
22.9
26,057
2.7
3.3
24.8
-
-2,037
-1.9
1978-79
26,129
22.0
28,272
0.3
2.8
23.8
-
-2,142
-1.8
1979-80
30,321
22.5
31,642
1.5
2.1
23.5
-
-1,322
-1.0
-0.1
1980-81
35,993
23.6
36,176
4.6
3.6
23.7
-
-184
1981-82
41,499
23.6
41,151
2.9
0.5
23.4
-
348
0.2
1982-83
45,463
24.0
48,810
6.3
6.2
25.8
-
-3,348
-1.8
1983-84
49,981
23.4
56,990
9.4
9.7
26.7
-
-7,008
-3.3
1984-85
58,817
25.0
64,853
9.1
8.4
27.5
-
-6,037
-2.6
1985-86
66,206
25.4
71,328
1.5
3.4
27.4
-
-5,122
-2.0
1986-87
74,724
26.2
77,158
-1.1
0.8
27.0
-
-2,434
-0.9
0.4
1987-88
83,491
25.7
82,039
-0.9
-0.3
25.3
-
1,452
1988-89
90,748
24.7
85,326
-3.1
-4.3
23.2
-
5,421
1.5
1989-90
98,625
24.4
92,684
0.6
1.7
22.9
-
5,942
1.5
1990-91
100,227
24.1
100,665
3.1
3.8
24.2
-
-438
-0.1
1991-92
95,840
22.6
108,472
5.7
6.0
25.6
-
-12,631
-3.0
1992-93
97,633
22.0
115,751
5.6
5.9
26.0
-
-18,118
-4.1
1993-94
103,824
22.2
122,009
3.5
4.3
26.1
-
-18,185
-3.9
1994-95
113,458
22.9
127,619
1.4
2.6
25.7
-
-14,160
-2.9
1995-96
124,429
23.5
135,538
1.9
3.3
25.6
-
-11,109
-2.1
1996-97
133,592
24.0
139,689
1.7
1.5
25.1
-
-6,099
-1.1
1997-98
140,736
23.9
140,587
0.6
-0.6
23.9
-
149
0.0
1998-99
152,063
24.5
148,175
4.1
4.7
23.8
-
3,889
0.6
1999-00
166,199
25.1
153,192
1.0
0.8
23.1
-
13,007
2.0
2000-01
182,996
25.9
177,123
9.1
10.7
25.1
-
5,872
0.8
2001-02
187,588
24.8
188,655
3.5
4.2
25.0
-
-1,067
-0.1
2002-03
204,613
25.5
197,243
1.4
1.6
24.6
-
7,370
0.9
2003-04
217,775
25.3
209,785
3.9
2.9
24.4
-
7,990
0.9
2004-05
235,984
25.6
222,407
3.5
1.9
24.1
-
13,577
1.5
2005-06
255,943
25.7
240,136
4.6
2.8
24.1
51
15,757
1.6
2006-07
272,637
25.2
253,321
2.5
0.6
23.4
2,127
17,190
1.6
2007-08
294,917
25.1
271,843
3.8
2.7
23.1
3,319
19,754
1.7
2008-09
292,600
23.3
316,046
12.7
10.3
25.2
3,566
-27,013
-2.2
2009-10
284,662
22.0
336,900
4.2
5.6
26.1
2,256
-54,494
-4.2
2010-11
302,024
21.5
346,102
-0.4
-3.1
24.7
3,385
-47,463
-3.4
72
Economic Statement
Table C1: Australian Government general government sector receipts, payments,
(a)
net Future Fund earnings and underlying cash balance (continued)
Net Future
Payments(c)
Receipts(b)
Underlying
Fund
cash
earnings
balance(d)
Per cent
Per cent
Per cent
real growth
Per cent
real growth
(NFGDP
Per cent
$m
of GDP
$m
(CPI)
deflator)(f)
of GDP
$m
$m
2011-12
329,874
22.4
371,032
4.8
5.4
25.2
2,203
-43,360
-2.9
2012-13(e)
350,410
23.2
367,286
-3.2
-0.4
24.3
2,501
-19,377
-1.3
of GDP
2013-14(e)
369,364
23.6
396,560
5.7
6.7
25.3
2,946
-30,142
-1.9
2014-15(e)
390,160
23.8
411,170
1.6
2.3
25.1
2,962
-23,972
-1.5
2015-16(p)
423,288
24.6
424,806
0.8
1.0
24.6
3,189
-4,708
-0.3
2016-17(p)
450,736
24.8
443,315
1.8
2.0
24.4
3,393
4,027
0.2
(a) Data have been revised in the 2013 Economic Statement to improve accuracy and comparability through
time.
(b) Receipts are equal to receipts from operating activities and sales of non-financial assets.
(c) Payments are equal to payments for operating activities, purchases of non-financial assets and net
acquisition of assets under finance leases.
(d) Underlying cash balance is equal to receipts less payments, less net Future Fund earnings. For the
purposes of consistent comparison with years prior to 2005-06, net Future Fund earnings should be
added back to the underlying cash balance.
(e) Estimates.
(f) Real spending growth using the non-farm GDP deflator has not been used as the relevant measure of
real spending growth since 2007-08, and is included for comparative purposes only.
(p) Projections.
73
Economic Statement
Table C2: Australian Government general government sector taxation receipts,
(a)
non-taxation receipts and total receipts
Taxation receipts
Non-taxation receipts
Total receipts(b)
Per cent
Per cent
Per cent
of GDP
$m
$m
of GDP
$m
of GDP
20.6
17.8
1,097
2.7
8,290
7,193
1970-71
2.8
9,135
20.5
1,240
17.8
1971-72
7,895
19.6
9,735
2.7
8,411
16.9
1,324
1972-73
20.3
1,396
2.3
12,228
18.0
10,832
1973-74
15,643
22.0
2.1
1,502
19.9
1974-75
14,141
22.5
18,727
16,920
20.3
1,807
2.2
1975-76
2,176
2.3
21,890
22.8
20.5
19,714
1976-77
2.5
24,019
22.9
2,591
1977-78
21,428
20.4
22.0
26,129
23,409
19.7
2,720
2.3
1978-79
2,848
2.1
30,321
22.5
20.4
27,473
1979-80
35,993
23.6
2.2
3,352
1980-81
32,641
21.4
23.6
41,499
21.6
3,619
2.1
37,880
1981-82
2.3
45,463
24.0
4,438
21.7
1982-83
41,025
49,981
23.4
2.4
1983-84
44,849
21.0
5,132
25.0
52,970
22.5
5,847
2.5
58,817
1984-85
25.4
66,206
22.6
7,365
2.8
58,841
1985-86
26.2
2.9
74,724
8,257
66,467
23.3
1986-87
83,491
25.7
8,415
2.6
23.1
1987-88
75,076
90,748
24.7
7,296
2.0
83,452
22.7
1988-89
24.4
1.9
98,625
22.4
7,852
1989-90
90,773
100,227
24.1
7,488
1.8
1990-91
92,739
22.3
95,840
22.6
20.6
8,476
2.0
1991-92
87,364
2.0
97,633
22.0
88,760
20.0
8,873
1992-93
22.2
20.0
10,462
2.2
103,824
1993-94
93,362
113,458
22.9
8,537
1.7
104,921
21.1
1994-95
23.5
1.6
124,429
21.8
8,729
1995-96
115,700
24.0
1.6
133,592
124,559
22.4
9,033
1996-97
23.9
140,736
22.2
9,752
1.7
1997-98
130,984
152,063
24.5
22.3
13,643
2.2
1998-99
138,420
25.1
2.2
166,199
1999-00
151,313
22.9
14,887
1.8
182,996
25.9
2000-01
170,354
24.1
12,641
24.8
12,481
1.7
187,588
2001-02
175,108
23.2
204,613
25.5
24.0
12,482
1.6
2002-03
192,131
11,683
1.4
217,775
25.3
206,091
24.0
2003-04
25.6
1.4
235,984
24.2
12,669
2004-05
223,314
255,943
25.7
14,728
1.5
2005-06
241,215
24.2
272,637
25.2
23.8
15,245
1.4
2006-07
257,392
25.1
16,540
1.4
294,917
2007-08
278,376
23.7
23.3
19,973
1.6
292,600
272,627
21.7
2008-09
1.8
284,662
22.0
260,973
20.2
23,689
2009-10
21,185
1.5
302,024
21.5
2010-11
280,839
20.0
1.4
329,874
22.4
309,943
21.0
19,931
2011-12
23.2
24,113
1.6
350,410
2012-13(e)
326,297
21.6
1.4
369,364
23.6
2013-14(e)
348,040
22.2
21,325
1.4
390,160
23.8
2014-15(e)
367,351
22.5
22,809
24.6
24,817
1.4
423,288
2015-16(p)
398,471
23.1
24.8
2016-17(p)
427,936
23.6
22,800
1.3
450,736
(a) Data have been revised in the 2013 Economic Statement to improve accuracy and comparability through
time.
(b) Receipts are equal to receipts from operating activities and sales of non-financial assets.
(e) Estimates.
(p) Projections.
74
Economic Statement
Table C3: Australian Government general government sector net debt and net
(a)
interest payments
Net debt(b)
Net interest payments(c)
Per cent
Per cent
of GDP
of GDP
$m
$m
0.9
-0.5
-189
344
1970-71
-0.6
-1.1
-245
-496
1971-72
-0.5
-1.6
-252
-790
1972-73
-0.5
-3.1
-286
-1,851
1973-74
-0.3
-2.7
-242
-1,901
1974-75
-0.4
-0.4
-330
-341
1975-76
-62
898
-0.1
1976-77
0.9
4
2,896
0.0
1977-78
2.8
254
4,983
0.2
1978-79
4.2
440
6,244
0.3
1979-80
4.6
620
6,356
0.4
1980-81
4.2
5,919
680
0.4
1981-82
3.4
9,151
896
4.8
0.5
1982-83
16,015
1,621
7.5
0.8
1983-84
2,813
21,896
9.3
1.2
1984-85
3,952
26,889
10.3
1.5
1985-86
4,762
29,136
10.2
1.7
1986-87
4,503
27,344
1.4
8.4
1987-88
4,475
21,981
1.2
6.0
1988-89
4,549
16,123
1.1
4.0
1989-90
3,636
16,915
0.9
4.1
1990-91
3,810
31,041
0.9
7.3
1991-92
55,218
3,986
0.9
12.4
1992-93
5,628
70,223
1.2
1993-94
15.0
1.5
1994-95
83,492
16.8
7,292
18.1
8,861
1.7
1995-96
95,831
9,489
1.7
96,281
17.3
1996-97
8,279
1.4
82,935
14.1
1997-98
8,649
1.4
1998-99
72,065
11.6
7,514
1.1
1999-00
53,869
8.1
0.9
6.0
6,195
2000-01
42,719
0.7
5,352
2001-02
38,180
5.1
0.5
29,047
3.6
3,758
2002-03
0.4
2.6
3,040
2003-04
22,639
0.3
1.2
2,502
2004-05
10,741
0.2
-0.5
2,303
2005-06
-4,531
0.0
2006-07
-29,150
-2.7
228
-0.1
2007-08
-44,820
-3.8
-1,015
-0.1
-1,196
2008-09
-16,148
-1.3
0.2
2,386
2009-10
42,283
3.3
0.3
2010-11
84,551
6.0
4,608
0.4
147,334
10.0
6,609
2011-12
0.5
2012-13(e)
161,603
10.7
8,238
11.7
8,351
0.5
2013-14(e)
184,065
2014-15(e)
212,246
13.0
9,485
0.6
219,114
12.7
11,508
0.7
2015-16(p)
0.5
2016-17(p)
217,634
12.0
9,969
(a) Data have been revised in the 2013 Economic Statement to improve accuracy and comparability through
time.
(b) Net debt is equal to the sum of deposits held, government securities, loans and other borrowing, minus
the sum of cash and deposits, advances paid and investments, loans and placements.
(c) Net interest payments are equal to the difference between interest paid and interest receipts.
(e) Estimates.
(p) Projections.
75
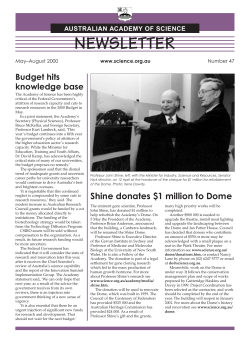
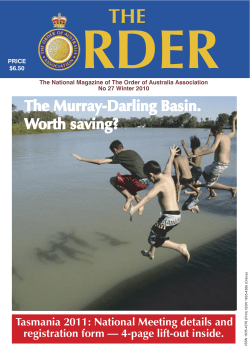
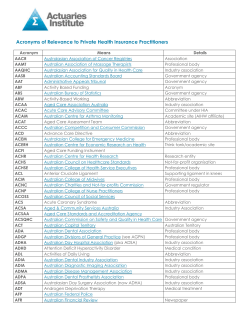
© Copyright 2026