
Economic impacts of an Australia– United States Free Trade Area
Economic impacts of an Australia– United States Free Trade Area Prepared for Department of Foreign Affairs and Trade Centre for International Economics Canberra & Sydney June 2001 The Centre for International Economics is a private economic research agency that provides professional, independent and timely analysis of international and domestic events and policies. The CIE’s professional staff arrange, undertake and publish commissioned economic research and analysis for industry, corporations, governments, international agencies and individuals. Its focus is on international events and policies that affect us all. The CIE is fully self-supporting and is funded by its commissioned studies, economic consultations provided and sales of publications. The CIE is based in Canberra and has an office in Sydney. © Centre for International Economics 2001 This work is copyright. Persons wishing to reproduce this material should contact the Centre for International Economics at one of the following addresses. CANBERRA Centre for International Economics Ian Potter House, Cnr Marcus Clarke Street & Edinburgh Avenue Canberra ACT GPO Box 2203 Canberra ACT Australia 2601 Telephone +61 2 6248 6699 Facsimile +61 2 6247 7484 Email [email protected] Website www.intecon.com.au SYDNEY Centre for International Economics Level 8, 50 Margaret Street Sydney NSW GPO Box 397 Sydney NSW Australia 1043 Telephone +61 2 9262 6655 Facsimile +61 2 9262 6651 Email [email protected] Website www.intecon.com.au Economic impacts of an Australia–United States Free Trade Area Authors: Leon Berkelmans, Centre for International Economics, Canberra Lee Davis, Centre for International Economics, Sydney Warwick McKibbin, Australian National University and The Brookings Institute Andrew Stoeckel, Centre for International Economics, Canberra Centre for International Economics Canberra & Sydney June 2001 iii Contents Summary 1 vii Background 1 Australia–United States trade agreement 1 Australia–United States trade 3 4 3 An Australia–United States trade area 3 Trade between Australia and the United States 4 Scope of trade issues covered 6 Existing barriers to trade 10 Simulating the gains from reform using APG-Cubed 19 The APG-Cubed model 19 Results 21 Effects on the United States 24 Welfare and production gains 25 Gains to other countries 26 Trade creation and trade diversion 26 Full versus partial liberalisation 26 Simulating the gains from a bilateral free trade agreement using GTAP 30 Global Trade Analysis Project 30 Results from GTAP modelling 34 APPENDIXES 45 A Measures of post-Uruguay Round tariff and nontariff rates of protection 47 B The GTAP and APG-Cubed models 79 C Sugar 90 References 98 ECONOMIC IMPACTS OF AN AUSTRALIA–UNITED STATES FTA iv CONTENTS Boxes, charts and tables 1 2 ECONOMIC The gains from full implementation of an Australia–United States FTA Summary of relative importance of trade between Australia and US viii x 2.1 Contribution to AUSFTA 3 2.2 Bilateral and external trade for Australia and the United States 1999 4 2.3 Australia’s trade with the United States 5 2.4 Distribution of tariff rates, 1999 US 11 2.5 Distribution of tariff rates, 1998 Australia 11 2.6 The Price Gap Method 16 2.7 Post-Uruguay tariff rates used for simulations 17 3.1 Economy and industry coverage of Asia Pacific G-Cubed 20 3.2 Tariff levels used for APG-Cubed calculations 21 3.3 APG-Cubed results for Australia 22 3.4 APG-Cubed results for the United States 23 3.5 The gains from full implementation of a Australia–United States FTA 25 3.6 Changes to real GDP for third countries/groups 27 3.7 Change in world exports 28 3.8 Comparison of full versus partial liberalisation 29 3.9 Net present value of real consumptionUS$ billion 29 4.1 Aggregated GTAP regions and sectors 31 4.2 Tariff rates used in GTAP simulations 33 4.3 Aggregate effects of AUSFTA 35 4.4 Dairy sector liberalisation by the United States 38 4.5 Australian sectoral changes 39 4.6 United States’ sectoral changes 41 4.7 Aggregate effects for third countries 42 4.8 Trade creation and trade diversion — value of exports 43 4.9 US exports to Australia and trade diversion 44 4.10 Australian exports to the United States and trade diversion 44 A.1 Post-Uruguay tariff rates used for simulations 49 A.2 Australian music content requirements for radio 65 IMPACTS OF AN AUSTRALIA–UNITED STATES FTA v CONTENTS A.3 Australian content and children’s television standards compliance 1999 66 A.4 The Baldwin and Richardson methodology 74 A.5 Australian restrictions in services trade 76 A.6 United States restrictions in services trade 77 B.1 Mapping between databases — GTAP regions 83 B.2 Mapping between databases — GTAP sectors 84 B.3 Economy and industry coverage of G-Cubed (Asia Pacific) 85 B.4 Relationship between G-Cubed (Asia Pacific) and SIC sectors for agriculture and non-durable manufacturing 86 Effects of a FTA if there are no imports into the US from other countries 92 Effect on exporting countries if imports into the US from other countries are discontinued. 93 Effect on importing countries if imports into the US from other countries are discontinued. 93 C.4 Effects of a FTA if imports from other countries continue 94 C.5 Effect on exporting countries if imports into the US from other countries remain. 95 Effect on importing countries if imports into the US from other countries remain. 95 C.1 C.2 C.3 C.6 ECONOMIC IMPACTS OF AN AUSTRALIA–UNITED STATES FTA vii Summary Modelling results A free trade agreement (FTA) between Australia and the United States has been proposed. This study models the measurable economic gains from trade for this FTA. It should be noted at the outset that this is a study that has not sought to determine Australia’s negotiating priorities or positions. Both Australia and the United States gain from the formation of a bilateral free trade agreement modelled here. – Welfare (as measured by real household consumption) and production (as measured by GDP) rise for both countries over time, with the removal of barriers to trade assumed to be over a five year period. – Using the APG-Cubed model, by 2006, when full implementation of the FTA is assumed, Australian welfare could be nearly 0.3 per cent above what it might otherwise be. This continues to rise to 0.4 per cent by 2010 and 0.5 per cent by 2020. For the United States, welfare peaks in 2006 at 0.016 per cent above what it otherwise might have been. – Australian GDP could be 0.33 per cent higher by 2006. This gap would then continue to widen, levelling off by 2010 at 0.4 per cent of GDP — an annual increase in that year of nearly US$2 billion. – US GDP, even though rising only by 0.02 per cent above what it might otherwise be, still amounts to an annual increase of US$2.1 billion in 2006. Expressing the stream of net benefits over the next 20 years in net present value terms, the gain in welfare to Australia could be US$9.9 billion and for the United States US$10.3 billion (chart 1). – For GDP, the net present value of benefits is US$15.5 billion for Australia and US$16.9 billion for the United States. ECONOMIC IMPACTS OF AN AUSTRALIA–UNITED STATES FTA viii SUMMARY 1 The gains from full implementation of an Australia–United States FTA Net present valuea, 1999 (US$ billion) Real GDP Real consumption 16.9 15.5 10.3 9.9 Australia a USA Discounted by model generated real interest rate. Data source: Centre for International Economics; APG-Cubed simulations. In terms of the share of GDP, the gains to Australia are bigger. This reflects the greater relative importance of the bilateral trade to Australia than the United States, the fact that a couple of key sectors, such as sugar and dairy stand to expand with the removal of the United States’ tariffs, and a slightly higher average barrier removed in Australia. For both economies the rise in exports is greater than imports and Australia’s current account (expressed as a percentage of GDP) improves by 0.9 per cent, while there is a negligible change for the United States. Overall, world exports rise showing that trade creation is greater than trade diversion as a result of forming the free trade area. – The GTAP (Global Trade Analysis Project) model captures all trade and resource use interactions in an economy-wide setting and allows detailed commodity effects to be reported. Using this model, the important points are as follows. – ECONOMIC IMPACTS New Zealand is one of the main third party beneficiaries since its trade with Australia is relatively important and so it benefits from Australia’s expansion. In addition, New Zealand picks up some of the trade diversion in dairy products as Australia shifts product from Asian markets to the United States. OF For Australia the largest gains are in sugar and dairy. The price of sugar in Australia could rise by 13 per cent and the output of raw sugar could rise by 7.8 per cent. Exports of sugar to the United States could rise by 2 550 per cent, but that is off a very low base of AN AUSTRALIA–UNITED STATES FTA ix SUMMARY just 85 000 tonnes. This represents an initial increase of US$442 million per annum. Even though Australian exports to the United States rise considerably, this still represents a small share of the United States market and has a small impact on US prices and output. Over time, the impact would be larger. – For the United States the main gain is in the manufacturing sector. Exports of motor vehicles and parts to Australia could rise by 46.6 per cent and exports of metal products could rise by 25.2 per cent. All of the above results have assumed complete removal of all identified barriers to trade between Australia and the United States. Whether this is politically feasible or not has not been the subject of this study. To reflect the reality that less than complete liberalisation of all sectors might materialise if a negotiation of an FTA should be undertaken, simulations of partial liberalisation were also calculated. A 50 per cent removal of barriers gives roughly half the full liberalisation results and, similarly, a 25 per cent removal of barriers gives roughly one quarter of the potential gain. These findings need to be considered in light of the fact that FTAs can have economic elements and effects other than simply removing trade barriers — for example, mechanisms to promote linkages and facilitate trade. In 1999 Australia exported US$8.1 billion of goods and services to the United States, while the United States exported US$15.2 billion worth to Australia. Trade with the United States is far more important to Australia in a relative sense than is Australia’s trade to the United States (see chart 2). Background – Australian exports to the United States account for around 11 per cent of total Australian exports and the United States is the source of nearly one fifth of Australia’s imports. – By contrast, United States exports to Australia account for just 1.6 per cent of total United States exports and Australia is the source of only 0.7 per cent of United States imports. ECONOMIC IMPACTS OF AN AUSTRALIA–UNITED STATES FTA x SUMMARY 2 Summary of relative importance of trade between Australia and US Australia United States Exports to Australia US$15.2 bn Exports to the US US$8.1 bn % of total Imports from US as % of total Imports from Australia as % % of of total total 1.6% 0.7% 19% 11% Data source: Centre for International Economics. ECONOMIC Both the United States and Australia are among the most open economies in the world. Average tariffs for the United States are 2.8 per cent, with over a third of all tariff lines duty free. However, the United States does maintain a number of specific tariffs and tariff rate quotas that are not reflected in this figure. All but two of the United States 10 173 tariff lines are bound by the WTO Agreements. Australia’s tariff regime is similarly open with rates varying between 0 and 5 per cent for 85 per cent of items and an average tariff rate of 3.8 per cent. Ninety-four per cent of Australia’s tariff lines are bound by the WTO Agreements. Notwithstanding the relative openness of the United States and Australian economies by world standards, there are some significant sectors where there are major barriers to bilateral trade. IMPACTS – For the United States the main barriers to trade are in sugar, dairy, commercial vehicles and shipping (both ships and domestic transport services). The barriers to Australian sugar exports amount to a tariff equivalent of 80 per cent and for dairy exports the tariff equivalent amounts to nearly 24 per cent. There are some other barriers to trade covering lamb, cotton, metals and financial services, among others. – For Australia the main barriers to trade are in motor vehicles, textiles, clothing and footwear. Other barriers to trade are in cheese, wood, chemicals and financial services, among others. Media local content rules and foreign investment screening are difficult to model and have not been included. OF AN AUSTRALIA–UNITED STATES FTA xi SUMMARY This study quantifies the size of the measurable bilateral trade barriers and examines the economic costs and benefits of their removal. – Trade barriers that can be removed in a bilateral context (for example, tariffs and quotas) are considered. Domestic subsidies, which can also impact on bilateral trade, and could potentially be considered in an FTA, are not included in this study. Overall, there are positive economic gains for Australia and the United States as a result of forming a bilateral free trade area. The undertaking would create more trade than it would divert for the world. Third countries also gain. These economic gains need to be placed in perspective of the overall political and strategic interests of Australia and the United States, which has not been part of this study. ECONOMIC IMPACTS OF AN AUSTRALIA–UNITED STATES FTA 1 1 Background Australia–United States trade agreement Australia and the United States have announced their interest in looking at the possibility of a bilateral free trade agreement (FTA). The idea is not a new one. A major review of the implications for Australia from entering into such an agreement was conducted by Richard Snape in 1986 (Snape 1986). Australia has made good progress on reducing most of its own trade barriers. However, externally significant barriers to agricultural exports remain. On top of that, there has been a lack of progress towards another multilateral round of WTO talks. These factors, and the reported signalling by President George W Bush (Pearson 2001) that he is interested in a free trade agreement provided ‘everything is on the table’, have led to renewed interest in pursuing a free trade agreement with the United States. This study needs to be kept in perspective. There are a host of issues to consider in assessing a free trade agreement. One is the benefits and costs that such an agreement might bring. Other important factors are the political aspects. For example, how likely such an agreement would be, what impact would there be on third countries, and how would it affect Australia’s regional and strategic interests? This study, commissioned by the Department of Foreign Affairs and Trade, focuses on the measurable economic costs and benefits such an agreement might bring. A separate study, also commissioned by the Department of Foreign Affairs and Trade, is examining the broader implications of such an agreement on bilateral trade and economic linkages, Australia’s trade policy interests, and other dimensions of the relationship between the two countries. In looking at the measurable economic effects of the proposed free trade agreement, a broad economy-wide perspective is the preferred route for analysis. Such an analysis can capture all of the flow-on effects that a series of partial analyses of key commodity groups misses by definition. This ECONOMIC IMPACTS OF AN AUSTRALIA–UNITED STATES FTA 2 1 BACKGROUND issue can be important for analysing a broad policy change such as forming an FTA where in principle, ‘everything is on the table’. Two frameworks are used: one to capture the dynamic and macroeconomic effects of a FTA over time (chapter 3) and the other to capture detail of the commodities and services traded (chapter 4), that an FTA of this nature might imply. First, (chapter 2) a review of existing trade between the United States and Australia is made and this is placed in some global perspective. Also, the main barriers to trade between the countries are discussed. More detail behind the origin and size of those barriers and, in some cases, the conversion into tariff equivalent is given in appendix A. ECONOMIC IMPACTS OF AN AUSTRALIA–UNITED STATES FTA 3 2 Australia–United States trade TRADE LIBERALISATION can deliver significant economic benefits and welfare gains. Many countries have decided to expand on the multilateral liberalisation conducted under the auspices of the GATT and WTO through unilateral and bilateral trade reform. A free trade agreement between Australia and the United States (AUSFTA) would be a continuation of the past efforts of both countries toward more open trade regimes. An Australia–United States trade area If the free trade area between Australia and the United States were to be implemented today, it would be a large trade area. The FTA would encompass a market of over 295 million people, with a combined gross domestic product (GDP) of over US$10 000 billion, or around one-third of world GDP. The United States would overwhelmingly dominate AUSFTA, as shown in table 2.1. It is important to put the relative size of Australia into perspective. Australia’s national output is around 4 per cent of United States GDP. With uninhibited access to such a large market as the United States, the FTA has potential to deliver welfare gains to Australia. For the United States, however, the benefits from AUSFTA may be more reserved. The size of economic benefits accruing to both parties will depend on: the relative importance of each country as a trading partner; current trade patterns; the size of existing trade barriers; and a 2.1 Contribution to AUSFTA Population GDP GDP per capita Unit Australia United States AUSFTA Millions US$ billion US$ 19 382 19 900 276 9 963 36 100 295 10 345 Na a Statistics refer to year 2000. Source: DFAT Country Economic Profile fact sheets. ECONOMIC IMPACTS OF AN AUSTRALIA–UNITED STATES FTA 4 2 AUSTRALIA–UNITED STATES TRADE the extent to which the FTA will stimulate trade creation as opposed to trade diversion. We should also note that FTAs can have economic elements and effects other than simply removing trade barriers — for example, mechanisms to promote linkages and facilitate trade. However, we have not included these considerations in our study. Trade between Australia and the United States The extent of merchandise and services trade between Australia and the United States is summarised in chart 2.2. Total trade between Australia and the United States was valued at US$23.3 billion in 1999. Australian exports to the United States account for around 2 per cent of Australia’s national output (or GDP) and for around 11 per cent of total Australian exports. These exports, worth US$8.1 billion to Australia, represent just 0.7 per cent of United States imports. United States exports to Australia account for under 0.2 per cent of US national output and 1.6 per cent of total US exports. Therefore, bilateral trade between the United States and Australia is relatively more important to Australia than it is to the United States. 2.2 Bilateral and external trade for Australia and the United States 1999 United States GDP US$9 299 billion Australia GDP US$398 billion US$15.2 billion n US $6 5.5 n lio bil 4.3 21 b il lio n US $6 6.6 $1 US US $9 52 .4 bil lio b il lio n US$8.1 billion Rest of World GDP US$20 917 billion Data source: DFAT 2000a and IMF 2000. ECONOMIC IMPACTS OF AN AUSTRALIA–UNITED STATES FTA 5 2 AUSTRALIA–UNITED STATES TRADE Australia’s trading relationship with the United States is shown in more detail in chart 2.3. Australia runs a balance of trade deficit with the United States, with imports from the US exceeding exports to the US by around US$7.1 billion in 1999. Merchandise trade accounts for around 90 per cent of the trade deficit (US$6.4 billion) and services for the remaining 10 per cent (US$0.7 billion). This trade imbalance is reflected in part by the United States being the destination for 11 per cent of Australia’s exports (the second largest single country export market after Japan) but is the source of 19 per cent of imports (largest single country import source). Australia is the destination for 1.6 per cent of US exports (the 15th largest US export market) and accounts for 0.7 per cent of US imports (29th largest import source). 2.3 Australia’s trade with the United States 1999 Australian exports (% ) Other 37 Automotive 4 EU 14 US 11 NZ ASEAN(10) 13 7 Japan 18 US imports (% ) Products exported to the US (% ) Australian imports (% ) NAFTA 32 Petroleum 7 Services Japan 12 33 Other 17 Beef 7 Other mfg 19 Metals 6 Other ag. EU 22 Australia 0.7 5 Alcohol 2 China Other 25 Products imported from the US (% ) 9 US exports (% ) Other 27 NAFTA 36 Other 4 ASEAN(10) 15 US 19 Japan 9 Other mfg Services 48 20 Australia 1.6 Agriculture EU 23 NZ 4 Japan 12 Aviation 11 2 Automotive 4 Computers 6 Telecom. 4 Other 24 EU 25 China 4 Data source: DFAT 2000b, US Depart. Of Commerce 2001, CIE estimates. ECONOMIC IMPACTS OF AN AUSTRALIA–UNITED STATES FTA 6 2 AUSTRALIA–UNITED STATES TRADE From chart 2.3 it can be seen that 18 per cent of Australia’s exports to the United States are primary products — beef (7 per cent), other agriculture (5 per cent) and metals (6 per cent). However, only 2 per cent of Australia’s imports from the US are primary products. High-tech products — aviation, computers and telecommunications equipment — account for 21 per cent of Australia’s imports from the US. The composition of trade profiled in chart 2.3 reflects in part each country’s areas of comparative advantage. But it also reflects the effects of barriers to trade. For example, despite being one of the world’s lowest cost dairy and sugar producers and exporters, Australian exports of dairy and sugar to the US represents just 0.38 and 0.01 per cent (respectively) of total Australian exports to the US. High, and in the case of sugar, almost prohibitive, barriers to trade curtail Australian exports of these products to the US. Scope of trade issues covered There are many trade issues in any bilateral trading relationship. These issues cover formal barriers to trade — such as tariffs and non-tariff measures like quotas — as well as other areas of trade such as quarantine, subsidies and other forms of protection such as licensing requirements. As is explained below, and further elaborated in appendix A, it is not possible to incorporate all of these trade issues in this study. Subsidies While this review does not pre-judge the final outcome of any FTA negotiation and while it assumes that ‘everything is on the table’, for some issues that affect either Australia’s or the United States’ trade interests it is simply not possible to isolate the effect to a bilateral mechanism which can be removed on a preferential basis — the basis of a free trade agreement. A good example would be domestic subsidies for agriculture. The United States maintains a small tariff against world cotton imports but also offers significant subsidies to domestic cotton producers. Both of these interventions by the United States are contrary to the interests of Australia’s cotton producers (as well as being contrary to the interests of United States consumers and taxpayers). However, to model the effects of forming a preferential free trade agreement only removal of the tariff against cotton imports from Australia can be captured. Removal of domestic production subsidies to cotton — while a potentially good thing for both the US and Australia — would amount to unilateral reform by the United States. It has been possible to form an agreement on some subsidy arrangements in bilateral negotiations, for example, the European Union ECONOMIC IMPACTS OF AN AUSTRALIA–UNITED STATES FTA 7 2 AUSTRALIA–UNITED STATES TRADE has undertaken not to export beef that has benefited from export subsidies to Asian markets of commercial value to Australia under the Andriessen assurance. In that case the effect of the subsidy could be isolated to particular parties. However, we can only speculate on the outcomes of negotiations in regard to these measures, so they are not included in our analysis. Quarantine Australia and the United States maintain quarantine regimes to protect their domestic production against the introduction of pests, disease and weeds. Sometimes the charge is made that these quarantine restrictions amount to protection and there have been some disputes over the use of such measures. The United States has expressed concern that Australia keeps out chicken, pork, corn and Californian grapes unnecessarily. Similarly, Australia also has a list of products for which it is seeking access to the United States market, including tomatoes, citrus, cherries, oats, honey bees and feeder cattle. However, Australia and the United States are signatories to the Sanitary and Phytosanitary Agreement of the Uruguay Round and quarantine access is judged based on transparent risk assessment procedures. If quarantine measures are used as a form of nontariff protection, then that implies correct scientific risk assessments are not being done now. To compute ‘tariff equivalents’ of any alleged bogus quarantine restriction would require conducting a correct scientific risk assessment as set out in the Sanitary and Phytosanitary Agreement. That task is far beyond the scope of this exercise. That does not mean to say there may not be legitimate quarantine concerns, it is just that to quantify the impact of the removal of any quarantine protection requires measuring what that protection is, which is a difficult exercise in itself. In any case, the effects of the restrictions appear to be small in some circumstances. For example, in the absence of the quarantine restrictions, it is estimated that US$12 to US$19 million worth of Californian grapes would be exported from the US to Australia (United States Trade Representative 2001). Intellectual property In July 1998, the Australian Federal Government made it legal for retailers to import compact discs without permission from the major recording companies (which have strong links to parent United States companies), in a practise known as parallel importing. The United States expressed concern in regard to this practise in the 2001 National Trade Estimate Report on Foreign Trade Barriers (United States Trade Representative, 2001). It could therefore transpire that United States interests request Australia to negate ECONOMIC IMPACTS OF AN AUSTRALIA–UNITED STATES FTA 8 2 AUSTRALIA–UNITED STATES TRADE parallel imports in a free trade agreement, which would not be in the interests of Australian consumers. In regard to other items, the Australian Government introduced the Copyright Amendment (Parallel Importation) Bill 2001 on 28 February. This gives effect to the Government’s policy of repealing the importation provisions as they apply to legitimately produced books, periodicals, printed music, and software products. However, Labor is likely to oppose the amendment (Gordon 2001) so passage through the Senate is not guaranteed. Parallel imports are therefore not a formal part of this analysis. Single desk Australia maintains single desk (export monopoly) arrangements for wheat, sugar and barley (scheduled to be removed). In past negotiations on agriculture, under the auspices of the WTO, the United States has argued strongly for the removal of these arrangements and they have also been mentioned in the 2001 National Trade Estimate Report. The United States may therefore raise this issue as part of the bilateral negotiations. However, for the purposes of measuring the impact of an FTA, these single desk arrangements are in the same category as domestic subsidies on agriculture. It is impossible to isolate, in a preferential sense, that component of single desk impacting on the interests of the bilateral trading partner. Moreover, any change to single desk arrangements, would have marginal impact on the estimates — probably of the order 1 or 2 per cent positive or negative — and so no change has been assumed. Rules of Origin In any bilateral free trade agreement rules of origin are crucial. Without rules of origin, a bilateral FTA could become a de facto unilateral liberalisation (Japanese cars could enter Australia via the United States). Therefore, rules of origin are necessary to limit the effects to goods and services actually produced in each of the countries. But this raises questions of what is meant by ‘Made in America’ or ‘Made in Australia’? Precedents can be found in Australia’s and the United States’ existing free trade agreements, namely the North American Free Trade Agreement (NAFTA) and the Australia New Zealand Closer Economic Relations Trade Agreement (ANZCERTA or CER). The rules governing preferential rates of duty in the CER agreement are quite simple. Goods are divided into three categories: ECONOMIC IMPACTS OF AN AUSTRALIA–UNITED STATES FTA 9 2 AUSTRALIA–UNITED STATES TRADE 1. goods wholly the produce of Australia or New Zealand (unmanufactured raw products1); 2. goods wholly manufactured in the country from one or more of the following: 3. – unmanufactured raw products (of any country); – materials wholly manufactured in Australia or New Zealand or both; – materials determined to be raw materials of Australia or New Zealand; and goods partly manufactured in the country. Goods in categories 1 and 2 are entitled to preferential rates of duty. To qualify for preferential rates of duty, goods in category 3 must satisfy the following criteria: the last process of manufacture must be performed by the manufacturer in either Australia or New Zealand; and not less than 50 per cent of the factory cost must represent qualifying expenditure. The last of these is referred to as the 50 per cent rule. Qualifying expenditure is the expenditure on Australian or New Zealand inputs, including wages, manufactured inputs, raw materials, etc. Factory cost is total expenditure on materials, qualifying labour and overheads. There are, however, some differences in the application of this rule between the two countries. On the other end of the spectrum, the Rules of Origin governing NAFTA are long and complicated. There are equivalent rules to the 50 per cent rule scattered through the document, but there are also provisions stating what transformations must occur to the good at the HS 8-digit level. This is very onerous and complicated. For example, try reading the rules of origin provisions of NAFTA in regard to a single subheading such as HS4202.22 (Department of Foreign Affairs and International Trade 2001). The detail in these Rules of Origin can be crucial to the consequences of the entire free trade agreement. However, this should be viewed in light of the fact that the most significant barriers to trade between the two countries are in dairy and sugar for the United States and for Australia, motor vehicles 1 Unmanufactured raw products are defined in Australian legislation under section 4 of the Customs Act 1904, and in New Zealand under Customs Regulation 70. ECONOMIC IMPACTS OF AN AUSTRALIA–UNITED STATES FTA 10 2 AUSTRALIA–UNITED STATES TRADE and textiles. Agricultural products from Australia, which represents a large portion of the raw material that is exported, is unlikely to be caught up in, say, a 50 per cent rule of origin as land is such a large component of value added. In regard to manufactured exports, the issue is more complicated. Manufactured goods can involve significant imports of components. Take the example of fast ferries. Many of the inputs used in their construction are imported, such as the aluminium sheeting, engines, generators, propellers and electronics. However, some of these engines come from the United States, so these inputs would contribute positively to some qualifying expenditure variable. The same issue would be raised for say Australian motor car components used in the manufacturing process in the US. The level of detail of the data, and the analysis that is required to assess where rules of origin might matter in manufactures is far beyond the scope of this study. However, it is acknowledged that detail could have a major impact in some cases. Existing barriers to trade Overview Both the Australian and United States markets are acknowledged to be among the most open and transparent economies in the world (WTO 1998, 1999). It is estimated that the average tariff rate for the United States is 2.8 per cent (World Bank 2001), and that 36.4 per cent of all tariff lines are duty free (chart 2.4 for the distribution of tariff lines as of 1999). It is noteworthy that all but two of the 10 173 tariff lines (at the HS 8 digit level) are bound by the WTO Agreement, the two exceptions are lines of crude petroleum. Specific tariffs are a feature of the US Tariff schedule, as well as the use of a number of Tariff Rate Quotas (TRQ) (both of these measures are not used in the calculation of the above average tariff rate). Australia’s tariff regime is similarly open with rates varying between 0 and 5 per cent for 85 per cent of our items and an average tariff rate of 3.8 per cent (World Bank 2001) (see chart 2.5 for the distribution of tariff rates as they stood in 1998.) As at 1 January 1998, approximately 99.7 per cent of Australia’s tariffs were ad valorem, and fifteen at the HS six-digit level were specific. Five of these lines were on cheese, where a tariff rate quota still applies. Ninety four per cent of tariff lines are bound as a result of the WTO Agreement (WTO 1998). ECONOMIC IMPACTS OF AN AUSTRALIA–UNITED STATES FTA 11 2 AUSTRALIA–UNITED STATES TRADE a 2.4 Distribution of tariff rates, 1999 US 40 35 Percentage 30 25 20 15 10 5 0 0 0-5 5-10 10-15 15-20 20-25 25-30 30-35 35-40 40-45 45-50 Tariff rate >50 a Data of last Trade Policy Review. Data source: WTO 1999. a 2.5 Distribution of tariff rates, 1998 Australia 50 Percentage 40 30 20 10 0 0 0-5 5-10 10-15 15-20 20-25 25-30 30-35 Tariff rate a Data of last Trade Policy Review. Data source: WTO 1998. Notwithstanding the fact that both economies are relatively open, there are some specific barriers of note. These barriers are examined in detail in appendix A. Included is an ad valorem equivalent of the non-tariff barriers where possible. The salient points are: ECONOMIC IMPACTS OF AN AUSTRALIA–UNITED STATES FTA 12 2 AUSTRALIA–UNITED STATES TRADE Main United States barriers to Australian exports Dairy products The United States maintains TRQ on the importation of a range of dairy products, with out-of-quota tariffs set at prohibitive levels. Under the WTO Agreements global cheese access was set at 140 000 tonnes, of which Australia was allocated 7000. In-quota tariffs range between 10 and 16 per cent and out-of-quota tariffs range between 60 and 65 per cent, depending upon the international spot price (the tariff rates are specific). CIE estimates that the tariff equivalent of these TRQ is around 20 per cent across cheese varieties. TRQ also exist on butter, butteroil and milk powder, with tariff equivalents of these TRQ ranging between 35 and 85 per cent. However, given that cheese production dominates this sector, a production-weighted tariff equivalent estimate for dairy products (excluding raw milk) would be somewhere near 20 per cent. In addition, there are some regulations in regard to fresh milk products that act as a barrier to trade. Some of these are rather old, such as the requirement under the Federal Milk Import Act 1927 that each herd supplying the United States market undertake a herd health test. Compliance with such regulations can be costly. Sugar TRQ also exist on sugar, with minimum global access set at 1.139 million tonnes. Australia’s quota for financial year 2000–01 was set at 87 408 tonnes, which is only a fraction of Australia’s 5 million tonnes of total exports. The in-quota tariff rate was US1.4606 c/kg (0.664 c/lb) and the outof-quota tariff rate is US33.87 c/kg (15.3 c/lb) in 2000. The operation of the quota heavily restricts Australia’s access to the United States market. These restrictions increase the long run price for sugar in the US to US18c/lb when the long run world price stands at US10c/lb. Textiles, Clothing and Footwear The US maintains quotas on imports of textile and clothing products of cotton, other vegetable fibres, wool, man-made fibres and silk blends from 45 countries, of which 37 are WTO members (although Australia is not one of these 45 countries and so its exports enjoy quota free access). These quotas are subject to the WTO Agreement on Textiles and Clothing (ATC), ECONOMIC IMPACTS OF AN AUSTRALIA–UNITED STATES FTA 13 2 AUSTRALIA–UNITED STATES TRADE which replaced the Multi-Fibre Arrangement (MFA). The ATC provides for the gradual and complete integration of clothing and textile products into the WTO by 1 January 2005. After this the tariff barriers, which are high relative to other US tariff barriers, can remain. Ships/boats, shipping services and the Jones Act The US Merchant Marine Act (the Jones Act) 1920, the Passenger Services Act 1886, and related laws severely restrict foreign access to the United States ship and shipping services market. These laws require that merchandise and passengers being transported by water between points in the United States travel on United States built, United States flagged, United States manned and United States citizen owned vessels. While Australia is not a major player in shipping services, we have a global market leadership position in high-speed catamaran ferries and are a significant exporter of recreational boats. Only fast ferries are affected by the Jones Act. However, as elaborated on in appendix A, the restriction is not completely prohibitive. Firstly, fast ferries can be used for external shipping services — for example, from Miami to the Carribean — where the Jones Act does not apply. Secondly, it may be possible to enter into joint ventures, and so take advantage of the fact that some construction can be performed in Australia. Incat and Austal have recently announced joint ventures with companies. In the case of Incat, this will allow up to 50 per cent of construction of ships used by the United States military to occur in Australia (Barbeliuk and Waterhouse 2000) thereby partially overcoming barriers in that market. Joint ventures also provide local marketing, reputation and contacts to United States customers. In any case, the true effect of the Jones Act can only be gauged by the detail of its rules of origin. For example, it stipulates that all major component parts of the hull and superstructure have to be built in the United States (Austrade 1999). As mentioned, rules of origin considerations are outside the scope of the report. Commercial vehicles There is a significant tariff on some commercial vehicles, for example pickups, of 25 per cent. However, the figures in the motor vehicles and parts sector have been import weighted (total imports have been used in this instance, not just imports from Australia), and as imports of these vehicles are not significant, the trade-weighted tariff is not high. ECONOMIC IMPACTS OF AN AUSTRALIA–UNITED STATES FTA 14 2 AUSTRALIA–UNITED STATES TRADE Government procurement The United States government procurement market is subject to a range of domestic preference legislation. The United States waives the provisions of this legislation for members of the WTO Agreement on Government Procurement (GPA). However, as Australia is not a party to the GPA it does not benefit from the waivers and even if Australia were a signatory, some provisions of the domestic reference legislation would continue to apply to limit access. In addition, the United States uses government procurement to promote the growth of small and medium enterprises (SMEs). These are subject to some degree of revision at the moment. Main Australian barriers to United States exports Textiles, clothing and leather Tariff rates are at a maximum of 25 per cent for apparel and certain finished textiles and 15 per cent for footwear and woven fabrics. However, there are also a number of lines at 0, 5 and 10 per cent. In fact just over 50 per cent of tariff lines in the three GTAP sectors of textiles, wearing apparel and leather products have the tariff rate set at 0 or 5 per cent. Motor vehicles and parts The tariff rates that apply to the automotive industry are: 15 per cent on passenger motor vehicles (PMV), PMV derivatives, original equipment components and replacement components; 5 per cent on light commercial vehicles and four-wheel drives and all components of these vehicles. There are also a small number of miscellaneous tariff lines that are duty free. The Foreign Investment Review Board Australia’s foreign investment policy provides for Government scrutiny of many proposed foreign purchases of Australian businesses and properties. The Government has the power under the Foreign Acquisitions and Takeovers Act 1975 to block proposals that are determined to be contrary to the ECONOMIC IMPACTS OF AN AUSTRALIA–UNITED STATES FTA 15 2 AUSTRALIA–UNITED STATES TRADE national interest. The Act also provides backing for ensuring compliance with the policy. The types of proposals by foreign interests to invest in Australia which require prior approval and therefore should be notified to the Government and reviewed by the Foreign Investment Review Board, are varied. It should also be noted that there are several sectors where there are explicit restrictions apart from the national interest criteria. Media ownership and content Some of the explicit restrictions on foreign investment mentioned above pertain to investments in newspapers and commercial and subscription television services. In addition, proposals involving portfolio shareholdings in the media of 5 per cent or more must be submitted for examination by the Foreign Investment Review Board, irrespective of size, which is not the case for other sectors. Australian content provisions exist under the Broadcasting Services (Australian Content) Standard 1999, Television Program Standard for Australian Content in Advertising, the Federation of Australian Radio Broadcasters (FARB) industry’s code of practice, and the Broadcasting Services Act 1992. Commercial free to air television is the most heavily regulated, with quota requirements for Australian programming overall and sub-quotas for drama, documentaries, and children’s and preschool television. The implications in this area of a FTA with the United States remain uncertain. Reasons for this uncertainty are outlined in appendix A. Government procurement The Australian government does maintain a number of programs in its procurement for a variety of reasons. For example, the inclusion of industry development (ID) criteria can pose a problem for overseas suppliers. Although not explicitly discriminatory, ID criteria do have a geographic basis which requires potential suppliers to undertake any R&D specified in a contract in Australia. In addition, all Commonwealth departments and agencies must purchase at least 10 per cent of their requirements from SMEs. At the State level several states continue to have formal preference margins on imported content ranging from 10 per cent to 20 per cent. However, these are used infrequently (WTO 1998). To our knowledge the most recent quantification ECONOMIC IMPACTS OF AN AUSTRALIA–UNITED STATES FTA 16 2 AUSTRALIA–UNITED STATES TRADE available of what procurement policy may offer in terms of domestic protection was provided in the Bureau of Industry Economics’ 1996 report, WTO Agreement on Government Procurement. However, these estimates have not been factored into the model for reasons outlined in appendix A. Barriers used for this study The trade barriers that have been computed are set out in table 2.7. These tariffs are either nominal tariffs at post-Uruguay Round rates or tariff equivalents as described above and in the appendix. The tariff equivalents of non-tariff barriers on goods were, in the main, determined by use of the price-gap method (see box 2.6). For a detailed treatment of the actual calculations see appendix A. For services the ‘tariff equivalent’ amounts to a domestic cost reduction that would be possible were bilateral restrictions to trade and investment removed. These cost reductions were based on recent work done at the Productivity Commission and the Australia-Japan Research Centre, Australian National University. Again, the detail of the calculations is provided in appendix A. 2.6 The Price Gap Method The Price Gap Method is one of the most widely used calculations used to determine the tariff equivalent of a non-tariff barrier. Suppose that the world price of a good or service is PW, and that as a result of the non-tariff barrier, the price in the domestic market is PD. The Price Gap Method gives a tariff equivalent (TE) of the non-tariff barrier as: TE = ECONOMIC IMPACTS PD − PW x 100% PW OF AN AUSTRALIA–UNITED STATES FTA 17 2 AUSTRALIA–UNITED STATES TRADE 2.7 Post-Uruguay tariff rates used for simulations Post-Uruguay tariffa — US Sector Post-Uruguay tariffa — Australia % % Paddy rice Wheat Cereal grains n.e.c. Vegetables, fruit, nuts Oil seeds Peanuts 0.30 1.80 0.00 1.00 3.80 45.00 1.00 0.00 0.00 0.80 0.00 Sugar cane, sugar beetb Plant-based fibres Crops n.e.c. Bovine cattle, sheep and goats, horses Animal products n.e.c. Raw milk Wool, silk worm cocoons Forestry Fishing Coal Oil Gas Minerals n.e.c. Bovine cattle, sheep and goat, horse meat products Meat products n.e.c. Vegetable oils and fats Dairy products Butter Cheddar Cheese Mozzarella Cheese Processed rice Sugar Food products n.e.c. Beverages and tobacco products Textiles and clothing Wearing apparel Leather products Wood products Paper products, publishing Petroleum, coal products Chemical, rubber, plastic products Mineral products n.e.c. Ferrous metals Metals n.e.c. Metal products Motor vehicles and parts Passenger motor vehicles Light commercial vehicles Transport equipment n.e.c. Electronic and equipment n.e.c. Machinery and equipment n.e.c. Manufactures n.e.c. Electricity Gas manufacture, distribution Water 80.00 0.10 0.90 0.00 0.30 0.00 3.00 0.00 0.20 0.00 0.20 0.00 0.10 0.00 0.00 0.00 0.00 0.00 0.00 0.00 0.00 0.00 0.00 0.00 0.00 0.40 2.20 1.80 0.00 23.90 84.60 15.50 23.60 0.30 80.00 1.60 1.40 5.80 11.60 7.30 0.40 0.30 0.70 2.00 3.50 2.50 0.50 1.50 1.40 0.00 0.30 0.00 3.20 0.00 0.00 2.40 4.80 9.90 15.70 8.40 5.20 4.60 0.10 2.70 4.40 4.40 2.70 5.50 9.30 15.00 25.00 1.4 1.10 0.80 2.00 0.00 0.00 0.00 1.30 0.20 2.90 3.90 0.00 0.00 0.00 (Continued on next page) ECONOMIC IMPACTS OF AN AUSTRALIA–UNITED STATES FTA 18 2 AUSTRALIA–UNITED STATES TRADE 2.7 Post-Uruguay tariff rates used for simulations Continued Post-Uruguay tariffa — US Sector Construction Trade, transport Financial, business, recreational services Public admin and defence, education, health Dwellings Post-Uruguay tariffa — Australia % % 0.00 0.08 0.04 0.00 0.00 0.00 0.33 0.97 0.00 0.00 a Includes non-tariff barriers expressed as tariff equivalents. b The US tariff equivalent is taken to be the same as that for sugar. This is of little consequence as sugar cane is not exported to the United States. Source: Various. ECONOMIC IMPACTS OF AN AUSTRALIA–UNITED STATES FTA 19 3 Simulating the gains from reform using APG-Cubed TRADE LIBERALISATION and increasing market openness have meant that, over time, countries have become increasingly interdependent. Often, a policy change in one country can bring about changes in another country. Because of interdependency between sectors and countries, measuring the impact of trade liberalisation requires a global and economy-wide framework that incorporates both the economic linkages within a country and accounts for the linkages between countries. To capture the effects of investment and capital accumulation over time or what happens to financial variables like interest rates or the exchange rate, a dynamic model — the APG-Cubed model — that incorporates both real and financial sector interactions is used. In the next chapter a more detailed model — the GTAP model — is used but at the expense of losing dynamic effects over time and the effects on investment and capital flows. The APG-Cubed model Being a fully dynamic model that integrates financial and goods markets with a rich treatment of assets and financial variables, the APG-Cubed model can explore welfare, GDP, investment, capital flow and current account effects as well as effects on interest rates and exchange rates. The time path of trade liberalisation between the two countries can be explored along with the levels of aggregate output and real consumption — the measure of welfare used in this study. While the APG-Cubed model could capture the commodity detail in GTAP, the practical problem is that solving for many time periods means the database is unworkable. Typically then, the version of the model used here aggregates sectors. The commodity and country aggregation is detailed in table 3.1. ECONOMIC IMPACTS OF AN AUSTRALIA–UNITED STATES FTA 20 3 SIMULATING THE GAINS FROM REFORM USING APG-CUBED 3.1 Economy and industry coverage of Asia Pacific G-Cubed Economies Sectors United States China Energy Australia Chinese Taipei Mining Japan Korea Agriculture New Zealand Hong Kong Durable manufacturing Indonesia India Nondurable manufacturing Malaysia Services Philippines Singapore Thailand Other OECD Source: Centre for International Economics 1998. Although many of the theoretical principles of the APG-Cubed and GTAP models (used in the next chapter) are similar (for example, consumers maximise utility and producers maximise profit), adding the time dimension means consumers, for example, in the APG-Cubed model are optimisers over time and expectations have been fully allowed for. Also, full inter-temporal arbitrage can occur and borrowings today, for example, have to be serviced and repaid in future years. The two models are therefore quite different and it is misleading to directly compare results. Each model is trying to capture a representation of a different aspect of what might happen with the formation of the FTA between the United States and Australia so a better judgement of what could be involved can be made. The APG-Cubed model is fully documented (www.msgpl.com.au) and other uses of the model can be found in East Asia’s Response to the Crisis: A Quantitative Analysis (McKibbin and Stoeckel 1999) or Asia’s Meltdown and Agriculture (CIE 1998), and in Global Trade Reform, Maintaining Momentum (DFAT 1999). Barriers Since the aggregation used for APG-Cubed is different to that in table 2.7, the average barriers by sector have to be recalculated. This has been done using production weights from the sectors in table 2.7 and the results are set out below in table 3.2 ECONOMIC IMPACTS OF AN AUSTRALIA–UNITED STATES FTA 21 3 SIMULATING THE GAINS FROM REFORM USING APG-CUBED 3.2 Tariff levels used for APG-Cubed calculations Sectors Australian barriers Per cent United States barriers Energy 0.03 0.30 Mining 1.36 0.40 Agriculture 0.10 1.36 Durable manufacturing 4.67 1.31 Nondurable manufacturing 3.75 3.85 0.35 0.02 Services a a Services are represented as a domestic cost reduction. Source: CIE calculations. Results The effects of forming a free trade area between Australia and the United States are shown in the series of figures in charts 3.3 and 3.4. These charts refer to a full liberalisation of bilateral trade between the two countries. The first thing to notice is that the effects for Australia are greater than for the United States. Australia is a much smaller country than the United States and a small change in America’s consumption and imports of items from Australia can have a much larger percentage effect. Also, the results reflect the smallness of Australia’s trade as a proportion of total trade of the United States. Looking at chart 3.3, Australia’s real GDP and real consumption (the variable we take to most closely represent real welfare) both rise over the period of the five-year phase for reductions in barriers. By 2010, GDP and real consumption in Australia could be 0.4 per cent higher than would otherwise have been the case in the absence of the formation of the free trade area. In absolute terms, real GDP could be nearly US$2 billion higher. Reducing barriers by the United States leads to more exports from Australia, which are nearly 0.8 per cent higher than otherwise. With lower Australian barriers to the United States, imports rise by 0.4 per cent in 2006 above what they otherwise would be. With exports rising above imports there is an improvement in the current account deficit, which improves by 0.08 per cent when expressed as a percentage of GDP. ECONOMIC BENEFITS FROM AN AUSTRALIA–UNITED STATES FTA 22 3 SIMULATING THE GAINS FROM REFORM USING APG-CUBED 3.3 APG-Cubed results for Australia Real GDP 0.6 0.4 0.2 0.0 2004 2008 2012 2016 2020 0.2 2004 2008 2012 2016 2020 Change in current account as percentage of GDP 0.12 1.2 0.09 0.8 Per cent % deviation from baseline 0.4 2000 Real imports and exports Exports 0.4 Imports 0.00 2000 2004 2008 2012 2016 2020 2000 Real investment 2004 2008 2012 2016 2020 Change in agricultural investment: Australia 2.0 % deviation from baseline 1.2 0.06 0.03 0.0 % deviation from baseline 0.6 0.0 2000 0.8 0.4 0.0 -0.4 1.5 1.0 0.5 0.0 2000 2004 2008 2012 2016 2020 2000 Real exchange rate 15 Deviation from baseline 0.1 % deviation from baseline Real consumption 0.8 % deviation from baseline % deviation from baseline 0.8 0.0 -0.1 -0.2 -0.3 2000 2004 2008 2012 2020 Real interest rate: Basis points 10 5 0 -5 -10 2004 2008 2012 2016 2020 2000 2004 2008 2012 Data source: Simulation of APG-Cubed model. ECONOMIC 2016 IMPACTS OF AN AUSTRALIA–UNITED STATES FTA 2016 2020 23 3 SIMULATING THE GAINS FROM REFORM USING APG-CUBED 3.4 APG-Cubed results for the United States Real GDP 0.020 0.010 0.000 2008 2012 2016 2020 2000 Real export and imports 0.10 Exports Imports 0.00 2004 2008 2012 2016 2020 Change in durable manufacting exports 0.20 0.05 0.15 0.10 0.05 0.00 2000 0.10 2004 2008 2012 2016 2020 2000 Real investment 0.001 0.05 Per cent % deviation from baseline 0.010 % deviation from baseline % deviation from baseline 2004 0.15 0.00 2010 2020 Change in current account as a percentage of GDP 0.000 -0.001 -0.05 -0.002 -0.10 2000 2004 2008 2012 2016 2000 2020 Real exchange rate (bilateral with Japan) 1.0 Deviation from baseline 0.020 % deviation from baseline 0.020 0.000 2000 0.20 Real consumption 0.030 % deviation from baseline % deviation from baseline 0.030 0.015 0.010 0.005 0.000 2000 2004 2008 2012 2016 2020 2016 2020 Real interest rate: Basis points 0.5 0.0 -0.5 2004 2008 2012 2016 2020 2000 2004 2008 2012 Data source: Simulation of APG-Cubed model. ECONOMIC BENEFITS FROM AN AUSTRALIA–UNITED STATES FTA 24 3 SIMULATING THE GAINS FROM REFORM USING APG-CUBED The investment story is an interesting one. Extra exports of largely dairy and sugar, leads to extra agricultural output which comes from extra investment. Although investment rises in mining and agriculture, there is some adjustment in manufacturing and some initial disinvestment overall. Before the barrier reductions are fully in place, resources shift out of some sectors and into the sectors with the largest export response. Eventually, rising incomes causes the demand for all goods to rise and the resource transfer to exports continues smoothly but with more investment in all sectors. There is a small temporary increase in real interest rates from the baseline case of 10 basis points in the first year. This differential later declines. The rise in the real interest rate reflects relatively stable nominal interest rates combined with a fall in expected future inflation as lower input costs and cheaper imports kicks in over time. The FTA causes the Australian dollar to initially depreciate by a small 0.2 per cent below what it might otherwise be. With a fall in investment and then a rise in savings over time there is an excess of savings in the economy, which flows overseas. This capital outflow causes a real exchange rate depreciation. The real depreciation may seem surprising when the real interest rate rises from the baseline case at the same time. The key point to remember is that the current value of the real exchange rate is equal to the current and expected future interest rate differential between Australia and the United States plus the long run equilibrium real exchange rate. While the interest rate rises above world interest rates initially the interest rate is below the world rates for most of the near future. It is this second effect that dominates. Effects on the United States The United States GDP gains by around US$2.1 billion in 2006. This is smaller than for Australia when expressed in relative terms. GDP rises by just 0.02 per cent above what it might otherwise be by 2006 when the trade barriers are fully removed. There is a small rise in real consumption (our measure of welfare) in the United States, amounting to just 0.016 per cent higher than the baseline. Exports rise more than imports on a percentage basis. However, because the base of imports into the United States is so much larger than exports, there is a very small deterioration in the current account to 2005 before declining imports leads to an improvement. The predominant increase in United States exports is for durable manufacturing which rise by 0.12 per cent by 2006 when the phase-in period is complete. ECONOMIC IMPACTS OF AN AUSTRALIA–UNITED STATES FTA 25 3 SIMULATING THE GAINS FROM REFORM USING APG-CUBED Welfare and production gains Even though the United States gains little welfare on a percentage basis, the size of the economy still translates into a significant welfare increase over time. The benefit to Australia and the United States is the net present value of the stream of extra production or real consumption as a result of forming the free trade area. From chart 3.5 the gain in welfare (real consumption) and real GDP over 20 years discounted at the equilibrium real 10 year bond rate in Australia is US$9.9 billion and US$15.5 billion for Australian welfare and GDP respectively and US$10.3 billion and US$16.9 billion for United States welfare and GDP respectively when discounted at equivalent United States rates. The difference between the consumption and GDP gains come about because there is a change in the price of the consumption bundle plus some of the additional production in each economy (GDP) is actually from foreign investment, some of the returns of which are repatriated to foreigners and so do not result in a dollar for dollar increase in domestic consumption. 3.5 The gains from full implementation of a Australia–United States FTA Representation of gain Net present value 1999 US$ billion $ Real GDP Benefit is the net present value of this stream of extra benefits Real GDP or real consumption 15.5 16.9 Real consumption 9.9 10.3 Baseline Australia 2020 2000 USA Data source: Centre for International Economics. ECONOMIC BENEFITS FROM AN AUSTRALIA–UNITED STATES FTA 26 3 SIMULATING THE GAINS FROM REFORM USING APG-CUBED Gains to other countries The gains to Australia and the United States have a beneficial effect on other countries. The gains are shown in chart 3.6. The major gainer is New Zealand. This can be explained by the fact that Australia expands as a result of the FTA and Australia is New Zealand’s most important trading partner. New Zealand also gains from diversion of Australian dairy products from Japan, among others, to the now more profitable United States market. New Zealand would pick up some of those extra sales and dairy products accounts for about a quarter of New Zealand’s exports. Although the impacts on third countries are small in some cases, the effects are nevertheless positive. Trade creation and trade diversion A frequent issue in the formation of a preferential free trade area is whether the extra trade created by the members of the new arrangement is more than offset by the divergence of trade from other lower cost sources. It could be that the members of the free trade area gain at the expense of third countries. Looking at world exports (chart 3.7), it is apparent that exports for the world rises and that, overall, the formation of the bilateral free trade area between Australia and the United States is trade creating. Full versus partial liberalisation The preceding results have been based on complete removal of the barriers to trade between Australia and the United States that have been identified. The purpose has been to try and assess the potential for trade liberalisation between the two countries. No attention has been given to the fact that, so far, some trade barriers have proved politically difficult to remove whether by unilateral action or under multilateral trade talks, for example sugar in the United States and motor vehicles in Australia. Should a negotiation for a free trade agreement start, many of these sensitive political issues will surface and less than a full liberalisation may result. The political assessment of what might be possible for what commodities and services is outside the scope of this study. However, some idea of the trade-off between a full versus partial liberalisation can be gained by examining the benefits from a partial liberalisation compared to the complete removal of all identified trade barriers. Two other simulations were therefore conducted, one representing a 50 per cent removal of trade barriers over the same time period and one where there was just 25 per cent removal of barriers. ECONOMIC IMPACTS OF AN AUSTRALIA–UNITED STATES FTA 27 3 SIMULATING THE GAINS FROM REFORM USING APG-CUBED 3.6 Changes to real GDP for third countries/groups Real GDP - New Zealand 0.040 % deviation from baseline % deviation from baseline 0.040 0.030 0.020 0.010 0.000 2008 2012 2016 0.040 0.010 0.000 2004 2008 2012 2016 2008 2012 2016 2020 2012 2016 2020 2008 2012 2016 2020 2008 2012 2016 2020 Real GDP - other OECD (mostly EU) 0.030 0.020 0.010 2020 2000 Real GDP - Taiwan 0.030 0.020 0.010 0.000 2004 2008 Real GDP - Singapore 0.040 % deviation from baseline % deviation from baseline 2004 0.000 2000 0.030 0.020 0.010 0.000 2000 2004 2008 2012 2016 2020 2000 Real GDP - Thailand Real GDP - China 0.030 0.020 0.010 0.000 2000 2004 0.040 % deviation from baseline % deviation from baseline 0.010 2000 Real GDP - Korea 0.020 0.040 0.020 2020 % deviation from baseline % deviation from baseline 2004 0.030 0.040 0.030 0.000 2000 0.040 Real GDP - Japan 0.030 0.020 0.010 0.000 2004 2008 2012 2016 2020 2000 2004 Data source: Simulation of APG-Cubed model. ECONOMIC BENEFITS FROM AN AUSTRALIA–UNITED STATES FTA 28 3 SIMULATING THE GAINS FROM REFORM USING APG-CUBED 3.7 Change in world exports World exports 0.040 % deviation from baseline 0.030 0.020 0.010 0.000 2000 2004 2008 2012 2016 2020 Data source: APG-Cubed. The results comparing full liberalisation to the two partial liberalisations between Australia and the United States is shown in chart 3.8. As could be expected, the partial liberalisations give much less economic gain. However, the same mechanisms are working which result in the same time profile of variables. With lower gains to real consumption and real GDP from partial liberalisations, the overall net present value of the welfare gain is much lower. The comparison of results for Australia and the United States is shown in chart 3.9. Whereas Australia gained a net present value of US$9.9 billion with full liberalisation, if there is only a 25 per cent reduction in barriers overall, there is approximately only one quarter of the gain. The same result can be seen for the United States. ECONOMIC IMPACTS OF AN AUSTRALIA–UNITED STATES FTA 29 3 SIMULATING THE GAINS FROM REFORM USING APG-CUBED 3.8 Comparison of full versus partial liberalisation USA: Real GDP per cent deviation from baseline Australia: Real GDP per cent deviation from baseline 0.6 0.050 0.5 0.040 Full removal of barriers 0.4 0.030 0.3 0.020 50 per cent removal of barriers 0.2 0.010 0.1 25 per cent removal of barriers 0.0 2000 0.000 2004 2008 2012 2016 2020 2000 2004 2008 2012 2016 2020 Data source: APG-Cubed. a 3.9 Net present value of real consumption US$ billion Full removal of barriers 10.3 9.9 50% removal 5.0 5.1 25% removal 2.5 2.6 Australia USA a Discounted over 20 years. Data source: APG-Cubed. ECONOMIC BENEFITS FROM AN AUSTRALIA–UNITED STATES FTA 30 4 Simulating the gains from a bilateral free trade agreement using GTAP IN THE PREVIOUS CHAPTER the aggregate macroeconomic effects of the FTA were explored. But the potential FTA involves major differences in effects since there is a wide disparity in protection for sectoral industries. With its considerable commodity and regional detail, the Global Trade Analysis Project (GTAP) framework is well placed to examine the implications for specific sectors and regions of bilateral trade liberalisation. Global Trade Analysis Project The GTAP model is a comparative static computable general equilibrium model of the world economy. GTAP captures linkages within economies and among them, by modelling the economic behaviour and interactions of producers, consumers and governments. It is therefore possible to trace the implications of a policy change — such as a tariff reduction — to other parts of the economy as well as to other regions and economies identified in the model. The GTAP model is neoclassical in nature. Consumers are assumed to maximise utility and producers to maximise profits. Markets are assumed to be perfectly competitive. Production exhibits constant returns to scale. Different regions and economies are linked through trade. Some of these assumptions — for example, constant returns to scale — mean that the gains from trade liberalisation will typically be understated by GTAP. GTAP has considerable regional and commodity detail, encompassing 45 regions and 50 sectors. Due to the size of the underlying database, an aggregated version of the database has been used to analyse an FTA between Australia and the United States. Aggregation of the database allows us to focus on the key regions and sectors of interest while keeping the modelling at a manageable and tractable level. The 45 regions and 50 ECONOMIC IMPACTS OF AN AUSTRALIA–UNITED STATES FTA 31 4 SIMULATING THE GAINS sectors have been condensed to 16 regions and 24 sectors, as shown in table 4.1. This level of aggregation provides a high level of sector/commodity detail and is sufficiently disaggregated regionally so that information on third trading partners can be captured. Sectors have been aggregated according to the nature of outputs, their relative importance in the Australian and United States’ economies and where, due to the size of current trade restrictions, significant changes to resource flows and sector output are anticipated. 4.1 Aggregated GTAP regions and sectors GTAP regions GTAP sectors Australia Grains Canada Other crops Chile Sugar cane, sugar beet China Animal products European Union Raw milk Japan Forestry and fishing Republic of Korea Mining and energy Mexico Meat products New Zealand Other food products Other ASEAN(6) Dairy Rest of Asia Sugar Rest of Europe Beverages and tobacco Rest of World Textiles, clothing, footwear and leather products Singapore Wood and paper products, publishing South America Chemicals, rubbers and plastics United States Other mineral and metal products Ferrous metal products Motor vehicles and parts Other transport equipment Electronic equipment Other manufacturing Utilities and other services Trade and transport Financial, business and recreation services ECONOMIC IMPACTS OF AN AUSTRALIA–UNITED STATES FTA 32 4 SIMULATING THE GAINS The GTAP database As the GTAP model will be used for the detailed sectoral results, it is important that the underlying database is as up-to-date as possible. Version 4 of the GTAP database — the latest available — is based on 1995 data. However, since 1995 changes will have occurred to the structure and size of various economies within the model. To improve the accuracy of the country and sector detailed results, the GTAP database was updated to 1998-99 so as to reflect changes that have occurred since 1995. It is important to recognise that the 1998-99 database is underpinned by exchange rates that prevailed at that time. For Australia, this means an A$:US$ exchange rate of 0.64 (A$1 buys US$0.64). This needs to be kept in mind when interpreting the GTAP modelling results presented below. Furthermore, the database was corrected for apparent irregularities and inconsistencies in trade and production patterns. The salient point to note from the updating and adjusting of the GTAP database is that the results reported in this study will not be able to be replicated by other researchers using the 1995 GTAP database. To replicate the results reported here, the CIE version of the GTAP database is required. Trade liberalisation and timing The tariff rates applying to bilateral trade between Australia and the United States reported in table 2.7 have been aggregated to the 24 sector level using production weights. Production weights are favoured over import weights as import weights may give insufficient weighting to high, and therefore very distortionary, import tariffs. For example, if the high tariffs are successful in discouraging imports this will mean that they have low weighting and the level of protection afforded by the tariff will be significantly underestimated. As protection encourages domestic production, local production is deemed to be the most suitable weight. Table 4.2 reports Australian and US tariff rates used in the GTAP modelling. Under the FTA, Australia and the United States each remove their respective trade barriers to goods and services sourced from the other country. ECONOMIC IMPACTS OF AN AUSTRALIA–UNITED STATES FTA 33 4 SIMULATING THE GAINS 4.2 Tariff rates used in GTAP simulations Australian tariffsa United States’ tariffsa Aggregated GTAP sector GRN OCP SCB APD RMK FAF MNG MTP OFP DRY SUG BAT TCF WPP CRP OMP FMP MVP OTN ELE OMU UOS TAT FBR Grains Other crops Sugar cane, beet Animal products Raw milk Forestry and fishing Mining and energy Meat products Other food products Dairy Sugar Beverages and tobacco Textiles, clothing and footwear Wood and paper products, publishing Chemicals, rubber and plastics Other mineral and metal products Ferrous metal products Motor vehicles and parts Other transport equipment Electronic equipment Other manufacturing Utilities and other servicesb Trade and transportb Financial, business and recreational servicesb Per cent Per cent 0.04 0.38 0.00 0.00 0.00 0.00 0.14 0.06 2.21 3.20 0.00 4.80 11.69 4.85 2.70 4.47 4.40 9.30 1.30 0.20 2.99 0.00 0.18 0.94 0.36 0.63 80.00 0.08 0.00 0.02 0.35 1.99 1.45 23.90 80.00 1.40 8.46 0.33 2.00 1.73 2.50 1.40 0.90 1.10 0.91 0.00 0.08 0.03 a Includes non-tariff barriers expressed as tariff equivalents. b Percentage cost reduction achievable following service trade liberalisation. Source: GTAP database, CIE, Productivity Commission, WTO Trade Policy Reviews, USITC. The GTAP model is comparatively static, meaning that it is independent of time. Hence when using GTAP to model the liberalisation of trade and investment between Australia and the United States, it is assumed that restrictions on bilateral trade between the two countries are eliminated ‘overnight’. That is, once the FTA has been formed the tariffs applying to exports from Australia and US are immediately eliminated. This was the approach taken in NAFTA, were barriers to trade between Canada, Mexico and the United States were eliminated overnight. Given the typically low trade barriers in place, this assumption is not seen to be unrealistic. The framework used to analyse the FTA in the previous chapter (APG-Cubed) does capture time paths and a five-year phase in of tariff reduction was assumed. However, as some sectors — most notably TCF, motor vehicles and parts, dairy and sugar — have high levels of protection, ‘overnight’ tariff elimination may not be politically feasible. To account for this, three levels of tariff reduction will be simulated, namely: full trade liberalisation — full removal of the tariff rates identified in table 4.2; ECONOMIC IMPACTS OF AN AUSTRALIA–UNITED STATES FTA 34 4 SIMULATING THE GAINS partial trade liberalisation — 50 per cent reduction in tariff rates; and limited trade liberalisation — 25 per cent reduction in tariff rates. The GTAP model is explained in greater detail in appendix B, including the concordance between the 45 region 50 sector GTAP database and the aggregated 16 region 24 sector version used here (note that the 50 GTAP sectors correspond to those in table 2.7). Full model documentation is available on-line at www.agecon.purdue.edu/gtap. Results from GTAP modelling Results from the GTAP model of the world economy are reported in this section. The aggregate (or macroeconomic) effects of AUSFTA are investigated first — what happens to GDP, exports and imports, and the terms of trade? We then consider the implications of AUSFTA for various sectors of the Australian and United States economies. Finally, the effects on selected third countries are considered. Aggregate effects Countries undertake trade liberalisation for a number of reasons. Increased competition and the productivity gains, allocative efficiency gains and greater variety in consumption of goods and services. Each of these factors contributes to the underlying rationale of pursuing trade liberalisation — to improve the community’s economic welfare and standard of living. To decide whether reducing tariffs benefits the community, an appropriate indicator of community welfare needs to be used. A rise in gross domestic product is commonly associated with a rise in economic welfare. However, as GDP is an accounting measure of economic activity, changes in GDP reflect only changes in the overall level of economic activity and not change in society’s well being. For example, as GDP does not account for leisure, it may be misleading to interpret a fall in GDP that results from increased leisure (and therefore less time spent working) as a reduction in society’s well being. The APG-cubed model overcomes this problem by reporting changes in real household consumption — the preferred measure of welfare gain to consumers from trade liberalisation. GTAP, however, does not report changes in real consumption. This means change to welfare will have to be inferred from change in real GDP. ECONOMIC IMPACTS OF AN AUSTRALIA–UNITED STATES FTA 35 4 SIMULATING THE GAINS Table 4.3 summarises the aggregate economic effects of the various AUSFTA trade liberalisation scenarios. Results reported in this chapter are to be interpreted as the permanent annual change relative to what otherwise would have occurred in the absence of an FTA between Australia and the United States. Furthermore, the reported changes represent the total change after the economy has had time to fully adjust to the effects of trade liberalisation. The first observation to note from table 4.3 is that all trade liberalisation scenarios deliver positive (real) GDP gains to both countries. The percentage change in real GDP is greater for Australia than for the US. This was to be expected, as the US is a much more important trading partner for Australia than Australia is for the United States (see chart 2.3). We saw in chapter 3 that under the APG-Cubed framework Australia’s real GDP is estimated to increase by 0.40 per cent, whereas under GTAP the increase is estimated to be 0.34 per cent. It is difficult to compare these two numbers since they are different models and so for example GTAP reports a lower real GDP gain than APG-Cubed as APG-Cubed has a more sophisticated investment theory. In the APG-Cubed framework investment and capital stocks are allowed to change over time in response to changes in the return to capital. For countries now attracting greater investment (as Australia would), this sees an increase in capital stocks and productive capacity, and subsequently a greater increase in real GDP. As GTAP holds the stock of capital constant — it is a short run model — changes in real GDP will be lower than that calculated by APG-Cubed. Hence the reliance on the APGCubed model for macroeconomic outcomes. As Australia and the US lower their bilateral trade barriers, imports to both countries increase. The lower priced imports reflect two effects. One is the lower cost of imports due to the removal of the tariff. The other is the effect of trade liberalisation on the efficiency of sectors in the other country. For example, trade liberalisation will bring efficiency gains in the United States, 4.3 Aggregate effects of AUSFTA Real GDP Import volume Import prices Export volume Export prices Terms of trade Expected return to capital Full trade liberalisation Partial trade liberalisation Limited trade liberalisation Australia United States Australia United States Australia United States Per cent Per cent Per cent Per cent Per cent Per cent 0.34 0.67 -0.05 1.35 0.03 0.08 1.04 0.02 0.12 -0.05 0.10 -0.03 0.02 0.03 0.16 0.28 -0.02 0.60 -0.04 -0.02 0.45 0.01 0.05 -0.03 0.04 -0.02 0.01 0.01 0.08 0.13 -0.01 0.28 -0.03 -0.01 0.21 0.01 0.02 -0.01 0.02 -0.01 0.01 0.01 Source: GTAP model simulation. ECONOMIC IMPACTS OF AN AUSTRALIA–UNITED STATES FTA 36 4 SIMULATING THE GAINS which in turn will lower their production costs. This will see the price of US exports to Australia falling. The increased imports have to be paid for and this necessitates that both countries export more. As a result, export volumes for both countries increase. To export more, supply prices must fall relative to other regions in the world, and we observe export prices decreasing for the US in all trade liberalisation scenarios and for Australia under the partial and limited liberalisation scenarios. The price of exports under full liberalisation increases for Australia, albeit marginally. This effect can be attributed solely to two Australian sectors — dairy and sugar. Under full liberalisation, the US tariff reductions for these two sectors are so significant that demand for Australian exports increases substantially, thereby driving up the domestic and free-on-board export prices. As will be seen below, the export prices for other Australian sectors fall. Rising export prices and cheaper imports sees a terms-of-trade (TOT) gain for Australia under full liberalisation. The US experiences a TOT gain under each scenario as import prices decline relatively more than do US export prices. Australia experiences a TOT deterioration under the other scenarios. Trade liberalisation and the resulting improvement in allocation of resources is typically associated with an improvement in the returns to capital, and this is observed for both countries (see expected return to capital in table 4.3). The improved returns to capital will provide an incentive to increase investment in Australia and the United States over the longer term. As the GTAP model is effectively short run, the improvement in the returns to capital will not have, as yet, brought about investment inflow to Australia and the United States. The salient observation from the results presented in table 4.3 is that both countries, and especially Australia, experience gains to real GDP. And from this we can infer gains to welfare. In the remainder of the chapter, the reported results will be restricted to those arising from the full trade liberalisation scenario. Sectoral effects Tables 4.5 and 4.6 summarise the sectoral results for the Australian and United States’ economies arising from AUSFTA. Starting with Australia, the US bilateral trade liberalisation sees Australian exports to the US falling in price. It should be noted, however, that the tariff reduction does not nec- ECONOMIC IMPACTS OF AN AUSTRALIA–UNITED STATES FTA 37 4 SIMULATING THE GAINS essarily correspond to a price reduction of the same magnitude. This is a robust outcome. Take the dairy sector as an example. US liberalisation of dairy trade sees the price of Australian dairy exports to the US falling as seen by the US consumer, which in turn encourages demand for Australian dairy products. Increased demand results in a price rise for Australian dairy products in Australia (see column 6 of table 4.5). This price rise feeds through to other sectors of the Australian economy, which in turn have a ‘second round’ effect and increase production costs in the dairy sector. As domestic prices rise, the price of exports must also rise. As a result of this, the tariff reduction does not correspond to a price reduction of the same magnitude. The effect of trade liberalisation on the dairy sector is provided as a case study in box 4.4. Cheaper priced exports are associated with increased exports to the US. Substantial increases are reported for the Australian dairy, sugar and TCF sectors. It should be recognised, however, that these rather substantial increases apply to low bases. For example, although sugar exports to the US increase by 2551 per cent, actual sugar exports increase by US$442 million. Similarly, Australian imports of sugar are reported to increase by 57 per cent, but this is equivalent to only an additional US$10 million worth of sugar imports into Australia. Elaboration and comparison of the partial and general equilibrium effects of sugar liberalisation is contained in appendix C. Comparing total export and import volumes (columns 4 and 5 of table 4.5) reveals an increase in both exports and imports of processed food and manufacturing goods. This result may seem counter intuitive to some, but it can be explained by product differentiation, and in the case of processed foods, differing agricultural seasons. Also, for example, some Australian automotive manufacturers import car engines from the US, while at the same time exporting engines of differing capacity/type back to the US. Bilateral trade liberalisation further promotes such trade. Greater product diversification enables consumers to have greater choice and to better satisfy their needs. A model such as GTAP cannot value such benefits. The decline in exports of primary products can be explained by the growth of the downstream processed food sectors. As these sectors expand they need greater production inputs, and for the most part, these are primary products. Sugar cane, for example, accounts for around 60 per cent of the sugar sector’s production costs. The increase in demand for primary products is satisfied by switching produce from the export market to the domestic market, thereby enabling the domestic processed food sector to expand. The results show that additional imports are needed to satisfy Australia’s demand for primary products. ECONOMIC IMPACTS OF AN AUSTRALIA–UNITED STATES FTA 38 4 SIMULATING THE GAINS 4.4 Dairy sector liberalisation by the United States Explaining the GTAP modelling results presented in tables 4.3 to 4.5 is complicated by the fact that many sectors simultaneously undergo change and hence it can be difficult to identify what is driving the results. By restricting trade liberalisation to just one sector, we can track and identify what is driving the resulting economywide changes. The experiment performed is trade liberalisation of the US dairy sector. This benefits Australia, whose real GDP is estimated to rise by 0.03 per cent. The effect in the US of dairy liberalisation is a combination of consumer gains and producer losses — the net effect being barely noticeable. But why are these results observed? Dairy liberalisation by the US sees the current tariff of 23.9 per cent (table 4.2) applying to Australian dairy imports being removed. Removal of this tariff bilaterally sees the price of Australian dairy products to US consumers falling by 18 per cent. The immediate effect of the price reduction is that domestic US users substitute away from dairy products sourced domestically and from other countries to the now relatively cheaper Australian products. Accordingly, exports of Australian dairy products to the US increase by a massive 354 per cent. It should be recognised, however, that this rather substantial increase applies to a very low base — actual dairy exports to the US increase by around US$260 million. Due to the increased (export) demand, the price of dairy products in Australia rises by 1 per cent. The reason for the large increase in exports to the US but small increase in Australia’s dairy price is that there is a lot of switching from other export markets to the US. For example, Australian dairy exports to Singapore decrease by 11 per cent. Hence not all of the 354 per cent increase in Australian dairy exports to the US is trade creation — some of it is trade diversion. The fall in dairy exports to Singapore is picked up by other countries, such as the European Union and New Zealand, whose dairy exports to Singapore increase by 5 and 4 per cent respectively. Increased prices result in increased profitability. This encourages output of the Australian dairy sector to expand by 1 per cent. The expansion effect places additional demand on production inputs, thereby bidding up the price of these inputs. Price rises are transmitted to other sectors of the Australian economy, with the end result being a very slight price rise (around 0.01 per cent) experienced by other sectors. A notable exception is the raw milk sector, which experiences a 2 per cent price rise. Given that the price of dairy output rises by 1 per cent, raw milk must account for around 50 per cent of the downstream dairy sector’s production costs. Increased exports of now higher priced products improve Australia’s terms-of-trade (TOT) by around 0.03 per cent. Australian real GDP increases by 0.03 per cent as a result of the US liberalisation to Australian dairy product. In the US, the market price of dairy products falls by only 0.1 per cent despite Australian dairy products now being 18 per cent cheaper. This reflects the share of Australian dairy products in total US dairy consumption (Australia has around 0.1 per cent of the total US dairy market) and the extent to which US purchasers differentiate between dairy products from different sources. The fall in US dairy price is associated with output of the US dairy sector falling by 0.2 per cent. To pay for the increase in dairy imports, the US must now export more. This sees US export volume increasing by 0.01 per cent. To export more, the price of US exports must fall relative to exports from other regions, and US supply prices fall marginally (around 0.005 per cent). Lower priced exports result in a TOT deterioration for the US (but contributes to Australia’s TOT gain as US imports are now cheaper). ECONOMIC IMPACTS OF AN AUSTRALIA–UNITED STATES FTA 39 4 SIMULATING THE GAINS 4.5 Australian sectoral changes Price of Aus exports to Aus exports Total export Total import US to the US volume volume Sector Grains Other crops Sugar cane, beet Animal products Raw milk Forestry and fishing Mining and energy Meat products Other food products Dairy Sugar Beverages and tobacco Textiles, clothing and footwear Wood and paper products, publishing Chemicals, rubber and plastics Other mineral and metal products Ferrous metal products Motor vehicles and parts Other transport equipment Electronic equipment Other manufacturing Utilities and other services Trade and transport Financial, business and recreational services Domestic price Domestic output Per cent Per cent Per cent Per cent Per cent Per cent -0.45 -0.65 -44.44 0.16 0.00 0.00 -0.35 -1.95 -1.50 -18.53 -38.11 -1.47 -7.92 -0.59 -2.13 -1.83 -2.60 -1.92 -1.10 -1.21 -1.16 -0.13 -0.22 -0.96 3.31 5.36 Na -1.18 Na -0.22 1.58 7.77 6.60 354.30 2550.81 9.24 75.48 2.45 8.26 10.52 15.41 10.33 5.69 6.75 6.48 0.38 0.59 3.56 -0.01 -0.26 Na -0.63 Na -0.37 -0.05 1.69 0.60 6.21 14.84 1.94 10.40 1.14 2.55 1.04 1.96 3.77 1.90 1.15 1.98 0.37 0.58 4.27 -1.10 0.37 Na 0.98 Na 0.40 0.15 0.35 0.64 4.86 57.54 3.41 2.20 1.35 0.99 1.11 0.39 1.85 0.45 0.04 0.80 -0.03 -0.12 -1.50 -0.09 -0.01 22.58 0.25 1.94 0.05 0.00 0.02 -0.07 0.99 12.58 -0.09 -0.14 -0.26 -0.19 -0.13 -0.17 -0.56 -0.22 -0.12 -0.27 -0.13 -0.22 -0.96 0.03 0.06 7.66 0.18 1.00 0.09 0.03 0.58 0.13 1.01 7.82 0.14 1.37 -0.07 0.41 0.20 0.31 -0.79 0.19 0.43 -0.17 0.14 0.24 0.35 Na Not applicable as there is no, or an insignificant amount of, trade in these commodities. Source: GTAP model simulation. Finally, output for the majority of Australia’s sectors expands. The extent to which output expands (or contracts) depends upon a combination of factors. Firstly, cheaper imports serve to lower production costs, thereby generating higher profits at current prices. This in turn induces output to expand. Secondly, for some sectors, cheaper imports may result in a loss of market share. As demand declines so too must the price of the domestically produced commodity. Finally, to pay for the increase in imports, Australia must now export more. To do this, the price of (some) Australian products must fall relative to those sourced from other regions. As price declines, so does output. Consider the motor vehicles and parts (MVP) sector where output and price contract. Trade liberalisation allows the MVP sector access to cheaper production inputs from the US, which would in turn lead to lower ECONOMIC IMPACTS OF AN AUSTRALIA–UNITED STATES FTA 40 4 SIMULATING THE GAINS production costs and an expansion in output. Lower production costs would also promote exports, as would the reduction in US tariffs on MPV. In table 4.5 we can see that exports to the US of MPV increase by around 10 per cent and total MPV exports grow by 3.7 per cent. However, we observe a slight fall in the output of the Australian MPV sector, meaning that the sector’s loss of market share to US MVP imports outweighs any expansion effect brought on by cheaper production inputs and increased export opportunities to the US. The net effect on the industry is determined by the responsiveness of the industry to the price changes (the elasticity of supply). Sectoral results for the United States are presented in table 4.6. The results follow a similar pattern as that reported for Australia. As a result of Australia’s bilateral trade liberalisation, the price of US exports to Australia falls, and this typically encourages greater consumption of US products by Australian consumers (see columns 2 and 3 of table 4.6). As before, some of the changes in US exports to Australia will appear large as a result of the low underlying base. Ignoring those products with low export bases, the greatest increase in exports occurs in the durable manufacturing sectors (metal products, motor vehicles and parts, other manufactures). While US exports to Australia of primary products, processed foods and manufactures increase, they fall for services. This can be attributed to the US service sectors switching their products from the export market to the domestic market in response to increased domestic demand. Domestic sales of services increase marginally, but domestic output remains unchanged with the exception of trade and transport (TAT) (see column 7 of table 4.6). Greater domestic sales but no increase in production must see exports decrease. Unlike Australia, which experienced price rises in several sectors (most notably sugar and sugar cane), US domestic prices fall marginally for all sectors. This reflects two things: Australian trade barriers are not sufficiently high such that on their removal there is a large increase in US sourced products; and Australia accounts for only a fraction of US exports, meaning Australia has little ability to affect prices in the US. Observed price decreases are brought about via cheaper production imports and the need for increased exports (and hence lower export prices) to pay for the increase in import volume (see columns 5 and 4 respectively of table 4.6). As Australian exports to the US — relative to the size of the total market — are not significant, cost savings from cheaper imports are not large. ECONOMIC IMPACTS OF AN AUSTRALIA–UNITED STATES FTA 41 4 SIMULATING THE GAINS 4.6 United States’ sectoral changes Price of US exports to Aus Sector Grains Other crops Sugar cane, beet Animal products Raw milk Forestry and fishing Mining and energy Meat products Other food products Dairy Sugar Beverages and tobacco Textiles, clothing and footwear Wood and paper products, publishing Chemicals, rubber and plastics Other mineral and metal products Ferrous metal products Motor vehicles and parts Other transport equipment Electronic equipment Other manufacturing Utilities and other services Trade and transport Financial, business and recreational services US exports Total export Total import to Aus volume volume Domestic price Domestic output Per cent Per cent Per cent Per cent Per cent Per cent -0.12 -0.43 -1.10 -0.07 0.00 -0.04 -0.18 -0.12 -2.21 -3.26 -0.87 -4.60 -10.48 -4.65 -2.65 -4.31 -4.24 -8.53 -1.30 -0.23 -2.93 -0.01 -0.09 -0.04 1.87 3.47 Na 1.04 Na 0.40 0.85 0.63 9.21 38.13 72.07 28.42 104.50 19.48 8.62 25.14 25.24 46.60 4.52 0.80 13.30 -0.15 -0.02 -1.54 0.07 -0.01 Na 0.11 Na -0.11 -0.02 0.00 0.11 1.94 16.91 0.06 0.83 0.21 0.08 0.08 0.05 0.78 -0.06 -0.12 0.07 -0.22 0.12 -0.11 -0.06 0.05 Na -0.03 Na 0.06 0.04 0.86 0.04 16.38 20.02 0.17 0.19 0.08 0.14 0.12 0.13 0.11 0.11 0.07 0.09 0.10 -0.01 0.06 -0.08 -0.04 -1.10 -0.07 -0.23 -0.03 -0.04 -0.06 -0.05 -0.17 -0.91 -0.02 -0.01 -0.02 -0.02 -0.02 -0.03 -0.02 -0.02 -0.03 -0.02 -0.01 -0.09 -0.04 -0.02 -0.01 -0.23 -0.01 -0.16 0.00 0.00 -0.02 0.01 -0.18 -1.47 0.01 0.04 0.01 0.01 0.00 -0.01 0.12 -0.01 -0.03 0.00 0.00 0.05 0.00 na Not applicable as there is no, or an insignificant amount of, trade in these commodities. Source: GTAP model simulation. The only significant change in sector output is experienced by the sugar sector, whose output is estimated to fall by around 1.5 per cent. This can be attributed to a loss of market share by US sugar producers as Australian sugar, now 38 per cent cheaper in the US, captures greater market share. Implications for third countries Aggregate economic effects of AUSFTA on third countries are reported in table 4.7. For all countries except for Australia and the United States, the effects on real GDP are barely noticeable. The expected return to capital gives some insight into investments flows in the longer term. A positive value indicates incentives to invest in that country, while a negative value indicates disincentives for investment in that region. Investment will flow to those regions with the highest (expected) rate of return to capital. ECONOMIC IMPACTS OF AN AUSTRALIA–UNITED STATES FTA 42 4 SIMULATING THE GAINS 4.7 Aggregate effects for third countriesa Region Australia United States Canada Chile China European Union Japan Korea Mexico New Zealand Other ASEAN(6) Rest of Asia Rest of Europe Rest of World Singapore South America Real GDP Terms of trade Expected return to capital Per cent Per cent Per cent 0.34 0.02 ns ns ns ns ns ns ns ns ns ns ns ns ns ns 0.08 0.02 -0.01 ns -0.01 ns -0.02 -0.04 0.01 ns -0.01 ns ns 0.01 -0.02 0.01 1.04 0.03 -0.01 ns -0.01 ns ns -0.03 ns 0.03 -0.01 ns ns 0.01 -0.03 ns ns: not significant. Changes could not be picked up at the second decimal place. Source: GTAP model simulation. Table 4.8 reports the extent of trade creation for Australia and the United States. From the table we can see that the US increases its exports to Australia by US$1854 million. However, net imports into Australia increases by around 36 per cent of that amount (US$675 million). Hence the increased exports from the US displaces some US$1179 million worth of exports from other regions. This will have an adverse impact on those regions whose exports to Australia are displaced. Increased Australian exports to the US displaces less trade, around US$63 million. The bulk of trade diversion is experienced by South America, whose exports to the US decrease by US$133 million. Increased Australian exports of sugar to the US are likely to account for the loss of exports experienced by South America. Increasing exports from the United States to Australia has the greatest adverse impact (in absolute terms) on the export sectors of China, the European Union and Japan. Table 4.9 identifies those sectors most adversely affected by the increase in US exports to Australia. The increase in US exports to Australia from those sectors is also reported for comparison. ECONOMIC IMPACTS OF AN AUSTRALIA–UNITED STATES FTA 43 4 SIMULATING THE GAINS 4.8 Trade creation and trade diversion — value of exports From/To Australia United States Canada Chile China European Union Japan Korea Mexico New Zealand Other ASEAN(6) Rest of Asia Rest of Europe Rest of World Singapore South America Total Australia United States US$ million US$ million 0 1 854 -33 -1 -104 -447 -297 -60 -3 -36 -53 -56 -28 -23 -27 -10 675 1 182 0 9 1 24 -53 117 22 -10 -7 -18 21 -28 -17 10 -133 1 119 Source: GTAP model simulation. From table 4.9 it can be seen that the majority of additional exports from the US to Australia as a result of AUSFTA are manufactured goods. Accordingly, it is exports of these products from other regions that the US exports displace. For example, US exports of motor vehicles and parts to Australia increase by US$525 million following Australia’s elimination of bilateral motor vehicle and parts tariffs. As US automotive products are now cheaper relative to automotive products sourced from other regions, Australian consumers substitute to the cheaper US products. As such, automotive exports to Australia from the European Union and Japan fall by US$103 million and US$181 million respectively. Overall, however, trade creation for Australia, the United States and the world as a whole outweighs the trade diversion. Australian exports to the US also results in some trade diversion. Dairy and sugar exports account for around 60 per cent of Australia’s additional US$1.2 billion worth of exports to the US. We can anticipate that this result will adversely impact on those regions currently exporting those commodities to the US. From table 4.10 we see that indeed this is the case. Australian exports of dairy products to the US increase by US$263 million, displacing some US$175 million worth of European Union exports of dairy products to the US. Increased exports of Australian sugar to the US sees the US decrease its sugar imports from other regions — South American exports of sugar to the US fall by US$119 million. It is interesting to note that Japan’s exports to the United States increase by US$117 million as a result of AUSFTA (see table 4.10). Furthermore, Japan ECONOMIC IMPACTS OF AN AUSTRALIA–UNITED STATES FTA 44 4 SIMULATING THE GAINS suffers no trade diversion as a result of Australia increasing its exports to the US. This is a robust outcome — Japan does not have a comparative advantage in dairy and sugar products and is unlikely to export these products to the US, hence there is ‘no trade’ to divert. Japan’s increase in exports to the US reflects the effect of AUSFTA on US real GDP. In table 4.7 we saw that US real GDP is estimated to increase by 0.02 per cent. Growth in US economy is associated with a need for greater imports to satisfy production and household demand, and hence Japan’s exports to the US increase. A similar story can be told for other regions identified in table 4.10, with the exception that these regions experience trade diversion as their dairy and sugar exports to the US are displaced by cheaper Australian products. 4.9 US exports to Australia and trade diversiona Sector Exports to Australia from United States China European Union Japan Other regions US$ million US$ million US$ million US$ million US$ million 249 525 181 604 295 1 854 -51 0 0 -35 -19 -104 -23 -103 -43 -193 -85 -447 -3 -181 -10 -77 -26 -297 -55 -46 -36 -112 -82 -331 Textile, clothing and footwear Motor vehicles and parts Chemicals, rubbers & plastics Other manufacturing All other sectors Total a Numbers may not add due to rounding. Source: GTAP model simulation. 4.10 Australian exports to the United States and trade diversiona Sector Exports to the United States from Australia European Union South America Japan Other regions US$ million US$ million US$ million US$ million US$ million 263 441 154 323 1182 -175 -4 0 126 -53 -4 -119 -1 -8 -133 0 0 0 117 117 -50 -95 13 138 6 Dairy Sugar Textile, clothing and footwear All other sectors Total a Numbers may not add due to rounding. Source: GTAP model simulation. ECONOMIC IMPACTS OF AN AUSTRALIA–UNITED STATES FTA Appendixes 47 A Measures of post-Uruguay Round tariff and non-tariff rates of protection Introduction The quantitative analysis for this study requires estimates of post-Uruguay rates of protection for commodities and services at the level of aggregation of GTAP commodities. However, the latest GTAP database (Version 4 — at the time this study was undertaken Version 5 was not yet available) does not include estimates of post-Uruguay Round protection rates. Therefore, revisions needed to be made. Scope The arrangement being explored here between the United States and Australia is a free trade agreement wherein each country removes its barriers with the other to trade in commodities, services and investment but retains existing arrangements with third countries. That is, initially all identifiable barriers between the two countries that are capable of being removed are considered here, including identifiable barriers to trade and investment on a bilateral basis. This means that removal of say, United States domestic subsidies to agriculture, would not form part of the bilateral agreement. The reason is that there is no easy mechanism for isolating domestic subsidies that impact on a bilateral trading partner in the same way that it is possible to remove a tariff or a quota specifically for products entering from the trading partner. A good example of this would be say cotton. The United States maintains a small tariff against cotton imports but also offers significant domestic subsidies to cotton producers. Both of these interventions hurt Australian cotton producing interests (as well as being contrary to the interests of the United States consumers and taxpayers). The United States and Australia would benefit with the removal of the tariff and the domestic production subsidies. However, to model the effects of forming a preferential free trade agreement only ECONOMIC IMPACTS OF AN AUSTRALIA–UNITED STATES FTA 48 A MEASURES OF POST-URUGUAY ROUND PROTECTION removal of the tariff against cotton imports from Australia can be captured. Removal of domestic production subsidies to cotton — while a potentially good thing for both the United States and Australia — would amount to unilateral reform by the United States. The starting point is therefore to assess the barriers to trade and investment between the two countries. Both countries are reasonably open to world trade and investment now, by world standards at least, but there are some notable exceptions identified below. Most imports now enter the United States either duty free or are subject to very low tariffs with an average estimated to be 2.8 per cent (World Bank 2001). Australia’s tariff regime is similarly open with rates varying between 0 and 5 per cent for 85 per cent of our items and an average tariff rate of 3.8 per cent (World Bank 2001). These estimates of tariffs do not include specific tariffs or some of the important non-tariff barriers such as quotas, and other barriers such as domestic legislation restricting shipping services (the Jones Act). Merchandise tariffs Post-Uruguay Round tariffs are presented in table A.1 for the fifty GTAP sectors. These tariffs, in the main, have been based on overall (i.e, not bilateral) trade weights. However, some adjustments have had to be made for those barriers of significance in the United States and Australia. These adjustments are to calculate the tariff equivalents of non-tariff measures like quotas and to make allowance for the different mix of trade between the United States or Australia compared with the rest of the world for some important aggregate categories like motor vehicles and parts. For example, Australia imports motor vehicles and motor vehicle parts but in a different proportion from the United States than it does from the rest of the world. This is important as there is a large difference between Australia’s tariffs on motor vehicles (15 per cent) and motor vehicle parts (mostly 5 per cent). These adjustments are explained below. ECONOMIC IMPACTS OF AN AUSTRALIA–UNITED STATES FTA 49 A MEASURES OF POST-URUGUAY ROUND PROTECTION A.1 Post-Uruguay tariff rates used for simulations GTAP Sector Aggregation sector Paddy rice Wheat Cereal grains n.e.c. Vegetables, fruit, nuts Oil seeds Peanuts Sugar cane, sugar beet Plant-based fibres Crops n.e.c. Bovine cattle, sheep and goats, horses Animal products n.e.c. Raw milk Wool, silk worm cocoons Forestry Fishing Coal Oil Gas Minerals n.e.c. Bovine cattle, sheep and goat, horse meat products Meat products n.e.c. Vegetable oils and fats Dairy products Butter Cheddar Cheese Mozzarella Cheese Processed rice Sugar Food products n.e.c. Beverages and tobacco products Textiles and clothing Grains Grains Grains Other crops Other crops Wearing apparel Leather products Wood products Paper products, publishing Petroleum, coal products Chemical, rubber, plastic products Mineral products n.e.c. Ferrous metals Metals n.e.c. Metal products Motor vehicles and parts Passenger motor vehicles Light commercial vehicles Transport equipment n.e.c. Electronic and equipment n.e.c. Machinery and equipment n.e.c. Manufactures n.e.c. Post-Uruguay tariffa — US Sugar cane, sugar beet Other crops Other crops Animals and wool Animals and wool Raw milk Animals and wool Forestry and fishing Forestry and fishing Energy, minerals and products Energy, minerals and products Energy, minerals and products Energy, minerals and products Meat products Meat products Other food products Dairy products Other food products Sugar Other food products Beverages and tobacco products Textiles, clothing and footwear and leather products Textiles, clothing and footwear and leather products Textiles, clothing and footwear and leather products Wood and paper products, publishing Wood and paper products, publishing Energy, minerals and products Chemical, rubber, plastic products Mineral and metal products Ferrous metals Minerals and metal products Minerals and metal products Motor vehicles and parts Transport equipment Electronic and equipment Other manufacturers Other manufactures Post-Uruguay tariffa — Australia % % 0.30 1.80 0.00 1.00 3.80 45.00 80.00 0.10 0.90 0.00 0.30 0.00 3.00 0.00 0.20 0.00 0.20 0.00 0.10 1.00 0.00 0.00 0.80 0.00 0.00 0.00 0.00 0.00 0.00 0.00 0.00 0.00 0.00 0.00 0.00 0.00 0.40 2.20 1.80 0.00 23.90 84.60 15.50 23.60 0.30 80.00 1.60 1.40 0.00 0.30 0.00 3.20 5.80 9.90 11.60 15.70 7.30 0.40 0.30 0.70 2.00 3.50 2.50 0.50 1.50 1.40 8.40 5.20 4.60 0.10 2.70 4.40 4.40 2.70 5.50 9.30 15.00 0.00 0.00 2.40 4.80 25.00 0.90 1.40 0.80 2.00 1.30 0.20 2.90 3.90 (Continued on next page) ECONOMIC IMPACTS OF AN AUSTRALIA–UNITED STATES FTA 50 A MEASURES OF POST-URUGUAY ROUND PROTECTION A.1 Post-Uruguay tariff rates used for simulations Continued GTAP Sector Aggregation sector Electricity Gas manufacture, distribution Water Construction Trade, transport Financial, business, recreational services Public admin and defence, education, health Dwellings Utilities and other services Utilities and other services Utilities and other services Utilities and other services Trade, transport Financial, business, recreational services Utilities and other services Utilities and other services Post-Uruguay tariffa — US Post-Uruguay tariffa — Australia % % 0.00 0.00 0.00 0.00 0.08 0.04 0.00 0.00 0.00 0.00 0.00 0.00 0.33 0.97 0.00 0.00 a Includes non-tariff barriers expressed as tariff equivalents. Source: Various. Main United States barriers to Australian merchandise exports Dairy The United States maintains significant barriers to the importation of dairy products. Imports of dairy products into the United States are subject to a tariff rate quota (TRQ) with out-of-quota tariffs set at prohibitive levels. For the major traded dairy products even by the year 2000 global access to the United States market is still only around 3 per cent of 1995 United States domestic consumption. Under the Uruguay Round outcome, global cheese access increased from 110 000 tonnes to 140 000 tonnes. Of the additional 30 000 tonnes, 3000 was allocated to Australia in addition to Australia’s previously existing 4000 tonnes access. This was phased in over the six years to the year 2000. Inquota tariffs range between 10 per cent and 16 per cent and out-of-quota rates would range between 60 per cent and 65 per cent (using international spot prices to calculate ad valorem equivalents where necessary). Australia’s total cheese quota allocation is divided into five varietal categories (cheddar, granular, Swiss/Emmenthaler cheese and other cheese). United States global access also increased over the six years to the year 2000 for the following dairy products: butter from 320 to 7000 tonnes; skim milk powder (SMP) from 820 to 5500 tonnes; and, butteroil from 544 to 6100 tonnes. Ad valorem equivalent tariff rates for the in-quota tariffs are currently around 7 per cent to 8 per cent for butter, less than 1.5 per cent for SMP and 10 per cent for butteroil. Out-of-quota tariff rates are around 100 per cent for butter, 35per cent to 40 per cent for SMP and 120 per cent for butteroil. ECONOMIC IMPACTS OF AN AUSTRALIA–UNITED STATES FTA 51 A MEASURES OF POST-URUGUAY ROUND PROTECTION To determine the ad valorem tariff equivalent of the barriers to trade for dairy products as an aggregate sector, the first step was to calculate the ad valorem equivalent of the individual tariff rate quotas and determine the ad valorem equivalent of any flat specific tariffs using average 2000 prices provided by the Australian Dairy Corporation. Then using import weights we aggregated up to a level where we could use United States production weights, which we used thereafter (sourced from Australian Dairy Corporation 2000). The use of these different weights in this sector is important because of the large quantity of casein Australia exports to the US, which is subject to small specific tariffs (although there have been movements toward introducing restrictive tariff rate quotas on this product also). Therefore, if we were to use a plain import weighting, the final figure would understate the level of protection as casein is relatively unimportant in the industry as a whole. If on the other hand we use a production weighting, the level of protection for the aggregate industry closely mirrors that of cheese, as cheese accounts for such a large proportion of dairy (nonliquid) production. There are also some rules regarding some fresh milk products that restrict our ability to export to the United States. For example, the Federal Milk Import Act 1927 requires a complicated procedure of testing, reporting, and certification before a herd is eligible to export pasteurised milk and cream into the U.S. This is proving to be an impediment to the United States frozen cream market. However, quantifying the effect is difficult and has not been attempted. Sugar The barriers to the importation of sugar in America are by way of TRQ. Under the Uruguay Round outcome the United States provided a yearly global minimum access commitment for imports of sugar and syrup derived from sugar cane or sugar beets of at least 1 139 million tonnes. The inquota tariff rate is US1.4606 c/kg (0.664 c/lb) and the out-of-quota tariff rate is US33.87 c/kg (15.3 c/lb) in 2000. In accordance with the United States agreement to maintain Australia’s minimum import share of 8.3 per cent of the base quota for raw sugar. Australia’s initial allocation for FY 2000-01 has been set at 87 408 tonnes (the same as last year). The operation of the quota heavily restricts Australia’s access to the United States market. We have used an ad valorem tariff equivalent of the tariff rate quota of 80 per cent. This is on the basis of CIE’s estimates of a long-term world price of US10 c/lb. and a price in the United States of US 18 c/lb. ECONOMIC IMPACTS OF AN AUSTRALIA–UNITED STATES FTA 52 A MEASURES OF POST-URUGUAY ROUND PROTECTION Meat The United States maintains TRQ on beef, while all remaining barriers are in the form of straight tariffs. It is generally recognised that the TRQ on beef is not binding (USITC 1999, p. 59), however according to the Global Meat Industries database maintained by the CIE, Australia did fill 92 per cent of its country specific allocation in 2000. The safeguard measures against lamb have received much publicity but have not been taken into account here. This is on the advice of the industry. The measures were defeated in the WTO and the recent appeal against these findings was lost. Regardless, they are due to be phased out next year. The life of the measures can be extended, but the process of doing this is very complicated and unlikely to go ahead. Taking these things into consideration, and also noting that beef accounts for the overwhelming majority of Australian meat exports to the United States, we have used the ad valorem equivalent of the beef in-quota tariff for the ‘Bovine cattle, sheep and goat, horse meat products’ tariff. The in-quota tariff is around US2c/lb and the approximate unit value of Australia’s exports last year was US90c/lb, which is equivalent to a tariff rate of 2.2 per cent. Cotton Imports of cotton into the United States are subject to a TRQ set at 3 per cent of United States domestic consumption in 1995 rising to 5 per cent in the year 2000. Under the Uruguay Round outcome in-quota levels are to increase from 237 980 bales (480 pounds per bale) for 1995 to 369 634 bales from the year 2000 onwards. In-quota imports of cotton are dutiable at free or low rates of duty (depending on type) and out-of-quota imports of cotton were set at US36.9 c/kg in 1995 phasing to US31.4 c/kg in the year 2000. The fill rate for cotton in 1998-99 was 27 per cent. Such low fill rates were attributed by the USITC (1999) to the lack of commercial viability of the small tariff quantities allotted. However, US cotton producers are one of our major competitors in our other export markets, and as such, it would be unlikely that we would be able to compete in their home market. In other words, the tariff rate quota has little effect. The main United States government policy for cotton affecting Australia’s cotton interests is the domestic subsidies, which are taken to be outside the FTA. ECONOMIC IMPACTS OF AN AUSTRALIA–UNITED STATES FTA 53 A MEASURES OF POST-URUGUAY ROUND PROTECTION Wine Australia’s wine industry has been an export success. The United States market is the second largest market after the United Kingdom. It is growing at 30 per cent per annum and is judged by the wine industry to have the biggest potential for success. However, there are restrictions on selling Australian wine in the United States. An importer of wines into the United States must comply with both the federal laws of the US in addition to laws of any individual state in which wine is to be sold. Each State has an agency, which oversees alcohol distribution and the issuing of permits. The restrictions on distribution of wine through particular networks are a hangover from the days of prohibition and the US federal and state governments are not likely to change those arrangements as part of a bilateral FTA. More to the point, the restrictions also apply to domestically produced wine as well as imported wine, so do not constitute a measure that discriminates against foreign goods. Another restriction is on labelling requirements, which are detailed, onerous and strictly enforced. A certificate of label approval, issued by the Bureau of Alcohol, Tobacco and Firearms, is required to effect the release of wine and spirits from Customs. Multilateral efforts are underway to streamline these requirements. Again, this measure also affects domestically produced wine. Therefore it is not a trade issue as such, although reform would help expand trade. Formal barriers to trade amount to a small barrier of 5 per cent. These barriers have been rescinded in the case of imports of wine from South Africa, which is classed as a developing nation. While the actual border measure is quite small, excise inflates the advantage to developing nations. This advantage is estimated to be 50 cents a bottle of wine, where a ‘typical’ bottle of wine could retail for US$10 per bottle. Transport equipment and the Jones Act The category of ‘Other transport equipment’ comprises shipping, airlines and railways. Of particular interest to Australia in this area is the Jones Act. The US Merchant Marine Act 1920 (the Jones Act), the Passenger Services Act 1886, and related laws severely restrict foreign access to the United States shipping services and ship building market. This legislation requires that merchandise and passengers being transported by water between points in ECONOMIC IMPACTS OF AN AUSTRALIA–UNITED STATES FTA 54 A MEASURES OF POST-URUGUAY ROUND PROTECTION the United States travel on United States built, United States flagged, United States manned and United States citizen owned vessels. The effect this has on Australia’s shipping services is considered below under ‘services’ but the restrictions on ship building have the potential to prohibit access to the United States market for Australian built high speed catamaran ferries, in which Australia has a global market leadership position. Nevertheless, it has not prevented fast ferries built in Australia from being used on ferry routes such as Miami to the Bahamas. The possibility of a free trade agreement with the United States raises three questions. What is the economic impact of the Jones Act, would it change or be negotiated in an agreement with Australia and would it make any difference if it was removed on the Australian shipbuilding industry? On the last point, the relevance is that the Australian shipbuilding industry exports are dominated by fast ferries built by Incat in Tasmania and Austal in Western Australia. Of the 61 vessels completed or under order for export in 1996-97, 50 were for fast catamarans and ferries. Australian shipyards built 40 per cent of the ferries delivered worldwide in 1997. At 30 June 1997, 85 per cent of the vessels completed, under construction or on firm order were for export markets. The value of completed vessels amounted to $299 million in 1996-97 and at 30 June 1997, vessels under construction and on firm order for export totalled $500 million. Currently however world demand for fast ferries is slack. Both Incat and Austal have joint ventures with United States partners which assists them in overcoming some ‘made in America’ provisions in selected legislation. Up to 50 fast catamarans could be built by Incat and US shipbuilder, Bollinger, at Lockport, Louisiana over the next decade. However, in the case of ships used by the military, up to half of the boats’ initial construction could be done in Tasmania (Barbeliuk and Waterhouse 2000). This partially overcomes the barriers that exist in that market. The joint venture gives the Australian firm more than just access for 50 per cent of the vessel — it provides local marketing, reputation and contacts to United States customers. In any case, the true effect of the Jones Act can only be gauged by the detail of its rules of origin. For example, it stipulates that all major components of the hull and superstructure have to be built in the United States (Austrade 1999). As mentioned in chapter 2, rules of origin considerations are outside the scope of this report. Also, sales of other boats — such as motor launches made by Riviera Marine — are for the pleasure market. Riviera’s exports to the United States account for half of its sales and it probably has over 10 per cent of the market with sales growing at something like 20 per cent per annum. The ECONOMIC IMPACTS OF AN AUSTRALIA–UNITED STATES FTA 55 A MEASURES OF POST-URUGUAY ROUND PROTECTION competitiveness of this segment of the market is not just an exchange rate phenomenon since many inputs, such as engines and resin, are US$ sourced. The Jones Act would prevent these pleasure type craft from being used for commercial purposes, but the effect would be small since it is not the primary segment Australia competes in. Regarding the question of the possibility of changing the Jones Act, it is worth noting that the Act was not changed for the formation of NAFTA and other bills to modify the Act in the past (for example, the 1998 bill by Senator Sarn Brownbak [R-KS] in the 106th Congress) have failed to win approval. However, it is conceivable that Australia’s specific interests might be accommodated in a more narrowly focused fashion. Estimates of the impact of complete removal of the Jones Act for all potential competitors is approximately US$1.32 billion (USTIC 1999). That estimate is based on a tariff equivalent of 64.6 per cent for shipping services, the area where most of the gain occurs. Partial removal of the Jones Act — that is for just the sale of foreign built vessels — gives a gain to the United States of US$260 million (mid-point range) but a substantial component of the gain is the reduction in shipping services, where Australia is not competitive. Even complete removal of barriers leads to a decline in domestic shipbuilding of 1 per cent. The combined effects of a small impact on shipping equipment with removal of the Jones Act; joint ventures inside the United States for fast ferries; and the political support for the Jones Act; means that we can assume little gain from this aspect of the bilateral trade. We have therefore assumed an arbitrary figure of 5 per cent for ship-building, but given that ship-building is only about 10 per cent of the ‘Other transport equipment’ sector by US production (United States Department of Commerce 2001b), this will be of little significance. Textiles, Clothing and Footwear The US maintains quotas on imports of textile and clothing products of cotton, other vegetable fibres, wool, man-made fibres and silk blends from 45 countries, of which 37 are WTO members. These quotas are subject to the WTO Agreement on Textiles and Clothing (ATC), which replaced the Multi-Fibre Arrangement (MFA). The ATC provides for the gradual and complete integration of clothing and textile products into the WTO by 1 January 2005. After this date the tariff barriers can remain. It is these 2005 tariff levels that we have used in this study for reasons already mentioned. ECONOMIC IMPACTS OF AN AUSTRALIA–UNITED STATES FTA 56 A MEASURES OF POST-URUGUAY ROUND PROTECTION Peanuts Peanuts are subject to a tariff rate quota, which was 48 403 metric tonnes in 1999-2000 and 52 906 in 2000-01. The quota is always filled, and as out-ofquota tariff rates are set at prohibitive levels of around 150 per cent, no outof quota exports are viable from Australia. Also, the overwhelming majority of the quota is given to Argentina. It is worth noting however, that the US is a net exporter of peanuts and can be very competitive due to favourable agroclimatic conditions, and that the TRQ is in place to limit the Treasury’s cost of domestic price support policies. Nevertheless, the price support policies would be unlikely to be part of a FTA as their effect on Australia cannot be isolated, so modelling of a tariff reduction is still appropriate. The c.i.f. price in Rotterdam of US shelled peanuts has been used as the world price. This was US$847 per metric tonne in 1998-992. To determine the world in-shell price 6.6 cents per kilogram was subtracted as shipping costs to Europe, 10 cents per pound was deducted for costs of shelling, culling, etc., and the figure was scaled down by a factor of 1.514 for weight lost through shelling an culling. This was the identical method used by the USITC (1999) and gave a world price of US18.8c/lb when the US price was US28.4c/lb. Using the price gap method this is an ad valorem tariff equivalent of 51 per cent. However, given that the US price fell to US25.4c/lb in 1999-20003 and that the world price was low by historical standards in 1998-99, this figure was scaled back to 45 per cent. The final figure for the oilseeds sector was then taken by the production weight for peanuts of 8.4 per cent4. Tobacco Tobacco is subject to a tariff rate quota with global access set at 150 575 metric tonnes. Of this, Brazil accounts for over 53 per cent. Australia can only export under the allocation to ‘Other countries or areas’, which has an allocation of 3000 metric tonnes, or 2 per cent of the quota. However, the quota would appear to be non-binding (USITC 1999). In 1998-99, the fill of the global quota was 29 per cent, where internationally competitive countries, such as Zimbabwe, did not even get close to approaching their limit (Zimbabwe filled their 45.6, 53.0 and 25.5 per cent of their quota in 1996, 1997, and 1998 respectively). Therefore the in-quota tariff rate is the appropriate barrier to take into consideration, which usually ranges 2 United States Department of Agriculture Foreign Agricultural Service 2001. 3 United States Department of Agriculture Economic Research Service 2000. 4 United States Department of Agriculture Foreign Agriculture Service 2001. ECONOMIC IMPACTS OF AN AUSTRALIA–UNITED STATES FTA 57 A MEASURES OF POST-URUGUAY ROUND PROTECTION between US20c and US40c per kilogram. In any case, out-of-quota rates are set at 350 per cent. Wool The tariffs that apply to raw wool in the United States do not constitute a major barrier to exports. Greasy and scoured wool enter at an ad valorem rate of about 2-3 per cent (the rate varies with price as the tariffs are specific) and wool top enters at a rate of 6-7 per cent. Trade weighted, this works out to be an average of about 3 per cent. Commercial vehicles There is a significant tariff on some commercial vehicles, for example ‘pickups’, of 25 per cent. However, the figures in the motor vehicles and parts sector have been import weighted (total imports have been used in this instance, not just imports from Australia), and as imports of these vehicles are not significant, the trade weighted tariff is not at a very high level. Main Australian barriers to United States merchandise exports Textiles, clothing and leather Tariff rates are at a maximum of 25 per cent for apparel and certain finished textiles and 15 per cent for footwear and woven fabrics. However, there are also a number of lines at 0, 5 and 10 per cent. In fact, just over 50 per cent of tariff lines in the three GTAP sectors: textiles, wearing apparel and leather products have the tariff rate set at 0 or 5 per cent. We used 2000 US import weights to determine the tariff rate for these three sectors, with the overall trade weighted tariff rate being 10.5 per cent. Motor vehicles and parts The tariff rates that apply to the automotive industry are: 15 per cent to passenger motor vehicles (PMV), PMV derivatives, original equipment components and replacement components; 5 per cent on light commercial vehicles and four-wheel drives and all components of these vehicles. There are also a small number of miscellaneous tariff lines that are duty free. ECONOMIC IMPACTS OF AN AUSTRALIA–UNITED STATES FTA 58 A MEASURES OF POST-URUGUAY ROUND PROTECTION Our figure of 9.3 per cent for motor vehicles and parts is calculated using the 2000 US import weights for this sector. Services Information on the quantitative barriers to protection in services represents a major problem for analysis. Hard data on quantitative barriers to services trade does not exist in the same way as there are tariffs on merchandise trade. The problem is that many services, such as restaurant meals, are simply not traded. The barriers to services really amount to the barriers to the right to enter and/or establish and compete for that service in another market. But the effect is the same: restrictions on competition mean that particular services are not provided at the lowest possible price. Bilaterally removing these restrictions would in some cases increase competition, improve efficiency and allow for this service to be provided domestically at more competitive prices. There are many restrictions on services covering banking, the media, aviation and shipping to name some. The best and most recent data on these services barriers are contained in the study by Findlay and Warren (2000) and various Productivity Commission Research papers. To work out what is possible bilaterally, between Australia and America, a case-by-case approach has been adopted as set out below (some of the barriers are also summarised in tables A.5 and A.6). The technical challenge is that if a barrier to services were removed, what impact could Australia have in reducing cost in a very large US economy? At one extreme, even a small player like Australia could have a very large impact on reducing costs in the United States. For example, Impulse airlines entering into Australia had a major effect on the domestic fare reductions for the other airlines, even though Impulse was a minor player. At the other extreme it could be argued that Australia is such a small player it would have a negligible impact on cost reductions in services in the US. We have adopted a conservative approach and assumed that removing restrictions from bilateral trade in services could see one twentieth of the potential cost reduction achieved by Australia’s entry. The factor of twenty is chosen because the US economy is approximately twenty times larger than Australia. ECONOMIC IMPACTS OF AN AUSTRALIA–UNITED STATES FTA 59 A MEASURES OF POST-URUGUAY ROUND PROTECTION Main US barriers to Australian services Aviation Aviation competition is still covered by the system of international bilateral air agreements. There are two issues, one is the international trade in aviation services, and the second is domestic competition. On the international side, Australia and the United States maintain a bilateral agreement that allows entrance into the market on a restricted frequency basis initially, but one that could grow rapidly. However, Australian and United States carriers readily accede to requests for more flights as they arrive, effectively ignoring the bilateral agreement. On the domestic market of each country, foreign carriers are not permitted to compete with domestic carriers. However, Australia’s agreement with CER for example, allows full open skies treatment for carriers of either country to fly in the other. Australia and the United States have been negotiating an ‘open skies’ agreement on aviation. However, this has not progressed very far because the United States have not been prepared to open their domestic market. The domestic market in the United States is competitive in the sense that domestic carriers are allowed to enter and compete in the market as they are in Australia — for example, Impulse Airlines and Virgin Blue have both recently entered the Australian market (although the fate of Impulse is now well known). However, Qantas for example may fly to the United States western seaboard, but cannot pick up extra passengers and fly onto New York. Code-sharing, which amounts to two airlines selling the same sort of seat on a flight, is one attempt to get around this issue and Australian carriers do participate in code-sharing. Another issue is the behaviour and pricing of airline infrastructure, particularly airports. Some airlines have blocked proposals to build competing airports. Some airports have also lobbied and managed to block the expansion of competing airports. Although competition is restricted in the United States, it is most unclear that there would be any effect of an ‘open skies’ agreement with Australia. Given the size of the Australian aviation sector it would be unlikely to have a large impact on the price and size of airline services in the United States market. On the Australian front, it is not clear that United States carriers would have much impact here. Conditions in the domestic market have become tighter, partly as a result of liberalised aviation policy. The lack of progress on an ‘open skies’ agreement so far, and the small size of Australia both as a market and as a competitor, means we have assumed no economic impact from negotiating a free trade agreement between the United States and Australia as far as airlines are concerned. ECONOMIC IMPACTS OF AN AUSTRALIA–UNITED STATES FTA 60 A MEASURES OF POST-URUGUAY ROUND PROTECTION Banking and finance Much of the literature investigating restrictions on United States banking and finance places emphasis on the difficulties in dealing with the myriad of regulations and regulatory bodies, both at the state and federal level. However, most if not all of these restrictions appear to impact on domestic firms just as severely as foreign entrants and as such do not constitute a trade barrier. The major sources of restrictions specific to foreign entrants appear to be investment restrictions, such as commercial establishment limitations and/or citizenship requirements pertaining to depository institutions. One of the most comprehensive lists of these measures pertaining to both foreign and domestic institutions can be found in appendix C of the USITC report, The Economic Effects of Significant US Import Restraints: Second Update. Kalirajan, McGuire, Nguyen-Hong and Schuele (2000) have attempted some calculations of the price effect of the trade barriers specific to the banking sector. They place this figure at about 4.4 per cent for the United States. It is difficult to say if this would apply to other types of financial institutions, for example insurance providers, as restrictions can be quite different (see pages D-59 and D-60 of USITC 2000). For example, joining the Industry Risk Insurers, an underwriting organisation, is much more difficult for foreign insurers but obviously this is irrelevant for banks. Despite this, Australia has had some presence in the United States market, (for example QBE), and it would appear that a free trade agreement would have little impact. This is because: 1. there are few foreign barriers anyway; and 2. the United States market is so large and competitive, Australian companies would find it difficult to gain significant market share. Therefore, no estimate has been attempted for insurance. Shipping services and the Jones Act The impact of the Jones Act was discussed extensively under the category of transport equipment earlier. The main effect is to restrict competition in providing shipping services. As seen earlier, Australia is not competitive in international shipping services and there is no reason to believe we could gain a lot from providing domestic shipping services to the United States in the event that changes were made to the Jones Act. ECONOMIC IMPACTS OF AN AUSTRALIA–UNITED STATES FTA 61 A MEASURES OF POST-URUGUAY ROUND PROTECTION Retail/wholesale trade Retail and wholesale trade comes under the umbrella of ‘distributional services’ which was the subject of a recent Productivity Commission Staff Research Paper (Kalirajan 2000). This study estimated that the cost impact of foreign barriers to establishment is 2.26 per cent, most of which is accounted for by restrictions on the acquisition of commercial land. Of note is that these distributional services make up over 60 per cent of the GTAP ‘trade and transport’ sector. Therefore the restrictions in these services will make up the bulk of the barriers in ‘trade and transport’. E-commerce Under international Internet charging arrangements that reflect the United States origins of the Internet, non-US Internet providers pay all costs of two-way international links with the United States backbone. These arrangements favour United States carriers, consumers and service providers over foreign carriers, consumers and service providers. It has been estimated that the additional direct costs incurred by Australian ISPs in the 1998-99 financial year as a result of these arrangements was A$133 million, with the indirect cost to Australia as a whole in excess of A$500 million over the same period. However, as these effects are extremely difficult to model, they have not been incorporated into the results. Professional services (state-based professional accreditation arrangements) To practice in the United States, professionals must be accredited. The accreditation services fall under State jurisdictions. This creates a burden for professionals wanting to practice in more than one state (for example, for engineering there are 72 different accreditation organisations). However, as with banking and finance, these restrictions would not appear to place domestic professionals at a significant advantage over foreign professionals. There are, however, some important nationality and citizenship requirements that are restrictive, particularly in the legal profession. The other important issue in this area is licensing and recognition of qualifications. Australia has mutual recognition agreements with the United States in accounting and engineering education. However, it is unclear how a free trade agreement would affect these issues. Regardless, there has been some preliminary study by the Productivity Commission of the price impact of barriers to foreign professionals ECONOMIC IMPACTS OF AN AUSTRALIA–UNITED STATES FTA 62 A MEASURES OF POST-URUGUAY ROUND PROTECTION (Nguyen-Hong 2000). Because of the dearth of information, estimates were only provided for engineering services. This was estimated to be 3.6 per cent in the United States where most of this impact is due to licensing and residency requirements. As these restrictions do not appear to be specific for engineering, we have assumed that the price impact is roughly the same across all professions. Telecommunications (burdensome licensing and regulation requirements) There are specific rules on entry into the United States of foreign-affiliated carriers. In public interest reviews for waivers of foreign investment restrictions under section 310 of the Communications Act, licenses to foreign operators can be revoked on ‘public interest’ criteria including ‘trade concerns’, ‘foreign policy’, and ‘very high risk to competition’. Other market access barriers include: the access deficit contribution scheme for interconnection (which raises the cost of terminating calls in the United States for Australian carriers); the limit on foreign direct investment in common carrier radio licenses to 20 per cent; and regulatory benchmarks on accounting rates that must be observed by United States carriers in their relations with overseas carriers that can result in settlement rates for international carriers unrelated to the underlying costs or benefits received. Note that the monopoly of Comsat has not been included in the above list as it has recently been abolished. There are some other minor barriers, and the extent which they affect Australia would seem to be negligible. For example, the conditionality of market access and lengthy proceedings for satellite services (European Commission 2000) would be unlikely to have much affect on Australian exports. Moreover, the most rigorous study to date of the price impact of impediments to trade in telecommunications services (Warren 2000) estimates the effect in the United States to be 0.0 per cent. Health Health in the United States is not publicly funded, except for Medicaid and Medicare, which cover the poor and elderly. Consequently, the health insurance system in the US is extremely large and sophisticated, much more so than the Australian health insurance industry. Therefor a FTA will have little effect on exports to the US. ECONOMIC IMPACTS OF AN AUSTRALIA–UNITED STATES FTA 63 A MEASURES OF POST-URUGUAY ROUND PROTECTION Australia is a less expensive provider of medical services than the United States. It would be possible that US patients may want to take advantage of this and have certain procedures undertaken here. However, people are reluctant to travel long distances for serious medical operations. This would appear to be the reason why there is not more trade in this area at the moment, and a FTA would not overcome this impediment. There may be some room for gain in a mutual recognition agreement as the requirements for foreigners to practice in the US are notoriously difficult to satisfy. However, quantifying the effects of this is too difficult to be attempted here. Main Australian barriers to US services trade Aviation The restrictions on aviation services were discussed earlier under US barriers as they come under the existing bilateral air agreement. Banking and finance The ‘four pillars’ policy in respect to the banking sector remains a major restriction on merger activity. It states simply that the four major banks cannot merge. It does, however, place no restriction on the entry of foreign banks in Australia. Any foreign bank can operate in Australia, the only restrictions being the normal prudential regulations and natural barriers such as lack of customer exposure to the ‘brand name’. These do not qualify as barriers that could be removed in the context of a FTA. Foreign investment above 15 per cent in an existing Australian bank requires approval by the Treasurer under the Foreign Acquisitions and Takeovers Act 1975. To gain approval for acquisition of a bank the proposal has to be reviewed by the government, as provided for under the government’s foreign investment guidelines, and national interest provisions apply. The price impact of these and other miscellaneous foreign trade barriers was estimated to be 9.3 per cent by Kalirajan, McGuire, NguyenHong and Schuele (2000). It would appear that a FTA with the United States would have little direct impact on the insurance market. Firstly, in the Australian market the regulations that bind are enforced by APRA, but it would appear that they are applicable to both foreign and Australian firms. There does not appear to be any discrimination on the basis of country of origin. The big foreign ECONOMIC IMPACTS OF AN AUSTRALIA–UNITED STATES FTA 64 A MEASURES OF POST-URUGUAY ROUND PROTECTION players in the market are the Europeans and if the US thought that the Australian market was lucrative they would have already entered. They have not done so as the market is very competitive and there are no big margins to be made. However, there are a couple of prudential regulations that may mean foreign firms find it more difficult to set up in Australia than expand business in their home country. For example, a guiding principle for insurance regulators everywhere is to ensure providers have local assets to meet local liabilities, but this not seen as artificial barriers to trade. Therefore there would be little additional activity in the insurance sector, so we have not incorporated any price impact estimate into the model. Media ownership and content Foreign investment in the Australian media sector is regulated under the Foreign Acquisitions and Takeovers Act 1975 and its associated regulations which requires all direct foreign investment proposals to be subject to prior approval. Proposals involving portfolio shareholdings of 5 per cent or more must also be submitted for examination. There are explicit restrictions on investments in newspapers. All proposals by foreign interests to acquire an interest of 5 per cent or more in an existing newspaper or to establish a new newspaper are subject to case-by-case approval. A maximum foreign investment/involvement in national and metropolitan newspapers of 30 per cent and a single foreign shareholder maximum interest limit of 25 per cent. A maximum level of aggregate foreign interest in provincial and suburban newspapers of 50 per cent. The Broadcasting Services Act 1992 (BSA) also places specific restrictions on foreign ownership in commercial and subscription television services. In the case of commercial television broadcasting services: – individual foreign interests are limited to 15 per cent; – aggregate foreign interests are restricted to 20 per cent; – no foreign persons may be in a position to exercise control of a commercial television broadcasting licence; and – no more than 20 per cent of directors may be foreign persons. There are also Australian content provisions under the Broadcasting Services (Australian Content) Standard 1999, Television Program Standard ECONOMIC IMPACTS OF AN AUSTRALIA–UNITED STATES FTA 65 A MEASURES OF POST-URUGUAY ROUND PROTECTION for Australian Content in Advertising, the Federation of Australian Radio Broadcasters (FARB) industry’s code of practice, and the Broadcasting Services Act 1992. Commercial free to air television is the most heavily regulated, with quota requirements for Australian programming overall and for several program categories. In 1999 these were: Australian programming transmission quota of 55 per cent; Australian drama score of 255 points per year (about 80–258 hours depending on program categories shown); 130 hours of first release Australian children’s (C) programs, including Australian children’s drama requirement of 32 hours. Eight hours of repeat drama per year must also be shown; 130 hours of Australian preschool (P) programs per year; and Australian first release documentary requirement of 15 hours per year (it was 20 hours in 2000). In addition to these requirements, 80 per cent of the advertising on television needs to be local and at least 10 per cent of program expenditure for adult and children’s pay TV channels needs to be local. To comply with the CER, New Zealand programs and Australia/New Zealand programs are treated equally with Australian programs for the purpose of adhering to the local content standard in television and advertising. This is specified in s. 160(d) of the Broadcasting Services Act 1992. In contrast, the local music content requirements for radio apply specifically to Australian product. These local music requirements are determined based on the predominant format of the service in accordance with the scale detailed in A.2. It has been argued that the local content broadcasting requirements are necessary in maintaining current levels of local production. However, the A.2 Australian music content requirements for radio Applicable Australian content requirement Format of service Mainstream rock, Album orientated rock, Contemporary hits, Top 40, Alternative No less than 25 per cent Hot/Mainstream adult contemporary, Country, Classic rock No less than 20 per cent Soft adult contemporary, Hits and memories, Gold (encompassing Classic Hits), News Talk/Sports talk No less than 15 per cent Oldies, Easy listening, Easy gold, Country gold No less than 10 per cent Nostalgia, Jazz, NAC (smooth jazz) No less than 5 per cent Australian Broadcasting Authority 1999. ECONOMIC IMPACTS OF AN AUSTRALIA–UNITED STATES FTA 66 A MEASURES OF POST-URUGUAY ROUND PROTECTION Gonski Review of assistance to the film industry (Gonski 1997) found that: …the quota is generally reached through the broadcast of television news and current affairs and sports and infotainment programs. There is general recognition that the transmission quota has had little impact on the actions of commercial broadcasters in program decision making. Commercial broadcasters regularly exceed the transmission requirements contained in the standard, suggesting other factors — most importantly viewer preference of Australian material — influence broadcasting decisions. Below table A.3 indicates the compliance to the local content restrictions for the 1999 calendar year. From this data, it would appear that the overall Australian quota of 55 per cent provided some response in the market. However, it is worth noting that the figures for 1999 are not significantly different from the 1996 figures, which were: Seven, 58.6 per cent; Nine, 60.73 per cent; and Ten 51.4 per cent. This was when the quota was set at 50 per cent. Therefore, there is scope to argue the fact that the current level of Australian programming could be at its ‘natural’ level (apart from Network Ten). Moreover, the Productivity Commission, in its review of broadcasting (Productivity Commission 2000c), found that Australian sport, news and current affairs programs are very popular and would not be easily substituted with imported programs. However: Other categories of Australian programming that are included in the overall quota but not captured by the sub-quotas, may be reduced in the absence of the overall quota. These include Australian variety, light entertainment, lifestyle and game shows, which are often copied from overseas program formats and may be easily replaced with imported versions of similar programs…for a lower price. (p.406) A.3 Australian content and children’s television standards compliance 1999 Networks Australian programs Australian drama % Minimum requirementa Australian documentary Hours Score 55 Hours Australian Australian children’s preschool C programs P programs Australian children’s C drama First Release Hours Repeat Hours Hours Hours 225 15 32 8 130 130 Sevenb 57.8 218.1 340.3 30.1 33.0 30.5 133.0 130.5 Ninec 63.6 126.0 277.2 44.2 33.5 71.8 131.5 133.0 Tend 56.4 216.3 260.0 16.0 32.5 45.0 130.5 130.5 aThese have time restrictions applied to them. For example, the overall quota is for programming between 6.00 a.m. and midnight. bThe Seven Network simple average for Sydney, Melbourne, Brisbane, Adelaide and Perth. cThe Nine Network simple average for Sydney Melbourne and Brisbane. dThe Ten Network simple average for Sydney, Melbourne, Brisbane, Adelaide and Perth. Source: Australian Broadcasting Authority 2001. ECONOMIC IMPACTS OF AN AUSTRALIA–UNITED STATES FTA 67 A MEASURES OF POST-URUGUAY ROUND PROTECTION For this and other reasons, the Productivity Commission was not able make any firm conclusions on the effect of the overall quota. In the case of children’s and preschool programming, there is little doubt that the quotas, apart from the quota on repeats of children’s drama, increase production in this area. There is very little over-quota production, and the Productivity Commission supports the point. In addition, the Productivity Commission concluded that the adult drama and documentary quotas influence broadcasting decisions. There is, however, scope to argue that the quotas are not ‘biting’ as significant over quota production occurs. Finally, the Productivity Commission found no evidence that locally produced commercials would decline in the absence of the advertising quota, and recommended its removal. This was supported by the fact that: In every year that the quota has operated, a far higher proportion (around 90 per cent) of advertisements on commercial television has been made than is required by the quota. (pp. 409-410). As mentioned, programs made in New Zealand have been eligible as Australian for quota purposes. This has been the case since March 1999 when the Australian Broadcasting Authority amended its standards in the wake on a High Court ruling that deemed the content restrictions inconsistent with Australia’s international agreements, including the CER. However, the Commonwealth Government has amended the Broadcasting Services Act 1992 with the aim of limiting the effect of the High Court’s decision to the CER agreement. Given this last point, and the fact that there is uncertainty as to which quotas influence broadcasting decisions and the difficulty of modelling these barriers anyway, we are not attempting to incorporate these restrictions in our quantitative analysis. Retailing and wholesaling As was the case with the United States, retail and wholesale trade was covered by Kalirajan (2000). The total effect of foreign barriers was calculated to be a 0.57 percentage cost impact. This can be broken down into a 0.32 per cent price effect due to restrictions on foreign investment, and 0.25 per cent impact due to restrictions on the movement of people. ECONOMIC IMPACTS OF AN AUSTRALIA–UNITED STATES FTA 68 A MEASURES OF POST-URUGUAY ROUND PROTECTION Health There appear to be no barriers to the entry of foreign firms into the health insurance market in Australia. However, returns in the Australian market are not very high as it is a highly regulated sector with a competing state sector. Therefore if premiums become too high, then consumers will turn away from privately managed health funds. This means a FTA would probably have little effect. As mentioned, Australia is a less expensive provider of medical services than the United States, so any barriers that we do maintain have little effect on US access. This also means that any mutual recognition agreement may have little effect, as it is unclear why US practitioners would come to Australia in significant numbers. In any case, the requirements for foreign specialists/GPs to practice in Australia have a similar reputation for severity as the United States requirements. The trade of paramedical services is complicated by different licensing requirements and functions. For example, paramedics in Australia are permitted to perform functions that only doctors can perform in the United States. These issues make discussion of the outcomes of negotiations highly uncertain and so we have not considered any changes in our aggregate analysis. In addition, there are no barriers to investment in private hospitals apart from the usual Foreign Investment Review Board requirements. For these reasons, no barriers in the health sector have been modelled. Education It would appear that there are also few barriers in the education sector. For example, private universities can be established provided the Foreign Investment Review Board approves as it has to do with any substantial foreign investment. This, of course, acknowledges that universities must have their status recognised by government, but this does not discriminate on the basis of country of origin. Similarly, students are free to be educated in either country provided appropriate fees are paid (for example, United States students are not eligible for HECS). ECONOMIC IMPACTS OF AN AUSTRALIA–UNITED STATES FTA 69 A MEASURES OF POST-URUGUAY ROUND PROTECTION Other issues There are several other trade issues that could surface during the course of negotiations of an FTA with the United States. The treatment of these issues for this analysis follows. Quarantine Australia and the United States maintain quarantine regimes to protect their domestic production against the introduction of disease. Sometimes the charge is made that these quarantine restrictions amount to protection. This results in disputes such as the importation of salmon from Canada to Australia. Also, the United States has argued that Australia keeps out chicken, pork, corn and Californian grapes unnecessarily. But Australia and the United States are signatories to the Phytosanitary agreement of the Uruguay Round and quarantine access is judged based on transparent risk assessment procedures. It is an on-going debate whether those risk assessment procedures are the right ones. However, for this analysis we assume these procedures are being applied correctly on both sides. To apply any other approach would be highly speculative and without economic or scientific merit. In any case, some of the quarantine measures do have only a small economic effect. For example, the US industry estimates the value to the United States of California table grape access into Australia to be between US$12 and US$19 million (USTR 2001). We should also note that quarantine issues can be isolated down to a bilateral problem. Many quarantine measures typically are specific to particular countries or regions. For example, beef from Europe and indeed grapes from California. In this way the quarantine issue is distinct from the subsidy issue. Intellectual property In July 1998, the Australian Federal Government made it legal for retailers to import CDs without permission from the major recording companies (which have strong links to parent United States companies), in a practise known as parallel importing. CDs could be imported from South-East Asia bringing prices down for consumers. Since this time, the average price of CDs available at specialist music stores has indeed trended downward. Nominal prices were in fact 6.1 per cent lower in December 2000 than the average price that prevailed immediately prior to deregulation. In real terms this is equivalent to a 13 per cent reduction in price (ACCC 2001a). ECONOMIC IMPACTS OF AN AUSTRALIA–UNITED STATES FTA 70 A MEASURES OF POST-URUGUAY ROUND PROTECTION Much of the imported top 40 product to date has been sourced from South East Asia, despite predictions that the US would be the major supplier. This appears to be an exchange rate phenomenon. However, if the Australian dollar’s value is restored, it is still expected that there will be imports from the US (ACCC 2001a). In a case before the Federal Court, the Australian Competition and Consumer Commission (ACCC) has alleged that Warner and Universal ‘have taken unlawful action in order to discourage or prevent Australian businesses from selling competitively priced ‘parallel’ imports of compact discs’ (ACCC 1999a). This unlawful action was alleged to have involved the cut-off of supply to retailers (ACCC 2001b). Therefore, it could transpire that United States interests request Australia to negate parallel imports. This seems even more likely considering the fact that the United States Trade Representative has recently expressed concern regarding the changes to copyright legislation (United States Trade Representative 2001). In regard to other items the Government introduced the Copyright Amendment (Parallel Importation) Bill 2001 on 28 February. This gives effect to the Government’s policy of repealing the importation provisions as they apply to legitimately produced books, periodicals, printed music, and software products. Australia, by and large, has higher prices for these items than does the US. In fact: for the 12.5 year period 199-89 to December 2000, Australians have been paying around 44 per cent more for best selling fiction paperbacks than US readers; over the same period, Australian consumers paid, on average 8.9 per cent more for best selling paperback fiction than UK readers; for the six and a half years to December 2000, Australians have paid, on average around 18 per cent more best-sellers other than hard-back fiction than US readers; in March 2001 Australian consumers were paying 23.2 per cent more for technical and professional books than US consumers, and 18.4 per cent more than UK consumers; and in February–March 2001 Australian consumers were paying 11.5 per cent more for business software products than those in the US, but 3.6 per cent less for PC games software (ACCC 2001a). While the Australian Competition and Consumer Commission caution against making long term predictions using spot prices, if the Act was passed there may be scope for the US to export some of their products to Australia. This is even more likely as ECONOMIC IMPACTS OF AN AUSTRALIA–UNITED STATES FTA 71 A MEASURES OF POST-URUGUAY ROUND PROTECTION One of the reasons that some publishers oppose opening the market is that booksellers are likely to import the overseas hardback (still in production in the US) in competition with the large format paperback (produced in Australia). (ACCC 1999b, p. 27) However, the devaluation of the dollar has meant that the current price differentials are smaller than some of the above averages indicate. In any case, Labor is likely to oppose the amendment (Gordon 2001) so passage through the Senate is not guaranteed. Therefore, given the above considerations and the political uncertainty, any change to our parallel import laws has not been modelled. Single desk Australia maintains single desk (export monopoly) arrangements for wheat and sugar. The United States has in past negotiations on agriculture under the auspices of the WTO argued strongly for the removal of these arrangements. The United States may raise this issue as part of the bilateral negotiations. These single desk arrangements are in the same category as domestic subsidies on agriculture. It is impossible to isolate in a policy sense that component of single desk contrary to the interests of the bilateral trading partner. Either way, the net effect is small — of the order of 1 or 2 per cent positive or negative. Any change to single desk, if it could occur politically, would have marginal impact on the estimates of effects here and so no change has been assumed. Government procurement The United States government procurement market is subject to a range of domestic preference legislation. The main measures in this area are as follows: Trade Agreements Act of 1979 The Trade Agreements Act 1979 imposes a general prohibition on certain government agencies from sourcing any goods or services from countries that are not signatories to the GPA. However, the Act allows the President to waive the prohibition if the non-GPA member: has agreed to apply transparent and competitive procedures to its government procurement equivalent to those in the GPA, and maintains and enforces effective prohibitions on bribery and other corrupt practices in connection with its government procurement. ECONOMIC IMPACTS OF AN AUSTRALIA–UNITED STATES FTA 72 A MEASURES OF POST-URUGUAY ROUND PROTECTION Buy American Act of 1933 The Buy America Act 1933 stipulates that Federal Agencies buy only goods mined, produced or manufactured in the US, except in the following cases: US goods are not available in sufficient quantity and satisfactory quality; the cost is unreasonable (assessed to be so of the offered price of a domestic product exceeds the price of a foreign product by 6 per cent, or 12 per cent if the domestic offer is from a small business concern or any labour surplus firm); or it is inconsistent with the public interest to purchase US articles, material or supplies. The Buy America Act does not apply to services and is only applicable at the Federal level. Also, the US waives the provisions of the Act for certain defence procurement from Australia. Balance of Payments Act This Act applies to procurement for use outside the US. It stipulates the conditions were non-US suppliers can be used. Small and Minority-owned business set-asides The United States has quite a comprehensive and complex scheme of assistance for small and minority owned businesses. These include loans and grants, programmes to encourage bids, and set-asides of certain contracts. These have recently been revised at the Federal level in the wake of the 1995 Supreme Court case Adarand Construction, Inc. v. Pena, which has had an impact on targeted preferential programs in particular. The impact of some of these changes over the longer term is difficult to say. However, long standing, permanent set asides are not likely to be supported, and any preferences are likely to be more focussed and rigorous than those of the past (US Small Business Administration 2000). In a review of the WTO Agreement on Government Procurement (GPA), the Department of Foreign Affairs and Trade found that of the above measures, the Trade Agreements Act 1979 and the Buy America Act 1933 were significantly restrictive on Australian exporters (Department of Foreign Affairs and Trade 1995). It should be noted that this DFAT report was commissioned a number of years ago, and as such some of the conclusions have the potential to be outdated. In any case, no numerical estimate was given to the extent of the barrier and no recent attempt has been found elsewhere. ECONOMIC IMPACTS OF AN AUSTRALIA–UNITED STATES FTA 73 A MEASURES OF POST-URUGUAY ROUND PROTECTION The United States waives provisions of some of these restrictions for parties to the GPA. As Australia has not acceded to the GPA it does not benefit from these waivers. In any case, some provisions of the domestic preference legislation would continue to apply even if Australia were a signatory. This is because the GPA only applies to procurement: by the procuring entities that each Party has listed in its schedule relating to central government entities, sub-central government entities and other entities such as utilities: – of goods, – all services and construction services that are specified in positive lists; and above certain threshold values. Each Party indicates the levels of minimum thresholds that apply to the procurement of goods and services. On the other hand, Australia does have certain programs in its market for government procurement. At the Federal level, for projects with a value over $A10 million, departments and agencies are required to include any industry development requirements and information on associated evaluation methodologies and opportunities for small and medium sized enterprises in tender documentation such measures can pose a problem for overseas suppliers. In addition, all Commonwealth departments and agencies must purchase at least 10 per cent of their requirements from small and medium sized enterprises. Moreover, there is one other program that is applicable to information technology firms. The Partnerships for Development program commits government contracts recipients to a range of industrial development activities. At the State level several states continue to have formal preference margins on imported content ranging from 10 per cent to 20 per cent. However, these are used infrequently (WTO 1998). A 1996 Bureau of Industry Economics study attempted to estimate the tariff equivalents of the preferences given to Australia producers in government procurement. The study used the Baldwin Richardson methodology, see box A.4. These figures were not particularly large except for the nonresidential construction; education, museum and library services; and the entertainment and recreational service industries. However, given the assumptions made to generate the figures, we would hesitate to place them into the model. For example, the assumption that the government would import the same proportion of non-residential construction services as the private sector in the absence of discriminatory measures is problematic. The government commissions the building of bridges, roads etc., activities that the private sector does not engage in to such a degree. Moreover, the ECONOMIC IMPACTS OF AN AUSTRALIA–UNITED STATES FTA 74 A MEASURES OF POST-URUGUAY ROUND PROTECTION A.4 The Baldwin and Richardson methodology This methodology assumes that in the absence of discriminatory policies, government entities would behave in the same way as private firms. Thus, without discriminatory purchasing, the government’s propensity to import good j (mj = imports / total consumption) would be identical to that of the private sector. Assuming that government demand (Gj) is perfectly inelastic, undistorted government imports can be estimated as h a mjGj (Mj ). The actual government imports of good j (Mj ) can be subtracted from this estimate to obtain an estimate of the margin of preference: h Dj = Mj -Mj a The marginal contribution to the tariff of this discrimination (∆tj) can be implied by this through the formula: ∆tj = Dj/ηjMj h where ηj is the price elasticity of demand for imports, assumed to be -2. Source: Bureau of Industry Economics 1996 assumption that the price elasticity of imports is –2 can lead to problems if we are focussing on specific industries. Given this, and that 1990-91 data was used (when different policies were in effect), we are not placing these figures into the model. The omission of any government procurement estimate (as opposed to entering in some arbitrary number) is further justified by the findings of the previously mentioned GPA review. Here it was found that: …there may be little justification for the view that if Australia joined the AGP (Agreement on Government Procurement), it would experience a significant upswing in direct overseas competition for government contracts. At the federal level, Australia is already a relatively open government market with procurement opportunities advertised by internationally accessible means, including the Internet. (Department of Foreign Affairs and Trade 1995). Pharmaceutical Industries Investment Program The Pharmaceutical Industries Investment Program aims to compensate the pharmaceutical industry for the government using its monopoly power under the Pharmaceutical Benefits Scheme. It does so by paying higher prices on certain products to participating companies that undertake specified activities in Australia. As such, to determine what proportion of this scheme impacts upon United States companies specifically is an impossible and meaningless task. ECONOMIC IMPACTS OF AN AUSTRALIA–UNITED STATES FTA 75 A MEASURES OF POST-URUGUAY ROUND PROTECTION Standards Standards can facilitate or inhibit trade in a number of areas. One area of significance is in the information industries. Part of this sector was dealt with under telecommunications but there are other areas such as computer hardware and software, where differing standards between the United States and Australia could act as a barrier to trade. However, the extent to which these barriers could be overcome appears to be very limited. For example, neither Australia or the United States are likely to change the voltage of their electricity supply as a result of an FTA. In addition, there appears to be the usual problem in the United States of differing regulations applying to different jurisdictions. As mentioned elsewhere, many of these restrictions do not discriminate between suppliers on the basis of country of origin and so is not considered an international trade barrier in our analysis. In any case, the United States is a, if not the, market leader in this area and the scope for exports in to the market is severely limited. In addition, the market is changing so rapidly that standards quickly become irrelevant and to concentrate on them would be to risk missing the market opportunity. For these reasons, any alterations to standards in the information industries has not been modelled. ECONOMIC IMPACTS OF AN AUSTRALIA–UNITED STATES FTA 76 A MEASURES OF POST-URUGUAY ROUND PROTECTION A.5 Australian restrictions in services trade Service Approximate Impact Source of restriction Business services n.a. Communications services Foreign ownership of Telstra is limited to 35 per cent, while foreign investment in the sector is determined on a case by case basis within the Commonwealth’s general foreign investment policy under the Foreign Acquisition and Takeovers Act 1975. 0.30 % Financial services Allows foreign access to stock exchange on a reciprocal basis. In McGuire 1998, 165 limitations on market access are identified, but it is unclear what effect some of these have. n.a. Banking and securities services Any acquisition above 15 per cent of an Australian bank requires the permission of the Treasurer, and any foreign investment needs the approval of the government. 9.30% Insurance services The Insurance Act 1973 requires that both Australian incorporated general insurers, and general insurance branches of foreign insurance companies must be authorised in order to conduct business in Australia. Agents of unauthorised foreign insurers can operate in Australia as long as they are registered under the Insurance (Agents and Brokers) Act 1984. n.a. Air transport Issues of capacity, routing, traffic rights, airline safety, security, tariffs, ownership and control, commercial opportunities and customs duties are dealt with in bilateral air service agreements, one was signed with the United States in 1993. In the cas eof domestic airlines, the usual approval must be sought. For international airlines a similar process, but there is a limit of 40 per cent of the equity in Qantas may be held by foreign interests. n.a. Maritime transport Under Australia’s cabotage regime, coastal operations are limited by the Navigation Act 1912 to licensed operators. The Act does not restrict licenses by class or nationality of shops, although crew are required to be paid Australian wage rates. Port services have now been largely privatised or corporatised. n.a. Transport services Professional services 0.7% Distribution services (comprises commission agents, wholesalers, retailers, franchisors) Media 0.57% Proposals involving portfolio shareholdings of 5 per cent or more must be in accordance with the Foreign Acquisitions and Takeovers Act 1975. There is a maximum foreign investment/involvement in national and metropolitan newspapers of 30 per cent and a single foreign shareholder maximum interest limit of 25 per cent. A maximum level of aggregate foreign interest in provincial and suburban newspapers of 50 per cent. For television services individual foreign interests are limited to 15 per cent and 20 per cent in aggregate. No foreign persons may be in a position to exercise control of a license and no more than 20 per cent of directors may be foreign. Foreign investors in subscription television are limited to 35 per cent and a maximum of 20 per cent for individuals. There is no restriction on commercial radio or other broadcasting services under the BSA. Local content for broadcasting is not Australian programming transmission quota of 55 per cent Australian drama score of 255 points Australian children’s drama requirement of 32 hours of first released and eight hours repeat drama; and Australian first release documentary requirement of 15 hours. n.a. Source: WTO (1998,1999), US International Trade Commission (1999,2000), APEC (1999), Ministry for International Trade and Industry (2000), European Commission (2000), McGuire (1998), Nguyen-Hong (2000), Kalirajun (2000), Findlay and Warren (2000), Department of Foreign Affairs and Trade, Centre for International Economics. ECONOMIC IMPACTS OF AN AUSTRALIA–UNITED STATES FTA 77 A MEASURES OF POST-URUGUAY ROUND PROTECTION A.6 United States restrictions in services trade Approximate impact Service Source of restriction Business services Lack of transparency in and divergence of access conditions at state level. Communication services Signatory to the WTO Basic Telecommunications Agreement. The Federal Communications Commission (FCC) maintains a ‘public interest’ criteria which can be invoked to deny licenses to foreign operators. Individual state commissions retain the authority to regulate rates, terms and conditions of intra-state trade or non radio services. Although they cannot grant monopoly rights. Also, the access deficit contribution scheme raises costs of terminating calls in the United States for Australian carriers. Licenses for cable landings are only granted to applicants in partnership with United States entities. Personnel limitations are a condition of license transfers to non-US companies. To participate I the market, when a foreign company participates in the home country market, the international settlement fees applied are to within benchmarks set by the United State government. 0.0 % fixed Financial services Complicated with a myriad of regulations and regulatory bodies both at the state and federal levels. However, the aggregate effect of these restraints on trade is believed to be small. A list can be found in appendix C of USITC report. The most significant include investment restrictions, such as commercial establishment limitations and/or citizenship requirements pertaining to depository institutions. n.a. Banking and securities services Foreign mutual funds have not been able to make public offerings because the SEC’s conditions make it impractical to do so. If a bank is an affiliate or subsidiary of a foreign bank, at least half of the board members have to be United States citizens. For further restrictions, see D-59 of UK report. 4.4% price effect Insurance services Insurance for maritime vessels built under federally guaranteed mortgage funds are given to United States providers where possible. Foreign branches are not permitted to provide surety bonds for United States government contracts. Other see D-60 of UK report. Non-US insurers also face prudential requirements such as deposit and fee requirements. No foreign firms have been put on the list to provide tender and performance guarantees required for projects commissioned by agencies. Fixed percentages of US directors is required. Joining the Industry Risk Insurers, an underwriting organisation, is difficult for foreign forms because it requires licenses in all 50 states, but some states have severed restrictions on foreign licenses. n.a. Transport services Transport funded by the United States government of cargo or passengers must be performed by United States carriers. n.a. Air transport Foreign investors cannot hold more than 49 per cent in a domestic United States carrier, and a maximum of 25 per cent of the voting rights. Crews must be foreign nationals. Section 1117 of the Federal Aviation Act requires that any transport funded by the United States government is performed by United States carriers. Open Skies agreement regulate access for international routes. Repairs have recently been liberalised. Foreign providers for computer reservation system services and foreign selling and marketing are normally afforded national treatment. Such activities are covered by United States bilateral air transport agreements and reciprocity requirements. The provision of United States domestic air services is restricted to United States carriers with less than 25 per cent foreign voting equity. Government financed transport must be on United States carriers. US-Australia arrangements are government by the 1993 agreement. n.a. n.a. (Continued over page) ECONOMIC IMPACTS OF AN AUSTRALIA–UNITED STATES FTA 78 A MEASURES OF POST-URUGUAY ROUND PROTECTION A.6 United States restrictions in services trade Continued Approximate impact Service Source of restriction Maritime transport Foreign built vessels are prohibited from engaging in coastwise trade, dredging, towing and salvaging. Certain types of government owned or financed cargoes to be carried on United States flagged ships (a minimum of 50 per cent in total). All export-import bank and military cargo must be on United States ships. Relevant legislation on p.67 of EU document. Other laws restrict foreign ownership of, and the citizenship of crews on, United States flag and United States registered ships, and reserve transport of certain types of cargo to United States ships, e.g. Alaskan oil, cargoes o the Great Lake sin trade with Canada and various government cargoes, but this is only a small proportion. The provision of these restrictions come from the 1920 Merchant Marine Act, the 1886 Passenger Services Act, and related laws. In general, not more than 25 per cent of the crew can be legal aliens. The United States Outer Continental Shelf Lands Act excludes foreign investment in supply of transport from a point in the United States to a offshore drilling rig or platform on the Continental Shelf. Truck transport Standards Satellite launch services Federal agencies must buy these services from United States providers Professional services Many restrictions are based at the state level, but there is no reason to believe that these are more of a disadvantage to foreign professionals than American professionals. Mutual recognition agreements exist for Australia in accounting, and in engineering education, but many of the restrictions seem to be in recognising foreign qualifications. Believed to have a narrow impact Legal services There is no cross border supply, but it is unconstitutional to prevent someone from practising law on the basis of citizenship. However, registration is state-based and foreign citizens need to satisfy various requirements and be a United States national, p.215 of the TPR. Only 24 US states and districts have been confirmed to accepted US lawyers. Assumed same as for engineering Accounting A mutual recognition agreement exists. Nationally restrictions only in AL and NC. Residency requirements are in effect in half of the states. Limitations on one Visa category for temporary employment and full local examination is required (even though we have the MR agreement). Some restrictions on form, they allow professional corporations, limited liability partnerships and companies. Require on locally qualified owner. Assumed same as for engineering Engineering services A mutual recognition agreement exists with respect to engineering education. Some states have nationality or residential requirements. 3.6% price advantage domestic companies Distribution services (comprises commission agents, wholesalers, retailers, franchisors) Examples (not necessarily in the United States) include import licenses, local government requirements, restrictions on promotion and acquisition of commercial land, licensing requirements on management, IPR, government monopolies, restrictions on FDI. 2.26% price advantage of domestic providers E-commerce Under international Internet charging arrangements that reflect the United States origins of the Internet, non-US Internet providers pay all costs of twoway international links with the US backbone. n.a. Audiovisual services A single company or firm is not permitted to own a combination of newspaper and broadcast stations serving the same local market. Radio and television licenses cannot be held by a company with foreign control above 25 per cent. n.a. 64.6% tariff equivalents for Jones Act n.a. n.a. Source: WTO (1998,1999), US International Trade Commission (1999,2000), APEC (1999), Ministry for International Trade and Industry (2000), European Commission (2000), McGuire (1998), Nguyen-Hong (2000), Kalirajun (2000), Findlay and Warren (2000), Department of Foreign Affairs and Trade, Centre for International Economics. ECONOMIC IMPACTS OF AN AUSTRALIA–UNITED STATES FTA 79 B The GTAP and APG-Cubed models Global Trade Analysis Project GTAP is the global modelling framework developed as part of the Global Trade Analysis Project, which was established in 1992. GTAP is supported by a fully documented, publicly available, global database and underlying software for data manipulation and implementing the model. The GTAP framework consists of a system of multisector country economywide models linked at the sector level through trade flows between commodities and factors of production. The latest GTAP database (version 4) divides the global economy into 45 regions, with 50 sectors of economic activity within in each region. GTAP is a comparative static, general equilibrium model. Other models of the world economy of this type include Whalley’s (1985) model of world trade, the Michigan model of world production and trade (Deardoff and Stern 1986), the RUNS model (Goldin, Knusden and van der Mensbrugghe 1993), the WALRAS model (Burniaux et al 1990), the CIE’s global trade model (Stoeckel, Pearce and Banks 1990) and the SALTER model (Zeitsch et al 1991). Like the GTAP model, these models include full general equilibrium features of individual economies and link these economies through international trade. Some (for example, the latest version of SALTER) also have linkages through international capital markets. In the GTAP model the activities of economic agents — consumers, producers and government — are modelled according to neoclassical economic theory. Consumers are assumed to maximise utility and producers to maximise profits. Markets are assumed to be perfectly competitive. Production exhibits constant returns to scale. Different regions and economies are linked through trade. Some of these assumptions — for example, constant returns to scale — mean that the gains from trade liberalisation will typically be understated by GTAP. ECONOMIC IMPACTS OF AN AUSTRALIA–UNITED STATES FTA 80 B THE GTAP AND APG-CUBED MODELS The change in welfare reported by the GTAP model arises principally from the reallocation of resources within an economy and the resulting change in allocative efficiency. Welfare may also change as a result of terms of trade effects, which may be significant for some countries. GTAP does not permit any statement about the time path of benefits and capital flows that allow consumers to borrow and so vary their real consumption patterns over time. Important dynamic gains from trade liberalisation are not captured in a comparative static model of this kind. Accounting for investment flows The GTAP framework allows users to specify whether the global allocation of investment is fixed or flexible. The former view assumes that the regional composition of capital stocks does not change in response to the policy change, meaning that global and regional net investment move together. As shown by the accounting identity A.1, provided there is little change in regional savings, fixing the global bank’s allocation of investment effectively fixes the trade balance (capital account) for each country/region. S−I ≡ X −M+R A.1 Identity A.1 states that national savings (S) minus investment (I) is equivalent to the current account, where R is international transfer receipts (which are set to zero in the GTAP database) (Hertel 1997). Alternatively, the allocation of investment across regions can be made flexible, driven by the (expected) rate of return to capital. Investors are assumed to behave in such as to equate the rate of return across regions. Investment flows to/from a region depend on that region’s rate of return to capital relative to the rate prevailing elsewhere. By identity A.1, an increase in regional investment would be associated with a deterioration in the current account and a strengthening of the terms of trade. Investment in the GTAP model does not come on-line in the simulation period, meaning that the capital stock within an economy is fixed. This outcome is essentially a short run proposition — the simulation period is too short to allow any investment that may affect the stock of capital. GTAP’s investment theory does not allow it to be used for true long-run policy analysis (Hanslow et al 2000 p.21). To reflect the underlying short-run nature of GTAP’s investment theory, GTAP model parameters have been set so that the regional composition of investment is fixed but expected rates of return to capital are allowed to vary between regions. Fixing the composition of global investment limits ECONOMIC IMPACTS OF AN AUSTRALIA–UNITED STATES FTA 81 B THE GTAP AND APG-CUBED MODELS changes in the trade balances of economies modelled. The APG-Cubed model, which is better equipped than GTAP to incorporate and model changes to financial and capital flows, will be used to investigate the effects of AUSFTA on capital flows and accumulation. The GTAP database As the GTAP model will be used for the detailed sectoral results, it is important that the underlying database is as up-to-date as possible. Version 4 of the GTAP database — the latest available — is based on 1995 data. However, since 1995 changes will have occurred to the structure and size of various economies within the model. For example, the 1997-98 Asian economic crisis was a major disruptive force on world trade and investment flows. To improve the accuracy of the country and sector detailed results it is important that the database be updated to reflect changes that have occurred since 1995. The underlying GTAP database was updated in a three-step procedure. First, the input–output base was updated to 1997-98 for just Australia, which is where ‘most of the action’ will occur given the relative size of the two economies. This step also included correcting for apparent inconsistencies/irregularities in the GTAP database and revision of key parameters. Second, for the US, Japan, the European Union and other major economies a limited update — that is forcing GDP and trade figures to line up with actual outcomes — was undertaken. The update was to year 1997-98. Third, for Australia, in addition to the input–output update, a aggregate GDP and trade figures were updated to 1998–99 was undertaken. The salient point to note from the above three steps is that the GTAP database has been updated, and in a few instances, corrected for apparent irregularities. An example of the latter is the Australian sector of ‘Sugar cane, sugar beet’ (SCB). When such irregularities have been identified, the database has been aligned to contemporary trade and production patterns. Updating and adjusting the GTAP database means that the results reported in this study will not be able to be replicated by other researchers using the 1995 GTAP database. To replicate the results reported here, the CIE version of the GTAP database is required. ECONOMIC IMPACTS OF AN AUSTRALIA–UNITED STATES FTA 82 B THE GTAP AND APG-CUBED MODELS It is important to recognise that the trade flows contained in the updated database will be underpinned by the exchange rate(s) prevailing at that time. For Australia, this means an A$:US$ exchange rate of 0.64 (A$1 buys US$0.64). This needs to be kept in mind when interpreting the GTAP modelling results. Aggregating the GTAP database GTAP has considerable regional and commodity detail, encompassing 45 regions and 50 sectors. Due to the size of the underlying database, an aggregated version of the database has been used to analyse a FTA between Australia and the United States. Aggregation of the database allows us to focus on the key regions and sectors of interest while keeping the modelling at a manageable and tractable level. The 45 regions and 50 sectors have been condensed to 16 regions and 24 sectors. Mapping between the 45 region 50 sector GTAP database and the aggregated 16 region 24 sector version used here is shown in tables B.1 and B.2. APG-Cubed The G-Cubed (Asia Pacific) model emerged from a research program designed to link two strands of quantitative economic modelling: traditional multisectoral general equilibrium models — which capture interactions between sectors but which are often static, do not generally incorporate the financial sector and do not have full macroeconomic closure; and macroeconomic models — which are mostly dynamic and have full macroeconomic closure but which usually do not capture intersectoral interactions and often do not have a well-specified supply side. Origins of G-Cubed (Asia Pacific) model The origins of G-Cubed (Asia Pacific) are the MSG2 macroeconomic model (McKibbin and Sachs 1991) and the G-Cubed model. Both of these models have proved successful in a wide variety of applications. The G-Cubed model has been an important tool in analysing greenhouse gas policy in the global economy (McKibbin and Wilcoxen 1998). Several features of G-Cubed (Asia Pacific) make it an ideal tool for analysing the effects of trade liberalisation with endogenous productivity and risk premiums. ECONOMIC IMPACTS OF AN AUSTRALIA–UNITED STATES FTA 83 B THE GTAP AND APG-CUBED MODELS B.1 Mapping between databases — GTAP regions Aggregated GTAP regions GTAP regions Australia Australia Canada Canada Chile Chile China China Hong Kong European Union Denmark Finland Germany Great Britain Sweden Rest of European Union Japan Japan Republic of Korea Korea Mexico Mexico New Zealand New Zealand Other ASEAN(6) Indonesia Malaysia Philippines Thailand Vietnam Rest of Asia Taiwan India Pakistan Rest of Asia Rest of Europe Iceland, Norway and Switzerland Central European Associates Former Soviet Union Rest of World Morocco Rest of Middle East Rest of North Africa Rest of Sub-Saharan Africa Rest of Southern Africa Rest of World South Africa Singapore Singapore South America Argentina Brazil Central American & Caribbean Columbia Rest of Andean Pact Rest of South America Uruguay Venezuela United States ECONOMIC United States IMPACTS OF AN AUSTRALIA–UNITED STATES FTA 84 B THE GTAP AND APG-CUBED MODELS B.2 Mapping between databases — GTAP sectors Aggregated GTAP sectors GTAP sectors Grains Paddy rice Wheat Cereal grains nec Vegetable, fruits, nuts Oil seeds Plant-based fibres Crops nec Sugar cane, sugar beet Bovine cattle, sheep and goats, horses Animal products nec Wool, silk-worm cocoons Raw milk Forestry Fishing Coal Oil Gas Minerals nec Petroleum and coal products Bovine cattle, sheep and goats, horse meat products Meat products nec Vegetable oils and fats Processed rice Food products nec Dairy products Sugar Beverages and tobacco products Textiles Wearing apparel Leather products Wood and wood products Paper products, publishing Chemicals, rubber and plastics Mineral products nec Metals nec Metal products Ferrous metals Motor vehicles and parts Transport equipment nec Electronic equipment Machinery and equipment nec Manufacturing nec Electricity Gas manufacture, distribution Water Construction Public admin and defence, education, health Dwellings Trade, transport Financial, business, recreational services Other crops Sugar cane, beet Animal products Raw milk Forestry and fishing Mining and energy Meat products Other food products Dairy Sugar Beverages and tobacco Textiles, clothing and footwear Wood and paper products, publishing Chemicals, rubber and plastics Other mineral and metal products Ferrous metal products Motor vehicles and parts Other transport equipment Electronic equipment Other manufacturing Utilities and other services Trade and transport Financial, business and recreational services ECONOMIC IMPACTS OF AN AUSTRALIA–UNITED STATES FTA 85 B THE GTAP AND APG-CUBED MODELS With its macroeconomic detail, and integrated real and financial markets, G-Cubed (Asia Pacific) can account for the effects of a financial shock on interest rates, exchange rates and international capital movements. It can also account for the effects of different government fiscal and monetary responses to these shocks. The model fully integrates wealth effects on consumption and captures debt burdens and expectations. With its explicit treatment of expectations, G-Cubed (Asia Pacific) can account for the ways in which future policy changes that are credible can affect economic activity in the early stages of implementation. As a global general equilibrium model, G-Cubed (Asia Pacific) accounts for the interactions between sectors and between regions. Thus, it can capture the effects of policy changes and shocks within an economy and between economies. As a dynamic model, G-Cubed (Asia Pacific) can account explicitly for the time paths of policies and shocks. By contrast, the comparative-static modelling frameworks used in traditional computable general equilibrium models do not include treatment of dynamics, interest rates, expectations or capital movements. Country to industry coverage G-Cubed (Asia Pacific) separately identifies 18 countries/regions. Table B.3 sets out the economy and six sector coverage of the version of G-Cubed (Asia Pacific) used in this study. Some food items occur in non-durable manufacturing, and the mapping between G-Cubed (Asia Pacific) and SIC sectors is shown in table B.4. B.3 Economy and industry coverage of G-Cubed (Asia Pacific) Countries Industry sectors Australia New Zealand Energy China OECD Europe and Canada Mining Chinese Taipei OPEC (ex. Indonesia) Agriculture Eastern Europe Other Non-durable manufacturing Hong Kong, China Philippines Durable manufacturing India Republic of Korea Services Indonesia Singapore Japan Thailand Malaysia United States ECONOMIC IMPACTS OF AN AUSTRALIA–UNITED STATES FTA 86 B THE GTAP AND APG-CUBED MODELS B.4 Relationship between G-Cubed (Asia Pacific) and SIC sectors for agriculture and non-durable manufacturing G-Cubed (Asia Pacific) SIC code Agriculture 01 Agricultural production — crops (excluding cereal preparations and flour) 02 Agricultural production — livestock and animal specialities 07 Agricultural services 08 Forestry 09 Fishing, hunting, and trapping 24 Lumber Non-durable manufacturing 20 Food and kindred products (including cereal preparations and flour) 21 Tobacco products 22 Textile mill products 23 Apparel and other finished products made 26 Paper and allied products 27 Printing, publishing and allied industries 28 Chemical and allied products 30 Rubber and miscellaneous plastics products Key features Detailed specifications of the theoretical structure of G-Cubed (Asia Pacific) can be found in McKibbin (1996). The key features of G-Cubed (Asia Pacific) are that it: ECONOMIC specifies the demand and supply sides of industrialised economies; integrates the real and financial markets of these economies; fully accounts for stocks and flows of real resources and financial assets; imposes intertemporal budget constraints so that agents and countries cannot indefinitely borrow and lend without undertaking the resource transfers necessary to service outstanding liabilities; has short run behaviour that is a weighted average of neoclassical optimising behaviour and liquidity constrained behaviour; has a real side that is disaggregated to allow for production and trade of multiple goods and services within and between economies; has full short and long run macroeconomic closure with annual macrodynamics around a neoclassical growth model; and can be solved for the full rational expectations equilibrium annually from 1996 to 2100. IMPACTS OF AN AUSTRALIA–UNITED STATES FTA 87 B THE GTAP AND APG-CUBED MODELS Like other models, G-Cubed (Asia Pacific) essentially consists of a theoretical framework, data and parameters. Theory The model theory consists of behavioural and accounting relationships. The model recognises a number of economic agents including firms, households and government. Firms Each sector is represented by a firm, which chooses its inputs and level of investment so as to maximise its stockmarket value, subject to a multiple input production function and output prices (which are given as far as the firm is concerned). Sectoral output is produced using capital, labour, energy and materials. Energy and materials are aggregates of inputs of intermediate goods, which are in turn aggregates of imported and domestic commodities that are assumed to be imperfect substitutes. The capital stock in each sector changes according to the rate of fixed capital formation and the rate of depreciation. Investment is subject to rising marginal installation costs so that total real investment is the value of purchases plus the per unit cost of installation. The per unit cost is a function of the rate of investment. This implies that, once in place, it is costly to move physical capital between sectors. In contrast, financial capital is perfectly mobile. The goal of each firm is to choose its inputs to maximise intertemporal net (of tax) profits. Taxes included are a corporate income tax, taxes on inputs (such as a carbon tax) and an investment tax credit. Wages Wages are determined by assuming that labour is mobile between sectors in each region, but not between regions. Thus, each sector in a region pays the same wages. Wages in a particular country adjust according to an overlapping contracts model where nominal wages depend on current and expected inflation and on labour demand relative to labour supply. Long run labour supply is determined by the (exogenous) rate of population growth. In the short run, hours worked can fluctuate. For a given nominal wage the demand for labour determines short run unemployment in each ECONOMIC IMPACTS OF AN AUSTRALIA–UNITED STATES FTA 88 B THE GTAP AND APG-CUBED MODELS sector. This varies, depending on the composition of demand for each sector’s output. Households Household behaviour is assumed to be a weighted average of two types of behaviour. In the first, households aim to maximise intertemporal utility subject to a wealth constraint. Wealth consists of human wealth and financial assets. Human wealth is the present value of the expected future stream of after-tax labour income. Financial wealth is the sum of real money balances, real government bonds, net claims against foreigners and the value of capital in each sector. In the second type of behaviour, households base their consumption on after-tax current income. Government Real government spending is exogenous and constant as a share of GDP. Government consumption is financed by taxes (corporate and personal income taxes) and by issuing government debt. The government budget must balance in present value terms but need not balance in any single period. Thus, if the government runs a budget deficit today, it must run an appropriate budget surplus at some point in the future. If not, the government will be unable to pay interest on debt and private agents will not be willing to hold it. The specific fiscal closure chosen is that at every instant in time the government must levy a lump sum tax equal to the value of interest payments on the outstanding debt. Financial markets and balance of payments The model accounts for flows of assets between regions, consistent with the flows of goods. The model specifies that money is required to undertake transactions and so the demand for money is a function of GDP and short term nominal interest rates. The supply of money is exogenously chosen by the central bank in each region. Asset markets are assumed to be integrated across regions. The model allows for risk premiums on assets held in different currencies. These are calculated as part of the baseline of the model and are designed to replicate 1996. When undertaking simulations it is assumed that risk premiums are independent of the shock under consideration. ECONOMIC IMPACTS OF AN AUSTRALIA–UNITED STATES FTA 89 B THE GTAP AND APG-CUBED MODELS For the results reported in this paper, exchange rates are assumed to be floating. Also, it is assumed that OPEC (Organisation of Petroleum Exporting Countries) chooses its foreign lending in order to maintain a desired ratio of income to wealth and that Eastern Europe and the former Soviet Union, as well as other developing countries, are constrained in what they can borrow from the rest of the world. In these countries, any available foreign exchange — given a current account constraint, the demand for exports and the servicing costs of external borrowing — is allocated to imports of goods from all other regions. Comparing GTAP to APG-Cubed The GTAP and APG-Cubed models are quite different. APG-Cubed captures some dynamic effects which GTAP cannot. APG-Cubed also takes into account structural adjustment costs that emerge from the reallocation of labour and capital between sectors when trade barriers fall. It is also possible to compare the effects of varying the rate of liberalisation — whether over, say, a five year period or a ten year period. Because the APGCubed model includes a specification of capital markets and captures financial flows, it can provide detailed information about the effects of trade liberalisation on the macroeconomy. This study has used both models so that the advantages of each can be exploited — greater country and sector detail from the GTAP model and more information about the macroeconomy, financial flows and timing of effects from the APG-Cubed model. ECONOMIC IMPACTS OF AN AUSTRALIA–UNITED STATES FTA 90 C Sugar A partial equilibrium analysis Perhaps the most distorted market in the United States that is of interest to Australia is sugar. As such, it is worth exploring some more detailed effects through a partial equilibrium analysis. This analysis is useful because we can identify more explicitly the gains and losses that accrue to each party, and we can also identify more readily the changes occurring in the marketplace. Firstly, assumptions are needed on the elasticities of the demand and supply curves. We have estimated that demands in the American and Australian markets have an own price elasticity of 0.1, and that supply elasticities are 1 in Australia and 1.5 in America. The supply elasticity is higher in America due to the presence of high fructose corn syrup in the market, which is much more vulnerable to price changes. Assumptions on supply and demand were not made in any other third country markets. This is because it has been assumed that the price changes in these markets are small enough that the ‘triangles’ of welfare gains/losses through price responses will be negligible when compared with the ‘rectangles’ of straight transfer resulting from the price change. Secondly, an assumption was needed on the effect of the agreement on Australian consumers. It may be possible, even if remote, that a free trade agreement with the United States will mean all of the Australian produced sugar will be exported to the United States, and demand in our domestic market will be met from cheap imports from say Thailand. This would happen if sugar were a perfectly homogenous good. In practice this is not quite the case. Therefore, we assume that Australian produced product will still supply Australian consumers. In the rest of the analysis, however, we do assume that sugar is a homogenous product for simplicity. Finally, an assumption also needs to be made in regard to the continuation of the US quotas afforded to other countries such as Brazil. It is conceivable that upon signing a FTA with Australia, the US will eliminate all imports from other countries with prohibitive tariffs. They will be able to do so ECONOMIC IMPACTS OF AN AUSTRALIA–UNITED STATES FTA 91 C SUGAR because imports will exceed the minimum 1.139 million tonnes bound by the WTO Agreements. On the other hand, the US may choose to keep the existing arrangements with other exporters. As it is unclear what the actual outcome may be, both situations were calculated. Firstly, let’s consider the case where imports from other countries no longer occur. All of Australia’s production now either serves the US or Australian markets. The price of sugar in both markets now equilibrates at the point where Australian exports equal US imports. This is at a level of US14.05c/lb. Therefore Australian price increases from its base of US10c/lb. and the US price decreases from its base of US18c/lb. The shaded region in chart C.1 indicates the gain to Australia through higher producer prices over the costs to Australia through higher consumer prices. This takes into account the costs of extra production and the loss of welfare due to the fall in consumption (the ‘triangles’). There is also a fine subtlety that we need to consider, but does not make a huge amount of difference to the bottom line. Previous exports to the US attracted a quota rent that accrued to Australia. The size of the rent was the quantity exported, which was 0.08 Mt, multiplied by the premium attracted, which was the US price less the tariff less the world price. Therefore the total gain to Australia is the shaded region, estimated to be US$556 million less the loss of quota rent, estimated be US$13 million, giving a net gain of US$543 million. The effect on the American market is shown in the lower graph of chart C.1. Areas A+B+C give the net gain to America through the lower cost of consumption over the cost of lower return to production. However, the US will also loose the tariff revenue generated by the tariff rate quota, which is given by area E. It has been estimated that areas A+B+C is US$386 million while the loss of tariff revenue will be US$20 million, leaving a net gain of US$366 million. The effect on other countries can also be considered. Exporters will be subject to two opposing forces. Firstly, the fact that all of Australia’s exports will now be directed to the US will place upward pressure on the world price, which of course will be beneficial. On the other hand, the exporters will loose any quota rents earned from their exports to the US market, which is equal to area B+D. The extent to which exporters gain or loose will depend upon the proportion of their exports that go to the US. The impact on importers will necessarily be negative because of the increase in world price. The CIE has estimated that in this partial equilibrium setting, the increase in world price will be US0.4c/lb. or US$0.009/kg. The basis for this comes from previous work that the CIE has completed. ECONOMIC IMPACTS OF AN AUSTRALIA–UNITED STATES FTA 92 C SUGAR C.1 Effects of a FTA if there are no imports into the US from other countries Changes in Australian market Price Supply 14.05 c/lb 10 c/lb Demand 0.97 1 6 8.4 Mt Changes in United States market Price Supply 18 c/lb A 14.05 c/lb B C D 10.7 c/lb 10 c/lb E Demand 12.4 18 19.4 19.8 Mt Data source: CIE estimates. ECONOMIC IMPACTS OF AN AUSTRALIA–UNITED STATES FTA 93 C SUGAR We only need to consider the export and import quantities because the effect of the price change on the sugar produced and then consumed domestically is simply a transfer from consumers to producers. This transfer nets out to have zero effect on welfare. Also, as mentioned, we have assumed that the price change is so small that the ‘triangles’ of welfare changes in these markets can be ignored. Therefore the overall gains and losses to selected countries is shown in the tables C.2 and C.3. C.2 Effect on exporting countries if imports into the US from other countries are discontinued. Gain from Loss of quota increase in world Exports to the rent Exports price US Country Brazil European Union Thailand Cuba Dominican Republic The Philippines Net Gain (Loss) Mt US$ million Mt US$ million US$ million 8.29 3.84 3.75 3.43 0.18 0.09 73.1 33.9 33.1 30.2 1.6 0.8 0.12 0 0.01 0 0.18 0.09 19.4 0 1.6 0 29.1 14.6 53.7 33.9 31.5 30.2 (27.5) (13.8) Source: ABARE 2000, United States Department of Agriculture Economic Research Service 2001, and CIE estimates C.3 Effect on importing countries if imports into the US from other countries are discontinued. Country Imports Loss Mt US$ million Russian Federation 5.25 46.3 Japan 1.51 13.3 Source: ABARE 2000 and CIE estimates Now consider the case where the US maintains their quotas on sugar from other countries. The effects upon the Australian and US markets are shown in chart C.4. Note that the price in these markets is now 13.43 c/lb., lower than was the case when imports from other countries were not permitted. Intuitively this is explained by the fact that Australian exports are no longer required to make up the entire gap between US consumption and US production, so the price response in the Australian market is not as high. Consequently, Australian and United States production is lower compared with the alternative case, and consumption is higher. The method of calculating the gains to each country remains the same as before, except that the US now retains the tariff revenue equal to area E (except for the revenue from Australian product, which was negligible and so ignored). The net gain to Australia is now US$444 million and the net gain to the US is now US$492 million. Note that Australia’s gain is less and the United States’ gain is greater than in the alternative case. This is because in ECONOMIC IMPACTS OF AN AUSTRALIA–UNITED STATES FTA 94 C SUGAR C.4 Effects of a FTA if imports from other countries continue Changes in Australian market Price Supply 13.43 c/lb 10 c/lb Demand 0.97 1 6 8.1 Mt Changes in United States market Price Supply 18 c/lb A 13.43 c/lb B C D 10.7 c/lb 10 c/lb E Demand 11.6 18 19.4 Mt Data source: CIE estimates. ECONOMIC IMPACTS OF AN AUSTRALIA–UNITED STATES FTA 19.9 95 C SUGAR Australia, where production exceeds consumption, higher prices lead to higher gains, and in the United States, where consumption exceeds production, lower prices lead to higher gains. The aggregate gain of these two markets is US$936 million compared with US$909 million in the alternative case. The calculation for other major trading countries is now complicated by the fact that the countries exporting to the US no longer loose the entire quota rent, which is area B+D. Instead, these countries now loose just area B, as they still retain the quota, and by implication the rent at the new price (area D). As the price in the US market is lower than in the alternative case, the US is now importing more sugar in total. This exerts upward pressure on world prices. CIE’s estimate is that price will now increase by 0.55 c/lb. These two beneficial effects reinforce each other to deliver a larger gain or a lower loss to the exporting countries, as can be seen in table C.5. Because the world price is now higher, obviously importing countries are now going to be affected more severely, which is shown in table C.6. One note needs to be made here in regard to the treatment of the Philippines and the Dominican Republic. It has been assumed that these countries produce at world prices. This is not true — both countries export only to the United States as neither can compete at world prices. Therefore each country may experience production shifts which will work to mitigate the losses they experience. This means that the figures quoted will overstate the losses for both countries. C.5 Effect on exporting countries if imports into the US from other countries remain. Country NonUSexports Gain from increase in world price Exports to the US Loss of quota rent Net Gain (Loss) Mt US$ million Mt US$ million US$ million 8.17 3.84 3.74 3.43 0 0 99.0 46.6 45.3 41.6 0 0 0.12 0 0.01 0 0.18 0.09 12.1 0 1.0 0 18.1 9.1 86.9 46.6 44.3 41.6 (18.1) (9.1) Brazil European Union Thailand Cuba Dominican Republic The Philippines Source: ABARE 2000, United States Department of Agriculture Economic Research Service 2001, and CIE estimates C.6 Effect on importing countries if imports into the US from other countries remain. Country Imports Loss Mt US$ million Russian Federation 5.25 63.7 Japan 1.51 18.3 Source: ABARE 2000 and CIE estimates ECONOMIC IMPACTS OF AN AUSTRALIA–UNITED STATES FTA 96 C SUGAR General equilibrium effects: a complication Some caution needs to be exercised in accepting these above results without qualification. Such a partial equilibrium analysis by definition misses some of the transfers, gains and losses. For example, an expansion in sugar production in Australia may displace some beef production. If there are distortions in the beef market (subsidies, taxes, etc.) there will be some effect to bottom line welfare. In addition, we miss some terms-of-trade (TOT) effects and so forth. In practice, partial equilibrium estimates usually overstate the gains. Furthermore, the assumption that all sugar is homogenous (apart for Australian consumers) may also result in an inflated estimate of the gains. In practice the US will differentiate Australian sugar from Brazilian or Thai sugar. An example of such differentiation in an apparently homogenous market would be the way Japan differentiates between coal from Australia and that from South Africa. In the sugar market, it would appear that the largest determinants of differentiation are transport costs and quality. Other factors, such as seasonality, don’t appear to have a significant effect. In any case, if there were differentiation, the response in the US market will not be as extensive as shown above. To gauge the differences, liberalisation of the sugar sector only was conducted using GTAP. This experiment removes the current tariff of 80 per cent applying to Australian sugar imports. Removal of the tariff sees the price of Australian sugar in the US falling by 38 per cent. The immediate effect of the price reduction is that domestic US users substitute away from sugar sourced domestically and from other countries to the now relatively cheaper Australian sugar. Accordingly, exports of Australian sugar to the US increase by over twenty-fold. It should be recognised, however, that this rather substantial increase applies to a very low base. Due to the increased (export) demand, the price of sugar in Australia rises by 13 per cent. The reason for the large increase in exports to the US but relatively small increase in Australia’s sugar price is that there is a lot of switching from other export markets to the US. For example, Australian sugar exports to Japan decrease by 47 per cent and South American sugar exports to the US decrease by 21 per cent. Hence not all of the 2550 per cent increase in Australian sugar exports to the US is new trade creation — some of it has come from trade diversion. The fall in sugar exports to Japan is picked up by other countries, such as South America, whose sugar exports to Japan increase by 22 per cent. ECONOMIC IMPACTS OF AN AUSTRALIA–UNITED STATES FTA 97 C SUGAR Increased prices result in increased profitability. This encourages output of the Australian sugar sector to expand by 8 per cent. The expansion effect places additional demand on production inputs, thereby bidding up the price of these inputs. The increase in production costs eliminates the above normal profits thereby removing the incentive for the sugar sector to expand. Price rises are transmitted to other sectors of the Australian economy, with the end result being a very slight price rise (≈0.02 per cent) experienced by other sectors. A notable exception is the sugar cane sector, which experiences a 22 per cent price rise. Given that the price of sugar output rises by 13 per cent, sugar cane must account for around 60 per cent of the downstream sugar sector’s production costs. Increased exports of now higher priced products improve Australia’s TOT by around 0.2 per cent. Australian real GDP increases by 0.04 per cent as a result of the US sugar liberalisation. In the US, the market price of sugar falls by only 0.9 per cent despite Australian sugar now being 38 per cent cheaper. This reflects the share of Australian sugar in total US sugar consumption (Australia has around 0.3 per cent of the total US sugar market) and the extent to which US purchasers differentiate between sugar from different sources. The fall in US sugar price is associated with output of the US sugar sector falling by 1.4 per cent. To pay for the increase in (sugar) imports, the US must now export more. To export more, the price of US exports must fall relative to exports from other regions, and US supply prices fall marginally. Lower priced exports result in a very slight TOT deterioration for the US (but contributes to Australia’s TOT gain as US imports are now cheaper). Note that it would appear from these results that sugar is not a product with a high degree of homogeneity. However, it should be stressed that GTAP is a short-run model. Over the long run it would be expected that the US would be more willing to substitute away from sugar in other countries and into Australian sugar. This would then drive the results closer to those seen in the partial equilibrium analysis. ECONOMIC IMPACTS OF AN AUSTRALIA–UNITED STATES FTA 98 References ABARE 2000, Australian Commodity Statistics 2000, Canberra. Alcorn, G. 2001, Quarantine Ban Leaves US in a Sour Mood, The Sydney Morning Herald, 11 April 2001. Austrade 1999, Understanding United States Coastwise Laws and their impact on Australian Marine Exports, April 1999. Australian Broadcasting Authority 2001, Australian Content and Children’s Television Standards Compliance 1999, http://www.aba.gov.au/what/ program/pdf/compl_99.pdf, Accessed 26 April 2001. —— 1999, Commercial Radio Codes of Practice & Guidelines, October. Australian Competition and Consumer Commission 2001a, Summary of the Commission’s March 1999 Report on the Potential Consumer Benefits of Repealing the Importation Provisions of the Copyright Act 1968 as they Apply to Books and Consumer Software, April. ——2001b, ‘Parallel Imports of CDs, Sony Provides Undertakings to the Court’, ACCC Media Release, 2 April 2001. ——1999a, ‘ACCC Institutes Against Record Companies’, ACCC Media Release, 3 September 1999. —— 1999b, p. 27, Potential Consumer Benefits of Repealing the Importation Provisions of the Copyright Act 1968 as they Apply to Books and Consumer Software, March. Australian Dairy Corporation 2000, Dairy Compendium 2000, Australian Dairy Corporation 2000. APEC 1999, United States of America Individual Action Plan for APEC, August. Barbeliuk, A. and Waterhouse, C. 2000, Incat Clinches American Deal Partnership with US Builder, The Mercury p.5, December 30 2000. Burniaux, J.M., Delorme, F., Leinert, I. and Martin, J.P., 1990, ‘WALRAS — a Multisector, Multi-country Applied General Equilibrium Model for Quantifying the Economy-wide Effects of Agricultural Policies’, in Modelling the Effects of Agricultural Policies, OECD Economic Studies, No. 13, Paris. Bureau of Industry Economics 1996, WTO Agreement on Government Procurement – Potential Implications for Australia of Accession, AGPS, Canberra, December. ECONOMIC IMPACTS OF AN AUSTRALIA–UNITED STATES FTA 99 REFERENCES CIE, (Centre for International Economics) 2000, Barriers to Wool Fibre Products Trade: Costs to US Consumers and Australian Woolgrowers, a joint study by the CIE, and The Trade Partnership, Washington D.C., April. ——1998, Asia’s Meltdown and Agriculture, a study commissioned by The World Bank, Union Offset Co. Pty Ltd, Canberra. ——1997, Review of the Victorian and South Australian Barley Marketing Act 1993, under the National Competition Policy Review of Legislative Restrictions on Competition, a confidential final report prepared for the Department of Natural Resources and Environment, Victoria and Primary Industries South Australia, Canberra. Deardoff, A.V. and Stern, R.M. 1986, The Michigan Model of World Production and Trade, MIT Press, Cambridge, MA. Department of Foreign Affairs and International Trade 2001, North American Free Trade Agreement Annex 401, Section 8, http://www.dfait-maeci.gc.ca/nafta alena/chap24-e.asp, Accessed on 2 May 2001. Department of Foreign Affairs and Trade 2001, Australia’s Trade, Outcomes and Objectives Statement: Trading into the Future, Paragon Printers, Canberra. —— 2000a, The APEC Region trade and Investment, incorporating the Australian Supplement, Market Information and Analysis Unit, Australia, November 2000. —— 2000b, Composition of Trade Australia 1999/00, Market Information and Analysis Unit, Canberra, October. —— 1999, Global Trade Reform, Maintaining Momentum, CanPrint, Canberra ——1995, Agreement on Government Procurement – Review of Membership Implications, http://www.dofa.gov.au/ctc/publications/purchasing/international/wto/ world_trade_organisation_agree.html, Accessed on 23 April 2001. European Commission 2000, Report on United States Barriers to Trade and Investment, Brussels, July. Frankel, J.A. and Romer, D. 1999, ‘Does trade cause growth?’, American Economic Review, vol. 89, no. 3, pp 379–99. Finlay, C. and Warren, T. 2000, Impediments to trade in Services, Measurments and Policy Implications, Routledge Studies in the Growth Economies of Asia, Routledge, London. Goldin, I, Knudsen, O. and van der Mensburgghe, D., 1993, Trade Liberalisation: Global Economic Imnplications, OECD and World Bank, Paris. Gonski, D. 1997, p. 56, Review of Commonwealth Assistance to the Film Industry, Department of Communications and the Arts, Canberra. Gordon, G. 2001, Demand to Lower the Price of Books, The Age p.1, 4 April 2001 ECONOMIC IMPACTS OF AN AUSTRALIA–UNITED STATES FTA 100 REFERENCES Hanslow. K., Phamduc. T. and Verikios, G., 2000, The Structure of the FTAP Model, Productivity Commission Research Memorandum No. 58, February 2000. Hertel T. W. (editor) 1997 Global Trade Analysis: Modelling and Applications, Cambridge University Press, Cambridge MA. Industry Commission 1997, The Automotive Industry, Volume I: Report, Report No. 58, 26 May, AGPS, Canberra. —— 1997, The Textiles, Clothing and Footwear Industries, Volume I: Report, Report No. 59, 9 September, AGPS, Canberra. IMF (International Monetary Fund) 2000, World Economic Outlook, October 2000, http://www.imf.org/external/pubs/ft/weo/2000/02/pdf/append.pdf, Accessed 10th April 2001. Kalirajan, K. 2000, Restrictions on Trade in Distribution Services, Productivity Commission Staff Research Paper, AusInfo, Canberra, August. Kalirajan, McGuire, Nguyen-Hong and Schuele 2000, The impact on output of impediments to trade in investment in telecommunications services, in Finlay, C. and Warren, T. (eds) 2000, Impediments to Trade in Services, Measurments and Policy Implications, Routledge, London 2000. McGuire, G. 1998, Australia’s Restrictions on Trade in Financial Services, Productivity Commission Staff Research Paper, AusInfo, Canberra, November. Ministry for International Trade and Industry 2000, White Papers/Reports, http://www.meti.go.jp/english/report/data/gCT00coe.html, Accessed 16 March 2001. McKibbin, W and Stoeckel, A 1999, East Asia’s Response to the Crisis: A Quantitative Analysis, paper prepared for ASEM Regional Economist’s Workshop: From Recovery to Sustainable Development, Denpasar, Bali, September 15–17. McKibbin, W 1996, Quantifying APEC Trade Liberalisation: A Dynamic Analysis, Working Paper in Trade and Development no. 1, Economics Department, Research School of Pacific and Asian Studies, Australian National University, Canberra, and Brookings Discussion Paper in International Economics no. 122, Brookings Institution, Washington, DC. Nguyen-Hong, D. 2000, Restrictions on Trade in Professional Services, Productivity Commission Staff Research Paper, AusInfo, Canberra, August. Pearson 2001, ‘Bush Tells PM: Let’s Talk Trade’, The Financial Review, 27 April 2001. Productivity Commission 2000a, Review of Australia’s General Tariff Arrangements, Report No. 12, AusInfo, Canberra. —— 2000b, Trade and Assistance Review 1999–2000, Annual Report Series 1999–2000, AusInfo, Canberra, December. ECONOMIC IMPACTS OF AN AUSTRALIA–UNITED STATES FTA 101 REFERENCES ——2000c, Broadcasting, Report No. 11, AusInfo, Canberra Snape, R.H. 1986, Should Australia Seek a Trade Agreement with the United States?, Economic Planning Advisory Council Discussion Papers No. 86/01, a Study commissioned in December 1985 by the Australian Government’s Ministerial Task Force on Long-term Economic Growth, Canberra June. Stoeckel, A. 1999, ‘Removing the hidden taxes on exports’, in Stoeckel, A. and Corbet, H. (eds) Reason versus Emotion: Requirements for a successful WTO round, Rural Industry Research & Development Corporation, Canberra, pp 77–102. Stoeckel, A., Tang, K.K. and McKibbin, W. 1999, The gains from trade liberalisation with endogenous productivity and risk premium effects, Technical paper for seminar for Reason versus Emotion: Requirements for a successful WTO Round, Sheraton Hotel, Seattle, 2nd December. Stoeckel, A., Pearce, P. and Banks, G. 1990, Western Trade Blocs, Game, Set or Match for Asia-Pacific and the World Economy?, an independent report commissioned by the Confederation of Asia-Pacific Chambers of Commerce and Industry, Canberra. United States Department of Agriculture Economic Research Service 2001, USDA Sugar and Sweetner, Situation and Outlook Report, SSS-230, January 2001, Washington DC. —— 2000, Oil Crops Situation and Outlook Yearbook, October 2000, Washington DC. United States Department of Agriculture Foreign Agricultural Service 2001, Oilseeds: World Markets and Trade, http://www.fas.usda.gov/ currwmt.html, Accessed on 24 April 2001. United States Department of Commerce 2001a, International Accounts from the April 2001 SURVEY, http://www.bea.doc.gov/bea/articles/internat/bpa/ 2001/0401itatables.pdf , Accessed on 2 May 2001. —— 2001b, 1997 Annual I-O Table Six-Digit, http://www.bea.doc.gov/ bea/dn2/i-o.htm, Accessed on 19 April 2001. United States Trade Representative 2001, 2001 National Trade Estimate Report on Foreign Trade Barriers, http://www.ustr.gov/html/2001_contents.html, Accessed on 2 May 2001. US Small Business Administration 2000, p.11, Procurement Opportunities, September. US International Trade Commission 2000, The Impact on the US Economy of Including the United Kingdom in a Free Trade Arrangement with the United States, Canada and Mexico, Investigation No. 332-409, Publication No. 3339, Washington DC, August. ECONOMIC IMPACTS OF AN AUSTRALIA–UNITED STATES FTA 102 REFERENCES —— 1999, The Economic Effects of Significant US Import Restraints, Second Update 1999, Investigation No. 332-325, Publication No. 3201, Washington DC, May. Warren, T 2000, The impact on output of impediments to trade in investment in telecommunications services, in Finlay, C. and Warren, T. (eds) 2000, Impediments to Trade in Services, Measurments and Policy Implications, Routledge, London 2000. Whalley, J., 1985, Trade Liberalization among Major Trading Areas, MIT Press, Cambridge, MA. World Bank 2001, World Development Indicators 2001, http://www.worldbank.org/ data/wdi2001/pdfs/tab6_6.pdf, Accessed on 2 May 2001. WTO 1999, Trade Policy Review, United States 1999, Geneva, September 1999. ——1998, Trade Policy Review, Australia 1998, Geneva, November 1998. Zeitsch, J., McDougall, R., Jomini, P., Welsh, A., Hambley, J., Brown, S. and Kelly, J., 1991, SALTER: a General Equilibrium Model of the World Economy, SALTER Working Paper, No. 4, Industry Commission, Canberra. ECONOMIC IMPACTS OF AN AUSTRALIA–UNITED STATES FTA


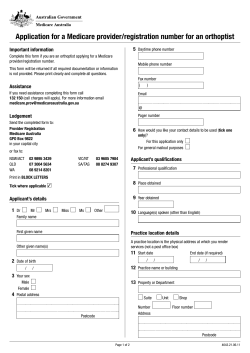


© Copyright 2026