
annual results for the year ended 31 december 2014
Hong Kong Exchanges and Clearing Limited and The Stock Exchange of Hong Kong Limited take no
responsibility for the contents of this announcement, make no representation as to its accuracy or
completeness and expressly disclaim any liability whatsoever for any loss howsoever arising from or
in reliance upon the whole or any part of the contents of this announcement.
中國遠洋控股股份有限公司
China COSCO Holdings Company Limited *
(a joint stock limited company incorporated in the People’s Republic of China with limited liability)
(Stock code: 1919)
ANNUAL RESULTS
FOR THE YEAR ENDED 31 DECEMBER 2014
FINANCIAL HIGHLIGHTS:
●
Revenue of the Group for 2014 was RMB66,901,438,000, representing an
increase of RMB763,577,000 as compared to 2013.
●
Profit attributable to equity holders of the Company for 2014 was
RMB362,529,000 as compared to profit attributable to equity holders of the
Company of RMB235,470,000 in 2013.
●
The basic and diluted earnings per share for 2014 amounted to RMB0.0355
and RMB0.0355, respectively.
●
The Board resolved not to propose any final dividend for the year 2014.
The board of directors (the “Board”) of China COSCO Holdings Company Limited
(the “Company” or “China COSCO”) hereby announces the results of the Company
and its subsidiaries (collectively, the “Group”) for the year ended 31 December 2014
(the “Reporting Period”), together with the comparative figures for the year ended
31 December 2013, which have been prepared in accordance with the Hong Kong
Financial Reporting Standards (“HKFRSs”) as below.
— 1 —
CHINA COSCO HOLDINGS COMPANY LIMITED
CONSOLIDATED INCOME STATEMENT
FOR THE YEAR ENDED 31 DECEMBER 2014
Note
Continuing operations
Revenues
Cost of services and inventories sold
3
5
Gross profit/(loss)
Other income, net
Gain on disposal of a joint venture and an
available-for-sale financial asset
Gain on disposal of subsidiaries
Selling, administrative and general expenses
4
5
Operating profit/(loss)
2014
RMB’000
66,901,438 66,137,861
(62,877,383) (67,030,192)
4,024,055
718,572
6
6
6
6
(892,331)
74,633
608,330
—
—
3,690,633
(4,308,227) (4,175,907)
1,042,730
Finance income
Finance costs
Net related exchange gain
Net finance expense
2013
RMB’000
(1,302,972)
998,500
1,022,769
(2,965,968) (3,212,282)
66,214
876,744
(1,901,254) (1,312,769)
(858,524) (2,615,741)
Share of profits less losses of
- joint ventures
- associates
654,494
711,317
Profit/(loss) before income tax
Income tax expenses
7
Profit/(loss) for the year from continuing
operations
Discontinued operations
Profit for the year from discontinued operations
Profit for the year
— 2 —
540,909
561,236
507,287
1,043,534
(1,513,596)
(299,472)
1,550,821
(1,813,068)
—
4,692,490
1,550,821
2,879,422
Profit attributable to:
Equity holders of the Company
Non-controlling interests
Note
2014
RMB’000
2013
RMB’000
9
362,529
1,188,292
235,470
2,643,952
1,550,821
2,879,422
Profit/(loss) attributable to equity holders of the
Company arising from:
- Continuing operations
- Discontinued operations
362,529
—
Earnings/(loss) per share attributable to equity
holders of the Company:
Basic earnings/(loss) per share from
- Continuing operations
- Discontinued operations
Diluted earnings/(loss) per share from
- Continuing operations
- Discontinued operations
Dividend
8
— 3 —
(2,960,159)
3,195,629
362,529
235,470
2014
RMB
2013
RMB
0.0355
—
(0.2898)
0.3128
0.0355
0.0230
0.0355
—
(0.2898)
0.3128
0.0355
0.0230
2014
RMB’000
2013
RMB’000
—
—
CHINA COSCO HOLDINGS COMPANY LIMITED
CONSOLIDATED STATEMENT OF COMPREHENSIVE INCOME
FOR THE YEAR ENDED 31 DECEMBER 2014
Profit for the year
Other comprehensive income/(loss)
Items that may be reclassified subsequently to profit or
loss
Fair value gains on available-for-sale financial assets,
net of tax
Share of other comprehensive loss of joint ventures
and associates
Release of reserves upon disposal of subsidiaries, a
joint venture and an associate
Currency translation differences
Item that may not be reclassified subsequently to profit
or loss
Remeasurements of post-employment benefit
obligations
2014
RMB’000
2013
RMB’000
1,550,821
-------------
2,879,422
-------------
131,288
2,283
(20,925)
(9,029)
(87,244)
(84,079)
(375,977)
(1,285,436)
(221,851)
—
Total other comprehensive loss for the year
(282,811)
--------------------------------------
(1,668,159)
--------------------------------------
Total comprehensive income for the year
1,268,010
1,211,263
Total comprehensive income/(loss) for the year
attributable to:
- Equity holders of the Company
- Non-controlling interests
127,619
1,140,391
(968,251)
2,179,514
1,268,010
1,211,263
Total comprehensive income/(loss) attributable to
equity holders of the Company arising from:
- Continuing operations
- Discontinued operations
— 4 —
127,619
—
(4,036,820)
3,068,569
127,619
(968,251)
CHINA COSCO HOLDINGS COMPANY LIMITED
CONSOLIDATED BALANCE SHEET
AS AT 31 DECEMBER 2014
Note
2014
RMB’000
2013
RMB’000
80,097,345
476,432
1,934,852
107,078
6,051,578
6,096,396
636,219
1,640,570
109,129
1,482
917,629
81,404,047
401,885
1,986,279
114,441
4,877,158
5,881,784
229,683
1,510,630
173,443
6,106
765,561
98,068,710
---------------
97,351,017
---------------
1,926,723
7,722,068
500,000
865,429
39,705,524
2,374,978
9,078,897
4,000,000
850,825
48,206,390
Total current assets
50,719,744
-------------------------------------------
64,511,090
-------------------------------------------
Total assets
148,788,454
161,862,107
ASSETS
Non-current assets
Property, plant and equipment
Investment properties
Leasehold land and land use rights
Intangible assets
Joint ventures
Associates
Loans to joint ventures and an associate
Available-for-sale financial assets
Deferred income tax assets
Restricted bank deposits
Other non-current assets
Total non-current assets
Current assets
Inventories
Trade and other receivables
Available-for-sale financial assets
Restricted bank deposits
Cash and cash equivalents
10
— 5 —
CHINA COSCO HOLDINGS COMPANY LIMITED
CONSOLIDATED BALANCE SHEET
AS AT 31 DECEMBER 2014
Note
2014
RMB’000
2013
RMB’000
EQUITY
Equity attributable to the equity holders
of the Company
Share capital
Reserves
10,216,274
14,162,888
10,216,274
14,006,311
Non-controlling interests
24,379,162
18,578,796
24,222,585
17,891,222
42,957,958
---------------
42,113,807
---------------
68,056,685
1,271,566
527,062
68,351,377
1,283,942
2,042,587
69,855,313
---------------
71,677,906
---------------
15,377,316
3,127,600
15,758,769
18,151,708
2,765,570
25,278,430
493,489
1,218,009
602,657
1,272,029
Total current liabilities
35,975,183
-------------------------------------------
48,070,394
-------------------------------------------
Total liabilities
105,830,496
-------------------------------------------
119,748,300
-------------------------------------------
Total equity and liabilities
148,788,454
161,862,107
14,744,561
16,440,696
112,813,271
113,791,713
Total equity
LIABILITIES
Non-current liabilities
Long-term borrowings
Provisions and other liabilities
Deferred income tax liabilities
Total non-current liabilities
Current liabilities
Trade and other payables
Short-term borrowings
Current portion of long-term borrowings
Current portion of provisions and other
liabilities
Tax payable
Net current assets
Total assets less current liabilities
— 6 —
11
CHINA COSCO HOLDINGS COMPANY LIMITED
NOTES TO THE CONSOLIDATED FINANCIAL STATEMENTS
1
General information
China COSCO Holdings Company Limited (the “Company”) was incorporated in the People’s
Republic of China (the “PRC”) on 3 March 2005 as a joint stock company with limited liability
under the Company Law of the PRC. The address of its registered office is 3rd Floor, No.1
Tongda Square, Tianjin Port Free Trade Zone, Tianjin, the PRC. The H-Shares and A-Shares of
the Company are listed on the Main Board of The Stock Exchange of Hong Kong Limited and
The Shanghai Stock Exchange respectively.
The businesses of the Company and its subsidiaries (the “Group”) include the provision of a
range of container shipping, dry bulk shipping, managing and operating container terminals and
container leasing all over the world.
The directors of the Company (the “Directors”) regard China Ocean Shipping (Group) Company
(“COSCO”), a state-owned enterprise established in the PRC, as being the Company’s parent
company. COSCO and its subsidiaries (other than the Group) are collectively referred to as
“COSCO Group”.
The Consolidated Financial Statements are presented in Renminbi (“RMB’’) and all values are
rounded to the nearest thousand except when otherwise indicated.
These Consolidated Financial Statements have been approved for issue by the Board of Directors
on 26 March 2015.
2
Basis of preparation
The Consolidated Financial Statements for the year ended 31 December 2014 have been prepared
in accordance with Hong Kong Financial Reporting Standards (“HKFRSs”) and the principles of
merger accounting as prescribed in Hong Kong Accounting Guideline 5 “Merger Accounting for
the Common Control Combinations’’ issued by Hong Kong Institute of Certified Public
Accountants (the “HKICPA”).
The consolidated financial statements are prepared in accordance with the applicable
requirements of the predecessor Companies Ordinance (Cap. 32) for this financial year and the
comparative period.
The Consolidated Financial Statements have been prepared under the historical cost convention
except that, as disclosed in the accounting policies below, available-for-sale financial assets and
derivative financial instruments are stated at fair value.
The preparation of the Consolidated Financial Statements in conformity with HKFRSs requires
the use of certain critical accounting estimates. It also requires management to exercise its
judgement in the process of applying the Group’s accounting policies.
— 7 —
(i)
Amendments to standards which are effective in 2014 and adopted by the Group
HKICPA has issued some amendments to standards which are mandatory and adopted by the
Group for the accounting periods on or after 1 January 2014. The adoption of those
amendments does not have any significant impact to the Group’s results for the year ended
31 December 2014 and the Group’s financial position as at 31 December 2014.
(ii)
New and amended standards and interpretation to standard that are relevant to the
Group but not yet effective for the financial year beginning 1 January 2014 and have
not been early adopted by the Group
Effective for
accounting periods
beginning on or after
New and amended standards and interpretation to standard
HKAS 19 (Amendment)
Defined Benefit Plans: Employee
Contributions
Annual Improvements
Annual Improvements 2010-2012
Project
Cycle
Annual Improvements
Annual Improvements 2011-2013
Project
Cycle
HKFRS 14
Regulatory Deferral Accounts
HKFRS 11 (Amendment) Accounting for acquisitions of
interests in joint operation
HKAS 16 and HKAS 38 Clarification of acceptable methods
(Amendment)
of depreciation and amortisation
HKAS 16 and HKAS 41 Bearer plants
(Amendment)
HKFRS 10 and HKFRS The sale or contribution of assets
28 (Amendment)
between an investor and its
associate or joint venture
HKAS 27 (Amendment) The equity method
Annual Improvements
Annual Improvements 2012-2014
Project
Cycle
HKFRS 15
Revenue from contracts with
customers
HKFRS 9
Financial Instruments
1 July 2014
1 July 2014
1 July 2014
1 January 2016
1 January 2016
1 January 2016
1 January 2016
1 January 2016
1 January 2016
1 July 2016
1 January 2017
1 January 2018
The Group will apply the new and amended standards and interpretation to standard from
1 January 2016 or later periods. The Group has already commenced an assessment of the
related impact to the Group. The Group is not yet in a position to state whether any
substantial changes to the Group’s significant accounting policies and presentation of the
financial information will be resulted.
— 8 —
In addition, the requirements of Part 9 “Accounts and Audit” of the new Hong Kong
Companies Ordinance (Cap. 622) come into operation as from the Company’s first financial
year commencing on or after 3 March 2014 in accordance with section 358 of that
Ordinance. The Group is in the process of making an assessment of expected impact of the
changes in the Companies Ordinance on the consolidated financial statements in the period
of initial application of Part 9 of the new Hong Kong Companies Ordinance (Cap. 622). So
far it has concluded that the impact is unlikely to be significant and only the presentation
and the disclosure of information in the consolidated financial statements will be affected.
3
Revenues and segment information
Revenues include gross revenues from operations of container shipping, dry bulk shipping,
logistics, container terminal operations and container leasing, net of discounts allowed, where
applicable. Revenues recognised during the year are as follows:
2014
RMB’000
2013
RMB’000
Container shipping (note a)
Dry bulk shipping (note b)
Container terminal operations
Container leasing, management and sale (note c)
49,491,862
11,250,265
2,926,171
1,105,234
47,464,934
12,957,293
2,566,983
1,177,774
Turnover
Crew service income
Others
64,773,532
478,401
1,649,505
64,166,984
289,112
1,681,765
Total revenues from continuing operations
66,901,438
66,137,861
Logistics
—
4,986,050
Total revenues from discontinued operation
—
4,986,050
Continuing operations
Discontinued operation
Notes:
(a)
Turnover from container shipping under time charterhire agreements was RMB618,282,000
for the year ended 31 December 2014 (2013: RMB769,985,000).
(b)
Turnover from dry bulk shipping under time charterhire agreements was
RMB3,405,713,000 for the year ended 31 December 2014 (2013: RMB3,550,014,000).
— 9 —
(c)
Turnover from container leasing, management and sale is analysed below:
Operating lease rentals
Finance lease income
Proceeds from sale of resaleable containers
2014
RMB’000
2013
RMB’000
800,806
11,036
293,392
906,548
5,943
265,283
1,105,234
1,177,774
Operating segments
The chief operating decision-maker has been identified as the executive directors of the Group.
The executive directors review the Group’s internal reporting in order to assess performance and
allocate resources. Management has determined the operating segments based on these reports
and analysed from a business perspective:
-
Container shipping and related business
-
Dry bulk shipping and related business
-
Logistics (discontinued operation)
-
Container terminal and related business
-
Container leasing, management, sale and related business
-
Corporate and other operations that primarily comprise container manufacturing
(discontinued operation), investment holding, management services and financing
Segment assets are those operating assets that are employed by a segment in its operating
activities. They exclude joint ventures, associates, loans to joint ventures and an associate,
available-for-sale financial assets not related to the segment and unallocated assets. Segment
liabilities are these operating liabilities that result from the operating activities of a segment.
Unallocated assets consist of deferred income tax assets. Unallocated liabilities consist of
current and deferred income tax liabilities.
Addition to non-current assets comprises additions to property, plant and equipment, investment
properties, leasehold land and land use rights, intangible assets, investments in joint ventures and
an associate and other non-current assets (excluding finance lease receivables), including
additions resulting from acquisitions through business combinations.
— 10 —
Year ended 31 December 2014
Dry bulk
Container
Container
shipping and shipping and terminal and
related
related
related
business (#)
business
business (#)
Container
leasing,
management,
sale and
related
business
Corporate
and other
operations
Intersegment
elimination
Total
RMB’000
RMB’000
RMB’000
RMB’000
RMB’000
RMB’000
RMB’000
50,324,187
12,556,490
3,176,914
2,192,976
14,577
(1,363,706)
66,901,438
(14,111)
(11,110)
(250,743)
(1,087,742)
—
1,363,706
—
50,310,076
12,545,380
2,926,171
1,105,234
14,577
—
66,901,438
1,015,538
(1,044,972)
718,653
739,461
(385,950)
—
1,042,730
Income statement
Total revenues
Inter-segment revenues
Revenues (from external
customers)
Segment profit/(loss)
Finance income
998,500
Finance costs
(2,965,968)
Net related exchange gain
66,214
Share of profits less losses of
- joint ventures
(6,786)
48,794
612,486
—
—
—
654,494
- associates
9,183
(8,388)
439,092
—
271,430
—
711,317
Profit before income tax
507,287
Income tax expenses
1,043,534
Profit for the year
1,550,821
Depreciation and amortisation
Provision/(reversal of provision)
for impairment of trade and
other receivables, net
Impairment loss on
availablie-for-sale financial
assets
Amortised amount of transaction
costs on long-term borrowings
Additions to non-current assets
(#)
1,470,117
1,348,054
511,378
778,435
12,789
—
4,120,773
19,684
(30,740)
—
1,717
—
—
(9,339)
—
32,039
—
—
—
—
32,039
27,575
2,315
—
29,170
22,000
—
81,060
2,111,907
1,973,137
1,953,141
1,878,458
1,385
—
7,918,028
Revenues for container shipping and related business and dry bulk shipping and related business
including respective crew service income and other income.
— 11 —
Dry bulk
Container
shipping and shipping and
related
related
business (##) business (##)
RMB’000
RMB’000
Year ended 31 December 2013
Continuing operations
Container
leasing,
Container management,
terminal and
sale and Corporate
Interrelated
related and other segment
business
business operations elimination
RMB’000
RMB’000 RMB’000 RMB’000
Discontinued operations
Total
RMB’000
Corporate
and other
Logistics operation (#)
RMB’000 RMB’000
Total
RMB’000
Income statement
Total revenues
Inter-segment revenues
48,325,636
(13,604)
14,067,865
(5,525)
2,822,348
(255,365)
2,154,990
(977,216)
18,732 (1,251,710) 66,137,861 4,986,050
— 1,251,710
—
—
— 4,986,050
—
—
Revenues (from external customers)
48,312,032
14,062,340
2,566,983
1,177,774
18,732
— 66,137,861 4,986,050
— 4,986,050
(988,138)
(1,697,821)
756,499
924,597
(298,109)
— (1,302,972)
1,022,769
(3,212,282)
876,744
271,229
16,837
(10,090)
5,477
—
—
—
—
271,229
16,837
(10,090)
5,477
(2,490)
7,660
38,925
1,579
504,474
449,306
—
—
—
102,691
—
—
540,909
561,236
19,845
36,938
—
142,897
19,845
179,835
(Loss)/profit before income tax
Income tax expenses
(1,513,596)
(299,472)
340,236
(74,332)
142,897
—
483,133
(74,332)
(Loss)/profit for the year
(1,813,068)
265,904
142,897
408,801
Segment (loss)/profit
Finance income
Finance costs
Net related exchange gain
Share of profits less losses of
- joint ventures
- associates
Net gain on disposals of subsidiaries
and an associate from
discontinued operations
1,845,721
2,437,968 4,283,689
Profit for the year from discontinued
operations
2,111,625
2,580,865 4,692,490
Depreciation and amortisation
Provision/(reversal of provision) for
impairment of trade and other
receivables, net
Impairment loss on
availablie-for-sale financial
assets
Amortised amount of transaction
costs on long-term borrowings
1,446,676
1,280,352
464,701
693,568
16,600
6,903
(24,172)
—
9,602
—
—
—
31,607
—
—
—
35,448
9,607
—
20,816
24,500
Additions to non-current assets
5,324,032
923,065
2,747,541
1,795,128
1,560
(#)
— 3,901,897
75,662
—
75,662
(7,667)
441
—
441
—
31,607
—
—
—
—
90,371
—
—
—
— 10,791,326
125,185
—
125,185
It comprised the container manufacturing business of the Group.
(##) Revenues for container shipping and related business and dry bulk shipping and related business
including respective crew service income and other income.
— 12 —
Dry bulk
Container
shipping and shipping and
related
related
business
business
RMB’000
RMB’000
As at 31 December 2014
Container
leasing,
Container management,
sale and
Corporate
terminal and
related
and other
related
business operations
business
RMB’000
RMB’000
RMB’000
Intersegment
elimination
Total
RMB’000
RMB’000
Balance sheet
Segment assets
Joint ventures
Associates
Loans to joint ventures and an
associate
Available-for-sale financial assets
Unallocated assets
55,296,737
293,824
35,191,351
612,342
17,385,341
5,145,412
13,487,977
—
25,934,705
—
(13,541,549) 133,754,562
—
6,051,578
43,585
90,791
5,055,499
—
906,521
6,096,396
—
600,687
—
825,718
636,219
214,165
—
—
—
500,000
—
—
Total assets
Segment liabilities
Unallocated liabilities
148,788,454
49,751,676
30,426,846
10,999,482
6,693,697
19,755,273
(13,541,549) 104,085,425
1,745,071
Total liabilities
105,830,496
Dry bulk
Container
shipping and shipping and
related
related
business
business
RMB’000
RMB’000
Balance sheet
Segment assets
Joint ventures
Associates
Loans to a joint venture and an
associate
Available-for-sale financial assets
Unallocated assets
55,963,679
37,395,805
As at 31 December 2013
Container
leasing,
Container management,
sale and
Corporate
terminal and
related
and other
related
business operations
business
RMB’000
RMB’000
RMB’000
17,520,123
13,015,075
34,665,422
Intersegment
elimination
RMB’000
Total
RMB’000
(13,370,695) 145,189,409
410,891
591,358
3,874,909
—
—
—
4,877,158
71,779
101,185
5,027,492
—
681,328
—
5,881,784
—
—
229,683
—
—
—
229,683
469,837
876,177
164,616
—
4,000,000
—
5,510,630
173,443
Total assets
Segment liabilities
636,219
2,140,570
109,129
161,862,107
50,640,317
31,007,899
11,318,860
Unallocated liabilities
6,844,757
29,992,546
(13,370,695) 116,433,684
3,314,616
Total liabilities
119,748,300
— 13 —
Geographical information
(a)
Revenues
The Group’s businesses are managed on a worldwide basis. The revenues generated from
the world’s major trade lanes for container shipping business mainly include Trans-Pacific,
Asia-Europe, Intra-Asia, PRC coastal, Trans-Atlantic and others which are reported as
follows:
Geographical
Trade lanes
America
Europe
Asia Pacific
China domestic
Other international market
Trans-Pacific
Asia-Europe (including Mediterranean)
Intra-Asia (including Australia)
PRC coastal
Trans-Atlantic and others
The revenues generated from provision of dry bulk shipping business services are classified
into international shipping and PRC coastal shipping only.
For the geographical information, freight revenues from container shipping and dry bulk
shipping are analysed based on the outbound cargoes or goods transport to each
geographical territory.
In respect of container terminals operations, corporate and other operations, revenues are
based on the geographical locations in which the business operations are located.
— 14 —
In respect of container leasing, the movements of containers under operating leases or
finance leases are known through reports from the lessees but the Group is not able to
control the movements of containers except to the degree that the movements are restricted
by the terms of the leases or where safety of the containers is concerned. It is therefore
impracticable to present financial information by geographical area and thus the revenues
of which are presented as unallocated revenues.
2014
RMB’000
2013
RMB’000
15,520,660
11,850,850
8,435,475
11,425,183
3,077,908
14,200,756
10,663,157
7,384,713
13,767,285
2,296,121
9,962,007
2,583,373
12,144,158
1,918,182
1,094,607
1,846,141
1,105,234
902,255
1,683,460
1,177,774
66,901,438
66,137,861
Discontinued operation
Logistics
- Europe
- Asia Pacific
- China domestic
—
—
—
24,060
75,388
4,886,602
Total
—
4,986,050
Continuing operations
Container shipping and related business
- America
- Europe
- Asia Pacific
- China domestic
- Other international market
Dry bulk shipping and related business
- International shipping
- PRC coastal shipping
Container terminal and related business, corporate and
other operations
- Europe
- China domestic
Unallocated
Total
— 15 —
(b)
Non-current assets
The Group’s non-current assets, other than deferred income tax assets (“Geographical
Non-Current Assets”), consist of its property, plant and equipment, investment properties,
leasehold land and land use rights, intangible assets, joint ventures and associates and other
non-current assets (excluding finance lease receivables).
The container vessels, dry bulk vessels and containers (included in property, plant and
equipment) are primarily utilised across geographical markets for shipment of cargoes
throughout the world. Accordingly, it is impractical to present the locations of the container
vessels, dry bulk vessels and containers by geographical areas and thus the container
vessels, dry bulk vessels, containers and vessels under construction are presented as
unallocated non-current assets.
In respect of the remaining Geographical Non-Current Assets, they are presented based on
the geographical locations in which the business operations/assets are located.
As at
31 December
2014
RMB’000
As at
31 December
2013
RMB’000
China domestic
Non-China domestic
Unallocated
26,992,510
5,461,323
63,010,765
26,755,431
4,502,092
64,049,883
Total
95,464,598
95,307,406
— 16 —
4
Other income, net
Dividend income from listed and unlisted investments
Government subsidy for the demolition of vessels
Other government subsidies
Gain/(loss) on disposal of/write off property, plant and
equipment, net
- container vessels
- dry bulk vessels
- containers
- others
Gain on disposal of available-for-sale financial assets
Loss on disposal of joint ventures and associates
Net (loss)/gain on derivatives financial instruments
Reversal of provision for impairment of trade and other
receivables
Provision for impairment of trade and other receivables
Net exchange loss
Compensation expense
Compensation income
Donations
Impairment of available-for-sale financial assets
Gain on fair value change on share appreciation rights
Reversal of provision for litigation
Others
Total
— 17 —
2014
RMB’000
2013
RMB’000
160,119
1,379,000
363,720
115,237
—
290,031
(1,041,206)
(28,277)
39,877
10,941
9,000
—
(33,510)
(268,930)
244,176
2,646
(26,119)
123
(9,792)
3,436
52,078
(42,739)
(249,758)
(136,287)
91,207
(346)
(32,039)
14,379
183,357
(20,944)
71,677
(64,010)
(17,538)
(287,263)
29,884
(1,006)
(31,607)
18,814
—
4,874
718,572
74,633
5
Expenses by nature
2014
RMB’000
2013
RMB’000
Cost of services and inventories sold
Container shipping and dry bulk shipping costs
- Equipment and cargo transportation costs
- Voyage costs
- Vessel costs
- Provision for onerous contracts
- Others
Freight forwarding and shipping agency costs
Terminal operating and other direct costs
Cost of inventories sold
Container depreciation and other direct costs
Business tax
19,133,576
16,501,546
15,418,821
387,380
1,473,283
5,987,147
2,071,510
792,966
1,021,703
89,451
17,757,865
19,011,981
17,220,097
604,663
1,172,686
7,556,011
1,924,398
731,054
928,032
123,405
Total
62,877,383
67,030,192
Selling, administrative and general expenses
Administrative staff costs
Depreciation and amortisation
Rental expense
Office expense
Transportation and travelling expense
Legal and professional fees
Auditors’ remuneration
Telecommunication and utilities
Repair and maintenance expense
Others
2,938,151
199,502
244,669
139,844
126,550
121,501
40,785
95,593
51,821
349,811
2,808,755
201,141
186,036
142,281
130,573
100,629
44,696
102,101
44,099
415,596
Total
4,308,227
4,175,907
— 18 —
6
Finance income and costs
Finance income
Interest income from:
- deposits with COSCO Finance
- loans to joint ventures and an associate
- banks
Finance costs
Interest expenses on:
- bank loans
- other loans wholly repayable within five years
- loans with COSCO Finance
- finance lease obligations
- notes/bonds
Fair value loss on derivative financial instruments
Fair value adjustment of notes attributable to interest rate risk
2014
RMB’000
2013
RMB’000
262,378
30,413
705,709
226,646
14,916
781,207
998,500
------------
1,022,769
------------
(1,753,380)
(50,299)
(7,705)
(8,911)
(871,772)
(1,831,734)
(54,558)
(19,452)
(7,083)
(1,162,895)
—
—
—
(53,065)
69,648
16,583
(2,692,067)
(3,059,139)
(81,060)
(1,689)
(246,344)
55,192
(90,371)
(10,668)
(187,553)
135,449
(2,965,968)
------------
(3,212,282)
------------
Net related exchange gain
66,214
----------------------------------------------------------
876,744
----------------------------------------------------------
Net finance costs
(1,901,254)
(1,312,769)
Amortised amount of transaction costs on long-term
borrowings
Amortised amount of discount on issue of notes
Other incidental borrowing costs and charges
Less: amount capitalised in construction in progress
— 19 —
7
Income tax expenses
Current income tax (note a)
- PRC enterprise income tax
- Hong Kong profits tax
- Overseas taxation
Under provision in prior years
Deferred income tax
2014
RMB’000
2013
RMB’000
279,167
5,578
139,871
676
218,679
4,784
112,735
2,473
425,292
(1,468,826)
338,671
(39,199)
(1,043,534)
299,472
Notes:
(a)
Current income tax
Taxation has been provided at the appropriate rate of taxation prevailing in the countries
in which the Group operates. These rates range from 12.5% to 46% (2013: 12.5% to 46%).
The statutory rate for PRC enterprise income tax is 25% and certain PRC companies enjoy
preferential tax treatment with the reduced rates ranging from 12.5% to 25% (2013: 12.5%
to 25%).
Hong Kong profits tax has been provided at the rate of 16.5% (2013: 16.5%) on the
estimated assessable profits derived from or arising in Hong Kong for the year.
8
Dividend
The Board of Directors did not recommend the payment of interim or final dividend for the year
ended 31 December 2014 and the year ended 31 December 2013.
— 20 —
9
Earnings/(loss) per share
(a)
Basic
Basic earnings/(loss) per share is calculated by dividing the profit/(loss) attributable to equity
holders of the Company by the number of ordinary shares in issue during the year.
Profit/(loss) from continuing operations attributable to
equity holders of the Company (RMB)
Profit from discontinued operations attributable to equity
holders of the Company (RMB)
Number of ordinary shares in issue
Basic earnings/(loss) per share (RMB)
From continuing operations
From discontinued operations
— 21 —
2014
2013
362,529,000
(2,960,159,000)
—
3,195,629,000
362,529,000
235,470,000
10,216,274,357
10,216,274,357
0.0355
—
(0.2898)
0.3128
0.0355
0.0230
(b)
Diluted
The outstanding share options granted by a subsidiary of the Company did not have any dilutive
effect on the earnings per share for the year ended 31 December 2014, and the diluted earnings
per share is equal to the basic earnings per share for the year ended 31 December 2014.
Diluted (loss)/earnings per share for the year ended 31 December 2013 was calculated based on
the loss attributable to equity holders of the Company after adjusting the effect for assumed
issuance of shares on exercise of share options of a subsidiary and the number of ordinary shares
in issue during the year.
2013
Loss from continuing operations attributable to equity holders of the
Company (RMB)
Adjustment of continuing operations on the effect of dilution
(2,960,159,000)
(54,000)
(2,960,213,000)
------------------
Profit from discontinued operations attributable to equity holders of the
Company (RMB)
Adjustment of discontinued operations on the effect of dilution
3,195,629,000
(79,000)
3,195,550,000
---------------------------------------------------------------------------------------235,337,000
Number of ordinary shares in issue
10,216,274,357
Diluted (loss)/earnings per share (RMB)
From continuing operations
From discontinued operation
(0.2898)
0.3128
0.0230
— 22 —
10
Trade and other receivables
Group
2014
2013
RMB’000
RMB’000
Trade receivables (note a)
- third parties
- fellow subsidiaries
- joint ventures
- associates
- other related companies
3,384,336
98,982
46,251
754
63,071
4,052,880
141,517
58,736
2,351
62,343
Bills receivables (note a)
3,593,394
165,741
4,317,827
242,239
3,759,135
4,560,066
2,912,923
690,110
152,521
17,058
156,846
3,253,475
675,216
338,037
53,142
184,916
3,929,458
4,504,786
33,475
----------------------------------------------------------
14,045
----------------------------------------------------------
7,722,068
9,078,897
Prepayments, deposits and other receivables
- third parties
- fellow subsidiaries (note b)
- joint ventures (note b)
- associates (note b)
- other related companies (note b)
Current portion of financial lease receivables
Total
— 23 —
Notes:
(a)
Trading balances with related parties are unsecured, interest free and have similar credit
periods as third party customers. The normal credit period granted to the trade receivables
of the Group is generally within 90 days. Trade receivables primarily consisted of shipping
business receivables. As at 31 December 2014, the ageing analysis of trade and bills
receivables is as follows:
1-3 months
4-6 months
7-12 months
Over 1 year
Trade and bills receivables, gross
Less: impairment of
1-3 months
4-6 months
7-12 months
Over 1 year
Provision for impairment
2014
RMB’000
2013
RMB’000
3,514,997
144,907
117,543
155,342
4,393,309
184,285
39,828
130,669
3,932,789
------------
4,748,091
------------
(31,716)
(14,485)
(3,681)
(123,772)
(53,085)
(13,931)
(3,626)
(117,383)
(173,654)
----------------------------------------------------------
(188,025)
----------------------------------------------------------
3,759,135
4,560,066
As at 31 December 2014, the Group’s trade and bills receivables of RMB3,166,765,000
(2013: RMB3,661,813,000) were considered fully collectible by management. Trade and
bills receivables that were fully collectible mainly represent those due from customers with
good credit history and low default rate.
(b)
The amounts due from related companies are unsecured, interest free and have no fixed
terms of repayment.
— 24 —
11
Trade and other payables
Group
2014
2013
RMB’000
RMB’000
Trade payables (note a)
- third parties
- fellow subsidiaries
- joint ventures
- associates
- other related companies
3,471,235
871,024
96,830
5,937
384,839
3,923,515
1,242,575
72,263
6
195,677
Bills payables (note a)
4,829,865
71,420
5,434,036
29,020
4,901,285
------------
5,463,056
------------
Advances from customers
492,500
------------
685,414
------------
Other payables and accruals
8,992,782
------------
10,426,941
------------
252,949
238,054
13,307
486,439
280,629
184,166
18,035
1,093,467
990,749
----------------------------------------------------------
1,576,297
----------------------------------------------------------
15,377,316
18,151,708
Due to related companies
- fellow subsidiaries (note b)
- joint ventures (note b)
- associates (note b)
- other related companies (note c)
Total
— 25 —
Notes:
(a)
As at 31 December 2014, the ageing analysis of trade and bills payables is as follows:
1-6 months
7-12 months
1-2 years
2-3 years
Above 3 years
2014
RMB’000
2013
RMB’000
4,515,959
149,320
158,800
37,711
39,495
5,156,073
82,313
122,052
39,877
62,741
4,901,285
5,463,056
Trade balances with related companies are unsecured, interest free and have similar terms
of repayment as those of third party suppliers.
12
(b)
The amounts due to related companies are unsecured and interest free and have no fixed
terms of repayment.
(c)
The balance including advances from non-controlling shareholders of subsidiaries are
unsecured, interest bearing and repayable within twelve months.
Contingent liabilities
The Group was involved in a number of claims and lawsuits, including but not limited to, the
claims and lawsuits arising from damage to vessels during transportation, delay in delivery,
collision of vessels, early termination of vessel chartering contracts and non-payment of
professional fees of certain terminal investment.
As at 31 December 2014, the Group is unable to ascertain the likelihood and amounts of the
above mentioned claims. However, based on advice of legal counsel and/or information available
to the Group, the Directors are of the opinion that the related claims amounts should not be
material to the Group’s Consolidated Financial Statements for the year ended 31 December 2014.
The financial figures above in respect of the announcement of the Group’s annual results for the year
ended 31 December 2014 (the “Announcement”) have been agreed by the Company’s international
auditor, PricewaterhouseCoopers, to the amounts set out in the Group’s consolidated financial
statements for the year ended 31 December 2014. The work performed by PricewaterhouseCoopers in
this respect did not constitute an assurance engagement in accordance with Hong Kong Standards on
Auditing, Hong Kong Standards on Review Engagements or Hong Kong Standards on Assurance
Engagements issued by the HKICPA and consequently no assurance has been expressed by
PricewaterhouseCoopers on the Announcement.
— 26 —
MANAGEMENT DISCUSSION AND ANALYSIS
I.
Discussion and Analysis of the Board Regarding the Operation of the
Group during the Reporting Period
In 2014, the international shipping sector still did not see substantial
improvement of imbalance of supply and demand. Under such difficult
conditions, the Company had taken various measures to improve its overall
performance by increasing revenue and reducing expenses.
In 2014, the Group’s operating revenue amounted to RMB66,901,438,000,
representing
an
increase
of
RMB763,577,000
as
compared
to
RMB66,137,861,000 in 2013. Realized net profit attributable to equity holders
of the Company amounted to RMB362,529,000, representing an increase of
RMB127,059,000 or 53.96% as compared to RMB235,470,000 in 2013.
(I) Analysis of principal businesses
1.
Movement analysis for the related items in the consolidated income
statement and consolidated cash flow statement
Items
Current year
Revenues
Cost of services and inventories sold
Selling, administrative and general
expenses
Net finance costs
Net cash flow from operating activities
Net cash flow from investing activities
Net cash flow from financing activities
2.
Unit: RMB’000
Last year Change (%)
66,901,438
(62,877,383)
66,137,861
(67,030,192)
1.15
-6.20
(4,308,227)
(1,901,254)
6,037,356
(763,358)
(13,731,565)
(4,175,907)
(1,312,769)
(2,316,602)
810,671
4,114,655
3.17
44.83
360.61
-194.16
-433.72
Revenues
(1) Analysis of reasons for changes in revenues
The amounts set out in the following financial analysis and descriptions in the
Management Discussion and Analysis are in RMB unless otherwise specified.
In 2014, the Group’s operating revenue amounted to RMB66,901,438,000,
representing an increase of RMB763,577,000 or 1.15% as compared to
RMB66,137,861,000 in 2013. In particular:
— 27 —
Container shipping business
The operating revenue from container shipping and related business amounted to
RMB50,310,076,000, representing an increase of RMB1,998,044,000 or 4.14%
as compared to last year. In 2014, container shipping volume amounted to
9,437,540 TEUs, representing an increase of 8.5% as compared to last year.
Average container freight rate amounted to RMB4,558 per TEU, representing an
increase of 1.7% as compared to last year. During the Reporting Period, market
conditions had remained weak and imbalance of supply over demand had
continued. The Company responded quickly to market changes by adjusting its
allocation of global shipping capacity and improving its regional shipping route
network. Routes and supplier structure were constantly optimised which resulted
in increases in the container shipping volume and the overall revenue throughout
the year as compared to last year.
As at 31 December 2014, the Group operated 175 container vessels with a total
capacity of 840,692 TEUs and the shipping capacity operated by the Group
increased by 6.9% as compared to last year (exclusive of the chartered-out
capacity of 5 container vessels with 42,476 TEUs). Meanwhile, the Group had 10
orders for container vessels, representing a total of 117,960 TEUs.
Dry bulk shipping business
Revenue generated from the dry bulk shipping and related business amounted to
RMB12,545,380,000, representing a decrease of RMB1,516,960,000 or 10.79%,
as compared to last year, which was mainly due to lower shipping capacity and
shipment volume.
During the Reporting Period, the dry bulk shipping business has completed a
shipment of 177,817,100 tons, representing a decrease of 15.36% as compared to
last year. Dry bulk shipment turnover amounted to 830,000 million ton-nautical
miles, representing a decrease of 16.72% as compared to last year, of which the
shipping volume of coal was 65,523,800 tons, representing a decrease of 20.21%
as compared to last year; the shipping volume of metal ore amounted to
75,487,600 tons, representing a decrease of 13.73% as compared to last year; the
shipping volume of grain amounted to 20,278,200 tons, representing a decrease
of 8.86% as compared to last year; the shipping volume of other cargoes was
16,527,500 tons, representing a decrease of 9.22% as compared to last year.
— 28 —
As at 31 December 2014, the Group operated 255 dry bulk vessels of 23,367,400
DWT, representing a decrease of 20.06% and 16.69% respectively as compared
to the beginning of the Reporting Period. At the end of the Reporting Period, the
Group owned 174 vessels of 16,222,200 DWT, representing a decrease of
14.29% and 8.83% respectively as compared to beginning of the Reporting
Period; the Group operated 81 chartered-in vessels of 7,145,200 DWT,
representing a decrease of 30.17% and 30.33% respectively as compared to the
beginning of the Reporting Period, mainly because the Company has gradually
adjusted and optimized the structure of its shipping fleet and controlled the scale
of chartered-in vessels. Meanwhile, the Group had 40 dry bulk vessel orders of
3,474,200 DWT.
Shipping volumes by
routes (tons)
Shipping volumes by
cargo type (tons)
International
shipping
PRC coastal
shipping
Coal
Mineral ore
Foodstuff
Others
Shipment turnover
(thousand ton
nautical miles)
2014
2013
Change (%)
145,665,758
178,390,114
-18.34
32,151,333
31,684,196
1.47
65,523,795
75,487,655
20,278,157
16,527,484
82,117,092
87,501,131
22,249,976
18,206,111
-20.21
-13.73
-8.86
-9.22
831,626,160
998,621,609
-16.72
As at 31 December 2014, China COSCO disassembled a total of 56 container and
dry bulk vessels of 3,138,800 DWT.
Terminal and related business
Revenue generated from the terminal and related business amounted to
RMB2,926,171,000, representing an increase of RMB359,188,000 or 13.99%, as
compared to last year. The throughput of Piraeus Terminal in Greece and
Guangzhou South China Oceangate Terminal were 2,986,904 TEUs (2013:
2,519,664 TEUs) and 4,647,266 TEUs (2013: 4,449,311 TEUs), respectively,
which resulted in an increase in revenue as compared to last year.
Container leasing business
Revenue generated from the container leasing business was RMB1,105,234,000,
representing a decrease of RMB72,540,000 or 6.16% as compared to last year.
— 29 —
(2) Major customers
In 2014, sales to the top five customers of the Group and their respective
percentages (as stated in the audited financial data of A Shares of the Group) are
as follows:
Unit: RMB
Total sales to
Total revenue
Percentage of
for the year
3.
top five customers
of the Group for the year
the total revenue of the Group
(%)
2,238,641,621.31
64,374,456,245.65
3.48
Costs
(1) Cost analysis
Unit: RMB’000
By business segments
Business segment
Container shipping and
related business
Components of
cost
Percentage
of total cost
for the
Current
current
year
year
(%)
Percentage
of total cost
for last
Last year
year
(%)
Change
(%)
Equipment and
cargo
transportation
costs
Voyage costs
Vessel costs
Others
Subtotal
19,133,576
30.43 17,757,865
26.49
7.75
11,813,821
8,309,394
6,528,787
45,785,578
18.79 13,539,742
13.22 8,094,777
10.38 8,156,139
72.82 47,548,523
20.20
12.08
12.17
70.94
-12.75
2.65
-19.95
-3.71
Dry bulk shipping and
related business
Voyage costs
Vessel costs
Others
Subtotal
4,687,725
7,109,427
1,860,663
13,657,815
7.46 5,472,239
11.31 9,125,320
2.96 1,775,035
21.72 16,372,594
8.16
13.61
2.65
24.43
-14.34
-22.09
4.82
-16.58
Container terminal and
related business
Container terminal
and related
business cost
Container leasing
business
Tax
Total costs of operations
2,071,510
3.29
1,924,398
2.87
7.64
1,273,029
89,451
2.02
0.14
1,061,272
123,405
1.58
0.18
19.95
-27.51
100.00 67,030,192
100.00
-6.20
62,877,383
— 30 —
In 2014, the operating costs of the Group amounted to RMB62,877,383,000,
representing a decrease of RMB4,152,809,000, or 6.2% as compared to
RMB67,030,192,000 of 2013. In particular:
The operating costs of container shipping and related business amounted to
RMB45,785,578,000, representing a decrease of RMB1,762,945,000, or 3.71%, as
compared to last year. During the Reporting Period, with the combined effect of
increased self-operating capacity and shipping volume as compared to last year,
operating costs recorded a decrease attributable to a significant decrease in fuel
costs. The Company had taken various steps to reduce the usage of fuel and realised
a corresponding decrease of 8.3% in fuel consumption during the Reporting Period,
which, coupled with fluctuations in international fuel prices, led to a decrease of
15.0% in fuel costs as compared to last year.
Operating costs of dry bulk shipping and related business amounted to
RMB13,657,815,000, representing a decrease of RMB2,714,779,000, or 16.58%, as
compared to last year. The capacity of chartered-in vessels was further reduced
during the Reporting Period whereas the charter costs amounted to
RMB3,627,670,000, representing a decrease of RMB1,601,406,000, or 30.6%, as
compared to last year, being the main reason for the decrease in costs during the
Reporting Period. Fuel costs amounted to RMB3,755,009,000, representing a
decrease of RMB816,993,000, or 17.9%, as compared to last year. In addition, the
reversal of provisions for onerous contracts during the Reporting Period amounted to
RMB599,998,000, as compared to the reversal of RMB1,416,202,000 last year.
The operating costs of terminal and related business amounted to
RMB2,071,510,000, representing an increase of RMB147,112,000, or 7.64%, as
compared to last year. During the Reporting Period, the increase of operating costs
was attributable to the increase in business volume of controlling terminals.
The operating costs of container leasing business amounted to RMB1,273,029,000,
representing an increase of RMB211,757,000, or 19.95%, as compared to last year.
The corresponding increase was mainly due to the expansion of container fleets and
the increase of returned containers sold upon expiry of lease during the Reporting
Period.
— 31 —
(2) Major suppliers
In 2014, purchases from the top five suppliers of the Group and their respective
percentages (as stated in the audited financial data of A Shares of the Group)
prior to A Share auditing are as follows:
Unit: RMB
Total purchases from top five suppliers
Total purchases of the Group for the year
Percentage of the total purchases of the Group
for the year (%)
4.
3,774,410,390.16
59,852,218,578.36
6.31
Expenses
Other net income/(expenses) and other gains
The net amount of other income/(expenses) and other gains of the Group in 2014
was RMB1,326,902,000 as compared to RMB3,765,266,000 in 2013,
representing a decrease of RMB2,438,364,000 as compared to last year. In the
prior year, the Group generated gains of RMB3,690,633,000 through the disposal
of Shanghai Tianhongli Asset Management Co. Ltd. (上海天宏力資產管理有限
公司) and COSCO (Qingdao) Asset Management Co., Ltd. (青島遠洋資產管理有
限公司), while in the current year, gain on the disposal of equity interests in
certain companies amounted to RMB608,330,000. The grants for vessel
retirement transferred from controlling shareholders amounted to
RMB1,379,000,000 and a net loss of RMB1,069,483,000 was incurred for the
disassembly of vessels during the Reporting Period.
Selling, administrative and general expenses
In 2014, the administrative expenses of the Group amounted to
RMB4,308,227,000, representing an increase of RMB132,320,000, or 3.17%, as
compared to 2013, which was mainly attributable to the year-on-year increase in
the expenses of items such as staff costs and rental expenses.
Finance income
The finance income of the Group was mainly interest income from bank deposits.
In 2014, the finance income of the Group amounted to RMB998,500,000,
representing a decrease of RMB24,269,000 or 2.37%, as compared to 2013. Such
decrease was mainly attributable to the decrease in the balances of bank deposits
during the current year.
— 32 —
Finance expenses
In 2014 the Group incurred finance expenses of RMB2,965,968,000,
representing a decrease of RMB246,314,000, or 7.67%, as compared to last year.
The decrease was mainly due to a decrease in the amount of borrowings.
Share of profits less losses of joint ventures and associates
The Group’s share of profits of joint ventures and associates in aggregate
amounted to RMB1,365,811,000 in 2014, representing an increase of
RMB263,666,000 as compared to RMB1,102,145,000 in 2013, which was
attributable to the increased profits in some joint venture terminal companies.
Income tax expenses
Income tax expenses of the Group in 2014 amounted to RMB-1,043,534,000,
representing a decrease of RMB1,343,006,000, as compared to RMB299,472,000
in 2013. During the Reporting Period, the Company’s overseas subsidiaries
signed container vessel building contracts which required more funds for such
expansion. It was determined after consideration that the retained profits in the
previous year will not be distributed and the deferred income tax liability
originally provided amounting to RMB1,557,867,000 was reversed accordingly.
5.
Research and development (“R&D”) expenses
(1) Breakdown of R&D expenses
Unit: RMB’000
R&D expenses in the current year
Capitalised R&D expenses in the current year
74,643
0
Total R&D expenses
74,643
Percentage of total R&D expenses over net assets (%)
0.31
Percentage of total R&D expenses over operating revenue (%)
0.12
(2) Description
In 2014, China COSCO had adopted an operation-driven approach and adhered
to the principles of cost reduction for greater efficiency, energy and consumption
— 33 —
saving, environmental protection and continuous improvement of management
level and service ability by employing new technologies and introducing
advanced management concepts. The Group emphasized the development of
mobile internet technology application, vessel exhaust-gas scrubbing and
desulfurization test and vessel turbocharger partition technology test, as well as
the proprietary research and development of roro vessel transport management
platform and cooling box unit controller fault diagnose system, and LNG
refueling and loading arm system and large caliber marine loading arm for inland
waterway and the update of automation technologies for container terminals.
6.
Cash flow
As at 31 December 2014, cash and cash equivalents of the Group amounted to
RMB39,705,524,000, representing a decrease of RMB8,500,866,000, or 17.63%,
as compared to 31 December 2013.
In 2014, the Group’s net cash inflow from operating activities amounted to
RMB6,037,356,000 as compared to the net cash outflow of RMB2,316,602,000
in 2013 During the Reporting Period, profit attributable to the principal business
of container shipping business turned around as compared to the losses in the
same period of last year; loss attributable to the principal business of dry bulk
shipping business narrowed further, resulting in a significant improvement to the
cash inflow from operating activities.
In 2014, the Group’s net cash used in investing activities amounted to
RMB763,358,000, as compared to the net cash inflow of RMB810,671,000 in
last year. During the Reporting Period, the Group’s cash receipts from returns of
investments had increased as compared to last year, mainly attributable to
receipts of wealth management products interest; cash paid for acquisition and
construction of fixed assets, intangible assets and other long-term assets
decreased respectively as compared to last year; net cash from the disposal of a
subsidiary and other operating entities decreased as compared to the amount
received from the disposal of equity interests in COSCO Logistics Co., Ltd. (中
國遠洋物流有限公司) (“COSCO Logistics”) and other entities last year.
In 2014, the Group’s net cash used in financing activities amounted to
RMB13,731,565,000, as compared to net cash inflow of RMB4,114,655,000 last
year. During the Reporting Period, cash payments for repayment of debts by the
Group increased as compared to last year. In particular, the first phase of RMB10
billion medium-term notes issued in 2009 was repaid in April, and the cash
received from the borrowings decreased as compared to last year.
— 34 —
7.
Others
(1) Details of major changes in components of income and sources of profits
of the Group
In 2014, the international shipping sector still did not see substantial
improvement of imbalance of supply and demand. Under such difficult
conditions, the Company had taken various measures to increase revenue and
reduce expenses. Realized net profit attributable to equity holders of the
Company of amounted to RMB362,529,000 representing an increase of
RMB127,059,000 or 53.96% as compared to RMB235,470,000 in 2013. In
particular, realized operating profit from container shipping and related business
amounted to RMB1,015,538,000, representing an increase of RMB2,003,676,000
as compared to loss of RMB988,138,000 last year. Operating results from dry
bulk shipping and related business further recorded a decrease in loss of
RMB652,849,000 as compared to last year, mainly contributed to the further
improvement in efficiency. In addition, subsidy received for the decommission
of vessels from the controlling shareholder of the Company (the “Shareholder”)
was RMB1,379,000,000 and a net loss of RMB1,069,483,000 was incurred by
the disassembly of vessels during the Reporting Period. Earnings of the Group
recorded in 2014 was mainly attributable to the decreased losses from principal
shipping businesses and the proceeds from the disposal of assets.
(2) Analysis of progress of the Company’s implementation of various
financing and significant asset restructuring events in the previous period
Not applicable.
(3) Progress of implementation of development strategies and operation plans
Container shipping business
In 2014, the global economy recovered gradually while the market demand for
container shipping increased slowly. As the pressure on shipping capacity and
supply still existed and the supply and demand relations was still severe, the
overall market freight rates saw no significant improvement. The Company
focused on “increasing revenue, controlling costs, refining management and
ensuring safety” and adopted various measures to increase revenue and reduce
expenses and finally achieved turnaround of operating gross profit.
— 35 —
COSCO Container Lines Co. Ltd. (中遠集裝箱運輸有限公司) (“COSCON”) had
undertaken numerous measures on vessel upgrade, alliance cooperation,
optimizing of route layout and shrinking of loss-making logistics, which resulted
in a significant decrease in costs of a single container for Europe and the United
States routes. With the coordination of southern and northern routes, more
efforts were able to be put into emerging markets. In order to explore new market
opportunities, COSCON implemented optimization, upgrade and revamp on
routes. Through constant improvement in the regional route network, transit
routes were planned, short-distance berths were coordinated and the utilization
rate of berth resources was increased.
In line with the state’s “One Belt and one Road” strategy, the Company expanded
its service outreach, resulting in an enlarged market share. The Company was
involved in Sino-Europe route business trying new mode of transportation and
identifying new profit growth drivers.
The Company continuously increased the proportion of its owned large vessels,
the proportion of custom-built vessels of high efficiency and energy saving with
social responsibility in mind, and promoted the decommissioning or disassembly
of its old vessels, which enabled great improvement in fleet structure. The
shipping fleet recorded a year-on-year decrease in average fixed vessel costs per
container per day. As at 31December 2014, out of our owned shipping fleet,
capacity of vessels with 8000 TEUs above further improved to 52%.
The Company strengthened top customer-oriented strategy, optimised supply
structure and customer structure and developed and owned a batch of small and
medium customers with higher contribution. Customer service guarantee system
was established to provide individualised services where customer experience
and internal communication efficiency were both increased step by step.
The Company continued to control each process, including purchasing and daily
fuel consumption, which realised a decrease of 8.3% in fuel consumption
volume, with a corresponding increase in operating capacity, as compared to last
year, which, combined with fluctuations in fuel prices, in turn led to a decrease
of 15.0% in fuel cost expenses, as compared to last year.
During the Reporting Period, the Company had continued to push forward the
integration of its traditional business with e-commerce, targeting a coverage of
all routes, and expanded its e-commerce platform to foreign trade routes, whilst
introducing new products such as “Zhiqibao” (滯期寶), which was a meaningful
attempt on commercialization of services.
— 36 —
The container shipping business of the Group achieved a shipping volume of
9,437,540 containers in 2014, representing a corresponding increase of 8.5% as
compared to last year.
Dry bulk shipping business
While strictly adhering to a market-oriented approach and shifting the line of
thinking, the Company focused on its shipping presence and took flexible
measures to capture market opportunities. Based on the improved quantitative
analysis model and the dynamic analysis on sensitive factors, the Company
strengthened the benchmark analysis of charters with markets and budgets so as
to enhance its level of operation. Taking into account budget indicators and
changes in market, the Company targeted by band with vessels and cargos
operated separately to safely ship valued cargos and made efforts to build
cycling routes based on long-term cooperation and location of spot goods. The
Company proactively developed premium routes for less than container load to
effectively take advantage of the features of different vessels of 300,000 tons,
200,000 tons and 115,000 tons, with the utilization of DWT improved.
Substantial progress was made in the implementation of the top
customer-oriented strategy. During the Reporting Period, the Company has
proactively arranged customer visits at various levels to promote differentiated
service products and customized solutions by leveraging its resource advantage.
As directed by the head office of the Group, the Company impelled further
cooperation with major mineral traders, grain traders and coal traders and have
made positive progress. At the end of the Reporting Period, the cargo sources of
the Company has seen obvious improvement over the beginning of the Reporting
Period. The Company proactively carried out reform and innovation in its
marketing mechanism and had its overseas network increasingly completed.
On the basis of overall budget management, the Company detailed components
of costs and improved its capability in cost control. Adhering to the principles
of “precise, detailed, strict and practical”, the Company detailed overall budget
management and placed emphasis on focus, details, process management, strict
inspection and the implementation of reward and punishment to further explore
its potential and get rid of its weaknesses, break expenditure items to the
minimum, and follow up continuously, with its management efficiency
improved, resulting a decrease of 16.5% in total costs as compared to last year.
— 37 —
The Company had optimized fleet structure and professional management,
construct a low-cost competitive advantage from the source. Based on market /
customer demands and its affordability, the Company dynamically adjusted fleet
structure and made all efforts to implement the plan to upgrade energy-efficient
and environment-friendly vessels. Meanwhile, each fleet secured long-term
resources based on ancillary operating plans.
The Company has refined its risk management system and optimized top-layer
design to facilitate the innovative integration of risk management, internal
control and overall management system. By organizing five level-1 risk
management segments of “market, strategy, finance, operation, and labor”, the
Company has realized the connection between comprehensive risk management
and business process and effectively prevented risk events.
A dry bulk shipping volume of 685.6 billion ton nautical miles in 2014 was
expected to be achieved while 835.5 billion ton nautical miles was actually
achieved.
Terminal business
COSCO Pacific emphasizes a terminal investment strategy of keeping balanced
layout, with terminal portfolio covering four major port clusters in mainland
China, Hong Kong and Taiwan as well as overseas port hubs. It has established
certain brands in the market with increasing influence in the industry. As at 31
December 2014, COSCO Pacific operated and managed 123 berths at 21 ports
worldwide (17 in mainland China, Hong Kong and Taiwan and 4 overseas), of
which 108 container berths had an annual handling capacity of 65,750,000 TEUs,
representing approximately 9.3% global market shares in terms of total
throughput. During the Reporting Period, COSCO Pacific continued to expand
its operating terminals through acquisition of terminal assets to increase
handling capacity. Meanwhile, it upgraded terminal infrastructures to improve
the efficiency of the operating terminals so as to enhance their competitiveness
and drive business growth. The actual additional annual operating capacity for
2014 is 3,000,000 TEUs.
— 38 —
(II) Analysis of operations by industries, products and regions
For details, please refer to the segment statement and income statement by
regions in the consolidated financial statements of the Group.
(III) Analysis of assets and liabilities
As at 31 December 2014, the total assets of the Group amounted to
RMB148,788,454,000, representing a decrease of RMB13,073,653,000 as
compared to RMB161,862,107,000 at the beginning of the Reporting Period.
Total liabilities of the Group amounted to RMB105,830,496,000, representing a
decrease of RMB13,917,804,000 as compared to RMB119,748,300,000 at the
beginning of the Reporting Period. Equity attributable to equity holders of the
Company amounted to RMB24,379,162,000, representing an increase of
RMB156,577,000 as compared to RMB24,222,585,000 at the beginning of the
Reporting Period.
As at 31 December 2014, the total amount of outstanding borrowings of the
Group was RMB86,943,054,000, representing a decrease of RMB9,452,323,000
as compared to RMB96,395,377,000 at the beginning of the year. As at 31
December 2014, net current assets amounted to RMB14,744,561,000,
representing a decrease of RMB1,696,135,000 as compared to the beginning of
the Reporting Period. The net debt as at 31 December 2014 amounted to
RMB47,237,530,000, representing a decrease of RMB951,457,000 as compared
to RMB48,188,987,000 at the beginning of the year. As at 31 December 2014,
the net liability to equity ratio was 109.96% as compared to 114.43% as at 31
December 2013.
The interest coverage ratio in 2014 was 1.19 times as compared to 0.51 times in
2013. Certain property, plant and equipment of the Group with net book value of
RMB34,776,361,000 (31 December 2013: RMB33,098,947,000) were pledged to
banks and financial institutions as collaterals for borrowings in the total amount
of RMB21,475,272,000 (31 December 2013: RMB20,244,211,000), representing
43.42% of the total value of the property, plant and equipment (31 December
2013: 40.66%).
— 39 —
Debt analysis
As at
As at
31 December 31 December
2013
2014
RMB’000
RMB’000
Categories
Short-term borrowings
Long-term borrowings
Less than 1 year
1 to 2 years
3 to 5 years
Over 5 years
Sub-total
3,127,600
2,765,570
15,758,769
22,713,238
21,849,275
23,494,172
83,815,454
25,278,450
20,205,381
24,130,210
24,015,766
93,629,807
Total
86,943,054
96,395,377
Classification by categories of borrowings
The secured borrowings of the Group amounted to RMB21,475,272,000 and
unsecured borrowings amounted to RMB65,467,782,000, representing 24.70%
and 75.30% respectively of the total borrowings.
Classification by categories of borrowings
The borrowings of the Group denominated in US dollars amounted to
RMB71,556,736,000 and borrowings denominated in RMB amounted to
RMB13,905,724,000, as well as borrowings denominated in other currencies
amounted to RMB1,480,594,000, representing 82.30%, 15.99% and 1.71%
respectively of the total borrowings.
Company guarantee and contingent liabilities
As at 31 December 2014, the Group had provided a guarantee on a banking
facility granted to an associate in the amount of RMB83,298,000 (31 December
2013: RMB128,608,000 ). Details of the Group’s contingent liabilities are
disclosed in Note 12.
— 40 —
(IV) Analysis of core competitive edge
1.
Advantages in scale: overall strength of principal businesses leading the
world
China COSCO is the capital platform of the China Ocean Shipping (Group)
Company (中國遠洋運輸(集團)總公司) (“COSCO Group”) and provides a wide
range of services covering the shipping value chain, including container
shipping, dry bulk cargo shipping, terminals and container leasing services to
international and domestic customers through its subsidiaries. Its container fleet
ranked sixth in the world. The container throughputs of the terminals invested
globally by COSCO Pacific ranked fourth in the world. Advantages in scale run
as a basis to provide more diversified and pluralistic comprehensive services for
its customers.
2.
Network advantages: global service network
As the capital platform of the COSCO Group, China COSCO, being an integrated
shipping company, maintained its presence in China and expanded to the global
market. With its advantages in market experience and network, it continues to
enhance its integrated capability in shipping.
With 192 ports for calling container vessels in 64 countries and regions, it
operated 101 international routes, 33 international branch routes, 23 coastal
routes in China and 83 branch routes in the Pearl River Delta and the Yangtze
River. COSCON has 500 or so domestic and overseas sales and service outlets.
Such wide coverage of sales and service network enabled the provision of quality
“door-to-door” services to our customers.
The dry bulk shipping routes covered more than 1,000 ports in more than 100
countries and regions worldwide. A large capacity in scale and well-established
outlets were more conducive to the design and scheduling of vessel routes so that
customised services could be offered to customers. Under the circumstances
where the cost was fixed, the advantage in scale was even more apparent.
As for terminal business, the Group’s terminal portfolio covers four major port
clusters in mainland China, Hong Kong and Taiwan as well as overseas port
hubs. As at 31 December 2014, the Group operated and managed 123 berths at
21 ports worldwide (17 in mainland China, Hong Kong and Taiwan and 4
overseas), of which 108 container berths had an annual handling capacity of
65,750,000 TEUs.
— 41 —
As for container leasing business, Florens company of the Group has an efficient
and quality international operation team and a sales and service network across
the globe, with offices or branches covering 13 locations spanning five
continents around the world and has business relationship with approximately
230 depots. The Group is capable of seeking development with upgrading and
transformation in respond to changing market and continues to increase its
competitiveness.
3.
Brand advantages: “COSCO” brand is well-known in the world
In the international shipping market, “COSCO” has a wide range of popularity
and recognition. “COSCO” brand has become an important intangible asset of
COSCO. Vessels and containers containing the “COSCO” trademark are
operating around the world and the trademark carries a symbolic representation
of COSCO.
4.
Advantages in business mode: to establish extensive strategic cooperation
and expand electronic commerce business
The controlling Shareholder (COSCO Group) has put a great emphasis on the
establishment of relationship and strategic cooperation with major customers by
the signing of major and long term contracts. It has strengthened the expansion
of domestic and overseas markets and customer - relationship maintenance with
enhanced cooperation for mutual benefit to ensure the stable increase of cargo
sources. It has put emphasis on the emerging markets and new customers and has
improved the composition of markets, cargo flow, cargo sources and customers.
COSCON continued to create a new business mode of Pan-Asian electronic
commerce platform by promoting the integration of traditional industries and
electronic commerce to expand electronic commerce platform business to
foreign trade route with an aim to cover the entire route.
— 42 —
5.
Advantages in business synergy: capitalising on the integrated advantages
of China COSCO
China COSCO has placed emphasis on strengthening its business synergy and
optimised integration of internal resources to provide customers with an entire
transportation chain service. COSCON has provided additional value-added
services to customers by strengthening internal coordination in order to
continuously enhance the level of customer service. COSCO Bulk has relied on
the support from COSCON to provide “integrated resolutions for goods
transportation” to the customers.
(V) Investment analysis
1.
Analysis of external equity investment
In 2014, the total external equity investment of the Group amounted to
RMB424,967,631.32.
The
Group
made
additional
investments
of
RMB62,974,365.23 to Ningbo Yuan Dong Terminals Ltd. The Group also
invested in six new companies as follows:
Proportion of
the equity
interest held
in the
invested
companies
Investment
Costs
Invested companies
Principal business
COSCO Yingkou Container
Services Co., Ltd. (營口中遠
集裝箱服務有限公司)
Qingdao Port Dongjiakou Ore
Terminal Co., Ltd.
Mindano Limited
COSNAM Shipping Co., Ltd.
Cosiam Transport Co., Ltd.
COSCO-HPHT Asia Container
Terminals Ltd.
Stack and storage
51%
510,000.00
Operation of terminal
25%
352,092,547.09
Agency service
Agency service
Agency service
Investment holding and
indirect holding of
equity interest in Asia
Container Terminals
Ltd.
49%
49%
49%
50%
981,772.45
3,450,165.67
4,955,710.11
3,070.77
— 43 —
(1) Security investment
Not applicable.
(2) Equity held in other listed companies
Unit: RMB
Change in
Book value as
owner’s equity
at the end of Gain/loss for the
during the
Sources of
the period reporting period reporting period Accounting item shares
Initial
investment cost
Percentage of
equity in the
company (%)
7,291,668.00
0.05
117,165,848.16
584,368.32
Tianjin Quanye
Bazaar
99,300.00
0.02
512,035.02
0.00
75,039.61 Available-for-sale Original legal
financial assets
person shares
purchased
000597
Northeast
Pharmaceutical
200,000.00
0.01
1,320,181.17
0.00
455,019.95 Available-for-sale Original legal
financial assets
person shares
purchased
000792
Qinghai Salt Lake
7,500,000.00
0.07
23,087,628.20
71,284.38
3,965,858.71 Available-for-sale Swap
financial assets
005880KS
KOREA LINE
CORP
80,138,805.95
0.51
16,586,059.23
-32,039,294.22
30,109,082.08 Available-for-sale Other
financial assets
601328
Bank of
Communications
676,413.00
0.00
3,473,739.20
132,819.44
95,906,186.95
╱
162,145,490.98
-31,250,822.08
Stock code
Short name of
securities
600837
Haitong Securities
600821
Total
46,530,327.48 Available-for-sale Acquired by
financial assets
promotion
1,134,073.68 Available-for-sale Original legal
financial assets
person shares
purchased
82,269,401.51 ╱
╱
(3) Equity held in non-listed financial enterprises
Changes in
owner’s equity
Percentage of Book value as at Gain/loss for the
during the
equity in the
the end of the reporting period reporting period
Source of
company (%)
period (RMB)
(RMB)
(RMB) Accounting item shares
Initial investment
cost (RMB)
Number of
shares held
(shares)
COSCO
Finance
Co., Ltd.
352,040,000.00
500,000,000
31.25
906,520,819.40
Bank of
Jiangsu
Co., Ltd.
400,000.00
400,000
0.0044
400,000.00
352,440,000.00 500,400,000.00
╱
906,920,819.40
Name of
object held
Total
271,430,426.33
Available-for-sale Acquired by
financial assets
promotion
271,430,426.33
(4) Trading of shares of other listed companies
Not applicable
— 44 —
Long-term equity Original legal
investments
person shares
purchased
╱
╱
2.
Wealth management entrusted to non-financial companies and derivatives
investments
(1) Entrusted wealth management
Entrusted wealth
Entrusted
wealth
Entrusted
wealth
Entrusted
wealth Remuneration
management
start date
management determination
end date
method
Actual
principal
Estimated
profit
Going
through
Partner Name
management
product type
management
amount
Ping An Trust
Trust
1,000,000,000
2014-1-2
2014-3-26
Expected 16,145,205.47 1,000,000,000 16,145,205.47
Yes
No
No
No
No
No
CITIC Securities
Collective asset
management plan
200,000,000
2014-1-6
2014-3-25
Expected
Yes
No
No
No
No
No
2,949,041.10
amount Actual profit
legal
recovered
obtained procedures
Source of funds
and indicate
whether the
Impairment
provision Related party
200,000,000
3,061,946.12
amount
provided
transactions
or not Litigation
funds are
raised funds
Relationship
Industrial Bank
Bank financing
1,000,000,000
2014-1-3
2014-3-28
Expected 14,038,256.16 1,000,000,000 14,038,356.16
Yes
No
No
No
No
No
CITIC Bank
Bank financing
1,000,000,000
2014-1-6
2014-3-28
Expected 13,758,804.11 1,000,000,000 13,419,178.08
Yes
No
No
No
No
No
Ping An Trust
Trust
1,500,000,000
2014-4-1
2014-4-17
Expected
2,301,369.86
Yes
No
No
No
No
No
Ping An Trust
Trust
500,000,000
2014-4-1
2014-4-16
Expected
719,178.08
500,000,000
719,178.08
Yes
No
No
No
No
No
CITIC Securities
Collective asset
management plan
199,000,000
2014-5-9
2014-11-18
Expected
7,050,052.05
199,000,000
7,124,200.00
Yes
No
No
No
No
No
CITIC CP
Specified asset
management plan
300,000,000
2014-5-6
2014-8-6
Expected
5,444,383.56
300,000,000
5,444,383.56
Yes
No
No
No
No
No
CITIC CP
Specified asset
management plan
300,000,000
2014-8-7
2014-11-6
Expected
5,235,616.44
300,000,000
5,235,616.44
Yes
No
No
No
No
No
CITIC CP
Specified asset
management plan
300,000,000
2014-11-6
2015-2-2
Expected
5,063,013.70
0.00
Yes
No
No
No
No
No
CITIC CP
Specified asset
management plan
200,000,000
2014-11-6
2015-2-2
Expected
3,375,342.47
0.00
Yes
No
No
No
No
No
Total /
/
6,499,000,000
/
/
/ 76,080,263.00 5,999,000,000 67,489,433.77
/
/
/
/
2,301,369.86 1,500,000,000
Cumulative amount
of principal and
revenue overdue:
(RMB)
/
0.00
(2) Entrusted loans
Source of funds
and indicate
Amount of
Loan interest
Use of
Security or
Overdue
Related
transactions
Extended or
borrowings
guarantor
or not
or not
not
Litigation
raised funds
Relationship
profit
investment
Ordinary
No
No
Yes
No
No
Equity fund
Joint venture
1,726,666.67
1,726,666.67
Borrower Name
entrusted loans
Loan duration
rate
COSCO Shanghai Hotel
70,000,000.00 2014.7.17-2014.12.12
6%
Company Limited
whether the
funds are
Estimated Profit/loss of
operation
Explanation of entrusted loans
COSCO Shanghai Hotel Company Limited is originally a joint venture of the
Company, which was interested in 10% of that company at the end of the year
following a disposal of its 48.07% equity interests.
— 45 —
(3) Other wealth management and derivative investments
Type of
investment
Financial
derivative
business
Financial
derivative
business
3.
Source of Party to
investment contract
╱ Citibank,
Societe
Generale,
JPMorgan
Chase Bank,
HSBC
╱ China
Merchants
Bank
Investment
amount Duration
Type of
Estimated
instrument
profit
97,500 tons Within
twelve
months
Fuel swap
US$80 million Within one Forward
year
foreign
exchange
settlement
Profit/loss of
investment Litigation
╱ US$-5,452,557.50
No
╱
No
╱
Use of proceeds from raised funds
Not applicable.
4.
Analysis of principal subsidiaries and companies with equity interest
The following is stated according to the audited financial report of A share of the
Company.
COSCON, a wholly-owned subsidiary of China COSCO, is principally engaged
in international and domestic container shipping services and related businesses.
Its registered capital is RMB11,088,763,082.00. As at 31 December 2014, its
total assets and total equity amounted to RMB55,995,785,878.26 and
RMB6,046,247,120.57 respectively. Total equity attributable to owners of the
parent company amounted to RMB5,732,110,700.89 (31 December 2013:
RMB5,880,579,854.90). Revenue, operating profit, gross profit and net profit in
2014 were RMB47,742,517,023.55, RMB651,132,225.42, RMB297,207,719.72
and RMB91,390,313.49 respectively. Net profit attributable to equity holders
of the parent company amounted to RMB52,027,471.59 (2013:
RMB-1,426,094,567.07).
COSCO Bulk , a wholly-owned subsidiary of China COSCO established in 2011,
in principally engage in cargo transportation service of dry bulk cargo to the
customers such as grain, minerals, coal, chemical fertilizer, steel, timber,
agricultural products and cement. Its current registered capital is
RMB25,968,025,394.50. As at 31 December 2014, its total asset and total equity
amounted to RMB36,738,523,356.67 and RMB6,094,065,693.62 respectively.
Total equity attributable to equity holders of the parent company amounted to
— 46 —
RMB5,820,473,570.70 (31 December 2013: RMB7,518,997,435.20). Revenue,
operating profit and net profit in 2014 were RMB12,557,153,617.69,
RMB-2,409,375,147.84 and RMB-1,671,563,525.65 respectively. Net profit
attributable to equity holders of the parent company amounted to
RMB-1,696,655,574.15 (2013: RMB-1,677,834,884.52).
COSCO Pacific and its subsidiaries are principally engaged in the businesses of
terminals management and operation and container leasing, management and
sales. COSCO Pacific is a company incorporated in Bermuda with limited
liability whose shares are listed on the main board of The Stock Exchange of
Hong Kong Limited (the “Stock Exchange”). On 31 December 2014, COSCO
Pacific was owned as to 44.54% by China COSCO. As at 31 December 2014, the
authorized share capital of COSCO Pacific was HK$400,000,000 and its issued
share capital and paid-up capital was HK$294,043,786.20. As at 31 December
2014, the total asset and total equity of COSCO Pacific amounted to
RMB46,546,766,182.13 and RMB30,884,628,156.48 respectively. Total equity
attributable to equity holders of the parent company amounted to
RMB28,949,708,704.87 (31 December 2013: RMB27,701,010,706.67).
Revenue, operating profit and net profit in 2014 were RMB5,404,648,365.05,
RMB2,106,952,050.70 and RMB1,919,287,386.16 respectively. Net profit
attributable to equity holders of the parent company amounted to
RMB1,795,666,947.76 (2013: RMB4,351,826.194.79).
5.
Projects financed by funds not raised from financing activities
Not applicable.
II. Discussion and analysis of the Board concerning the future development
of the Company
(I) Competition in the industry and development trend
Container shipping market
Competition landscape
Since the financial crisis, the container shipping market has experienced a period of
unprecedented turbulence and downturn. Liners made great efforts to reduce costs,
actively optimized business structure and expanded alliance cooperation in order to
compete in the sluggish market. According to the statistics of Alphaliner, the four
shipping alliances, including 2M, CKYHE, Ocean3 and G6, accounted for
approximately 35%, 23%, 22% and 19% of the weekly shipping capacity of the
Asia-Europe routes and approximately 15%, 36%, 14% and 30% of the weekly
— 47 —
shipping capacity of the Pacific routes respectively. The four alliances had a total
share of up to 99% and 95% in the shipping capacity of the afore-said two
eastern-and-western major routes. The co-operation structure in the
eastern-and-western major routes alliance is relatively stable and is not expected to
be broken in the near future.
Market outlook
Although the demand for container transportation continues to recover in 2015, the
capacity oversupply pressure does not fall and industry competition remains
intensive. Clarkson forecasts in February that the global container volume will
increase by 6.7% in 2015 as compared to 2014 and the supply of global container
transportation capacity will increase by 5.8%, slightly lower than the increase in
demand; the increase in capacity of large vessels (new vessels of more than
12,000TEUs) in 2015 will reach approximately 704,000 TEUs, representing a
year-on-year increase of approximately 11%. The concentrated delivery of large
vessels will continued to put pressure on the shipping capacity of east-west main
routes. As a result of hierarchical substitution, the pressure shall spread to
North-South shipping routes and routes in the emerging markets.
Development trend
In respect of demand and supply, a certain “barrier” has developed in the market
against the background of large vessel size and operational alliance in the
eastern-and-western major routes, especially the Asia-Europe routes. Liner
companies outside the alliance had gradually lost their competitiveness and their
operation retarget at sub-main routes, which results in the rapid growth of shipping
capacity supply of sub-main routes, especially in the emerging markets. According to
the statistics issued by Alphaliner in February, the current percentage of capacity
allocation to the Middle East/South Asia regional market, the African regional market
and the East Asia intra-regional is 13%, 9% and 11%, one percentage point higher
than the previous year in each case. In terms of absolute value, the regional capacity
allocation to the afore-said three emerging markets is approximately 2.36 million
TEUs, 1.67 million TEUs and 2.12 million TEUs, representing a year-on-year
increase of 14%, 17% and 18% respectively. The capacity scale of Asia-Europe routes
reaches 3.93 million TEUs, which is the same as the corresponding period last year.
In addition, it is notable that large vessel capacity will further favor the Pacific
routes. In February 2015, the shipping capacity of large vessels of more than 10,000
TEUs in the Pacific routes recorded a sharp year-on-year increase of 286%, resulting
a year-on-year increase of 25% in the total capacity of this route.
— 48 —
In respect of freight rate, being put under severe test by the “New Normal” of slower
growth of global economy and container shipping market demands, as well as the
continuing imbalance between demand and supply, it is expected that freight rate in
2015 will remain low and low-cost competitive situation will remain unchanged. This
situation is mainly due to two reasons: firstly, the inherent cost difference and the
difference in operating strategies and supplier structure among various main liners
will exist in the long run, and the ability of the suppliers to recover freight rate will
decrease in face of the intense market competition; secondly, in recent years, the low
cost advantages emerged from large-scale vessels in the container shipping market,
may prolong the duration of low market freight rate.
Dry bulk shipping market
Competition landscape
With the slow recovery of global economy and China’s economy entering into a “New
Normal”, the growth rate of demand for dry bulk shipping witnessed significant
slowdown. Meanwhile, due to significant decrease in the price of dry bulk cargo and
the effects from trade pattern, some large-scale mineral traders and grain traders
further enhanced their concentration on resources such as iron ore and coal and also
strengthened their control on shipping rights, which intensified the excessive
overcapacity of shipping capacity and thus the competition environment of dry bulk
market has further deteriorated. Therefore, shipping companies encountered more
difficulties in their shipping operations.
Market Outlook
Based on the latest forecasts of various international organizations and major forecast
institutions on global economic growth in 2015, the global economy in 2015 is
expected to slightly outperform than 2014. However, taking into account that the
price of bulk commodities will continue staying at a generally low level, as well as
the impact of domestic and international economic environment and the
strengthening US dollars, problems on multilevel structure will affect the increase of
demand for dry bulk. It is expected that the demand for dry bulk shipping will
increase by around 3.7% in 2015. Based on the delivery schedules of new ship orders
and the ship age structure of dry bulk shipping capacities, the supply of dry bulk
shipping capacities is expected to increase by around 4.5% in 2015. It is preliminarily
predicted that the market condition will remain very severe in the dry bulk market.
Development Trend
Firstly, the global economy will continue to show a weak recovery trend and a
differentiated development trend between developed economies and emerging
— 49 —
economies. In addition, the “New Normal” presented in economic development and
market environment in the PRC will, to some extent, slow down the growth rate of
dry bulk market. On one hand, due to continued downturn of the bulk commodity
trades, cargo owner customers will generally experience operating pressure, and in
order to control shipping costs, they will require spot market operation as mainstream
approach. On the other hand, faced with operation challenges, the customers are also
striving for innovation, and they will impose more requests on shipping companies
for integrated shipping service solutions and customized service products.
Secondly, sustained release of excessively oversupplied capacities in the ship
manufacturing industry in Asian region will continue to intensify the oversupply of
shipping capacities accumulated in a long term. And the imbalance between supply
and demand of shipping capacities will have a long-term effect on the international
dry bulk market, which will keep volatile at a low level in a quite long period of time.
Thirdly, low entry barriers in the dry bulk shipping industry results in the entry of
numerous investment funds and cargo owners, thus occupied the development space
of ship owners. In the past, many investors who are not engaged in the industry have
successively made significant investment in building bulk carriers, resulting in more
fragmental and complicated operating environment of suppliers of shipping
capacities and more intense competition, with obvious disadvantages compared to
highly centralized demand parties of shipping capacities.
Port Segment
Competition landscape
In 2015, the shipping industry has entered into a “New Normal” and the imbalance
between supply and demand remained prominent in the container shipping market.
The trend that container shipping companies establishing alliance and container
vessels becoming larger also brought new challenges for the expansion of terminals
and container leasing business. On one hand, shipping companies establishing
alliance and container vessels becoming larger require higher terminal service quality
and operation efficiency, such as terminal operation efficiency and port turnround of
ships.
— 50 —
Market outlook
In light of the slow recovery of economic fundamentals and new normal development
of the shipping industry, the global port industry is expected to experience stable
growth, but the growth rate may slow down. With China’s economic transformation
and slowdown of economic growth, it is expected that domestic manufacturing
industry will continue to be affected and the throughput growth will continue to show
a slowdown trend. Specifically, the growth rate of China’s port container throughput
is expected to remain above 5% or more. Meanwhile, with the implementation of full
reform on domestic ports, the port transformation and upgrading process will
accelerate.
Development trend
In recent years, as competition in the terminal industry became more intense, some
regional terminal operators have gradually grown stronger and developed their
business globally. Meanwhile, terminal operators are still active in making
investment in emerging markets such as Eastern Europe, Central America and
Far-East which are widely considered to have good growth potential.
(II) Development strategy
According to the latest revised development strategy of China COSCO (2020), China
COSCO categorizes its existing business into global integrated service cluster for
container and global integrated service cluster for dry bulk, and will put great
emphasis on the synergy between inter-cluster companies, so as to become an
industry leader in terms of profitability, anti-cyclicality, global presence and increase
in size as directed by the strategic vision of being customer-centric.
The overall position and function of global integrated service cluster for container in
the business of China COSCO falls into improvement of profitability, expansion of
global presence and increase in size. Container terminal business will actively adapt
to “New Normal” through activation of new reform impetus, practical exploration of
new marketing model, pursuit of profit growth, continuing optimization of fleet
structure, broad way of alliance cooperation, expansion of cost advantage. Container
terminal business will seek to realize synergy with container shipping business in
investment and operation. It will also accelerate the establishment of overseas
networks, emphasize the construction of hub ports, and increase shareholdings in
terminals to turn to be an operator of terminal business from its participant in order
to make contribution to the realization of the four strategic visions of China COSCO.
The overall position and function of global integrated service cluster for dry bulk in
the business of China COSCO falls into the development of anti-cyclicality and
— 51 —
expansion of global presence. Dry bulk shipping will increase investment in shipping
based on demand from customers, accelerate the restructuring of cargo sources and
customers, and proactively develop direct customers to secure shipping demand,
expand its global presence and realize healthy operation. Dry bulk terminal business
will make selective investment in individual terminals after giving adequate
consideration to the investment potential and synergetic value of relevant terminals.
(III) Operation plan
Container shipping business
In light of the “New Normal” of the global economy and the shipping market and the
new wave of Internet economy, the Company will further grasp the main keynote of
“Adjustment and Development”, actively adapt to “New Normal”, activate new
reform impetuses to continually improve effectiveness of business operation.
Capitalizing two key factors, namely large-scale vessel and energy saving and
environmental protection, the Group will continue to optimize its fleet structure,
establish a low-cost fleet, improve the economical efficiency of marine fuel. In
addition, the Group will promote sharing of resources within the alliance, enhance its
value-creating capacities and further consolidate and expand the cost advantages of
alliance. Moreover, the Group will actively exploit the potentials and the profit
growth contributors of the emerging markets and regional markets through
optimization of the type of vessels and shipping routes.
The Group will renovate its transportation modes under the guideline of national
strategy of “One Belt and One Road (一帶一路)” in order to establish seamless
connection of transit shipment in multi-transportation modes and establish unique
competitive advantages. Moreover, the Group will carry out marketing innovation,
improve service quality and put full efforts on the consolidation of cargo source base
in order to further increase the proportion of high-value cargoes and profit
contribution.
The Group will enhance its resource allocation capacities and utilization efficiency
in order to accelerate turnover of container equipment. Furthermore, the Group will
continue to strengthen ship operation and fuel consumption monitoring. Moreover,
the Group will continue to strengthen supplier management and negotiations and
enhance collaboration between terminal business and shipping business in order to
improve terminal operation efficiency.
— 52 —
We will further explore O2O e-commerce model and actively introduce new elements
and new mechanism, and we will integrate various resources through our
e-commence platform to expand derivative services with increasing efforts on service
and product innovation for establishing shipping e-commerce ecosphere, so as to
improve the overall value of the Company’s services.
In 2015, the Group’s container shipping business is expected to achieve a 5-6%
increase in cargo volume as compared with 2014.
Dry bulk shipping business
In 2015, with the new changes and features of domestic and international economic
development, COSCO Bulk will adhere to its operation and development principles
of “being market-oriented and customer-centric”, and gradually promote the
transformation of business model to enhance its soft power. Focusing on the four
dimensions of “anti-cyclicality, profitability, global presence, increase in size”, it
will insist on “systematic thinking, systematic innovation and systematic
implementation” to enhance the ability to increase revenues and create benefits so as
to achieve sustainable development.
It will establish the systematic innovation mechanism, speed up the transformation of
business model to build an integrated service cluster for dry bulk. Being
customer-centric, it will optimize the design of service products, and actively
promote the deep strategic cooperation with major customers and realize mutual
benefit by taking a series of measures such as “entering into long-term contracts to
provide selectively tailored-made ship-booking and transportation services to
targeted customers, collaborating on the development of resources and deepening
joint venture”. Through materializing the reforms on institutional mechanism of
marketing, it will adopt marketing account executive accountability system to
improve the customers’ experience on shipping services and enhance its global
market capacities. On the basis of the existing marketing network of overseas
companies, with a combination of source flow of goods, status of cargo owners and
potential of emerging markets, it will accelerate the establishment of oversea
networks to develop an overseas collaborative network platform. It will gradually
facilitate the adjustment, optimization and professional management on fleet
structure to form competitive advantages at a low cost from sources and continue to
meet the demands for special cargo types and project transportation at various levels
from customers.
COSCO Bulk expects that a shipping volume of 678.3 billion ton miles is to be
achieved in 2015.
— 53 —
Terminal business
To focus on investment opportunities in major hub ports and domestic second-tier
ports, and make flexible investment in promising second-tier domestic terminals. To
upgrade existing terminal facilities to adapt to the trend of large vessels. To improve
the terminal layout in Mediterranean region. To deepen the market research efforts on
bulk, universal and various specialized terminals. To enlarge and strengthen the
markets and businesses of existing specialized terminals such as stone terminals,
timber terminals and car docks, and to identify cooperation opportunities in relevant
specialized terminals to achieve diversification in terminal investment and operation.
To actively coordinate with global development strategy of COSCO fleet to achieve
full synergy between terminal and shipping segments. To promote the diversification
of shareholding cooperation and make efforts to enhance the profitability of terminal
segment. To firmly grasp the “Two Belts and One Road” strategic opportunity to
make efforts to promote the globalization layout of terminals. To focus on emerging
markets such as African and Latin-American markets.
(IV) Fund requirement for maintaining existing business and establishing
project company in process
Capital commitment
Contract
arrangement
Time
schedule
Financing
method
Funding source
arrangement
RMB 19.043 billion
Not applicable
2015
Debt
financing
Bank loans,
existing funds,
others
Cost of fund
and usage
description
Not applicable
(V) Potential risks
1.
Risk of Macroeconomic Environment
In 2015, the economy of the world is still in a deep adjustment period following
the financial crisis, the economic growth is likely to rebound significantly but
the uncertainties increase. The domestic economy maintains overall steady but
the downward pressure increases. It is difficult to reverse the situation that the
shipping markets fluctuate at a low level, the Group is still exposed to many
difficulties and challenges under such an environment that has not fundamentally
changed.
2.
Risk of Market Competition Landscape
With the continued downturn in the market, the shipping market in 2015 is still
not optimistic and also shows some new characteristics: firstly, the market
— 54 —
situation is more complicated. With the rising industrial concentration and the
continuous emerging of new business models such as shipping e-commerce and
shipping finance which were born out of new technologies and new economy, the
business models of traditional shipping industry are suffering from serious
challenges. Secondly, the customer demands become more diversified. The
customers have increasingly higher demands for mode of transport, transport
safety, service experience, etc. To meet customers’ full range needs and provide
integrated services becomes a “customer centric” innovative reflection. Thirdly,
the competition and cooperation relationships become closer. To deepen the
cooperation becomes the consensus of the shipping companies to cope with
market risk and achieve steady growth. Peer competition facilitates the
deepening of alliance cooperation and transboundary cooperation gradually
becomes the new normality. Overall, the weak market demand and the lack of
growth momentum represent the biggest challenges that the shipping companies
currently face.
3.
Risk of Production Safety
In recent years, the Company has been strengthening its efforts in safety
management. Although the overall safety environment remains stable,
production safety incidents occurred occasionally, which resulted in personal
injuries and property losses. Therefore, the pressure of production safety has
remained high. The Company is currently under difficult circumstances in terms
of business operation and we cannot afford more safety problems at work place.
The Company will further strengthen the production safety responsibility
system, increase safety training, ensure investments in safety measures and
strive to assure the normal order in the Company’s production and operation.
III. Profit distribution or capitalization of surplus reserves proposals
(I) Formulation, implementation or adjustment of cash dividend policies
The Company distributes dividend to all shareholders by way of cash or scrip
dividend, and the total dividends shall be no less than 25% of the audited
distributable profits of the Company during the accounting year or period
concerned in principle. The actual distribution amount of dividends to
Shareholders shall be based on the operating results, cash flow condition, current
financial position and capital expenditure plans of the Company. The proposal of
dividend distribution is formulated by the Board and implemented after approval
by the general meeting of the Company. The amount of dividends to be
distributed shall be determined based on the lower of the after-tax profits set out
in the audited financial statements prepared pursuant to China Accounting
Standards for Business Enterprises and HKFRSs.
— 55 —
On 12 November 2012, the resolution regarding the amendments to the Articles
of Association of China COSCO Holdings Company Limited was considered and
approved in the second extraordinary general meeting of China COSCO for
2012. Pursuant to the amendments to Article 193, the profit distribution policy
of the Company is as follows:
1.
Profit distribution principles: The Company should implement positive
profit distribution policies and value investors’ reasonable investment return
and the Company’s sustainable development to maintain the continuity and
stability of profit distribution policy. The cumulative profit distribution in
cash by the Company in the last three years was in principle not less than
30% of the average annual distributable profits of the Group for the last
three years.
2.
Profit distribution frequency: In principle, the Company distributes profit
once a year. When conditions permit, the Board may recommend the
Company to distribute interim cash dividends according to the earnings and
capital requirement of the Company.
3.
Profit distribution decision-making system and procedures: The profit
distribution proposal of the Company shall be formulated and reviewed by
the Board and submitted to the general meeting for approval. Independent
Directors shall express their opinions clearly in regard to the profit
distribution proposal. The Supervisory Committee shall supervise the
implementation of the profit distribution proposal.
4.
In case of no proposal of profit distribution in cash being made in any
profitable year with available distributable profit of the Company,
disclosure should be made in a timely manner regarding the Board’s
explanation and the Independent Directors’ expressed opinions. Upon
consideration by the Board, it shall be submitted to the general meeting for
review and the Board shall provide explanation at the general meeting.
5.
When determining the particulars of the cash dividend proposal of the
Company, the Board shall study and discuss on, among others, the timing,
conditions as well as the minimum ratio, conditions of adjustments and other
factors as required for making the decisions. The Independent Directors
shall express their opinions clearly. When considering the particulars of the
profit distribution proposal at the general Meeting, the Company shall
communicate with the Shareholders, especially the minority shareholders,
— 56 —
through various channels (including but not limited to hotlines, mailbox of
Secretary to the Board and inviting minority investors to attend the
meeting), in order to gather opinions from the minority Shareholders and
respond to their concerns in a timely manner.
6.
Adjustments to cash dividend policy: The Company shall strictly implement
the cash dividend policy stipulated in the Articles of Association and the
particulars of the cash dividend proposal considered and approved at the
general meetings. Adjustments or amendments to the cash dividend policy
stipulated in the Articles of Association shall only be made after detailed
discussion and corresponding decision-making procedure according to the
Articles of Association and approval shall be obtained from Shareholders
holding more than two thirds of the total voting rights present at the general
meeting.
7.
Disclosure of cash dividends in regular reports: The Company shall disclose
the details regarding the formulation and implementation of its cash
dividend policy in regular reports. In case of any adjustments or
amendments to cash dividend policy, it shall also explain in detail the
conditions and the procedures for such adjustment or amendments.
After the proposal of profit distribution has been passed by resolution at the
general meeting of the Company, the Board must complete the distribution of
dividends (or shares) within two months after the general meeting.
Although the Company achieved profits in 2014, the negative value of
undistributed profits had not been reversed. After consideration by the Board, it
was proposed that profits realized in the current year would not be distributed
but would be used to supplement working capital to improve the financial
conditions.
— 57 —
(II) Proposals or budgets for profit distribution and capitalization of surplus
reserves of the Company in the recent three years (including the
Reporting Period)
Unit: RMB
Number of
bonus
shares for
every 10
shares
Year of
(share)
Distribution
2014
2013
2012
—
—
—
Dividend Number
for every of scrip
10 shares shares for
(RMB) every 10
shares
(tax
(share)
inclusive)
—
—
—
Net profit
attributable to
Ratio to net
shareholders of
profit
listed
companies in attributable to
consolidated shareholders
of listed
financial
statements of companies in
consolidated
the bonus
financial
distribution
Cash dividend
year statements (%)
(tax inclusive)
—
—
—
— 58 —
—
362,529,000
—
235,470,000
— -9,559,138,000
—
—
—
OTHER INFORMATION
Closure of Register of Members
The register of members of the Company will be closed from Tuesday, 21 April 2015
to Wednesday, 20 May 2015, both days inclusive, during which period no transfer of
shares will be effected. Holders of H shares of the Company whose names appear on
the register of members of the Company on Monday, 20 April 2015 at 4:30 p.m. are
entitled to attend the annual general meeting of the Company to be held on
Wednesday, 20 May 2015.
Corporate Governance
The Company is committed to maintaining a high standard of corporate governance
within the Group, and the Board considers that effective corporate governance marks
an important contribution to corporate success and to enhancing Shareholders value.
The Company adopted its own corporate governance code, which incorporates all the
code provisions and a majority of the recommended best practices in the Corporate
Governance Code (the “Code”) as set out in Appendix 14 to the Rules Governing the
Listing of Securities on The Stock Exchange of Hong Kong Limited (the “Listing
Rules”).
None of the Directors is aware of any information that would reasonably indicate that
the Company had not been in compliance with the Code for any part of the period for
the year ended 31 December 2014.
Model Code for Securities Transactions by Directors
Since the listing of the Company on the Main Board of The Stock Exchange of Hong
Kong Limited (the “Stock Exchange”) in 2005, the Board has adopted the Model
Code for Securities Transactions by Directors of Listed Issued (the “Model Code”)
as set out in Appendix 10 to the Listing Rules as its own code for securities
transactions by the Directors and supervisors of the Company. Having made specific
enquiries of all Directors and supervisors of the Company, each of them has
confirmed that they complied with the required standard set out in the Model Code
throughout the year ended 31 December 2014.
Board Committees
The Company has established a strategic development committee, a risk control
committee, an audit committee, a remuneration committee, a nomination committee
and an executive committee.
— 59 —
Audit Committee
The audit committee of the Company (the “Audit Committee”), established in April
2005, comprises two independent non-executive Directors and one non-executive
Director. It is chaired by Mr. KWONG Che Keung, Gordon and the other two
members are Ms. SUN Yueying and Mr. YANG, Liang Yee Philip. All members of the
committee are competent and experienced in understanding, analyzing and reviewing
the financial reports of listed companies.
The annual results of the Company have been reviewed by the Audit Committee.
Repurchase, Sale or Redemption of Shares of the Company
During the Reporting Period, neither the Company nor any of its subsidiaries had
repurchased or sold any listed securities of the Company. The Company had not
redeemed the Company’s securities during the Reporting Period.
Service Contracts
Each of the Directors and supervisors of the Company has entered into a service
contract with the Company.
Pre-emptive Rights
The articles of association of the Company and the laws of the PRC contain no
provision for any pre-emptive rights, requiring the Company to offer new shares to
Shareholders on a pro-rata basis to their shareholdings.
Auditors
The Company has appointed PricewaterhouseCoopers and Ruihua Certified Public
Accountants, LLP as the international and PRC auditors of the Company respectively
for the year ended 31 December 2014. PricewaterhouseCoopers has conducted the
audit of the Group’s financial statements which are prepared in accordance with
HKFRSs. Resolutions for the re-appointment of PricewaterouseCoopers and Ruihua
Certified Public Accountants, LLP as the international and PRC auditors of the
Company respectively will be proposed at the forthcoming annual general meeting of
the Company to be held on Wednesday, 20 May 2015.
— 60 —
PAST PERFORMANCE AND FORWARD-LOOKING STATEMENTS
The performance and the results of operations of the Group contained in this annual
results announcement are historical in nature, and past performance does not
guarantee the future results of the Group. Any forward-looking statements and
opinions contained within this annual results announcement are based on current
plans, estimates and projections, and therefore involve risks and uncertainties. Actual
results may differ materially from expectations discussed in such forward-looking
statements and opinions. The Group, the Directors, employees and agents of the
Group assume (1) no obligation to correct or update the forward-looking statements
or opinions contained in this annual results announcement; and (2) no liability in the
event that any of the forward-looking statements or opinions do not materialize or
turn out to be incorrect.
PUBLICATION OF ANNUAL REPORT
This annual results announcement has been published on the websites of
the
Stock
Exchange
(http://www.hkexnews.hk)
and
the
Company
(http://www.chinacosco.com). An annual report for the year ended 31 December 2014
containing all the information required by Appendix 16 to the Listing Rules will be
despatched to Shareholders and will be available for review on the same websites in
due course.
By Order of the Board
China COSCO Holdings Company Limited
Guo Huawei
Company Secretary
Beijing, the People’s Republic of China
26 March 2015
As at the date of this announcement, the directors of the Company are Mr. MA Zehua 2 (Chairman), Mr.
LI Yunpeng 1 (Vice Chairman), Ms. SUN Yueying 2 , Mr. SUN Jiakang 1 , Mr. YE Weilong 1 , Mr. WANG
Yuhang 2 , Mr. JIANG Lijun 1 (President), Dr. FAN HSU Lai Tai, Rita 3 , Mr. KWONG Che Keung,
Gordon 3 , Mr. Peter Guy BOWIE 3 and Mr. YANG, Liang Yee Philip 3 .
1
2
3
Executive director
Non-executive director
Independent non-executive director
* For identification purpose only
— 61 —

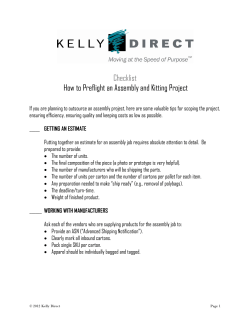
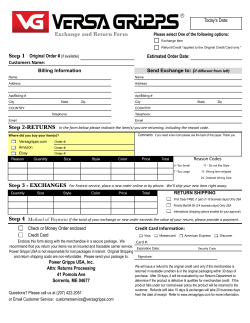

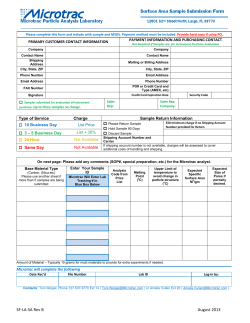


© Copyright 2026