
Dramatic Drop in Fuel Prices Starts To Affect the Markets
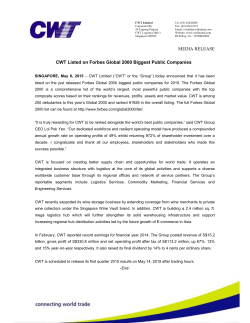
1Q COST REPORT ECONOMICS By Tim Grogan Dramatic Drop in Fuel Prices Starts To Affect the Markets Annual price declines: 41% for diesel fuel, 42% for gasoline, 52% for crude, 25% for natural gas T he largest drop in energy costs in decades has to have an impact on construction costs and markets. But perhaps not as much as you may think. “The impact of the drop in oil prices will be limited to a few specific markets, such as petrochemical plants, and it will be very regional,” says Robert Murray, chief economist for Dodge Data & Analytics. He still predicts that the dollar value of total construction starts will increase 9% to 10% this year. “The pullback in manufacturing is dampening growth but not causing a decline,” he says. However, the downturn in the manufacturing sector will be severe. “We had a surge in petrochemical work last year and expected a slowdown in 2015, but now we expect that slowdown to be even stronger due to the drop in oil prices,” Murray says. That is also adding to the deferral of pipeline work. He predicts that, overall, the manufacturing sector will decline 25% this year. However, Murray points out that this downturn follows two very strong years of growth for the manufacturing market. “When we look at major markets, we agrees that the positive side of lower oil predict that non-residential construction prices outweighs the negative side. will settle back to a 6% annual increase in “Lower energy prices are reducing the 2015, after a 19% gain in 2014. However, input cost of producers for most construcif we exclude manufacturing, we would be tion materials, especially the drop in looking at an 11% gain this year in the diesel fuel prices on transportation costs. non-residential building market,” he says. That’s good news for the industry because On the plus side, Murray believes it shrinks overall costs,” says Basu. lower oil prices will help boost consumer “Lower fuel prices will reduce tax revspending, which should have a positive enue for highway projects, but, on the impact on both the commercial building other hand, those projects become and homebuilding markets. “The cheaper to deliver,” he adds. drop in oil prices will have a “Also, lower fuel prices means mixed impact on construction, people will drive more, helping but, in net, we think it will be to boost gas-tax revenue. So, in SEE VIDEO ONLINE positive,” Murray says. the end, I think it’s a wash.” In addition, Murray says there are inMost state and local governments do dications that oil prices have bottomed not depend heavily on gas taxes to fund out. “The key to our forecast is the dura- construction, he adds. “However, it may tion of the decline in oil prices and when threaten future projects if the federal they will stabilize. What we have seen in Highway Trust Fund becomes depleted. February and March is oil prices edging But, for now, with lower material costs, upward, and, as a result, we think the state and local governments will find it overall impact of lower oil prices on con- easier to push projects forward, given struction will be relatively small,” he says. their limited budgets, he says. Anirban Basu, the chief economist for “Falling interest costs combined with the Associated Builders and Contractors, falling materials costs will be a boost for NATURAL GAS TEXAS CRUDE 30 30 20 20 +17.3 10 +11.1 +7.3 0 -8.9 -10 20 +19.7 +4.0 0 -0.9 -10 -25.4 -31.2 -30 2010 2011 2012 2013 2014 2015 2016 +26.2 +31.3 10 -5.1 -20 +9.9 +2.5 0 -3.5 -10 -5.6 -20 -30 -40 -51.6 -50 -60 FORECAST 30 +30.8 +28.7 -30 -20 40 FORECAST 10 PERCENTAGE PERCENTAGE 40 FORECAST +35.5 U.S. GASOLINE PERCENTAGE 40 enr com 2010 2011 2012 2013 2014 2015 2016 -41.7 -40 -50 2010 2011 2012 2013 2014 2015 2016 SOURCE: DATA SUPPLIED BY IHS GLOBAL INSIGHT enr.com March 30/April 6, 2015 ENR 1 1Q COST REPORT ECONOMICS WHAT THE ECONOMISTS THINK Anirban Basu, ABC Lower oil prices will be a plus for overall economic growth. The bottom line is that lower oil prices will be a boost to overall economic growth by stimulating consumer spending, says Anirban Basu, chief economist for the Associated Builders and Contractors. “Many markets will benefit, but oil-related sectors will suffer.” construction. I have talked with several contractors, and they all say they have not seen any slowdown in the market,” says Basu. The impact of lower oil prices on construction materials is more sketchy. Some will be hit, but other materials are not vulnerable to lower oil prices. And though some materials prices are falling, that has nothing to do with the drop in oil prices. The obvious construction materials to reflect the massive drop in oil prices would be paving asphalt. Not so. “There is a major disconnect between falling oil prices and asphalt prices,” says Charlie McCarren, construction materials economist with IHS Global Insight. There are several components in the manufacturing of asphalt that blunt the impact of lower oil prices, such as using lighter crude oil, which reduces the asphalt by-product, McCarrren says. “Asphalt may move in Charlie McCarren, IHS Global Insight Robert Murray, Dodge Data & Analytics Lower oil prices won’t have a big impact on construction materials prices. Strong market demand will mostly offset lower energy costs, says Charlie McCarren, the economist who forecasts construction materials trends for IHS Global Insight. “It takes about six months for lower crude-oil prices to trickle down through the supply chain, and even then there will be a diminished impact.” He predicts that asphalt paving prices will decline only 4.1% this year, despite the forecast of a 52% drop in West Texas crude-oil spot prices. The impact of lower oil prices on construction starts will be limited to a few markets. The major impact of lower oil prices will be on the manufacturing sector, especially those related to petrochemical plants, says Robert Murray, chief economist for Dodge Data & Analytics. While he expects to see a pullback in the manufacturing sector, his forecast still looks for a 9% to 10% increase in the dollar value of overall construction starts in 2015. “The drop in oil prices will be focused on a few project types and be very regional,” he says. the same direction as oil, but it does not have the same volatility,” he says. IHS Global Insight forecasts the spot price for West Texas crude oil will fall 52% this year. But the same forecast calls for only a 4.1% decline in asphalt paving cost. IHS expects asphalt prices to decline another 1.2% in 2016 before rebounding 4.2% in 2017 and 3.7% in 2018. However, there is a time lag to take into account, McCarren warns. “It takes about six months for lower crude-oil prices to trickle down through the supply chain. That is one reason we have not seen much of a reaction in the producer price indexes yet,” he says. “We have a big drop in input costs, but most material prices seem to be improving because there is no slowdown in demand,” says McCarren. “Material [prices] are just not driven by input costs, such as energy, but also by demand in the marketplace. The one sector we expect to see a pullback is manufacturing, but general demand is improving, and that will put a floor beneath prices,” he adds. As a consequence, lower input costs may result in larger profit margins for producers, rather than lower prices for contractors. “We are not at a tipping point for most material prices yet. But by the end of the second quarter of this year, we think we may start seeing price declines for some materials,” McCarren says. The dramatic 52% decline in crude-oil prices is overshadowing the 25% decline in natural-gas prices that IHS Global Insight is forecasting. However, the drop in natural-gas prices may be more significant for construction materials, says McCarren. “Most construction materials producers have moved away from oil, in favor of natural gas,” he says. IHS Global Insight predicts that enr.com March 30/April 6, 2015 ENR 2 1Q COST REPORT ECONOMICS natural-gas prices will rebound 7.3% next year and another 10.5% in 2017. Likewise, it forecasts that the spot price for West Texas crude oil will bounce back 30.8% next year, followed by another 16.8% gain in 2017. The prediction for the average U.S. gasoline price is more subdued: After an expected 41.7% decline this year, prices are predicted to rebound 9.9% in 2016 and another 5.0% in 2017. IHS also recently released its latest Procurement Executive Group survey index. That PEG index dropped to 42.4%. It is a diffusion index, which means when it drops below 50, more firms are reporting price declines than increases. However, it does not measure the magnitude of the declines, only the direction, says McCarren. In addition, the index was only created in 2011, so claims of a record low should be taken with a grain of salt, he says. Prices for other construction materials also are falling, but the declines have little to do with lower oil prices. The Bureau of Labor Statistics’ producer price index for softwood lumber in February was down 4.5% from a year ago, which is mostly due to the soft rebound in housing. Likewise, steel, aluminum and copper prices are down but, again, due more to market conditions than oil prices.“There has been a great expansion of production capacity for commodities such as copper, aluminum and steel, and the global market is not strong enough to soak up the excess capacity,” says McCarren. “That is having a bigger impact on lower commodity prices than the recent drop in oil prices,” he adds. Bucking the downward price trend has been cement, which is posting historically high price increases. In February, the producer price index for cement was 9.4% above a year ago; IHS predicts that will calm down to a year average 3.5% gain. The February PPI for ready-mix concrete was up 4.3% for the year. The PPI for gypsum-wallboard prices rose 3.4% in February, following a 4.6% gain the previous month, leaving prices 1% above a 2014’s level. The PPI for plywood prices is up 4.9% for the year. n BUILDERS’ CONSTRUCTION COST INDEXES JAN. 2014 NAME, AREA AND TYPE APRIL. 2014 JULY 2014 OCT 2014 JAN. 2015 % CHANGE QTR. YEAR GENERAL-PURPOSE COST INDEXES: ENR 20-CITY: CONSTRUCTION COST1 899.72 907.64 915.56 920.35 928.35 +0.9 ENR 20-CITY: BUILDING COST1 788.05 792.90 796.73 805.49 813.67 +1.0 +3.3 BUREC: GENERAL BUILDINGS2 345.00 349.00 352.00 354.00 355.00 +0.3 +2.9 FM GLOBAL: INDUSTRIAL3 305.00 NA 308.00 NA NA NA NA MEANS: CONSTRUCTION COST4 203.00 203.80 204.90 205.60 204.00 –0.8 +0.5 ECC, EDWARTOSKI COST CONSULTING5 173.50 174.00 174.35 174.78 175.21 +0.3 +1.0 TURNER: GENERAL BUILDING1 885.00 896.00 908.00 917.00 NA NA NA RIDER LEVETT BUCKNALL6 154.56 156.33 158.48 161.11 162.98 +1.2 +5.5 +3.2 SELLING PRICES INDEXES—BUILDING: SPECIAL-PURPOSE BUILDING COST INDEXES U.S. COMMERCE: ONE-FAMILY HOUSE7 109.90 109.80 111.30 113.80 116.70 +2.6 +6.2 U.S. COMMERCE: NEW WAREHOUSES7 136.80 137.50 138.50 139.00 139.90 +0.7 +2.3 +1.7 U.S. COMMERCE: NEW SCHOOL BUILDINGS7 145.70 146.30 146.60 147.70 148.10 +0.3 U.S. COMMERCE: NEW OFFICE BUILDINGS7 122.10 122.60 123.20 124.20 125.00 +0.7 +2.4 POWER ADVOCATE: POWERPLANT8 185.29 185.79 186.41 187.34 188.48 +0.6 +1.7 1BASE: 1967=100; 2BASE: 1977=100; 3BASE: 1980=100; 4BASE: 1993=100; 5FORMERLY SMITH GROUP, 1992=100; 6BASE: APRIL 2005=100; 7BASE: 1992=100; 8POWERPLANT FOR A 550-MW COMBINED-CYCLE FACILITY. . ENR’S CANADIAN COST INDEXES 1913=100 CITY CONSTRUCTION COST OCT. ’14 % CHG. INDEX YEAR BUILDING COST OCT. ’14 % CHG. INDEX YEAR COMMON LABOR COST OCT. ’14 % CHG. INDEX YEAR SKILLED LABOR COST OCT. ’14 % CHG. INDEX YEAR MATERIALS COST OCT. ’14 % CHG. INDEX YEAR MONTREAL 10378.38 +3.2 5767.66 +2.7 20873.68 +3.5 9484.08 +3.2 3497.36 +1.9 TORONTO 10515.58 +2.9 5491.24 +2.4 21705.26 +3.3 8494.29 +3.0 3657.39 +1.6 CONSTRUCTION MATERIALS PRICE MOVEMENT IN 2014-15 AGGREGATES ALUMINUM SHEET ASPHALT PAVING CEMENT CONCRETE PIPE COPPER PIPE DIESEL FUEL FABRICATED STEEL GYPSUM PRODUCTS LUMBER, SOFTWOOD PLYWOOD PVC PRODUCTS READY-MIX CONCRETE SHEET METAL JULY AUG. SEPT. OCT. NOV. DEC. JAN. FEB. 0.0 +4.5 +1.7 +4.1 –0.2 +2.0 –0.1 +4.1 +2.5 +6.7 +0.9 +1.7 0.0 +3.1 +0.7 +7.3 0.0 +1.7 +0.2 +3.5 –1.2 +6.7 +0.3 +2.0 –0.1 +3.4 +1.5 +8.4 +0.2 +2.3 +0.2 +3.3 +0.1 +8.7 +0.1 +2.7 0.9 +3.1 –2.0 +5.7 –0.3 +1.5 +0.1 +2.6 –0.3 +3.7 –1.2 +0.2 MONTHLY % CHG. 0.0 +0.4 +0.5 +0.8 +0.3 –0.1 +3.4 0.0 ANNUAL % CHG. +5.0 +5.1 +5.7 +6.4 +6.6 +6.8 +8.5 +9.4 MONTHLY % CHG. ANNUAL % CHG. MONTHLY % CHG. ANNUAL % CHG. MONTHLY % CHG. ANNUAL % CHG. MONTHLY % CHG. ANNUAL % CHG. MONTHLY % CHG. ANNUAL % CHG. MONTHLY % CHG. ANNUAL % CHG. MONTHLY % CHG. ANNUAL % CHG. MONTHLY % CHG. ANNUAL % CHG. MONTHLY % CHG. ANNUAL % CHG. MONTHLY % CHG. ANNUAL % CHG. 0.0 +3.5 +2.6 +2.2 –0.3 –1.2 +0.1 +1.3 +0.4 +8.2 –0.2 +9.7 +2.6 +5.9 –0.1 +1.5 +0.5 +4.6 +0.4 +2.0 0.0 +3.4 –0.4 –0.9 –0.3 –3.9 0.0 +1.2 –0.6 +7.2 +1.8 +9.1 +4.6 +8.9 +0.3 +2.1 +0.2 +5.0 +0.6 +2.9 0.0 +3.4 –0.7 –2.1 –1.5 –7.9 0.0 +1.9 –1.2 +6.1 +1.6 +10.1 –1.8 +7.0 –0.1 +1.7 0.0 +4.8 –0.5 +2.3 0.0 +2.7 –1.4 –3.5 –6.2 –11.0 –0.2 +1.6 +0.4 +7.5 –2.9 +5.4 +0.3 +6.9 +0.7 +2.8 +0.4 +5.1 –0.4 +2.0 0.0 +2.7 –0.3 –3.0 –3.6 –11.0 0.0 +1.6 +1.7 +10.4 –2.2 +0.8 +0.1 +8.1 0.0 +2.4 +0.7 +5.5 +0.1 +2.1 +0.9 +3.3 –1.3 –4.4 –14.9 –26.1 0.0 +1.6 –4.2 +3.8 –1.2 +0.3 –0.7 +8.2 –1.0 +1.4 –0.3 +5.0 0.0 +2.1 +1.2 +4.0 –3.5 –9.3 –20.9 –40.4 +0.1 +1.2 +4.6 +0.2 +2.0 –0.6 –0.3 +7.5 –0.1 +0.7 +1.0 +4.8 +0.7 +2.2 –0.3 +3.7 –2.7 –10.5 +3.2 –41.0 +0.1 +1.0 +3.4 +1.0 –1.6 –4.5 –2.5 +4.9 +1.0 +1.1 +0.4 +4.3 +0.3 +2.3 MONTHLY % CHG. ANNUAL % CHG. MONTHLY % CHG. ANNUAL % CHG. MONTHLY % CHG. ANNUAL % CHG. SOURCE: BUREAU OF LABOR STATISTICS. MONTHLY AND YEAR-TO-YEAR PERCENT CHANGES FOR PRODUCER PRICE INDEXES FOR LATEST EIGHT-MONTH PERIOD. enr.com March 30/April 6, 2015 ENR 3 1Q COST REPORT EQUIPMENT By Tudor Van Hampton Diesel Fuel Prices Bottom Out Nationwide fuel prices ticked up in February but are still 41% lower than last year’s levels PRODUCER PRICE INDEX DIESEL FUEL Monthly percent change 5 0.0 -5 PERCENTAGE F or some construction projects—such as public paving work—the cost of fuel and freight is often tied to a price index. So, a drop in petroleum prices of 50% or more is neither good news nor bad news for contractors. For others, the news is seen as a mixed blessing. Prices inched up in February, but they still remain far lower than last year’s levels. If low fuel prices continue, some experts predict, they will create an economic stimulus that will give consumers more cash—and, eventually, more money to find its way into new construction. All this remains to be seen, though. Shale output has slowed, and after roughly 10 straight months of price declines, diesel fuel prices in February inched up 3.2% higher than January’s but were still 41% lower than a year ago, according to the Producer Price Index. Diesel prices at the pump averaged $2.92 across the U.S. in mid-March, down 27% compared to a year ago, after falling to $2.83 in early February—its lowest since January 2010, according to the Energy Dept. Falling prices already have produced mixed effects. Firms working in the oil patch have seen drilling put on hold and equipment idled, while some refinery upgrades have continued as planned. Estimating is a bigger challenge, too. “We just a got a six-year job where we estimated $4-a-gallon gas,” says Thad Pirtle, vice president of equipment for Evansville, Ind.-based Traylor Bros. “It’s really a throw of the dice.” Fleet managers say projects are certainly spending less on fuel but add that the drop in prices has hindered their ability to make strategic investments. Firms investing in alternative fuels, such as electric, propane and compressednatural-gas vehicles, say they likely will take a break from these purchases this year as the drop in petroleum-oil prices -10 3.2% -15 -20 -25 A J A O D F ’15 SOURCE: BUREAU OF LABOR STATISTICS now makes for a longer payback period. “It gives us pause,” admits Marty Ozinga IV, president of Chicago-area concrete supplier Ozinga Bros. Inc. It operates four CNG filling stations and about 150 vehicles that run on CNG. “There is some general replacement of equipment that we are doing this year with diesel,” Ozinga says. “The low prices on diesel and oil are definitely part of the decision.” Alternative-fuel experts say oil prices may be back on the rise. “I think we will see sales pick up next year as soon as oil prices start to increase,” said Stephe Yborra, director of market development for natural-gas group NGV America at the Green Truck Summit, held in early March in Indianapolis. “Don’t fall off the train,” he urged fleet managers. Even with the sharp downturn in oil prices, the price spread between petroleum and alternative fuels is still favorable—though greatly diminished— compared to last year. According to the website CNGNow.com, the average pergallon-equivalent price of CNG is $2.11, while diesel prices in the U.S. are expected to average $2.83 this year com- pared to $4 a gallon last year, EIA says. “We know it is going to go back up,” Yborra said, referring to petroleum-based fuels such as diesel, which powers most construction machines. “We just don’t know how quickly.” Meanwhile, companies say they are continuing to make investments that lower their overall fuel costs. Newer, clean-diesel engines in both on-road and off-road machinery are proving to be more fuel-efficient, and less-critical upgrades can further reduce operating costs, say fleet managers. On heavy-duty trucks, even the lights can make a difference. “The fuel savings of moving from incandescent high-energy lights to LEDs is real money,” said Doyle Sumrall, managing director of the National Truck Equipment Association, at the Indianapolis summit. “It’s almost like turning off your truck for an hour or two a day.” Cutting idle time is another industry focus, he added, noting that more firms are adopting technologies such as wireless telematics to help monitor their fuel usage. “Over 50% of the cost of fuel we use is from truck idling,” echoes Ozinga. Those who rely on equipment values to secure bonding or asset-backed loans may be concerned about a glut of idle machines in the oil patch, but appraisers are less worried. Machines in oil-producing regions are at risk, but only 6% to 8% of all rented heavy equipment is exposed to pure oil-and-gas work, according to appraisal firm Rouse Asset Services. Further, the oil-and-gas sector accounts for only 10% of all rental revenue, its analysts say. “[If] all this were to be wiped out, you might have 6% to 10% of equipment come to market that has to find other projects or is going to be off-loaded in the used-equipment markets,” explains Raffi Aharonian, managing director at Rouse. “The exposure is rather low.” n enr.com March 30/April 6, 2015 ENR 4 1Q COST REPORT PAVING By Aileen Cho and Jeffrey Rubenstone Asphalt Prices Drop; Concrete Looks for Long-Term Role While asphalt will continue to dominate paving, concrete advocates point to life-cycle costs Scott Sounart, technical practice leader in pavement engineering for Kleinfelder, says cash-strapped municipalities are trying to avoid large-scale reconstruction in favor of maintenance when it comes to facilities such as parking lots. Moreover, he adds, “state transportation departments are forced to have to wait” on major reconstruction projects, also due to funding uncertainties. “The fear is that roads are being allowed to deteriorate, and that may cause problems in the years to come,” he says. Down the road, higher demand for asphalt might then drive prices up. Still, asphalt’s “first cost” remains lower than concrete’s, and, “for the clients we work with, it’s more prevalent. I think it will stay that way, regardless of oil prices,” Sounart says. There is a recent example, however, of a state bucking the tradition. The Nevada Dept. of Transportation awarded an $83-million concrete contract last month to Fisher Sand and Gravel, although the contract was $3 million more than the low asphalt bid by Las Vegas Paving Corp. The state applied a life-cycle equivalency factor and anticipated that maintenance of asphalt paving would be three times the cost over 35 years, says Darin Tedford, NDOT assistant chief materials engineer. For maintenance of existing roads, the traditional asphalt prevalence is a “detriment to the tax-paying public,” says Leif Wathne, executive vice president of the American Concrete Pavement Association. States that have an asphalt paving monopoly pay higher prices per ton but don’t leverage the competitiveness of a free-market dynamic. The focus on so-called Band-Aid maintenance could include greater attention to concrete overlays, which have increased from nearly zero 10 years ago to about 15% for all repaving projects nationwide, Wathne adds. If DOTs encouraged healthy competition between concrete and asphalt overlays, “we could get something like 17% additional lane-miles with the same investment,” he says. n PRODUCER PRICE INDEX CEMENT ASPHALT 8 7 +6.8 6 +6.0 5 4 +4.3 3 2 +1.9 1 +0.4 0 -1 -2 -3 -4 -5 2010 2011 2012 2013 2014 5 FORECAST +4.7 +4.9 4 FORECAST +3.5 3 2 PERCENTAGE PERCENTAGE B oth asphalt and concrete advocates expect increases in paving activity overall, and both note that asphalt prices haven’t gone down in conjunction with oil prices as quickly as in the past. While asphalt will continue its paving prevalence, proponents of concrete contend that life-cycle costs and tight budgets may contribute to an increasing competitiveness with asphalt. “Oil prices have been going down, and liquid-asphalt prices have finally gone downward,” says Jay Hansen, executive vice president at the National Asphalt Pavement Association. “Demand for asphalt paving is expected to continue to go up 5% in 2015 on the strength of private commercial [and] residential markets, mainly, and in states that approved user-fee increases for their programs.” Ed Sullivan, chief economist for the Portland Cement Association, concurs that the effect of low oil prices is filtering into asphalt prices, but adds that it is “nowhere near the degree that people might have expected.” The ratio between oil and asphalt prices is “tighter” when oil prices rise and less than when they fall, he notes. While Sullivan expects asphalt prices will continue to ease, he says that, over the long term, “you’d expect the world economy to keep increasing its demands on oil. If there is tremendous paving activity, then asphalt prices won’t decline.” But Hansen says, “When the price of oil was a $100 a barrel, we were competitive. The price of oil is now around $50, and we’re going to be even more competitive, and that’s the bottom line.” Hansen says the shift by many companies from recycled fuel oil to natural gas has created an energy-related cost savings per ton of asphalt paving. -1.2 1 +1.7 +0.9 0 -1 -2 -3 -3.5 -4 -4.1 2015 2016 -5 -5.6 -6 2010 2011 2012 2013 2014 2015 2016 SOURCE: IHS GLOBAL INSIGHT enr.com March 30/April 6, 2015 ENR 5 1Q COST REPORT MARKETS By Jeff Rubenstone with ENR Staff Firms Feeling the Drop in Oil Drilling work slows in key regions, downstream projects continue, and contractors readjust PHOTO COURTESY OF FLUOR T he fallout from a decline in oil prices has driven a recent decline in upstream oil-and-gas work for engineers and contractors. Still, big industrial projects continue downstream, and some contractors in some regions are hoping to take advantage of a glut of skilled labor. Work along the Gulf Coast has already seen adjustments to lower oil prices, with large oil and gas projects shelved as their economics evaporated. Sasol Ltd. delayed a decision to invest in a $14-billion project next to an ethane cracker under construction in Lake Charles, La. (ENR 3/23/15 p.11), and other projects on the drawing board also are being put on hold. “Anything tied directly to crude oil or direct derivatives, these projects have been pushed to the right and/or cancelled,” says Robert Connors, engineering and construction analyst with Stifel Equity Research. “Anything upstream-related or oil-related is seeing capex cut, and anything LNG-related is being deferred and/or cancelled. The reason for including liquified natural gas is that, while natural gas may be attractively priced in the U.S., they’re selling it to Asia, where it is pegged to oil prices.” On the industrial side, projects using oil derivatives haven’t felt the worst of the drop in prices, and cheaper feedstock may actually bolster some projects. “You’re not going to see any cancellations with the five big ethelyne-based crackers underway,” says Connors. “But there’s going to be less of a rush to build the next few.” Major downstream Gulf Coast projects that continue may see unexpected benefits from a slowdown in oil-and-gas exploration. “You’re going to see craft labor rates in the Gulf Coast start to relax and start to help on project economics. A lot of guys from the oil patch are going to be out looking for work,” says Connors. STILL ON A drop in oil prices has slowed production, but work on Dow’s Freeport ethylene cracker rolls on. “There is a shock value that happens,” he says. “When oil gets cut in half, the first reaction from clients is, ‘Let’s wait to see volatility out.’ There is definitely a heightened caution across the industry.” Far upstream, in the oil and gas fields of Colorado, the drop in prices has slowed work for oil-service engineering firms. The number of oil rigs operating along the Front Range of the Rockies has dropped by a third, to 44, in the past five months, according to Baker Hughes, an oil services company. The nine major drillers in the area have cut spending by nearly 30%. But Colorado is a hot market that is only starting to cool. It’s likely the slowdown hasn’t been felt in the state yet because there was already so much work out there, says Scott Merritt, director of communications for the Rocky Mountains Chapter of the Associated Builders and Contractors. “Most of the contracting firms that do oil-and-gas work also have a pretty diverse client base,” he notes. Glenwood Springs, Colo.-based H-P Geotech says the slowdown has actually helped the geotechnical services firm by making more engineering talent available to hire. “A young engineer in California had turned down our job offer, then came back recently after he was laid off from his oil-and-gas job and said he was available. That helps with our labor shortage issues,” says Steve Pawlak, firm president. Across the country, in the shale plays of Pennsylvania, oil-and-gas engineering firms that saw tremendous growth in recent years are starting to feel the pullback. “In this environment, with the clients facing those contractions, they are looking for concessions from their suppliers,” says Jim Rodgers communications director for Enola, Pa.-based Dawood Engineering, which does most of its work in midstream and pipelines. “Trying to keep people busy while maintaining profitable work, that’s a double whammy. The pie is getting smaller. So, firms are asked to work for a lower price.” Rodgers expects his firm will feel the price drop eventually. “The easiest thing to slow down is new exploration … and that’s where we do see the budgets are [being] cut,” he says. “But there is still so much volume of work, between what’s new and what’s been re-permitted. There’s still plenty of work to be done.” n enr.com March 30/April 6, 2015 ENR 6 1Q COST REPORT CONFIDENCE SURVEY By Gary J. Tulacz Industry Executives Predict Market Growth Through 2016 Petroleum sector takes a tumble, but most believe the markets will remain healthy T he construction market has enjoyed steady growth for several years. Most industry executives believe this growth will continue through 2016. But one sector that has been leading the recovery, petroleum, has suddenly hit a roadblock as plummeting oil prices have resulted in project postponements. The ENR Construction Industry Confidence Index for the first quarter shows that, of the 305 executives of large construction and design firms responding to the survey, a majority believe the market is growing. The CICI index moved up a point, to a record 78 on a scale of 100, in the first-quarter survey, an indicator of a growth market. The CICI measures executive sentiment about the current market and reflects the respondents’ views on where it will be in the next three to six months and over a 12- to 18-month period. The index is based on responses to surveys sent out to more than 6,000 U.S. firms on ENR’s lists of leading contractors, struction Financial Management subcontractors and design Association, Princeton, N.J., INDUSTRY firms. The latest results shows growing optimism CONFIDENCE INDEX are calibrated from a about 2015. CFMA survey conducted from polls 200 CFOs from Feb. 19 to March 16. general contractors, Surveyed industry subcontractors and executives believe civil contractors. most market sectors While a Confindex measured by the CICI rating of 100 indicates a INCREASES are now in growth mode. stable market, higher ONE POINT The index has risen steadily, ratings show growth is as few firms now believe the expected. “Our Confindex rose market is in decline. by five points, to 137 [on a scale of 200], Survey respondents generally believe for the first quarter,” says Stuart Binstock, the overall market will continue to pick CEO of CFMA. up steam over the next 18 months. For example, 60% say the current market is CFMA Sees Near-Term Growth growing, up from 55% in the last quarter, Binstock notes that the “financial condiand 67% believe the market will be in tions” component of the CFMA survey growth mode in three to six months, up rose sharply in the fourth quarter, up 11 from 61% in the fourth quarter. points to 127. Further, the “current The soon-to-be-released results of the confidence” component was up 10 points, latest Confindex survey from the Con- to 139. “This indicates that our CFOs are 78 PROSPECTS BY INDIVIDUAL SECTORS BY FIRMS WORKING IN THOSE MARKETS CURRENTLY (%) COMMERCIAL OFFICES DISTRIBUTION, WAREHOUSE EDUCATION K-12 ENTERTAINMENT, THEME PARKS, CULTURAL HOSPITALS, HEALTH CARE HIGHER EDUCATION HOTELS, HOSPITALITY MULTI-UNIT RESIDENTIAL RETAIL INDUSTRIAL, MANUFACTURING TRANSPORTATION WATER, SEWER AND WASTE POWER PETROLEUM, PETROCHEMICAL ENVIRONMENTAL, HAZARDOUS WASTE 3-6 MONTHS (%) 12-18 MONTHS (%) NUMBER OF FIRMS DECLINING ACTIVITY STABLE ACTIVITY IMPROVING ACTIVITY DECLINING ACTIVITY STABLE ACTIVITY IMPROVING ACTIVITY DECLINING ACTIVITY STABLE ACTIVITY IMPROVING ACTIVITY 191 116 140 74 167 169 122 116 138 148 95 86 65 49 32 6 9 13 9 5 14 3 3 8 8 11 10 9 33 9 46 46 44 65 42 47 46 38 50 47 52 45 35 45 59 48 46 43 26 53 40 51 59 42 45 38 44 55 22 31 7 8 12 7 4 11 3 7 7 7 9 7 8 35 6 46 42 41 61 37 45 49 37 51 48 40 44 37 29 53 47 50 46 32 59 44 48 56 43 45 51 49 55 37 41 8 9 11 12 4 11 11 19 8 8 7 7 8 16 9 51 50 45 51 42 47 56 43 55 47 39 45 40 35 50 40 41 44 36 54 42 34 38 37 45 54 48 52 49 41 ENR FIGURES MAY NOT ADD UP TO 100% DUE TO ROUNDING enr.com March 30/April 6, 2015 ENR 7 U.S. ECONOMY’S CICI is seven points below the overall construction market’s rating, showing exec’s are concerned about the economy. 71 1Q COST REPORT CONFIDENCE SURVEY Quarterly Cost Report Confidence Index 95 ’12 ’13 60 56 ’15 ’14 75 64 50 69 67 69 72 76 77 77 78 How Different Types of Firms View the Overall Market Stable Improving 50 Declining Designers 45 30 15 4% 5% 29% 29% 5% 18% 45% 46% 00 Q2 Q3 Q4 Q1 Q2 Q3 Q4 Q1 Q2 Q3 Q4 Q1 67% SOURCE: DODGE DATA & ANALYTICS ENR very optimistic about the near-term market,” Binstock says. However, he noted that the “overall business conditions” component was down four points, to 148, and the “year-ahead outlook” component also was down, to 133 from 135. “Our four components are somewhat time-based,” notes Anirban Basu, CEO of economic consultant Sage Policy Group Inc., Baltimore, and CFMA economic adviser. The two components that look at the near-term markets are very strong, he says. Oil-Patch Blues For the CICI survey, execs were asked to assess current and future market prospects in general and in any of 15 market sectors in which they currently work. The big story is the sudden drop in the prospects for the petroleum market. Petroleum has been the top or secondranked market sector in the CICI survey for two years. However, in the first quarter, the petroleum-market CICI rating fell 24 points, to 51—marking an essentially a flat market. Many executives are beginning to see projects put on hold, largely thanks to plummeting oil prices. As part of the CICI survey, ENR asked participants whether the drop in oil prices has had an impact on their markets. Of survey respondents, 30.2% said oil price declines have had a negative impact on their markets. Further, 77% of firms working in the petroleum sector agreed that their markets have declined. Among the other individual market sectors, the industrial process and manu- facturing market, which was the topregarded market in the last quarter, fell seven points, to a 69 CICI rating. The distribution and warehouse market fell five points, to a 69 rating. Macroeconomics may be playing a role in these declines. “We have seen lowerthan-expected numbers in several economic indicators, such as retail sales and housing starts, which is worrisome in the long term,” says Basu. The growing strength of the U.S. dollar against other currencies also is a concern. “This could have a negative impact on construction in industries that rely heavily on exports,” Basu says. Overseas companies have been building U.S. plants to take advantage of cheap energy prices and a skilled and stable workforce. “These companies are now finding the price of investing in the U.S. rising sharply and may reconsider locating here, and some domestic companies may even locate new production facilities offshore,” says Basu. While there are reasons to be wary about the market’s long-term prospects, the next year or so still looks bright. This quarter, 38.1% of CICI survey respondents said client’s access to funds for project financing was either “somewhat easier” or “much easier” over the past six months, down only slightly from last quarter, when that figure was 39.5%. Industry executives are confident the market will remain strong over the next year to 18 months. “Even with the drop in oil prices and its impact on that sector, for the overall market, it’s full speed ahead,” Binstock concludes. n Present 66% 3-6 Months 50% 12-18 Months 36% 3 Years General Contractors, Construction Managers, Engineer-Constructors 5% 5% 1% 33% 28% 48% 14% 52% 62% Present 68% 3-6 Months 51% 34% 12-18 Months 3 Years 12% Subcontractors 4% 3% 4% 44% 32% 35% 52% Present 52% 65% 61% 36% 3-6 Months 12-18 Months 3 Years 4% 4% 3% 14% 35% 29% All Firms 43% 60% 67% 54% Present 3-6 Months 12-18 Months 50% 36% 3 Years SOURCE: DODGE DATA & ANALYTICS/ENR. FIGURES MAY NOT ADD UP TO 100% DUE TO ROUNDING. enr.com March 30/April 6, 2015 ENR 8 1Q COST REPORT EXECUTIVE COMPENSATION By Bruce Buckley Executive Salary Increases Stall, While Bonuses Improve D espite improved revenues for many contractors in 2014, top executives saw mixed results in their compensation packages. Average salary increases for executives remained flat at 3.8% in 2014 compared to the previous year, according to the 2015 Executive Compensation Survey For Contractors, published by Personal Administration Services, Saline, Mich. Following the historically low increases of around 3% between 2010 and 2012, salaries seemed to be on the rebound in 2013. However, salary increases didn’t make gains last year and remain below historic norms. Prior to 2009, since PAS began its survey in 1984, executive raises had never increased at less than 4% annually. Jeff Robinson, president of PAS, says that, although companies are forecasting a modest 3.5% increase in salaries this year, he expects actual increases to equal 2014 levels or improve slightly. Bonuses are making modest gains, according to PAS. Robinson says the number of contractors paying bonuses remains below prerecession levels, “although the dip now seems to have leveled off.” In 2008, 83% of firms gave bonuses; by comparison, around 70% of firms gave bonuses last year. Still, with many firms seeing improved revenues, executives are reaping the rewards. “The bright spot is that bonus amounts for most executives increased over the previous year,” he says. According to PAS data, those executives who received bonuses are seeing both higher dollar amounts and receiving bonuses that represent a higher percentage of total compensation. The percentage of executives receiving bonuses and the dollar amount of those bonuses vary greatly, depending on the executive position. For example, 69% of CONTRACTOR EXECUTIVE PAY MEDIAN BASE COMPENSATION ($) MEDIAN BONUS ($) PRESIDENT $217,300 $112,576 CHAIRMAN $330,000 $267,500 EXECUTIVE VP $218,500 $116,750 SENIOR V.P. $196,685 $80,575 VP, OPERATIONS $151,330 $60,750 VP, ESTIMATING $140,602 $44,570 VP, BUS. DEVELOPMENT $138,900 $33,086 VP, PRECONSTRUCTION $145,551 $52,750 VP, ADMINISTRATION $164,350 $41,750 VP, CFO $152,900 $50,000 VP, HUMAN RESOURCES $143,850 $32,500 GENERAL COUNSEL $224,500 $80,500 OPERATIONS MANAGER $120,076 $18,341 IT-MIS DIRECTOR $112,046 $17,000 DIVISIONAL MANAGER $130,000 $35,000 GEN. SUPERINTENDENT $113,625 $24,000 CONTROLLER $109,726 $18,000 TITLE SOURCE: PAS INC. 2015 EXECUTIVE COMPENSATION SURVEY board chairman received bonuses, and, among those who received bonuses, the median amount represented 44% of total compensation, according to the latest PAS survey. By comparison, 83% of vice presidents of human resources received bonuses last year, but the median bonus amount received represented only 18% of total compensation. Generally, executives working for construction management firms, designbuild firms and developers earned the highest total compensation packages, according to the survey. Dan Pauletich, senior managing director of Specialty Consultants, Pittsburgh, agrees that firms offer modest increases in base salaries at the executive level, focusing instead on bonuses. “Bonuses are starting to come back into play as a significant part of compensation as companies set their [financial] goals,” he says. “More companies are establishing bonuses to achieve those objectives.” Although Pauletich sees “intense competition for talent,” it is mostly at the staff level, rather than the executive level. Tom Helbling, president of Helbling & Associates, Pittsburgh, says that, since the recession, he has seen companies develop more defined bonus programs, especially among midsize firms. “Historically, the industry has been more discretionary,” he says. “The industry is taking the opportunity to have more definition in both short-term and long-term programs. They are trying to give employees more comfort.” Helbling sees multi-family residential, hospitality and other dense urban development as the biggest drivers for executive searches. Although major metropolitan markets, such as New York City, Washington, D.C., and Los Angeles, are the biggest draw, there is widespread activity in most metro markets. While residential is still hot, Helbling says he has seen significant contraction in the oil-and-gas market, as prices have fallen and projects have stalled. Helbling notes that companies are typically looking for talent with experience in specific regional and metro markets, rather than bringing in executives from other parts of the country to work in a different geographic market. While the largest firms may be looking for executive leaders with experience in specific sectors, Pauletich says midsize and smaller firms are looking for executives with a broader résumé. “The smaller companies have really been asking for executives that are experts in multiple disciplines,” he says. “They need to be experienced in business development; they need to be a strategist, an estimator, and someone who can stay on top of operations.” n enr.com March 30/April 6, 2015 ENR 9 1Q COST REPORT INTERNET By Scott Lewis Finding Data On ENR.com T he three index tables on this page each represent various components of ENR’s two primary indexes. The Materials Price Index is the materials component of both cost indexes. The Common-Labor Index is the labor component of ENR’s Construction Cost Index, and the Skilled-Labor Index is the labor component of ENR’s Building Cost Index. ENR publishes cost-index history tables in its First Quarterly Cost Report. However, ENR’s website, ENR.com, will keep you current with historical data and monthly updates. Historical tables for all five of ENR’s cost indexes are posted at ENR.construction.com/economics/histor ical_indices. Also, going back to January 2008, all of ENR’s building-materials price tables—comprising items such as asphalt, portland cement, ready-mix concrete, plastic and concrete pipe, copper water tubing, lumber, drywall, structural steel and reinforcing bar—are posted in the archive section at ENR.com. To find these materials price tables, go to the homepage of ENR.com and, on the right-hand side of the screen, click on the link marked “Archive.” Next, scroll down to the issue containing the table you need and click on the “View this entire issue” link, which will bring you to that issue’s table-of-contents page. Then, under the “Departments” or the “More from magazine” heading, click on the “Construction Economics” link. The most comprehensive data on construction labor costs appear in ENR’s annual Third Quarterly Cost Report, which contains hourly union wage rates for 22 different construction trades in 34 cities and open-shop wage rates for eight trades in various regions. The current tables can be found in ENR’s most recent Third Quarterly Cost Report (10/06/14 p. 27). n ENR’S MATERIALS PRICE INDEX (1994-2015) 1913=100 1994 1995 1996 1997 1998 1999 2000 2001 2002 2003 2004 2005 2006 2007 2008 2009 2010 2011 2012 2013 2014 2015 JAN. FEB. MARCH APRIL MAY JUNE JULY AUG. SEPT. OCT. NOV. DEC. 2036 2031 1973 2206 2185 2173 2197 2122 2045 1987 2008 2402 2584 2584 2578 2747 2628 2723 2866 2913 2963 3073 2093 2024 1977 2207 2186 2161 2224 2108 2045 1981 2056 2399 2584 2583 2577 2721 2624 2786 2862 2935 2956 3056 2109 2009 1985 2189 2177 2151 2228 2116 2062 1961 2139 2417 2572 2546 2600 2723 2623 2789 2882 2940 2959 3052 2120 1999 2000 2254 2189 2158 2225 2104 2039 1960 2219 2483 2578 2551 2606 2714 2632 2813 2890 2953 2969 –– 2113 1989 2013 2262 2187 2156 2241 2105 2063 1970 2295 2489 2570 2578 2633 2697 2672 2825 2917 2976 2972 –– 2083 1987 2028 2293 2178 2157 2219 2120 2070 1961 2345 2492 2585 2572 2698 2680 2713 2828 2920 2988 2979 –– 2064 1996 2039 2269 2169 2184 2198 2189 2070 1954 2361 2486 2607 2601 2815 2661 2720 2843 2926 2978 2985 –– 2055 1993 2062 2238 2172 2208 2191 2152 2049 1976 2376 2466 2610 2599 2823 2647 2709 2856 2906 2967 2995 –– 2048 1965 2094 2225 2192 2230 2177 2097 2044 1974 2431 2460 2608 2597 2904 2634 2707 2858 2890 2977 3006 –– 2039 1968 2139 2207 2177 2228 2163 2097 2029 2003 2452 2494 2608 2590 2891 2628 2719 2863 2901 2974 3031 –– 2029 1979 2168 2166 2174 2211 2151 2088 2016 2031 2448 2548 2637 2581 2857 2620 2728 2865 2901 2966 3073 –– 2029 1974 2072 2195 2165 2192 2127 2056 1992 2011 2420 2575 2596 2577 2775 2620 2731 2863 2889 2969 3064 –– ENR’S COMMON-LABOR PRICE INDEX (2001-2015) 1913=100 2001 2002 2003 2004 2005 2006 2007 2008 2009 2010 2011 2012 2013 2014 2015 JAN. FEB. MARCH APRIL MAY JUNE JULY AUG. SEPT. OCT. NOV. DEC. 13066 13669 14075 14684 15284 15943 16521 17084 18016 18502 19079 19472 20082 20598 21229 13066 13669 14241 14702 15290 16018 16521 17097 18016 18538 19134 19537 20087 20653 21229 13073 13745 14241 14816 15290 16045 16521 17097 18016 18538 19162 19686 20087 20704 21264 13109 13727 14264 14845 15306 16045 16534 17097 18016 18538 19166 19686 20139 20813 –– 13113 13772 14264 14845 15408 16045 16694 17128 18162 18698 19166 19686 20186 20930 –– 13168 13812 14417 14884 15447 16045 16694 17137 18201 18744 19209 19686 20236 20930 –– 13282 14003 14432 14900 15474 16065 16702 17231 18201 18836 19256 19762 20278 21010 –– 13300 14003 14493 15038 15658 16065 16831 17399 18217 18837 19256 19866 20278 21022 –– 13397 14003 14518 15239 15829 16173 16946 17779 18296 18836 19326 19866 20278 21070 –– 13411 14003 14551 15247 15831 16489 16946 17976 18335 19039 19400 19940 20644 21070 –– 13461 14021 14566 15247 15921 16515 17084 17976 18335 19103 19466 20000 20598 21070 –– 13461 14021 14566 15284 15921 16521 17084 17976 18467 19103 19466 20056 20598 21149 –– ENR’S SKILLED-LABOR PRICE INDEX (2001-2015) 1913=100 2001 2002 2003 2004 2005 2006 2007 2008 2009 2010 2011 2012 2013 2014 2015 JAN. FEB. MARCH APRIL MAY JUNE JULY AUG. SEPT. OCT. NOV. DEC. 5874 6097 6366 6644 6912 7201 7459 7796 8112 8356 8644 8809 9010 9188 9465 5874 6097 6393 6660 6926 7207 7459 7796 8112 8391 8644 8820 9028 9192 9468 5874 6109 6411 6672 6926 7209 7464 7796 8112 8391 8644 8848 9028 9225 9474 5892 6109 6421 6672 6926 7213 7466 7796 8112 8391 8652 8848 9028 9265 –– 5906 6148 6426 6672 6972 7213 7579 7818 8171 8437 8652 8848 9029 9294 –– 5948 6166 6487 6698 6981 7213 7579 7818 8191 8449 8711 8851 9047 9295 –– 5978 6242 6515 6717 6997 7218 7591 7846 8200 8494 8725 8879 9051 9306 –– 5984 6264 6553 6728 7065 7225 7651 7861 8240 8499 8748 8963 9058 9309 –– 6052 6291 6569 6838 7157 7266 7701 7975 8251 8517 8763 8966 9062 9341 –– 6065 6306 6596 6874 7164 7416 7718 8103 8255 8593 8773 8973 9129 9387 –– 6065 6333 6604 6878 7199 7450 7793 8105 8255 8634 8793 8997 9164 9387 –– 6067 6338 6616 6912 7199 7459 7796 8107 8356 8634 8800 9010 9183 9434 –– enr.com March 30/April 6, 2015 ENR 10 1Q COST REPORT METHODOLOGY By Tim Grogan Inflation Picking Up Steam Increases in lumber, steel and cement prices are driving ENR’s cost indexes A lthough ENR’s indexes measure the costs of non-residential buildings, the recovery in the housing market is having a major impact on index movement. After a long decline, ENR’s 20-city average price for 2x4 lumber is up 5.7% this year, following just a 1% increase during the previous year. During the same period, ENR’s prices for structural steel has increased 2% over a year ago, while cement prices in the cost indexes rose 4.8%. This rebound in prices pushed ENR’s materials cost component in March up 3.1% for the year, compared to just a 0.6% increase the previous year. As a result, the Building Cost Index is up 2.9% for the year, after increasing 1.7% last year. The Construction Cost Index (CCI) is up 2.8%, following a 2.6% annual increase in 2014. The mechanics of what drives ENR’s indexes are explained below. ENR began systematically reporting materials prices and wages in 1909, but it did not establish the CCI until 1921. The index was designed as a general-purpose tool to chart basic cost trends. Today, it remains as a weighted aggregate index of the prices of a constant quantity of structural steel, portland cement, lumber and common labor. This package of goods was valued at $100, using 1913 prices. The original use of common labor in the CCI was intended to reflect wage-rate activity for all construction workers. In the 1930s, however, wage and fringebenefit rates climbed much faster in percentage terms for common laborers than for skilled tradesmen. In response to this trend, ENR introduced, in 1938, its Building Cost Index (BCI) to weigh the impact of skilled-labor trades on costs. The BCI labor component is the average union wage rate, plus fringes, for carpenters, bricklayers and ironworkers. The materials component is the same as Construction Cost Index 81% 13% 5% 1% Common Labor Steel Lumber Cement Building Cost Index 66% 23% 9% 2% Skilled Labor Steel Lumber Cement SOURCE: ENR CONSTRUCTION ECONOMICS DEPT. the CCI’s. The BCI also represents a hypothetical package of these construction items, valued at $100 in 1913. Both indexes are designed to indicate the basic underlying trends of construction costs in the U.S. Therefore, components are based on construction materials that are influenced less by local conditions; ENR chose steel, lumber and cement because they have a stable relationship to the U.S. economy and play a predominant role in construction. As a practical matter, ENR selected these materials because reliable price quotations are available for all three, ensuring the index can be computed on a timely basis. While there may be some weaknesses in any index based on a limited number of components, ENR thinks a larger number of elements would increase the time lag between verifying prices and releasing the index. Also, an index with fewer components is more sensitive to price changes than one comprising many. On the downside, the use of only a few cost components makes indexes for individual cities more vulnerable to source changes. These aberrations tend to average out for the 20-city indexes. Since the indexes are computed with real prices, the proportion a given component has in the index will vary with its relative escalation rate. In the late 1970s, labor’s share of the index dropped because materials prices were in the grip of hyperinflation. For example, in 1979, lumber prices increased 16%, cement prices increased 13%, and steel prices jumped 11%, but common and skilled labor rose 8%. These events resulted in materials gaining a larger percentage of the index. In the original CCI, the components were weighted at 38% for labor, 38% for steel, 17% for lumber and 7% for portland cement. The shifting tide of inflation changed the weight of the CCI components to 81% for labor, 13% for steel, 5% for lumber and 1% for cement. This shift was less dramatic for the BCI, which now registers 66% for labor, 23% for steel, 9% for lumber and 2% for cement. Neither index is adjusted for productivity, managerial efficiency, contractor overhead or profits. However, the indexes can get a fix on these factors. As a rule, when productivity is low, the selling price will be relatively higher than the ENR index. When competition is sharp, the selling price of finished construction generally will fall below ENR’s indexes. n enr.com March 30/April 6, 2015 ENR 11 1Q COST REPORT INDEXES By Tim Grogan How To Use ENR’s Indexes Explaining the difference between the construction and building cost indexes R eaders of ENR generate a steady stream of questions about the magazine’s indexes and how to apply them accurately to construction projects. To help clarify the nature and use of the cost indexes, here are answers to the most frequently asked questions as well as suggestions on how to avoid costly mistakes when using the indexes. What is the difference between ENR’s Construction Cost Index and its Building Cost Index? n The difference is in their respective labor components. The CCI uses 200 hours of common labor, multiplied by the 20-city average rate for wages and fringe benefits. The BCI derives its calculation from a baseline of 68.38 hours of skilled labor, multiplied by the 20-city wage-fringe average for three trades: brick-layers, carpenters and structural ironworkers. For their materials components, both indexes use 25 cwt of standard fabricated structural steel at the 20-city average price, 1.128 tons of bulk portland cement priced locally and 1,088 board-ft of 2x4 lumber, which is also priced locally. The ENR indexes measure how much it costs to purchase this hypothetical package of goods compared to the price in the base year. What kinds of construction are represented in the ENR indexes? n The two indexes apply to general construction costs. The CCI can be used when labor costs are a high proportion of total costs. The BCI is more applicable for structures. n Where does ENR get its data? ENR has price reporters who check prices locally in 20 U.S. cities. The prices are quoted from the same suppliers each month. ENR computes its latest indexes from these figures as well as local union wage rates. Does ENR have cost indexes for cities outside of the U.S.? n ENR publishes indexes for two Canadian cities, Montreal and Toronto, each quarter in the cost reports. ENR’s Fourth Quarterly Cost Report includes a comprehensive listing of international costs. n Are materials prices averaged? No. ENR reporters collect spot prices from a single source for all the materials tracked, including those in the index. The reporters survey the same suppliers each month for materials that affect the index. Actual prices within a city may vary, depending on the competitiveness of the market and local discounting practices. This method allows for a quick indicator of price movement, which is the primary objective of both indexes. Do the indexes measure cost differentials between cities? n No. This is a common error in the application of ENR’s indexes, which measure a trend only in an individual city and in the U.S. as a whole. Differentials between cities may reflect differences in labor productivity and building codes. Moreover, price quotations for lumber and cement vary from one city to another. BUILDING COST INDEX HISTORY (1928-2015) HOW ENR BUILDS THE INDEX: 68.38 hours of skilled labor at the 20-city average wage of bricklayers, carpenters and structural ironworkers, plus 25 cwt of standard structural-steel shapes at the mill price prior to 1996 and the fabricated 20-city price from 1996, plus 1.128 tons of portland cement at the 20-city price, plus 1,088 board-ft of 2x4 lumber at the 20-city price. ANNUAL AVERAGE, 1993=100 1928: 188 1929: 191 1930: 185 1931: 168 1932: 131 1933: 148 1934: 167 1935: 166 1936: 172 1937: 196 1938: 197 1939: 197 1940: 203 1941: 211 1942: 222 1943: 229 1944: 235 1945: 239 1946: 262 1947: 313 1948: 341 1949: 352 1950: 375 1951: 401 1952: 416 1953: 431 1954: 446 1955: 469 1956: 491 1957: 509 1958: 525 1959: 548 1960: 559 1961: 568 1962: 580 1963: 594 1964: 612 1965: 627 1966: 650 1967: 676 1968: 721 1969: 790 1970: 836 1971: 948 1972: 1048 1973: 1138 1974: 1975: 1976: 1977: 1978: 1979: 1980: 1981: 1982: 1983: 1984: 1985: 1986: 1987: 1988: 1989: 1990: 1991: 1992: 1993: 1994: 1995: 1996: 1205 1306 1425 1545 1674 1819 1941 2097 2234 2384 2417 2425 2483 2541 2598 2634 2702 2751 2834 2996 3111 3112 3203 1997 1998 1999 2000 2001 2002 2003 2004 2005 2006 2007 2008 2009 2010 2011 2012 2013 2014 2015 ANNUAL AVERAGE JAN. FEB. MARCH APRIL MAY JUNE JULY AUG. SEPT. OCT. NOV. DEC. 3332 3363 3425 3503 3545 3581 3648 3767 4112 4335 4432 4557 4782 4800 4969 5120 5226 5324 5497 3333 3372 3417 3523 3536 3581 3655 3802 4116 4337 4432 4556 4765 4812 5007 5122 5246 5321 5488 3323 3368 3411 3536 3541 3597 3649 3859 4127 4330 4411 4571 4767 4811 5010 5144 5249 5336 5487 3364 3375 3421 3534 3541 3583 3652 3908 4168 4335 4416 4574 4761 4817 5028 5150 5257 2357 –– 3377 3374 3422 3558 3547 3612 3660 3955 4189 4331 4475 4599 4773 4858 5035 5167 5272 5370 –– 3396 3379 3433 3553 3572 3624 3677 3996 4195 4340 4471 4640 4771 4888 5059 5170 5286 5375 –– 3392 3382 3460 3545 3625 3652 3684 4013 4197 4356 4493 4723 4762 4910 5074 5184 5281 5383 –– 3385 3391 3474 3546 3605 3648 3712 4027 4210 4360 4515 4733 4768 4905 5091 5204 5277 5390 –– 3378 3414 3504 3539 3597 3655 3717 4103 4242 4375 4533 4827 4764 4910 5098 5195 5285 5409 –– 3372 3423 3505 3547 3602 3651 3745 4129 4265 4431 4535 4867 4762 4947 5104 5204 5308 5442 –– 3350 3424 3498 3541 3596 3654 3766 4128 4312 4462 4558 4847 4757 4968 5113 5213 5317 5468 –– 3370 3419 3497 3548 3577 3640 3758 4123 4329 4441 4556 4797 4795 4970 5115 5210 5326 5480 –– enr.com March 30/April 6, 2015 3364 3391 3456 3539 3574 3623 3694 3984 4205 4369 4486 4691 4769 4883 5059 5174 5278 5387 –– ENR 12 1Q COST REPORT INDEXES One city may report list prices, while another city may include discounts in its reported price for the same material. index has more elements, it has a smoother trend. Indexes for individual cities are more susceptible to price spikes. Are the cost indexes seasonally adjusted? n n No. This is an important point for index users to keep in mind. Wages, the most important component, usually affect the indexes once or twice a year. Cement prices tend to be more active in the spring, while pricing for fabricated structuralsteel tends to have monthly adjustments. Lumber prices, which are more dependent upon local pricing and production conditions, are the most volatile and can change appreciably from month to month. Declines in the indexes are most often the result of falling lumber and steel prices. The study of an index movement for a period of less than 12 months can sometimes miss these important developments. Users of an index for individual cities should watch the timing of wage settlements, too. Stalled labor negotiations may keep the old wage rate in effect longer than a 12-month period, giving the appearance of a low inflation rate. Is it more accurate to use an index that is closest to my home city? n No. The 20-city average index is generally more appropriate. Because that Are annual averages weighted? No. They are straight mathematical averages. n Are the indexes verifiable? Yes. In the “Construction Economics” section, ENR’s national indexes are updated in the first week of each month, while the indexes for individual cities appear in the second issue of each month. Prices for the indexes’ materials components can be found in the preceding month’s Construction Economics pages: Cement prices appear in the first issue, lumber prices in the third issue and steel in the fourth issue. Wage rates for all 20 cities are published in the Third Quarterly Cost Report. Readers can compute ENR’s indexes by multiplying the published prices and wages by the appropriate weights (shown in the tables below) and summing the results. n Does ENR forecast its indexes? Yes. Once a year, ENR projects its BCI and CCI for the next 12 months in the Fourth Quarterly Cost Report. To reach its forecast, ENR incorporates the new wage rates called for in multi-year, collective-bargaining agreements and estimates for the cities in which new contract terms will be negotiated. Further, ENR estimates the materials component by studying consumption forecasts as well as price trends. Does ENR change the weighting of the index components? n No. The components are always multiplied by the same factors. However, a component’s share of an index’s total will shift with its relative escalation rate. Has ENR ever changed the makeup of the index components? n Only once, in 1996. ENR was forced to switch from the mill price for structural steel to the 20-city average fabricated price for channel beams, I-beams and wide flanges when ENR’s two sources for mill prices left the structural market. n Does ENR revise the indexes? On some occasions, ENR must revise the indexes. For example, ENR revised its March 2004 indexes shortly after their initial publication to reflect the huge surcharges being placed on structural steel. Any revisions to the national indexes are published below. Any revisions to indexes for individual cities are published in the cost report at ENR.com. n Is ENR’s cost data on the web? Yes. All ENR’s cost indexes, wage rates, material prices and cost-issue articles can be found at ENR.com. n CONSTRUCTION COST INDEX HISTORY (1928-2015) HOW ENR BUILDS THE INDEX: Two hundred hours of common labor at the 20-city average common-labor wage rates, plus 25 cwt of standard structural-steel shapes at the mill price prior to 1996 and the fabricated 20-city price from 1996, plus 1.128 tons of portland cement at the 20-city price, plus 1,088 board-ft of 2x4 lumber at the 20-city price. ANNUAL AVERAGE, 1993=100 1928: 207 1929: 207 1930: 203 1931: 181 1932: 157 1933: 170 1934: 198 1935: 196 1936: 206 1937: 235 1938: 236 1939: 236 1940: 242 1941: 258 1942: 276 1943: 290 1944: 299 1945: 308 1946: 346 1947: 413 1948: 461 1949: 477 1950: 510 1951: 543 1952: 569 1953: 600 1954: 628 1955: 660 1956: 692 1957: 724 1958: 759 1959: 797 1960: 824 1961: 847 1962: 872 1963: 901 1964: 936 1965: 971 1966: 1019 1967: 1074 1968: 1155 1969: 1269 1970: 1381 1971: 1581 1972: 1753 1973: 1895 1974: 2020 1975: 2212 1976: 2401 1977: 2576 1978: 2776 1979: 3003 1980: 3237 1981: 3535 1982: 3825 1983: 4066 1984: 4148 1985: 4182 1986: 4295 1987: 4406 1988: 4519 1989: 4615 1990: 4732 1991: 4835 1992: 4985 1993: 5210 1994: 5408 1995: 5471 1996: 5620 1997 1998 1999 2000 2001 2002 2003 2004 2005 2006 2007 2008 2009 2010 2011 2012 2013 2014 2015 JAN. FEB. MARCH APRIL MAY JUNE JULY AUG. SEPT. OCT. NOV. DEC. ANNUAL AVERAGE 5765 5852 6000 6130 6281 6462 6581 6825 7297 7660 7880 8090 8549 8660 8938 9176 9437 9664 9972 5769 5874 5992 6160 6272 6462 6640 6861 7298 7689 7880 8094 8533 8672 8998 9198 9453 9681 9962 5759 5875 5986 6202 6279 6502 6627 6957 7309 7692 7856 8109 8534 8671 9011 9268 9456 9702 9972 5799 5883 6008 6201 6286 6480 6635 7017 7355 7695 7865 8112 8528 8677 9027 9273 9484 9750 –– 5837 5881 6006 6233 6288 6512 6642 7064 7398 7691 7942 8141 8574 8761 9035 9290 9516 9796 –– 5860 5895 6039 6238 6318 6532 6694 7109 7415 7700 7939 8185 8578 8805 9053 9291 9542 9800 –– 5863 5921 6076 6225 6404 6605 6696 7126 7422 7721 7959 8293 8566 8844 9080 9324 9552 9835 –– 5854 5929 6091 6233 6389 6592 6733 7188 7479 7723 8007 8362 8564 8837 9088 9351 9545 9846 –– 5851 5963 6128 6224 6391 6589 6741 7298 7540 7763 8050 8557 8586 8836 9116 9341 9552 9870 –– 5848 5986 6134 6259 6397 6579 6771 7314 7563 7883 8045 8623 8596 8921 9147 9376 9689 9886 –– 5838 5995 6127 6266 6410 6578 6794 7312 7630 7911 8092 8602 8592 8951 9173 9398 9666 9912 –– 5858 5991 6127 6283 6390 6563 6782 7308 7647 7888 8089 8551 8641 8952 9172 9412 9668 9936 –– 5826 5920 6059 6221 6334 6538 6695 7115 7446 7751 7967 8310 8570 8799 9070 9308 9547 9806 –– enr.com March 30/April 6, 2015 ENR 13 CONSTRUCTION ECONOMICS ENR’s 20-city average cost indexes, wages and material prices. Historical data and details for ENR’s 20 cities can be found at ENR.com/economics Construction Cost Index ANNUAL INFLATION RATE 2.8 % + MARCH 2015 1913=100 INDEX VALUE CONSTRUCTION COST COMMON LABOR WAGE $/HR. 2.9 Building Cost Index + ANNUAL INFLATION RATE MARCH 2015 1913=100 Materials Cost Index % INDEX VALUE MONTH MONTHLY INFLATION RATE MONTH YEAR YEAR 1913=100 9972.38 +0.1% +2.8% BUILDING COST 5487.34 0.0% +2.9% MATERIALS COST 21264.34 +0.2% +2.7% SKILLED LABOR 9473.84 +0.1% +2.7% CEMENT $/TON 40.34 +0.2% +2.7% WAGE $/HR. 52.58 +0.1% +2.7% STEEL $/CWT The BCI showed no movement this month as a 0.2% decline in materials cost offset a small increase in labor costs. Construction Starts Regional growth trends vs. national trends SOUTH ATLANTIC PACIFIC NEW ENGLAND MIDDLE ATLANTIC -1% EAST NORTH CENTRAL YEAR –0.2% +3.1% 116.27 –0.2% +4.8% 50.31 –0.2% +2.0% 462.34 –0.1% +5.7% NON-RESIDENTIAL RESIDENTIAL TOTAL 25 20 10% 2% 15 11% 4% 10 5 0 -5 EAST SOUTH CENTRAL 8% 7.0% -10 -15 NOV ’13 SOURCE: DODGE DATA & ANALYTICS. YEAR-TO-YEAR PERCENT CHANGE IN VALUE OF TOTAL PROJECTS STARTED NOV. 2014 FOR 12-MONTH ROLLING TOTALS. The dollar value of total construction starts in Georgia is up 13% from a year ago, in line with regional trends for the South Atlantic, where overall starts are up 10%for the year, according to Dodge Data & Analytics. Georgia saw large annual gains of 79% for hotels, 41% for office buildings and 29% for highway construction. MONTH 3051.50 Cement, steel and lumber prices all slipped this month, pulling the MCI down 0.2% NON-BUILDING WEST NORTH CENTRAL -9% MOUNTAIN INDEX VALUE 30 PERCENTAGE -11% % RESIDENTIAL CONSTRUCTION SLOWS 22% WEST SOUTH CENTRAL 0.2 MARCH 2015 LUMBER $/MBF Despite a 0.2% increase in its labor component this month, the annual escalation rate for the CCI fell to 2.8% from 2.9% in February. STARTS ARE UP 10% IN THE SOUTHEAST – GEORGIA CONSTRUCTION STARTS: $/MIL. TOTAL CONSTRUCTION NON-RESIDENTIAL JAN ’14 MAR. MAY JULY SEPT. NOV. SOURCE: DODGE DATA & ANALYTICS. YEAR-TO-YEAR PERCENT CHANGE FOR 12-MONTH ROLLING NATIONAL TOTAL STARTS. FEB APR JUN AUG 2014 NOV. 2014 OCT. 2013 NOV. $16,936.008 $16,829.275 OCT DEC % CHG. MONTH % CHG. YEAR $14,988.928 +0.6 +13.0 $5,916.582 $5,598.241 $5,654.795 +5.6 +4.6 COMMERCIAL & MANUFACTURING 2,456.961 2,349.542 2,422.421 +4.6 +1.4 STORES & SHOPPING CENTERS 479.885 477.262 529.296 +0.6 –9.3 OFFICE & BANK BUILDINGS 424.694 329.209 301.769 +29.0 +40.7 HOTELS & MOTELS 214.122 143.289 119.713 +49.0 +78.9 MANUFACTURING BUILDINGS 652.514 756.513 1,037.156 –13.8 –37.1 3,459.621 3,248.699 3,232.374 +6.5 +7.0 1,385.649 1,475.272 1,700.429 –6.1 –18.5 INSTITUTIONAL EDUCATION BUILDINGS 745.369 446.575 886.437 +66.9 –15.9 RESIDENTIAL 7,590.522 7,639.645 6,770.106 –0.7 +12.1 NONBUILDING 3,428.904 3,591.389 2,564.027 –4.5 +33.7 1,908.620 1,973.106 1,482.123 –3.3 +28.8 534.438 588.327 510.102 –9.2 +4.8 47.263 15.803 169.299 +199.1 –72.1 HEALTHCARE FACILITIES HIGHWAYS & BRIDGES ENVIRONMENTAL PUBLIC WORKS POWER/UTILITIES SOURCE: DODGE DATA & ANALYTICS CONSTRUCTION STARTS. TOTALS MAY NOT ADD UP DUE TO EXCLUSION OF OTHER CATERGORIES. 12-MONTH ROLLING TOTALS FOR GEORGIA. enr.com March 30/April 6, 2015 ENR 14 CONSTRUCTION ECONOMICS PRODUCER PRICE INDEX FABRICATED STEEL Monthly Percent Change 2.0 1.0% 1.5 PERCENTAGE Steel prices are starting to tumble. ENR’s 20city average price for three types of structural steel declined 0.5% this month, following February’s 0.2% drop. Prices are now just 1.2% higher than a year ago. Likewise, ENR’s rebar price fell 0.9% in March and is only 1.6% above 2014’s level. Spot market prices tracked by Platts Metal Week also are showing weakness. Platts’ rebar price fell 3.7% in February, following a 2.4% decline the previous month. Platts’ steel-plate price dropped 8.3%, while its price for hotrolled steel coil fell 9.0%. Both the plate and coil price cuts followed declines during the previous month. 1.0 0.5 0.0 A F‘13 J A A J O D F ’15 SOURCE: BUREAU OF LABOR STATISTICS A O D ENR’s Materials Prices For March 2015 ALUMINUM SHEET REINFORCING BAR 1.1 0.9 % – % – PRICES DROPPED 0.5%, WIPING OUT MOST OF LAST MONTH’S PRICE INCREASE. ALUMINUM SHEET 155 PRICES FELL 0.9% IN MARCH, AFTER HOLDING STEADY FOR THREE MONTHS. REINFORCING BAR 228 2014-2015 2014-2015 20-CITY AVERAGE ITEM UNIT $PRICE %MONTH %YEAR STANDARD STRUCTURAL SHAPES Average CWT 50.04 –0.5 +1.2 Channel beams, 6” Deep, 8.2 LB/LF CWT 49.98 –0.5 +1.0 I-beams, 6” Deep, 12.5 LB/LF CWT 52.43 –0.5 +1.5 Wide-flange, 8” Deep, 31 LB/LF CWT 47.72 –0.6 +1.1 CWT 45.78 –0.9 +1.6 154 226 REINFORCING BARS 153 224 Grade 60, No. 4 152 222 HOT-ROLLED CARBON-STEEL PLATE 151 220 12 guage, 48” x 10’ 150 J 218 J J 1992=100 1992=100 A S O N D J F M J 1992=100 1992=100 STAINLESS-STEEL SHEET A S O N D J F M 0.4 0.6 % % – PRICES DIPPED 0.4% IN MARCH, AFTER INCREASING DURING THE PREVIOUS TWO MONTHS. STAINLESS-STEEL SHEET 123 THIS MONTH’S 0.6% DECLINE IS THE THIRD CONSECUTIVE MONTHLY PRICE CUT. WIDE-FLANGE 216 2014-2015 46.82 –0.8 +1.6 3003H14, 36” x 96” CWT 190.20 –0.5 –1.1 STAINLESS STEEL SHEET WIDE FLANGE – CWT ALUMINUM SHEET 14 gauge CWT 166.52 –0.2 +2.1 16 gauge CWT 169.61 –0.5 +1.6 20 gauge CWT 174.34 –0.4 +2.2 STAINLESS STEEL PLATE 304, ¼”, 72” X 240” CWT 195.34 –0.5 –2.2 316, ¼”, 96” X 140” CWT 250.03 –0.4 +1.8 CWT 33.45 –0.3 –0.3 STEEL PILING (H-PILE) HP10 X 42 2014-2015 SOURCE: DODGE DATA & ANALYTICS/ENR 122 214 121 212 120 210 Reinforcing bar, No. 5 TON 592.37 –3.7 208 Plate TON 691.58 –8.3 –9.0 206 Hot-rolled coil TON 521.18 –9.0 –20.6 119 118 J J 1992=100 1992=100 A S O N D J F M PLATTS* STEEL SPOT MARKET PRICES: FEB. 2015 J J 1992=100 1992=100 A S O N D J F M –7.3 SOURCE: *PLATTS MCGRAW HILL FINANCIAL. REBAR SOUTHERN U.S.; PLATE PRICES U.S. SOUTHEAST AVERAGE; HOT-ROLLED COIL PRICES INDIANA. enr.com March 30/April 6, 2015 ENR 15 CONSTRUCTION ECONOMICS Structural Steel, Rebar, Building Sheet, Piling For March 2015 City prices reflect quotes from single sources and can be volatile. They are not meant to be the prevailing price for a city. Data are a mix of list and transaction prices and may include ENR estimates. Do not compare prices between locations. Use city information to analyze national trends. ITEM UNIT ATLANTA STANDARD STRUCTURAL SHAPES AVERAGE BOSTON CHICAGO DALLAS DENVER DETROIT CWT 52.29 –50.00 CHANNEL BEAMS, 6” DEEP, 8.2 LB/LF CWT 52.95 –50.00 51.02 49.73 55.41 –48.50 51.80 49.57 55.05 –46.50 48.54 +50.46 49.82 43.63 51.15 –48.50 50.32 I-BEAMS, 6” DEEP, 12.5 LB/LF CWT 55.10 –56.00 53.50 51.00 58.37 46.32 –52.00 48.20 +52.89 51.65 WIDE-FLANGE, 8” DEEP, 31 LB/LF CWT 48.82 –44.00 47.75 48.63 42.30 52.80 –47.00 46.26 +50.00 47.48 42.28 REINFORCING BARS GRADE 60, No. 4 HOT-ROLLED CARBON-STEEL PLATE 12 GAUGE, 48” x 10’ CWT +47.56 –42.50 44.50 46.69 48.07 –43.00 48.00 46.33 49.92 –49.00 BUILDING SHEET AND PLATE ALUM. SHEET, 3003H14, 36” x 96” CWT 45.45 –45.00 44.12 50.20 46.33 –52.00 45.40 47.59 47.00 +43.88 CWT 191.59 STAINLESS-STEEL SHEET 14 GAUGE 219.00 180.00 –188.20 205.35 206.00 189.60 195.55 –182.75 –198.20 CWT 16 GAUGE CWT 169.20 –158.00 156.88 +177.33 167.29 150.00 –163.87 179.05 165.39 159.80 172.88 +159.60 157.59 +182.92 171.55 150.00 –162.00 183.27 169.51 20 GAUGE 166.60 CWT 177.45 167.00 169.42 +188.45 175.80 152.00 –167.60 187.56 173.00 169.00 STAINLESS-STEEL PLATE 304, ¼”, 72” x 240” CWT 206.64 165.00 195.07 211.68 –197.53 154.00 175.00 215.00 –218.67 218.58 316, ¼”, 96” x 140” CWT 263.31 330.00 +240.98 261.07 –239.82 376.00 238.00 263.90 –230.96 237.42 STEEL PILING: H-PILE HP10 x 42 CWT 32.30 45.00 –40.15 34.00 31.80 44.00 +29.95 37.25 –30.75 29.58 ITEM UNIT SAN FRANCISCO SEATTLE STANDARD STRUCTURAL SHAPES AVERAGE CWT 60.81 44.00 +46.91 –48.82 54.46 52.88 55.25 44.75 43.42 50.14 CHANNEL BEAMS, 6” DEEP, 8.2 LB/LF CWT 56.90 44.57 +46.88 –48.09 54.59 52.60 50.92 50.10 42.82 49.92 I-BEAMS, 6” DEEP, 12.5 LB/LF CWT 69.05 42.74 47.60 –51.58 56.45 53.97 69.00 42.88 42.74 51.63 WIDE-FLANGE, 8” DEEP, 31 LB/LF CWT 56.48 44.69 +46.25 –46.80 52.33 52.06 45.82 41.28 44.69 48.88 REINFORCING BARS GRADE 60, No. 4 CWT 49.00 32.68 49.00 –44.25 51.30 –49.30 45.85 50.00 32.68 45.95 HOT-ROLLED CARBON-STEEL PLATE 12 GAUGE, 48” x 10’ CWT 56.00 47.92 46.30 +45.38 47.19 –49.82 42.91 42.58 47.08 45.17 BUILDING SHEET AND PLATE ALUM. SHEET, 3003H14, 36” x 96” CWT 180.20 190.00 179.28 193.42 175.20 188.65 190.00 183.10 190.00 –177.98 STAINLESS-STEEL SHEET 14 GAUGE CWT –76.50 179.20 162.88 175.19 –160.55 173.20 158.47 152.50 182.33 162.77 16 GAUGE CWT –175.00 188.76 166.10 179.30 –162.72 177.00 159.12 155.25 183.97 169.10 20 GAUGE CWT –177.87 184.37 168.40 185.00 –170.28 183.84 167.55 165.20 181.64 175.36 STAINLESS-STEEL PLATE 304, ¼”, 72” x 240” CWT 180.10 188.50 250.00 188.90 195.00 190.29 172.20 –197.10 188.80 198.70 316, ¼”, 96” x 140” CWT 243.90 235.53 255.10 233.72 249.56 247.65 204.34 –175.00 236.84 237.55 STEEL PILING: H-PILE HP10 x 42 CWT +28.88 33.16 29.00 31.49 30.02 31.48 0.00 +30.00 33.16 33.65 KANSAS CITY BALTIMORE LOS ANGELES BIRMINGHAM MINNEAPOLIS NEW ORLEANS NEW YORK CINCINNATI PHILADELPHIA CLEVELAND PITTSBURGH ST. LOUIS + OR – DENOTES PRICE HAS RISEN OR FALLEN SINCE PREVIOUS REPORT. ALL PRICES ARE FOB WAREHOUSE OR CITY. STAINLESS-STEEL SHEET PRICES ARE FOR TYPE 304, 2B FINISH, 48 X 120-IN. STEEL PILES ARE HIGH-STRENGTH A572. SOME PRICES MAY INCLUDE TAXES OR DISCOUNTS. PRODUCT SPECIFICATIONS MAY VARY DEPENDING ON WHAT IS MOST COMMONLY USED OR MOST ACCESSIBLE IN A CITY. QUANTITIES ARE GENERALLY TRUCKLOADS. enr.com March 30/April 6, 2015 ENR 16


© Copyright 2026