
PDF (Energy production from biomass and waste derived
Some pages of this thesis may have been removed for copyright restrictions. If you have discovered material in Aston Research Explorer which is unlawful e.g. breaches copyright, (either yours or that of a third party) or any other law, including but not limited to those relating to patent, trademark, confidentiality, data protection, obscenity, defamation, libel, then please read our Takedown policy and contact the service immediately ([email protected]) ENERGY PRODUCTION FROM BIOMASS AND WASTE DERIVED INTERMEDIATE PYROLYSIS OILS YANG YANG Doctor of Philosophy Aston University September 2014 © Yang Yang, 2014 Yang Yang asserts his moral right to be identified as the author of this thesis. This copy of the thesis has been supplied on condition that anyone who consults it is understood to recognise that its copyright rests with its author and that no quotation from the thesis and no information derived from it may be published without appropriate permission or acknowledgement. 1 Aston University ENERGY PRODUCTION FROM BIOMASS AND WASTE DERIVED INTERMEDIATE PYROLYSIS OILS YANG YANG Doctor of Philosophy SUMMARY This study investigates the use of Pyroformer intermediate pyrolysis system to produce alternative diesel engines fuels (pyrolysis oil) from various biomass and waste feedstocks and the application of these pyrolysis oils in a diesel engine generating system for Combined Heat and Power (CHP) production. The pyrolysis oils were produced in a pilot-scale (20 kg/h) intermediate pyrolysis system. Comprehensive characterisations, with a view to use as engine fuels, were carried out on the sewage sludge and de-inking sludge derived pyrolysis oils. They were both found to be able to provide sufficient heat for fuelling a diesel engine. The pyrolysis oils also presented poor combustibility and high carbon deposition, but these problems could be mitigated by means of blending the pyrolysis oils with biodiesel (derived from waste cooking oil). The blends of SSPO (sewage sludge pyrolysis oil) and biodiesel (30/70 and 50/50 in volumetric ratios) were tested in a 15 kWe Lister type stationary generating system for up to 10 hours. There was no apparent deterioration observed in engine operation. With 30% SSPO blended into biodiesel, the engine presents better overall performance (electric efficiency), fuel consumption, and overall exhaust emissions than with 50% SSPO blend. An overall system analysis was carried out on a proposed integrated Pyroformer-CHP system. Combined with real experimental results, this was used for evaluating the costs for producing heat and power and char from wood pellets and sewage sludge. It is concluded that the overall system efficiencies for both types of plant can be over 40%; however the integrated CHP system is not economically viable. This is due to extraordinary project capital investment required. Keywords: biomass, waste, intermediate pyrolysis, Pyroformer, pyrolysis oil, diesel engine Combined Heat and Power 2 ACKNOWLEDGEMENTS Doing Ph.D is a long journey! It is an important chapter of life with many interesting stories rather than just a four-and-half-year in research. I must take this opportunity to acknowledge those who have shared my up and down during this time. Firstly, I would like to express my sincerest gratitude to my supervisors: Dr. John G. Brammer for his invaluable guidance, support, and encouragement all the time; and Prof. Andreas Hornung, for providing me the opportunity, financial funding, experimental facilities and significant emotional support to complete my research. Secondly, I would like to thank my friends and (former) colleagues at EBRI. I would like to specially acknowledge Antonio Oliveira being a wonderful senior student, who looked after me all the time. Big thanks due to Miloud Ouadi, Zsuzsa A. Mayer, Muhammad Saghir, Muhammad S. Abu Bakar, Katharina Kebelmann and Neeranuch Phusunti for their kindness since the very beginning; Janat Samanya and Dr. Abul K. Hossain for the research collaborations; Daniel Wright and Jim Scott for their valuable advices for my works; Dr. Daniel J. Nowakowski and Mr. Steve Ludlow for their kind helps from time to time and Asad Mahmood for his advices and encouragement during the writing-up stage, which allow me to always feel accompanied. I am truly grateful for Prof. Hongming Xu at University of Birmingham who kindly hosted me in his research group for a short period of research work during my first year. The EC Marie Curie IAPP PYROGAS project is acknowledged for the opportunity of a 14-month secondment at WEHRLE-WERK AG in Germany in my fourth year. I am very thankful to Dr. Christoph Kornmayer, Dr. Guomin Zhang and Mr. Volker Steinberg for their support during the secondment. I was fortunate enough to have my cousin Li Chen and her husband Uli Nädelin as well as my friends Yinchun Bai, Yuan Yang, Miao Zhang and many others at Freiburg who have managed to make Germany a warm home. I owe a thank you to Shi Su, Chunhui Li, Tianyu Qiu, Xueting Wang, Guchun Zhang and Chengbo Mu from Aston EAS School for our great friendship since the very beginning. I also appreciate members of the CSSA Birmingham and Residential Service Team at Aston for the interesting time we had been together. Specially again, I would to thank Wenjie Zhang at Harbin Institute of Technology in China, being my best friend and always on standby whenever I need him. Last but not least, I must thank my parents and Yijun, for their love, endless support and unshakable faith in me. 3 TABLE OF CONTENTS CHAPTER 1 INTRODUCTION ......................................................................................... 16 1.1. Background ............................................................................................................... 16 1.2. Biomass ..................................................................................................................... 19 1.3. Biomass Thermochemical Conversion ..................................................................... 20 1.4. Biomass Pyrolysis ..................................................................................................... 21 1.5. Reactor Types ........................................................................................................... 22 1.5.1. Fluidised Bed Reactors ......................................................................................... 22 1.5.2. Fluidised Ablative Reactor .................................................................................... 24 1.5.3. Rotary Kiln Reactors ............................................................................................. 25 1.5.4. Screw Auger Reactors ........................................................................................... 26 1.6. Diesel Engine System ............................................................................................... 26 1.7. Combined Heat and Power ....................................................................................... 30 1.8. Work Scope and Objectives ...................................................................................... 31 1.9. Thesis Structure ........................................................................................................ 32 CHAPTER 2 PREVIOUS WORK ....................................................................................... 34 2.1. Biomass Pyrolysis and Auger Reactors .................................................................... 34 2.1.1. Haloclean® Intermediate Pyrolysis System .......................................................... 34 2.1.2. Influence of Pyrolysis Conditions on Product Yields of an Auger Reactor ......... 36 2.1.3. Effect of Pyrolysis Temperature on the Yield and Properties of Pyrolysis Oils from a Small-Scale Auger Reactor ...................................................................................... 39 2.2. Characteristics of Pyrolysis Oils ............................................................................... 40 2.2.1. Characterisation of Fractionated Wood Fast Pyrolysis Oil ................................... 40 2.2.2. Characteristics of Haloclean® Intermediate Pyrolysis Oils .................................. 43 2.2.3. Characteristics of Sewage Sludge Fast Pyrolysis Oil ........................................... 43 2.3. Engine Studies .......................................................................................................... 45 2.3.1. Performance of Wood Pyrolysis Oil Fuelled Diesel Engine ................................. 45 2.3.2. Combustion Characteristics of Wood Fast Pyrolysis Oils in a Diesel Engine ...... 46 2.3.3. Performance and Exhaust Emissions of Fast Pyrolysis Oil Fuelled Diesel Engines Working In Dual-Fuel and Oxygen Enrichment Conditions ............................................... 47 2.3.4. 2.4. Performance of a Pyrolysis Oil-Diesel Blend Fuelled Diesel Engine................... 48 Economic Evaluations of Energy Production by Pyrolysis ...................................... 49 2.4.1. A Techno-Economic Comparison of Power Production by Biomass Fast Pyrolysis with Gasification and Combustion ...................................................................................... 49 4 2.4.2. A Techno-Economic Assessment of the Use of Fast Pyrolysis Bio-Oil from UK Energy Crops in the Production of Electricity and Combined Heat and Power .................. 50 2.5. Novelty...................................................................................................................... 51 CHAPTER 3 METHODOLOGIES ..................................................................................... 53 3.1. Feedstocks ................................................................................................................. 53 3.1.1. Wood and Barley Straw Pellets............................................................................. 53 3.1.2. Sewage Sludge ...................................................................................................... 53 3.1.3. De-inking Sludge .................................................................................................. 53 3.2. Equipment ................................................................................................................. 54 3.2.1. The Pyroformer ..................................................................................................... 54 3.2.2. The Pyrolysis Process ........................................................................................... 56 3.2.3. Lister Engine ......................................................................................................... 57 3.3. Experimental Methods .............................................................................................. 59 3.3.1. Feedstock Characterisation ................................................................................... 59 3.3.1.1. Proximate Analysis ............................................................................................ 59 3.3.1.2. Ultimate Analysis .............................................................................................. 60 3.3.1.3. Gross (higher) Heating Value ............................................................................ 60 3.3.2. Oil Characterisation .............................................................................................. 61 3.3.2.1. Composition ...................................................................................................... 61 3.3.2.2. Ignition and Combustion ................................................................................... 61 3.3.2.3. Atomisation ....................................................................................................... 63 3.3.2.4. Safety ................................................................................................................. 64 3.3.2.5. Corrosiveness and Erosiveness.......................................................................... 64 3.3.2.6. Deposit Formation ............................................................................................. 65 3.3.2.7. Gas and Char Analysis ...................................................................................... 65 3.3.3. Engine Test............................................................................................................ 66 3.3.3.1. Energy Balance of the Generating System ........................................................ 67 3.3.3.2. Total Fuel Energy Input ..................................................................................... 68 3.3.3.3. Electric Power Output ....................................................................................... 68 3.3.3.4. Coolant Heat ...................................................................................................... 68 3.3.3.5. Exhaust Heat ...................................................................................................... 69 3.3.3.6. Engine Exhaust Emissions ................................................................................ 70 3.3.4. 3.4. Measurement Errors .............................................................................................. 71 Economic Evaluation ................................................................................................ 72 5 3.4.1. Capital Cost ........................................................................................................... 73 3.4.2. Production Cost ..................................................................................................... 75 3.4.3. Annual Cost of Capital .......................................................................................... 75 3.4.4. Consumables ......................................................................................................... 76 3.4.5. Disposal ................................................................................................................. 76 3.4.6. Labour ................................................................................................................... 76 3.4.7. Maintenance and Overheads ................................................................................. 76 3.4.8. Product Sales and Return on Investment .............................................................. 76 3.4.8.1. Product Sales ..................................................................................................... 76 3.4.8.2. Break-even Selling Price ................................................................................... 77 3.4.8.3. Internal Rate of Return ...................................................................................... 77 CHAPTER 4 PYROFORMER AND INTERMEDIATE PYROLYSIS OF BIOMASS ENERGY PELLETS............................................................................................................ 79 4.1. Pyroformer Parameters ............................................................................................. 79 4.1.1. Screw Geometry and Dimensions ......................................................................... 79 4.1.2. Residence Time and Char/Biomass Ratio ............................................................. 80 4.1.2.1. Residence Time ................................................................................................. 80 4.1.2.2. Char/Biomass Mixing Ratio .............................................................................. 81 4.2. Pyrolysis of Biomass Energy Pellets ........................................................................ 83 4.2.1. Feedstocks Analysis .............................................................................................. 83 4.2.1.1. Compositions ..................................................................................................... 83 4.2.1.2. TGA Analysis .................................................................................................... 84 4.2.2. Pyrolysis Parameters ............................................................................................. 86 4.2.3. Product Yields ....................................................................................................... 86 4.2.4. Oil Analysis ........................................................................................................... 87 4.2.5. Permanent Gas Analysis ....................................................................................... 93 4.2.6. Char Analysis ........................................................................................................ 95 4.3. Energy Flow .............................................................................................................. 95 4.4. Summary ................................................................................................................... 96 CHAPTER 5 CHARACTERISATION OF INTERMEDIATE PYROLYSIS OILS .......... 98 5.1. Feedstock Characterisation ....................................................................................... 98 5.2. Production of SSPO and DSPO ................................................................................ 99 5.3. Characterisation of SSPO and DSPO ..................................................................... 100 5.3.1. Elemental Analysis.............................................................................................. 100 6 5.3.2. Compositional Analysis ...................................................................................... 101 5.3.3. Water Content ..................................................................................................... 104 5.3.4. Distillation and Calculated Cetane Index ............................................................ 104 5.3.5. Higher Heating Value ......................................................................................... 106 5.3.6. Density ................................................................................................................ 107 5.3.7. Viscosity.............................................................................................................. 107 5.3.8. Surface Tension ................................................................................................... 108 5.3.9. Flash Point ........................................................................................................... 109 5.3.10. Acidity ................................................................................................................. 109 5.3.11. Corrosiveness ...................................................................................................... 109 5.3.12. Lubricity .............................................................................................................. 110 5.3.13. Carbon Residue and Ash ..................................................................................... 112 5.4. Comparisons of Pyrolysis Oils with Diesel and Biodiesel ..................................... 112 5.5. Summary ................................................................................................................. 117 CHAPTER 6 ENGINE TESTING OF INTERMEDIATE PYROLYSIS OIL AND BIODIESEL BLENDS ...................................................................................................... 118 6.1. Characterisation of SSPO-BD Blends .................................................................... 118 6.1.1. The SSPO and Blends ......................................................................................... 118 6.1.2. Compositional Analysis ...................................................................................... 119 6.1.3. Physical and Chemical Properties ....................................................................... 120 6.2. Fuel Combustion and Estimation of the Oil Empirical Formula ............................ 122 6.2.1. Air-fuel Ratio and Lambda ................................................................................. 123 6.2.2. Estimation of Empirical Formula of Oils and Blends ......................................... 123 6.2.3. Calculation of Stoichiometric Air-fuel Ratio ..................................................... 125 6.3. Engine Tests ............................................................................................................ 126 6.3.1. Power and Electrical Efficiency .......................................................................... 126 6.3.2. Specific Fuel Consumption ................................................................................. 127 6.3.3. System Energy Balance and Potential CHP Application .................................... 128 6.3.4. Exhaust Emissions .............................................................................................. 131 6.3.4.1. Exhaust Temperature ....................................................................................... 131 6.3.4.2. CO Emission .................................................................................................... 132 6.3.4.3. NOx Emission .................................................................................................. 133 6.3.4.4. Smoke .............................................................................................................. 134 6.3.5. Exhaust Emissions vs. Standards. ....................................................................... 135 7 6.4. Summary ................................................................................................................. 137 CHAPTER 7 ECONOMIC EVALUATION OF THE PYROLYSIS-CHP SYSTEM...... 138 7.1. Pyro-CHP Process Simulation ................................................................................ 138 7.2. Pyro-CHP Plant Costs and Product Sales ............................................................... 141 7.3. Capital Costs ........................................................................................................... 142 7.3.1. Equipment Cost ................................................................................................... 142 7.3.2. Total Plant Cost ................................................................................................... 144 7.3.3. Operating Cost .................................................................................................... 145 7.3.3.1. Consumables.................................................................................................... 145 7.3.3.2. Waste Water Disposal ..................................................................................... 145 7.3.3.3. Labour Requirement and Cost ......................................................................... 146 7.3.4. Product Sales ....................................................................................................... 148 7.3.5. CHP Production .................................................................................................. 148 7.3.6. Prices for Electrical Power .................................................................................. 149 7.3.7. Price for Heat ...................................................................................................... 151 7.3.8. Price for Char ...................................................................................................... 152 7.4. Energy Production Cost .......................................................................................... 153 7.5. Break-even Selling Price ........................................................................................ 155 7.6. Share of Product Sales ............................................................................................ 159 7.7. Internal Rate of Return ........................................................................................... 160 7.8. Learning Effects ...................................................................................................... 162 7.9. Summary ................................................................................................................. 166 CHAPTER 8 CONCLUSIONS ......................................................................................... 167 8.1. Intermediate Pyrolysis of Biomass (Chapter 4) ...................................................... 167 8.2. Characterisation of the Pyrolysis Oils and SSPO-BD Blends (Chapter 5 &6) ....... 168 8.3. Engine Test of the Pyrolysis Oils (Chapter 6) ........................................................ 169 8.4. Economic Evaluation on the Pyrolysis- CHP System (Chapter 7) ......................... 170 8.5. Further work ........................................................................................................... 172 REFERENCES .................................................................................................................. 174 LIST OF PUBLICATIONS ............................................................................................... 185 APPENDIX 1 ANALYSIS PROCEDURES ...................................................................... A1 APPENDIX 2 MEASUREMENT ERROR ...................................................................... A10 APPENDIX 3 ENGINE TEST RESULTS ....................................................................... A12 APPENDIX 4 ASPEN PROCESS FLOWSHEET AND DESCRIPTIONS .................... A17 8 APPENDIX 5 SYSTEM PRODUCTIVITY AND PRODUCT SALES .......................... A23 9 LIST OF FIGURES Figure 1.1 Renewable Share in Gross Final Energy Consumption ..................................... 17 Figure 1.2 Renewable Energy Consumption – the UK ....................................................... 18 Figure 1.3 Biomass Thermal Conversion Processes, Products and Applications ............... 21 Figure 1.4 Fluidised Bed Pyrolysis System ......................................................................... 23 Figure 1.5 Ablative Pyrolysis .............................................................................................. 24 Figure 1.6 Rotary Kiln Reactor............................................................................................ 25 Figure 1.7 Screw Reactor..................................................................................................... 26 Figure 1.8 Diesel Engine Configuration .............................................................................. 27 Figure 2.1 Haloclean® Pyrolysis System ............................................................................ 35 Figure 2.2 Product Yields vs. Temperature for the Haloclean® Reactor ............................ 36 Figure 2.3 Continuous Auger Reactor ................................................................................. 37 Figure 2.4 Fractionation Scheme and Analysis Method for Pyrolysis Oil .......................... 41 Figure 3.1 Schematic of the Pyroformer intermediate pyrolysis reactor ............................. 54 Figure 3.2 Schematic Diagram of the Intermediate Pyrolysis System ................................ 56 Figure 3.3 Lister CS diesel Engine and Generator .............................................................. 58 Figure 3.4 Schematic Diagram of the Engine Test Arrangement ........................................ 66 Figure 4.1 Geometric Dimensions of the (a) Inner Screw and (b) Outer Screw ................. 80 Figure 4.2 Pyrolysis TGA Analyses of Feedstock Samples ................................................ 85 Figure 4.3 GC/MS Spectrums of the Pyrolysis Oils ............................................................ 89 Figure 4.4 GC/TCD Spectrums of the Pyrolysis Gases ....................................................... 93 Figure 5.1 GC/MS Spectrum of the Pyrolysis Oils ........................................................... 101 Figure 5.2 SSPO and DSPO Distillation Curves ............................................................... 105 Figure 5.3 Densities of the Pyrolysis Oils ......................................................................... 107 Figure 5.4 Copper Corrosion of the Pyrolysis Oils ........................................................... 110 Figure 5.5 Ware Scares ...................................................................................................... 111 Figure 5.6 Comparisons of Oil Properties ......................................................................... 115 Figure 6.1 Comparison of the Different Oils and Blends .................................................. 119 Figure 6.2 Comparisons of Characteristics of Different Oils and Blends ......................... 121 Figure 6.3 Comparison of Electrical Efficiencies .............................................................. 126 Figure 6.4 Comparison of Specific Fuel Consumption ..................................................... 128 Figure 6.5 Comparison of Exhaust Gas Temperature........................................................ 132 Figure 6.6 Comparison of Carbon Monoxide Emission .................................................... 133 Figure 6.7 Comparison of Nitrogen Oxides Emission ....................................................... 134 Figure 6.8 Comparison of Exhaust Gas Opacity ............................................................... 135 Figure 7.1 Schematic of the Proposed Pyro-CHP Plants ................................................... 141 Figure 7.2 Electrical and Heat Efficiency of Diesel Engine Based CHP Systems ............ 149 Figure 7.3 Breakdown of Energy Production Cost- Wood ................................................ 153 Figure 7.4 Breakdown of Energy Production Cost- Sewage Sludge ................................. 154 Figure 7.5 BESP and Market Price- Electrical Power ....................................................... 156 Figure 7.6 BESPs and Market Prices- Heat ....................................................................... 157 Figure 7.7 BESPs and Market Prices- Char ....................................................................... 158 Figure 7.8 Shares of Individual Product Sales in Total Sales- .......................................... 159 10 Figure 7.9 Shares of Individual Product Sales in Total Sales- .......................................... 160 Figure 7.10 Internal Rate of Return - Wood Plant ............................................................. 161 Figure 7.11 Internal Rate of Return- Sewage Sludge Plant ............................................... 162 Figure 7.12 Learning Effect on Energy Production Cost .................................................. 163 Figure 7.13 Learning Effect on Internal Rate of Return - Wood Plant ............................. 164 Figure 7.14 Learning Effect on Internal Rate of Return - Sewage Sludge Plant ............... 165 11 LIST OF TABLES Table 1.1 Biomass Groups and Types ................................................................................. 19 Table 1.2 Fast, Intermediate and Slow Pyrolysis of Biomass ............................................. 22 Table 2.1 Product Yields vs. Pyrolysis Conditions for the Auger Reactor. ........................ 38 Table 2.2 Characteristics of the Fast Pyrolysis Oils ............................................................ 42 Table 2.3 Physical Properties of Pyrolysis Oils ................................................................... 43 Table 2.4 Characteristics of Sewage Sludge Pyrolysis Liquids........................................... 44 Table 3.1 Technical Specifications of the Engine and Generator ........................................ 58 Table 3.2 Equipment Cost Conversion Factors ................................................................... 74 Table 3.3 Conversion of direct plant cost to total plant cost ............................................... 75 Table 4.1 Parameters of the 20 kg/h Pyroformer ................................................................. 80 Table 4.2 Residence Time and Char/Biomass Ratio under Various Screw Speeds ............ 83 Table 4.3 Ultimate and Proximate Analysis of the Wood and Barley Pellets ..................... 84 Table 4.4 The Pyroformer Settings and Parameters ............................................................ 86 Table 4.5 Product Yields of the Intermediate Pyrolysis ...................................................... 87 Table 4.6 Characteristics of the Intermediate Pyrolysis Oils............................................... 88 Table 4.7 Composition of the Biomass Derived Pyrolysis Oils .......................................... 90 Table 4.8 Compounds of the Intermediate Pyrolysis Oils ................................................... 92 Table 4.9 Composition of Pyrolysis Gases .......................................................................... 94 Table 4.10 Characterisation of Chars .................................................................................. 95 Table 4.11 Mass and Energy Balances ................................................................................ 96 Table 5.1 Characteristics of Sewage Sludge and De-inking Sludge Feedstock .................. 98 Table 5.2 Pyrolysis Condition and Product Yields .............................................................. 99 Table 5.3 Elemental Analysis of SSPO and DSPO ........................................................... 100 Table 5.4 Composition of the Waste Derived Pyrolysis Oils ............................................ 102 Table 5.5 Distillation Temperatures, Densities and CCI of SSPO and DSPO .................. 106 Table 5.6 Validations of Measured HHV of SSPO and DSPO ......................................... 106 Table 5.7 Kinematic Viscosity........................................................................................... 108 Table 5.8 Dimensions of SSPO and DSPO Wear Scars .................................................... 111 Table 5.9 Carbon Residue and Ash Content of SSPO and DSPO ..................................... 112 Table 5.10 Comparison of Fuel-Related Properties of Pyrolysis Oils to Diesel and Biodiesel ............................................................................................................................ 114 Table 6.1 Comparison of the CHO of Different Oils and Blends...................................... 119 Table 6.2 Elemental Analysis of Diesel, Biodiesel, SSPO And DSPO ............................. 124 Table 6.3 Calculated Atom Numbers for Different Oils ................................................... 124 Table 6.4 Average Chemical Formulas for Different Oils ................................................ 124 Table 6.5 Calculated Stoichiometric Air-Fuel Ratio for Different Oils ............................ 125 Table 6.6 Engine Electrical Efficiency under Different Air-fuel Equivalence Ratio ........ 127 Table 6.7 Energy Balance of the Engine Test ................................................................... 129 Table 6.8 EU Stage IIIA Emission Standard and US Tier 4 Emission Standard for Stationary Diesel Engines .................................................................................................. 136 Table 6.9 Exhaust Emission of CO and NOx at 75% Load ............................................... 136 Table 7.1 Mass and Energy Balance for the Simulated Systems at 100 kg/h Dry Feed .... 140 12 Table 7.2 System Equipment Costs ................................................................................... 143 Table 7.3 Equipment Cost and Total Plant Cost ................................................................ 144 Table 7.4 Cost of Wood Pellets ......................................................................................... 145 Table 7.5 Cost of Waste Water Disposal ........................................................................... 146 Table 7.6 Staffing Level and Cost ..................................................................................... 147 Table 7.7 Price of Electrical Power ................................................................................... 151 Table 7.8 Price of Heat ...................................................................................................... 151 Table 7.9 Price of Char ...................................................................................................... 152 Table 7.10 Scenarios for Product Sales ............................................................................. 155 13 LIST OF ABBREVIATIONS AC Alternate Current ACC Annual Charge of Capital AFR Air/Fuel Ratio ar as received ASTM American Society for Testing and Materials EBRI European Bioenergy Research Institute BESP Break-Even Selling Price BFB Bubbling Fluidised Bed CCI Calculated Cetane Index CFB Circulating Fluidised Bed CI Compression Ignition CCGT Combined Cycle Gas Turbine CHP Combined Heat and Power CCR Conradson Carbon Residue CR Capacity Ratio daf dry ash free DSPO De-inking Sludge Pyrolysis Oil DPC Direct Plant Cost EPC Energy Production Cost FIT Feed-In Tariff FD Fossil Diesel GC Gas Chromatography HHV Higher Heating Value IPC Installed Plant Cost IRR Internal Rate of Return GC/MS Gas Chromatography / Mass Spectrometry GC/TCD Gas Chromatograph / Thermal Conductivity Detector GHG Greenhouse Gas KF Karl Fischer NPV Net Present Value Pyro-CHP Pyroformer-Combine Heat and Power RO Renewable Obligation 14 ROC Renewable Obligation Certificate RHI Renewable Heat Incentive SI Spark Ignition SSPO Sewage Sludge Pyrolysis Oil TAN Total Acid Number TPC Total Plant Cost TGA Thermo-Gravimetric Analysis 15 CHAPTER 1 INTRODUCTION The work of this thesis relates to the intermediate pyrolysis of low value waste biomass to produce liquid fuels for use in internal combustion engines for combined heat and power. These concepts will be explained in the following sections. 1.1. Background Since the beginning of the Industrial Revolution in the 1760s, fossil fuels have increasingly replaced wood, wind and water as the primary energy source for human society, particularly in the developed countries. Large scale industrial production began and energy consumption dramatically increased. Today, the UK is the third largest energy consumer among the EU28 member states, following Germany and France [1]. In 2012, UK’s total overall primary energy consumption was 206.3 Mtoe (million tonnes of oil equivalent), similar to the level in 1985. During the last 40 years, the UK’s annual overall primary energy consumption remained stable around an average level of 216 Mtoe, the lowest being 196.1 Mtoe in 1982 and the highest 236.9 Mtoe in 2001 [2]. Although the energy supply in the UK has been mostly dependent on fossil fuels [3, 4], the structure of UK’s primary energy use has undergone some changes over the past three decades, along with significant energy policy changes in response to various social, economic, environmental and politic drivers. The fossil energy share in the total consumption has reduced from over 95.0% in 1980 to 85.1% in 2012; while the renewable energy share has been increased from a negligible amount in 1980 to 4.2% in 2012 with the remaining share mainly filled by nuclear energy [5-7]. Energy production and utilisation are becoming more and more efficient, evidenced by today’s total energy consumption in the UK being less than in 1970, despite an extra of 6.5 million of population. The main factors for the change are an increasing public and political requirement to reduce reliance on fossil imports and more importantly, reduce national greenhouse gas (GHG) emissions in response to evidence for the anthropogenic causes of climate change 16 and global warming [8]. Research has shown with high certainty that global warming primarily results from the increase of GHG in the atmosphere from anthropogenic sources [9]. Anthropogenic carbon dioxide emissions, one of the principal greenhouse gases, mostly come from combustion of carbon-based fossil fuels (coal, oil, and natural gas). Use of energy from renewable resources such as sunlight, wind, marine, geothermal heat and sustainable biomass to substitute conventional fossil fuels in the distinct areas of electricity generation, space heating, motor engine fuels, and off-grid rural energy supply is believed to be a practical way to alleviate the atmospheric GHG increase [10]. Figure 1.1 Renewable Share in Gross Final Energy Consumption (data from [11]) Historical Data and 2020 Target for the UK, Other Western European Countries and the EU28 Average In March 2010, the European Commission (EC) introduced “Europe 2020” as its 10-year development strategy [12], which set a clear objective of meeting the challenges of climate change as one of five major targets. It states that, by 2020, the EC aims to reduce GHG emissions by at least 20% compared to 1990 levels and increase the share of renewable energy in final energy consumption to 20%, and achieve a 20% increase in energy efficiency. Prior to this, the associated “UK Renewable Energy Strategy” in July 2009 declared the UK 2020 target, deploying a share of 15% renewable energy in total energy consumption [11]. Figure 1.1 illustrates the historical performance of the renewable energy share in the total consumption and the 2020 targets for the UK with some other Western European countries and the EU28 average. It is observed that the UK has been historically behind the average level. Considering the 2012 level, a significant (nearly 3.6 times) 17 increase in renewable energy market penetration is required in the next 8 years to reach the 15% target by 2020 [11]. Figure 1.2 Renewable Energy Consumption – the UK (data from [11]) (Biomass includes biomass electricity and biomass non-domestic heat; Heat pumps include air-source heat and ground-source heat; Others include hydropower, geothermal, solar energy, marine energy and domestic heat) In order to assist industry in meeting the renewable energy targets, the UK government has also implemented a series of major financial incentive schemes. The schemes operate with different technologies and industrial scales in different mechanisms. In April 2002, the Renewables Obligation (RO) came into force [13]. This places an obligation on licensed electricity suppliers to source an annually incremental target of electricity from renewable sources, and also specifies detailed means of support for various technologies and scales. A Renewables Obligation Certificates (ROCs) trading scheme has also been set to assist the energy suppliers, who cannot meet their obligations, to purchase additional credits from other renewable electricity generators. This has become the major UK policy tool to incentivise deployment of renewable electricity. From April 2010 a Feed-in Tariff (FIT) scheme came into effect in addition to the current RO scheme [14]. The FIT has different incentive bands and is of most interest to smaller scale generators. In contrast to trading ROCs in the RO scheme, the FIT allows renewable generators to receive a straightforward incentive payment. From November 2011, the renewable heat incentive (RHI) was launched. It works in a similar way to FIT but for renewable heat generation [15, 16]. In conjunction with to these support schemes, in July 2011, the government released the first “UK Renewable Energy Roadmap”, which reviewed the achievements to date and set out detailed renewable energy objectives by 2020 [17]. Figure 1.2 illustrates the 18 technology breakdown of renewable energy production in 2010 and the proposed 2020 deployment. It can be clearly seen that biomass electricity and heat contribute the largest component, although this will decrease from 45.0% in 2010 to 35.1% in 2020. 1.2. Biomass The term biomass was originally coined by biologists to denote the weight of biological material from organisms in a given unit area of land [18, 19]. More recently it has come to be used as a term for recent (i.e. non-fossil) organic material used as a source of energy, and covers a board range of materials from woody forestry products, through agricultural residues to energy crops, as well as organic industrial, commercial and domestic wastes that are difficult and costly to treat and dispose of. Throughout this work, biomass is commonly referred to as a feedstock as it is used as an input to a conversion process. Biomass feedstocks can be primarily categorised as the following major groups, as shown in Table 1.1. Table 1.1 Biomass Groups and Types Group Typical product Wood fuels Forest wood fuel, sawmill co-product Energy crops Short rotation coppice, miscanthus, switchgrass Wood residues Forest residues, urban wood residues Agricultural residues and wastes Plant based: crop residues Animal based: cattle slurry, poultry and pig manures Wastes and discards Sewage sludge, municipal waste, paper industry waste Bioenergy describes any form of energy that is generated from biomass sources. Unlike other renewable resources, biomass can be converted to renewable liquid or gaseous fuels that can substitute conventional fossil fuels in existing IC engine power and CHP systems. Although the ultimate combustion of biomass produces carbon dioxide emissions, provided the harvested biomass is re-grown, the process over the utilisation cycle is “carbon-neutral”, that is to say the carbon emissions (in the form of gaseous carbon dioxide) to the atmosphere from the energy conversion system are balanced by the carbon uptake from the atmosphere during the growing cycle of the biomass [19]. However, it is worth noting that this does not take into account other possible fossil energy inputs prior to 19 the fuel utilisation cycle including biomass planting (applying fertiliser for energy crops) and harvesting, feedstock production and transport etc., although their carbon emissions are usually minor in comparison to the combustion. Apart from the environmental benefit, utilising waste biomass as an energy resource also has economic benefits. The EU and UK governments have implemented taxation policies and other legislation to control and discourage the disposal of waste by landfill or in-situ burning. This means that some residual and waste biomass materials have a negative cost associated with them (a so-called “gate fee”). If they can be upgraded to energy carriers, their value increases. Two examples of industrial waste biomass resources which will become the focus of the present work are de-inking sludge (one of the residues from the paper recycling industry), and sewage sludge (the final residue from municipal water treatment plants) sewage sludge. Both of these are available in large quantities and present major disposal challenges, while at the same time being quite different in nature. They will be described in detail in Chapters 3 and 5. 1.3. Biomass Thermochemical Conversion There are a variety of means, including thermal, biological and mechanical/physical, to convert biomass to bioenergy. Biomass thermal conversion is a type of process that uses heat as the dominant mechanism to convert biomass feedstock to another energy form. The processes are combustion, pyrolysis and gasification, and they are principally differentiated by the extent to which the involved chemical reactions are allowed to proceed, controlled by the availability of oxygen (usually as air) and the process temperature. Figure 1.3 shows the different methods of biomass thermal conversion and their primary products and markets [20]. Direct combustion/incineration requires the presence of an excess of oxygen. In industrialscale production, the combustion heat is generally used to produce steam in the boiler for electricity generation. Air- or oxygen- blown gasification is a method of converting solid biomass into gaseous fuel. It requires a controlled amount of air or oxygen and a conversion temperature over 700°C to produce mainly permanent gases comprised predominantly of carbon monoxide, hydrogen, methane, carbon dioxide and nitrogen (if air-blown). The gaseous fuel can be used in gas engines or turbines for high efficiency 20 energy production. Pyrolysis is a thermal process in which organics in the biomass are decomposed into smaller molecules to form a liquid fuel, known as pyrolysis oil (bio-oil), together with permanent gases and solid char, the proportions depending on the process parameters. It can take place only in the absence of oxygen, and usually at moderate temperatures between 400 and 600°C. The pyrolysis oil can potentially be used to substitute conventional petroleum fuels for heat and power generation and for road transport. The permanent gases may contain a combustible fraction which can be used as a gaseous fuel. The char product may be used as a solid fuel, or as a soil enhancing medium referred to as biochar. Pyrolysis Charcoal/ biochar Char Oil Engine Chemicals Gas Turbine Power and heat Gasification Combustion Boiler Heat Heat only Figure 1.3 Biomass Thermal Conversion Processes, Products and Applications Among the thermal conversion processes, pyrolysis is particularly interesting, as the oil product can have a high energy content and the advantage of easier and more economical storage and transport compared to gaseous fuels. The joint products, char in particular, also have significant added economic and environmental value. 1.4. Biomass Pyrolysis There are three main types of biomass pyrolysis technique widely used, fast pyrolysis and intermediate pyrolysis predominantly for oil production and slow pyrolysis predominantly for char production. These techniques are differentiated by processing conditions, i.e. temperature and hot vapour residence time, as shown in Table 1.2. The pyrolysis of biomass always produces condensable vapour, permanent gases and char, but the yields of the final products can be varied over a wide range by mean of controlling the processing parameters. At moderate temperature (400-500°C), short solids and vapour 21 residence time (a few seconds) and rapid vapour cooling rate, production of pyrolysis oil is promoted (fast pyrolysis). Up to 70% of the final product yield is pyrolysis oil (the rest is in the form of permanent gas and char). This pyrolysis oil is generally a single-phase mixture of organic material and aqua. A low process temperature (200-300°C) and a long solids residence time (60 minutes to a few days) favour the conversion of biomass to char (slow pyrolysis). Intermediate pyrolysis operates at conditions between fast and slow pyrolysis, in the same temperature range of as fast pyrolysis, but with relatively longer solids residence time (2-30 minutes). It usually produces a lower quantity of oil than fast pyrolysis, but the increased char is considered as a valuable joint product. The present work will focus on intermediate pyrolysis because of its ability to handle the more difficult waste feedstocks of interest here. Table 1.2 Fast, Intermediate and Slow Pyrolysis of Biomass Mode Conditions Oil Gas Solid Fast Pyrolysis 400-500°C, short solids and vapour residence time (a few seconds), rapid cooling and condensation 70% 15% 15% Intermediate Pyrolysis 400-500°C, intermediate solids residence time, (several minutes), 50% 30% 20% 0% 20% 80% Slow Pyrolysis 200-300°C, long solids residence time (torrefaction) (hours or days) A typical fast or intermediate biomass pyrolysis system consists of a feedstock pretreatment and feeding system, a pyrolysis reactor, a condensing system and product collectors. The pyrolysis reactor is the core component, as the products are mostly dependent on the reactor configuration and processing conditions. For pyrolysis oil production, a number of types of reactors have been designed. The more common of these are now described. 1.5. Reactor Types 1.5.1. Fluidised Bed Reactors The fluidised bed reactor is the most widely utilised biomass fast pyrolysis reactor. Fluidisation takes place when gas is made to pass upwards through a quantity of solid particulate substance so that it is transported and behaves like a fluid. In the case of 22 pyrolysis reactors, the fluidisation is usually achieved by introducing an inert gas (e.g. nitrogen) into a quantity of a solid particulate bed (e.g. silica sand). The fluidised bed reactor has been used for many years in many industries and is fully demonstrated in commercial applications. It has the advantages of being well understood and relatively simple in construction and operation, with few moving components [20]. In fluidised bed reactors, heat transfer is normally achieved through heat conduction and convection from the fluidising gas and/or solid bed material (often silica sand) to the biomass feedstock, and in the case of fast pyrolysis the feedstock needs to be in the form of small particulates (smaller than 3 mm diameter). Bubbling fluidised bed (BFB) and circulating fluidised bed (CFB) reactors, as illustrated in Figure 1.4, are the main types of fluidised bed reactor. (a) (b) Figure 1.4 Fluidised Bed Pyrolysis System [20] (a) Bubbling Fluidised Bed (BFB), (b) Circulating Fluidised Bed (CFB) The feature of the BFB pyrolysis reactor is that the fluidising flow is set just above the minimum fluidisation velocity, but not high enough to transport the bed material out of the reactor along with pyrolysis vapours. The bed material develops a bubbling-like movement within the reactor. Silica sand or dolomite is usually employed as the bed material and nitrogen as the fluidising gas. For fast pyrolysis, the solid residence time is determined by the feedstock feed rate and the bed volume and the vapour residence time is controlled by the fluidising gas flow. There is an immediate separation of pyrolysis vapour from the solid bed, thus avoiding secondary cracking reactions taking place from the char remaining in the bed. Surplus char solids accumulating in the bed are removed by an extraction pipe near the reactor base and the hot vapour is further cleaned at the cyclones in the next 23 process stage. Oil product is collected at the end of the condenser. The BFB reactor is efficient and gives a very high yield of oil product. A technical difficulty in the BFB reactor is that the hot char product has a tendency to accumulate and agglomerate on the top of the bed. This issue can seriously affect the reactor performance. The CFB reactor has comparable features and system configurations to the BFB reactor, but rather than retaining the entrained solids within the bed, the flow of the fluidising gas is sufficient to entrain the bed solids out of the reactor. The entrained solids are recirculated through an external loop back into the reactor bed. Due to the high flow velocity required to achieve this, the vapour residence time is much less than that of the BFB. A smaller biomass feedstock particle size is also required [21]. Therefore the CFB reactor provides a very high heat transfer rate. This configuration is more suitable for larger scales and is already widely used in the petroleum industry [20]. The CFB reactor avoids some drawbacks of the BFB reactor, such as char agglomeration, although the constant solid recirculation within the system can lead to increased erosion, both within the reactor and the associated pipework. 1.5.2. Fluidised Ablative Reactor The ablative reactor, also used for fast pyrolysis, has a completely different configuration to the fluidised bed reactors as shown in Figure 1.5. ROTATION HOT SURFACE Vapour PRESSURE Biomass Char Figure 1.5 Ablative Pyrolysis (adapted from [22]) In the ablative reactor, biomass feedstock is pressured (by mechanical or centrifugal force) against a heated rotating plate, at which surface the pyrolysis reaction takes place. The vapour rapidly evolves and is then quenched and condensed to form pyrolysis oil. High relative motion between the feedstock and the hot surface can remove the char product to 24 allow the process to continue. The rate of pyrolysis reaction is largely determined by the pressure with which the feedstock is pressed onto the reactor surface, but is less influenced by the size and form of the feedstock particulates [20]. Hence it does not have strict feedstock pre-treatment requirements. Ablative reactors are typically compact designs which do not require a transporting/heat-carrying medium. However, the reactors contain rotating parts which work mostly in high temperature high particulate conditions, and the heating plate may encounter durability issues. 1.5.3. Rotary Kiln Reactors The rotary kiln reactor (Figure 1.6) was initially designed as a furnace primarily for the incineration of industrial waste, and has only recently been developed for slow pyrolysis [23, 24]. The rotary kiln reactor is basically a rotating cylinder inclined at 1-10° to the horizontal to promote the advancement of biomass. The solids residence time in the kiln is determined by the reactor design (dimensions and slope angle), degree of filling and rotational speed although the residence time is controlled at a minimum of 30 minutes. For pyrolysis, the reactor is generally externally heated, via the kiln wall. The heating temperature is usually higher than normal pyrolysis (up to 800°C). This favours production of permanent gas that can be immediately consumed. Biomass is fed at the inlet of the reactor, where a specially made damper is installed to prevent entrance of air. Biomass is directly in contact with and thus pyrolysed at the kiln wall inner surface. A hot gas filter, condenser and electrostatic precipitator (ESP) are generally installed downstream to further process the pyrolysis vapour to oil and permanent gas. HEATING UNIT ROTATION Biomass Rotary Kiln Vapour Char Figure 1.6 Rotary Kiln Reactor (adapted from [22]) Rotary kiln reactors are often used to handle low quality heterogeneous feedstocks that are difficult or insufficiently valuable to be highly pre-treated, sewage sludge for example. A 25 high degree of feedstock mixing and direct heat allows efficient heat exchange and a uniform char product [25]. 1.5.4. Screw Auger Reactors The screw auger reactor is also cylindrical reactor. But rather than transporting the material by rotation, it generally employs one or more motor driven rotating screws to mechanically transport biomass through the reactor (as shown in Figure 1.7). Heating can be achieved by either using an external heating source or using recirculated heat carriers, such as steel and ceramic balls [26]. The solid residence time is controlled by the dimensions and rotational speed of the screws. Heating rates are much slower than necessary for fast pyrolysis, so this type of reactor is used for intermediate or sometimes slow pyrolysis where the solids residence time is minutes or more. Biomass Vapour Char HEATING UNIT Figure 1.7 Screw Reactor (adapted from [22]) Screw auger reactors do not require intensive feedstock pre-treatment and are well suited to more difficult, and/or heterogeneous feedstocks. This is the type of reactor used in the present work, and is described in more detail in Chapter 3. 1.6. Diesel Engine System The internal combustion (IC) engine is a system that converts the chemical energy from fuel combustion to the mechanical energy of the rotating engine shaft. An IC engine essentially consists of pistons fitting into cylindrical combustion chambers and connected to a crankshaft. In operation, the piston travels along the length of the cylinder under the expansion pressure of fuel combustion to push the crankshaft, so transforming the linear motion of the piston into the rotary motion of the crankshaft. . 26 There are two main types of IC engine design utilised in stationary power generation applications, the compression-ignition (CI) Diesel-cycle engine and the spark-ignition (SI) Otto-cycle engine. The primary difference between the SI and CI engines is the method of igniting the fuel, which is related to their fuels’ characteristics. The SI engine uses a highvoltage spark plug to ignite a pre-mixed air and fuel (normally petrol or natural gas) introduced into the cylinder. The CI engine compresses the air inspired into the cylinder to a pressure and temperature high enough to cause the injected fuel (normally diesel) to autoignite, as shown in the Figure 1.8. Air Inlet Valve & Manifold Injector Cylinder Exhaust Outlet Valve & Manifold Fuel Spray (Injection in Compression Stroke) Piston Movement Piston Piston Rod Crankshaft Figure 1.8 Diesel Engine Configuration The present work focuses on the four-stroke CI diesel engine, which is commonly seen in small-scale power generation. This type of engine completes an engine power cycle in the following four strokes of the piston within the cylinder: Intake stroke – inlet valve opens and piston moves downward to introduce air into the cylinder. Compression stroke – piston moves upward to compress the air within the cylinder. The diesel fuel is injected near the end of the compression stroke (top dead centre), and auto-ignited. Power stroke – piston is pushed to move downward by the expansion of the combustion gases. Exhaust stroke – outlet value opens and piston moves upward to expulse combustion products from the cylinder through the exhaust port. 27 Most diesel engines have fuel directly injected into the combustion chamber. The fuel system plays a vital role here. The fuel pump controls the injection timing (the fuel injection at a certain crank angle) and supplies required amount of fuel to the injector through a high-pressure fuel pipe. The injector, as well as withstanding the high temperature and high pressure inside the cylinder, has to continuously and stably deliver the fuel in a fine atomised spray with a fixed pattern. This increases the fuel surface area and thus vaporisation and combustion rate to ensure good fuel combustion [27]. There are several spray characteristics to indicate the injection quality, including spray pattern, spray cone angle and droplet size. During fuel injection, a finely atomised and properly distributed spray favours a rapid ignition, and smooth and complete combustion. However, these characteristics are not only determined by the features of the injector, but are also closely related to the fuel properties such as distillation characteristics, density, viscosity and surface tension etc. The quality of the fuel spray determines the combustion character and hence influences the engine performance. Therefore, they engine fuel system needs to be carefully calibrated according to the fuel properties to ensure an optimised injection. A detailed discussion on fuel characteristics and diesel engine parameters and performance will be provided in Chapter 5 and Chapter 6 respectively. It is worth noting that nowadays most of the modern engines use an ECM (Electronic Control Module) controlled injection system instead of mechanical controlled for more flexible and accurate fuel delivery. Diesel engine generating systems normally consist of a diesel engine whose shaft is connected (via a gearbox usually) to an electrical generator. This system has the advantages of low capital cost and high efficiency at small scale generation. The electrical efficiency, the ratio between electrical power output and fuel chemical energy input, is the main indicator of the overall performance of the engine generating system. For diesel engine systems, the levels of electrical efficiency generally increase with the engine size. Modern systems can achieve up to 48% (for large slow speed engines), compared to up to 42% for modern high performance SI engines [28]. This is because diesel engines work under a higher air compression ratio. Fuel efficiency is another indicator of the fuel and engine performance, although it is directly related to the engine electrical efficiency. Specific fuel consumption (SFC), defined as the amount of fuel (generally in grams) required to generate a unit of electricity (generally in kilowatt), is usually used to indicate the fuel efficiency. A high electrical efficiency means a good fuel economy (low SFC). 28 Although diesel engines are more efficient (better fuel economy in other words), one major problem for the diesel engine is its exhaust emissions. It is reported that, depending on the engine type and fuel character, a diesel engines produce 5 to 20 times the nitrogen oxides (on a ppm basis) of high performance natural gas fired SI engines, and also soot which is generally absent in SI engine emissions [28]. There are several types of gas and other matter emitted in the engine exhaust. Apart from nitrogen and oxygen from the air as the main content (a total of over 80 vol.%), there are also fuel combustion products and by-products including carbon dioxide (CO2), water vapour (H2O), carbon monoxide (CO), unburned hydrocarbons (UHC), nitrogen oxides (NO and NO2, together called NOx), sulphur oxides (SOx) and particulate matters (PM). CO2 and water vapour are the products of hydrocarbon fuel combustion. CO is the product of incomplete fuel combustion. Unburned HC emission is caused by fuel un-combusted, for example, a trace amount of fuel-air mixture avoiding from the flame zone in the gaps at the piston ring grooves. NOx formation results from two sources, i.e. combustion of nitrogen-bearing fuel and oxidisation of atmospheric nitrogen during the fuel combustion. The latter has been proved to have a strong relationship with combustion temperature [29]. SOx results from complete or incomplete combustion of sulphur-bearing fuel. PM is a complex component of diesel exhaust gas, including soot and aerosols such as fly ash particulates, sulphates and silicates. It is usually responsible for the black smoke from diesel engines. Among the exhaust gases, CO2 is the major greenhouse gas, and CO, HC, NOx, SOx and PM are hazardous to human and animal health and can also cause serious environmental and climate issues. Therefore, in most modern engines, a catalytic convertor is installed to minimise the hazardous gas emissions to meet the ever increasingly strict exhaust emission regulations. It is worth noting that, besides the CI and SI configuration, there are also some adapted types of IC engine configurations that combine the features of CI and SI. An example is the “dual-fuel” engine with pilot fuel injection. When a diesel engine operates with gaseous fuel or liquid fuel having a high auto-ignition temperature, it is necessary to admit a pilot charge of diesel fuel to the engine cylinder to provide the ignition source. This type of engine configuration can be utilised in the development of bioenergy especially for the above-mentioned biomass pyrolysis oil and permanent gases, when a specially designed generating system for such biofuel is not available. 29 1.7. Combined Heat and Power A combined heat and power (CHP) system is one that simultaneously supplies electrical power and heat (in the form of steam or hot water) in a single generating process. The heart of a CHP system is the prime mover that produces heat as well as provides the mechanical power to drive the electricity generator. The CHP installations are very flexible and can be tailored in various scales and to meet the requirement of different heat demands, as there are a variety of types of prime movers are available, such as gas turbine, stream turbine, combined cycle gas turbines (CCGTs) or IC engine. The CHP technology has been developed to effectively improve the energy production efficiency. Compared to the separate purchase of electricity from the national grid and a gas boiler for onsite heating, it can achieve primary energy savings of approximately 40% [30]. This type of system has attracted a great deal of attention recently and many suppliers of large-scale diesel engine based CHP systems quote extremely high overall energy efficiencies of up to 90% [31]. CHP installations vary significantly in scale [32]. Industrial-scale CHP systems are typically found in industrial plants or power stations with capacities up to a few MWe (megawatt electrical). Along with electricity, high value heat that meets the industrial requirement is produced and can be used for steam production. In addition to that, heat that is surplus to the needs of the site can also be utilised to meet heat requirements of the surrounding local community. Likewise, surplus electricity can be fed into the grid. Mini scale CHP systems are normally supplied packaged as complete units that can conveniently connect to the electrical and heating network of buildings such as supermarkets, museums, hotels or blocks of flats etc. These systems range from about 50 kWe up to megawatt-level electrical capacity. Individual households can also run CHP systems, but at a micro-scale. The system generates electrical power for household consumption and also can replace the domestic gas boiler for space and water heating. IC engines are commonly seen in miniscale and micro-scale CHP systems [33]. Both SI and CI engines can be used as the prime mover for IC engine based CHP schemes. However, the present work is interested in diesel engine based CHP systems. Industrialscale diesel systems are available at electrical outputs of up to 15 MWe and can be designed to operate on gas-oil, heavy fuel oil or a mixture of gas and oil in dual-fuel mode [34]. A power-only diesel generating system can convert approximately 30-40% of the fuel 30 energy input into electrical power, but leaves most of the rest of the fuel energy in the exhaust gases and cooling water in the form of waste heat. This heat is potentially useable heat and it can be recovered from the both sources. The exhaust gases are normally emitted at a temperature of over 400°C and they account for approximately 30% of the fuel energy input. The engine cooling systems include the engine cooling circuit and the lubricating oil cooling circuit and they can provide hot water at 80°C. The heat from the cooling system also accounts for approximately 30% of the fuel energy input. The heat-to-power ratio is generally used to indicate the balance between the electrical power that can be generated and the heat that can be recovered, expressed as the quantity of heat recovered per unit of electricity generated. It is an important factor for CHP plant selection and installation. Large-scale CHP generation using steam turbines has a relatively low electrical efficiency (10%-20%) compared to diesel engines, but gives a very high heat-to-power ratio (up to 10.0) and a very high grade heat resource [33]. The heat can be in the form of medium- or low-pressure steam from the turbine and can increase the system efficiency up to 80% [33]. In some cases, the excess heat is also used for hot water production or fed to the local network for district heating. For CHP systems using diesel engines, the heat-to-power ratio usually falls into the range 1.0-2.0, but generally decreases with size [33]. In industry, exhaust heat from the diesel engine can be used for steam generation. The coolant heat is a relatively low-grade heat source and it may be used for boiler feed water heating or for drying (depending on the type of dryer). However in practise, it is almost always only used for hot water or space heating. Recently a new concept for thermal storages is being developed for improving the efficiency of recovered heat in domestic or industrial applications [35]. 1.8. Work Scope and Objectives The present work contains three main parts: 1. Experimental investigations into a novel type of pyrolysis system - the Pyroformer intermediate pyrolysis system. 2. Investigations into the use of intermediate pyrolysis oils as fuels for a diesel engine generator. 3. An economic analysis of a Pyroformer-Engine CHP system. 31 The focus is primarily on a few types of waste biomass feedstock, according to different project requirement and feedstock availability. These include forestry and agricultural residues (waste wood and barley straw) mainly in Part 1, and industrial wastes (sewage sludge from the water treatment industry and de-inking sludge from the paper recycling industry) mainly in Part 2. In Part 1, full design details as well as operating principals of the Pyroformer are presented. Following that is the pyrolysis experiment section, where the wood pellets and barley straw pellets are processed in the Pyroformer system. Yields and characteristics of the liquid, gaseous and solid products are studied. At the end of this section, system mass balance and material energy flow are also investigated to evaluate the potentials of products for energy fuel application. Part 2 is carried out in collaboration with another two EBRI research projects for recovering sustainable energy from water treatment solid waste and paper industry wastes. Two types of the ready-made pyrolysis oils, namely sewage sludge pyrolysis oil (SSPO) and de-inking sludge pyrolysis oil (DSPO), are characterised. The oils’ elemental compositions, GC/MS spectrums, physical and chemical properties are analysed and discussed in respect to as diesel engine fuels. The SSPO is selected for testing in the engine generator. Conventional diesel fuel, a type of waste cooking oil derived biodiesel and two types of pyrolysis oil blends, i.e. 30/70 and 50/50 (on a volume basis) SSPObiodiesel blends are used. The engine performance and exhaust emissions under various engine operating conditions are investigated and compared between the fuels. Part 3 is carried out based on the experimental work and results obtained in Part 1, where two energy system models, i.e. wood Pyroformer-CHP system and sewage sludge PyroformerCHP system, are created using Aspen Plus process simulation software to extrapolate further system parameters. Following that, economic analyses are carried out on the system models in a variety of scales. Plant capital investments and costs, energy production costs, product selling prices, investment payback and internal rate of return are calculated and discussed. 1.9. Thesis Structure Chapter 1 is an introductory chapter providing background of the work, major term definitions and top-level project aims and objectives. Chapter 2 contains a review of relevant previous work and presents the novelty of this work. Chapter 3 describes the 32 major experimental equipment and methodologies employed. Chapter 4 addresses the intermediate pyrolysis reactor, and presents the results and discussion of the pyrolysis experiments. Chapter 5 presents the characterisation of the pyrolysis oils to be used in the engine tests. Chapter 6 presents the results and discussion of the engine tests. Chapter 7 presents the findings of the system economic analysis. Finally in Chapter 8, conclusions are presented, along with recommendations for further work. 33 CHAPTER 2 PREVIOUS WORK This chapter carries out a critical review of research literature related to the present work. It reviews the experimental approaches employed by researchers and serves as a resource for providing theoretical and methodological aid to the present work. Key findings from these studies are presented and their relevance is discussed. By introducing and comparing these works with the present work, it is also used to demonstrate the novelty of the present work. To reflect the scope of the present work as set out in the previous chapter, this review has been organised in four parts, namely the study of biomass pyrolysis by auger reactors, the study of pyrolysis oil characteristics, the study of pyrolysis oils as engine fuels and the economic analysis of the biomass pyrolysis-CHP system. However, considering the fact that intermediate pyrolysis technology is at the early stage of the research and hence has a limited amount of literature, studies on pyrolysis oil produced by fast pyrolysis are also included where relevant. 2.1. Biomass Pyrolysis and Auger Reactors Biomass pyrolysis reactors vary in the form and scale, depending on the specific objectives of the research carried out. The present work will use a laboratory-scale (20kg/h) intermediate pyrolysis system to produce fuel oils for diesel engine use. The use of auger reactors for biomass pyrolysis is a relatively new technology. Previously published work on this type of reactor can be found since 2001 [26, 36-44], most of which comes from the USA [36, 38, 40, 41, 44]. In this section, the Haloclean® system, which is considered the most similar auger reactor to that used in the present work, is presented, followed by reviews of a continuous auger reactor and a small-scale auger reactor. 2.1.1. Haloclean® Intermediate Pyrolysis System The Haloclean® pyrolysis technology was patented by Sea Marconi [26] in Italy in 2002 and used for thermal degradation of electronic waste. It was later adapted for intermediate pyrolysis of biomass at Forschungszentrum Karlsruhe (FZK) in Germany [37]. 34 The Haloclean® reactor can deal with a wide range of biomass feedstocks, including wood, grass, straw, and proceeding wastes such as rapeseed residues, olive stones and coconut residues, to produce pyrolysis oil. The processing conditions can be varied between a temperature of 350°C and 550°C and a solid residence time of 1 to 15 minutes, depending on the requirement of the oil production. The Haloclean® reactor compromises a single conveyor screw that transports the biomass feedstock horizontally through the reactor. Heat is provided by internal heating of the conveyor screw. In addition, pre-heated steel spheres are fed to the reactor inlet to assist in heating of the biomass feed. A closed loop for the spheres is realised by an automatic sphere separation and external recirculation system, during which the spheres are re-heated and then returned to the reactor. The pyrolysis system consists of a Haloclean® reactor, a hot gas filter, double tube condensers and an aerosol precipitator, as shown in Figure 2.1. Biomass Feed Spheres Circulation Precipitator Vapour/Gas Outlet Clean Gas Outlet Pyrolysis Reactor Bio-char Condenser and Liquid Collection Hot Gas Filter Char Cooling Figure 2.1 Haloclean® Pyrolysis System (adapted from [37]) Products are liquids, permanent gas and char. Figure 2.2 gives the product yields of the pyrolysis of rapeseed by the Haloclean® intermediate pyrolysis reactor at different temperatures. The system is designed to produce pyrolysis liquids and aerosol free gases for using in CHP systems. This is mainly due to the integration of hot gas filters and aerosol precipitators in the system. The already condensed tarry droplets and dust present in the pyrolysis vapours can be removed by hot gas filters and the vapour is condensed and collected afterwards. In this work, the authors stated that the liquids produced under these process conditions can naturally separate into a ratio of 2:1 organic phase and aqueous 35 phase under gravity. The oil produced normally has high energy content due to the high content of aliphatic and fatty acids. The permanent gaseous product (mainly contains CO, CO2 and CH4) was directed to an electrostatic precipitator for aerosol removal and then can be combusted in, for example, gas engines. Organic Phase 30% 41% 13% 16% 19% Aqueous Phase 42% 22% 17% Gas Organic Phase Aqueous Phase Gas Char Char Product Yields- 550 °C Product Yields- 450 °C Figure 2.2 Product Yields vs. Temperature for the Haloclean® Reactor (adapted from [37]) This paper mainly focuses on describing the system configurations and their advantages. Some results of product yields are given, but there is a lack of detailed product analysis in terms of product composition, physical and chemical properties. The authors mention several types of organic components may exist in the oil, but do not provide any proof. In addition, some terms used in this work, such as tar and coke are not clearly defined, resulting in the possibility of misinterpretation. At the end of the paper, the authors mention that the pyrolysis oil produced from rapeseed was tested in a Schnell Zündstrahlmotoren engine. But, again, there is no an experimental result or discussion provided. The pyrolysis system used in the present is a developed version of the original Haloclean® Reactor by Sea Marconi [26], which also produce similar intermediate pyrolysis. Therefore the present work provides an opportunity to extend this reviewed work in a further step, i.e. carrying out detailed oil characterisation and diesel engine test. These works will be addressed in this thesis. 2.1.2. Influence of Pyrolysis Conditions on Product Yields of an Auger Reactor Puy et al. [42] studied the influence of pyrolysis processing conditions on the yield and properties of the pyrolysis products in an auger reactor. The feedstock used was a mixture of forest residues from Scots pine and Black pine, dried to a moisture content of 7% and 36 prepared to particle size range of approximately 20 mm. A total of ten experiments were carried out, with the reaction temperature varied between 500°C and 800°C, residence time between 1.5 and 5 minutes and biomass feed rate between 3.9 and 6.9 kg/h (as shown in Table 2.1). The yields of liquid, solid and gaseous products and the pyrolysis oil properties were studied. 12 11 8 10 2 1 9 5 3 4 6 N2 7 Figure 2.3 Continuous Auger Reactor (adapted from [42]) (1) Feeding Hopper; (2) Nitrogen Flow; (3) Feeding Auger Conveyer; (4) Auger Reactor; (5) Furnaces; (6) Reactor Closure System; (7) Vessel for Solids; (8) Condensing System; (9) Liquid Collecting System; (10) Gas Expanders; (11) Gas Sampling Valve; (12) Gas Burner The auger reactor is externally heated by electrical furnaces. Three thermocouples along the length of the reactor are used for measuring the heating temperature. The pyrolysis system, as shown in Figure 2.3, comprises a feeding system, an auger reactor, a char vessel and a vapour condenser and liquid collection vessel. Both the feedstock feeder and the reactor use screw conveyors. Feedstock is continuously feed to the reactor. The auger conveyer in the reactor transports the feedstock passing through the reactor for pyrolysis. As soon as the pyrolysis reaction takes place, the produced vapour flows to the condenser downstream of the reactor with the carrier gas (nitrogen) at a flow rate of 5 L/min. The condensed fraction is then collected in the liquid collecting vessel. Permanent gas is sent to the gas burner for combustion. The char product and solid residue are transported to the solids outlet and collected in the vessel. 37 As shown in Table 2.1, a pyrolysis temperature of 500°C gives the highest liquid yield (4557 wt.%). The results for chemical composition analysis of the pyrolysis oil indicate that high reaction temperatures tend to lead to increased aromatic components, such as naphthalene and biphenyl, which are considered unfavourable for combustion engine fuels. The water content of the pyrolysis oils was found highly variable (between 11 wt.% and 19 wt.%) depending on the feedstock sample. This is due to the effect of temperature on yield of reaction water. Table 2.1 Product Yields vs. Pyrolysis Conditions for the Auger Reactor [42]. The authors conclude that at least 2 minutes of residence time is required in this type of auger reactor for achieving a complete pyrolysis reaction and minimum char production. A residence time of 3 minutes is the most favourable for pyrolysis liquid production. The highest liquid yield was 58.7% at a pyrolysis temperature of 500°C, a residence time of 5 minutes and a mass flow rate of 6.9 kg/h. A reduced feeding rate (3.9 kg/h) with less residence time (3 minutes) at the same temperature gave similar liquid yield (57%). The authors also discuss the chemical composition of some of the selected pyrolysis oils and indicate the oils are suitable for use as fuel oil; however there is no detailed study on the oil physical and chemical properties such as heating value and density. A following 38 assessment on system scale-up indicates that the auger reactor can be a plausible option for industrial plant. The authors suggest the possibility of mass processing residual forest biomass in remote locations by means of a mobile auger reactor pyrolysis plant in the near future. 2.1.3. Effect of Pyrolysis Temperature on the Yield and Properties of Pyrolysis Oils from a Small-Scale Auger Reactor The effect of pyrolysis temperature on Douglas Fir wood feedstock in a small-scale auger reactor was studied by Liaw et al. [44]. The auger reactor used in this work was a single screw stainless steel auger reactor having a length of 58.5 cm and an internal diameter of 10 cm. Heating is provided externally by a furnace mounted on the reactor wall, and the wall temperature can be varied from 200 to 600°C. No heat transfer medium is used inside the reactor. The wood feedstock was initially washed in hot demineralised water for reducing the content of alkali and alkaline earth metallic species, which are known to be strong catalysts for the charcoal yield and to be responsible for reducing pyrolysis oil yield. The dried feedstock was then comminuted to approximately 2 mm particles. The feeding rate was 10 – 12 g/min. The auger speed was set to 13 rpm, which gave a residence time around 1 minute. Nitrogen (flow rate 20 L/min) was used as carrier gas. A total of 500 to 600 g of wood was used for each run. The procedures for processing vapour and solid char products are similar to the work described before [26] In this process the external heating temperature to the reactor is the only variable. However, the authors state that the external heating temperature cannot represent the actual temperature of the feedstock, due to the fact that the heat transfer coefficient between the reactor wall and the biomass moving bed is low. Therefore, a temperature gradient (150200°C) between the biomass bed and the wall of the reactor exists. The experiment found that the pyrolysis oil yield of this type of reactor is comparable to that of fast pyrolysis in a fluidised bed reactor for the same feedstock. A wall temperature of 500°C, corresponding to a biomass maximum temperature of 330°C, gave the highest 59 wt.% liquid yield (with 19 wt.% char and 22 wt.% gas) and the maximum amount of biomass primary degradation products. The products from the secondary reaction in the oil, as well as the permanent gas, increased with increase in temperature. The water content of the oil was constant at around 10 – 12 wt.% when the wall temperature was above 420°C 39 (biomass temperature 270°C). This was lower than the water content of the oils from fluidised bed fast pyrolysis. The authors suggest that the reduced water content could be a result of the reduced alkali metal content of the wood. Beyond a general indication of the effect of pyrolysis temperature on the yield of liquid product in the auger reactor, the main focus of the discussion in this work related to the effect of temperature on the yield of chemical compounds in the liquid. However, there is no information on basic characteristics of the oils such as elemental content and heating value. 2.2. Characteristics of Pyrolysis Oils Sufficient knowledge of the composition and properties of the pyrolysis oil is essential, as it determines the possibility of the utilisation of the oils in specific equipment. Unlike fossil fuel oil, pyrolysis oil is derived from biomass feedstocks and hence the composition resembles that of biomass rather than fossil fuel, i.e. a high content of cellulose and lignin derived products rather than long-chain hydrocarbons, and a relatively high content of oxygen and nitrogen, but less sulphur. Moisture and hundreds of organic components from the degraded biomass can be found in varying proportions in pyrolysis oil, and therefore the physicochemical properties of the pyrolysis oil also vary. This section reviews oil characterisation approaches developed by researchers and presents typical characteristics of pyrolysis oils from similar pyrolysis processes. 2.2.1. Characterisation of Fractionated Wood Fast Pyrolysis Oil VTT Energy in Finland has been active in research on pyrolysis oil synthesis and refining for thirty years. The technology is based on fast pyrolysis and the main reactors used are circulating fluidised beds and bubbling fluidised beds. A good number of articles have been published on oil characterisation [45-48]. Sipilä et al. [46] introduced a compositional characterisation method by fractionation of the pyrolysis oil samples. Three kinds of fast pyrolysis oil derived from hard wood, Scots pine tree and wheat straw by fluidized-bed pyrolysis were analysed. Water was used as the first fractionation medium to separate the oil samples into two phases. Both water-soluble 40 and water-in soluble phases of each separated sample were analysed. A further fractionation and properties characterisation were carried out in the water-soluble phase. The work started with the analysis of the whole fast pyrolysis oil samples. Elemental content analysis and physical and chemical properties such as water content, density, viscosity, heating value, ash content, Conradson carbon residue (CCR), flash point and pour point, were measured in accordance with the ASTM and DIN standards. The pyrolysis oil samples were then fractionated by distilled water at a ratio of 1:10 to obtain the water-soluble fraction and water-insoluble fraction of the whole pyrolysis samples. Figure 2.4 Fractionation Scheme and Analysis Method for Pyrolysis Oil [46] An aliquot of the water-soluble fraction was then analysed by GC/MS for chemical composition and a pH meter was used to measure the acidity. The other aliquot was further extracted by diethylether on a 1:1 volume ratio. Both fractions from the diethyether separation were analysed by GC/MS and were processed for evaporation. Figure 2.4 presents the process flow of this fractionation method. This method achieved fractionation by use of two solvent stages. The method is useful to explore the correlations between the physical properties and chemical composition of the pyrolysis oils. Table 2.2 presents the main components found in the oil samples and some key physical properties of the three oils. 41 Table 2.2 Characteristics of the Fast Pyrolysis Oils [46] This analysis found that the content of low molecular mass carboxylic acids, i.e. formic, acetic and propionic acids, is high in the water-soluble fraction of the oil samples (6-10 wt.%), which is the source of the acidity of the pyrolysis oil. No such compounds are identified in the water-insoluble fraction (20-40 wt.% of the oil samples), which is found to mainly consist of high molecular weight compounds. Further investigation by pyrolysisGC/MS of this water-insoluble fraction indicated that these high molecular weight compounds correspond to lignin-derived materials. Analysis on diethylether extracted from the water-soluble fraction of the oil indicated that the ether-soluble fraction is rich in polysaccharides and low molecular mass degradation products of lignin such as acetic acid, glycolaldehyde and phenols, while the ether-insoluble fraction contains mainly levoglucosan and cellobiosan. From the analysis the author concludes that the water-soluble fraction contributes to the acidity of the pyrolysis oil most significantly, up to 90%. The reason for high viscosity, high flash point and high pour point is due to the lack of easy evaporation volatiles and 42 water-soluble materials, such as carboxylic acids and alcohols. The water-insoluble fraction and the ether-insoluble fraction of the water-soluble fraction provide the calorific content, as they contain mainly lignin-derived material. 2.2.2. Characteristics of Haloclean® Intermediate Pyrolysis Oils Sea Marconi Technologies [26, 43] carried out studies on their patented Haloclean® intermediate pyrolysis system at both laboratory and pilot scales. Various types of biomass feedstock, such as wheat straw, rapeseed, olive stones, beech wood, rice husk, coconut, rice bran and brewers grain have been used to produce the pyrolysis oils. Feedstocks were prepared in varies shape and type (chips, pellets or pieces up to 50 mm width). In this work, the authors state that all of the oil samples were subjected to thorough physicochemical characterisation for determination of kinematic viscosity, density, pH, total acidity number (TAN), content of metals, and GC/MS, as presented in Table 2.3. Table 2.3 Physical Properties of Pyrolysis Oils (Pyrolysis Temperature: 450 °C) [43] The authors describe that the biomass intermediate pyrolysis oils are dark liquids giving off a strong smell of carbonised organic material. Most of them are highly acidic. The compositions of the oils differ widely, depending on the type of feedstock, but it is found that methylphenol and dimethylphenol are the most abundant compounds (up to 20% of the oils). However, there is no detailed comparison and discussion of the oil characteristics. 2.2.3. Characteristics of Sewage Sludge Fast Pyrolysis Oil Font et al. [49] carried out research into the pyrolysis of sewage sludge in a laboratoryscale fluidised bed pyrolyser and conducted a detailed study on characteristics of the pyrolysis oil at the University of Zaragoza. 43 The sewage sludge feedstock was anaerobically digested residue, and was supplied dried. The feedstock was supplied from a local sewage treatment plant and contained 46.1 wt.% volatile, 6.6 wt.% moisture, 6.0 wt.% fixed carbon and 41.3 wt.% ash. The pyrolysis experiment was carried out in a 300 g/h fluidised bed reactor with a vapour condensation and collection system. Feed rate was 3.4 g/min and pyrolysis temperature was 530°C. Average vapour residence time was calculated as 1 second. The vapour was not filtered and condensed at about 450°C. The liquid yield was 49.2 wt.% with the water content about 50 wt.%. The authors state that the sewage sludge pyrolysis liquid can separate into three phases under gravity. A comprehensive characterisation for the whole oil and the three phases was carried out, with the results shown in Table 2.4. Table 2.4 Characteristics of Sewage Sludge Pyrolysis Liquids [49] The whole liquid was found to be typical of pyrolysis oils, having a dark brown colour, nonhomogeneous and bad-smelling. The oxygen content of the liquid was quite high (38.2 wt.%) leading to only moderate heating value. The three phases obtained under gravity were 10 vol.%, 60 vol.% and 30 vol.% of the whole liquid from top to bottom. The top phase did not contain water and had high carbon and hydrogen content (76.9 wt.% and 11.8wt.% respectively). GC-eluted compounds presented were mainly in alkanes and alkenes from C12 to C24, and steroids from C27 to C29, such as ergosterol and cholesterol 44 from vegetal and animal fats. Hence the top phase had a good heating value of 41 MJ/kg and was found to be miscible with diesel fuel. The middle phase was sludge-like and contained a high level of water (34.4 wt.%). Hence the heating value was quite low (16.9 KJ/kg). GC/MS found that this phase contains large amounts of water-soluble organics including low chain acids, phenols and cresols etc. The bottom phase was a mixture of water-insoluble compounds and moderate water (12.4 wt.%), but had a good heating value (30.6 KJ/kg ). A high content of nitrogen and sulphur were found in middle and bottom phases (7.0 and 0.8 wt.% for the middle phase and 8.8 and 1.0 wt.% for the bottom phase). The authors concluded that further upgrading treatment to the middle and bottom phases would be necessary prior to their utilisation in conventional fuel oil applications. A further review carried out by Font et al. [50] concluded that the sewage sludge pyrolysis oils, in contrast to the oils derived from green biomass which normally produce a single phase, normally separate into two or three phases under gravity. Most researchers report a two phases (organic and aqueous) separation in the pyrolysis liquid, but some also identify two differentiated organic phases (a light one and a viscous one) and one aqueous phase. The oil-like organic phase can have a heating value of 25-44 KJ/kg and hence is considered to be a good energy fuel either alone or in blends with diesel or biodiesel. 2.3. Engine Studies Pyrolysis oils are believed to have potential as a substitute for petroleum-based liquid fuels. Research on the application of pyrolysis oil in different types of combustion equipment i.e. boilers [51-56], gas turbines [57-59] and diesel engine [60-70], has been carried out all over the world since the mid-1990s. Studies on pyrolysis oil fuelled diesel engines are particularly interesting, as this can be the most efficient way to convert biomass to electricity in CHP schemes at relatively small scale. This section reviews these studies. 2.3.1. Performance of Wood Pyrolysis Oil Fuelled Diesel Engine Solantausta et al. [60] carried out a study on the performance and exhaust emissions of a hard wood pyrolysis oil fuelled diesel engine. The work included an evaluation of the ignition, combustion, and exhaust emission characteristics of wood pyrolysis oil in a 0.5L, 45 4.8kW, single cylinder Petter AVB diesel engine, having a compression ratio of 15.3:1 and a speed of 2000 rpm. The pyrolysis oil used was derived from hardwood by fast pyrolysis and supplied by ENSYN Technologies (Canada). The oil had a high moisture content (20.5%), a relatively low calorific value (HHV 18MJ/kg), a high viscosity and poor ignition properties. N-Cet (ICI, UK) was added to the oil at different concentrations (3, 5 and 9% vol.%) as an ignition improver. Conventional diesel fuel, a type of low quality reference fuel (cetane number = 35.2) and a cetane-enhanced ethanol were also tested in the same diesel engine for comparison. The engine was started and warmed up by using diesel fuel. Fuels were switched from diesel to ignition-enhanced ethanol, pyrolysis oil and low quality oil in turns. With a small amount of ignition improver in the pyrolysis oil, the engine started successfully, although rapid nozzle coking was encountered. The author attempted to make a mixture of diesel and pyrolysis oil to reduce the nozzle coke, but it was found that pyrolysis oil and diesel were not miscible. These problems were later solved by using ethanol as an additive (the ratio of blending was not specified), as ethanol is an effective injector nozzle cleaning solvent and largely miscible with pyrolysis oil. Difficulty in pyrolysis oil ignition, but a rapid burn of the pyrolysis oil on ignition, especially when the ignition improver was added at higher than 5%, were found according to the diagrams of the cylinder pressure and injector needle-lift trace. For exhaust emissions, the concentrations of CO, HC and NOx in the exhaust gas of pyrolysis oil with 5% ignition improver was comparable to those of conventional diesel. Overall, the authors concluded that the pyrolysis oil in a blend with ethanol or ignition enhancer would be fine for using as a diesel engine fuel, but for having a good engine performance and acceptable exhaust emission, a dual-fuel operating mode, i.e. pyrolysis oil with diesel fuel pilot injection, was recommended. 2.3.2. Combustion Characteristics of Wood Fast Pyrolysis Oils in a Diesel Engine Shihadeh [66, 67] carried out studies on the combustion characters of two kinds of biomass pyrolysis oil in a high speed (4500 rpm) single-cylinder Ricardo diesel engine. Two types of wood pyrolysis oils made by ENSYN Rapid Thermal Process and NREL Vortex Ablative Pyrolysis were used. The objectives of this work were to evaluate the characteristics of the ignition and heat release profile of the pyrolysis oil by experimental investigation and numerical modelling and to compare them to those of diesel fuel. The 46 engine was started and warmed up with conventional diesel fuel for half hour to achieve steady-state operation and then switched to pyrolysis oil for experimental investigation. The engine was successfully operated fuelled by pyrolysis oil only, and the key findings of the engine operation were: Thermal efficiency of the pyrolysis oils is close to that of diesel fuel. It was difficult to achieve a reliable ignition with pyrolysis oil, without a moderately pre-heated intake air (about 55°C). Fuel ignition delay of the pyrolysis oils is longer than that of diesel fuel. The heat release peak of the pyrolysis oils is lower than for diesel fuel. The authors explain that the ignition delay of the pyrolysis oil is due to the content of water (16.9wt% for NREL and 26.3% for ENSYN) as well as the content of some heavy organic compounds. This is concluded from the results of the numerical model of fuel vaporisation, ignition, and combustion, which shows that the heat release profiles of the pyrolysis oil are predominantly affected by the water and heavy organics, which can slow down the combustion chemistry kinetics. The authors also state that even though modifications on the engine and fuel system have been implemented, it was still not possible to operate the engine smoothly for more than six hours on pure pyrolysis oil. This was mainly because of the damage caused to the injector nozzle and fuel lines. In addition, a great amount of carbon deposit in the combustion chamber and exhaust valves was observed. 2.3.3. Performance and Exhaust Emissions of Fast Pyrolysis Oil Fuelled Diesel Engines Working In Dual-Fuel and Oxygen Enrichment Conditions Blowes [71] carried out studies on the performance and exhaust emission of diesel engines fuelled by fast pyrolysis oil. In the first study, fast pyrolysis oil (provided by Aston University) having water content of 24.98 wt.% and solid char content of 0.9 wt.% was used. The oil also had high acidity (pH=2.585), high viscosity (43.8 cSt for aged oil) and rather low heating value (LHV=15.8 MJ/kg). The engine involved in this work was a 6 cylinder, naturally aspirated, 230 kWe at 750 rpm Ormrod stationary diesel engine. An additional fuel pump and injector was installed in each cylinder to allow the engine to operate in dual-fuel mode (diesel pilot injection). 47 The pilot fuel (diesel) was injected at 14° BTDC and the main fuel (fast pyrolysis oil) was injected at 21° ATDC. The author stated that virtually complete combustion of the pilot diesel fuel was observed, but not of the main pyrolysis oil, according to the fact that measured CO emission level in the exhaust gas was high (2,057 ppm to 3,475 ppm, equivalent to 21.5 g/kWh to 36.6 g/kWh) and smoke in the emission was significantly visible. NOx emissions were low (266 ppm to 384 ppm, equivalent to 4.6 g/kWh to 3.2 g/kWh) compared to diesel only (586 ppm). This was due to the low mean combustion temperature of the pyrolysis oil. The author then carried out a further study on a fast pyrolysis oil fuelled Lister Petter diesel engine with oxygen enrichment. The engine was a 1.8 L, two-cylinder stationary engine that can deliver a power of 10.5 kWe at 2,500 rpm. The same type of fast pyrolysis oil was used. Additional oxygen was supplied with the air to assist the combustion of the fuel. The results showed a complete combustion of the fuel. CO emission was significantly reduced to 560ppm (equivalent to 4.32g/kWh) compared to that in dual-fuel mode (up to 3475ppm), but NOx became much higher, up to 2,405ppm (21.31g/kWh). No smoke was visible in the oxygen enrichment mode, but there was excessive smoke when the system was switched to ambient air. The author suggests using emission treatment equipment to reduce NOx emissions. Overall, the author states that both of the experiments encountered problems of deterioration in fuel combustion and seizure of the fuel injection system, as indicated by unstable engine operation and CO emission increase after a certain period of time. The author concluded that this was due to the presence of abrasive impurities in the pyrolysis oils. 2.3.4. Performance of a Pyrolysis Oil-Diesel Blend Fuelled Diesel Engine Performance and exhaust emissions of a pyrolysis oil-diesel blend fuelled diesel engine was studied by Singh et al. [72]. The pyrolysis oil used in this study was derived from a mixture of waste frying oil and castor oil. Physical properties of the pyrolysis oil were significantly improved compared to the pure oil and the authors claim that it was comparable to those of the diesel fuel. A Kirloskar VT1 7.73kW stationary diesel engine was used. The engine thermal efficiency and exhaust emissions were investigated and analysed. 10/90, 30/70 and 50/50 pyrolysis oil-diesel blends were tested. 48 It was found that the brake specific fuel consumption (bsfc) of the pyrolysis oil blends was higher than that of diesel fuel, and the less pyrolysis oil in the blend, the lower the fuel consumption. The author explained that the decrease of bsfc was possibly due to the oxygen content in the pyrolysis oil and hence in the blends. Exhaust gas temperature and NOx emissions were found to be higher when the engine ran with the pyrolysis oil-diesel blends rather than pure diesel, and the tendency was to increase with increasing pyrolysis oil blending ratio. The author explained that the cause of high temperature was the high viscosity of the pyrolysis oil, which can lead to an increased ignition delay and rapid fuel combustion. CO and HC emissions of the blends were found to be similar to those of diesel fuel. 2.4. Economic Evaluations of Energy Production by Pyrolysis There have been a number of studies done on the economic evaluation of fast pyrolysis oil production and the use of these oils for power and heat generation since 1993 [21, 73-80], particularly by Bridgwater et al. [73-75] at Aston University. These works have developed a clear route and methodology for estimating the capital investment, operating costs and product selling prices, and they also serve as resources for data and references for realistic assumptions. Some of the studies compare different biomass to energy technologies, others focus specifically on pyrolysis. The most relevant of each type has been selected for review here. 2.4.1. A Techno-Economic Comparison of Power Production by Biomass Fast Pyrolysis with Gasification and Combustion Bridgwater et al [74] carried out this techno-economic comparison of power production from wood chip by various thermochemical conversion technologies (fast pyrolysis, gasification and combustion) in 2002. This work modelled power plants in the range 1-20 MWe power plants based on different biomass energy systems (i.e. fast pyrolysis to diesel engine, combustion to steam cycle, and air-blown gasification to gas engine), assuming a project based in central Europe in the year 2000 (priced in €). Analysis included comparisons of system overall efficiency, capital investment and energy production costs. This work began by estimating the system energy performance. For the fast pyrolysis and diesel engine (PyrEng) system, the net system efficiencies were the quotients of the 49 expected annual electricity output to the grid and the total energy value of the pyrolysis oil and auxiliary diesel fuel. The quoted properties of pyrolysis oil and data of the pyrolysis plant were obtained from small scale experiments, but were adapted to commercial-scales through consideration of potential differences in feedstock and product yields. The project capital costs were presented as the total plant cost (TPC) that is the complete cost to the developer including equipment, installation and commission. A “Learning Factor” (a measure of how much the cost is expected to reduce with a doubling of installed units) of 10% was applied to the capital costs for the more novel plant items (including the pyrolysis plant) when comparing with well-established technology (e.g. combustion and steam cycle). The energy production cost (Cost of Electricity, CoE) was calculated taking into account plant capital amortisation and associated maintenance and overheads costs, and feedstock, labour, utility and other material costs. The analysis showed that the PyrEng system was competitive with other established systems, as CoE varied only slightly between the systems at all scales. CoE in the PyrEng system reduced with increasing of plant scale, and converged at larger scales with the mean electricity price paid in the EU by a large consumer. This implied potential economic viability when selling electricity directly to large consumers. As well as a close-coupled pyrolysis/generation system, decoupling of pyrolysis oil production from electricity generator was also investigated in this work. It was found that the arrangement of using several remote generators supplied by a single central pyrolysis plant would be more viable than using multiple pyrolysis plants feeding a centralised power station. The authors also commented that profitability in a shorter term may also be achieved in several carefully selected project scenarios, such as choosing locations with high electricity prices, seeking low cost feedstocks (e.g. waste materials), incorporating small-scale CHP schemes and selling excess char product. 2.4.2. A Techno-Economic Assessment of the Use of Fast Pyrolysis Bio-Oil from UK Energy Crops in the Production of Electricity and Combined Heat and Power Rogers [80] analysed the cost of electricity and CHP generation using fast pyrolysis oil from dedicated UK energy crops - short rotation coppice (SRC) willow and miscanthus. This work was carried out based on a model of an energy system employing bubbling fluidised bed fast pyrolysis reactors and diesel engines at a range of scales. Arrangements of decoupled system were also considered. The project capital and operating costs and 50 system performance data (such as the pyrolysis yield and energy content) were obtained from published literature. The analysis went beyond Bridgwater’s work [74], taking into account planting of energy crops, harvest and transport to the generator’s terminals as well as energy crop subsidy, renewable energy incentives payments and selling of char as fuel. The author concluded that both SRC willow and miscanthus would be suitable for pyrolysis and CHP generation, but to make the project viable an energy crop subsidy was required. Feedstock purchase accounted for 43-47% of the total costs, but oil transport cost was unlikely to be a major factor. In the decoupled scheme cases (central pyrolysis plant feeding various remote generators), use of oil storage was found to have a significant impact on reducing the electricity production cost. Sales of excess char as a solid fuel could be an income stream to the plant, but it did not give a substantial impact on the overall profit. 2.5. Novelty In light of the preceding review, the aspects of novelty of the present work are summarised below. Firstly, the present work uses a recently patented Pyroformer intermediate pyrolysis system to produce pyrolysis oil (the main product), permanent gas and char. Intermediate pyrolysis is different from fast pyrolysis for oil production, using longer feedstock residence time anticipated to produce pyrolysis oil that is suable for use as an engine fuel. Sea Marconi Technologies and FZK have used intermediate pyrolysis reactors since 2002, but the research progress appears to have been slow and there has been only very limited, superficial publication. No rigorous studies of the performance of the Pyroformer or of similar auger-screw intermediate pyrolysis processes are available in the published literature. Secondly no studies have been found that produce intermediate pyrolysis oils from sewage sludge and de-inking sludge using intermediate pyrolysis of any kind. There are no studies considering use of the sewage sludge or de-inking sludge pyrolysis oils derived from any type of pyrolysis process as diesel engine fuels. 51 Finally, no studies are available on the economic evaluation of a bioenergy CHP system based on intermediate pyrolysis with a diesel engine. 52 CHAPTER 3 METHODOLOGIES This chapter mainly presents the specifications of the experimental equipment and the methodologies used in this work. 3.1. Feedstocks 3.1.1. Wood and Barley Straw Pellets The woody feedstock used in the present work is compressed pine wood pellets purchased from Countrywide Farmers [81]. The pellets consist of compressed ground pine wood residue particles from sawdust and woodchips. The pellets have a nominal particle size of approximately 6 mm diameter and 15 mm length. The moisture content of these wood pellets is less than 10 wt.%. The barley straw pellets are produced from barley straw residues. They were purchased from Straw Pellets Ltd. [82] and they have similar dimensions to the wood pellets. The characterisation of these feedstocks is presented in the next chapter. 3.1.2. Sewage Sludge Sewage sludge originates form the waste water treatment process and it is the residue from the final anaerobic digestion step. Defined as a pollutant, the sludge can contain various inorganic, organic and heavy metal substances depending on the waste water source and treatment methods. The sewage sludge used in this work was supplied from the Severn Trent Water Ltd’s Netheridge treatment plant [83] in conjunction to another research project at EBRI [84].It had been dewatered before being received, but was further dried in an oven at a temperature of 65˚C for 5 days until almost moisture free. The dry sludge was thereafter broken down into small chunks and then ground into fine powder. The dry sludge powder was blended with 10 wt.% water and pelletised into 5 mm diameter and 10 mm length. 3.1.3. De-inking Sludge De-inking sludge is a solid residue generated during the de-inking stage of recovered fibre paper products manufacture. It contains mainly of fibres and inert fillers, together with small amounts of inks and pigments. The sludge as recovered has a high moisture content which can be reduced to approximately 35-40 wt% by a mechanical dewatering process, a 53 high inerts content between 40-70 wt% (dry basis) which is predominately calcium based, and a low HHV (4-7 MJ/Kg) [85]. Approximately 100 kg of wet de-inking sludge was obtained from Kimberly Clark Ltd’s Flint mill [86]. The de-inking sludge was dried to <15 wt.% moisture content in a funditor tray drying oven at approximately 70C for 12 hours and subsequently pelletised to 5 mm diameter and10 mm length pellets. 3.2. Equipment 3.2.1. The Pyroformer The Pyroformer intermediate pyrolysis reactor was recently patented by A. Hornung et al. [87] of the European Bioenergy Research Institute (EBRI) at Aston University. The Pyroformer is a horizontal cylindrical reactor and uses screw conveyers to transport the biomass feedstock inside the reactor (as shown in Figure 3.1). The pilot-scale Pyroformer used in the present work at EBRI is made from carbon steel and has a length of 180 cm and an internal diameter of 20 cm. Five Ceramic electrical heating units (2×3 kW + 3×2.5 kW = 13.5kW are mounted on the outside of the reactor wall and provide external heating (up to 530°C wall temperature) to the reactor. Feedstock Vapour Heat 1 3 2 5 6 Heat 4 Heat Char Figure 3.1 Schematic of the Pyroformer intermediate pyrolysis reactor (adapted from [87]) (1)Biomass Feed Inlet; (2) Inner Screw; (3) Gas/Vapour Outlet; (4)Outer Screw; (5) Char Outlet; (6) Heating Units The reactor is designed to handle solid biomass feedstocks in various forms and sizes, including high-quality feeds such as rapeseeds and wood pellets, through higher ash biomass residues such as wheat straw pellets, to difficult waste feedstocks such as sewage sludge, municipal waste and paper-processing residues. In this work, well-prepared pelletised feedstocks (less than 10% moisture content) are used for pyrolysis experiments 54 (see Section 3.1). They are produced in an appropriate size and regular geometry that favour a convenient feeding. Use of these pellets can also assist the experiments to produce a “theoretically” consistent quality of products for analysis. The pellet feeds to the present reactor are at a range of dimensions between 2 mm* 5 mm to 5 mm*15 mm (diameter* length). It is worth noting that the scaled-up systems can take feeds at larger sizes. The reactor comprises two horizontal counter-rotating co-axial screws, where the inner screw conveys the fresh biomass feedstock along the length of the reactor and the outer screw transports part of the product char backward to re-join the fresh biomass in the inner screw, thus cycling some of the char within the reactor for heat exchange and to promote further cracking. The outer screw contains slots at both ends, which allow passage of solids between the outer and inner screw passages. This design allows the reactor to make full use of the contact between the pyrolysis vapours and the char, in order to achieve a maximised cracking of the high molecular weight organic compounds in the pyrolysis vapours. The char thus acts not only as a heat transfer medium, providing heat to the biomass feedstock, but also as a catalyst to improve quality of the pyrolysis liquid yield. The movement of material through the reactor is illustrated in Figure 3.1. Feeding The biomass feeding is achieved by an automatic feeding hopper, where a constant feeding rate can be set. The biomass feedstock passes through a feeding chute (as shown in Figure 3.2) before it is fed into the reactor. The chute contains two evacuation valves in series, which open and close alternately every second in order to minimise any air intake or pyrolysis vapour leakage via the feedstock inlet. The pilot-scale Pyroformer is designed to process up to 20 kg biomass per hour. However, the feed rate is in practice limited by the size and wetness of the feedstock. This is because some of the pellets can be broken down in the feeder, and when they encounter the high temperature at the end part of the feeder chute they can became agglomerated. Continuously feeding can then lead to a blocked inlet which will terminate the experiment. Hence the maximum feeding rate for different types of feedstock needs to be established before carrying out the pyrolysis experiment itself. Screws The carbon steel made co-axial rotating screws, as the feedstock transport and char recycle mechanism, are the core part of the Pyroformer. The inner screw shaft of the 20 kg/h 55 Pyroformer has a length of 1234 mm and a diameter of 82mm, and the outer screw shaft has a length of 1015 mm and a diameter of 180 mm. The inner screw and outer screw have 14 and 9 screw sections respectively, via which the biomass feedstock and a portion of char product can be transported along the length of the reactor. The outer screw has 4 slots and 6 slots at front end and back end respectively, which can allow the feedstock and char fall into or out of the outer screw for pyrolysis reaction. The screw geometry and detailed dimensions are given in Section 4.1.1. The rotational speed of both screws can be varied from 0 to 15 rpm in either clockwise or anticlockwise directions. The detailed parameters and calculations of the screws regarding the feedstock residence time and char to biomass mixing ratio will be discussed in Chapter 4. 3.2.2. The Pyrolysis Process The intermediate pyrolysis system, as shown in Figure 3.2, is comprised of a feeding hopper, the Pyroformer reactor, hot gas filter candles for removal of entrained char and solid particulates, a shell and tube water cooled condenser for condensing of the liquids and an electrostatic precipitator for aerosol removal [88]. 1 11 Biomass Feedstock 2 Pyrolysis Vapour 4 8 7 6 5 Clean Vapour 3 Biochar 9 10 Gas to Flare 16 15 Coolant Out 14 Coolant In 12 Aerosolfree Gas Gas to Store Pyrolysis Oil Permanent Gas 13 Figure 3.2 Schematic Diagram of the Intermediate Pyrolysis System (1) Feeding System; (2) Feeding Chute; (3) Electric Motors; (4) The Pyroformer; (5) Inner Screw; (6) Outer Screw; (7) External Heating Jackets; (8) Vapour Outlet; (9) Char Pot; (10) Stands; (11) Hot Gas Filter; (12) Shell and Tube Condenser; (13) Oil Vessel; (14) Electrostatic Precipitator; (15) Gas Vessel; (16) Gas Flare 56 In the experiment, the inner and outer screws are started with the set rotational speed and direction (inner screw anticlockwise and outer clockwise). The Pyroformer is then gradually heated to the set point wall temperature (450°C in most cases), with a continuous purge of N2. The reactor is then fed with pelletised feedstock at a set feeding rate (up to 20kg/h depending on the feedstock) via a feed hopper. The pyrolysis vapour/gas will come out of the vapour outlet as soon as the reaction commences. The pyrolysis vapour first passes through the hot gas filter candles (heated to the same temperature as the Pyroformer) for removal of entrained solid particulates, and then is routed to a shell and tube water cooled condenser, where the majority of the pyrolysis vapours are condensed to form pyrolysis oil. Permanent gas is then routed to an electrostatic precipitator (ESP) for aerosol removal. A portion of char product is internally recycled, and the remainder which is not recycled proceeds through the inner screw to the char exit, and is collected in the char pot. The experiment is estimated to establish a steady-state typically 60 minutes after the feeding commences (depending to some extent on the screw speeds). The steady state is when the char recycle rate and (therefore final extraction rate) has become constant, and the thermal environment within the reactor has stabilised. Product samples of liquid and permanent gases are collected for analysis at this stage. To obtain sufficient products, at least another 60 minutes of steady-state operation is required. When the experiment completes, the operator changes the direction of the outer screw rotation so that the retained char can be transported to the char pot for collection. 3.2.3. Lister Engine The diesel engine employed in the present work is a Vidhata 2VL-12 15kW Lister type stationary cold start (CS) diesel engine manufactured by Basant Products India (Figure 3.4). The Lister CS engine was initially designed and manufactured by the British Lister Company in the 1930s based on the design of a Lister L type petrol engine. After the English Lister company closed in 1987, some Indian manufacturers took over the production of these types of engine, renaming them ‘Listeroids’. Renowned for its simple operation, long durability, fuel flexibility and low cost, the Lister type engine is particularly widely used in the rural parts of developing counties, for work such as smallscale electricity generation and pump driving etc. The main reasons for selecting this type of engine for the present work are the engine’s cost, and tolerance of a wide range of fuel quality. 57 Figure 3.3 Lister CS diesel Engine and Generator Table 3.1 Technical Specifications of the Engine and Generator Lister Engine Unit Model Parameters Vidhata TV-MS-120 Cylinders 2 Bore mm 120 Stroke mm 139.7 Displacement Litre 3.2 Compression Ratio 18:1 Cooling system Water Cooling Fuel Injection Direct Injection Aspiration Nature Rated Speed rpm 950-1000 Maximum Power kW 15 Generator Model Power Voltage Prime Mover speed Vidhata AVR Generator kW/kVA 12/15 V 380-440 rpm 1500 Power Factor 0.8 The technical specifications of the Lister engine and generator are given in Table 3.1. Each engine cylinder head has one air intake valve and one exhaust valve. Bosch Mico 034 fuel 58 pumps are used to control the fuel supply, and Bosch Mico diesel injectors are used for fuel injection. The engine starter is powered by a 12V 100AH battery. The engine runs at a constant speed and the speed is regulated by a helical spring-loaded self-governing system for various load conditions. A 15KVA three-phase AC generator is coupled to the engine flywheel for converting shaft power into electric energy. The engine operates at a fixed speed of 1000 rpm for a constant AC electricity output. The ratio of the diameters of the engine flywheel and generator driving wheel is 3:2. The detailed engine test layout is described in Section 3.3.4. 3.3. Experimental Methods 3.3.1. Feedstock Characterisation Feedstock characterisation includes the proximate analysis, ultimate analysis and determination of the gross heating value. This section only presents brief information for the feedstock analysis. Detailed sample analysis produces are shown in the Appendix 1. 3.3.1.1. Proximate Analysis Proximate analysis is a method that quantitatively determines the distribution of products obtained from a carbonaceous material sample under specified heated conditions [89]. The analysis separates the sample products into four groups, (1) moisture; (2) volatile matter, consisting of vapour and gases released during pyrolysis; (3) fixed carbon, the non-volatile fraction of biomass; and (4) ash, the inorganic residue remaining after combustion. In the present work, the analysis was carried out on a Mettler Toledo TGA 1 Analyser. TGA is a method of thermal analysis commonly used to look into the changes in physical and chemical properties of materials as a function of increasing temperature (with constant heating rate), or as a function of time (with constant temperature or constant mass loss) [90]. In the present work, it is used to determine mass loss characteristics of the biomass sample due to decomposition and oxidation. The Pyrolysis TGA method is carried out in an inert environment. It is used for the analysis of moisture content and volatiles. For analysis 5 mg of ground of biomass sample is placed in a measuring crucible and the crucible is heated in an atmosphere of N 2 with a temperature programme of: 59 Heating from ambient to 50°C at a heating rate of 5 °C /min Holding for 5 minutes at 50 °C Heating from 50 °C to 105 °C at a heating rate of 5 °C /min Holding for 5 minutes at 105 °C Heating from 105 °C to 900 °C at a heating rate 25 °C /min Holding for 15 minutes at 900 °C Cooling to ambient at a cooling rate of 25 °C/min Water content is calculated as the weight difference of the original sample and the sample at 105°C [91]. Volatiles content is determined as the weight difference of the original sample and the remaining solids of pyrolysis. This solid contains fixed carbon and ash. To find out the content of both substances, combustion TGA needs to be performed. Combustion TGA is a TGA method carried out in a combustion environment. It is used for ash content analysis. The same temperature programme as for pyrolysis TGA is used, but air is supplied to the TGA instead of N2. When heated, the organic component of the sample is combusted and ash remains in the form of solid. Ash content is determined as the weight of the ash after cooling to room temperature, and fixed carbon is determined as the weight difference between the ash and the solids of pyrolysis. 3.3.1.2. Ultimate Analysis Ultimate analysis is the determination of the elemental components of a material sample including carbon, hydrogen, nitrogen, sulphur and oxygen etc., as found from the gaseous products of a complete combustion [92]. The determination of carbon, nitrogen and sulphur etc. includes that present in the biomass organic. The hydrogen determination includes that in the organic substances. Oxygen is usually calculated by difference. Ultimate analysis gives the weight percentage of these major elemental components in the biomass. The analysis in the present work was carried out externally by Medac Ltd [93]. 3.3.1.3. Gross (higher) Heating Value Gross (or higher) heating value is the amount of heat produced by the complete combustion of a unit quantity of fuel with the water vapour product condensed to room temperature (25°C). The gross heating value of the biomass was determined using a Parr 6100 bomb calorimeter. Weighted oil samples are placed in a Parr 1108 combustion bomb 60 and ignited by heating wires in an oxygen enriched environment. The system automatically logs the temperature increase in the combustion bomb and calculates the temperature increase rate and gross heating value of the weighed sample. 3.3.2. Oil Characterisation Oil characterisation here refers to the determination of elemental, compositional, physical and chemical properties of the various liquids involved (pyrolysis oils, biodiesel, fossil diesel, and pyrolysis oil and biodiesel blends). 3.3.2.1. Composition The elemental analysis (CHNOS) is the same as the biomass ultimate analysis described earlier, and was also carried out by Medac Ltd using a Carlo-Erba EA1108 CHNS-O analyser by total oxidation. The results of elemental analysis can be used to calculate the energy content and the amount of air required for fuel combustion. Compositional analysis of the pyrolysis oil was conducted by Gas chromatography/ mass spectrometry (GC/MS), which is an analytical method that identifies the molecular composition of the oil sample from the features of gas-liquid chromatography and mass spectrometry of different substances. The measurement was carried out using a HP 5890 Series II plus Gas Chromatograph and a HP 5972 Series Mass Selective Detector. Oil samples were dissolved in chloroform at 1:10 sample-solvent ratio. An Agilent J&W DB 1701 Capillary Column (60 m×0.25 mm i.d.; film thickness 0.25 μm) was used in the GC and helium was used as the carrier gas. The oven heating profile was set at an increase of 3°C per minute from 40 to 290°C, with the final temperature maintained for 20 minutes. Initial injection temperature was 310°C. The full analysis takes 104 minutes in total. The mass spectra obtained from analysis were processed by MassFinder 4 software, where the major peaks of the chromatograph were identified and integrated according to the NIST mass library. 3.3.2.2. Ignition and Combustion The cetane index and HHV determine the ignition property and combustibility of a fuel oil. Oil distillation is used for calculating the cetane index of the fuel oil. The results are expressed as percent volume recovery versus temperature. The measurement was 61 performed in accordance with ASTM D86. A 100 ml oil sample was placed in a round bottom flask and manually distilled at ambient pressure. The volume of condensate and the corresponding vapour temperature readings were systematically recorded. Cetane number is a measurement of the ignition quality of a diesel fuel during the compression-ignition in a diesel engine cycle. Measurement of the cetane number for a given diesel fuel requires a specially designed Cooperative Fuel Research engine. When such a test engine is not available, the calculated cetane index is usually used as a substitute for the cetane number to give an estimated cetane value. Calculation of the cetane index of the oil samples was based on Four Variable Equations Method in accordance with ASTM D4737 by using the oil density at 15°C and the temperatures for 10%, 50% and 90% distillation recovery of the fuel oils. The calculated cetane index (CCI) is given by [94]: 𝐶𝐶𝐼 = 45.2 + 0.0892 ∙ 𝑇10𝑁 + (0.131 + 0.901 ∙ 𝐵 × 𝑇50𝑁 ) + (0.0523 − 0.42 ∙ 𝐵) × 𝑇90𝑁 + 0.00049 ∙ [(𝑇10𝑁 )2 + (𝑇90𝑁 )2 + 107 ∙ 𝐵 + 60 ∙ 𝐵 2 ] (3.1) where: B = [e (-3.5) (DN)] - 1, DN = D - 0.85, D = Density at 15°C, g/ml, determined by ASTM Test Methods D1298 or D4052, T10 = 10 % distilled oil recovery temperature, in °C, determined by Test Method D86 and corrected to standard barometric pressure, T10N = T10- 215, in °C, T50 = 50 % distilled oil recovery temperature, in °C, determined by Test Method D86 and corrected to standard barometric pressure, T50N = T50- 260, in °C, T90 = 90 % distilled oil recovery temperature, in °C, determined by Test Method D86 and corrected to standard barometric pressure, T90N = T90- 310, in °C. HHV of the oil samples was determined in accordance with ASTM D420. A Parr 6100 calorimeter and a Parr 1108 combustion bomb were used as previously described in the feedstock characterisation. 62 3.3.2.3. Atomisation The water content, density, viscosity and surface tension of a fuel oil are the key factors that determine the fuel atomisation and spray quality on injection. These properties thus affect the quality of combustion and ultimately the engine power output. The water content of the oil samples was determined using a Mettler Toledo V30 Compact Volumetric Karl Fischer (KF) titrator in accordance with ASTM E203. The result was corrected to weight percent of the total sample. The density of the oil samples was measured by a Mettler Toledo 30PX densitometer. Liquid samples are injected into a measuring cell and the device calculates the liquid density by measuring the light reflection from the liquid surface. Kinematic viscosity, which refers to the resistance to flow of a fluid under gravity, was measured in accordance with ASTM D445 with a Cannon-Fenske Routine glass capillary viscometer. About 5 ml of oil samples flows through the capillary of the viscometer under gravity at 40°C. The time for the sample flowing through the capillary is recorded, and the kinematic viscosity is then calculated according to the following equation [95]: 𝑣 = 𝐶 ∙ 𝑡1,2 (3.2) where, ν1,2 = determined kinematic viscosity values for ν1 and ν2, respectively, mm2/s, C = calibration constant of the viscometer, mm2/s2, and t1, 2 = measured flow times for t1 and t2, respectively, s. The kinematic viscosity result, ν, is calculated as an average of ν1 and ν2. Surface tension is a physical property of a liquid resulting from the cohesive forces between liquid molecules. Dynamic surface tension of the pyrolysis oil was measured by a SITA pro line t15 bubble pressure tensiometer, in accordance with ASTM D3825. The procedure is carried out by immersing a capillary needle in the test liquid samples and then recording the pressure required to create series of bubbles at various air flowrates. The varying of air flowrates leads to a changing surface age (t, time required to start a new bubble, in ms-millisecond). The pressure and a calibration constant are then used to 63 calculate the dynamic surface tension at different surface ages at 20°C. For t = 25 ms, the calculated value is known as the dynamic surface tension, and for t = 2000 ms the value is known as the static surface tension. 3.3.2.4. Safety Flash point refers to the lowest temperature, at which a volatile material will vaporise to form an ignitable mixture in air. It is a key value for evaluating a fuel oil’s safety properties. The flash point in this work was determined in accordance with ASTM D7236 Procedure B for inhomogeneous fuel oils by a Seta Flash Series 3 plus Closed Cup (Auto Ramp) Tester. A test flame is directed to the pre-set location where the vaporised oil is released at specified temperature intervals until a flash is detected. 3.3.2.5. Corrosiveness and Erosiveness The use of unsuitable fuel oil can cause engine damage in the form of metal part corrosion and wear. Fuel properties related to this include acidity, corrosiveness and lubricity. Total acid number (TAN) represents the level of acidity for the fuel oil and it is expressed as the mass of potassium hydroxide (KOH) in milligrams required to neutralise one gram of oil sample in a specified solvent. In the present work, it was measured with a Mettler Toledo G20 Compact titrator using the potentiometric titration method in accordance with ASTM D664. The oil sample is dissolved in 50/50 toluene-isopropanol solution and potentiometrically titrated with 0.1N alcoholic potassium hydroxide using a combination electrode. Readings of the solution potential are automatically plotted against the volume of titrating KOH solution consumed until the titration end-point is achieved. The oil corrosiveness in the present work refers to the degree of corrosion on copper strips directly caused by pyrolysis oil samples. The test was carried out using a Stanhope-SETA cooper corrosion test station in accordance with ASTM D130. Polished copper strips are immersed into the tested oil samples in a metal vessel. The vessel is then placed in a 40°C oil heating bath. Copper stripes are taken out of the vessel after periods between 6 and 24 hours, and they are then compared to the ASTM corrosion standard board. Lubricity is a measure of the physical friction and wear caused by a fuel oil. In this work, it was determined using a PCS High Frequency Reciprocating Rig (HFRR) in accordance 64 with ASTM D6079. For the measurement, a vibrating arm holding a non-rotatable ball specimen and loaded with a 200 gram mass is lowered to contact a test disk specimen. These are then submerged in the testing oil sample and the oil temperature is set to 60°C. The ball is made to rub against the disk with 1 mm stroke at a frequency of 50Hz for 75 minutes. An oil film forms between the two metal specimens acts as an anti-wear medium. The thickness of the oil film can represent the anti-wear property of oil. The ball is removed from the vibrating arm and cleaned after the experiment. The ball is removed from the vibrating arm and cleaned. The dimensions of the wear scar at the major and minor axes are measured by 100× magnifiers and recorded, and the arithmetic average taken. The area of the wear scar on the test disk specimen is used to rate the oil lubricity. 3.3.2.6. Deposit Formation The fuel deposition refers to the residues formed after combustion, including carbon residue and ash. Carbon residue can give an approximate indication of the deposit forming tendencies of the oil. The Conradson Carbon Residue (CCR) test was performed in accordance with ASTM D189 by a manual method. A weighed sample is placed in a crucible and undergoes strong heating by a Meeker burner. The carbonaceous residue remaining after the cracking and coking reactions is then cooled to room temperature and weighed. The CCR is the carbonaceous residue, and it is expressed as a mass percentage of the original oil sample. Ash content was determined in accordance with ASTM D482. The carbonaceous solid samples produced from the Carbon Residue test are combusted in a muffle furnace at 775°C. The remaining ash is cooled to room temperature and weighed, and it is then expressed as a mass percentage of the original oil sample. 3.3.2.7. Gas and Char Analysis Gas analysis in the present work was carried out by using a HP-5890 series ІІ Gas Chromatograph Thermal Conductivity Detector (GC/TCD) with a 60/80 Carboxen 1000 column. The GC was calibrated to detect H2, CO, CH4, CO2, CH4, and N2. For the analysis, helium was used as the carrier gas with a flow rate of 30 ml/min. The oven heating profile is set to an initial temperature of 35 °C and increased to 225 °C at a rate of 20 °C/min. The gas samples are manually injected into the GC by using a gas tight syringe at the initial 65 oven temperature and approximately 150 ml gas is injected per injection. Char analysis includes determination of CHNO content, HHV and ash content. The analysis methods are same to the feedstock characterisation described in Section 3.3.1. 3.3.3. Engine Test The schematic diagram of the engine test arrangement is shown in Figure 3.4. The engine test includes the study of the engine load, fuel consumption, cooling water flow and exhaust emissions. The electricity produced from the engine and generator (Table 3.1) was dumped to two Frico Panther fan heaters of 6kW and 9kW. The voltage and current produced by the generator is measured, from which power output is calculated. Fuel consumption is measured by using a graduated cylinder and stopwatch. Engine exhaust temperature is measured by k-type thermocouples. The composition of the exhaust gas is measured using an exhaust analyser and a smoke meter. 8 A 7 flow V Hz 4 5 6 11 10 9 2 1 3 Figure 3.4 Schematic Diagram of the Engine Test Arrangement (1) Lister Diesel Engine; (2) Generator; (3) Fan Heaters; (4) Ampere Meter; (5) Voltage Meter; (6) Frequency Meter; (7) Fuel Flow Meter; (8) Cooling Water Flow Meter; (9) Smoke Meter; (10) Exhaust Analyser; (11) Data Acquisition System The exhaust analyser used in this work is a Bosch BEA850. It can measure the concentrations of CO, CO2, O2 and NO, and lambda (introduced in the following section) in the exhaust gas. Smoke is measured by a Bosch RTM430 smoke meter. It can run continuous smoke-opacity tests during the engine run. The engine was operated at a range of load conditions, namely 3.7, 5.2, 6.4, 8.6 and 11.2 kW, which correspond to 25%, 35%, 42%, 57% and 75% of the full engine load. The engine was started with diesel fuel and 66 then switched to biodiesel or SSPO-biodiesel blends after ten minutes of operation. At the end of the experiment, diesel fuel was used to flush the fuel line in order to maintain a good condition of fuel line and injector. 3.3.3.1. Energy Balance of the Generating System The system energy balance comprises the energy inputs and outputs of the whole system. Diesel engines transform a certain amount (usually between 30% and 45%) of fuel combustion energy into mechanical energy output through the movement of pistons and the rotation of the crankshaft and flywheel. The flywheel then drives the generator for electricity generation. The remaining heat energy is discharged as waste heat exiting in the engine coolant and exhaust gas, and in the form of other minor miscellaneous losses. The energy balance of the diesel engine generating system may be expressed as: 𝑄𝑖𝑛 = 𝑃 + 𝑄𝑐 + 𝑄𝑒𝑥 +𝑄𝑙 (3.3) where Qin is the total energy input of the fuel; P is the electrical power generated by the generator; Qc is the heat present in engine coolant; Qex is the heat present in exhaust gas and Ql is the heat loss. All parameters are expressed in kilowatts (kW). The primary energy output is presented as the electrical energy from the engine generator. The heats present from the engine coolant and the exhaust gas are counted as recoverable useable heat (for CHP purpose). The electrical efficiency is calculated as the quotient of the electricity output and the total fuel energy input, and the heat efficiency is the quotient of the useable heat and total fuel energy input. The system electric efficiency is expressed as: 𝑃 𝑄𝑖𝑛 (3.4) 𝑄𝑐 +𝑄𝑒𝑥 𝑄𝑖𝑛 (3.5) 𝜂𝑃 = The useable heat efficiency is expressed as: 𝜂𝐻 = 67 The overall combined heat and power efficiency is, therefore, expressed as: 𝜂 = 𝜂𝐻 +𝜂𝑃 (3.6) where Qin is the total energy input of the fuel; P is the electrical power generated by the generator; Qc is the heat present in engine coolant and Qex is the heat present in exhaust gas. All parameters are expressed in kilowatts (kW). 3.3.3.2. Total Fuel Energy Input The total fuel energy input to a diesel engine is the product of the amount of fuel oil supplied and the energy content per unit fuel oil. The calculation of thermal energy input is expressed as: 𝑄𝑖𝑛 = 𝐻𝐻𝑉 × 𝑣 × 𝜌 (3.7) where, Qin is the total energy input of the fuel in kW; HHV is the higher heating value of fuel, in MJ/kg; v is the volumetric flow of the fuel, in l/s; and ρ is the fuel density, in kg/l. 3.3.3.3. Electric Power Output In the three-phase AC generating system, the electric power is calculated by the following relation of power, circuit current and voltage: 𝑃= 3 × 𝐼 × 𝑈 √3 (3.8) where, P is the electric power of the engine generating system in kW; I is the average measured alternating current of each phase, in Ampere; U is the average measured voltage of each phase, in Volt. 3.3.3.4. Coolant Heat Useable heat from the engine coolant is calculated as the heat difference in the coolant input and output to the engine cylinder jacket. The equation of coolant heat may be expressed as: 68 𝑄𝑐 = 𝐶𝑝,𝑤𝑎𝑡𝑒𝑟 × 𝑣𝑤 × 𝜌 × (𝑇2 − 𝑇1 ) (3.9) where, Qc is the useable from the engine coolant; Cp, water is the specific heat capacity of the engine coolant; vw is the volumetric flow of the coolant; T2 is the temperature of the output coolant and T1 is the temperature of the input coolant, in ˚C; ρ is the average coolant density between T2 and T1. 3.3.3.5. Exhaust Heat The exhaust heat is the heat in the hot exhaust gas relative to ambient temperature. Only a part of this heat is recoverable as useable heat. The equation of the exhaust heat may be expressed as: 𝑄𝑒 = 𝐶𝑝,𝑒𝑥 × 𝑚𝑒 × (𝑇𝑒 − 𝑇0 ) (3.10) where, Qe is the heat present from exhaust gas; Cp, ex is the specific heat capacity of exhaust gas; me is the mass flowrate of the exhaust gas; Te is temperature of the exhaust; T0 is the ambient temperature. The Specific Heat Capacity (Cp e) is the quantity of heat energy required to change the temperature of an object per unit mass. Exhaust gas is a mixture of fuel combustion products, mainly CO2, N2, CO, UHC, NOx and water vapour. Each gas component has a different Cp, so for calculating the Cp e of the exhaust gas, the Cp of each gas component should be known (available from gas thermal property tables). Diesel engines normally operate in a lean burn mode implying that large amounts of excess air are supplied, so there is a significant fraction of O2 also present in the exhaust gas. The emissions of CO, UHC and NOx are relatively low compared to the main components, thus their specific heat capacities make a negligible contribution. Calculation of the specific heat capacity of the exhaust gas may be expressed as, 𝐶𝑝 𝑒 = 𝐶𝑝 𝑂2 × 𝑂2 𝑤𝑡% + 𝐶𝑝 𝐶𝑂2 × 𝐶𝑂2 𝑤𝑡% + 𝐶𝑝 𝑁2 × 𝑁2 𝑤𝑡% + 𝐶𝑝 𝐻2 𝑂 × 𝐻2 𝑂𝑤𝑡% (3.11) where each Cp and wt.% are the specific heat capacities and weight percentages of O2, CO2, N2 and water vapour, respectively. 69 The Mass Flow Rate (me) of the exhaust gas equals the sum of the mass flow of air intake and the fuel consumption. 𝑚𝑒 = 𝑚𝑎𝑖𝑟 + 𝑚𝑓𝑢𝑒𝑙 (3.12) Fuel consumption, as previously described, is the product of volumetric flow rate (vfuel) and the density (ρfuel). Air intake is then calculated from its relations to the air-fuel ratio. The equations are expressed as following, 𝑚𝑓𝑢𝑒𝑙 = 𝑣𝑓𝑢𝑒𝑙 × 𝜌𝑓𝑢𝑒𝑙 (3.13) 𝑚𝑎𝑖𝑟 = 𝐴𝐹𝑅 × 𝑚𝑓𝑢𝑒𝑙 (3.14) 𝐴𝐹𝑅 = 𝜆 × 𝐴𝐹𝑅𝑠𝑡𝑜𝑖 (3.15) where, AFR is the actual air-fuel ratio (dimensionless); AFRstoi is the stoichiometric air-fuel ratio; λ is the ratio between AFR and AFRstoi. In combustion theory, the air-fuel ratio (AFR) is the actual mass ratio of air to fuel. Stoichiometric AFR (AFRstoi) is the stoichiometric ratio of air and fuel required for complete combustion. 3.3.3.6. Engine Exhaust Emissions The amount of exhaust gas emission, referring to the EU and US exhaust standards for non-road diesel engines, is calculated in gram per kilowatt-hour electricity generated (g/kWh). The calculation of mass flow of one specific gas component may be expressed as: 𝑚𝑎 = 𝑎𝑤𝑡% × 𝑚𝑒 𝑃 (3.16) where, ma is the mass flow of one specific gas component in the exhaust gas; 𝑎𝑤𝑡% is the weight percentage of one specific gas in the who exhaust gas; me is the mass flow of the whole exhaust gas; P is the power of the generator. 70 The 𝑎𝑤𝑡% is expressed as the following equation, only concerning the major exhaust gas components: 𝑎𝑤𝑡% = 𝑤𝑎 𝐶𝑂𝑣𝑜𝑙% 32𝑂2 𝑣𝑜𝑙% + 44𝐶𝑂2 𝑣𝑜𝑙% + 28𝑁2 𝑣𝑜𝑙% + 18𝐻2 𝑂 𝑣𝑜𝑙% + 28𝐶𝑂𝑣𝑜𝑙% (3.17) where, 𝑤𝑎 is the molecular weight of the specific gas; vol% is the volumetric percentage of each component gas (measured by the exhaust analyser). Total flow of the exhaust gas in Standard Temperature and Pressure is expressed as: 𝐹= 22.4 × (𝑚𝑓𝑢𝑒𝑙 + 𝑚𝑓𝑢𝑒𝑙 × 𝐴𝐹𝑅) 32𝑂2 𝑣𝑜𝑙% + 44𝐶𝑂2 𝑣𝑜𝑙% + 28𝑁2 𝑣𝑜𝑙% + 18𝐻2 𝑂 𝑣𝑜𝑙% + 28𝐶𝑂𝑣𝑜𝑙% (3.18) where, F is the total volumetric flow of the exhaust gas; vol% is the volumetric percentage of each component gas (measured by the exhaust analyser), and mfuel is the fuel mass flow. 3.3.4. Measurement Errors Measurement error is the difference between the result of the measurement and the real value of the object/property been measured. Although modern instruments have helped improve measurement accuracy, there are still uncertainties that exist. In a quantitative measurement, there are principally two sources of error i.e. systematic error caused by the measuring instrument and procedure, and random error that may vary from observation to observation. In this work, most of the instruments are equipped with digital recording and display. This can largely reduce random error. Where possible, all measurements are performed using the instruments required by the ASTM standard and in accordance with the standard procedures. However, the error of the instrument depends on the manufactured quality of the instrument and there is no direct means of avoiding it for a given instrument. For some instruments, especially those made to high precision and sensitivity such as TGA and GC/MS, equipment service and standard calibration are carried out regularly to maintain the high level accuracy of the equipment. When measuring some properties that are sensitive to the sample quality and/or the environmental parameters (measuring 71 temperature), such as moisture content, heating value, acid number, density and viscosity, carefully prepared samples according to the ASTM standard are used and multiple measurements are carried out to produce average results. For some measured values which fluctuate within a certain range, such as generator voltage, engine coolant temperature, and exhaust gas concentration, the measurements are carried out over a prolonged period (over 30 minutes) so that a large number of measured values can be obtained to produce average results. For measured values which are at micro-scale, such as lubricity analysis, a highresolution microscope is used to obtain the highest possible accuracy in the results. Table A2.1 provided in the Appendix 2 lists all of the measurement errors for the equipment/instrument used in this work, as quoted by the manufacturers of the equipment. 3.4. Economic Evaluation This section presents methodologies and basic assumptions used in the economic evaluation of biomass pyrolysis-CHP systems. Based on the experimental results from the studies on pyrolysis oil production and diesel engine tests, analyses of the economic aspects of the combined systems using the Pyroformer and diesel CHP engine generator are carried out. A type of commercially available wood pellet and a type of sewage sludge waste from a waste water treatment plant are used as the feedstocks. The base year for the study is chosen to be 2013, being the year during which most of the equipment cost data were collected. All costs are projected 2013 GB£, unless otherwise specified. An inflation rate of 3 % is assumed. This has been applied to adjust all non-2013 cost and sales data, i.e. the biomass feedstock costs, utility cost, labour cost and all product sale prices. Plant Cost Index is not used here as all the equipment costs are estimated according to industrial experience or quoted at rate for 2013. The evaluation assumes UK installations. Total project life is taken to be 20 years, according to the RWE annual report that quotes 15 to 20 years as the life of a thermal plant [96]. At the end of the project life, a salvage value (scrap value) of 10% plant cost is applied. The annual plant operating time is assumed to be 7000 hours [97]. This is due to the consideration of novel technology and potential negative impact of the pyrolysis oil to the generating system (e.g. soot emissions). 72 3.4.1. Capital Cost Total plant cost (TPC) is used as the measure of the capital cost in this work. It is the total amount of capital required to finance the whole system to the point at which it is ready to operate. The calculation of TPC starts with the summation of the equipment cost (EC, the cost of purchasing brand new equipment delivered to the plant gate) of the major components in the subsystem. Increments are then added for erection, instrumentation, piping and ducting, associated electrical equipment, structures and buildings, civil works and laggings, to give a direct plant cost (DPC). Costs of engineering design and management overheads are then added to give an installed plant cost (IPC), and finally commissioning costs, contractor’s fees, interest during construction and a contingency element are added to give the TPC. These increments are less specific to system modules, being usually approximated as fixed percentages of direct plant cost. The cost data utilised in the present work were collected in the form of EC of each specific subsystem component at a certain scale. Hence appropriate conversions from the collected data to the costs of equipment at desired scales have been performed. The summation of the EC for the whole plant was then converted to the TPC. This has been done in accordance with some previous works [19, 74, 98]. The following relationships were used: Conversion of EC of a system component at quoted scale to EC at a desired scale: 𝑆2 𝐶2 = 𝐶1 ( )𝑛 𝑆1 (3.19) where, C1 is the capital cost of the project with capacity S1 and C2 is the capital cost of the project with capacity S2. n is usually taken as 0.6 for a power plant [98]. Conversion from summation of EC to DPC of a system: 𝐷𝑃𝐶 = 𝐸𝐶(1 + ∑ 𝐶3 𝐶1 𝐸𝐶 𝐶2 ) (3.20) where, the values for the constants C1, C2 and C3 are given in Table 3.2 [19]. The adjustment C3 is unity unless selected otherwise. Multiplication factors for the conversion 73 of DPC to TPC are given in Table 3.3 [19]. A contingency of 10% has been selected, in line with a previous comparable economic study [74]. Table 3.2 Equipment Cost Conversion Factors [19] Conversion from DPC of a system to TPC of a system: 𝑇𝑃𝐶 = 𝑥1 𝑥2 𝐷𝑃𝐶 74 (3.21) where, x1 is the factor that used for converting DPC to IPC and x2 is the factor that used for converting DPC to TPC. The ranges of factors have been given in Table 3.3 and the factors are selected in line with the previous comparable studies [19]. Table 3.3 Conversion of direct plant cost to total plant cost [19] 3.4.2. Production Cost Production costs on an annual basis are comprised of operating costs, which in turn comprise consumable costs, disposal costs, labour, maintenance and overheads, and a charge for initial capital and its interest repayment. In the Pyro-CHP plant, electricity, heat and char are considered as joint products from the plant. The cost of production can then be derived by dividing the production cost by the annual amount of supplied electricity, heat and char in kWh to give a cost in £/kWh, as they are primarily energy products. The char production cost is then converted to £/kg, using the relationship between char production rate and heating value. It is worth noting that the calculated costs of production have ignored the operator’s profit - hence they are break-even costs of production. 3.4.3. Annual Cost of Capital Annual cost of capital (ACC) is the annual levelised repayment over the lifetime of the project (n years) assuming that the full capital amount (TPC) is loaned at the start of the project at a real interest rare i. The ACC is calculated as follows: 𝐴𝐶𝐶 = 𝑇𝑃𝐶 𝑖(1 + 𝑖)𝑛 (1 + 𝑖)𝑛 − 1 75 (3.22) 15% interest rate is used in this work considering the similar economic studies and the risk on capital investment [80, 99, 100]. 3.4.4. Consumables Costs of consumables include the costs of feedstocks (wood pellets and sewage sludge) and the cost of biodiesel used. In the present study, it is assumed that the pyrolysis oil is blended with biodiesel in a 50/50 volumetric ratio for use in diesel engines. The cost values of the consumables used are obtained from the literature or from quotations from commercial suppliers (see Section 7.2). 3.4.5. Disposal Waste water (the aqueous fraction of the pyrolysis liquid) is the waste stream of the PyroCHP system. The present study uses the conventional industrial waste water treatment service from a UK water company. The price tariffs are available on the company’s website [101]. The total disposal costs are calculated (see Section 7.2). 3.4.6. Labour In the present work, the labour cost is estimated from the average 2013 labour cost for UK power plant (in the case of the wood plant) and the average 2013 labour cost for UK water treatment plant (in the case of the sewage sludge plant). In addition to the gross salaries paid to the employees, contributions to national insurance, pensions, payroll administration and staff training allowance are also included (see Section 7.2). 3.4.7. Maintenance and Overheads Annual maintenance costs and overheads costs (including insurance, rent, taxes etc.) are calculated as a percentage of TPC per annum. The present study uses 2.5% of TPC for plant maintenance and 2.0% of TPC for plant overheads costs in line with previous comparable work [74]. 3.4.8. Product Sales and Return on Investment 3.4.8.1. Product Sales It is assumed that all of the pyrolysis oil produced in the Pyroformer is used to generate electricity either for selling to customers (in the case of the wood plant) or for internal consumption in the plant (in the case of the sewage sludge plant). For the useable heat 76 from the CHP system, it is assumed that the customers are able and willing to purchase this. For the char produced, it is assumed that the customers are able and willing to purchase it either as biochar for soil improver or as charcoal for solid fuel. The total income from the product sales is calculated (see Section 7.2). The total income includes two parts: the income from the product sales themselves, and the income from government incentive payments for renewable energy. In the case of wood plant, the income from the electricity sale is the payment received from the local grid or business customers; while in the case of sewage sludge plant, the income from the electricity sale is the electricity bill saved in the water treatment plant. The income from the renewable energy incentives is received as the trade value of Renewable Obligation Certificates (ROCs) and payments claimed under the Renewable Heat Incentives (RHI) scheme from the government. 3.4.8.2. Break-even Selling Price Break-even Selling Price (BESP) is the minimum product selling price that covers the costs for production. The system investigated in this work produces three types of products. The calculation of BESP for each product is based on the assumption that the other two products have been purchased by the customers at the market price and the associated subsidies have been paid. In the case of electricity, the BESPelec is calculated as: 𝐵𝐸𝑆𝑃𝑒𝑙𝑒𝑐. = (𝐴𝐶𝐶 + 𝑂𝐶) − 𝑄ℎ𝑒𝑎𝑡 × 𝑃ℎ𝑒𝑎𝑡 − 𝑄𝑐ℎ𝑎𝑟 × 𝑃𝑐ℎ𝑎𝑟 − 𝑄𝑒𝑙𝑒𝑐. × 𝑆𝑒𝑙𝑒𝑐. 𝑄𝑒𝑙𝑒𝑐. (3.23) where, ACC is the annual cost of capital; OC is the annual operating cost; Q is quantity of energy product produced; P is market price received from sale of energy product (price plus subsidy); S is the rate of subsidy, i.e. ROC trade value for electricity and RHI rate for heat. 3.4.8.3. Internal Rate of Return In this work, the internal rate of return (IRR) is used to measure and evaluate the profitability of the project investments. The IRR is a discounted cash flow rate of return that makes the net present value (NPV) of cash flows equal to zero. The NPV is the summation of the present values (PVs) of the individual annual net cash flows. The PV is 77 the cash flow in future that has been discounted to reflect its present value, as if it existed today [102]. It is a characteristic of money referred to as its time value. The present value of money is always less than its future value as it has interest-earning potential. The PV of the cash flow is calculated in the following formula: 𝑃𝑉 = 𝐶𝑡 (1 + 𝑖)𝑡 (3.24) where, Ct is the net cash flow; t is the time of cash flow (time between the present date and the date for the cash flow Ct, and i is the discount rate or interest rate that could be earned on an investment. The NPV is calculated in the following formula: 𝑇 𝑁𝑃𝑉 = −𝐶0 + ∑ 𝑡=1 𝐶𝑡 + 𝐶𝑆𝑉 (1 + 𝑟)𝑡 (3.25) where, C0 is the initial investment; C is the cash flow; r is the discount rate; t is the year; T is the project lifetime and CSV is the PV of salvage value of the project at the end of lifetime. When the NPV equals zero, the value of discount rate r is the IRR of the project. The IRR is then used as an indicator of the potential probability of the project, by comparing with the target IRR. For a novel technology with a high risk associated, the target IRR may be up to 25% [103]. 78 CHAPTER 4 PYROFORMER AND INTERMEDIATE PYROLYSIS OF BIOMASS ENERGY PELLETS This chapter comprises two parts: (1) estimation of the Pyroformer processing parameters, and (2) study of pyrolysis of two types of pelletised biomass feedstocks. In pyrolysis, the processing parameters such as solid residence time, heating temperature and heating rate, determine the product yields and quality. As introduced in Chapter 3, the Pyroformer features intermediate solids residence times and makes use of recycled char to act as a heat carrier and a vapour cracking medium. In this chapter, the solid residence time and char/biomass mixing ratio (i.e. the char recycle rate) are calculated according to the reactor geometry and screw speeds. Following this, a study on pyrolysis of pelletised wood and barley straw feedstocks under certain process conditions is presented. The feedstocks are firstly characterised and then processed in the Pyroformer reactor. All products are collected and characterised. The mass balance and product energy flows are also evaluated. 4.1. Pyroformer Parameters Further to the brief information given in Chapter 3, this section presents estimations of the feedstock solid residence time and char/biomass mixing ratio of the Pyroformer reactor under various system settings. In the Pyroformer, these two parameters are dependent on the dimensions (constant) and rotational speed (variable) of both inner and outer screws. 4.1.1. Screw Geometry and Dimensions The geometric parameters of the inner screw and outer screw are shown in Figure 4.1 and the full information of the screws is given in Table 4.1. The inner screw is co-axially located inside of the outer screw. Both screws can operate independently for transporting the feedstock and char along the length of the reactor. The inner screw is constructed in a single helix and the outer screw is a double helix. There are 14 and 9 pitches (gaps between successive screw blades) on the inner and outer screws respectively. However, only 10 and 8 pitches respectively are effective for transporting the feedstock and char when running pyrolysis. This is because the last two and a half screws at the back end of the outer screw contain slots for solids recirculation. The rest of the pitches in the screws (from the mid-point of the slots to the back end of the outer screw) do 79 not affect the solid residence time and char recirculation, but are useful for cleaning the reactor (when the pyrolysis process finishes, both screws are operated in the same rotating direction, towards the reactor back end; the solids are thereby transported to the char pot). Lin din Din pin (a) Front End Back End Lot dot Dot pot (b) Figure 4.1 Geometric Dimensions of the (a) Inner Screw and (b) Outer Screw Table 4.1 Parameters of the 20 kg/h Pyroformer Unit Inner Screw Outer Screw Shaft Length (Lin, ot) mm 1234 1015 Shaft Outer Diameter (Din, ot) mm 82 180 Screw Height (sin, ot) mm 32 36 Screw Pitch (pin, ot) mm 60 66 Screw Inner Diameter (din, ot) mm 18 108 Shaft Effective Length (lin, ot) mm 881 -- Number of Screw Pitches -- 14 9 Number of Effective Screw Pitches -- 10 8 Individual Pitch Volume ml 301 1074 Screw Volume ml 4220 9669 4.1.2. Residence Time and Char/Biomass Ratio 4.1.2.1. Residence Time Solids residence time is the period during which the fresh feed is heated and converted into char. In the Pyroformer, the solids residence time is considered as the time taken by the feedstock to travel along the whole effective length of the inner screw and it is dependent 80 on the number of effective screw pitches (effective length) and rotational speed of the inner screw. For each revolution of the shaft, the solid material moves forward one pitch. The equation for the solids residence time may be expressed as, 𝑙𝑖𝑛 𝑝𝑖𝑛 × 𝑁𝑖𝑛 𝑡𝑠 = (4.1) where, ts is the solid residence time in minutes; lin is the effective length of the inner screw in mm (millimetre); pin is inner screw pitch in mm; and Nin is the inner screw speed, in rpm (revolutions per minute). 4.1.2.2. Char/Biomass Mixing Ratio The char/biomass mixing ratio is the volumetric ratio of the char recycle rate to the biomass feed rate in the reactor under steady state operation. The equation for char/biomass ratio may be expressed as: 𝑅𝑐/𝑏 = 𝑣𝑐 𝑣𝑏 (4.2) where, Rc/b is the char/biomass ratio; vc is the volumetric recycle rate of char and vb is the volumetric feed rate of biomass, both in ml/min (millilitre per minute). vc is a function of the volume of outer screw pitch, the capacity ratio (CR, the amount of material transported divided by the maximum possible) and the speed of outer screw rotation. The CR is an ideal factor, as the maximum possible (screw volume fully occupied) is never achieved in reality due to the rotational motion of the solids in the direction of the screw rotation which takes place increasingly as the volume occupancy increases due to frictional forces. The value of vc can be estimated from the following equations, 𝑣𝑐 = 𝐶𝑅 × 𝑉𝑜𝑡 × 𝑁𝑜𝑡 (4.3) and 𝑉𝑖𝑛,𝑜𝑡 = 𝜋 × [( 𝐷𝑖𝑛,𝑜𝑡 2 𝑑𝑖𝑛,𝑜𝑡 2 ) −( ) ] × 𝑝𝑖𝑛,𝑜𝑡 2 2 81 (4.4) where CR is the capacity ratio; Not is the rotational speed of the outer screw; Vin,ot is the volume of an inner or outer screw pitch in ml (millilitre); Din,ot is the shaft outer diameter of the inner or outer screw in mm; din,ot is the shaft inner diameter of the inner or outer screw in mm; pin,ot is the pitch length in mm. It is worth noting that CR is a major unknown factor for determination of the char and biomass mixing ratio. In reality, it is influenced by several reactor operating parameters, such as type of biomass feed, biomass feedrate and occupancy of the screws. For a given biomass feedrate, the char recycle rate generally continues to rise from the beginning of the run until the process reaches the steady state when a stable char recirculation is achieved. A Pyroformer cold flow experiment simulating the biomass and char mix found that the CR appeared to be limited by the occupancy of the outer screw at the back end where char leaves the inner screw. When the occupancy reaches a certain fraction, char recycle can no longer increase [104]. The excessive char will be transported to the char pot. According to these relations, the char/biomass mixing ratio can be finally derived as: 𝑅𝑐/𝑏 𝐷 𝑑 𝐶𝑅 × 𝜋 × [( 2𝑜𝑡 )2 −( 2𝑜𝑡 )2 ] × 𝑝𝑜𝑡 × 𝑁𝑜𝑡 = 𝑣𝑏 (4.5) Table 4.2 gives the results of the calculated solid residence time as well as the comparisons of char/biomass mixing ratio obtained from the theoretical calculation (assumed value of CR of 0.2) and a cold flow experiment [104]. The experiment and the calculation used a feed rate of 5 kg/h and a biomass bulk density of 0.6 kg/l. It should be noted that the cold experiment did not involve the thermal degradation of the biomass, so the “char” was the same material as the feed. The comparison shows that the experimental results of the char/biomass ratio are similar to those from the calculation using Equation 4.5 with an assumption of CR of 0.2. If we use the cold flow Rc/b results to derive CR inversely via Equation 4.5, the results of the CR fall in the range of 0.12-0.26 (“Derived CR” in Table 4.2). The estimated CR of 0.2 is at the approximate average. The results in Table 4.2 cover the most frequently used settings in the present work. From the theoretical calculated results, it is obvious that, for the test range in the steady-state 82 operation, the solid residence time increases with decreasing inner screw speed, while the char/biomass mixing ratio increases with increasing outer screw speed. Table 4.2 Residence Time and Char/Biomass Ratio under Various Screw Speeds 4.2. Outer Speed (rpm) Inner Speed (rpm) Residence Time (min) Char/biomass Ratio Calculated Char/biomass Ratio Cold Flow Derived CR 1 3 5.02 1.56 1.20 0.15 1.5 3 5.02 2.35 1.39 0.12 1 6 2.52 1.56 2.05 0.26 1.5 6 2.52 2.35 2.60 0.22 2 6 2.52 3.13 3.05 0.19 3 6 2.52 4.69 3.53 0.15 4 6 2.53 6.26 3.96 0.13 1 7 2.10 1.56 -- 1.5 7 2.10 2.35 -- Pyrolysis of Biomass Energy Pellets This section describes the use of the pilot-scale Pyroformer to produce pyrolysis oil, permanent gas and char from pelletised wood and barley straw residue feedstocks at the same processing condition. Only results from one condition are presented here, i.e. at a heating temperature of 450°C, and screw speeds of 1 rpm and 7 rpm for the inner and outer screws respectively. No parametric study to identify optimum conditions was carried out in this work. 4.2.1. Feedstocks Analysis Feedstock analysis includes the proximate analysis, ultimate analysis and TGA analysis of the feedstock sample. 4.2.1.1. Compositions The wood feedstock is compressed pine wood pellets, as described in the previous chapter. The proximate analysis (analysed as received) and ultimate analysis (on dry ash free basis) are shown in Table 4.3. 83 The analysis shows that the contents of carbon, hydrogen and nitrogen in the wood pellets and barley straw pellets are similar. The wood pellets have higher volatiles than barley straw pellets, and nearly half the ash content. Ash is undesirable in the feedstocks, as it mainly remains in the char resulting in reduced char heating value [105, 106]. A small portion of metal elements can also present in the pyrolysis oil in the form of oil-soluble or water-soluble compounds, resulting in ash after oil combustion. Table 4.3 Ultimate and Proximate Analysis of the Wood and Barley Pellets Properties Unit Wood Barley Carbon wt.% daf 53.0 53.8 Hydrogen wt.% daf 5.9 7.4 Nitrogen wt.% daf 0.4 0.5 Oxygen* wt.% daf 40.6 37.0 Sulphur wt.% daf <0.1 0.7 Chlorine wt.% daf <0.1 0.5 Volatile matter wt.% ar 82.1 74.9 Moisture wt.% ar 7.0 11.9 Fixed carbon wt.% ar 7.7 7.2 Ash wt.% ar 3.2 6.0 HHV MJ/kg ar 18.2 17.0 Ultimate analysis Proximate analysis * calculated by difference; daf: dry and ash free; ar: as received 4.2.1.2. TGA Analysis All virgin biomass and energy crops in nature are lignocellulosic biomass, composed of mainly carbohydrate polymers (cellulose, and hemicellulose) and an aromatic polymer (lignin). Lignocelluloses are major structural components of green plants and are generally bonded tightly to form of the primary and secondary cell wall of plants. Celluloses are typically presented as long linear chains of glucose unit having a strong and stable structure, but hemicelluloses consist of heterogeneous polymers and are structurally amorphous. Lignin is complex in form and structure and is mainly found in wood. Literature shows the extraction of those components from wood generally yields over 3050% cellulose, 15-25% hemicellulose and 25-35% lignin [107, 108], while that from 84 barley straw yields 30-45% cellulose, 30-40% hemicellulose and 10-20% lignin [109]. Investigations into the thermal decomposition of cellulose, hemicellulose and lignin in the absence of air (pyrolysis) indicate they behave significantly differently. Cellulose decomposes rapidly over a narrow temperature range, between 330-410°C, while hemicellulose decomposes slowly in the range 230-380°C. Lignin is the slowest of the three but has a wide decomposition temperature range of 180-800°C [110]. The materials released from the biomass are volatiles. They decompose into a variety of condensable organic compounds, water and permanent gases. 110 0.000 100 90 -0.002 70 -0.004 60 50 -0.006 1st Derivative Weight Loss (%) 80 40 30 -0.008 Wood Weight Loss Barley Weight Loss Wood Derivative Barley Derivative 20 10 -0.010 0 100 200 300 400 500 600 Temperature (oC) Figure 4.2 Pyrolysis TGA Analyses of Feedstock Samples Figure 4.2 shows the results of pyrolysis TGA of both biomass samples. The solid curves in the figure represent the weight loss of the biomass samples against the oven temperature in an inert atmosphere. Their first derivatives - the rate of weight loss - are drawn in dash. The peak of the first derivative indicates the point of greatest rate of weight loss, also known as the inflection point. The two biomass samples show similar weight loss behaviour in pyrolysis. The major weight loss of barley straw takes place between 280°C and 370°C, with an inflection point of -0.0084 at 350°C, but that of wood occurs at a higher temperature range, between 330°C and 450°C, with an inflection point of -0.0091 at 400°C. This finding reflects the feedstock 85 composition. Wood normally has a higher content of cellulose, which tends to decompose rapidly at higher temperatures; while barley straw is richer in hemicellulose, which decomposes at lower temperatures but more slowly. The curves also indicate that the rates of weight loss for both samples reduce significantly after 450°C, so this temperature is therefore selected for the pyrolysis experiments. The reduction in weight continues until only the fixed carbon and ash remain. 4.2.2. Pyrolysis Parameters The reactor settings and parameters of the experiments are shown in Table 4.4. The feed rates for wood pellets and barley straw pellets were set to 6 kg/h and 5 kg/h respectively. Reduced feed rates are used here, as the feeding system was not able to achieve a full load with these biomass pellets. The bulk densities of the pellets are relatively low and attempts to feed at higher rates caused feeder blockages. The rotating speeds of the inner and outer screws were set to 1 rpm and 7 rpm respectively. This accordingly gives a residence time of 2.10 minutes and a char/biomass mixing ratio of 1.56. As it has been discussed in Section 4.1.2, the solid residence time is only related to the inner screw speed and char/biomass ratio is a function to the outer screw speed. Pyrolysis temperature was set to 450°C. Each experiment continued for 2 hours, including 1 hour pre-steady-state and 1 hour steady state. A total amount of 12 kg of feedstock for wood pellets and 10 kg for barley straw pellets were used. Table 4.4 The Pyroformer Settings and Parameters Parameters Unit Wood Barley Feed rate kg/h 6.0 5.0 Pyrolysis Temperature °C 450 450 Inner speed rpm 1 1 Outer speed rpm 7 7 - 1.56 1.56 Residence time min 2.10 2.10 Filtration temperature °C 450 450 Char/biomass ratio 4.2.3. Product Yields Product yields are given in Table 4.5. Pyrolysis liquid was the most abundant product accounting for 54.3% and 49.0% of the total for wood and barley respectively. The liquids 86 were produced with separated organic and aqueous phases. Full separation was seen within a few hours of the experiment completing. The organic phases of both wood pyrolysis liquid and barley straw pyrolysis liquid have higher densities than water (aqueous phase of the whole liquid), hence they have appeared as the bottom phase. Table 4.5 Product Yields of the Intermediate Pyrolysis Product Unit Wood Barley Liquid wt.% 54.3 49.0 Organic phase wt.% 34.1 12.0 Aqueous phase wt.% 65.9 88.0 Solid wt.% 28.5 30.1 Gas wt.% 17.2* 20.9* *calculated by difference The pyrolysis oil (organic phase) was obtained using a separating funnel. It was found that 34.1% of the wood pyrolysis liquid formed pyrolysis oil, but only 12.0% for barley straw. The char yields were 28.5% and 30.1% for wood and barley straw respectively. Yields of permanent gas were calculated by difference. 4.2.4. Oil Analysis Table 4.6 presents the most critical characters of the pyrolysis oils. Elemental analysis (dry basis) shows that the barley straw oil contains more carbon and hydrogen (62.57% and 8.12%) than wood oil (55.69% and 7.93%). A higher content of carbon and hydrogen will result in higher combustion energy, as shown by the HHV analysis (barley straw oil 28.9 MJ/kg compared to wood oil 24.2 MJ/kg). Nitrogen contents of 0.36% and 1.41% are found in wood and barley straw oil respectively in the forms of nitrous compounds in wood oil and nitrile compounds in barley straw oil. The content of sulphur and chlorine in the oils was not measured since their content in the feedstock was very low (see Table 4.3). The wood oil contained approximately three times more moisture than the barley straw oil (15.4 wt.% compared to 5.8 wt.%). Unlike fossil fuels that generally require minimal moisture content, the presence of moisture in pyrolysis oil is important, as it can reduce viscosity. This was shown by the viscosity analysis which found that the viscosity of wood oil was 14.8 cSt, compared to 30.5 cSt for barley straw oil. Lower viscosity means better 87 fluid quality and better fuel spray atomisation. The TAN of wood oil (47.5 g/mgKOH) was found to be higher than that of barley straw oil (30.9 g/mgKOH), as more organic acidic compounds were found in wood oil. It is worth noting that moisture in the oils also plays an important role here. Higher moisture content can reduce the oil viscosity, but may also lead to a higher content of water-soluble acidic compounds. The carbon residue found in the barley straw oil is nearly twice of that in wood oil (6.50% compared to 3.55%). This is consistent with the greater proportion of heavy organics in the barley straw oil which appears quite bituminous. The wood oil appears to be slightly heterogeneous, as the moisture contained is not completely miscible. Table 4.6 Characteristics of the Intermediate Pyrolysis Oils Properties Unit Elemental analysis wt.% Wood Barley C wt.% 55.69 62.57 H wt.% 7.93 8.12 N wt.% 0.36 1.41 O* wt.% 36.02 27.90 mgKOH/g 47.5 30.9 Moisture wt.% 15.4 5.8 HHV MJ/kg 24.2 28.9 Kinematic viscosity at 40°C cSt 14.8 30.5 Density at 20°C g/ml 1.10 1.15 Carbon residue wt.% 3.55 6.50 Ash wt.% 0.18 0.20 TAN *calculated by difference 88 10.00 20.00 30.00 40.00 89 50.00 a. Wood Oil, b. Barley Straw Oil 65.453 60.00 76.560 63.475 40.00 61.199 55.473 56.071 44.757 30.00 49.368 45.999 43.562 40.975 40.572 34.881 40000 39.204 40.377 31.673 30.616 20.00 33.156 36.123 35.651 30.983 29.040 10.00 25.403 25.982 20.084 30.912 21.693 15.301 20000 17.531 10.989 46.924 50.00 64.949 58.684 55.316 53.350 49.425 36.992 32.877 29.222 30.348 24.094 23.497 20.669 21.451 44.602 43.246 28.769 24.922 19.899 44.430 8.369 8.610 9.254 9.576 10.243 6.058 0.5e5 14.577 6.655 17.600 40.660 49.178 31.371 36.509 [M2711121] TIC #1 a. Wood Oil 2.0e5 1.5e5 1.0e5 60.00 b. Barley Straw Oil [QBSGY ] TIC #1 60000 70.00 Figure 4.3 GC/MS Spectrums of the Pyrolysis Oils (chemical abundant vs. retention time) Table 4.7 Composition of the Biomass Derived Pyrolysis Oils a. Wood Oil Wood 1 Retention Time Chemical Name 6.058 Furan,2-methyl- Formula C5H6O C6H8O Area% 0.81 2 8.369 Furan,2,5-Dimethyl- 0.79 3 8.610 unknown 4 9.254 Acetic Acid C2H4O2 2.45 5 9.576 Nitrous acid, butyl ester C4H9NO2 0.75 0.92 6 10.243 Acetone, 1-hydroxy- C3H6O2 0.74 7 17.600 Furfural C5H4O2 6.90 8 19.899 2-Furanmenthanol C5H6O2 3.09 9 20.669 2-Cyclopenten-1-one, 2-methyl- C6H8O 1.14 10 21.451 Furan, 2-ethyl-5-methyl- C7H10O 0.72 11 23.497 2-Cyclopenten-1-one,2-hydroxy- C5H6O2 1.96 12 24.922 Furancarboxaldehyde, 5-methyl- C6H6O2 2.64 13 26.049 2(5H)-Furanone C4H4O2 1.19 14 28.796 C6H8O2 4.44 15 29.222 Furanone, 2,5-dihydro-3,5-dimethyl C6H8O2 0.80 16 30.348 Phenol C6H6O 0.90 17 31.371 Phenol, 2-methoxy C7H8O2 11.97 18 32.877 Phenol, 2-methyl- C7H8O2 0.72 19 36.509 Phenol, 2-methoxy-4-methyl C8H10O2 16.39 20 36.992 Phenol, 2,4-dimethyl- C8H10O 0.74 21 40.660 Phenol, 4-ethyl-2-methoxy C9H12O2 8.89 22 43.246 3-Methylacetophenone, 4-hydroxy- C9H10O2 5.05 23 44.430 Phenol, 2-methoxy-4-(1-propenyl)- C10H12O2 2.26 24 44.602 Phenol, 2-methoxy-4-propyl C10H14O2 3.12 25 46.924 Phenol, 2-methoxy-3-(2-propenyl)- C10H12O2 1.86 26 49.178 Phenol, 2-methoxy-4-methyl-4-(2propenyl)-, acetate C12H14O3 13.42 27 49.925 unknown 28 53.350 ethanone, 1-(4-hydroxy-3methoxyphenyl) C9H10O3 1.01 29 55.316 2-Propanone, 1-(4-hydroxy-3methoxyphenyl) C10H12O3 1.10 30 58.684 Nonanoic acid C9H18O2 1.11 31 64.949 Propenoic acid, 3-(4-methoxyphenyl) C10H10O3 2-Cyclopenten-1-one,2-hydroxy-3mehtyl 1.05 90 1.07 b. Barley Straw Oil Barley Retention Time Chemical Name 1 6.655 1,3,5 -Hexatriene C6H8 1.57 2 10.989 Benzene, methyl C7H8 10.41 3 14.577 Cyclopentanone C5H8O 1.46 4 15.301 Benzene, ethyl- C8H10 3.11 5 17.531 Cyclooctatetraene C8H8 2.31 6 20.084 Decane, 1-chloro- C10H21Cl 2.44 7 20.912 2-Cyclopenten-1-one,2-methyl- C6H8O 2.14 8 21.693 2-Furyl Methyl Ketone C6H6O2 1.62 9 25.403 1-Octanol, 2-butyl- C12H26O 2.3 10 25.982 2-Cyclopenten-1-one, 3-methyl C6H8O 1.84 11 29.040 C6H8O2 2.65 12 30.616 Phenol C6H6O 7.4 13 30.983 unknown 14 31.673 Phenol, 2-methoxy- C7H8O2 2.52 15 33.156 Phenol, 2-methyl- C7H8O 2.52 16 34.881 Phenol, 4-methyl- C7H8O 10.06 17 35.651 1-Tetradecene C14H28 2.23 18 36.123 Bicyclo[6.4.0]dodeca-9,11-diene C12H18 1.63 19 39.204 Phenol, 4-Ethyl- C8H10O 4.25 20 40.377 unkown 21 40.572 3-Pyridinol C5H5NO 3.23 22 40.975 Phenol, 2-methoxy-4-ethyl- C9H12O2 1.85 23 43.562 Phenol,4-ethenyl-2-methoxy C9H10O2 2.08 24 44.757 Tetradecane C14H30 3.53 25 45.999 Indolizine C8H7N 1.51 26 49.368 1H-Indole, 3-methyl- C9H9N 1.55 27 55.473 unknown 28 56.071 Bicyclo [2.2.2.] octa-2,5-diene, 2dimethylamino- C10H15N 3.06 29 61.199 N-Phenyl-N-furaldehyde hydrazone C11H10N2O 1.51 30 63.475 Pentadecanoic acid, 14-methyl-, methyl ester C17H34O2 3.74 31 65.453 Pentadecanenitrile C15H29N 2.04 32 76.560 Hexadecanamide C16H33NO 4.17 2-Cyclopenten-1-one, 2-hydroxy3-methyl- Formula Area% 2.31 5.53 1.44 91 Figures 4.3a and 4.3b illustrate the mass spectra of the wood oil and barley straw oil. Table 4.7a and 4.7b present the all chemical compounds identified by the NIST library. Table 4.8 presents the groups of chemical compounds in the oils identified by the GC/MS analysis. Compositional analysis indicates that the content of compounds in the wood oil and barley straw oil are similar to those of fossil fuels such as diesel and petrol, which mainly contain paraffins, naphthenes and aromatics. Table 4.8 Compounds of the Intermediate Pyrolysis Oils Wood (area%) Barley (area%) Furanic 16.94 1.62 Phenolic 67.43 30.68 - 13.52 7.54 8.09 - 7.80 2.93 - - 18.15 5.16 20.15 Compound Aromatic hydrocarbons Cyclopentenone based compounds Other heterocyclic Organic acids Long-chain hydrocarbon based compounds (including chloride and nitrile) Other and unknown For wood oil, aromatic compounds are the major constituents represented by 67.43% of phenolic compounds and 16.94% of Furanic compounds, Followed by 7.54% heterocyclic compounds and 5.38% organic acids. Furans, phenols and cyclopentenone are all flammable organics. This could ensure the oils have a good combustibility for use as energy fuels. Barley straw oil is found to be more complex than wood oil, as more types of organic compound with longer carbon chains up to C16 are detected. Apart from cyclicorganic compounds, barley straw oil also contains 18.15% of long-chain hydrocarbon based chloride and nitrile compounds. Long-chain aliphatic compounds can provide better combustion characteristic that aromatics, however, the presence of chloride and nitrogen elements gives concerns relating to hazardous combustion emissions. It is worth noting that the barley straw oil also contains up to 20.15% of “unknown” compounds. These could represent a complex heavy organic fraction causing the bituminous appearance of the oil. This also raises concerns for the aging of barley straw oil over long periods of storage. 92 4.2.5. Permanent Gas Analysis The results of pyrolysis gas analysis are presented in the Figures 4.4a, 4.4b and Table 4.9. These show that the permanent gases consist predominantly of six of gases, H2, O2, N2, CO, CH4 and CO2. Water was not analysed here, as it has been removed from the gas at the condensation and ESP stages. a. Wood Pyrolysis Gas b. Barley Straw Pyrolysis Gas Figure 4.4 GC/TCD Spectrums of the Pyrolysis Gases a. Wood Pyrolysis Gas b. Barley Straw Pyrolysis Gas Unlike with air-blown gasification, there is no oxidisation-reduction reaction taking place in pyrolysis. Formation of permanent gases occurs during the whole pyrolysis process including primary biomass decomposition, secondary cracking and other related reforming reactions. It has been reported that CO2 formation is mainly due to the primary pyrolysis of cellulose and hemicellulose, formation of CO is mostly during the secondary pyrolysis 93 stage, while lignin is mainly responsible for producing CH4 [111]. In Table 4.9, the term “retention time” indicates the gases’ residence time in the GC column (column residence time). Analysis shows that CO2 is the most abundant component representing over 50% in both gases. Next is the combustible faction, mostly CO and CH4, representing 44.18% for wood gas and 33.76% for barley straw gas and giving calculated heating values of 7.27 and 6.92 MJ/m3, respectively. These values are comparable to the HHV of typical air-blown gasification producer gas, which is generally between 4 and 10 MJ/Nm3 [112-114]. It is worth noting that small amounts of H2 are detected in both samples (2.24% and 1.54% for wood gas and barley straw gas). Generally, the content of H2 is not expected in pyrolysis gases, as there is no reduction process for H2 formation to occur. In the Pyroformer, however, hot char is recycled all the time. Contact with water vapour can lead to reactions to form CO and H2 in a heated environment. Table 4.9 Composition of Pyrolysis Gases Component Wood (area%) Barley (area%) 1.9 H2 2.24 1.54 6.9 O2 - 0.42 7.5 N2 5.54 4.68 9.1 CO 34.70 21.74 13.3 CH4 7.24 10.48 16.1 CO2 50.27 60.13 HHV (MJ/kg) 4.88 4.45 HHV (MJ/m3) 7.27 6.92 Retention time (min) The permanent gas normally does not contain N2, as pyrolysis is air-free and N2 is unlikely to be produced in pyrolysis. A small amount of N2 is detected here; this is because there is an air leakage into the reactor from the feeding system. A small leakage is unavoidable, as feedstock pellets are continuously feed into the reactor. Air enters the reactor along with the biomass, causing some pyrolysis vapour combustion and leaving N2 in the gas phase. Minimisation of air leakage from the feeding device is an important target for the development of the Pyroformer reactor. 94 The pyrolysis permanent gas has a satisfactory combustible fraction and energy content. Hence it can be used as a gaseous fuel. Furthermore, researchers have reported that gas post-treatments such as post catalytic reforming have been effective in improving the heating value of the permanent gas [115]. 4.2.6. Char Analysis The char analysis is presented in Table 4.10. Analysis shows that the wood char contains 75.60% carbon and has a heating value of 30.1 MJ/kg and barley straw char contains 74.83% carbon and has a heating value of 32.9 MJ/kg. These compare well to typical subbituminous class coal which contains at least 70% carbon and has a heating value of 30 MJ/kg [116]. As previously discussed, prolonged residence time promotes the secondary cracking reaction and leads to coke formation, leading to a high fraction of carbon in the char product. However, it is also worth noting that both char samples contain high contents of ash (over 10%). Table 4.10 Characterisation of Chars Properties Unit Wood Barley C wt.% 75.60 74.83 H wt.% 3.38 3.51 N wt.% 0.22 0.10 O* wt.% 10.20 8.46 Ash wt.% 10.60 13.10 Heating value MJ/kg 30.1 32.9 Elemental analysis 4.3. Energy Flow The mass balance and energy flows for pyrolysis of wood and barley straw are shown in Table 4.11. For the mass flow, as discussed in the product yields section, the aqueous phase is the largest produced for both feedstocks, followed by char. The oil yield of wood is similar to the gas yield, but that of barley straw is much lower. In the energy yields, it is interesting to see that about 50% of the feedstock energy content remains in the char product, but only 24.6% and 10.0% in the oils of wood and barley 95 straw respectively. This implies that these processing conditions are effective for producing char, but the conversion rate of feedstock to pyrolysis oil is limited, particularly for barley straw. Enhancing the cracking effect of the char by optimising residence time of the feedstock and char/biomass mixing ratio may improve this, but further investigation is required. The overall energy yields are 76.5% and 73.7% for wood and barley straw respectively, but it is worth noting that this does not include the energy content of the aqueous phase of the liquid product. Table 4.11 Mass and Energy Balances Mass Flow (kg/h) Energy Flow (kW) Wood Barley Straw Wood Barley Straw Feedstock 6.00 5.00 30.33 23.61 Oil 1.11 0.29 7.47 2.36 Aqua phase 2.15 2.16 -- -- Char 1.71 1.51 14.30 13.75 Gas 1.03 1.05 1.44 1.29 Difference -- -- 7.12 6.21 Difference -- -- 23.5% 26.3% Further to the work in this section, more detailed analysis on overall system efficiencies, together with an economic assessment of producing pyrolysis, permanent gases and char, are presented in Chapter 7. 4.4. Summary This chapter studied the Pyroformer processing parameters and pyrolysis of two types of pelletised biomass feedstocks. For the Pyroformer, it is found that for a given feed rate, the solid residence time is a function of the inner screw speed, and the char/biomass mixing ratio is dependent of the char recycle rate. Comparison of the results from theoretical calculation and the cold flow experiment indicate that the Capacity Ratio (CR) of char return is in the range of 0.12-0.26, and in the pyrolysis experiment, 0.2 can be used as a realistic estimate. 96 From the biomass pyrolysis experiment, it was found that the proportion of liquid, gaseous and solid product yields were approximately 50 wt.%, 20 wt.% and 30 wt.% respectively; The pyrolysis liquid can naturally separate into an aqueous phase and an organic phase (pyrolysis oil) under gravity. The yields of wood pyrolysis oil and barley straw oil were 18.5% and 5.8% (of the total product), respectively. The char product contained most of the energy from the feedstocks, approximately 50%. The overall energy yields were 76.5% and 73.7% for wood and barley straw respectively. 97 CHAPTER 5 CHARACTERISATION OF INTERMEDIATE PYROLYSIS OILS This chapter presents the results from the detailed characterisation of two kinds of intermediate pyrolysis oil derived from sludge waste, sewage sludge pyrolysis oil (SSPO) and de-inking sludge pyrolysis oil (DSPO). Further to the brief oil characteristics given in Chapter 4, all liquid fuel related properties including the ignition and combustion properties, atomisation properties, safety and corrosiveness are investigated and discussed with regard to the application of the oils as engine fuels. At the end of this chapter, some of these key properties are compared to those of commercial diesel and biodiesel fuels. 5.1. Feedstock Characterisation The sewage sludge and de-inking sludge feedstocks were received wet as raw material. After drying and pelletising, the pellets were characterised for ultimate, proximate and heating value analysis. Table 5.1 Characteristics of Sewage Sludge and De-inking Sludge Feedstock Unit Sewage Sludge De-inking Sludge Ultimate Analysis Carbon wt.% daf 35.6 38.4 Hydrogen wt.% daf 5.2 5.0 Oxygen wt.% daf 53.0 52.7 Nitrogen wt.% daf 4.3 3.7 Sulphur wt.% daf 1.9 <0.1 Moisture wt.% ar 4.7 1.3 Volatiles wt.% ar 63.7 55.1 Ash content wt.% ar 32.6 43.6 Fixed Carbon wt.% ar <0.1 <0.1 HHV MJ/kg ar 11.3 7.0 Proximate Analysis *analysis based on pre-treated feedstock (see Section 3.1), ultimate analysis on dry basis The results are presented in Table 5.1. Ultimate analysis of the feedstocks is presented on a dry ash free basis (daf). De-inking sludge is found to have similar contents of all elements 98 to sewage sludge, apart from carbon (2.8% higher) and trace amounts of sulphur. Unlike feedstocks from green biomass, both sewage sludge and de-inking sludge Newtonian fluid content feedstocks (32.6 wt.% and 43.6 wt.%). Ash consists of the non-combustible, mineral constituents of the feedstock as oxides or salts. Ash from de-inking sludge also contains compounds of silicon and mineral elements such as iron, magnesium and calcium etc. as well as limited amounts of toxic heavy metal elements such as lead and cadmium [117]. High ash content is unfavourable for pyrolysis feedstocks as it reduces the volatile content of the feedstock and hence the oil yield. The quality of char product is also affected by the ash content of the feedstock (incombustible components such as metal oxides), because the ash always remains with the char in pyrolysis. 5.2. Production of SSPO and DSPO The processing conditions used for sewage sludge and de-inking sludge pyrolysis, and the associated product yields, are presented in Table 5.2 [118]. Table 5.2 Pyrolysis Condition and Product Yields Unit Sewage sludge De-inking sludge kg/h 15 15 Temperature °C 450 450 Outer screw rpm 1.5 1.5 Inner screw rpm 4 4 Residence time min 2.69 2.69 -- 2.09 2.09 Liquid (organic/aqueous) wt.% 40 (25/75) 10 (90/10) Gas wt.% 12 11 Char wt.% 48 79 Feed rate Biomass/char ratio Products yield The same processing conditions were used for both feedstocks in order to give a good basis of comparison for the oils produced. The liquid sample was collected after one hour from the beginning of the pyrolysis, when a steady state was established. For sewage sludge, the yields of liquid, permanent gas and solid product were 40 wt.%, 12 wt.% and 48 wt.% 99 respectively (with the gas yield calculated by difference); and for de-inking sludge, the corresponding yields of liquid, gas and solid product were 10 wt.%, 11 wt.% and 79 wt.% respectively. The collected liquid spontaneously separated under gravity into two phases, an organic phase at the top and an aqueous phase at the bottom, within a few hours of production. For sewage pyrolysis liquid, the organic phase was 25 wt.% of the whole liquid and the aqueous phase was 75 wt.%. For de-inking sludge liquid, the organic phase accounted for 90 wt.% and the aqueous phase was 10 wt.%. The organic phases of the liquids formed the SSPO and DSPO. Their characteristics are studied below. 5.3. Characterisation of SSPO and DSPO 5.3.1. Elemental Analysis Table 5.3 presents the CHNOS content of the SSPO and DSPO. It is seen that both the carbon and hydrogen content of the oils are significantly increased, while oxygen is significantly reduced, compared to those of the feedstocks. This can lead to improved heating values for the oils and support the oils’ suitability as fuels. Table 5.3 Elemental Analysis of SSPO and DSPO Elemental analysis Unit SSPO DSPO C wt.% 74.21 76.58 H wt.% 9.96 8.38 N wt.% 5.14 1.86 O wt.% 8.73 12.60 S wt.% 1.96 0.58 Research indicates that modest oxygen content in a fuel oil can have a beneficial effect on combustion efficiency as well as on exhaust emissions from diesel engines. Oxygenated fuel requires less external oxygen from air for complete combustion, due to the presence of oxygen in the oil components [119]. For the same amount of air intake, it therefore gives a higher lambda. For diesel engine operation, reduced CO emission from both pyrolysis oils may be expected, compared with that from diesel fuel with barely oxygen content. 100 However, the nitrogen and sulphur content in the oils, particularly in the case of SSPO, gives concerns over increased NOx and SO2 emissions [120]. 5.3.2. Compositional Analysis Figures 5.1a and 5.1b present the GC/MS mass spectra of SSPO and DSPO, and the corresponding major chemical components identified from the oils by GC/MS are shown in Tables 5.3a and 5.3b respectively, although over 200 peaks corresponding to different organic compounds are detected in each mass spectrum. The Area% in the tables represents the area under the peak for that identified component, expressed as a fraction of the area under the whole spectrum. Since the integrated spectrum is equivalent to mass, this measurement gives an approximate mass fraction of the component. [M1111012] TIC #1 15.29 a. SSPO 10.99 17.51 1.5e5 10.00 30.00 40.00 65.44 44.74 40.32 40.95 36.86 33.15 34.88 35.61 30.62 31.65 29.03 20.00 30.13 25.96 14.55 18.41 20.07 20.87 0.5e5 55.57 22.16 1.0e5 50.00 60.00 70.00 b. DSPO 15.29 [M1111012] TIC #1 10.99 17.51 1.5e5 10.00 40.00 65.44 44.74 40.32 40.95 36.86 33.15 34.88 35.61 30.62 29.03 30.00 31.65 25.96 20.00 30.13 18.41 14.55 20.07 20.87 0.5e5 55.57 22.16 1.0e5 50.00 60.00 70.00 Figure 5.1 GC/MS Spectrum of the Pyrolysis Oils (chemical abundant vs. retention time), a. SSPO, b. DSPO 101 Table 5.4 Composition of the Waste Derived Pyrolysis Oils a. SSPO # Retention Time Chemical Name Formula Area% 1 10.42 unknown - 2.15 2 10.97 Benzene, methyl- C7H8 17.51 3 14.87 unknown - 3.12 4 15.26 Benzene, ethyl- C8H10 8.38 5 15.67 Benzene, 1,3-dimethyl (pXylene) C8H10 1.86 6 17.49 Cyclooctatetraene C8H8 6.9 7 20.06 Decane C10H22 4.33 8 22.15 Benzene, 1-methyethenyl- C9H10 1.53 9 25.42 Undecane C11H24 3.89 10 30.64 Phenol C6H6O 9.17 11 33.18 Phenol, 2-methyl- C7H8O 1.6 12 34.9 Phenol, 4-methyl- C7H8O 8.73 13 35.61 Tridecane C13H28 3.16 14 39.24 Phenol, 4-ethyl- C8H10O 1.57 15 40.96 Phenol, 4-methyl, 2-methoxy- C9H12O2 1.37 16 44.75 Pentadecane C15H32 3.53 17 45.98 Phenylacetonitrile C8H7N 4.86 18 48.94 Hexadecane C16H34 1.8 19 49.36 1H-lindole, 5-methy- C9H9N 2.3 20 52.92 Heptadecane C17H36 2.19 21 55.57 Benzene, 1,1’-(1,3propanediyl) bis C15H16 1.91 22 65.44 Hexadecanenitrile C16H31N 5.47 23 71.97 Heptadecanenitrile C17H33N 2.68 It is found that both pyrolysis oils are complex organic mixtures consisting of carbon chains ranging from C7 to C17 for SSPO and C5 to C15 for DSPO. Similar to fossil diesel fuel, they mainly contain paraffins, naphthenes and aromatics. Aromatic hydrocarbons are the most abundant component in the pyrolysis oils, accounting for 31% of SSPO and 48% of DSPO. Phenols, the other major aromatic compound found in the oils, are also present in significant quantity, over 22% in SSPO and 15% in DSPO. This can be a cause of the high acidity of pyrolysis oils. The high aromatics content may also lead to low cetane 102 index (ignitability) of the oils, as aromatics have poorer combustibility compared with paraffins and naphthenes [121]. b. DSPO # 1 Retention Time 10.99 Chemical Name Benzene, methyl- Formula C7H8 Area% 10.14 2 14.55 Cyclopentanone C5H8O 1.67 3 15.29 Benzene, ethyl- C8H10 17.91 4 17.51 Cyclooctatetraene C8H8 16.51 5 18.41 Benzene, propyl- C6H8 3.39 6 20.07 Benzene, 1-methyl, 2-ethyl- C9H12 3.08 7 20.87 2-Cyclopenten-1-one, 2methyl- C6H8O 3.47 8 22.16 Benzene, 1-methylethenyl- C9H10 5.64 9 25.96 2-Cyclopentenone, 3-methyl- C6H8O 2.19 10 29.03 1-Cyclopenten-1-one, 2,3dimethyl- C7H10O 3.55 11 30.13 Acetophenone C8H8O 1.88 12 30.62 Phenol C6H6O 3.99 13 31.65 Phenol, 2-methoxy- C7H8O2 2.51 14 33.15 Phenol, 2-methyl- C7H8O 1.84 15 34.88 Phanol, 3-methyl- C7H8O 2.31 16 35.61 Tridecane C13H28 1.57 17 36.86 Phenol, 2-methoxy-4-methyl- C8H10O2 2.14 18 40.32 Tetradecane C14H30 2.58 19 40.95 Phenol, 4-methyl, 2-methoxy- C9H12O2 2.51 20 44.74 Pebtadecane C15H32 2.23 21 55.57 Benzene, 1, 1’-(1,3propanediyl) bis C15H16 6.78 22 65.44 Pentadecanenitrile C15H29N 2.13 It is also found that alkanes account for 18% of SSPO, ranging from C 7 to C17, but only for 6% of DSPO, ranging from C13 to C15. Previous research concludes that for compounds with the same carbon number, aromatics give a lower heating value than naphthenes and paraffins on a weight basis [121]. This could explain why SSPO has a higher heating value compared with DSPO. Up to 15% of alkyl nitriles are identified in SSPO and 6% in DSPO, in accordance with nitrogen content in the elemental analysis. Cyclopentanone is another major component in DSPO at 16.5%, but represents only 7% of SSPO. Cyclopentanone is 103 highly flammable which may improve the ignitability of the oil. However, both nitriles and cyclopentanone compounds are highly toxic, and the oil should be handled with care to avoid direct skin contact. 5.3.3. Water Content Water is always produced with pyrolysis oil during the intermediate pyrolysis process. There are two main sources for water content in the oil, feedstock water and reaction water. The intermediate pyrolysis of sewage sludge produced approximately 75% of water in the overall liquid product and de-inking sludge produced approximately 10%. Most of the water content became automatically separated by gravity as a highly aqueous phase in a few hours, at which point it was easily removed. The water content of the remaining organic phase was measured as only 4.37 wt.% in SSPO and 2.97 wt.% in DSPO. As been discussed in the Previous Work chapter, separation of the organic phase from the aqueous phase under gravity also takes place in the fast pyrolysis of sewage sludge. However, according to Font et al. [50], it is still not possible to obtain an organic phase containing less than 20 wt.% water. 5.3.4. Distillation and Calculated Cetane Index Distillation curves of SSPO and DSPO are presented in Figure 5.2 respectively. Unlike mid-distilled fuel oils, the pyrolysis oils contain compounds with a wide range of boiling points, from 60 to 340°C. A noticeable difference in pyrolysis oil curves can be found after 100°C, where the majority of the compounds of the oil are distilled. It has already been pointed out that SSPO contains higher amounts of high boiling point compounds such as phenolics, long-chain hydrocarbons and long-chain nitriles; hence it will have a higher average distillation temperature than DSPO. Low boiling point compounds may have relatively high volatility and may be problematic in long-term storage. The distillation curves for the pyrolysis oils can be used to evaluate the oils’ ignitability, which is normally presented as the Calculated Cetane Index (CCI). The CCI of the SSPO and DSPO are calculated by the following equations (see Section 3.3.2, Equitation 3.1) and the results are given in Table 5.4. 104 350 o Temperature ( C) 300 250 200 150 SSPO DSPO 100 50 0 20 40 60 80 100 Recovery (vol.%) Figure 5.2 SSPO and DSPO Distillation Curves 𝑆𝑆𝑃𝑂 𝐶𝐶𝐼 = 45.2 + 0.0892 × (90 − 215) (5.1) + (0.131 + 0.901 × (2.718(−3.5)×(0.95−0.85) − 1)) × (282 − 260) + (0.0523 − 0.42 × (2.718(−3.5)×(0.95−0.85) − 1)) × (338 − 310) + 0.00049 × ((90 − 215)2 − (338 − 310)2 ) + 107 × (2.718(−3.5)×(0.95−0.85) − 1) + 60 × (2.718(−3.5)×(0.95−0.85) − 1) 𝐷𝑆𝑃𝑂 2 𝐶𝐶𝐼 = 45.2 + 0.0892 × (88 − 215) (5.2) + (0.131 + 0.901 × (2.718(−3.5)×(0.98−0.85) − 1)) × (236 − 260) + (0.0523 − 0.42 ∗ (2.718(−3.5)∗(0.98−0.85) − 1)) × (330 − 310) + 0.00049 × ((88 − 215)2 − (330 − 310)2 ) + 107 × (2.718(−3.5)×(0.98−0.85) − 1) + 60 × (2.718(−3.5)×(0.98−0.85) − 1) 2 It can be seen that both of the pyrolysis oils show rather low CCI, 18 for SSPO and 19 for DSPO, compared to 40 for diesel fuel (see Section 5.4). This is due to the combined effect of wide-range of boiling points and high density of the pyrolysis oils. In addition, the high level of aromatics content plays an important role in reducing the CCI, as for the same carbon number, aromatics have the lowest cetane number, followed by naphthenes and paraffins [121]. 105 DSPO has a slightly higher CCI than DSO, because it has a much lower recovery temperature at 50% recovery (T50), which implies that DSPO contains a greater light organics fraction. This is also expected form the compositional analysis, as DSPO is found to consist of organics having lower average carbon chain length than SSPO. Table 5.5 Distillation Temperatures, Densities and CCI of SSPO and DSPO Property SSPO DSPO T10 90 88 T50 282 236 T90 338 330 Density (15°C) 0.95 0.98 18 19 CCI 5.3.5. Higher Heating Value The experimental results from the bomb calorimeter show that SSPO and DSPO have satisfactory heating values as fuel oils, 39.38 MJ/kg and 36.54 MJ/kg respectively. These results can be reasonably validated according to a general derivation method of HHV based on elemental composition of the compound, as introduced by Channiwala [122], 𝐻𝐻𝑉 = 0.3691𝐶𝐶 + 1.1783𝐶𝐻 + 0.1005𝐶𝑆 − 0.1034𝐶𝑂 − 0.0151𝐶𝑁 − 0.0211𝐶𝐴 (5.3) where, CC, CH, CS, CO, CN, and CA are the mass percentage of relevant elements. Table 5.6 Validations of Measured HHV of SSPO and DSPO Unit SSPO DSPO Measured HHV MJ/kg 39.38 36.54 Calculated HHV MJ/kg 38.39 36.92 Difference -- -2.51% +1.03% The results based on the elemental composition of the pyrolysis oils in Table 5.1 are 38.39 KJ/kg (SSPO) and 36.54 KJ/kg (DSPO). This represents deviations of about -2.51% and +1.03% from the measured results for SSPO and DSPO respectively. Given the calculation is based on a general empirical expression, and it neglects the effect of molecular structure on the heating value (different materials having the same elemental formula can have small 106 difference in heating value), the HHV differences are acceptable [123]. The empirical equation given above also shows the impact of oxygen content in HHV reduction. For pyrolysis oils, oxygen could be contained in the presence of organic groups such as hydroxyl, aldehyde, carboxyl, ether and carbolic etc. The values of HHV for both oils are satisfactory compared to that of diesel fuel- 45.36 MJ/kg (see Section 5.4). 5.3.6. Density The densities of the intermediate pyrolysis oils are shown in Figure 5.3, as a function of temperature. SSPO DSPO Density (g/ml) 0.985 0.980 0.955 0.950 12 14 16 18 20 22 24 26 Temperature ( C) Figure 5.3 Densities of the Pyrolysis Oils The linear relationships show that the densities at 20°C for the SSPO and DSPO are 0.9536 g/ml and 0.9819 g/ml, respectively. These results are slightly lower than that of water, and this is the reason that the organic phase appears uppermost in the pyrolysis liquid, unlike oils form wood and barley straw presented in Chapter 4. This finding for SSPO agrees with other pyrolysis oils derived from sewage sludge by fast pyrolysis, which also have lower densities than water [124]. But there is no such information available for de-inking sludge derived pyrolysis oil. 5.3.7. Viscosity The kinematic viscosity is the resistance to flow of the pyrolysis oils under gravity, and is measured by using glass capillary measuring tubes. The method is intended for application to Newtonian fluids, for which the shear stress is linearly proportional rate of shear at 107 every point. The pyrolysis oil samples are considered as Newtonian fluids here [125]. It is important to choose an appropriate measuring tube, according to the estimated kinematic viscosity of the oil samples prior to the measurement. The results of the measured parameters and the calculated kinematic viscosity are presented in the Table 5.7. Table 5.7 Kinematic Viscosity Unit Tube -- Size No. -- SSPO Cannon-Fenske Routine Viscometer DSPO Cannon-Fenske Routine Viscometer 200 100 2 2 Constant mm /s 0.1 0.015 Temperature °C 40 40 Δt s 387.5 640.0 Kinematic Viscosity mm2/s 38.75 9.60 The SI unit of kinematic viscosity is m2/s; however, it is more commonly quoted in stokes (St) or centistokes (cSt), 1 𝑐𝑆𝑡 = 1 𝑚𝑚2 /𝑠 = 10−6 𝑚2 /𝑠 (5.4) The kinematic viscosity of SSPO and DSPO was measured at a temperature of 40°C as required by the ASTM standard. The results show that SSPO has a very high value of 38.75 cSt, which is slightly higher than biomass fast pyrolysis oils (ranging from 10-30 cSt) at 40°C [126]. DSPO has a lower value of 9.60 cSt, but it is still not comparable to that of conventional diesel fuel (between 1.9 and 4.1 cSt, see Section 5.4). Viscosity of the pyrolysis oils may increase over the time, as some of the reactive components can interact to polymerise and form larger molecules. This is one of the results of oil aging. 5.3.8. Surface Tension Surface tension is the specific surface free energy of a liquid gas interface, and the SI unit for surface tension is millinewton per metre (mN/m). The dynamic surface tension of the SSPO and DSPO was measured at a temperature of 20°C. It is found that both SSPO and DSPO have similar surface tensions, i.e. 29.3 mN/m and 27.9 mN/m, respectively, and these are comparable to that of diesel fuel at 25.7 mN/m. Surface tension, with the combined effects of liquid density and viscosity, plays an important role for droplet 108 formation. It is known that high surface tension of the liquid fuel makes droplet formation more difficult and hence results in inefficient atomisation [127, 128] 5.3.9. Flash Point Flash point is used to assess the overall flammability of the pyrolysis oils. Liquid does not burn itself; it is the vapour from the liquid. Low flash point liquids normally have a high ability to generate vapour (volatility) and can more easily catch fire in ambient conditions than high flash point liquids. The analysis of flash point shows that both SSPO and DSPO have very high flash points, 150°C for SSPO and 160°C for DSPO. This means that both of the pyrolysis oils are not highly flammable. The US National Fire Protection Association classifies flammable liquids having flash points greater than or equal to 93 °C (200 °F) as Class IIIB combustible liquids. This is the lowest flammability class among the flammable liquids. 5.3.10. Acidity Acidity in the present work is measured using Total Acid Number (TAN), which is expressed as milligrams of KOH required to titrate per gram of oil sample (mgKOH/g), as described in the Chapter 3. The results show that SSPO has a TAN of 19.9 mgKOH/g, and DSPO has a TAN of 30.03 mgKOH/g. This is because the oils contain large amounts of phenolic compounds which can give hydrogen ions to neutralise the KOH during the acid titration. Also it is possible that there are some unidentified aliphatic acidic constituents present in the oil, as well as some water soluble carboxylic acids in the water faction. Both the acidity results are considered very high for fuel oils compared to that of diesel fuel, which is neutral (TAN less than 0.01). This could pose challenges for the oils’ utilisation, as they may be corrosive to metals in storage or engine components. However, ASTM D664 states that there is no clear correlation between oil acid number and metal corrosiveness [129]. 5.3.11. Corrosiveness The results of the copper corrosion tests, as well as the ASTM standard, are presented in Figure 5.4a and 5.4b. These results are from newly polished copper strips immersed in a standard sample amount of SSPO and DSPO at 40°C for 6, 12 and 24 hours. It is seen that 109 after 6 hours, the tarnish of the copper strips in the SSPO is rated at 2b, which is less severe than the DSPO strip at 2d. However, after 12 hours, the tarnish for the SSPO strip becomes more severe than that for DSPO. The rating for SSPO has become close to 4a. Eventually, after 24 hours, the SSPO strip is completely corroded, whereas the DSPO strip is still between 3a and 3b. a b Figure 5.4 Copper Corrosion of the Pyrolysis Oils (a. SSPO; b. DSPO) This result is the opposite to that from the acidity tests discussed above, where the DSPO might have been expected to show higher corrosiveness because of its higher TAN. This concurs with comments in ASTM D664 which suggests that there is no clear correlation between the TAN and metal corrosiveness [31]. Nevertheless, the black colour proves that there is electrochemical corroding reactions taking place and the acidic substances are believed to play an important role. Use of corrosive fuels in an engine can result in corrosion to the metal components of the fuel system and consequently a danger of engine failure. Concerns over corrosion are also important for long-term oil storage and transport. 5.3.12. Lubricity The oil lubricity test was carried out using a High Frequency Reciprocating Rig (HFRR), where two contacting specimens immersed in the testing oils are given relative motion to cause friction and wear. If the specimens are the same material, the friction and wear between the surfaces are mainly determined by the properties of the contacting fluid. Hence the boundary lubricating effect of the oils can be evaluated from the dimensions of the wear scar, in micrometres, produced on the test specimen. Figure 5.5a and 5.5b 110 illustrate the wear scars from SSPO and DSPO (100× magnification), and Table 5.7 lists the measured dimensions of the wear scars. a b Figure 5.5 Ware Scares (a. SSPO; b. DSPO) It is found that the average dimension of the wear scar generated from DSPO is 215 µm, slightly smaller than that from SSPO at 267 µm. These values are significantly less than the required level for conventional diesel fuel (520 µm) in the ASTM standard [130], hence the pyrolysis oils have sufficient lubricity to protect against mechanical wear of the engine fuel system. The DSPO exhibits a better lubricity than SSPO, as the average antiwear film between the two contacting specimens created by DSPO (34%) is thicker than that created by SSPO (11%). Table 5.8 Dimensions of SSPO and DSPO Wear Scars Unit SSPO DSPO Movement frequency Hz 50 50 Stroke µm 1000 1000 Average temperature °C 60 60 Average film % 11 34 Wear scare X µm 306 233 Wear scare Y µm 228 196 Average wear scare µm 267 215 This result contravenes the common assumption that oils with higher viscosity have a better lubricating effect. However, in the ASTM standard specifications, it is pointed out 111 that this test method is designed to evaluate boundary lubrication properties, and the viscosity effects on lubricity have been minimised [130]. In addition, the wear scar on the specimen can also be related to the presence of solid abrasive particulates in the testing oil samples [131]. 5.3.13. Carbon Residue and Ash Carbon residue is the carbonaceous residual deposit formed by evaporation and thermal degradation of a carbon containing material. Apart from the carbonaceous materials formed during oil combustion, the formation of carbon residue is also related to the oil ash content [132]. Ash arises from the oil-soluble or water-soluble metallic compounds as well as from foreign impurities such as dirt and rust in the oil. Table 5.9 gives the measured carbon residue and ash content for the pyrolysis oils. Table 5.9 Carbon Residue and Ash Content of SSPO and DSPO Unit SSPO DSPO Carbon Residue wt.% 2.38 5.26 Ash Content wt.% 0.23 0.16 It is found that the carbon residue of DSPO (5.26 wt.%) is much higher than that of SSPO (2.38 wt.%). However, in contrast, the ash content of DSPO (0.16 wt.%) is slightly lower than that of SSPO (0.23 wt.%). The diesel fuel standard requires extremely low yields of carbon residue and ash from diesel combustion (up to 0.01 wt.% for both materials, see Section 5.4), and therefore these values for pyrolysis oils seem problematic. Carbon residue and ash are unavoidable for wastes-derived pyrolysis oils due to the nature of the feedstocks. However, post-treatment measures, such as a physical filtration, may be easily applied to reduce the carbon residue and ash resulting from the foreign impurities. Further measures like oil distillation can permanently remove the heavy viscous fraction of the oil which is more difficult to combust (and therefore yields carbon residue), provided the distilled oil has a good stability. 5.4. Comparisons of Pyrolysis Oils with Diesel and Biodiesel The operational parameters of stationary diesel engines, such as fuel injection and ignition, are normally optimised for fuelling with diesel fuels based on diesel characteristics, and 112 these can be relatively easily adjusted for fuelling with biodiesel, as biodiesel has many similar characteristics to diesel fuel [133]. Development of waste-derived pyrolysis oils as diesel engine fuels is in the early stages, so there is no characterisation standards yet established. In Table 5.10, some of the measured characteristics of SSPO and DSPO are compared to the ASTM standards for commercial diesel and biodiesel. Figure 5.6 shows the comparison of these properties against actual measured values for diesel and biodiesel. It is well known that fuel density, viscosity and surface tension have a significant effect on fuel injection parameters such as injection timing, injection pressure and injection duration. This is resulted from their influence on the atomisation process during injection [134, 135]. Both pyrolysis oils have higher density and higher viscosity compared to diesel and biodiesel. High viscosity can lead to advanced injection timing, but high viscosity also tends to retard the injection timing, as it causes more friction when the oil is travelling through the injector nozzle [135, 136]. These effects can, to some extent, compensate each other. However, the consequences of the high viscosity particularly of pure SSPO are of considerable concern (35.75 cSt compared with 4 cSt for diesel). High viscosity is also considered beneficial in lubricating the fuel supply system and thus decreasing mechanical wear to the metals, however on the other hand it can worsen the flow characteristics of the fuel. High viscosity can also result in deteriorated atomisation in the nozzle, which can result in incomplete combustion and, consequently, engine power loss and increased emissions. The high density of pyrolysis oils can also have effect on combustion. Since the injection system works primarily on a volume basis, a greater mass of the higher density pyrolysis oils will be injected. This can compensate to some extent for the low HHV of the oils when compared to biodiesel. But it is also likely to cause a greater spray cone angle as well as reduced fuel spray penetration in the cylinder, which may result in a poorer combustion and unstable engine operation [134] Surface tension of the pyrolysis oils is similar to those of diesel and biodiesel, as shown in Figure 5.6. A low surface tension is considered beneficial, since high surface tension opposes the formation of the spray droplets and can generally decrease the initial spray velocity and hence cause poor atomisation and poor ignition. 113 Table 5.10 Comparison of Fuel-Related Properties of Pyrolysis Oils to Diesel and Biodiesel Property Unit SSPO DSPO Diesel Biodiesel MJ/kg 39.38 36.54 45.36 39.65 18 19 40 47 g/ml 0.9536 0.9819 0.8246 0.8846 Kinematic Viscosity at 40°C cSt (min-max)* 38.75 9.60 2.85 (1.9-4.1) 6.56 (1.9-6.0) Surface Tension at 20°C mN/m 29.3 27.9 25.7 31.7 Flash Point °C (min)* 150 160 60 (52) 130 (130) Moisture wt.% (max)* 4.37% 2.97% 0.05% 0.05%* mgKOH/g (max)* 19.90 33.03 <0.01 (0.01) 0.5 (0.8) Lubricity (wear scar) mm (max)* 267 215 276 (520) 202 (N/A) Copper Corrosion at 24h/40°C -(max)* 4b 3b 1a (3) 1b (3) CCR wt.% (max)* 2.38 5.26 <0.01 (0.01) 0.06 (0.05) Ash Content wt.% (max)* 0.23 0.16 <0.01 (0.01) 0.05 (0.10) HHV CCI Density at 20°C TAN *Limitations required by ASTM D975 standard for diesel and D6751 standard for biodiesel. The HHV of a fuel oil affects the fuel efficiency and power output of a diesel engine. A reduction in the HHV of a fuel oil will reduce the engine thermal input for the same fuel consumption rate, and increase the fuel consumption rate for the same power output. Figure 5.6 shows both pyrolysis oils giving satisfactory HHVs, particularly for SSPO (39.38 MJ/kg), which is comparable to that of biodiesel (39.65 MJ/kg) as measured by the Karl Fischer titration method (See Section3.3.2). The reduced HHV for the pyrolysis oils is directly related to the content of oxygen in the oils, although as indicated earlier, some oxygen in the fuel can improve combustion quality and hence give reduced carbon particulates, CO and unburned hydrocarbons in the exhaust emissions. 114 50 40 1 45.35 39.38 39.65 36.54 30 0.9629 0.8966 0.9 0.8246 0.8 20 0.7 SSPO DSPO Diesel Biodiesel SSPO a. HHV (MJ/kg) 50 40 0.9819 DSPO Diesel Biodiesel b. Density at 20 °C (g/ml) 50 38.75 40 30 38.75 30 20 9.06 10 20 2.85 6.56 9.06 10 0 2.85 6.56 0 SSPO DSPO Diesel Biodiesel SSPO c. Viscosity at 40 °C (cSt) DSPO Diesel Biodiesel d. Surface Tension at 20 °C (mN/m) Figure 5.6 Comparisons of Oil Properties (a. HHV; b. Density; c. Viscosity; d. Surface Tension) Water content in fuels is highly unfavourable for engines, and the content is strictly controlled in the standard for diesel and biodiesel (ASTM regulates less than 0.05%). In engine applications, water can cause ignition delay and deteriorated emissions by reducing the local temperature of the combustion chamber and the fuel evaporation rate [66]. Furthermore, it can lead to rusting and corrosion of the metal parts and cause emulsion formation in the fuel system. Water content in SSPO and DSPO are 4.37% and 2.79% respectively. This could be considered as reasonable since it does not greatly reduce the oil heating values and does not lead to a further significant phase separation problem during oil storage. Furthermore, modest water content in the oils, by reducing the combustion temperature in the cylinders, can reduce NOx emission. However, the water content may result in metal electrochemical reactions in the long term, and may decrease the oil stability by allowing the growth of microorganisms causing further phase separation [137]. The flash point is the lowest temperature at which fuel oil can vaporise to form an ignitable mixture with air. Hence it gives an indication of the maximum temperature that the oils can be stored and handled without fire risk. Flash point determines the safety class of fuel oils in storage and transportation and must be always specified in the fire precaution 115 regulations. Both SSPO and DSPO show a satisfactory flash point, 150°C and 160°C respectively compared to 130°C for biodiesel and 53°C for diesel. The CCI of the pyrolysis oils is much lower than those of diesel and biodiesel, as they contain high levels of heavy organic fraction. A low CCI indicates that pyrolysis oils may have difficulty in compression ignition in the diesel engine and may exhibit incomplete combustion and consequent reduced engine thermal efficiency. Both pyrolysis oils show a high acidity (TAN) and significant copper strip corrosion. These two characteristics are well above the required level, and as a result, could cause significantly shortened fuel system life and reduced engine durability. Lubricity of the pyrolysis oils on the other hand are satisfactory, with both giving a test specimen wear scar half the size of that from diesel. However, this test does not reveal the effect of solid abrasive particulates in the oil, only that of mechanical friction due to the lack of lubricity. The CCR of both pyrolysis oils is very high compared with the limit of 0.05 wt.% specified in the ASTM biodiesel standard, being 2.38 wt.% for SSPO and 5.26 wt.% for DSPO. These very high values are likely to correlate with fuel injector nozzle clogging and combustion chamber deposits which can affect combustion and overall engine performance. Ash content of the oils was measured as 0.23 wt.% for SSPO and 0.16 wt.% for DSPO. This may be acceptable for a furnace or boiler, but is well above the biodiesel standard maximum of 0.1 wt.% maximum [138]. In summary, the pyrolysis oils possess some satisfactory physical and chemical properties for use as diesel engine fuels, but other properties are unsatisfactory to varying degrees and may cause deteriorated engine performance and even reduced engine life. Some of these negative properties could be mitigated by the use of additives or other upgrading processes. More likely to be successful however would be the blending of the oils with better quality fuel oils such as diesel or biodiesel. Some properties (e.g. water content, carbon residue) would simply be the mass-weighted average of the blend; others (e.g. surface tension, corrosiveness) would show a more complex relationship, but all the problematic properties should show some improvement depending on the pyrolysis oil fraction in the blend. Before looking into the characteristics of the oil blends, it is important to know whether the oils are miscible and if so, in what proportions these oils can be blended and whether the 116 blends are stable. Some previous research has suggested that pyrolysis oils generally tend to be unstable in short-term storage (up to 3 months), as they exhibit phase separation and increased viscosity in the organic phase [139]. Therefore, tests on the intermediate pyrolysis oils as well as on their blends with diesel fuel or biodiesel need to be conducted. The focus in terms of engine application now shifts to blends of pyrolysis oils with biodiesel. The following chapter presents work on the miscibility of the pyrolysis oils in biodiesel and the characteristics of resulting blends at different proportions, followed by engine testing of the blends. 5.5. Summary This chapter studied the detailed characteristics of two kinds of intermediate pyrolysis oils, i.e. SSPO derived from sewage sludge and DSPO derived from de-inking sludge. Both pyrolysis oils were found formed of organic mixtures consisting of aromatics, long chain hydrocarbon, alkyl nitriles and cyclopentanone. The carbon, hydrogen and oxygen content of both SSPO and DSPO were found comparable to biodiesel, but the oxygen content was considerably higher than for diesel fuel oil. SSPO and DSPO showed satisfactory heating values as well as water content, surface tension, flash point and lubricity compared with diesel and biodiesel, but may present poor combustibility, corrosiveness to metal and carbon deposition. S 117 CHAPTER 6 ENGINE TESTING OF INTERMEDIATE PYROLYSIS OIL AND BIODIESEL BLENDS This chapter is concerned with engine test runs using intermediate pyrolysis oils in blends with biodiesel (BD). The characteristics of the pyrolysis oil/biodiesel blends are analysed and discussed first, followed by the diesel engine tests themselves. The test results are discussed in comparison with those obtained from 100% diesel and 100% biodiesel tests in the same engine. Two SSPO blends (30/70 SSPO-BD and 50/50 SSPO-BD, on a volume basis) and one DSPO blend (30/70 DSPO-BD, on a volume basis) are studied. The engine electrical efficiency, specific fuel consumption and exhaust emissions for each fuel are measured and compared. In order to understand the engine mass and energy balances, detailed calculations of the air-fuel ratio (AFR) and other fuel combustion related factors are also presented. 6.1. Characterisation of SSPO-BD Blends This section addresses the characterisation of biodiesel and SSPO blends. As discussed in the Chapter 5, some properties of the pyrolysis oils, such as low cetane index, high viscosity and high acidity, raise concerns over their suitability as diesel engine fuels. This works considers using blends of SSPO with biodiesel to mitigate the negative factors. Blends of 30/70 and 50/50 SSPO-BD blends (volumetric ratio) were prepared manually and characterised prior to engine tests. 6.1.1. The SSPO and Blends Figure 6.1 shows images of the 100% biodiesel (Bottle 1), 100% SSPO (Bottle 2), SSPOBD blends (Bottles 3-5) and also a blend of SSPO and commercial fossil diesel in a 30/70 ratio (Bottle 6). The blends were prepared 2 hours before the images were recorded. A comparison between Bottles 3, 4 and 6 clearly shows a good miscibility of the SSPO in biodiesel compared with fossil diesel, as no visible phase separation can be observed in the SSPO-BD blends, whereas with the commercial diesel blend, clear phase separation can be seen. In the unfiltered SSPO-BD blends (Bottles 3 and 4) there was very small amount of solid residue settled in the bottom of the bottles several hours after the blend was prepared. This residue was mainly the solid particulate formed in the pyrolysis process, which the hot gas filter 118 was unable to completely remove from the pyrolysis vapour before condensation. Bottle 5 is the residue-free oil after the filtration of the SSPO by a 200-micron sock filter. The blends are physically stable - no phase separation was observed after about hundred days. Figure 6.1 Comparison of the Different Oils and Blends 1. 100% biodiesel; 2. 100% SSPO; 3. 30/70 SSPO-BD blend; 4. 50/50 SSPO-BD blend; 5. Filtered 50/50 SSPO-BD blend; 6. 20/80 SSPO-diesel blend 6.1.2. Compositional Analysis Full elemental compositions of the oils have been presented in the previous chapter. Table 6.1 gives the comparison of the CHO contents of 100% biodiesel, 100% SSPO, 100% DSPO and their blends on a nitrogen and sulphur free basis. Table 6.1 Comparison of the CHO of Different Oils and Blends Unit BD SSPO DSPO **30% SSPO **50% SSPO **30% DSPO C wt.% daf 79.5 79.9 78.5 79.7 79.7 79.1 H wt.% daf 12.7 10.8 8.6 12.1 11.8 11.5 O wt.% daf 7.9 9.4 12.9 8.2 8.5 9.3 Elemental Composition *Calculated by difference **Calculated on mass-weighted average basis It shows that the carbon contents of the SSPO and DSPO are similar to that of biodiesel, and therefore those of the blends are also similar. SSPO has approximately 15% less hydrogen, but 16% more oxygen than biodiesel; while DSPO has approximately 33% less hydrogen, but 40% more oxygen than biodiesel. These are the main causes for the pyrolysis oils having reduced heating value compared to biodiesel, but these differences 119 are, to some extent, mitigated by the blending. However, it is worth noting that the pyrolysis oils, SSPO in particular, contain considerable amount of nitrogen and sulphur (see Table 5.3), which raise concern about the potential high NOx and SO2 emissions [47]. 6.1.3. Physical and Chemical Properties Comparisons of the physical and chemical properties of 100% biodiesel, 100% SSPO, 100% DSPO and their blends are shown in Figure 6.2. These values for the blends were measured, not simply calculated as a mass-weighted average. It can be seen that the levels of most of the unfavourable properties of the SSPO and DSPO (including viscosity, acidity, carbon residue and ash content) have been approximately proportionally reduced by blending with biodiesel. 41 40 39 38 37 36 35 39.65 39.57 39.38 39.52 38.79 36.54 BD SSPO 30/70 SSPO-BD 50/50 SSPO-BD DSPO 30/70 DSPO-BD a. HHV (MJ/kg) 0.9819 1 0.9536 0.96 0.92 0.9137 0.8966 0.9251 0.901 0.88 0.84 BD SSPO 30/70 50/50 SSPO-BD SSPO-BD DSPO 30/70 DSPO-BD 9.6 8.91 DSPO 30/70 DSPO-BD b. Density at 20 °C (g/ml) 50 38.75 40 30 18.08 20 10 11.21 4.7 0 BD SSPO 30/70 SSPO-BD 50/50 SSPO-BD c. Viscosity at 40 °C (cSt) 120 40 33.03 30 19.9 20 10 4.42 0.11 8.55 7.66 0 BD SSPO 30/70 SSPO-BD 50/50 SSPO-BD DSPO 30/70 DSPO-BD d. Acid Number (mgKOH/g) 5 4.37 4 2.97 3 2.32 1.7 2 1 1.04 0.05 0 BD SSPO 30/70 SSPO-BD 50/50 SSPO-BD DSPO 30/70 DSPO-BD e. Water Content (wt.%) 6 5 4 3 2 1 0 5.26 2.38 1.21 0.79 0.98 0.06 BD SSPO 30/70 SSPO-BD 50/50 SSPO-BD DSPO 30/70 DSPO-BD f. Carbon Residue (wt.%) 0.23 0.25 0.20 0.14 0.15 0.08 0.10 0.05 0.16 0.03 0.01 0.00 BD SSPO 30/70 50/50 SSPO-BD SSPO-BD DSPO 30/70 DSPO-BD g. Ash (wt.%) Figure 6.2 Comparisons of Characteristics of Different Oils and Blends (a. HHV, b. Density, c. Viscosity, d. Acidity, e. Water content, f. Carbon Residue, g. Ash Content) 121 Density and viscosity significantly affect the oil injection process and the atomisation quality achieved in the cylinder. The densities of 100% SSPO and DSPO (Figure 6.2b) were measured as 0.9536 and 0.9819 g/ml. This is significantly lower than a typical fast pyrolysis oil with a density of 1.2- 1.3 g/ml [47, 140], and blending with the lower-density biodiesel reduces the density further. Blending of SSPO with biodiesel reduces the viscosity of the oil (Figure 6.2c) from 38.75 cSt for 100% SSPO to 11.21 cSt for the 30% SSPO blend and 18.08 cSt for the 50% SSPO blend, a slightly greater reduction than would be predicted by mass-weighted averaging. Vegetable oils with equivalent or higher viscosities and densities have been used successfully in diesel engines giving good engine performance [140-142]. As previously described, both of the pyrolysis oils have very low water contents (Figure 6.2e), as they are the separated organic phase of the pyrolysis liquid. This is an important factor in the pyrolysis oils having such a high heating value of 39.36 and 36.54 MJ/kg (Figure 6.2a), very similar to that of biodiesel at 39.65 MJ/kg. As would be expected, blending the pyrolysis oils with biodiesel gives no significant change in heating value, but reduces the water content of the blends further to 2.32% for 50% SSPO, 1.04% for 30% SSPO and 1.70% for 30% DSPO. These values are similar to those predicted by massweighted averaging. A reduction in acid number with water content can be seen in Figure 6.2d, a correlation which has been identified in other work [142, 143]. The 30% SSPO blend has a modest acidity level of 4.42 mgKOH/g, which should not lead to significant fuel system corrosion in the short term; however this needs further experimental investigation. Water content of the pyrolysis oil blends are less than 3 wt.%. This is satisfactory as the ASTM standard defines 30 wt.% water content as the upper limit for pyrolysis oils . A small amount of water content can have the beneficial effect of lowering the combustion temperature in the cylinders and thereby reducing NOx emissions. The carbon residue and ash content of the blends were found to be in line with the massweighted average (Figures 6.3f and 6.3g). 6.2. Fuel Combustion and Estimation of the Oil Empirical Formula The thermal efficiency and energy balance are the most important indicators of the performance of an engine system. They are related to the fuel combustion, energy conversion efficiency and engine emissions. This section addresses the estimation of the 122 empirical formulae of the oils and blends, which are critical for calculating the system efficiency and energy balance. 6.2.1. Air-fuel Ratio and Lambda The air-fuel ratio (AFR) varies when the diesel engine operates at different loads. The AFR decreases as engine load increases, as more fuel is consumed at a high load. Unlike SI engines, diesel engines do not throttle air intake, so for a constant engine speed the air intake is constant and diesel engines always operate with a lean mixture ( > 1.0). In fact CI engines commonly operate at a of about 1.7 at full load to ensure complete combustion and avoid engine knocking [19]. In the engine exhaust diagnostics, is calculated from the measured concentrations of oxygen and carbon dioxide in the exhaust gases. Actual AFR is then derived. In the present work, lambda at different engine loads is indicated by the exhaust analyser, based on a pre-set AFRstoi of 14.6 for a diesel fuel. With a known lambda, the actual AFR can be calculated (as shown in Chapter 3). The mass flows of air intake and exhaust gas can be then calculated. However, for biodiesel and pyrolysis oil blends, the AFRstoi are different to that of diesel, and corrections must be made. The following section deals with the calculation of AFRstoi for biodiesel, SSPO and DSPO. In order to validate the calculation result, AFRstoi for diesel fuel is also calculated using the same method and compared with the known value. 6.2.2. Estimation of Empirical Formula of Oils and Blends The empirical formula of the oils was estimated based on the contents of carbon hydrogen, nitrogen, oxygen and sulphur in the oils. The average chemical formula of an oil can be expressed as: 𝐶𝑥 𝐻𝑦 𝑁𝑧 𝑂𝑚 𝑆𝑛 where, x, y, z, m, n are the number of atoms for the elements. Table 6.2 shows the results of elemental analysis for different oils. 123 Table 6.2 Elemental Analysis of Diesel, Biodiesel, SSPO And DSPO Content C Unit wt.% Diesel 85.60 Biodiesel 78.86 SSPO 74.21 DSPO 76.58 H wt.% 13.37 12.63 9.96 8.38 N wt.% - - 5.14 1.86 O wt.% - 8.36 8.73 12.60 S wt.% 1.03 0.15 1.96 0.58 According to the element contents and their molecule weights, the constant numbers x, y, z, m, n can be calculated as: 𝑥 = 𝐶𝐶 ⁄12 ; 𝑦 = 𝐶𝐻 ⁄1 ; 𝑧 = 𝐶𝑁 ⁄14 ; 𝑚 = 𝐶𝑂 ⁄16 ; 𝑛 = 𝐶𝑆 ⁄32 (6.1) where CC, CH, CN, CO and CS are the mass percentages of carbon, hydrogen, nitrogen, oxygen and sulphur respectively, to give an oil molecule with a nominal molecular weight of 100. The results calculated from these equations are shown in Table 6.3. Table 6.3 Calculated Atom Numbers for Different Oils Diesel Biodiesel SSPO DSPO x 7.13 6.57 6.18 6.38 y 13.37 12.63 9.90 8.38 z 0 0 0.36 0.13 m 0 0.52 0.50 0.79 n 0.01 0 0.01 0.01 The assumption of a molecular weight of 100 is arbitrary, so the formulae can be simplified by normalising to one atom of carbon. These are shown in Table 6.4. Table 6.4 Average Chemical Formulas for Different Oils Average Formula Simplified Average Formula C7.1H13.4 CH1.874 C6.6H12.6O0.5 CH1.922O0.080 SSPO C6.2H9.9N0.4O0.5 CH1.601N0.059O0.081 DSPO C6.4H8.4N0.1O0.8 CH1.313N0.021O0.125 Diesel Biodiesel 124 6.2.3. Calculation of Stoichiometric Air-fuel Ratio Calculation of AFRstoi for the oils uses the simplified average chemical formulae. Fuel combustion is an oxidisation reaction and the equation is expressed as: 𝐶𝐻𝑥 𝑂𝑦 𝑁𝑧 + 𝑚𝑂2 = 𝐶𝑂2 + 𝑧𝑁𝑂 + 𝑛𝐻2 𝑂 (6.2) where: 𝑚= 2+𝑧+𝑛−𝑦 𝑥 ; 𝑛= 2 2 and the equation of AFRstoi is derived: 𝐴𝐹𝑅𝑠𝑡𝑜𝑖 = 𝑚𝑊𝑂2 𝜌𝑎𝑖𝑟 𝑊𝐶𝐻𝑥𝑂𝑦𝑁𝑧 0.21 × 𝜌𝑂2 (6.3) where, WCHxOyNz and WO2 are the molecular weights of CHxOyNz and O2; ρair and ρO2 are the densities of air and oxygen (1.29 kg/m3and 1.43 kg/m3 respectively at standard conditions: (0°C and 1 atm). The air is assumed to be a simplified air consisting of 0.21 O 2 and 0.79 N2 only. The calculated AFRstoi are given in Table 6.5. Table 6.5 Calculated Stoichiometric Air-Fuel Ratio for Different Oils Simplified Estimated Average Chemical Formula AFRstoi CH1.874 14.6 CH1.922O0.080 13.2 SSPO CH1.601N0.059O0.081 12.1 DSPO CH1.313N0.021O0.125 11.4 Diesel Biodiesel It is seen that the calculated AFRstoi for diesel fuel (14.6) is in accordance with the commonly accepted stoichiometric AFR of diesel fuel. This provides validation of the method of calculation. 125 6.3. Engine Tests The results of engine tests using SSPO-BD blends and DSPO-BD blends are presented in this section. As described in Chapter 3, the engine was operated at a range of load conditions of 3.7, 5.2, 6.4, 8.6 and 11.2 kW, corresponding to 25%, 35%, 42%, 57% and 75% of the full engine load. Due to the limited pyrolysis oil supply, only two blends of SSPO and one blend of DSPO were tested. SSPO blends were tested at all load ranges, but the DSPO blend only tested from 3.7 kW to 8.6 kW. Tables containing full measured data and derived results from the engine tests are presented in Appendix 2. The following sections present comparisons of the test results using graphs. 6.3.1. Power and Electrical Efficiency Engine electrical efficiency against engine electrical power for different fuels are shown in Figure 6.3 [144] and Table 6.6 respectively. It is seen that all curves show a trend of increasing electrical efficiency with electrical power for all fuels. The efficiency with diesel increases most sharply and is the highest of the fuels tested from medium powers upward, although it is the lowest at low power. At the highest load, 11.5 kW, the efficiencies with 30% SSPO and 50% SSPO are 2.7% and 4.8% lower than that with diesel. This is likely to be due to the lower heating values and poorer combustibility of the pyrolysis oil blends, particularly at the lower air-fuel ratios associated with high powers. 30 29 Electrical Effciency (%) 28 27 26 25 24 23 22 Diesel Biodiesel 30% SSPO 50% SSPO 30% DSPO 21 20 19 3 4 5 6 7 8 9 10 11 Electrical Power (kW) Figure 6.3 Comparison of Electrical Efficiencies 126 12 A lower HHV fuel requires a greater flow rate than a higher HHV fuel for a same electrical power. This leads to a greater volume of combustion products leaving the engine with more heat and therefore gives relatively lower electrical efficiency. The electrical efficiency with 100% biodiesel is higher than those of pyrolysis oil blends at all power conditions. Table 6.6 Engine Electrical Efficiency under Different Air-fuel Equivalence Ratio (λ) Diesel Load 1 Load 2 Load 3 Load 4 Load 5 Biodiesel 30% SSPO 50% SSPO 30% DSPO Lambda Eff. Lambda Eff. Lambda Eff. Lambda Eff. Lambda Eff. 3.224 0.207 3.431 0.224 3.623 0.213 3.689 0.207 4.191 0.212 2.159 0.245 2.508 0.247 2.595 0.241 2.708 0.230 3.313 0.234 1.930 0.266 2.242 0.263 2.328 0.260 2.504 0.248 2.587 0.254 1.828 0.284 2.156 0.281 2.246 0.281 2.356 0.268 2.253 0.264 1.748 0.292 2.055 0.287 2.148 0.285 2.218 0.279 -- -- It is worth noting that the electrical efficiency of 30% SSPO is marginally lower than that of biodiesel at full load, but the difference increases as engine load reduces. The electrical efficiency of 50% SSPO is nearly 1.5% lower than that of biodiesel across the power range. It is observed that above 5.2kW (35% load), the 30% DSPO has not been able to generate as much power as the other fuels. Reduced electrical efficiency is seen for the 30% DSPO blend compared with the 30% SSPO blend. 6.3.2. Specific Fuel Consumption SFC is plotted against engine electrical power for the different fuels in Figure 6.4. From the figure, it is easy to see an increasing fuel economy with engine electrical power for all fuels. SFC of a given fuel is equivalent to the inverse of efficiency. Therefore, compared to pure diesel, the low efficiency SSPO blends require a higher mass flow to produce the same amount of power. This explains why both blends have a higher SFC compared to diesel. The highest SFC is seen at all powers 50% SSPO has, 18.1% higher than diesel at the highest load. The blend contains 30% SSPO is lower than that contains 50% SSPO, and the fuel consumption rate is 10.9% higher than diesel at the highest load. 127 480 Diesel Biodiesel 30% SSPO 50% SSPO 30% DSPO Specific Fuel Consumption (g/kWh) 460 440 420 400 380 360 340 320 300 280 3 4 5 6 7 8 9 10 11 12 Electrical Power (kW) Figure 6.4 Comparison of Specific Fuel Consumption It is interesting to see that, compared to biodiesel, 30% SSPO has a higher SFC at low load, but a lower SFC at high load. Again, this is in accordance with tendency of increasing efficiency for the 30% SSPO with increasing electrical power. This is believed to be related to the different combustion quality of the fuels at different loads, as the difference between biodiesel and the SSPO blends in heating values is minor. The SFC of 30% DSPO is below that of 30% SSPO, because of the lower HHV of 30% DSPO. 6.3.3. System Energy Balance and Potential CHP Application The system energy balance for the tests with diesel, biodiesel, 30% SSPO, 50% SSPO and 30% DSPO are shown in Table 6.6a-e respectively (for calculation method and real data see Section 3.3.3.1 and Appendix 3 respectively). The present work is concerned with the use of pyrolysis oil in CHP applications, so the useable heat produced from the engine coolant and exhaust gas are also calculated. About 35-45% of total input energy leaves the engine in the form of useable heat in the exhaust gases and 27-33% as coolant heat; this gives a total of approximately 65-75% of the input energy available for recovery as exportable heat. Biodiesel gives the highest exhaust heat among the tested fuels, as it has the highest combustion temperature. Diesel gives the highest coolant heat. The figures for other fuels look similar. 128 Table 6.7 Energy Balance of the Engine Test a. Diesel Run Load (KW) Input (kW) Output (%) Fuel Power Coolant Heat Exhaust Heat Loss 3.69 17.78 20.65 32.37 43.07 3.91 5.20 21.26 24.46 29.17 42.54 3.83 6.39 23.99 26.64 29.31 41.43 2.62 8.68 30.53 28.44 28.34 40.86 2.36 11.27 38.54 29.24 27.42 39.39 3.95 b. Biodiesel Run Load (KW) Input (kW) Output (%) Fuel Power Coolant Heat Exhaust Heat Loss 3.74 16.74 22.37 30.04 45.15 2.44 5.24 21.24 24.68 28.70 44.23 2.39 6.36 24.19 26.29 28.06 43.34 2.31 8.64 30.78 28.08 27.30 42.45 2.17 11.25 39.24 28.65 26.88 42.44 2.03 c. 30% SSPO Run Load (KW) Input (kW) Output (%) Fuel Power Coolant Heat Exhaust Heat Loss 3.68 17.29 21.26 30.37 43.89 4.48 5.17 21.50 24.06 29.03 43.06 3.85 6.35 24.39 26.04 28.57 42.28 3.11 8.67 30.90 28.06 28.06 40.74 3.14 11.16 39.23 28.45 27.61 39.11 4.83 129 d. 50% SSPO Run Load (KW) Input (kW) Output (%) Fuel Power Coolant Heat Exhaust Heat Loss 3.67 17.76 20.65 30.57 43.23 5.55 5.26 22.91 22.95 29.06 42.75 5.24 6.35 25.62 24.80 28.09 42.49 4.62 8.59 32.02 26.84 27.74 39.75 5.67 11.12 39.93 27.85 27.32 38.12 6.71 e. 30% DSPO Run Load (KW) Input (kW) Output (%) 3.76 Fuel 17.69 Power 21.25 Coolant Heat 32.21 Exhaust Heat 41.65 Loss 4.89 5.16 23.00 22.42 31.36 41.02 5.20 6.30 25.40 24.80 30.83 38.55 5.82 8.09 30.91 26.16 29.31 38.58 5.95 It is argued that a full recovery of useable heat is not realistic in practice, mainly due to two important reasons. Firstly, the maximum measured engine coolant temperature for the present system is about 50°C at the highest load condition. It is therefore a low-grade heat source and is only suitable for space heating or hot water production for domestic use. For industrial use, it may be possible to pre-heat feed water for a steam boiler, but not to produce steam, which normally requires a minimum temperature of 120°C. Secondly, for the exhaust heat, the heat exchanger design will set a lower limit on the exit temperature of the exhaust gas, which depends on the required temperature of the water or steam. For the present system running pyrolysis oil blends, the temperature of the exhaust gas is up to 450°C (Figure 6.5) and the heat in the exhaust gas accounts for the most significant share - up to 43% of the energy input. A carefully designed heat exchange system is required to maximise recovery of this useable heat. However for such engine scales, it is more sensible to recover the heat exclusively for hot water usage or production. 130 6.3.4. Exhaust Emissions The exhaust emissions of the fuels are compared and discussed in this section. The major components of the diesel engine exhaust gas are N2, water vapour, CO2 and O2, as well as a small portion of undesirable combustion products, such as CO, NOx, soot and unburned hydrocarbons. Diesel engines are designed to over-supply oxygen (lean burn) under all conditions, thus the CO emission is extremely low. However, due to the high compression ratio of diesel engines, high temperatures and pressures are reached in the cylinder which can result in significant production of nitric oxides. Diesel engine emissions also contain fine particulates and aerosols, such as soot and fly ash particulates, and metallic abrasion particles. These are closely associated with negative environmental impacts and human health effects. Hence engine exhaust emission standards have become increasingly strict over the past fifty years. 6.3.4.1. Exhaust Temperature Exhaust gas temperature against engine electrical power for the different fuels is illustrated in Figure 6.5. The temperature of exhaust gas gives a direct indication of the temperature of combustion in the engine cylinder, and is thus directly related to the emission of nitric oxides. The exhaust gas temperature increases with engine electrical power in all cases. More fuel is consumed at higher load conditions and in consequence more combustion heat is produced per engine cycle leading to an increase in combustion and in-cylinder temperatures. While the fuel consumption increases with the load increase, the mass of air intake remains the same. This results in reduced actual air-fuel ratio (and so , see Table A3.1-A3.5 in Appendix 3). Exhaust temperature then increases, as more heat is taken out of the cylinder by each unit mass of exhaust gas. Biodiesel has the highest exhaust temperature across the load range and this is found to be in accordance with another investigation using the same type of biodiesel [145]. Biodiesel gives noticeably higher exhaust temperature compared to 30% SSPO and 50% SSPO, by 83˚C and 102˚C, respectively at the highest load. This is due to a combined effect of low AFR stio and the high density of biodiesel as well as very low moisture content. High exhaust temperature can result from high fuel density. Dense fuels generally have shorter ignition delay, and this causes advanced ignition and fuel combustion and hence may lead to a higher cylinder pressure and cylinder temperature in the power stroke [146]. Biodiesel has a higher density than diesel and a lower moisture content than the blends, and these can contribute to the high exhaust temperature of biodiesel. However, more accurate explanation of the 131 combustion and exhaust temperatures require further investigation into fuel injection, heat release profile and cylinder pressure profile of the engine cycle. 550 Exhaust Temperature (oC) 500 450 400 350 300 Diesel Biodiesel 30% SSPO 50% SSPO 30% DSPO 250 200 3 4 5 6 7 8 9 10 11 12 Electrical Power (kW) Figure 6.5 Comparison of Exhaust Gas Temperature The reductions in temperature when SSPO and DSPO are blended with biodiesel are seen here. This is due to the presence of water in both pyrolysis oils, as discussed in the oil characterisation section. Modest water content reduces the combustion temperature in the engine cylinders due to the latent heat required for evaporation, as well as affecting the combustion characteristics. This is partly beneficial, as reduced combustion temperature will mean decreased production of nitric oxides. Furthermore, lower combustion temperature reduces the likelihood of engine failure over extended operation at high load conditions. 6.3.4.2. CO Emission CO emission against engine electrical power for the different fuels is shown in Figure 6. A clear increase in CO emission is evident with increase of electrical power, indicating an increasing tendency towards incomplete fuel combustion. This is because more fuel is being consumed as the engine power increases, but the air intake remains constant in the diesel engine cycle. Thus actual AFR and lambda decrease. 132 The curves also indicate that at low engine loads, diesel has the lowest CO emission. However, with increasing load, the CO emission of diesel increases sharply and eventually becomes the highest of the tested fuels. Biodiesel and the SSPO blends have shallower CO emission curves compared to diesel because, as previously discussed, their stoichiometric AFRs are relatively low and hence they require less air for complete combustion. 0.08 Diesel Biodiesel 30% SSPO 50% SSPO 30% DSPO 0.07 CO Emmision (vol.%) 0.06 0.05 0.04 0.03 0.02 0.01 0.00 3 4 5 6 7 8 9 10 11 12 Electrical Power (kW) Figure 6.6 Comparison of Carbon Monoxide Emission The beneficial effect on CO emission is particularly seen at high load. At most conditions the blends show lower CO emissions than biodiesel for the same reason. However, in the case of 50% SSPO, which has a low stoichiometric AFR, the CO emission is higher than biodiesel at low loads. This may be because of the reduced combustibility of the 50% SSPO blend compared to 30% SSPO and 30% DSPO. 6.3.4.3. NOx Emission NOx emission against engine electrical power for different fuels is shown in Figure 7. Little significant trend with fuel type is observed, particularly at low and medium engine power. It has been widely discussed in the literature that there are two main mechanisms responsible for the formation of NOx, namely the formation of NOx from atmospheric nitrogen (thermal NOx) and the conversion of the original bonded nitrogen in the fuel (fuel NOx) [147, 148]. 133 550 500 NOx Emission (ppm) 450 400 350 300 250 Diesel Biodiesel 30% SSPO 50% SSPO 30% DSPO 200 150 3 4 5 6 7 8 9 10 11 12 Electrical Power (kW) Figure 6.7 Comparison of Nitrogen Oxides Emission 30% SSPO has a slightly lower NOx emission compared to biodiesel and diesel, although it contains 1.54 wt% of nitrogen. This is probably due to the reduced thermal NOx from the lower combustion temperature offsetting increased fuel NOx. 50% SSPO has a content of 2.57 wt% nitrogen. It surprisingly gives the highest NOx emission, which is 14% higher than that of 30% SSPO at the highest load condition. This suggests that for 50% SSPO, fuel NOx is the dominating factor for NOx emission. 30% DSPO has the lowest nitrogen content as well as the lowest combustion temperature; hence it makes sense that 30% DSPO gives the lowest NOx emission. 6.3.4.4. Smoke Smoke emissions (expressed as exhaust opacity), against engine electrical power for the different fuels is shown in Figure 8. The presence of smoke is usually correlated with soot formation, which is present in the form of fine particulates in the exhaust causing increased gas opacity. In diesel engines, soot formation is directly associated with high combustion temperature and with incomplete combustion in the cylinder. As discussed in the CO emission section, incomplete combustion is related to the availability of oxygen in the cylinder. SSPO has about 10 wt.% of oxygen content and this is possibly the reason for the blends giving lower smoke emissions compared to diesel at high loads where AFR is at its lowest. The reason for SSPO blends giving higher smoke 134 than biodiesel is probably the ash content and high carbon residue. Burning of pure SSPO yielded about 2.4 wt.% of carbon residue and 0.23 wt.% of ash (Figure 6.2). In engine combustion, they may remain as smoke particulate and fly ash in the exhaust gas. Smoke emission for 30% DSPO was not measured due to failure of the equipment. 2.5 Diesel Biodiesel 30% SSPO 50% SSPO -1 Smoke Opacity (m ) 2.0 1.5 1.0 0.5 0.0 3 4 5 6 7 8 9 10 11 12 Electrical Power (kW) Figure 6.8 Comparison of Exhaust Gas Opacity 6.3.5. Exhaust Emissions vs. Standards. The EU has established categories to regulate the exhaust emissions of non-road diesel engines over 18kVA called Stages I, II, IIIA, IIIB and IV. Each increasing stage specifies reduced amounts of allowable hazardous gases that are permitted in terms of grams of the compound per kWh. Form 1st January 2011, the EU has introduced the Stage IIIA standard. The US EPA (Environmental Protection Agency) has also introduced its Tier 4 emission standard for non-road stationary diesel engines phased in from 2008 to 2015. The emission standards and details are shown in Table 6.7. In current EU and US standards for the scale of interest here (15kW full load), NOx and unburned hydrocarbon emissions are not regulated separately, but as combined NOx and non-methane hydrocarbon (NMHC). In the EU standard, a regulation for engine rated powers lower than 18 kW was not found. This is probably because engines at such scales are less used and would not significantly impact the environment. 135 Table 6.8 EU Stage IIIA Emission Standard and US Tier 4 Emission Standard for Stationary Diesel Engines [149-151] Rated Power Effective Year CO NOx HC kW NOx+NMHC PM g/kWh EU 18≤ P < 36 2011 5.5 -- -- 7.5 0.6 US 8≤ P <19 2008 6.6 -- -- 7.5 0.4 The emissions of CO and NOx from engine runs at 75% load (maximum achievable load) on different fuels are calculated (equation 3.18) and shown in Table 6.9. It can be clearly seen that the CO emissions of all tested fuels have met the US standard for engines with rated powers of 8-19 kW. As has been discussed in the previous section, the SSPO blends give better CO emissions compared to conventional diesel fuel due to higher AFR in combustion (content of oxygen in the fuel). NOx emissions are also low for SSPO blends as a result of the reduced combustion temperature because of the presence of moisture. Unfortunately HC was not measured in the present work due to a damaged sensor, and there is no emission standard for NOx alone. However, it is worth noting that none of the NOx emissions from tested fuels has exceeded 50% of the allowable NO+NMHC in both the EU and US standards (7.5g/kWh). Thus if the HC emission is not higher than that of NOx, the combined emission will not exceed the maximum allowable amount. In practice, a number of studies have shown that the emission of HC is usually much lower than (usually 1/10 of) NOx in biodiesel fuelled stationary diesel engines [152-155]. Hence it is very likely that the combined NOx and HC emission of SSPO blends runs are able to meet the standard. Table 6.9 Exhaust Emission of CO and NOx at 75% Load CO (g/kWh) NOx (g/kWh) Total Exhaust Gas (l/kWh) Diesel 4.02 2.99 6010.5 Biodiesel 3.31 3.20 7293.4 30% SSPO 1.87 2.78 7251.1 50% SSPO 2.55 3.24 8007.8 136 6.4. Summary This chapter studied the characteristics of the pyrolysis oil blends with biodiesel (BD) and engine performance when running the oil blends. It was found that, for a limited period of operation (up to 10 hours), the biodiesel and SSPO blends could be used as fuels in an unmodified Lister diesel engine without apparent deterioration in performance. The engine thermal efficiency with both pyrolysis oils were satisfactory and the exhaust emissions were able to meet the international emission standards. 137 CHAPTER 7 ECONOMIC EVALUATION OF THE PYROLYSIS-CHP SYSTEM The work presented in earlier chapters have shown the feasibility of using the Pyroformer and diesel engine system to produce electrical power, heat and char from various biomass and waste feedstocks. This chapter presents an economic evaluation of proposed Pyroformer reactor(s) CHP systems to produce energy from commercially available wood energy pellets and sewage sludge waste from a water treatment plant. The systems are evaluated at a range of scales and with different product selling scenarios. The capital and operating costs are estimated and the energy production cost and the project Internal Rate of Return is calculated to examine the economic viability of the systems. 7.1. Pyro-CHP Process Simulation An energy system simulation is performed using the Aspen Plus process simulation software (V7.3.2, information available at [156]) prior to the economic analysis. This is for extrapolating the whole system energy balance and efficiency, using the experimental results from the Pyroformer runs and the diesel engine runs that are presented in earlier chapters. The simulated system is a combined pyrolysis CHP production (Pyro-CHP) system incorporating a Pyroformer reactor and a diesel engine CHP system. Two similar system arrangements using different types of feedstocks, i.e. wood pellets and wet sewage sludge, are simulated at the base scale of 100 kg/h dry feed. The simulation covers the process from the feedstock to the final products. The Aspen process flowsheets and detailed model descriptions are presented in Appendix 4. In the Pyro-CHP system arrangement using wood pellet feedstock, the feeds are firstly processed in the Pyroformer (100 kg/h feed processing capacity) and converted into pyrolysis products, i.e. pyrolysis liquids (mixture of a number of oxygenated hydrocarbon organics and water), permanent gases (mainly CO2, CO, CH4 and H2) and char (mixture of carbon and ash). Most of the organic fraction is then separated from the pyrolysis liquid to form pyrolysis oil and the oil is then blended with biodiesel in a 50/50 volumetric ratio to form the engine fuel, which is used in a CHP engine (120 kW) for power and heat production. All permanent gases and 20 wt.% of char produced by the Pyroformer are consumed onsite in a gas and char combustor. This in total produces about 75 kW heat, 138 which is utilised to meet the Pyroformer heat demand. It is estimated that the present Pyroformer reactor consumes about 50 kW energy (heat and electricity) to pyrolyse a feed rate of 100 kg/h. The remaining 25kW heat is rejected from the heat exchanger (at a temperature of 139 °C). The CHP engine is able to generate 118 kW electrical power and recover a total of 156 kW heat from the engine cooling system and exhaust system respectively in the form of hot water. The electrical power, heat and surplus char (22.8 kg/h) are the final joint-products that from the whole system available for sale. In the Pyro-CHP system arrangement using sewage sludge, wet sludge (50 wt.% moisture content) is supplied to a rotary dryer to reduce the feedstock moisture content. The heat for drying is provided by the engine exhaust gas, which contains about 56 kW heat that is sufficient to dry 180 kg/h of wet sludge to 100 kg/h of dry sludge (10 wt.% moisture content and 90 wt.% solids) for use in the Pyroformer. It is assumed that the sludge does not need to be pelletised as the rotatory dryer is able to produce the dried sewage sludge as small pieces of crumb that can be conveniently fed to the Pyroformer. As with the PyroCHP system using wood, pyrolysis oil is obtained from the pyrolysis liquid and blended for use in the CHP engine. All permanent gases and 35 wt.% of char produced by the Pyroformer are combusted onsite to meet the heating requirement of the Pyroformer. The CHP system produces 78 kW electrical power, 67 kW heat (from the engine coolant only) in the form of hot water and 31.9 kg/h surplus char as final products for sale. Table 7.1 presents the main results of the calculated system energy balance, engine electrical and CHP efficiencies and overall Pyro-CHP system CHP efficiencies (energy output divided by the summation of feedstock and biodiesel energy input). These results are used as the baseline data for economic analysis. Validation of the engine electrical and CHP efficiency obtained from the simulations is provided from Figure 7.2 provided in Section 7.2.3. 139 Table 7.1 Mass and Energy Balance for the Simulated Systems at 100 kg/h Dry Feed FEEDSTOCK Moisture (wet/dry) Throughput (wet/dry) HHV Particle size C Feedstock Composition H N O S Ash Pyrolysis Temperature MASS BALANCE Yields Oil Aqua Gas Char Biodiesel ENERGY BALANCE Oil Energy Content (HHV) Gas Char Biodiesel Pyrolysis Input Feedstock Output Oil Gas Char Energy Loss CHP Input Pyrolysis oil Biodiesel Output Power Coolant Heat Exhaust Heat Heat Loss Engine Electrical Efficiency Engine CHP Efficiency Overall System CHP Efficiency Unit Wood Pellets Sewage Sludge wt. % kg/h MJ/kg mm wt.% db wt.% db wt.% db wt.% db wt.% db wt.% db °C NA/8.0 NA/100 18.2 5-30 51.1 5.7 0.4 39.2 0.1 3.4 450 50.0/10.0 180/100 11.3 5-30 24.0 3.5 2.9 35.7 1.3 32.6 450 kg/h kg/h kg/h kg/h kg/h 18.9 35.5 17.2 28.5 15.5 10.3 27.4 13.2 49.1 9.7 MJ/kg MJ/kg MJ/kg MJ/kg 24.2 5.9 30.1 39.7 39.4 6.4 11.2 39.7 kW kW kW kW kW 505.6 127.1 28.2 238.3 112.0 313.9 112.7 23.5 152.8 24.9 kW kW kW kW kW kW ---- 127.1 170.9 118.0 85.0 71.0 24.0 39.6% 92.0% 40.5% 112.7 107.0 78.0 67.0 56.0 18.7 35.5% 91.5% 47.6% 140 7.2. Pyro-CHP Plant Costs and Product Sales This section deals with the economic evaluation of the proposed Pyro-CHP plants. This includes the estimation of the system capital cost and the plant operating costs, as well as the calculations of energy production costs and project investment return. Figure 7.1 shows the schematic diagrams of the layout of the proposed Pyro-CHP systems. They are simplified diagrams of the Aspen process flowsheets provided in Appendix 4. Cooling Water Input Electricity Clean Pyrolysis Vapour Feedstock Pyroformer Scrubber Cooling Water Output Heat Condenser Pyrolysis Liquid Heat Permanent Gas Gas Combustor Oil Liquid Separator Electricity CHP Engine Material Exhaust Heat Energy Char Aqueous Phase Biodiesel Exhaust Gas a. Wood Plant Exhaust Gas Cooling Water Input Heat Electricity Clean Pyrolysis Vapour Feedstock Dryer Pyroformer Scrubber Heat Condenser Pyrolysis Liquid Heat Gas Combustor Cooling Water Output Permanent Gas Liquid Separator Oil Electricity CHP Engine Material Exhaust Heat Energy Char Aqueous Phase Biodiesel Exhaust Gas Exhaust b. Sewage Sludge Plant Figure 7.1 Schematic of the Proposed Pyro-CHP Plants (a. Wood Plant, b. Sewage Sludge Plant) The wood pellets Pyrolysis-CHP plants (Figure 7.1a) consist of 1 to 5 single Pyroformer reactor(s) (depending on the feedstock processing capacity), a single CHP engine, a gas/char combustor, a heat exchanger for the cooling system and a heat exchanger for the 141 exhaust gas. Wood pellets are fed directly to the Pyroformer, as the feedstock is commercially available and do not require pre-treatment (i.e. drying). The sewage sludge Pyrolysis-CHP plants (Figure 7.1b) consist of a feedstock dryer, 1 to 5 single Pyroformer reactor(s), a single CHP engine, a gas/char combustor and a heat exchanger for the cooling system. Wet sewage sludge from the water treatment plant is dried to small pieces of crumb in the dryer before being fed to the Pyroformer. 7.3. Capital Costs 7.3.1. Equipment Cost The baseline equipment costs of the Pyro-CHP system components used in this work are derived either from the cost estimates for the equipment available at the EBRI pilot plant (such as the Pyroformer and char combustor), or from the cost estimates provided by commercial suppliers or manufacturers (such as the CHP engine and heat exchangers) in the year 2013. The Pyroformer reactor equipment cost is estimated to be £500,000 for a 30 kg/h system [157]. The CHP engine equipment cost is estimated to be £300,000 for a 400 kWe NEK dual-fuel CHP (modified Cummins diesel) engine [158]. The gas/char combustor equipment cost is estimated to be £30,000 for a 30 kWth unit [158]. Heat exchanger equipment costs are estimated to be £9,000 for a 100 kWth shell and tube heat exchanger and £20,000 for a 100 kWth exhaust gas boiler [159]. The feedstock dryer equipment cost is estimated to be £175,000 for a 300 kg/h rotary dryer [160]. This work evaluates Pyro-CHP systems at processing capacities across the range 100-1500 kg/h that can generate a range of 78-2000 kW electrical power. Most of the system components, including dryer, CHP engine, combustor and heat exchangers, are commercially available and can be directly ordered from suppliers. In the economic evaluation, these system components are scaled up to the required capacity and their capital costs are adjusted using the equation shown in Section 3.4 (Chapter 3). However, the Pyroformer reactor scale-up needs to take account of the upper limit of reactor capacity for a single Pyroformer. This limit exists because the reactor is externally heated at the outside of the reactor wall. The heat transfer rate for a given delta-T is proportional to the reactor surface area, whereas the heat demand for pyrolysis is proportional to the reactor volume as more feedstock can be processed. The ratio of surface area to volume decreases with the reactor scale. When the reactor exceeds a certain scale, the reactor will be unable 142 to transfer sufficient internal heat for the pyrolysis reaction. 200 kg/h, therefore, has been chosen as an assumption for the upper limit of a single Pyroformer reactor. For Pyro-CHP plants exceeding this capacity, multiple Pyroformer reactors are used. However, scenarios with 300 kg/h Pyroformer reactors are also evaluated in order to handle the uncertainty in this aspect. Table 7.2 presents the adjusted equipment costs for all system components in various scales. Table 7.2 System Equipment Costs Pyroformer Cost Capacity (kg/h) (£) 30 500,000 100 1,029,668 200 1,560,685 300 1,990,536 Dryer Cost Capacity (kg/h) (£) 180 128,804 360 195,230 540 249,001 720 295,914 1,080 377,415 1,440 448,521 1,620 481,365 1,800 512,777 2,160 572,055 2,700 654,009 Gas/char Combustor Cost Capacity (kW) (£) 30 30,000 50 40,760 100 61,780 150 78,796 200 93,641 300 119,432 450 152,327 500 162,267 600 181,025 750 206,959 CHP Engine Cost Capacity (kW) (£) 80 114,219 120 145,678 250 226,282 400 300,000 380 290,908 500 342,979 800 454,715 1200 579,955 1400 636,154 1600 689,219 2000 787,958 Coolant Heat Exchanger Cost Capacity (kW) (£) 30 30,000 50 40,760 100 61,780 150 78,796 200 93,641 300 119,432 400 141,933 450 152,327 500 162,267 600 181,025 750 206,959 Exhaust Heat Boiler Cost Capacity (kW) (£) 80 7,872 100 9,000 150 11,479 200 13,641 260 15,967 360 19,410 500 23,639 500 23,639 600 26,371 700 28,927 800 31,340 143 7.3.2. Total Plant Cost Table 7.3 presents the combinations of system component capacities for Pyro-CHP plants at various scales, and the equipment cost (EC) and total plant cost (TPC) that will be incurred for the plant build and installation. It is worth noting that the cost of the Pyroformer reactor accounts for the most significant percentage of the total EC. For the wood plants, the range is from 82.9% to 54.1% for the plant capacities from 100 kg/h to 1500 kg/h; and for the sewage sludge plants, the range is from 78.0% to 51.9% for plant capacities from 100 kg/h to 1500 kg/h. Table 7.3 Equipment Cost and Total Plant Cost a. Wood Plants Pyroformer (kg/h) 100 1×100* 200 400 600 800 1,000 1×200 2×200 3×200 4×200 5×200 Engine (kW) 120 Combust or (kW) 50 Coolant Heat (kW) 80 Exhaust Heat (kW) 80 Equipment Cost (£) 1,241,472 Total Plant Cost (£) 4,608,781 250 500 800 800 1,400 100 200 300 400 500 150 260 360 500 600 150 260 360 500 600 1,885,734 3,609,439 5,318,745 6,915,558 8,686,820 6,563,555 12,367,652 18,103,199 23,510,765 29,397,870 300 1×300 380 150 200 200 2,404,195 8,072,998 600 2×300 800 300 360 360 4,617,762 15,267,925 900 3×300 1,200 450 500 500 6,780,058 22,284,902 1,200 4×300 1,600 600 700 700 8,925,596 29,244,636 1,500 5×300 2,000 750 800 800 11,048,581 36,127,719 *1×100: 1 indicates 1 Pyroformer unit, 100 indicates the capacity of the Pyroformer is 100 kg/h b. Sewage Sludge Plants Pyroformer (kg/h) 100 1×100 Dryer (kW) 180 Engine (kW) 80 Combustor (kW) 50 Coolant Heat (kW) 70 Equipment Cost (£) 1,320,717 Total Plant Cost (£) 5,027,441 200 400 600 800 1,000 1×200 2×200 3×200 4×200 5×200 360 720 1080 1440 1800 180 580 580 720 1000 100 200 300 400 500 100 200 280 360 450 2,012,496 3,899,489 5,570,519 7,279,464 9,020,519 7,170,186 13,515,391 19,175,906 24,929,338 30,761,161 300 600 900 1,200 1,500 1×300 2×300 3×300 4×300 5×300 540 1080 1620 2160 2700 280 580 880 1200 1500 150 300 450 600 750 150 280 400 540 650 2,572,015 4,869,535 7,107,452 9,319,934 11,504,357 8,835,747 16,340,631 23,619,135 30,800,317 37,886,111 144 7.3.3. Operating Cost 7.3.3.1. Consumables Wood pellets: the price of wood pellets varies with the quantity ordered, as the delivery charges are generally applied per delivery rather than per tonne. Therefore the price will be lower for a larger quantity delivery. The price of wood pellets used here is estimated to be £200/t for bulk supply (including VAT and shipping for 2013) and a discount of 3% per every 5,000 tonnes ordered [161]. For a 100 kg/h pyrolysis plant, 2400 kg feedstock is required per day. Table 7.4 Cost of Wood Pellets Plant Capacity (kg/h) 100 200 300 400 600 800 900 1,000 1,200 1,500 Total Consumption (t/y) 700 1,400 2,100 2,800 4,200 5,600 6,300 7,000 8,400 10,500 Unit Cost (£/t) 200 200 200 200 200 194 194 194 194 188 Total Cost for 2013 (£) 140,000 280,000 420,000 560,000 840,000 1,086,400 1,222,200 1,358,000 1,629,600 2,037,000 Sewage Sludge: a water treatment plant in the West Midlands recycles 100% of its wet sludge (50% solid and 50% moisture) to farmland in 2013. The farmland owners pay approximately £2/t of wet sludge, but there is an average transportation cost of £10/t to the farmland [162]. Therefore, utilisation of sewage sludge onsite for CHP production will give a negative sludge disposal cost (cost saving) for the water plant of £8/t wet sludge. Biodiesel: a blend of pyrolysis oil and biodiesel (50/50 volumetric ratio) is used as the CHP engine fuel. A UK biodiesel supplier quoted a (soybean oil derived) biodiesel average wholesale price of £1.05/L (£1.167/kg) (including VAT and shipping) for 2013 [163]. 7.3.3.2. Waste Water Disposal A UK water service company quotes a fixed charge of £4,497/yr plus £1.445/m 3 industrial waste water disposal charge for year 2010-11. Industrial customers who discharge effluent are also required to pay trade effluent fees. For a power plant, the effluent charge is 145 estimated at £0.8/m3 [101, 164]. The total costs for waste water disposal (including effluent consent and VAT) for 2013-14 are shown in Table 7.5. Table 7.5 Cost of Waste Water Disposal Capacity (kg/h) 100 200 300 400 600 800 900 1000 1200 1500 7.3.3.3. Total Waste Water (kg/h) 35.5 71 107 142 213 284 320 355 426 533 Total Waste Water (m3/y) 249 497 746 994 1491 1988 2237 2485 2982 3728 Total Disposal Fee 2013 (£) 6,651 7,343 8,035 8,726 10,110 11,493 12,185 12,876 14,260 16,355 Labour Requirement and Cost The staffing level of a plant is related to the plant scale. The staff is usually divided into a day team and a shift team. The day team includes the plant manager and technician, and the number of staff required depends on the load of management work and any maintenance and support contracts that are in place. The shift team members include the plant operators and their supervisor, and the number of staff required depends on the number of equipment items that need to be operated. The wood Pyro-CHP plant is assumed to be an independent Pyro-CHP plant, but the sewage sludge plant is assumed to be based in a water treatment plant. The sewage sludge plant therefore may require less new employees than the wood plant due to the availability of staff in the water treatment plant. The management team of the water treatment plant can share the general management work of the CHP plant. Therefore it can have a smaller management budget. The shift team can also use available operators in the water treatment plant. Staff level is assumed based on the real work experience on operating the Pyroformer and diesel engine system and a previous comparable research [80]. For each staff member, the cost of employment is calculated on the basis of [80]: 146 2013 UK average weekly salaries for employees in the electricity industry- £710 and for employees in the water industry- £550 [165]. 52 weeks of the average wage for all employees in the energy and water industries. Employer's National Insurance contribution of 11% of earnings above £87/week. Employer's contribution to staff pension of 5% of earnings. Training allowance of £1,000/yr. Payroll administration of 5% of earnings. Table 7.6 Staffing Level and Cost a. Wood Plants Capacity (kg/h) 100 200 300 400 600 800 900 1000 1200 1500 Day Team* Manager Technician 1 0.5 1 0.5 1 0.5 1 0.5 1 1 1 1 1 1 1 1.5 1 1.5 1 1.5 Shift Team* Supervisor Operator 1 3 1 3 1 3 1 3 1 4 1 4 1 4 1 4 1 4 1 4 Total 13.5 13.5 13.5 13.5 17 17 17 17.5 17.5 17.5 Labour Costs (£) 616,545 616,545 616,545 616,545 776,390 776,390 776,390 799,225 799,225 799,225 *Stream day of the Pyro-CHP plant is 292 days per year b. Sewage Sludge Fuelled Plant Capacity (kg/h) 100 200 300 400 600 800 900 1000 1200 1500 Day Team Manager Technician 0.5 0.5 0.5 0.5 0.5 0.5 0.5 0.5 0.5 1 0.5 1 0.5 1 0.5 1.5 0.5 1.5 0.5 1.5 Shift Team Supervisor Operator 1 2 1 2 1 2 1 2 1 3 1 3 1 3 1 3 1 3 1 4 147 Total 10 10 10 10 13.5 13.5 13.5 14 14 17 Labour Costs (£) 356,060 356,060 356,060 356,060 480,681 480,681 480,681 498,484 498,484 605,302 The employer's training allowance has been included in the assumptions. This will ensure the staff are skilled to work in the plant. Taking all considerations into account gives an annual labour cost of £45.67k per employee for the wood plant and £35.61k per employee for the sewage sludge plant. Table 7.6 shows the estimated labour requirement and costs for both plants. 7.3.4. Product Sales The annual income of the Pyro-CHP plant includes total product sales and the income from the UK government renewable energy incentive payments, namely the ROCs trade value and payments from the RHI scheme. According to the explanations on the “Interaction between the Renewable Heat Incentive and Renewables Obligation” by DECC (Department of Energy and Climate Change) [166], the renewable CHP generators can receive support from a combination of ROCs and RHI payments according to electrical power and heat produced. Alternatively, the renewable CHP generators may opt to receive support under the RO only, with an additional GQCHP (“Good Quality CHP”) 0.5 ROC uplift and Enhanced Capital Allowances (ECA, [167]). However, this requires the CHP installation to be registered as GQCHP under the CHP Quality Assurance (CHPQA) scheme [31]. This option is expected to be terminated in April 2015 and is therefore not considered in this study [166]. 7.3.5. CHP Production The process simulations described in Section 7.1 are only for the base feed rate of 100 kg/h (dry feed). The Pyro-CHP system can be split to the “Pyroformer system” and the “CHP system”. For the Pyroformer system, due to lack of real experimental results, it is assumed that the product yields of the higher capacity Pyroformer (i.e. 200 kg/h and 300 kg/h) are the same as those of the base feed rate unit. However the diesel engine CHP systems have been manufactured at various scales by different manufacturers and there is much information on engine performance available. The curves illustrated in Figure 7.2 are fits of data obtained from a variety of modern diesel CHP system manufacturers and suppliers [28, 31, 168-172]. From the curves, it can be seen that the average electrical efficiencies and CHP efficiencies for 0- 500 KW systems are in the range of 35-42% and 85- 92% respectively. The results obtained from 148 the process simulation (39.6% electrical efficiency and 92.0% CHP efficiency for wood plant, and 35.5% electrical efficiency and 91.5% CHP efficiency for sewage sludge) fall into this range. For systems above the base feed rate and producing more energy, the curve fit values for the electrical efficiency and heat efficiency are used for each plant. 55 Electrical Efficiency Heat Efficiency Efficiency (%) 50 45 40 35 0 1000 2000 3000 4000 Electrical Power (kW) Figure 7.2 Electrical and Heat Efficiency of Diesel Engine Based CHP Systems In fact, the actual efficiencies in full-scale installations vary depending on the individual system, fuel quality, load, maintenance condition, etc. In addition, the parasitic load (the electrical power needed to operate the CHP system) is generally not subtracted from the electrical efficiencies quoted by the manufacturers. This element of energy typically corresponds to 3% of the installed electrical power [168, 173]. In this study, the parasitic load of the integrated Pyro-CHP system is assumed to be 8% of the installed electrical power as the pyrolysis system involves several moving components such as feeders, the Pyroformer(s) and dryer that consume more energy. 7.3.6. Prices for Electrical Power Renewable Obligation: the electrical power produced by the Pyro-CHP system from wood pellets and sewage sludge is primarily incentivised under the RO ACT Band (Advanced Conversion Technologies: Gasification and Pyrolysis) [174, 175], which entitles 2 ROCs per megawatt of eligible renewable electrical power generated. However, there is a concern regarding the eligibility of using blended biodiesel and pyrolysis oil for generation. 149 Biodiesel: the document “Biodiesel, Glycerol and the Renewable Obligation” released by the Ofgem (Office of Gas and Electricity Markets) in 2008 categorised the transesterified biodiesel as a FDBL (fossil derided bio-liquid) [176]. This is because one of the raw materials for biodiesel production (methanol) is usually derived from natural gas by steam reforming and associated reactions. This type of biodiesel is therefore not 100% renewable and as a result not eligible for RO accreditation. Three years later, Ofgem (the administrator of the RO) released the “Renewables Obligation: Biodiesel and Fossil Derived Bio-liquids Guidance” and confirmed a relaxed policy for using biodiesel for renewable electrical power production from April 2011 [177]. The transesterified biodiesel is eligible under the RO, as long as the energy share of the fossil part of the fuel is less than 10%. This value should be determined by the FMS (Fuel Measurement and Sampling: a method to determine the fossil fuel content of the fuel) procedures defined by Ofgem. The biodiesel used in this work is manufactured from soybean oil and methanol via transesterification [178]. An official FMS procedure study reports that this type of biodiesel contains an average fossil-derived mass share of 10.64% (methoxy group), which equates to an energy share of 3.92% of the total biodiesel energy content [177]. In the present work, the biodiesel is 50 vol.% blended with pyrolysis oil. This volumetric ratio is equivalent to a mass share of 45.06% and 48.50% of biodiesel in wood oil blends and sewage sludge oil blends respectively as a result of different densities. This consequently leads to a fossil energy share of 1.77% and 1.90% of the total energy content in wood oil blends and sewage sludge oil blends. These values are much lower than the maximum allowable fossil composition in the feedstock (10%) and therefore the proposed systems are eligible under the RO. The electricity generated by the CHP system can be sold to two types of customer: Offsite customers such as the national grid and licenced electricity suppliers Onsite industrial users such as other manufacturing plants. In 2013, a total number of 996,240 ROCs were traded at an average trade value of £43.27 per ROC [179]. 150 Table 7.7 Price of Electrical Power ROC ROCs Price Sales Price Total Price Unit /MWhe £/ROC £/kWhe £/kWhe Grid 2 43.27 0.055 0.14154 Industrial User 2 43.27 0.0984 0.18494 Selling the electricity to the public grid requires a Power Purchase Agreement (PPA) [180] and the price is relatively low. In this work, £0.055/kW is used as the most optimistic assumption for 2013 [181]. The price for direct sale to industrial users at a small/medium scale (annual consumption in the range of 500-1999 MWh) is £0.0984/kWh (2013 UK average) [182]. In addition, the renewable CHP consumer is also entitled to an exemption from the Climate Change Levy on their electricity bill, which currently is £5.24/MW electricity [183, 184]. This is an additional benefit to the electricity customer, but is not counted in the total sales of electrical power. Table 7.7 presents the ROC price and the real market price for electricity for both scenarios. 7.3.7. Price for Heat The heat recovered from the Pyro-CHP plant is utilised to produce hot water for district or community heating. During the past four years, the regulations for non-domestic RHI scheme have been changed significantly in terms of the support tariff levels [185-187]. Table 7.8 Price of Heat RHI Price Customer Price Total Sales Unit £/kWhth £/kWhth £/kWhth District Heating 0.01 0.0378 0.0478 In May 2014, the “RHI DRAFT Guidance (Version 3.1)” published by Ofgem has eventually confirmed the eligibility of various types of CHP technology. For newly commissioned biomass CHP systems, the support level is up to £0.041 £/MWhth [187]. However, the tariff level for large commercial biomass (including solid waste) CHP with capacities of over 1,000 kWth is only currently £0.01 per kWhth (effective from April 2012). The 2013 market price of heat for district heating is estimated to be £0.0378 per kWhth, as 151 recommended by the “District Heating Manual for London” [188]. Prices are summarised in Table 7.8. 7.3.8. Price for Char The sales of char product from the Pyroformer are also considered in two different scenarios, i.e. sold as charcoal as a solid fuel or sold as biochar as a soil enhancement medium. As a fuel, charcoal has been widely used over hundreds of years in industrial metal processing and domestic heating and cooking. Every year, there are about 1 million tonnes of charcoal produced in the UK [189]. The use of biochar is a relatively recent adoption (from 2007) compared to the use of charcoal. The biochar market is still in an early stage so there were only two UK biochar commercial suppliers found online in 2013 [190, 191]. Differences between charcoal and biochar have been discussed extensively. However, most researchers agree that they are basically the same product, despite their different intended utilisation and small differences in the feedstock thermal treatment temperatures [192, 193]. Table 7.9 Price of Char Charcoal Price Biochar Price Unit £/kg £/kg Wood Char 0.70 2.45 Sewage Sludge Char 0.14 - 0.49 0.42 - 1.47 In 2013, the market price for the UK hardwood charcoal is about £1/kg [194-196]. In this work, a wholesale price of £0.7/kg is used for the wood charcoal. The average biochar market price is about £3.5/kg. In this work, a wholesale price of £2.45/kg is used for the wood biochar. The char produced from sewage sludge does not have the same value as the wood char as it contains less carbon and much higher ash. It has a lower heating value than wood char and therefore can only be used as a low-grade solid fuel. There is no information in the literature on the application of sewage sludge biochar to soil. However, given the fact that the wet sewage sludge from the water treatment plant can be directly recycled to the farmland, it is assumed that the sewage sludge biochar can also be used as a biochar, but is less valuable than wood biochar. In this work, it is assumed that the value of char products from the sewage sludge is in the range of 20-60% of that of the wood char. This gives wholesale prices of £0.14- £0.49/kg and £0.42- £1.47/kg for sewage sludge derived charcoal and biochar respectively. It is worth emphasising that this price range is completely based on assumption and it is only use for exploring the potential economic 152 performance of the system processing sewage sludge. A more reliable pricing is still depending on further investigation over the soil application test for the sewage sludge derived biochar. 7.4. Energy Production Cost Figures 7.3 and 7.4 present the breakdown of the energy (electrical power or heat) production costs from wood and sewage sludge by the Pyro-CHP systems at different Pyroformer capacities. In the wood plants, it can be clearly seen that the EPCs decrease with increasing plant capacity. Significant decreases in EPCs are seen with increasing scale - over 30% going from 100 kg/h plants to 200-300 kg/h plants and nearly 50% going from 100 kg/h plants to 1000-1500 kg/h plants. However, the rate of cost reduction decreases with scale. Labour cost is the most significant expenditure in the small scale plants, but the cost of the feed and the biodiesel dominate in the large scale plants. This is because the average labour required per unit of feed processed in a large plant is much less than that in a small plant. The proportion of cost of capital also reduces with increasing plant scale. The same tendency is found in plant overheads and maintenance cost, as these are functions of the total plant capital cost. The proportion of waste disposal cost is negligible, accounting for less than 0.5% of the production cost. 0.70 Labour Disposal Cost of Capital Cost of Production (£/kWh) 0.60 0.50 200 kg/h Pyroformer Consumble-BD Overhead Consumble- Feed Maintenance 300 kg/h Pyroformer 0.40 0.30 0.20 0.10 0.00 100 200 400 600 800 1000 200 300 600 900 1200 1500 kg/h Figure 7.3 Breakdown of Energy Production Cost- Wood Comparison between different Pyroformer unit sizes indicates that the 300 kg/h reactor is more cost-effective in energy production. For instance, in the 600 kg/h wood systems, the 153 energy production cost of the 3×200 kg/h system is £0.328/kWh, compared to £0.305/kWh for the 2×300 kg/h system. Similarly with the sewage sludge plants, the EPC are £0.500/kWh for the 3×200 kg/h system and £0.441/kWh for the 2×300 kg/h system. In the sewage sludge plants, the trend of EPC with plant scale is similar to that of the wood plant, but the production costs themselves are slightly higher. In the 1000 kg/h plant (200 kg/h Pyroformer), the EPC from sewage sludge is £0.465/kWh, which is 32.5% higher in comparison to that of wood plant at £0.314kWh. In the 1500 kg/h plant (300 kg/h Pyroformer), the EPC from sewage sludge is £0.391/kWh, which is 26.9% higher than that of the wood plant at £0.286/kWh. This is because of two reasons: firstly the sewage sludge has a lower energy content than wood, so it produces less pyrolysis oil and hence produces less energy. Secondly, there is a significant amount of heat that has been used for sewage sludge drying rather than exported as a final product. The cost of capital and associated plant overheads and maintenance cost dominate the EPC and their total share accounts for from 70.3% at 100 kg/h plant to 83.2% and 81.2% at 1000 kg/h and 1500 kg/h respectively. Next largest are biodiesel fuel and labour. Expenditure on waste water disposal in a water treatment plant is extremely low and therefore it has been ignored. 1.00 Labour Disposal Cost of Capital Cost of Production (£/kWh) 0.90 0.80 0.70 Consumbles-BD Overhead 200 kg/h Pyroformer Consumble- Feed Maintenance 300 kg/h Pyroformer 0.60 0.50 0.40 0.30 0.20 0.10 0.00 100 200 400 600 800 1000 200 300 600 900 1200 1500 kg/h Figure 7.4 Breakdown of Energy Production Cost- Sewage Sludge The char product is sold per mass unit rather than per energy unit. The converted breakeven selling prices (BESP) of the char, as well as those of the electricity and heat, are presented in the next section. 154 7.5. Break-even Selling Price Calculation of product BESP is based on the assumption that the remaining two products have been purchased by customers at the market rates defined in Section 3.4.3.2. There are a range of scenarios for product sales as shown in Table 7.10. For wood Pyro-CHP plants, four scenarios with different combinations of electricity customers and char customers are evaluated. Scenario 1 is the pessimistic estimation, where the products are sold for their lowest values. Scenario 4 is the optimistic estimation, where the products are sold for their highest values. For sewage sludge Pyro-CHP plants, electricity generated will be internally consumed in the waste water plant, so the effective income is the same as the unit price quoted to the industrial customers (£0.0984/kWhe). The price for the char product varies with different combinations of use and price assumption. Scenario 1 is the pessimistic case, where the char is sold as charcoal at the lower limit of the price range. Scenario 4 is the optimistic estimate, where char is sold as biochar at the upper limit of the price range. Table 7.10 Scenarios for Product Sales Wood Plant Scenario 1 (pessimistic) Scenario 2 Scenario 3 Scenario 4 (optimistic) Sewage Sludge Plant Scenario 1 (pessimistic) Scenario 2 Scenario 3 Scenario 4 (optimistic) Electricity sold to the local grid. Char sold as charcoal. Heat sold to district heating. Electricity sold to the business customer. Char sold as charcoal. Heat sold to district heating. Electricity sold to the local grid. Char sold as biochar. Heat sold to district heating. Electricity sold to the business customer. Char sold as biochar. Heat sold to district heating. Electricity consumed internally. Char sold as charcoal at the lower limit. Heat sold to district heating. Electricity consumed internally. Char sold as biochar at the lower limit rate. Heat sold to district heating. Electricity consumed internally. Char sold as charcoal at the upper limit rate. Heat sold to district heating. Electricity consumed internally. Char sold as biochar at the upper limit rate. Heat sold to district heating. Figures 7.5-7.7 presents the calculated EBSPs and market average prices (UK 2013) for electricity, heat and char respectively. For products produced by the sewage sludge plants, the negative feedstock cost is also accounted for as an income. 155 2.4 200 kg/h S1 300 kg/h S1 Market Price (Grid) Selling Price (£/kWh) 2.0 200 kg/h S4 300 kg/h S4 Market Price (Indu.) 1.6 a. Wood Plant 1.2 0.8 0.4 0.0 0 200 400 600 800 1000 1200 1400 1600 (kg/h) 3.0 200 kg/h S1 300 kg/h S1 Market Price (Grid) Selling Price (£/kWh) 2.5 200 kg/h S4 300 kg/h S4 Market Price (Indu.) 2.0 b. Sewage Sludge Plant 1.5 1.0 0.5 0.0 0 200 400 600 800 1000 1200 1400 1600 (kg/h) Figure 7.5 BESP and Market Price- Electrical Power (a. Wood Plant, b. Sewage Sludge Plant) It is obvious from Figure 7.5 that the BESPs of electricity under pessimistic scenarios for both types of Pyro-CHP plants are much higher than the average market price at all capacities, although the gap reduces with increasing plant capacity. The 1500 kg/h plants give the lowest BESP of the electricity - £0.715/kWh and £0.888/kWh for wood and sewage sludge plants respectively. However, this is over 7 times higher than the price paid by small/medium size industrial customers of £0.098/kWh. In the optimistic scenario for wood plant, the 1500 kg/h plants could give the lowest electricity BESP at £0.392/kWh, and for sewage sludge plant the lowest electricity BESP is £0.417/kWh. However, these are still much higher than the market price. 156 1.8 200 kg/h S1 300 kg/h S1 Market Price (Heat) 1.6 Selling Price (£/kWh) 1.4 200 kg/h S4 300 kg/h S4 a. Wood Plant 1.2 1.0 0.8 0.6 0.4 0.2 0.0 0 200 400 600 800 1000 1200 1400 1600 (kg/h) 3.2 200 kg/h S1 300 kg/h S1 Market Price (Heat) Selling Price (£/kWh) 2.8 2.4 200 kg/h S4 300 kg/h S4 b. Sewage Sludge Plant 2.0 1.6 1.2 0.8 0.4 0.0 0 200 400 600 800 1000 1200 1400 1600 (kg/h) Figure 7.6 BESPs and Market Prices- Heat (a. Wood Plant, b. Sewage Sludge Plant) The trend of heat BESP shown in Figure 7.6 for both plants is similar to that of electricity BESP. However, in the pessimistic scenario, the heat BESPs from the sewage sludge plant are much higher than those from wood plant at the same capacity, for example £1.798/kWh compared to £0.843/kWh at the 1500 kg/h plant. This is because the sewage sludge plant uses almost half of the produced heat for feedstock drying, so the exported heat product is much less than the wood plant. Electricity and char are sold at the lowest estimated value, so the difference in production costs and product sales is high. The allocated BESP per each kilowatt-hour of heat from sewage sludge is hence higher than that from wood. In the optimistic scenario, the difference in BESPs from both plants at the same capacity is 157 slightly smaller (£0.820/kWh compared to £0.304/kWh). Electricity and char are sold at the highest estimated value and therefore the BESP of heat is significantly reduced. The heat has the lowest value among the three products. One of the reasons is that the eligible rate of RHI payment for the biomass CHP at the scales considered here is very low. From 2014, the updated RHI regulation will dramatically increase the support level (by up to 4 times) for biomass CHP technology [187]. This will improve the competitiveness of Pyro-CHP systems. 12.0 200 kg/h S1 300 kg/h S1 Market Price (Charcoal) Selling Price (£/kg) 10.0 200 kg/h S4 300 kg/h S4 Market Price (Biochar) 8.0 a. Wood Plant 6.0 4.0 2.0 0.0 0 200 400 600 800 1000 1200 1400 1600 (kg/h) 7.0 b. Sewage Sludge Plant 6.0 Selling Price (£/kg) 5.0 4.0 200 kg/h 300 kg/h Market Price (Charcoal, Lower) Market Price (Biochar, Upper) Market Price (Charcoal, Lower) Market Price (Biochar, Upper) 3.0 2.0 1.0 0.0 0 200 400 600 800 1000 1200 1400 1600 (kg/h) Figure 7.7 BESPs and Market Prices- Char (a. Wood Plant, b. Sewage Sludge Plant) Figure 7.7 illustrates the char BESP for both plants. For the wood plant, it is clear that the difference in BESP for each scenario at the same capacity is very small. This is due to the small difference between the prices of electricity under optimistic and pessimistic 158 scenarios. However, none of these plants are profitable as even for the optimistic scenario, the BESP is higher than the char market price. There are no variations in the electricity and heat customers for the sewage sludge plant, so only one scenario is analysed. As for the wood plant, none of the plants seems profitable. 7.6. Share of Product Sales This section presents the shares of individual product sales in the total sales in various scenarios. Full results of the system productivity and product sales under the scenarios are provided in Appendix 5. Figure 7.8 and 7.9 present the shares of each individual product sale in the total products sales for the 300 kg/h Pyroformers plants. 200 kg/h Pyroformer plants have similar results, so only one scenario is shown here. 100% Pessmestic Optimistic 80% 60% Elec. Heat 40% Char 20% 0% 200 300 600 900 1200 1500 200 300 600 900 1200 1500 kg/h Figure 7.8 Shares of Individual Product Sales in Total SalesWood 300 kg/h Pyroformer, Pessimistic and Optimistic Scenarios In the wood plants, it can be clearly seen that the shares of electricity sales (40.2%-44.8%) and char sales (42.4%-40.9%) are almost equivalent in the pessimistic scenario, but the biochar sales take the major share in the optimistic scenario (66.0%-68.3%). This is because the increase in the char sales value going from the pessimistic scenario to the optimistic scenario is much higher than that in the electricity sales value. In both scenarios, it is seen that the shares of char sales and heat sales are slightly reduced with the plant capacity. This is due to the electrical efficiency slightly increasing but the heat efficiency reducing (reduced heat-to-power ratio) with the scale of the engine, with the char production rate remaining constant. 159 The trends for the sewage sludge plant are similar to the wood plant, but the shares of heat sales are even less than those of the wood plant, as a result of about 50% of produced heat used for sludge drying. However, there is an extra source of product “sales” in the form of cost reduction in the avoided disposal of wet sludge. Although minor, it takes a similar amount of share to the sales of heat particularly for the higher capacity plant (2.17% compared to 2.39% at the capacity of 1500 kg/h). The estimated char sales values vary significantly, and this results in a similar effect on the share of char sales in the total sales. In the pessimistic scenario, the percentage of biochar sales only account for less than 20% of the total sales; but in the optimistic scenarios, it accounts for over 70%. This reflects the importance of selecting appropriate potential char customers for the sewage sludge. Pessimistic Optimistic 100% 80% Dispo. 60% Elec. 40% Heat Char 20% 0% 200 300 600 900 1200 1500 200 300 600 900 1200 1500 kg/h Figure 7.9 Shares of Individual Product Sales in Total SalesSewage Sludge 300 kg/h Pyroformer, Pessimistic and Optimistic Scenarios 7.7. Internal Rate of Return Full project cash flows, including the total product sales, gross profit and net profit, for all evaluated scenarios over a 20 year project lifetime, are calculated. Results show that only scenarios 3 and 4 for the wood plant and scenario 4 for the sewage plant are able to generate positive gross profit (annual total product sales minus total annual operating cost). This indicates that sale of the biochar plays the most vital role for project economic viability. The biochar has the highest market value among the three products, and there is a significant difference between the prices of charcoal and biochar. This results in a significant difference in the total product sales for different char sales scenarios. 160 Figure 7.10 and 7.11 present the Internal Rates of Return (IRR) of some selected scenarios of the wood and sewage sludge plants, respectively. For the wood plant, it is clear that none of the plants using 200 kg/h Pyroformer are profitable (able to present a positive IRR), and only the high capacity plants using 300 kg/h Pyroformers are profitable with limited IRRs. A negative IRR means that net annual profit rates during the project lifetime are eventually unable to cover the initial capital investment, even if the capital were obtained at zero interest rate. For plants at the same capacity, Scenario 4 (S4 in the figure) always has a higher IRR than Scenario 3 (S3), as the electricity price is higher. The highest IRR value is only 3.63% for the 1500 kg/h plant in the optimistic scenario, far lower than any sensible target rate of return for a venture such as this. 4% 2% 200 kg/h Pyroformer 300 kg/h Pyroformer 0% -2% -4% -6% -8% -10% -12% -14% Figure 7.10 Internal Rate of Return - Wood Plant The overall IRR values of sewage sludge plants, as shown in Figure 7.11, are higher than those of the wood plant. Most of the scenarios are able to show positive IRRs. A higher capacity plant always has a higher IRR value than a lower capacity plant and again the overall IRR values for the 300 kg/h Pyroformer plants are higher than 200 kg/h Pyroformer plants. Differently to the wood plants, lower capacities (such as 600 kg/h) sewage sludge plants can also give positive IRR. The highest IRR is 6.22% for 1500 kg/h plant, which is over 40% higher than the highest for the wood plant. The main reason is the considerably lower operating costs in the sewage sludge plants. The wood plants require purchase of wood pellets as feedstock and this cost accounts up to 25% of the energy production cost (Figure 7.3). Sewage sludge plants however have a negative feedstock cost. In addition the 161 wood plants have higher labour costs, due to being independent CHP plants and to the average wage for employees in the energy industry being higher than that in the water service industry. 8% 6% 200 kg/h Pyroformer 300 kg/h Pyroformer 4% 2% 0% -2% -4% -6% -8% -10% Figure 7.11 Internal Rate of Return- Sewage Sludge Plant Nevertheless, the highest IRR for the sewage sludge plant scenarios is still way below the general target IRR of 20-25% for a novel technology with a high associated risk [103]. This indicates that the Pyro-CHP projects using these two feedstocks are not currently economically viable without large additional subsidy. Furthermore the biochar plays the most important role in the total product sales, but there is a high degree of uncertainty over this as the market is immature. 7.8. Learning Effects This section presents the learning effect on the future costs of energy production and project investment return using the present Pyro-CHP system. The Pyro-CHP is regarded as a novel process, and as such it is widely accepted that the capital cost will reduce over time as more plants are constructed and experience accumulated [19]. Learning factor is a constant cost reduction rate applied to the capital cost when a novel process is doubled. In line with previous relevant research, a learning factor of 20% has been used in this work [19, 74, 197]. This will result in a 50% reduction in capital costs after 10 installations of 162 the Pyro-CHP system. It should be noted that only the Pyroformer reactor is considered novel, and the current capital costs associated with it are assumed to refer to the costs of the 1st plant constructed. All the other units of the plant, such as CHP engine, burner, dryer and heat exchangers are based on established technologies and therefore their current capital costs are assumed to be 100th plant costs [74]. 0 200 400 600 800 1000 1200 -0.10 1600 kg/h -0.15 Cost Reduction 1400 200 kg/h- Wood 200 kg/h- Sewage Sludge 300 kg/h- Wood 300 kg/h- Sewage Sludge -0.20 -0.25 -0.30 -0.35 -0.40 Figure 7.12 Learning Effect on Energy Production Cost Figure 7.12 presents the reduction in the EPC when 20% learning factor is applied to the 1st plant installation. It is obvious that the EPC reduction will be proportional to the percentage the capital cost and its associated operating costs take in the EPC. In other words, for a specific scenario, the higher the percentage of capital cost in the EPC, the more EPC reduction learning will bring about. Referring to the results shown in Figure 7.4 and 7.5, this explains why the sewage sludge plants have a higher EPC reduction than the wood plants and, for the same type of plant, the systems using the 200 kg/h Pyroformer have a higher EPC reduction than those using 300 kg/h Pyroformer. The EPC reduction also increases with plant scale. For the most economical system arrangement - 1500 kg/h plant, the learning effect gives 27.6% and 34.9% EPC reductions for wood plant and sewage sludge plant respectively. Figure 7.13 and 7.14 illustrate the effect on IRR for both plants by applying 20% learning factor (equivalent to the 10th installation). In comparison to Figure 7.10 and 7.11, it is clearly seen that the IRRs have been greatly increased due to the learning effect. For wood 163 plant, most of the scenarios have turned to being profitable and with IRR increasing by from 2.00% to 6.54%. The highest IRR is seen at the optimistic scenario for the 1500 kg/h plant at 10.17%. For sewage sludge plant, the IRR has increased by from 2.58% to 7.44% and the highest IRR is seen at the optimistic scenario for the 1500 kg/h plant at 13.66%. Nevertheless, the highest IRR after the learning effect is still unable to meet the general 2025% target for a novel technology. In addition, it is worth emphasising that the high IRRs are only seen at the high capacity plant with the optimistic estimations. 12% 200 kg/h Pyroformer 300 kg/h Pyroformer 8% 4% 0% -4% -8% -12% -16% Figure 7.13 Learning Effect on Internal Rate of Return - Wood Plant For the plants in pessimistic scenarios - especially those have low processing capacity (lower than 600 kg/h and 300 kg/h for wood and sewage sludge plants respectively), it is still difficult to give a positive IRR, far less to be profitable. The IRR is in fact calculated based on the consideration of an initial capital charge only. Therefore, a plant will not be deemed to be “profitable” unless the IRR is at least higher than the interest rate of the capital loan. In this work, the highest IRR for both plants is not satisfactory when considering the risk of investment. Although the learning effects have increased the return, there is still a considerable gap to reach the lower end of the target range. Further cost reductions are hence required. The equipment cost of the Pyroformer reactor accounts for over 50% of the total equipment cost of the whole system, as a result of new technology and lack of competition in the market as well as lack of project experience accumulation. The study on learning 164 effect shows that the profitability of the project can be enhanced by the reduction in the project capital investment which takes place over time. In addition to the high capital cost, the Pyroformer reactors have an upper limit on processing capacity and this results in multiple reactors being used in the larger scale plants, with correspondingly higher equipment and installation costs. If the units can be built larger, the total capital cost, as well as the plant overheads and maintenance cost, can also be proportionately reduced. This requires technology improvements and better design of the pyrolysis reactor. 16% 12% 200 kg/h Pyroformer 300 kg/h Pyroformer 8% 4% 0% -4% -8% Figure 7.14 Learning Effect on Internal Rate of Return - Sewage Sludge Plant For wood Pyro-CHP plants, the feedstock cost also takes a major share of the energy production cost. Therefore a carefully selected project location, where the biomass resource is abundant and costs are lower, is important. An example of these locations outside the UK may be the Nordic countries. The energy selling prices are also important, as they determine the values of product sales. Enhanced probability should be seen at locations where the local electricity, heat and especially the char prices are higher than the average. Finally different system arrangements, such as those which include buffer oil storage for generating system decoupling may also be useful for reducing the energy production cost and in turn increasing the project profitability. 165 7.9. Summary A process simulation study on the integrated Pyro-CHP system indicated that the CHP efficiency and the overall system efficiency could achieve over 90% and 40% respectively. However, findings from the economic evaluation gave concerns over the system investment return and therefore project viability. The Energy Production Costs (EPC) was found decrease with increasing plant capacity and in general, plants using the 300 kg/h Pyroformer reactors were more cost-effective than those using 200 kg/h reactors in energy production. The Break-even Selling Prices (BESP) of electricity, heat and char have been calculated, but none of them for the three products was lower than its 2013 market value. Only the wood plants at high capacity in the optimistic scenario were able to present a positive IRR, and the highest IRR was 3.63%. All of the sewage sludge plants at medium to high capacity presented a positive IRR and the highest IRR was 6.22%. When applying a 20% learning factor to the 1st constructed plant, the IIR raised, but it was still not satisfactory when considering the risk of a new technology. Further cost reduction is required to confidently deem the project economically viable. 166 CHAPTER 8 8.1. 1. CONCLUSIONS Intermediate Pyrolysis of Biomass (Chapter 4) The Pyroformer reactor is a type of novel pyrolysis reactor for intermediate pyrolysis. Two critical parameters of the reactor, i.e. solid residence time and char/biomass mixing ratio have been determined, based on the geometric and operating parameters of the inner and outer screws. At a given feed rate, the solid residence time is a function of the inner screw speed, and the char/biomass mixing ratio is dependent of the char recycle rate. Comparison of the results from theoretical calculation and the cold flow experiment indicate that the Capacity Ratio (CR) of char return is in the range of 0.12-0.26, and in the pyrolysis experiment, 0.2 can be used as a realistic estimate. 2. The biomass feedstocks, i.e. wood pellets and barley straw pellets have been characterised. The intermediate pyrolysis oils, permanent gases and pyrolysis chars have been successfully produced from wood pellets and barley straw pellets by the Pyroformer system. The product mass balance and energy flow have been studied. The liquid, gaseous and solid product yields for wood are 54.3 wt.%, 17.7 wt.% and 28.5 wt.% respectively; and those for barley straw are 49.0 wt.%, 20.9 wt.% and 30.1 wt.%, respectively. The pyrolysis liquid can naturally separate into an aqueous phase and an organic phase (pyrolysis oil) under gravity. The yields of wood pyrolysis oil and barley straw oil are 18.5% and 5.8% (of the total product), respectively. The HHV of barley straw and oil wood oil are 28.9 MJ/kg and 24.3 MJ/kg respectively. Barley straw oil is less acidic and contains lower moisture than wood oil, but has higher viscosity and density. 167 The HHV of the pyrolysis gas for wood and barley straw are 6.33 MJ/Nm 3 and 6.92 MJ/Nm3, respectively. These values are comparable to typical air-blown gasification syngas. Both of the char products from wood and barley straw have a high content of carbon and their HHV are 30.1 MJ/kg and 32.9MJ/kg, respectively. The char product contains most of the energy from the feedstocks, approximately 50%. The overall energy yields are 76.5% and 73.7% for wood and barley straw respectively. 8.2. 3. Characterisation of the Pyrolysis Oils and SSPO-BD Blends (Chapter 5 &6) Intermediate pyrolysis oils from dried sewage sludge (SSPO) and de-inking sludge (DSPO) pellets have been successfully produced by the Pyroformer intermediate pyrolysis reactor. Both SSPO and DSPO have been characterised and their properties have been compared with commercial diesel and biodiesel. SSPO is an organic mixture having carbon chains ranging from C7-C17 mainly consisting of aromatics, long chain hydrocarbon and alkyl nitriles, while DSPO has carbon chains ranging from C5-C15 mainly consisting of aromatics, long chain hydrocarbon and cyclopentanone. The carbon, hydrogen and oxygen content of both SSPO and DSPO are comparable to biodiesel, but the oxygen content is considerably higher than for diesel fuel oil. SSPO and DSPO present satisfactory HHV- 39.4 MJ/kg and 36.5MJ/kg - and water content, surface tension, flash point and lubricity compared with diesel and biodiesel. Both pyrolysis oils have relatively low cetane index, high density, high viscosity, high acid number and high carbon residue and ash content compared with diesel and biodiesel, which would restrict the use of pyrolysis oils in diesel engines. 168 DSPO shows noticeably better characteristics of viscosity, water content and copper corrosion, but poorer heating value, acid number and carbon residue compared with SSPO. 4. SSPO has been successfully blended with biodiesel. SSPO has good miscibility with biodiesel at ratios up to 50% SSPO on a volumetric basis. Blending of SSPO with biodiesel reduces the level of unfavourable properties such as acidity, carbon residue and ash content. 8.3. 5. Engine Test of the Pyrolysis Oils (Chapter 6) For a limited period of operation (up to 10 hours) the biodiesel and SSPO blends could be used as fuels in an unmodified Lister diesel engine at oil blending ratios up to 50/50 on a volume basis, without apparent deterioration in performance. The engine thermal efficiency with 30% SSPO is nearly equivalent to that of biodiesel. The efficiency with 50% SSPO is slightly below that of biodiesel. Both SSPO-biodiesel blends have slightly lower thermal efficiency compared to diesel fuel. The specific fuel consumption of 30% SSPO is lower than that of biodiesel at medium engine loads and above. The SFC of 50% SSPO is higher than those of 30% SSPO and biodiesel at all loads. Both SSPO-biodiesel blends have higher SFCs than diesel. The exhaust temperatures of both SSPO-biodiesel blends are comparable to that of diesel but much lower than that of biodiesel. CO emissions from 30% SSPO are lower than from 50% SSPO and from biodiesel. 50% SSPO has slightly higher CO emissions than biodiesel at low load but lower at high load. Both blends show a smaller rate of increase of CO emission with load compared to diesel. 169 30% SSPO has the lowest NOx emissions at all loads while 50% SSPO has the highest, although the differences are relatively small particularly at low and medium loads. Smoke emission of 50% SSPO is higher than 30% SSPO at all loads, and both are higher than biodiesel. Diesel has lower smoke emission than SSPO blends at low loads but has the highest smoke emission of all at high loads. 8.4. 6. Economic Evaluation on the Pyrolysis- CHP System (Chapter 7) The Pyro-CHP process using wood pellets and sewage sludge waste to produce CHP energy and char has been successfully simulated by using Aspen Plus. The CHP efficiency and overall system efficiency for wood Pyro-CHP system are 92.0% and 40.5%, respectively; and those for sewage sludge plant are 91.5% and 47.6%, respectively. 7. The Energy Production Costs (EPC) for both wood plant and sewage sludge plant under different scenarios have been calculated based on the values of energy and char productions and estimations on the Total Plant Cost (TPC) and Operating Cost. The EPCs decrease with increasing plant capacity, but the rate of cost reduction decreases with scale. For the wood plants, labour cost is the most significant expenditure in the small-scale plants, but the cost of the feed and the biodiesel dominate in the large-scale plants. For sewage sludge plants, the capital cost and associated operating costs account for the most significant part and the percentage is increasing with the plant scale. Plants that use the 300 kg/h Pyroformer reactors are more cost-effective than those that use 200 kg/h reactors in energy production. 8. The Break-even Selling Prices (BESP) of electricity, heat and char for both wood plant and sewage sludge plant in various scenarios have been calculated and compared to their 2013 market rates. None of the BESPs for the three products is lower than its market value. 170 9. Shares of individual product sales in the total sales in various scenarios have been calculated based on the product market prices and their incentive subsidies. The Internal Rates of Return (IRR) of projects have been calculated from the cash flow for a 20 year project lifetime and 3% inflation rate. For both of the wood plant and sewage sludge plant, the char sales play the most significant role in the optimistic scenarios because the biochar has the highest value among the three products. In the pessimistic scenario, the share of charcoal sales is equivalent to the electricity sales for the wood plant, but the share of charcoal sales is much less than the electricity sales in the sewage sludge plants. Only the wood plants at high capacity in the optimistic scenario are able to present a positive IRR, and the highest IRR is 3.63%. All of the sewage sludge plants at medium to high capacity present a positive IRR and the highest IRR is 6.22%. 10. The impact of learning on the EPC and project IRR have been investigated based on the application of a 20% learning factor to the 1st constructed plant. The EPC has been considerably reduced by applying learning. The EPC reduction increases with the plant scale. In the 1500 kg/h wood plant and sewage sludge plant, learning gives rise to 19.2% and 28.7% EPC reductions, respectively. The profitability of the plant has been greatly enhanced by applying learning. The improvement to IRR increases with the plant scale. In the 1500 kg/h wood plant and sewage sludge plant, learning increases the IRR to 10.17% and 13.66% respectively. The IRR for the plant after learning is still not satisfactory when considering the risk of a new technology, as it is much lower than the assumed target range of 20-25%. Further cost reduction is required to confidently deem the project economically viable. 171 8.5. Further work The present work has demonstrated the feasibility of producing CHP energy from various biomass and waste feedstocks using the Pyroformer and diesel engine system, by both a practical experimental approach and by economic analysis for large-scale production. Nevertheless, there are a number of aspects in which the work could be improved or extended. During the experimental work, there were frequent unexpected equipment problems which led to experiment failure. This mainly resulted from a few technical issues in the Pyroformer system. These should be addressed in future work to improve the system performance. Firstly, the feeding system should be better designed to overcome restrictions on biomass feeding. This includes increasing the feeding chute size and optimising the actuating valves to prevent the vapour leakage. Secondly, the connection between the vapour outlet and hot gas filters should be redesigned for reducing the vapour condensation and providing convenience for pipe cleaning. In the current installation, vapour always tends to condense and accumulate in the pipe inner wall causing blockage. Thirdly, char pot should be redesigned for better sealing ability and easy removal for obtaining the char product. The parametric study of the Pyroformer system was not sufficiently comprehensive, and the significance of the char catalytic cracking effect is still not clear. The former can be addressed by conducting extended pyrolysis run under a broad range of operating parameters, including different combinations of the pyrolysis temperature, feeding rate and screw speeds, as well as different types and forms of feedstocks. The latter requires an understanding of the catalytic mechanism of the char on the biomass and vapour during the pyrolysis process. This may be studied firstly via literature review and bench-scale experiment. Characteristics of the present pyrolysis oils are not good enough for fuelling an engine directly. Distillation fractionation of the pyrolysis oil is recommended, as it can effectively eliminate the water content and the heavy fraction of the oil. The distilled product oil may be able to be used as diesel engine fuel without blending with biodiesel. 172 For the engine test, fuel injection characteristics and in-cylinder pressure profile should be investigated for designing the optimistic fuel injection and ignition strategy. The pyrolysis oils present carbon deposit and contain ash. Therefore, extended engine runs should be tested to study the effects of engine operation time on deterioration in engine performance and carbon deposition build-up. Then ways to improve the engine electrical efficiency with SSPO blends, such as using different SSPO blending ratios and using fuel additives, can be investigated. Other types of pyrolysis oils derived from different feedstocks blended with biodiesel also can be tested in the engine, and the engine performances can be compared. If possible, dual fuel injection with producer gas from gasification can also be tested. A dual-fuel CHP engine can be a better option than a diesel engine in the present system, as it can make full use of the products (pyrolysis oil and permanent gas) from the pyrolysis system. Economic evaluations are based on a number of assumptions. Wherever possible, real experimental data should be used and assumptions should be avoided. In this work, a real energy balance of the Pyroformer system should be derived according to the energy consumption of the pyrolysis and cleaning system. The actual cost of the Pyroformer reactor and the feasible upper limit of a reactor size should be further investigated to obtain a more accurate estimation. 173 REFERENCES 1. 2. 3. 4. 5. 6. 7. 8. 9. 10. 11. 12. 13. 14. 15. 16. 17. 18. 19. 20. 21. 22. 23. 24. IEA, 2013 Key world energy statistics. 2013. DECC, Energy consumption in the UK, Chapter 1. Overall energy consumption in the UK since 1970. 2013. Hope, M. Renewable energy grows but UK still mostly dependent on fossil fuels. 2012; Available from: http://www.carbonbrief.org/blog/2012/12/increase-inrenewables-in-uk-energy-mix/. IEA. Fossil fuel energy fossil fuel energy consumption (% of total). 2013; Available from: http://data.worldbank.org/indicator/EG.USE.COMM.FO.ZS. IEA. Combustible renewables and waste (% of total energy). 2014; Available from: http://data.worldbank.org/indicator/EG.USE.CRNW.ZS/countries?page=6. DECC, UK energy in brief 2013. 2014. EuroStat. Share of renewable energy in gross final energy consumption. 2014; Available from: http://epp.eurostat.ec.europa.eu/tgm/table.do?tab=table&plugin=1&language=en&p code=t2020_31. Scott, J. Developing a decision framework for the strategic sourcing of biomass. Aston University. 2013. Ph.D Thesis. IPCC, Climate Change 2013: The Physical Science Basis. 2013. REN21, Renewables 2013 global status report. 2013. HMGovernment, The UK renewable energy strategy. 2009. EC, Europe 2020, a European strategy for smart, sustainable and inclusive growth. 2010. Ofgem. Renewable Obligation (RO). 2014; Available from: https://www.ofgem.gov.uk/environmental-programmes/renewables-obligation-ro. Ofgem. Feed-in-Tariff (FIT) scheme. 2014; Available from: https://www.ofgem.gov.uk/environmental-programmes/feed-tariff-fit-scheme. Ofgem. About the domestic Renewable Heat Incentive. 2014; Available from: https://www.ofgem.gov.uk/environmental-programmes/domestic-renewable-heatincentive/about-domestic-renewable-heat-incentive. Ofgem. Non-Domestic Renewable Heat Incentive (RHI). 2014; Available from: https://www.ofgem.gov.uk/environmental-programmes/non-domestic-renewableheat-incentive-rhi. DECC, UK renewable energy roadmap: 2011. 2011. OxfordDictionaries. Definition of biomass in English. 2014; Available from: http://www.oxforddictionaries.com/definition/english/biomass?q=biomass. Brammer, J.G. Study of biomass gasifier-engine systems with integrated feed drying for power and CHP. Aston University. 2001. Ph.D Thesis. Bridgwater, A.V., Review of fast pyrolysis of biomass and product upgrading. Biomass and Bioenergy, 2012. 38(0): p. 68-94. Ringer, M., Putsche, V., and Scahill, J., Large-scale pyrolysis oil assessment: a technology assessment and economic analysis 2006. Verma, M., Godbout, S., Brar, S.K., Solomatnikova, O., Lemay, S.P., and Larouche, J.P., Biofuels Production from Biomass by Thermochemical Conversion Technologies. International Journal of Chemical Engineering, 2012. 2012: p. 18. Earle, J.S. Rotary kiln incineration of hazardous wastes: Pilot-scale studies at louisiana state university. Louisiana State University. 2003. Ph.D Thesis. Zajec, L. Slow pyrolysis in a rotary kiln reactor : optimization and experiment. University of Iceland. 2009. Mater's Thesis. 174 25. 26. 27. 28. 29. 30. 31. 32. 33. 34. 35. 36. 37. 38. 39. 40. 41. 42. Li, A.M., Li, X.D., Li, S.Q., Ren, Y., Chi, Y., Yan, J.H., and Cen, K.F., Pyrolysis of solid waste in a rotary kiln: influence of final pyrolysis temperature on the pyrolysis products. Journal of Analytical and Applied Pyrolysis, 1999. 50(2): p. 149-162. SeaMarconi. Haloclean® BioEnergy- Introduction. 2007 [cited 2012 8.31]; Available from: http://www.seamarconi.com/modules.php?name=News&file=print&sid=137. Karimi, K. Characterisation of multiple-injection diesel sprays at elevated pressures and temperatures. University of Brighton. 2007. Ph.D Thesis. EIA. Technology characterization: reciprocating engines. 2008; Available from: http://www.epa.gov/chp/documents/catalog_chptech_reciprocating_engines.pdf. Lapuerta, M., Armas, O., and Rodríguez-Fernández, J., Effect of biodiesel fuels on diesel engine emissions. Progress in Energy and Combustion Science, 2008. 34(2): p. 198-223. ClarkeEnergy. Cogeneration & CHP. 2014 [cited 2014 20 Jun.]; Available from: http://www.clarke-energy.com/chp-cogeneration/. CHPQA. CHPQA Unit List. 2013; Available from: https://www.chpqa.com/guidance_notes/CHPQA_UNIT_LIST.pdf. CHPA. Industrial CHP. 2014 [cited 2014 29 Jul.]; Available from: http://www.chpa.co.uk/industrial-chp_186.html. CarbonTrust, Introducing combined heat and power- a new generation of energy and carbon savings. 2010. DECC. Reciprocating Engines. 2013 [cited 2014 20 Jun.]; Available from: http://chp.decc.gov.uk/cms/reciprocating-engines-5. Martin, M. and Thornley, P., The potential for thermal storage to reduce the overall carbon emissions from district heating systems. 2013. Ingram, L., Mohan, D., Bricka, M., Steele, P., Strobel, D., Crocker, D., Mitchell, B., Mohammad, J., Cantrell, K., and Pittman, C.U., Pyrolysis of wood and bark in an auger reactor: Physical properties and chemical analysis of the produced bio-oils. Energy & Fuels, 2007. 22(1): p. 614-625. Hornung, A., Apfelbacher, A., Richter, F., Schöner, J., Leibold, H., and Seifert, H., Thermo-chemical conversion of biomass. Haloclean® - intermediate pyrolysis, in 15th International Conference on Composites/Nano Engineering. 2007: Haikou, China. ICCE-15 Detailed Short Papers. p. 29-33. Bhattacharya, P., Steele, P.H., Hassan, E.B.M., Mitchell, B., Ingram, L., and Pittman Jr, C.U., Wood/plastic copyrolysis in an auger reactor: Chemical and physical analysis of the products. Fuel, 2009. 88(7): p. 1251-1260. de Wild, P.J., Uil, H.d., Reith, J.H., Kiel, J.H.A., and Heeres, H.J., Biomass valorisation by staged degasification: A new pyrolysis-based thermochemical conversion option to produce value-added chemicals from lignocellulosic biomass. Journal of Analytical and Applied Pyrolysis, 2009. 85(1–2): p. 124-133. Hassan, E.-b., Steele, P., and Ingram, L., Characterization of fast pyrolysis bio-oils produced from pretreated pine wood. Applied Biochemistry and Biotechnology, 2009. 154(1): p. 3-13. Thangalazhy-Gopakumar, S., Adhikari, S., Ravindran, H., Gupta, R.B., Fasina, O., Tu, M., and Fernando, S.D., Physiochemical properties of bio-oil produced at various temperatures from pine wood using an auger reactor. Bioresource Technology, 2010. 101(21): p. 8389-8395. Puy, N., Murillo, R., Navarro, M.V., Lopez, J.M., Rieradevall, J., Fowler, G., Aranguren, I., Garcia, T., Bartroli, J., and Mastral, A.M., Valorisation of forestry 175 43. 44. 45. 46. 47. 48. 49. 50. 51. 52. 53. 54. 55. 56. 57. 58. 59. waste by pyrolysis in an auger reactor. Waste Management, 2011. 31(6): p. 133949. Roggero, C.M., Tumiatti, V., Scova, A., De Leo, C., Binello, A., and Cravotto, G., Characterization of oils from Haloclean (R) pyrolysis of biomasses. Energy Sources Part a-Recovery Utilization and Environmental Effects, 2011. 33(5): p. 467-476. Liaw, S.-S., Wang, Z., Ndegwa, P., Frear, C., Ha, S., Li, C.-Z., and Garcia-Perez, M., Effect of pyrolysis temperature on the yield and properties of bio-oils obtained from the auger pyrolysis of Douglas Fir wood. Journal of Analytical and Applied Pyrolysis, 2012. 93(0): p. 52-62. Oasmaa, A., Leppamaki, E., Koponen, P., Levander, J., and Tapola, E., Physical characterisation of biomass-based pyrolysis liquids- Application of standard fuel oil analyses. 1997, Technical Research Centre of Finland: Espoo. Sipila, K., Kuoppala, E., Fagernas, L., and Oasmaa, A., Characterization of biomass-based flash pyrolysis oils. Biomass & Bioenergy, 1998. 14(2): p. 103-113. Oasmaa, A. and Peacocke, C., A guide to physical property characterisation of biomass-derived fast pyrolysis liquids. 2001, Technical Research Centre of Finland: Espoo. Oasmaa, A. and Peacocke, C., Properties and fuel use of biomass-derived fast pyrolysis liquids- A guide. 2010, Technical Research Centre of Finland: Espoo. Fonts, I., Kuoppala, E., and Oasmaa, A., Physicochemical properties of product liquid from pyrolysis of sewage sludge. Energy & Fuels, 2009. 23(8): p. 4121-4128. Fonts, I., Gea, G., Azuara, M., Ábrego, J., and Arauzo, J., Sewage sludge pyrolysis for liquid production: A review. Renewable and Sustainable Energy Reviews, 2012. 16(5): p. 2781-2805. Shaddix, R. and Huey, S., Combustion characteristics of fast pyrolysis oils derived from hybrid poplar, in Developments in thermo chemical biomass conversion, Bridgwater, A.V. and Boocock, D.G.B., Editors. 1997, Blackie Academic & Professional: London, UK. p. 465–480. Gust, S., Combustion experiences of fast pyrolysis fuel in intermediate size boilers, in Developments in thermochemical biomass conversion, Bridgwater, A.V.B., D.G.B., Editor. 1997, Blackie Academic & Professional: London, UK. p. 481–488. Gust, S., Combustion of pyrolysis liquids, in Biomass gasification and pyrolysis, Kaltschmitt, M.B., A.V., Editor. 1997, CPL Press: Newbury, UK. p. 498–503. Oasmaa, A., Kyto, M., and Sipila, K., Pyrolysis liquid combustion tests in an industrial boiler, in Progress in thermochemical biomass conversion, Bridgwater, A.V., Editor. 2001, Blackwell Science: Oxford, UK. p. 1468-1481. Kyto, M., Martin, P., and Gust, S., Development of combustors for pyrolysis liquids, in Pyrolysis and gasification of biomass and waste, Bridgwater, A.V., Editor. 2003, Newbury, UK: CPL Press: Strasbourg, France. p. 187–190. Gust, S., Nieminen, J.P., and Nyronen, T., Forestera (TM)—liquefied wood fuel pilot plant, in Pyrolysis and gasification of biomass and waste, Bridgwater, A.V., Editor. 2003, Newbury, UK: CPL Press: Strasbourg, France. p. 187–190. Andrews, R.G., Patnaik, P.C., Liu, Q., and Thamburaj, R. Firing fast pyrolysis oil in turbines. in Proceeding of biomass pyrolysis oil, properties and combustion meeting. 1994. Estes Park, Colorado. Lopez Juste, G. and Salva Monfort, J.J., Preliminary test on combustion of wood derived fast pyrolysis oils in a gas turbine combustor. Biomass & Bioenergy, 2000. 19(2): p. 119-128. Ashmore, C., Biomass based cogen plant rated at 2.5MW and 12,000 pph steam, in Gas turbine world. 2004. 176 60. 61. 62. 63. 64. 65. 66. 67. 68. 69. 70. 71. 72. 73. 74. 75. Solantausta, Y., Nylund, N.-O., Westerholm, M., Koljonen, T., and Oasmaa, A., Wood-pyrolysis oil as fuel in a diesel-power plant. Bioresource Technology, 1993. 46(1-2): p. 177-188. Solantausta, Y., Nylund, N.O., and Gust, S., Use of pyrolysis oil in a test dieselengine to study the feasibility of a diesel power-plant concept. Biomass & Bioenergy, 1994. 7(1-6): p. 297-306. Jay, D.C., Rantanen, O.A., Sipila, K.H., and Nylund, N.-O. Wood pyrolysis oil for diesel engines. in 1995 fall technical conference. 1995. Milwaukee, Wisconsin: New York: ASME. Suppes, G.J., Natarajan, V.P., and Chen, Z., Autoignition of select oxygenate fuels in a simulated diesel engine environment, in AIChE National Meeting. 1996: New Orleans, LA. Leech, J., Running a dual fuel engine on pyrolysis oil, in Biomass gasification and pyrolysis, state of the art and future prospects, Kaltschmitt, M. and Bridgwater, A.V., Editors. 1997, CPL Press: Newbury, UK. Shihadeh, A. Rural electrification from local resources: biomass pyrolysis oil combustion in a direct injection diesel engine. Massachusetts Institute of Technology. 1998. Ph.D Thesis. Shihadeh, A. and Hochgreb, S., Diesel engine combustion of biomass pyrolysis oils. Energy & Fuels, 2000. 14(2): p. 260-274. Shihadeh, A. and Hochgreb, S., Impact of biomass pyrolysis oil process conditions on ignition delay in compression ignition engines. Energy & Fuels, 2002. 16(3): p. 552-561. Bertoli, C., Calabria, R.D., Alessio, J., Lazzaro, M., Massoli, P., and Moccia, V. Diesel engines fuelled by wood pyrolysis oil: feasibility and perspectives. in Fifth international conference on internal combustion engines. 2001. Chiaramonti, D., Bonini, A., Fratini, E., Tondi, G., Gartner, K., Bridgwater, A.V., Grimm, H.P., Soldaini, I., Webster, A., and Baglioni, P., Development of emulsions from biomass pyrolysis liquid and diesel and their use in engines - Part 1: emulsion production. Biomass & Bioenergy, 2003. 25(1): p. 85-99. Chiaramonti, D., Bonini, A., Fratini, E., Tondi, G., Gartner, K., Bridgwater, A.V., Grimm, H.P., Soldaini, I., Webster, A., and Baglioni, P., Development of emulsions from biomass pyrolysis liquid and diesel and their use in engines - Part 2: tests in diesel engines. Biomass & Bioenergy, 2003. 25(1): p. 101-111. Blows, J.H., Evaluation of complementary technologies to reduce bio engine emissions. 2003, Department of Trade and Industry (DTI) New and Renewable Energy Programme: London, U.K. Singh, B., Hansdah, D., and Murugan, S., Performance and exhaust emissions of a diesel engine using pyrolysis oil from waste frying oil and castor oil mixture, in International conference on sustainable mobility. 2010: Kuala Lumpur, Malaysia. Mitchell, C.P., Bridgwater, A.V., Stevens, D.J., Toft, A.J., and Watters, M.P., Technoeconomic assessment of biomass to energy. Biomass and Bioenergy, 1995. 9(1–5): p. 205-226. Bridgwater, A.V., Toft, A.J., and Brammer, J.G., A techno-economic comparison of power production by biomass fast pyrolysis with gasification and combustion. Renewable and Sustainable Energy Reviews, 2002. 6(3): p. 181-246. Peacocke, G.V.C., Bridgwater, A.V., and Brammer, J.G., Techno-economic assessment of power production from the Wellman Process Engineering Ltd and BTG fast pyrolysis processes. , in Science in Thermal and Chemical Biomass Conversion, Bridgwater, A.V. and Boocock, D.G.B., Editors. 2004. p. 1785-1802. 177 76. 77. 78. 79. 80. 81. 82. 83. 84. 85. 86. 87. 88. 89. 90. 91. 92. 93. 94. 95. 96. 97. LaClaire, C., Barrett, C., and Hall, K., Technical, environmental and economic feasibility of bio-oil in new hampshire's north country. 2004: Durham, NH: University of New Hampshire. Badger, P.C. and Fransham, P., Use of mobile fast pyrolysis plants to densify biomass and reduce biomass handling costs—A preliminary assessment. Biomass and Bioenergy, 2006. 30(4): p. 321-325. Gregoire, C.E. and Bain, R.L., Technoeconomic analysis of the production of biocrude from wood. Biomass and Bioenergy, 1994. 7(1–6): p. 275-283. Chiaramonti, D., Oasmaa, A., and Solantausta, Y., Power generation using fast pyrolysis liquids from biomass. Renewable and Sustainable Energy Reviews, 2007. 11(6): p. 1056-1086. Rogers, J.G. A techno-economic assessment of the use of fast pyrolysis bio-oil from UK energy crops in the production of electricity and combined heat and power. Aston University. 2009. Ph.D Thesis. CountryWide. CountryWide woodburner pelletes. 2013 [cited 2013 18 Mar.]; Available from: http://www.countrywidefarmers.co.uk/pws/ProductDetails.ice?ProductID=10116. StrawPelletsLtd. Straw pellets for fuel. 2013 [cited 2013 16 Jul.]; Available from: http://www.strawpelletsltd.co.uk/straw-pellets.html. SevernTrentWater. Netheridge Sewage Treatment Works. [cited 2013 18 Mar.]; Available from: http://www.stwater.co.uk/businesses/tankered-waste/netheridgesewage-treatment-works. Samanya, J. Increase of energy recovery from sewage sludge. Aston University. 2013. Ph.D Thesis. Ouadi, M., Kay, M., Brammer, J.G., and Hornung, A., Waste to power. Tappi Journal, 2012. 11(2): p. 55-64. Ouadi, M. Sustainable energy from paper industry wastes. Aston University. 2013. Ph.D Thesis. Hornung, A. and Apfelbacher, A., Thermal treatment of biomass. 2009: UK. Yang, Y., Brammer, J.G., Mahmood, A.S.N., and Hornung, A., Intermediate pyrolysis of biomass energy pellets for producing sustainable liquid, gaseous and solid fuels. Bioresource Technology, 2014. 169(0): p. 794-799. ASTM. MNL57 Proximate Analysis. 2007; Available from: http://www.astm.org/DIGITAL_LIBRARY/MNL/PAGES/MNL11271M.htm. Coats, A.W. and Redfern, J.P., Thermogravimetric analysis: A review. Analyst, 1963. 88(1053): p. 906-924. ASTM, E870 - 82 Standard Test Methods for Analysis of Wood Fuels. 2013: West Conshohocken, PA. www.astm.org. ASTM. MNL57 Ultimate Analysis. 2007; Available from: http://www.astm.org/DIGITAL_LIBRARY/MNL/PAGES/MNL11272M.htm. MedacLtd. CH&N Analysis. 2012 [cited 2013 3 Mar.]; Available from: http://www.medacltd.com/services.html. ASTM, D4737 - 10 Standard test method for calculated cetane index by four variable equation. 2010, ASTM International: West Conshohocken, PA. www.astm.org. ASTM, D445 - 12 Standard test method for kinematic viscosity of transparent and opaque liquids (and calculation of dynamic viscosity). 2012, ASTM International: West Conshohocken, PA. www.astm.org. REW, If no us, who eles- Annual Report 2007. 2007. Kornmayer, K. 2014. Personal Communication. 178 98. 99. 100. 101. 102. 103. 104. 105. 106. 107. 108. 109. 110. 111. 112. 113. 114. 115. Sinnott, R.K., Coulson and Richardson's Chemical Engineering Volume 6 Chemical Engineering Design (4th Edition). 2005, Elsevier. Dimitriou, I. Techno-economic assessment and uncertainty analysis of thermochemical processes for second generation biofuels. Aston University. 2013. Ph.D Thesis. Tijmensen, M.J.A., Faaij, A.P.C., Hamelinck, C.N., and van Hardeveld, M.R.M., Exploration of the possibilities for production of Fischer Tropsch liquids and power via biomass gasification. Biomass and Bioenergy, 2002. 23(2): p. 129-152. AnglianWater. Water and wastewater charges for 2013/14, Business customers. 2013 [cited 2014 2 Jun.]; Available from: http://www.anglianwater.co.uk/_assets/media/LED262_Business_charges_leaflet_2 013-14.pdf. Moyer, R.C., Contemporary Financial Management. 2012: South-Western, Cengage Learning. Alexander, S. Novel biomass conversion routes : ammonia from biomass, and marine macroalgae for energy. Aston Universtiy. 2013. Hassan, M. Experimental investigation and process modelling of the cold particulate solids flow inside a twin-screw Pyroformer reactor Aston University. 2014. MEng Project Report. Mayer, Z.A., Apfelbacher, A., and Hornung, A., A comparative study on the pyrolysis of metal- and ash-enriched wood and the combustion properties of the gained char. Journal of Analytical and Applied Pyrolysis, 2012. 96(0): p. 196-202. Lehmann, J., Gaunt, J., and Rondon, M., Bio-char Sequestration in Terrestrial Ecosystems – A Review. Mitigation and Adaptation Strategies for Global Change, 2006. 11(2): p. 395-419. Pettersen Roger, C., The chemical composition of wood, in The Chemistry of Solid Wood. 1984, American Chemical Society. p. 57-126. Burhenne, L., Messmer, J., Aicher, T., and Laborie, M.-P., The effect of the biomass components lignin, cellulose and hemicellulose on TGA and fixed bed pyrolysis. Journal of Analytical and Applied Pyrolysis, 2013. 101(0): p. 177-184. Sun, J.X., Xu, F., Sun, X.F., Xiao, B., and Sun, R.C., Physico-chemical and thermal characterization of cellulose from barley straw. Polymer Degradation and Stability, 2005. 88(3): p. 521-531. Giudicianni, P., Cardone, G., and Ragucci, R., Cellulose, hemicellulose and lignin slow steam pyrolysis: Thermal decomposition of biomass components mixtures. Journal of Analytical and Applied Pyrolysis, 2013. 100(0): p. 213-222. Yang, H., Yan, R., Chen, H., Lee, D.H., and Zheng, C., Characteristics of hemicellulose, cellulose and lignin pyrolysis. Fuel, 2007. 86(12–13): p. 1781-1788. Anis, S. and Zainal, Z.A., Upgrading producer gas quality from rubber wood gasification in a radio frequency tar thermocatalytic treatment reactor. Bioresource Technology, 2013. 150(0): p. 328-337. Ouadi, M., Brammer, J.G., Kay, M., and Hornung, A., Fixed bed downdraft gasification of paper industry wastes. Applied Energy, 2013. 103(0): p. 692-699. Ruiz, J.A., Juárez, M.C., Morales, M.P., Muñoz, P., and Mendívil, M.A., Biomass gasification for electricity generation: Review of current technology barriers. Renewable and Sustainable Energy Reviews, 2013. 18(0): p. 174-183. Mahmood, A.S.N., Brammer, J.G., Hornung, A., Steele, A., and Poulston, S., The intermediate pyrolysis and catalytic steam reforming of Brewers spent grain. Journal of Analytical and Applied Pyrolysis, 2013. 103(0): p. 328-342. 179 116. 117. 118. 119. 120. 121. 122. 123. 124. 125. 126. 127. 128. 129. 130. 131. 132. 133. 134. Kabe, T., Ishihara, A., Qian, E.W., Sutrisna, I.P., and Kabe, Y., Coal and coalrelated compounds: structures, reactivity and catalytic reactions. Vol. 150. 2004: Elsevier. Mattenberger, H., Fraissler, G., Brunner, T., Herk, P., Hermann, L., and Obernberger, I., Sewage sludge ash to phosphorus fertiliser: Variables influencing heavy metal removal during thermochemical treatment. Waste Management, 2008. 28(12): p. 2709-2722. Yang, Y., Brammer, J.G., Ouadi, M., Samanya, J., Hornung, A., Xu, H.M., and Li, Y., Characterisation of waste derived intermediate pyrolysis oils for use as diesel engine fuels. Fuel, 2013. 103(0): p. 247-257. McDonnell, K., Ward, S., Leahy, J.J., and McNulty, P., Properties of rapeseed oil for use as a diesel fuel extender. Journal of the American Oil Chemists' Society, 1999. 76(5): p. 539-543. Knothe, G., Sharp, C.A., and Ryan, T.W., Exhaust emissions of biodiesel, petrodiesel, neat methyl esters, and alkanes in a new technology engine. Energy & Fuels, 2005. 20(1): p. 403-408. Bacha, J., Freel, J., Gibbs, A., Gibbs, L., and Hemighaus, G. Chevron CorporatioDiesel fuels technical review 2007. Channiwala, S.A. and Parikh, P.P., A unified correlation for estimating HHV of solid, liquid and gaseous fuels. Fuel, 2002. 81(8): p. 1051-1063. Zhu, X. and Venderbosch, R., A correlation between stoichiometrical ratio of fuel and its higher heating value. Fuel, 2005. 84(7–8): p. 1007-1010. Bahadur, N.P., Boocock, D.G.B., and Konar, S.K., Liquid hydrocarbons from catalytic pyrolysis of sewage sludge lipid and canola oil: Evaluation of fuel properties. Energy & Fuels, 1995. 9(2): p. 248-256. Nelik, D. Newtonian and Non-Newtonian Fluids. 2012; Available from: http://www.pump-zone.com/topics/pumps/centrifugal-pumps/newtonian-and-nonnewtonian-fluids-0. Wissmiller, D. Pyrolysis oil combustion characteristics and exhaust emissions in a swirl-stabilized flame. Iowa State University. 2009. Ph.D Thesis. Shu, Q., Wang, J., Peng, B., Wang, D., and Wang, G., Predicting the surface tension of biodiesel fuels by a mixture topological index method, at 313 K. Fuel, 2008. 87(17–18): p. 3586-3590. Freitas, S.V.D., Oliveira, M.B., Queimada, A.J., Pratas, M.J., Lima, Á.S., and Coutinho, J.A.P., Measurement and prediction of biodiesel surface tensions. Energy & Fuels, 2011. 25(10): p. 4811-4817. ASTM, ASTM D664 - 11a Standard Test Method for Acid Number of Petroleum Products by Potentiometric Titration. 2011: West Conshohocken, PA. ASTM, D6079 - 11 Standard test method for evaluating lubricity of diesel fuels by the High-Frequency Reciprocating Rig (HFRR). 2011: West Conshohocken, PA. ASTM, D975 - 12a Standard specification for diesel fuel oils. 2012: West Conshohocken, PA. ASTM. ASTM D189-06(2010)e1 Standard Test Method for Conradson Carbon Residue of Petroleum Products. 2010. Happonen, M., Heikkilä, J., Murtonen, T., Lehto, K., Sarjovaara, T., Larmi, M., Keskinen, J., and Virtanen, A., Reductions in particulate and nox emissions by diesel engine parameter adjustments with HVO fuel. Environmental Science & Technology, 2012. 46(11): p. 6198-6204. Yamane, K., Ueta, A., and Shimamoto, Y., Influence of physical and chemical properties of biodiesel fuel on injection, combustion and exhaust emission characteristics in a DI-CI engine, in The Fifth International Symposium on 180 135. 136. 137. 138. 139. 140. 141. 142. 143. 144. 145. 146. 147. 148. 149. Diagnostics and Modelling of Combustion in Internal Combustion Engines (COMODIA 2001), . 2001: Nagoya. Torres-Jimenez, E., Pilar Dorado, M., and Kegl, B., Experimental investigation on injection characteristics of bioethanol–diesel fuel and bioethanol–biodiesel blends. Fuel, 2011. 90(5): p. 1968-1979. Torres-Jimenez, E., Svoljšak-Jerman, M., Gregorc, A., Lisec, I., Dorado, M.P., and Kegl, B., Physical and Chemical Properties of Ethanol−Biodiesel Blends for Diesel Engines. Energy & Fuels, 2009. 24(3): p. 2002-2009. Schleicher, T., Werkmeister, R., Russ, W., and Meyer-Pittroff, R., Microbiological stability of biodiesel–diesel-mixtures. Bioresource Technology, 2009. 100(2): p. 724-730. Oasmaa, A. and Czernik, S., Fuel oil quality of biomass pyrolysis oilsstate of the art for the end users. Energy & Fuels, 1999. 13(4): p. 914-921. Diebold, J.P., A review of the chemical and physical mechanisms of the storage stability of fast pyrolysis bio-oils. 2000, National Renewable Energy Laboratory: Golden, USA. Labeckas, G. and Slavinskas, S., Performance of direct-injection off-road diesel engine on rapeseed oil. Renewable Energy, 2006. 31(6): p. 849-863. Vojtíšek-Lom, M., Pechout, M., and Barbolla, A., Experimental investigation of the behavior of non-esterified rapeseed oil in a diesel engine mechanical fuel injection system. Fuel, 2012. 97(0): p. 157-165. Kim, K.H., Eom, I.Y., Lee, S.M., Choi, D., Yeo, H., Choi, I.-G., and Choi, J.W., Investigation of physicochemical properties of biooils produced from yellow poplar wood (Liriodendron tulipifera) at various temperatures and residence times. Journal of Analytical and Applied Pyrolysis, 2011. 92(1): p. 2-9. Pollard, A.S., Rover, M.R., and Brown, R.C., Characterization of bio-oil recovered as stage fractions with unique chemical and physical properties. Journal of Analytical and Applied Pyrolysis, 2012. 93(0): p. 129-138. Yang, Y., Brammer, J.G., Samanya, J., Hossain, A.K., and Hornung, A., Investigation into the performance and emissions of a stationary diesel engine fuelled by sewage sludge intermediate pyrolysis oil and biodiesel blends. Energy, 2013. 62(0): p. 269-276. Hossain, A.K., Ouadi, M., Siddiqui, S.U., Yang, Y., Brammer, J., Hornung, A., Kay, M., and Davies, P.A., Experimental investigation of performance, emission and combustion characteristics of an indirect injection multi-cylinder CI engine fuelled by blends of de-inking sludge pyrolysis oil with biodiesel. Fuel, 2013. 105(0): p. 135-142. Chauhan, B.S., Kumar, N., and Cho, H.M., A study on the performance and emission of a diesel engine fueled with Jatropha biodiesel oil and its blends. Energy, 2012. 37(1): p. 616-622. Kasiraman, G., Nagalingam, B., and Balakrishnan, M., Performance, emission and combustion improvements in a direct injection diesel engine using cashew nut shell oil as fuel with camphor oil blending. Energy, 2012. 47(1): p. 116-124. Varatharajan, K. and Cheralathan, M., Influence of fuel properties and composition on NOx emissions from biodiesel powered diesel engines: A review. Renewable and Sustainable Energy Reviews, 2012. 16(6): p. 3702-3710. DieselNet. European Union emission standards for non-road diesel engines 2013 [cited 2014 March]; Available from: http://www.dieselnet.com/standards/eu/nonroad.php. 181 150. 151. 152. 153. 154. 155. 156. 157. 158. 159. 160. 161. 162. 163. 164. 165. 166. 167. 168. 169. 170. 171. 172. EPA. Non-road compression-ignition engines- exhaust emission standards 2013 [cited 2014 March]; Available from: http://www.epa.gov/otaq/standards/nonroad/nonroadci.htm. CumminsPower. EU emissions standards for on-site power generation. 2006 [cited 2014 March]; Available from: http://www.cumminspower.com/www/literature/brochures/CPG-475-EUemissions-flyer-en.pdf. Vedharaj, S., Vallinayagam, R., Yang, W.M., Saravanan, C.G., Chou, S.K., Chua, K.J.E., and Lee, P.S., Reduction of harmful emissions from a diesel engine fueled by kapok methyl ester using combined coating and SNCR technology. Energy Conversion and Management, 2014. 79(0): p. 581-589. İleri, E. and Koçar, G., Experimental investigation of the effect of antioxidant additives on NOx emissions of a diesel engine using biodiesel. Fuel, 2014. 125(0): p. 44-49. Sayin, C., Gumus, M., and Canakci, M., Influence of injector hole number on the performance and emissions of a DI diesel engine fueled with biodiesel–diesel fuel blends. Applied Thermal Engineering, 2013. 61(2): p. 121-128. Imran, A., Varman, M., Masjuki, H.H., and Kalam, M.A., Review on alcohol fumigation on diesel engine: a viable alternative dual fuel technology for satisfactory engine performance and reduction of environment concerning emission. Renewable and Sustainable Energy Reviews, 2013. 26(0): p. 739-751. AspenTechnologyInc, Aspen Plus V7.3.2: getting started modeling processes with solids. 2012. Brammer, J.G. 2014. Personal Communication. Saghir, M. 2013. Personal Communication. Wang, L. 2014. Personal Communication. Li, H.M. 2014. Personal Communication. Thompson, D. 2014. Personal Communication. Vale, P. 2014. Personal Communication. David, A. 2014. Personal Communication. Ofwat, Large and intermediate user charges for sewerage 2010-11. 2012. Bovill, D., Patterns of pay: Estimates from the annual survey of hours and earnings, UK, 1997 to 2013. 2014. DECC. Interaction between the RHI and Renewables Obligation. 2014; Available from: http://chp.decc.gov.uk/cms/interaction-between-the-rhi-and-renewablesobligation/. DECC. Energy Technology List- ECA Scheme. 2013 [cited 2014, 6 Jun. ]; Available from: https://etl.decc.gov.uk/etl/site.html. Lantz, M., The economic performance of combined heat and power from biogas produced from manure in Sweden – A comparison of different CHP technologies. Applied Energy, 2012. 98(0): p. 502-511. SEVAEnergieAG. SEVA Energie AG product range. 2013; Available from: http://www.seva.de/index.php/en/component/content/article/7. SENTECHIncorporated, Commercial and industrial CHP technology cost and performance data analysis for EIA. 2010. ASUE. BHKW-Kenndaten 2005. 2005; Available from: http://asue.de/cms/upload/inhalte/blockheizkraftwerke/broschuere/BHKWKenndaten-2005.pdf. ASUE. BHKW-Kenndaten 2011. 2011; Available from: http://asue.de/cms/upload/broschueren/2011/bhkw-kenndaten/asue-bhkwkenndaten-0311.pdf. 182 173. 174. 175. 176. 177. 178. 179. 180. 181. 182. 183. 184. 185. 186. 187. 188. 189. 190. 191. 192. do Espirito Santo, D.B., Performance evaluation of an electricity base load engine cogeneration system. International Journal of Energy Research, 2010. 34(9): p. 787-799. DECC. Guidance: Calculating Renewable Obligation Certificates (ROCs). 2013; Available from: https://www.gov.uk/calculating-renewable-obligation-certificatesrocs. DECC, Government response to the consultation on proposals for the levels of banded support under the Renewables Obligation for the period 2013-17 and the Renewables Obligation Order 2012. 2012. Ofgem, Biodiesel, Glycerol and the Renewable Obligation. 2008. Ofgem. Renewables Obligation: biodiesel and fossil derived bioliquids guidance 2013; Available from: https://www.ofgem.gov.uk/ofgempublications/58215/biodiesel-guidance.pdf. Greenergy. Greenergy Perspectives, soy oil in biodiesel. 2011 [cited 2014, 1 May]; Available from: http://www.greenergy.com/Environment/perspectives/10-Soy.pdf. eROC. On-line ROC track record. 2014; Available from: http://www.eroc.co.uk/trackrecord.htm. BaringaPartnersLLP, Power Purchase Agreements for independent renewable generators – an assessment of existing and future market liquidity 2013. APX_Power_UK. Electricity spot prices. 2014; Available from: http://www.wrap.org.uk/content/electricity-spot-prices. DECC. Gas and electricity prices in the non-domestic sector. 2014; Available from: https://www.gov.uk/government/statistical-data-sets/gas-and-electricity-prices-inthe-non-domestic-sector. HMRevenueCustoms. Climate Change Levy rates. 2014; Available from: http://customs.hmrc.gov.uk/channelsPortalWebApp/channelsPortalWebApp.portal? _nfpb=true&_pageLabel=pageExcise_ShowContent&id=HMCE_PROD1_031183 &propertyType=document. Ofgem. Climate Change Levy exemption. 2013; Available from: https://www.ofgem.gov.uk/environmental-programmes/climate-change-levyexemption. DECC. Renewable Heat Incentive. 2011; Available from: https://www.gov.uk/government/uploads/system/uploads/attachment_data/file/4804 1/1387-renewable-heat-incentive.pdf. Ofgem, Renewable Heat Incentive – tariff adjustment. 2012. Ofgem, Non-Domestic RHI- DRAFT guidance volume one: Eligibility and how to apply. 2014. MayorofLondon, District Heating Manual for London. 2013. Hart, A., Charcoal for barbeques consumption within the United Kingdom: a transport energy analysis of charcoal supplied from UK coppiced woodlands and from Brazil and South African important. 1997, Queen Mary and Westfield Collegem: London. OxfordBiochar. Biochar- 10kg of 100% pure biochar. 2013; Available from: http://oxfordbiochar.bigcartel.com/product/biochar-10-kg-of-100-pure-biochar. CarbonGold. 3 for 2 offer. 2013; Available from: http://www.carbongold.com/product-category/3-for-2-offer/. Verheijen, F., Jeffery, S., Bastos, A.C., van der Velde, M., and Diafas, I., Biochar application to soils: a critical scientific review of effects on soil properties, processes and functions. 2010. 183 193. 194. 195. 196. 197. Hugh McLaughlin, Frank Shields, Jacek Jagiello, and Greg Thiele, Analytical options for biochar adsorption and surface area, in 2012 US Biochar Conference session on Char Characterization. 2012: Rohnert Park, CA. FourSeasonFuelLtd. Charcoal- BBQ. 2013 [cited 2013 12 Dec]; Available from: http://www.fourseasonsfuel.co.uk/charcoal-bbq/charcoal-minimum-of-5-x-3-and-6kg-bags-local-delivery-6-0-P-7/. TreewoodCharcoal. Treewood charcoal products. 2013 [cited 2013 12 Dec]; Available from: http://www.treewoodcharcoal.com/products.html. BigK. Big K products. 2013 [cited 2013 12 Dec]; Available from: http://www.bigk.co.uk/Catalog-Charcoal_141.aspx. Elliott, P., Biomass-energy overview in the context of Brazilian biomass-power demonstration. Bioresource Technology, 1993. 46(1–2): p. 13-22. 184 LIST OF PUBLICATIONS The work presented in Chapter 4, 5 and 6 of this thesis has been produced as the following publications: Peer-reviewed Journals 1. Y. Yang, J.G. Brammer, A.S.N. Mahmood and A. Hornung, Intermediate pyrolysis of biomass energy pellets for producing liquid, gaseous and solid fuels. Bioresource Technology, 2014, 169: pp. 794-799, doi: 10.1016/j.biortech.2014.07.044. 2. M. Ouadi, J.G. Brammer, Y. Yang, A. Hornung and M. Kay, The intermediate pyrolysis of de-inking sludge to produce a sustainable liquid fuel. Journal of Analytical and Applied Pyrolysis, 2013, 102, pp. 24-32, doi: 10.1016/j.jaap.2013.04. 007 3. Y. Yang, J.G. Brammer, J. Samanya, A.K. Hossain and A. Hornung, Investigation into the performance and emissions of a stationary diesel engine fuelled by sewage sludge intermediate pyrolysis oil and biodiesel blends. Energy, 2013, 62: p. 269-276, doi:10. 1016/j.energy.2013.09.058 4. A.K. Hossain, M. Ouadi, S.U. Siddiqui, Y. Yang, J.G. Brammer, A. Hornung, M. Kay, and P.A. Davies. Experimental investigation of performance, emission and combustion characteristics of an indirect injection multi-cylinder CI engine fuelled by blends of de-inking sludge pyrolysis oil with biodiesel. Fuel, 105, 2013, pp. 135–142, doi: 10.1016/ j.fuel.2012.05.007 5. Y. Yang, J.G. Brammer, M. Ouadi, J. Samanya, A. Hornung, H.M. Xu and Y. Li, Characterisation of waste derived intermediate pyrolysis oils for use as diesel engine fuels. Fuel, 2013. 103(0): pp. 247-257, doi: 10.1016/j.fuel.2012.07.014 Conferences 6. Y. Yang, J.G. Brammer, A.S.N. Mahmood and A. Hornung, ‘Intermediate pyrolysis of biomass energy pellets for producing liquid, gas and solid fuels by using Pyroformer intermediate pyrolysis system’, at the 20th International Symposium on Analytical and Applied Pyrolysis (19-23 May 2014, Birmingham UK) 7. Y. Yang, J.G. Brammer and C. Kornmayer, ‘Simulation of integrated intermediate pyrolysis and gasification CHP system using Aspen Plus’, at the 20th International Symposium on Analytical and Applied Pyrolysis (19-23 May 2014, Birmingham UK) 185 8. Y. Yang, J.G. Brammer and A. Hornung, ‘Thermal efficiency and emissions of a stationary diesel engine fuelled with a biodiesel-intermediate pyrolysis oil blend’, at the 20th European Biomass Conference and Exhibition (18-22 Jun. 2012, Milan Italy) 9. Y. Yang, J.G. Brammer and A. Hornung, ‘The characteristics of intermediate pyrolysis oil derived from sewage sludge in blends with biodiesel for use in diesel engines’, at the 19th International Symposium on Analytical and Applied Pyrolysis (21-25 May 2012, Linz Austria) Book Chapter 10. M. Ouadi, Y. Yang and A. Hornung ‘Engines for Combined Heat and Power’, a chapter in ‘Transformation of Biomass: Theory to Practice’, Editor: A. Hornung, John Wiley & Sons Ltd. (Sep. 2014) 186 APPENDIX 1 ANALYSIS PROCEDURES 1. Ultimate Analysis: Elemental analysis of the solid and liquid sample is provided externally by Medac ltd. Equipment FlashEA 1112 CHNS-O Elemental Analyser Analysis Principal The original analytical method is based on the complete and instantaneous oxidation of the sample by “flash combustion” which converts all organic and inorganic substances into combustion products. The resulting combustion gases pass through a reduction furnace and a swept into the chromatographic column by the carrier gas (He) where they are separated and detected by a thermal conductivity detector (TCD) which gives an output signal proportional to the concentration of the individual components of the mixture. 2. Higher Heating Value: Method for measuring the higher heating value of the solid and liquid sample is performed in accordance to user’s manual of the Parr bomb calorimeter and the ASTM D240 Standard. Equipment Parr 6100 bomb calorimeter and Parr 1108 combustion bomb Sample preparation Solid 1. Well mix approximately 300g solid sample in a sample container. 2. Grind solid sample in an electrical grinder at an approximate size of 0.1mm power. 3. Sample the solid power using a chemical spatula. Liquid 1. Well mix approximately 200 ml liquid material in a closed cap sample vessel at room temperature. 2. Before experiment, shake the sample vessel vigorously to allow the liquid well mixed. 3. Sample the liquid using a pipette. A1 Analysis Procedure 1. 2. 3. 4. Switch on the Parr bomb calorimeter and choose the standard analysis method. Weigh about 20 g solid or liquid sample to the nearest 0.01 g in a sample crucible. Assemble the combustion bomb including the crucible and an ignition wire. With the test sample and fuse in place, slowly charge the bomb with oxygen to 3.0 MPa (30 atm) gage pressure at room temperature. 5. Place 2 kg (±0.1 kg) water in the bomb calorimeter cabinet. 6. Securely place the bomb in the cabinet and connect the ignition electrodes. 7. Input the sample size data as requested by the program. Confirm to start experiment. 8. Wait until the bomb calorimeter complete the experiment and record the results. 9. Clean the combustion bomb and crucible for the next experiment. 10. Repeat the experiment at least twice to take average results. 3. Distillation: Method for the oil distillation is performed in accordance to the ASTM D86 Standard. Equipment Standard laboratory distillation setup including a 300 ml distillation flask, a countercurrent water condenser, an electric 5kW heat source, the flask support, a thermometer, a 100 ml receiving cylinder and various glass tube and joints Sample preparation 1. Well mix approximately 500 ml liquid sample in a closed cap sample vessel. 2. Before experiment, shake the sample vessel vigorously to allow the liquid sample well mixed. Analysis Procedure 1. Pour the sample specimen precisely to the 100 ml mark of the receiving cylinder, and transfer the contents of the receiving cylinder as completely as practical into the distillation flask. 2. Fit the thermometer through a rubber stopper and mechanically centre the thermometer in the neck of the flask above the liquid surface. 3. Place the receiving cylinder that is used to measure the recovered specimen. 4. Connect the counter-current water condenser and run the cooling water via a chiller. 5. Heat the distillation flask at a heating rate of 10°C per minute and observe the Initial Boiling Point. 6. Record the temperature of distillation when every 10% of the distilled liquid is collected in the receiving cylinder. Record all volumes in the graduated cylinder to the nearest 0.5 mL, and all temperature readings to the nearest 0.5°C. A2 7. The experiment can be terminated after 90% of the liquid is distilled. 8. Clean the distillation flask and receiving cylinder for the next experiment. 9. Repeat the experiment at least twice to take average results. 4. Water Content Method for measuring water content of the pyrolysis oils is performed in accordance to the user’s manual of the MT V20 titrator and ASTM E203 Standard. Equipment Mettler Toledo V20 compact volumetric KF titrator and precision scale Reagent HYDRANAL-Water Standard 0.10, HYDRANAL-Water Standard HYDRANAL-Working Medium K reagent for volumetric one-component KF titration in aldehydes and ketones (working medium) Sample preparation 1. Well mix approximately 100 ml liquid sample in a closed cap sample vessel. 2. Before experiment, shake the sample vessel vigorously to allow the liquid well mixed. 3. Use syringe to obtain approximately 10 ml liquid sample and record sample weight (including syringe). Analysis Procedure 1. Switch on the KF titrator and select the pre-programmed E203 standard. 2. Pour approximately 20 ml working medium K reagent in the test beaker and confirm to start the experiment. 3. Allow the titrator automatically operate in pre-titration stage. Wait until the device request sample injection. 4. Inject approximately 2 ml sample. Weight the syringe before and after injection (0.1 mg). Calculate the weight difference and input the weight data. 5. Wait until the analysis is completed and record the results. 6. Wash the titration beaker and electrode with acetone solvent and rinse with distilled water after each run. 7. Repeat the experiment at least twice to take average results. 5. Density: Method for measuring Density of the pyrolysis oils is performed in accordance to the MT 30PX densitometer user’s manual. A3 Equipment Mettler Toledo 30PX densitometer Sample preparation 1. Well mix approximately 200 ml liquid sample in a closed cap sample vessel. 2. Before experiment, shake the sample vessel vigorously to allow the liquid well mixed. Analysis Procedure 1. Pour approximately 100 ml of the liquid sample into a 100 ml beaker and allow the liquid sample settle down at room temperature. 2. Switch on the densitometer and choose the liquid density measurement mode. 3. Immerse the measuring probe of the densitometer below the surface of the liquid sample. Press the trigger to allow the probe introduce 20 ml of the sample specimen into the measurement cell. 4. Rinse the measurement tube with the test sample twice for removing any remaining sample or cleaning solvent that might affect the result. 5. Introduce 20 ml fresh sample into the densitometer. 6. Wait until the device stabilised and record the temperature and density readings from the digital display. 7. Repeat the measurement several times under different temperature profile. 8. To determine the average density, draw a scatter chart to obtain a liner fit under different temperature range. 9. After the experiments, wash the probe and measurement cell with acetone solvent several times and rinse with distil water. 6. Viscosity: Method for measuring kinematic viscosity of the pyrolysis oils is performed in accordance to ASTM D445 Standard using a Cannon-Fenske Routine glass capillary viscometer. Equipment Cannon-Fenske Routine glass capillary viscometer, 20 litre water bath Sample preparation 1. Well mix approximately 50 ml liquid sample in a closed cap sample vessel. 2. Before experiment, shake the sample vessel vigorously to allow the liquid well mixed. A4 3. Sample the liquid using a pipette. Analysis Procedure 1. Select an appropriate Cannon-Fenske Routine glass capillary viscometer. For diesel and biodiesel, size 75 viscometer should be used; for pyrolysis oils, size 150 viscometer should be used. 2. Position the viscometer in the water bath. The water surface should be above the water level mark. Maintain the bath temperature at 40°C. 3. Charge approximately 5 ml of the oil sample into the measuring tube cell. Allow the sample specimen remain in the bath for 10 minutes to reach the test temperature. 4. Use hand suction pipe to pump the test specimen into the test bulb from the tube cell. 5. Record the time for the specimen flowing through the test cell. 6. Use the equitation 3.2 to calculate the kinematic viscosity. Make sure an appropriate constant is applied. 7. Wash the entire tube with acetone solvent and rinse with distilled water. 7. Surface Tension Method for measuring dynamic surface tension of the pyrolysis oils is performed in accordance to the SITA pro line t15 user’s manual and ASTM D3825 standard. Equipment SITA Pro Line t15 Bubble Pressure Tensiometer Sample preparation 1. Well mix approximately 300 ml liquid sample in a closed cap sample vessel. 2. Before experiment, shake the sample vessel vigorously to allow the liquid well mixed. 3. Sample the liquid using a pipette. Analysis Procedure 1. 2. 3. 4. Pour approximately 100 ml liquid sample into a 100 ml testing beaker. Connect the device with PC and start SITA pro analysis software. Lower the testing device to allow the testing probe immersed into the oil sample. Select “Auto-Mode” on the digital display of the device and confirm to start experiment. 5. Wait to see air bubbles coming out from the test probe in a constant frequency and the software starting reading. A5 6. During the experiment, the software will plot the measured surface tension against the bubble life time. Wait until the analyser completes the test, the analyser will show the result of measured surface tension. Save the results. 7. Wash the probe head with acetone solvent and risen with distilled water. 8. Flash Point: Method for measuring Flash point of the pyrolysis oils is performed in accordance to the Seta Flash Series 3 user’s manual and ASTM D7236 Standard Procedure B for inhomogeneous fuel oils. Equipment Seta Flash Series 3 plus Closed Cup (Auto Ramp) Tester. Sample preparation 1. Well mix approximately 50 ml liquid sample in a closed cap sample vessel. 2. Before experiment, shake the sample vessel vigorously to allow the liquid well mixed. 3. Sample the liquid using a pipette. Analysis Procedure 1. Switch on the Seta flash point analyser. 2. Inject approximately 2 ml of the oil sample into the test hot plate by a pipette and close the cap. 3. Select auto ramp method. Ignite the lighter of the tester and maintain a medium flame. 4. The temperature of the oil specimen is ramped up gradually with 5 °C increments. When the temperature alert sounds, manually flick the flame onto the cap outlet. When the temperature reaches the flash point, the apparatus will sound an alter to indicate. This value should be recorded as the flash point. 5. Wait until the hot plate cools down. Wash the plate with acetone solvent and rinse with distilled water. 9. Acidity: Method for measuring of the pyrolysis oils acidity is performed in accordance to the MT G20 user’s manual and ASTM D664 Standard. Equipment Mettler Toledo G20 Compact titrator A6 Reagent 50/50 toluene-isopropanol solution, 0.1N alcoholic potassium hydroxide Sample preparation 1. Well mix approximately 50 ml liquid sample in a closed cap sample vessel. 2. Before experiment, shake the sample vessel vigorously to allow the liquid well mixed. 3. Prepare 2 L 50/50 toluene-isopropanol solution as required. Analysis Procedure 1. Switch on the reactor and select shortcut for ASTM D664 method. 2. Load the electrode in correct position and rinse with distilled water. 3. Pipette approximately 2 ml of the sample in the test beaker. Weight and record the sample size. 4. Pour 50 ml toluene-isopropanol solution in the test beaker and install the beaker on the analyser. The electrode head should be immersed in the solvent. 5. Select number of samples in the following window of the analysis method and input the sample size for each sample. Confirm to start the experiment. 6. Wait until the analysis completed and record the results. 7. Repeat at least three samples to take average results. 8. Wash the beaker and electrode with acetone solution rinse with distilled water. 10. Corrosiveness: Method for testing the corrosiveness of the pyrolysis oils is performed in accordance to the user’s manual of the Stanhope-SETA cooper corrosion test station and ASTM D130 standard Equipment Stanhope-SETA cooper corrosion test station Standard Cooper strips Corrosion compassion board Sample preparation 1. Well mix approximately 200 ml liquid sample in a closed cap sample vessel. 2. Before experiment, shake the sample vessel vigorously to allow the liquid well mixed. A7 Analysis Procedure 1. Switch on the test station and set the oil heating bath at 40°C. 2. Polish the cooper strip with sand paper and use a piece of cloth to clean any copper particulate may present. 3. Fill approximately 50 ml oil specimen in the oil test vessel so that the cooper strip can be fully submerge into the oil specimen. 4. The test is carried out at varying times from 1 hour to 12 hours. 5. When experiment reaches the required experiment time, remove the cooper strip from the vessel. Rinse the cooper strip with acetone and compare with the color board immediately to determine the corrosiveness rating. 6. Clean the test vessel and cooper strip and store for future use. 11. Lubricity: Method for testing the corrosiveness of the pyrolysis oils is performed in accordance to the user’s manual of the PCS High Frequency Reciprocating Rig and ASTM D6079 standard. Equipment PCS High Frequency Reciprocating Rig (HFRR) Sample preparation 1. Well mix approximately 200 ml liquid sample in a closed cap sample vessel. 2. Before experiment, shake the sample vessel vigorously to allow the liquid well mixed. Analysis Procedure 1. Switch on the HFRR and associated PC program. 2. Install the non-rotatable ball specimen with 200 g weight and the test disk specimen on the system in accordance to the instruction. 3. Choose the analysis standard and fill approximately 30 ml oil sample in the holder of the test disk as requested by the program. 4. Confirm to start analysis. The system will automatically submerge the ball specimen against the disk specimen in the testing oil sample. 5. During the test, the ball specimen will rub against the disk with 1 mm stroke at a frequency of 50Hz for 75 minutes and an oil temperature of 60°C. 6. Wait until the specimen cool down after the experiment. Remove the ball specimen from the vibrating arm and disk specimen from the holder respectively. Clean both specimens with organic solvent. 7. Inspect the dimensions of the wear scar at the major and minor axes on disk specimen by 100× magnifiers. Report the total area to rate the oil lubricity. A8 12. Carbon Residue and Ash Content Method for testing the Conradson Carbon Residue (CCR) test and ash content test are performed in accordance with ASTM D189 and ASTM D482 respectively by a manual method. Equipment Conradson Carbon Residue test apparat Meeker burner Muffle furnace Sample preparation 1. Well mix approximately 300 ml liquid sample in a closed cap sample vessel. 2. Before experiment, shake the sample vessel vigorously to allow the liquid well mixed. Sample preparation 1. Pour approximately 20 ml oil sample in a ceramic crucible and record the total weight. 2. Place the ceramic crucible in the metal crucible, cover the crucible lid and chimney to complete the apparat setup. 3. Ignite the Meeker burner and adjust to medium flame to heat the metal crucible for 15 minutes. When black smoke appears, flick the burner on top of the crucible’s chimney from time to time to ignite the vaporised oil samples. Reposition the burner underneath the metal crucible with continuous heating. 4. When there is no oil vapour and black smoke coming out from the chimney, turn up the burner to maximum flame for 10 minute. The metal crucible should appear cheery red colour during the time. 5. When the experiment completed. Allow the whole apparat to cool down within room temperature. 6. Weigh the remaining carbonaceous residue in the ceramic crucible. The CCR is expressed as a mass percentage of the original oil sample. 7. Place the cooled crucible into a muffle furnace at 775 ˚C for 10 minutes. After cooling again at room temperature, the ash content can be determined as a mass percentage of the original oil sample. 8. Clean the test apparat for future use. A9 APPENDIX 2 MEASUREMENT ERROR Table A2.1 Measurement Error Unit Measured Property Measured Unit Equipment kg weight kg Weighting Scale Ultimate Analysis wt.% weight g CH&N Analyser -- ±0.30% Proximate Analysis -- -- MT TGA 1 -- -- wt.% weight mg MT XA 204 DR Analyt. Balance 0.8-220g ± 0.1mg heating value MJ/kg -- ±0.1% temperature °C 0-100 °C ±0.0001°C weight g Weighting Scale 0-500g ±0.1g -- -- HP 5890 GC, HP 5972 MS -- -- potential mV MT G 20 Compact Titrator -2000 +2000 mV ±2 mV weight g MT XA 204 DR Analyt. Balance 0.8-220g ± 0.1mg potential mV MT V30 Volumetric KF Titrator -2000 +2000 mV ±2 mV weight g MT XA 204 DR Analyt. Balance 0.8-220g ± 0.1mg Property Measuring Range Accuracy/ Error Chapter 4 Product Yields HHV GC/MS TAN Moisture MJ/kg -- mgKOH/g wt.% Kinematic Viscosity cSt Density mg/l Carbon Residue Ash Parr 6100 Calorimeter 0.01kg 1.6-8, 3-15, 20100 volume time s density mg/l temperature °C wt.% weight g wt.% weight Distillation -- Corrosiveness Lubricity Stopwatch ±0.2% -- ± 0.2s 0 -2 g/ml ±0.001g/ml 0-40°C ±0.5°C MT XA 204 DR Analyt. Balance 0.8-220g ± 0.1mg g MT XA 204 DR Analyt. Balance 0.8-220g ± 0.1mg volume ml Graduated Cylinder (250 ml) 0-250ml ± 1 ml -- -- -- -- -- -- -- length & width µm Microscope -- ± 1 µm temperature °C Seta Flash Series 3 plus 20-100°C 0.5°C tension mN/m temperature °C time ms MT 30PX Chapter 5 Flash Point Surface Tension mN/m A10 SITA Pro Line T15 Tensiometer 10-100 mN/m 0 - 100 °C 0.1 °C 15-20000ms 1 ms Chapter 6 Electrical Current Ampere Current Ampere Ampere meter -- 0.1 Electrical Voltage volt Voltage volt Volt meter -- 0.1 Fuel Consumption ml volume ml Graduated Cylinder (500 ml) 0-500 ml ±2.5 ml time s Stopwatch -- ± 0.2s -- ± 0.1L 3 volume m Flow Meter time s Stopwatch temperature °C K-type Thermocouple -40 +1100°C ±1°C °C temperature °C K-type Thermocouple -40 +1100°C ±1°C vol.% O2 conc. vol.% Bosch BEA 850 Analyser 0–22 vol.% < ±2% vol.% CO conc. vol.% Bosch BEA 850 Analyser 0–10 vol.% < ±2% ppm CO2 conc. ppm Bosch BEA 850 Analyser 0–18 vol.% < ±2% ppm NOx conc. ppm Bosch BEA 850 Analyser 0–5000 vol.% < ±2% Lambda1, 2 -- Lambda -- Bosch BEA 850 Analyser 0.5–1.8 vol.% < ±2% Degree of Opacity % Degree of Opacity % Bosch RTM 430 Analyser 0-100 % ±1% Coolant Flow Exhaust Temperature1, L/min 2 O2 concentration1, 2 CO concentration1, 2 CO2 concentration1, 2 NOx concentration1, 2 ± 0.2s 1. Robert Bosch GmbH, 2013, A Tidy Affair: Emissions Analysis, Assess Date 29 Aug 2014, Available from http://rb-aa.bosch.com/boaauk/kidownload?type=application/pdf&publication=3&cl_id=20&pos=1&attrv_id=1632 2. OIML, 2008, OIML R 99-1 & 2: Instruments for measuring vehicle exhaust emissions- Part 1: Metrological and technical requirements. Part 2: Metrological controls and performance tests. Assess Date 29 Aug 2014, Available from: http://www.oiml.org/en/files/pdf_r/r099-1-2-e08.pdf A11 APPENDIX 3 ENGINE TEST RESULTS Table A3.1 Engine Data for Diesel Run Parameters: diesel Total Thermal Input Electrical Power Coolant Heat Exhaust Heat Heat Loss Unit kW kW kW kW kW Load 1 17.87 3.69 4.71 6.80 2.66 Load 2 21.26 5.20 6.20 9.25 0.60 Load 3 23.99 6.39 7.03 10.42 0.15 Load 4 30.53 8.68 8.65 12.47 0.72 Load 5 38.54 11.27 10.95 15.18 1.14 ml/s MJ/kg g/ml g/kWh 0.520 45.36 0.825 418.3 0.634 45.36 0.825 362.1 0.693 45.36 0.825 321.9 0.899 45.36 0.825 307.4 1.135 45.36 0.825 299.2 Air Intake Lambda AFRstoi AFR ---- 3.224 14.6 47.1 2.159 14.6 31.5 1.930 14.6 28.2 1.828 14.6 26.7 1.748 14.6 25.5 Electrical Current Voltage Frequency Power A V Hz kW 5.0 429 50 3.69 7.0 425 50 5.20 8.8 419 50 6.39 12.5 401 50 8.68 16.6 392 50 11.27 Coolant Coolant Flow Input Temperature Output Temperature Coolant Δ Temperature Water Density at 40˚C Cp Heat l/s °C °C K (°C) kg/l kJ/kgK kW 0.45 39.6 40.2 0.6 4.125 4.187 4.71 0.45 42.5 43.3 0.8 4.125 4.187 6.20 0.45 44.5 45.4 0.9 4.125 4.187 7.03 0.45 47.5 48.6 1.1 4.125 4.187 8.65 0.45 50.1 51.5 1.4 4.125 4.187 10.95 Exhaust Gas Temperature CO CO2 O2 NO Opacity Heat °C vol.% vol.% vol.% ppm m-1 kW 219 0.01 3.50 16.13 207 0.15 6.80 311 0.01 4.62 14.55 312 0.45 9.25 358 0.01 5.30 13.61 358 0.73 10.42 398 0.04 6.53 11.98 420 1.32 12.47 455 0.07 7.46 9.35 494 2.13 15.18 Fuel Input Fuel Consumption HHV Density SFC A12 Table A3.2 Engine Data for Biodiesel Run Parameters: biodiesel Total Thermal Input Electrical Power Coolant Heat Exhaust Heat Heat Loss Unit kW kW kW kW kW Load 1 16.74 3.74 4.86 7.05 1.08 Load 2 21.24 5.24 6.31 9.40 0.29 Load 3 24.19 6.36 7.03 10.77 0.03 Load 4 30.78 8.64 8.40 13.07 0.67 Load 5 39.24 11.25 10.55 15.87 1.58 ml/s MJ/kg g/ml g/kWh 0.517 39.65 0.893 444.7 0.661 39.65 0.893 405.7 0.753 39.65 0.893 380.9 0.949 39.65 0.893 353.3 1.206 39.65 0.893 344.9 Air Intake Lambda AFRstoi AFR ---- 3.431 13.1 44.9 2.508 13.1 32.9 2.242 13.1 29.4 2.156 13.1 28.2 2.055 13.1 26.9 Electrical Current Voltage Frequency Power A V Hz kW 5.0 430 50 3.74 7.1 428 50 5.24 9.0 410 50 6.36 12.5 398 50 8.64 16.6 390 50 11.25 Coolant Coolant Flow Input Temperature Output Temperature Coolant Δ Temperature Water Density at 40˚C Cp Heat l/s °C °C K (°C) kg/l kJ/kgK kW 0.45 38.9 39.5 0.6 4.125 4.187 4.86 0.45 42.8 43.6 0.8 4.125 4.187 6.31 0.45 44.4 45.3 0.9 4.125 4.187 7.03 0.45 47.2 48.3 1.1 4.125 4.187 8.40 0.45 50.6 52.0 1.4 4.125 4.187 10.55 Exhaust Gas Temperature CO CO2 O2 NO Opacity Heat °C vol.% vol.% vol.% ppm m-1 kW 270 0.02 3.84 15.64 224 0.17 7.05 355 0.02 4.91 14.29 324 0.35 9.40 396 0.03 5.49 13.69 369 0.52 10.77 458 0.05 6.59 12.04 439 1.05 13.07 528 0.06 7.54 9.36 527 1.59 15.87 Fuel Input Fuel Consumption HHV Density SFC A13 Table A3.3 Engine Data for 30%SSPO Run Parameters: 30% SSPO Total Thermal Input Electrical Power Coolant Heat Exhaust Heat Heat Loss Unit kW kW kW kW kW Load 1 17.29 3.68 4.91 6.50 2.21 Load 2 21.50 5.17 6.24 9.26 0.83 Load 3 24.39 6.35 6.97 10.56 0.51 Load 4 30.90 8.67 8.28 12.59 1.36 Load 5 39.23 11.16 10.24 15.34 2.48 ml/s MJ/kg g/ml g/kWh 0.521 39.57 0.914 465.5 0.656 39.57 0.914 417.2 0.758 39.57 0.914 392.4 0.909 39.57 0.914 344.8 1.139 39.57 0.914 335.8 Air Intake Lambda AFRstoi AFR ---- 3.623 12.8 46.4 2.595 12.8 33.2 2.328 12.8 29.8 2.246 12.8 28.7 2.148 12.8 27.5 Electrical Current Voltage Frequency Power A V Hz kW 5.0 425 50 3.68 7.1 421 50 5.17 8.9 410 50 6.35 12.5 399 50 8.67 16.4 392 50 11.16 Coolant Coolant Flow Input Temperature Output Temperature Coolant Δ Temperature Water Density at 40˚C Cp Heat l/s °C °C K (°C) kg/l kJ/kgK kW 0.45 39.7 40.3 0.6 4.125 4.187 4.91 0.45 41.9 42.7 0.8 4.125 4.187 6.24 0.45 42.5 43.4 0.9 4.125 4.187 6.97 0.45 46.2 47.3 1.1 4.125 4.187 8.28 0.45 49.9 51.2 1.3 4.125 4.187 10.24 Exhaust Gas Temperature CO CO2 O2 NO Opacity Heat °C vol.% vol.% vol.% ppm m-1 kW 226 0.01 3.62 15.97 189 0.25 6.50 316 0.01 4.84 14.34 296 0.49 9.26 348 0.01 5.57 13.78 347 0.69 10.56 396 0.02 6.75 11.30 403 1.18 12.59 445 0.03 7.61 8.95 454 1.69 15.34 Fuel Input Fuel Consumption HHV Density SFC A14 Table A3.4 Engine Data for 50%SSPO Run Parameters: 50% SSPO Total Thermal Input Electrical Power Coolant Heat Exhaust Heat Heat Loss Unit kW kW kW kW kW Load 1 17.76 3.67 5.07 6.79 2.23 Load 2 22.91 5.26 6.66 9.80 1.20 Load 3 25.62 6.35 7.20 10.89 1.18 Load 4 32.02 8.59 8.56 13.05 1.82 Load 5 39.93 11.12 10.31 15.62 2.88 ml/s MJ/kg g/ml g/kWh 0.529 39.52 0.925 471.9 0.693 39.52 0.925 439.1 0.783 39.52 0.925 410.8 0.963 39.52 0.925 373.5 1.208 39.52 0.925 365.1 Air Intake Lambda AFRstoi AFR ---- 3.689 12.6 46.5 2.708 12.6 34.1 2.504 12.6 31.5 2.356 12.6 29.7 2.218 12.6 27.9 Electrical Current Voltage Frequency Power A V Hz kW 5.0 426 50 3.67 7.3 417 50 5.26 9.1 405 50 6.35 12.7 390 50 8.59 16.7 385 50 11.12 Coolant Coolant Flow Input Temperature Output Temperature Coolant Δ Temperature Water Density at 40˚C Cp Heat l/s °C °C K (°C) kg/l kJ/kgK kW 0.45 39.3 40.0 0.7 4.125 4.187 5.07 0.45 42.1 43.0 0.9 4.125 4.187 6.66 0.45 43.5 44.4 0.9 4.125 4.187 7.20 0.45 47.1 48.2 1.1 4.125 4.187 8.56 0.45 50.1 51.4 1.3 4.125 4.187 10.31 Exhaust Gas Temperature CO CO2 O2 NO Opacity Heat °C vol.% vol.% vol.% ppm m-1 kW 224 0.02 3.66 15.79 239 0.36 6.79 308 0.03 4.92 14.26 319 0.59 9.80 336 0.03 5.61 13.79 367 0.83 10.89 375 0.04 6.77 12.50 449 1.27 13.05 426 0.05 7.66 10.11 526 1.81 15.62 Fuel Input Fuel Consumption HHV Density SFC A15 Table A3.5 Engine Data for 30% DSPO Run Parameters: 30% DSPO Total Thermal Input Electrical Power Coolant Heat Exhaust Heat Heat Loss Unit kW kW kW kW kW Load 1 17.69 3.76 4.99 6.66 2.27 Load 2 23.00 5.16 6.98 9.43 1.43 Load 3 25.40 6.30 7.83 9.79 1.48 Load 4 30.91 8.09 9.06 11.31 2.46 ml/s MJ/kg g/ml g/kWh 0.499 39.16 0.901 430.6 0.637 39.16 0.901 400.4 0.755 39.16 0.901 396.0 0.856 39.16 0.901 343.3 Air Intake Lambda AFRstoi AFR ---- 4.191 13.4 56.3 3.313 13.4 44.5 2.587 13.4 34.7 2.253 13.4 30.3 Electrical Current Voltage Frequency Power A V Hz kW 5.1 428 50 3.76 7.1 420 50 5.16 9.2 395 50 6.30 11.8 397 50 8.09 Coolant Coolant Flow Input Temperature Output Temperature Coolant Δ Temperature Water Density at 40˚C Cp Heat l/s °C °C K (°C) kg/l kJ/kgK kW 0.45 38.2 38.8 0.6 4.125 4.187 4.99 0.45 40.9 41.8 0.9 4.125 4.187 6.98 0.45 43.2 44.2 1.0 4.125 4.187 7.83 0.45 46.8 48.0 1.2 4.125 4.187 9.06 Exhaust Gas Temperature CO CO2 O2 NO Opacity Heat °C vol.% vol.% vol.% ppm m-1 kW 213 0.02 3.56 16.27 174 -6.66 297 0.01 4.59 15.07 259 -9.43 325 0.02 5.83 14.21 341 -9.79 357 0.02 6.64 12.29 427 -11.31 Fuel Input Fuel Consumption HHV Density SFC A16 APPENDIX 4 ASPEN PROCESS FLOWSHEET AND DESCRIPTIONS Figure A4.1 Process Flowsheet for Wood Pyro-CHP System (100 kg/h) A17 Model description for wood Pyro-CHP system The Pyroformer reactor (PYR-PYR) is simulated using a RStoic reactor. Biomass is decomposed into water vapour, pyrolysis oil components (vapour phase), permanent gases, and char (carbon and ash). Vapour phase and permanent gases pass through a cyclone block (PYR-SEP1) and then a condensation block (PYR-COND), and a followed separation block (PYRSEP2). Vapour is condensed and separated from the permanent gases at PYR-SEP2. Permanent gases are sent to a compression block (PRY-COMP), prior to been supplied into a char combustor (PYR-COMB). The char combustor, simulated using a RGibbs reactor, provides heat to the Pyroformer. Char is separated from the vapour phase at PYR-SEP1, and sent to char separation block (PYRO-SPL), where a portion of char is also supplied to PYR-COMB. Surplus char is collected. Condensed vapour forms pyrolysis liquid at PYR-SEP2. The aqueous phase and organic phase (pyrolysis oil) are separated at a separation block (PYR-SEP3). The aqueous phase is collected and disposed. Pyrolysis oil is collected for CHP engine use. The combustion unit (ENG-COMB) of the CHP engine is simulated using a RSTOIC reactor. Pyrolysis oil and biodiesel are supplied into the combustion unit respectively. The engine compression unit (ENG-COMP) is simulated using a compression block, where air is compressed and supplied into the combustion unit. The engine cooling unit (ENG-COL1) is simulated using a heat exchange block, where excessive engine combustion heat is collected and sent to heat output. The engine work unit together with the electricity generator (ENG-WORK) is simulated using a turbine block, after a pressure-drop and gas-expansion unit (ENG-PRES). Engine work represents the power output. The exhaust gas passes through a heat exchange block (ENG-COL2), where exhaust heating is collected for heat output. The Engine generating efficiency is 95% and the isentropic efficiency is 75%. Yields of the liquid, gas and char are based on the experiment results from a 20 kg/h Pyroformer reactor. A18 Composition of pyrolysis oil, permanent gases and char is based on the experimental results from a 20 kg/h Pyroformer reactor. A19 Figure A4.2 Process Flowsheet for Sewage Sludge Pyro-CHP System (100 kg/h) A20 Model description for SS Pyro-CHP system The dryer (DRYER) is simulated using a RStoic reactor. A heat exchange block (DRY-EXCH) connected to the engine exhaust is used to recycle engine exhaust heat to the dryer. Dried sewage sludge is separated from the moisture at a separation block (DRY-SEP) and sent to the Pyroformer. The Pyroformer reactor (PYR-PYR) is simulated using a RStoic reactor. Dried sewage sludge is decomposed into water, pyrolysis oil components (vapour phase), permanent gases, and char (including ash). Vapour phase and permanent gases pass through a cyclone block (PYR-SEP1) and then a condensation block (PYR-COND), and a followed separation block (PYRSEP2). Vapour is condensed and separated from the permanent gases at PYR-SEP2. Permanent gases are sent to a compression block (PRY-COMP), prior to been supplied into a char combustor (PYR-COMB). The char combustor, simulated using a RGibbs reactor, provides heat to the Pyroformer. Char is separated from the vapour phase at PYR-SEP1, and sent to char separation block (PYRO-SPL), where a portion of char is also supplied to PYR-COMB. Surplus char is collected. Condensed vapour forms pyrolysis liquid at PYR-SEP2. The aqueous phase and organic phase (pyrolysis oil) are separated at a separation block (PYR-SEP3). The aqueous phase is collected and disposed. Pyrolysis oil is collected for CHP engine use. The combustion unit (ENG-COMB) of the CHP engine is simulated using a RSTOIC reactor. Pyrolysis oil and biodiesel are supplied into the combustion unit respectively. The engine compression unit (ENG-COMP) is simulated using a compression block, where air is compressed and supplied into the combustion unit. The engine cooling unit (ENG-COL1) is simulated using a heat exchange block, where excessive engine combustion heat is collected and sent to heat output. The engine work unit together with the electricity generator (ENG-WORK) is simulated using a turbine block, after a pressure-drop and gas-expansion unit (ENG-PRES). Engine work represents the power output. A21 The exhaust gas passes through a heat exchange block (ENG-COL2), where exhaust heating is redirected to DRY-EXCH. The Engine generating efficiency is 95% and the isentropic efficiency is 75%. Yields of the liquid, gas and char are based on the experiment results from a 20 kg/h Pyroformer reactor. Composition of pyrolysis oil, permanent gases and char are based on the experimental results from a 20 kg/h Pyroformer reactor. A22 APPENDIX 5 SYSTEM PRODUCTIVITY AND PRODUCT SALES Table A5.1 System Productivity and Product Sales for 200 kg/h Wood Plant Pyroformer kg/h 1*100 Plant 100.00 1*200 Plant 200.00 2*200 Plant 400.00 3*200 Plant 600.00 4*200 Plant 800.00 5*200 Plant 1,000.00 Electricity kW 118.00 232.40 500.60 790.20 1,058.40 1,326.00 Heat kW 156.00 274.10 524.40 715.20 953.50 1,177.00 Char kg/h 22.8 45.6 91.2 136.8 182.4 228.0 Total Capital Cost £ 4,608,781 6,563,555 12,367,652 18,103,199 23,510,765 29,397,870 Cost of Capital £/yr 736,306 1,048,603 1,975,874 2,892,194 3,756,114 4,696,647 Operating Cost £/yr 1,097,211 1,452,487 2,248,294 3,041,016 3,945,224 4,736,366 Maintenance £/yr 115,220 164,089 309,191 452,580 587,769 734,947 Overhead £/yr 92,176 131,271 247,353 362,064 470,215 587,957 Disposals £/yr 6,652 7,343 8,727 10,110 11,493 12,877 Consumable-feed £/yr 140,000 280,000 560,000 840,000 1,086,400 1,358,000 Consumable-BD £/yr 126,620 253,239 506,478 759,717 1,012,956 1,266,195 Labour £/yr 616,545 616,545 616,545 616,545 776,390 776,390 kWh/yr 759,920 1,496,656 3,223,864 5,088,888 6,816,096 8,539,440 Unit Price (Grid) £/kWh 0.14154 0.14154 0.14154 0.14154 0.14154 0.14154 Sales £/yr 107,559 211,837 456,306 720,281 964,750 1,208,672 Unit Price (Indut.) £/kWh 0.18494 0.18494 0.18494 0.18494 0.18494 0.18494 Sales £/yr 140,540 276,792 596,221 941,139 1,260,569 1,579,284 Products Electricity Production Heat Production kWh/yr 1,092,000 1,918,700 3,670,800 5,006,400 6,674,500 8,239,000 Unit Price £/kWh 0.0478 0.0478 0.0478 0.0478 0.0478 0.0478 Sales £/yr 52,198 91,714 175,464 239,306 319,041 393,824 Production kg/yr 159,600 319,200 638,400 957,600 1,276,800 1,596,000 Production Unit Price (Charcoal) Sales Unit Price (Biochar) Sales kWh/yr 1,334,433 2,668,867 5,337,733 8,006,600 10,675,467 13,344,333 £/kg 0.7 0.7 0.7 0.7 0.7 0.7 £/yr 111,720 223,440 446,880 670,320 893,760 1,117,200 2.45 2.45 2.45 2.45 2.45 2.45 391,020 782,040 1,564,080 2,346,120 3,128,160 3,910,200 Char £/kWh £/yr Energy Prod. Cost Electricity £/kWh 0.575 0.411 0.345 0.328 0.319 0.313 Heat £/kWh 0.575 0.411 0.345 0.328 0.319 0.313 A23 Char £/kg 4.811 3.437 2.887 2.741 2.665 2.618 Product Sales Scenario 1 (Pess) £/yr 271,477 526,991 1,078,650 1,629,907 2,177,551 2,719,697 Scenario 2 304,457 591,945 1,218,566 1,850,765 2,473,370 3,090,308 Scenario 3 550,777 1,085,591 2,195,850 3,305,707 4,411,951 5,512,697 Scenario 4 (Opt) 583,757 1,150,545 2,335,766 3,526,565 4,707,770 5,883,308 A24 Table A5.2 System Productivity and Product Sales for 300 kg/h Wood Plant Pyroformer kg/h 1*200 Plant 200.0 1*300 Plant 300.0 2*300 Plant 600.0 3*300 Plant 900.0 4*300 Plant 1200.0 5*300 Plant 1500.0 Electricity kW 232.4 371.0 790.2 1193.4 1601.9 2011.4 Heat kW 274.1 400.5 715.2 1059.3 1412.4 1743.2 Char kg/h 45.6 68.4 136.8 205.2 273.6 342.0 Total Capital Cost £ 6,563,555 8,072,998 15,267,925 22,284,902 29,244,636 36,127,719 Cost of Capital £/yr 1,048,603 1,289,754 2,439,226 3,560,269 4,672,166 5,771,817 Operating Cost £/yr 1,452,487 1,787,723 3,073,274 4,153,171 5,278,528 6,314,600 Maintenance £/yr 164,089 201,825 381,698 557,123 731,116 903,193 Overhead £/yr 131,271 161,460 305,358 445,698 584,893 722,554 Disposals £/yr 7,343 8,035 10,110 12,185 14,260 16,335 Consumable-feed £/yr 280,000 420,000 840,000 1,222,200 1,629,600 1,974,000 Consumable-BD £/yr 253,239 379,859 759,717 1,139,576 1,519,434 1,899,293 Labour £/yr 616,545 616,545 776,390 776,390 799,225 799,225 1,496,656 2,389,240 5,088,888 7,685,496 10,316,236 12,953,416 Products Electricity Production kWh/yr Unit Price (Grid) £/kWh 0.14154 0.14154 0.14154 0.14154 0.14154 0.14154 Sales £/yr 211,837 338,173 720,281 1,087,805 1,460,160 1,833,427 Unit Price (Indut.) £/kWh 0.18494 0.18494 0.18494 0.18494 0.18494 0.18494 Sales £/yr 276,792 441,866 941,139 1,421,356 1,907,885 2,395,605 1,918,700 2,803,500 5,006,400 7,415,100 9,886,800 12,202,400 Heat Production kWh/yr Unit Price £/kWh 0.0478 0.0478 0.0478 0.0478 0.0478 0.0478 Sales £/yr 91,714 134,007 239,306 354,442 472,589 583,275 Char Production kg/yr Production Unit Price (Charcoal) Sales Unit Price (Biochar) Sales kWh/yr 319,200 478,800 957,600 1,436,400 1,915,200 2,394,000 2,668,867 4,003,300 8,006,600 12,009,900 16,013,200 20,016,500 £/kg 0.7 0.7 0.7 0.7 0.7 0.7 £/yr 223,440 335,160 670,320 1,005,480 1,340,640 1,675,800 2.45 2.45 2.45 2.45 2.45 2.45 782,040 1,173,060 2,346,120 3,519,180 4,692,240 5,865,300 £/kWh £/yr Energy Prod. Cost Electricity £/kWh 0.411 0.335 0.305 0.285 0.275 0.268 Heat £/kWh 0.411 0.335 0.305 0.285 0.275 0.268 Char £/kg 3.437 2.798 2.546 2.379 2.297 2.237 A25 Product Sales Scenario 1 (Pess) £/yr 526,991 807,340 1,629,907 2,447,727 3,273,389 4,092,501 Scenario 2 £/yr 591,945 911,033 1,850,765 2,781,277 3,721,114 4,654,679 Scenario 3 £/yr 1,085,591 1,645,240 3,305,707 4,961,427 6,624,989 8,282,001 Scenario 4 (Opt) £/yr 1,150,545 1,748,933 3,526,565 5,294,977 7,072,714 8,844,179 A26 Table A5.3 System Productivity and Product Sales for 200 kg/h Sewage Sludge Plant 1*100 Plant 1*200 Plant 2*200 Plant 3*200 Plant 4*200 Plant 5*200 Plant Pyroformer Electricity Heat Surplus char kg/h kW kW kg/h 100.0 78.0 67.0 31.9 200.0 171.3 101.5 63.8 400.0 369.0 193.3 127.6 600.0 566.7 276.0 191.4 800.0 711.6 355.8 255.2 1,000.0 970.8 439.3 319.0 Total Capital Cost Cost of Capital £ £/yr 5,027,441 803,191 7,170,186 1,145,520 13,515,391 2,159,239 19,175,906 3,063,571 24,929,338 3,982,748 30,761,161 4,914,448 Operating Cost Maintenance Overhead Disposals Consumables-BD Labour £/yr £/yr £/yr £/yr £/yr £/yr 661,534 125,686 100,549 0 79,239 356,060 837,197 179,255 143,404 0 158,479 356,060 1,281,210 337,885 270,308 0 316,957 356,060 1,819,033 479,398 383,518 0 475,436 480,681 2,236,416 623,233 498,587 0 633,914 480,681 2,657,326 769,029 615,223 0 792,393 480,681 Products Sales Electricity Production Unit Cost (ROC) Total kWh/yr £/kWh £/yr 502,320 0.08654 43,471 1,103,172 0.08654 95,469 2,376,360 0.08654 205,650 3,649,548 0.08654 315,832 4,582,704 0.08654 396,587 6,251,952 0.08654 541,044 Heat Production Unit Price Sales kWh/yr £/kWh £/yr 469,000 0.0634 29,735 710,500 0.0634 45,046 1,353,100 0.0478 64,678 1,932,000 0.0478 92,350 2,490,600 0.0478 119,051 3,075,100 0.0478 146,990 kg/yr kWh/yr 223,300 694,711 446,600 1,389,422 893,200 2,778,844 1,339,800 4,168,267 1,786,400 5,557,689 2,233,000 6,947,111 £/kg 0.14 0.14 0.14 0.14 0.14 0.14 £/yr 31,262 62,524 125,048 187,572 250,096 312,620 £/kg 0.49 0.49 0.49 0.49 0.49 0.49 £/yr 109,417 218,834 437,668 656,502 875,336 1,094,170 £/kg 0.42 0.42 0.42 0.42 0.42 0.42 £/yr 93,786 187,572 375,144 562,716 750,288 937,860 £/kg 1.47 1.47 1.47 1.47 1.47 1.47 £/yr 328,251 656,502 1,313,004 1,969,506 2,626,008 3,282,510 kWh/yr 502,320 1,103,172 2,376,360 3,649,548 4,582,704 6,251,952 Char Production Production Unit Price (Charcoal, Lower) Sales Unit Price (Biochar, Lower) Sales Unit Price (Charcoal, Upper) Sales Unit Price (Biochar, Upper) Sales Expense Saved Electricity Production (Cost) A27 Unit Cost Total £/kWh £/yr 0.0984 49,428 0.0984 108,552 0.0984 233,834 0.0984 359,116 0.0984 450,938 0.0984 615,192 Sludge Disposal kg/h £/kg £/yr £/kWh £/kg 180 0.008 10,080 -0.006 -0.019 360 0.008 20,160 -0.006 -0.020 720 0.008 40,320 -0.006 -0.019 1080 0.008 60,480 -0.006 -0.019 1440 0.008 80,640 -0.006 -0.020 1800 0.008 100,800 -0.006 -0.019 Energy Prod Cost Electricity Heat Char £/kWh £/kWh £/kWh £/kg 0.879 0.879 0.879 2.735 0.619 0.619 0.619 1.926 0.529 0.529 0.529 1.645 0.501 0.501 0.501 1.558 0.492 0.492 0.492 1.532 0.465 0.465 0.465 1.447 PRODUCT SALES Scenario 1 Scenario 2 Scenario 3 Scenario 4 £/yr £/yr £/yr £/yr £/yr 104,467 182,622 166,991 401,456 203,038 359,348 328,086 797,016 395,376 707,996 645,472 1,583,332 595,753 1,064,683 970,897 2,377,687 765,734 1,390,974 1,265,926 3,141,646 1,000,654 1,782,204 1,625,894 3,970,544 COSTS SAVED £/yr 59,508 128,712 274,154 419,596 531,578 715,992 TOTAL SALES Scenario 1 Scenario 2 Scenario 3 Scenario 4 £/yr £/yr £/yr £/yr 163,976 242,131 226,500 460,965 331,750 488,060 456,798 925,728 669,530 982,150 919,626 1,857,486 1,015,349 1,484,279 1,390,493 2,797,283 1,297,312 1,922,552 1,797,504 3,673,224 1,716,646 2,498,196 2,341,886 4,686,536 A28 Table A5.4 System Productivity and Product Sales for 300 kg/h Sewage Sludge Plant 1*200 Plant 1*300 Plant 2*300 Plant 3*300 Plant 4*300 Plant 5*300 Plant Pyroformer kg/h 200.0 300.0 600.0 900.0 1,200.0 1,500.0 Electricity kW 171.3 273.5 566.7 869.8 1,170.2 1,469.4 Heat kW 101.5 147.6 276.7 397.3 524.5 650.7 Surplus char kg/h 63.8 95.7 191.4 287.1 382.8 478.5 Total Capital Cost £ 7,170,186 8,835,747 16,340,631 23,619,135 30,800,317 37,886,111 Cost of Capital £/yr 1,145,520 1,411,612 2,610,603 3,773,428 4,920,704 6,052,741 Operating Cost £/yr 837,197 991,387 1,691,445 2,256,696 2,835,370 3,498,766 Maintenance £/yr 179,255 220,894 408,516 590,478 770,008 947,153 Overhead £/yr 143,404 176,715 326,813 472,383 616,006 757,722 Disposals £/yr 0 0 0 0 0 0 Consumables-BD £/yr 158,479 237,718 475,436 713,154 950,872 1,188,590 Labour £/yr 356,060 356,060 480,681 480,681 498,484 605,302 1,103,172 1,761,340 3,649,548 5,601,512 7,536,088 9,462,936 0.08654 0.08654 0.08654 0.08654 0.08654 0.08654 95,469 152,426 315,832 484,755 652,173 818,922 Products Sales Electricity Production kWh/yr Unit Cost (ROC) £/kWh Total £/yr Heat Production kWh/yr 710,500 1,033,200 1,936,900 2,781,100 3,671,500 4,554,900 Unit Price £/kWh 0.0634 0.0478 0.0478 0.0478 0.0478 0.0478 Sales £/yr 45,046 49,387 92,584 132,937 175,498 217,724 Production kg/yr 446,600 669,900 1,339,800 2,009,700 2,679,600 3,349,500 Production Unit Price (Charcoal, Lower) Sales Unit Price (Biochar, Lower) Sales Unit Price (Charcoal, Upper) Sales Unit Price (Biochar, Upper) Sales kWh/yr 1,389,422 2,084,133 4,168,267 6,252,400 8,336,533 10,420,667 £/kg 0.14 0.14 0.14 0.14 0.14 0.14 £/yr 62,524 93,786 187,572 281,358 375,144 468,930 £/kg 0.49 0.49 0.49 0.49 0.49 0.49 £/yr 218,834 328,251 656,502 984,753 1,313,004 1,641,255 £/kg 0.42 0.42 0.42 0.42 0.42 0.42 £/yr 187,572 281,358 562,716 844,074 1,125,432 1,406,790 £/kg 1.47 1.47 1.47 1.47 1.47 1.47 Char £/yr 656,502 984,753 1,969,506 2,954,259 3,939,012 4,923,765 Char A29 Expense Saved Electricity Production (Cost) kWh/yr Unit Cost £/kWh 0.0984 0.0984 0.0984 0.0984 0.0984 0.0984 Total £/yr 108,552 173,316 359,116 551,189 741,551 931,153 Sludge Disposal kg/h 360 540 1080 1620 2160 2700 £/kg 0.008 0.008 0.008 0.008 0.008 0.008 £/yr 20,160 30,240 60,480 90,720 120,960 151,200 £/kWh -0.006 -0.006 -0.006 -0.006 -0.006 -0.006 £/kg -0.020 -0.019 -0.019 -0.019 -0.019 -0.019 Sales 1,103,172 1,761,340 3,649,548 5,601,512 7,536,088 9,462,936 Energy Prod Cost Electricity £/kWh 0.619 0.493 0.441 0.412 0.397 0.391 £/kWh 0.619 0.493 0.441 0.412 0.397 0.391 Heat £/kWh 0.619 0.493 0.441 0.412 0.397 0.391 Char £/kg 1.926 1.532 1.372 1.282 1.235 1.216 PRODUCT SALES Scenario 1 £/yr £/yr 203,038 295,599 595,988 899,049 1,202,815 1,505,577 Scenario 2 £/yr 359,348 530,064 1,064,918 1,602,444 2,140,675 2,677,902 Scenario 3 £/yr 328,086 483,171 971,132 1,461,765 1,953,103 2,443,437 Scenario 4 £/yr 797,016 1,186,566 2,377,922 3,571,950 4,766,683 5,960,412 £/yr 128,712 203,556 419,596 641,909 862,511 1,082,353 Scenario 1 £/yr 331,750 499,155 1,015,583 1,540,958 2,065,326 2,587,930 Scenario 2 £/yr 488,060 733,620 1,484,513 2,244,353 3,003,186 3,760,255 Scenario 3 £/yr 456,798 686,727 1,390,727 2,103,674 2,815,614 3,525,790 Scenario 4 £/yr 925,728 1,390,122 2,797,517 4,213,859 5,629,194 7,042,765 £/yr EXPENSE SAVED TOTAL SALES A30


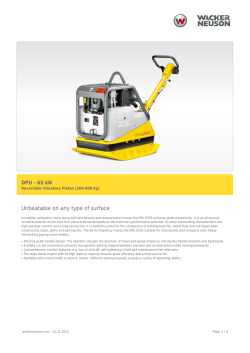


© Copyright 2026