
- USQ ePrints - University of Southern Queensland
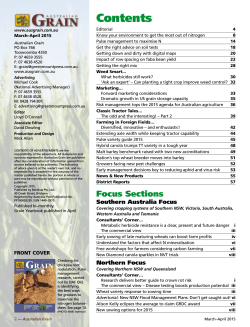
Proceedings of the Australasian Conference on Business and Social Sciences 2015, Sydney
(in partnership with The Journal of Developing Areas)
ISBN 978-0-9925622-1-2
ESTIMATING THE RELATIONSHIP BETWEEN GRAIN CROP
CONSUMPTION IN AUSTRALIA AND ENVIRONMENTAL
SUSTAINABILITY
Gazi A. Uddin*
University of Southern Queensland, Australia
Khorshed Alam
University of Southern Queensland, Australia
Jeff Gow
University of Southern Queensland, Australia & Stellenbosch University, South Africa
ABSTRACT
The ecological footprint methodology permits the monitoring of dominant threats to sustainability. One of the
benefits of ecological footprint methodology is its capacity to distinguish between resources consumed and
resources available and then reveal how ecologically sustainable those consumption patterns are. The main aim of
this paper is to determine the size of the ecological footprint of grains consumption in Australia in order to evaluate
the level of environmental sustainability. The paper uses both local and global yield data with inter-temporal timeseries yield factors instead of only global yield. This paper also uses production and consumption data on various
grain crops. Results indicate that the ecological footprint of grain consumption in Australia only exceeds biocapacity
when the energy requirements of these crops are included in the evaluation. The size of the revealed ecological
footprint are responsible for the amount of grain consumption, energy inputs, the size of the population, the degree
of carbon dioxide equivalent (CO2-e) gas emissions, and the amount of other farm inputs. This paper highlights the
environmental significance of the ecological footprint of grain crops consumption in Australia. This paper also
reinforces how intensely a sustainable future depends on the reshaping of the Australian grain industry.
JEL Classification: Q15, Q51, Q58
Keywords: Biocapacity, Ecological Footprint, Equivalence Factor, Population, Yield Factors.
Corresponding Author`s Email Address: [email protected]
INTRODUCTION
In recent decades, the majority of the world’s nations have experienced rapid economic growth on the one hand and
unusual consumption patterns and loss of natural resources on the other. Therefore, the global ecological stock has
increasingly worsened following the imbalance between ecological demand and supply. Ecological Footprint
Analysis (EFA), since its inception in 1996, has been applied to measure the imbalance between ecological demand
and supply, both at micro and macro levels (Wackernagel and Rees 1996).
This method has also been extensively accepted as a sustainability indicator for a given population (Borsa
and Marchettini 2008; Lenzen and Murray 2003; Niccolucci et al. 2008; Wackernagel et al. 2004). It measures the
amount of natural resources needed to satisfy the consumption requirements and waste assimilation needs of an
individual, a city, a nation, a country or the entire human world in a given year (Wackernagel et al. 2002; Wood and
Garnett 2009). The consumption requirements of these populations is then converted into the amount of productive
area, expressed in terms of hectares per capita at world-average productivity (Wackernagel and Rees 1996). Thus,
EFA has provided a policy guide and planning tool for sustainability by comparing ecological footprint to the
available land, usually referred to as biocapacity (BC).
There have been many instances where the ecological footprint model has been applied to identify the level
of environmental impact and to measure sustainability. For example, VicUrban (2007) found the local resident
ecological footprint of Aurora and showed that the ecological footprint of Aurora’s residents is 7.03 global hectares1
(gha), which is much lower than that of the average Victorian. The Environmental Protection Authority (2008)
assessed the state-level ecological footprint of Victorian consumption, which is unsustainable and its ecological
footprint is more than three times higher than the world average. Lenzen and Murray (2003) revealed the countrylevel ecological footprint and mentioned that the per capita ecological footprint of Australians is considerably larger
than results obtained in previous studies. Wood and Garnett (2009) assessed regional sustainability and showed that
1140
Proceedings of the Australasian Conference on Business and Social Sciences 2015, Sydney
(in partnership with The Journal of Developing Areas)
ISBN 978-0-9925622-1-2
the higher-density urban populations have larger ecological footprints than rural and remote populations in the
Northern Territory.
In recent years, some researchers have paid much attention to ecological footprint as the tool for calculating
the agricultural land requirement for crops consumption (Dong et al. 2010; Khan et al. 2009; Kissinger, Fix and
Rees 2007). Dong et al. (2010) found that food consumption patterns have a large effect on total land requirements,
and they also showed that grain consumption has a strong correlation with ecological footprint. Kissinger and
Gottlieb (2012) found a positive relationship between the size of the grain ecological footprint and consumption in
Greece. Food that is consumed above a person’s requirements represents avoidable greenhouse gas (GHG)
emissions and use of natural resources (Friel et al. 2013).
Nevertheless, most ecological footprint studies are not yet attentive to, and do not account for the
appropriate crop consumption for a defined population on which the footprint falls. In addition, these studies
calculated ecological footprint using only global yield factors instead of local yields, so that their findings would not
be consistent for regional settings and regional policy decisions. Also, the majority of studies have used either the
compound approach2 or component-based approach3 for calculating ecological footprint. But for the calculation of
the ecological footprint of any product or crops, the most effective method is a hybrid of these two approaches
(Wackernagel et al. 2002); although it is not popular in crops consumption research in Australia. Another
shortcoming that occurred in many case studies was that no time series ecological data were used. Many studies
have assessed the ecological footprint of countries, nations, cities and even a region or product, but no local study
has to date determined the ecological footprint of grain crops consumption in Australia. So this study accommodates
for the shortcomings mentioned above in its methodology and calculates the ecological footprint of grain crops
consumption in Australia.
This study therefore aims to incorporate this progressive and dynamic body of literature to enhance its
potential contribution as an indicator of grain crops consumption and its sustainability. The case study here is
Australia’s grain crops consumption from 1995 to 2010. The study begins with an analysis of the ecological
footprint of grain crops consumption, then analyses the biocapacity. The study concludes by making a comparison
between ecological footprint and biocapacity and then assessing its sustainability through some potential
implications for policy making.
BACKGROUND
Australia has a total land area of 7.7 million km2, however, less than 6per cent of this land area has soil conditions
suitable for annual crops (Harvey and Perrett 2011). Approximately half of this suitable land area is planted annually
for commercial grain crop production. Grains either refined or whole, are a basic staple food of most people, so they
are treated as major tradable crops in the world. Australia is a relatively small producer of grains on a global scale,
however, due to its low level consumption, it accounts for a significant portion of global trade (PwC 2011). A
summary of grain crops production and consumption in Australia from 1995 to 2010 is shown in Table 1.
Wheat is Australia’s main grain crop and came to Australia with the European settlement in 1788 (GRDC
2010). Australia produces around 3per cent of the world’s wheat but accounts for 10–15 per cent of the world’s
annual global wheat trade. Despite the economic benefits of wheat production, the environmental cost is
considerably high in Australia. Emission statistics for wheat production varies between researchers. Bradbear and
Sharon (2011) reported that the equivalent of 304 kg of carbon dioxide (CO2) was emitted during the production and
delivery to port of 1 tonne of wheat, whereas Muir (2013) mentioned this statistics is 205 kg per tonne and Biswas et
al. (2010) reported 400 kg of CO2 per tonne. So this study considered the average emission as 354 kg per tonne
based on these statistics to convert tonnes into CO2e. Barley is the second-biggest field grain crop produced in
Australia. The rate of emissions in the atmosphere from 1 tonne of barley production also accounts for 244 kg of
CO2e emissions.
Pulses are annual crops that are used for human and animal food. Muir (2013) calculated 153 kg CO2e
emissions for 1 tonne of chickpeas. Oilseeds are used for the production of oils and livestock feed. Cottonseed and
canola constitute around 90 per cent of Australian oilseed production. Leng (2012) calculated 1 tonne of cottonseed
yields approximately 200 kg of oil, 500 kg of cottonseed meal and 300 kg of hulls, and altogether requires 20GJ of
energy. On the other hand, Collison et al. (2012) calculated 1 tonne of rapeseed/canola produces 539 kg CO2e
emissions.
1141
Proceedings of the Australasian Conference on Business and Social Sciences 2015, Sydney
(in partnership with The Journal of Developing Areas)
ISBN 978-0-9925622-1-2
Sorghum is a summer crop. It has traditionally been used for human consumption and livestock feed.
Increasing amounts of sorghum are being used for ethanol production. Australia produces just over 2.5 per cent of
global sorghum, but accounts for over 5 per cent of global exports. Oats are a crop that has a number of different
uses. The primary use for oats is livestock feed in the form of grazing, seed or hay. Its seeds are used for the
production of animal feed, and alternatively, it is consumed by humans. Rice is a summer crop and a staple for a
significant percentage of the world’s population. Rice is both an important sequester of CO2 from the atmosphere
and a significant source of GHG emissions. Maraseni et al. (2009) found 1 kg of rice yield generates emissions of
0.18 kg CO2e.
From the primary production process to end use, all of the grain crops have an impact on the environment.
The whole food system – which involves agricultural production, food processing and packaging, distribution and
retail as well as consumption – requires inputs such as land, water, fertiliser, pesticides, herbicides and energy,
which are responsible for environmental degradation (Friel, Barosh & Lawrence 2013). Australia has the seventhlargest per capita ecological footprint of 6.68 global hectares (gha) (Radio 2012). It has moved one place from
eighth since 2010. In terms of impact on the world’s natural resources, Australia is now sitting behind Qatar, Kuwait
and the United Arab Emirates. Agriculture accounts for 16 per cent of Australia’s GHG emissions. Of that, 17.4 per
cent comes from the land use changes through cropping, pastures and soil preparation (DCCEE 2010). While there
is considerable evidence on the effects of agricultural consumption on the environment in the literature (Bradbear
and Sharon 2011; Edmonds 2004; Friel et al. 2013), no studies have been carried out on grain crop consumption and
its impact on the environment in Australia.
TABLE 1: GRAIN CROPS PRODUCTION AND CONSUMPTION IN AUSTRALIA FROM 1995 TO 2010
Australian Crop Statistics (kilo tonne)
1996
1997
1998
1999
2000
2001
2002
2003
2004
2005
2006
2007
2008
2009
2010
Wheat
16504
23702
19224
22108
24757
22108
24299
10132
26132
21905
25173
10822
13569
21420
21834
27410
Coarse Grain
10819
11891
11960
11176
10544
12257
14497
8753
15439
12588
14617
8519
10798
13715
12767
11204
Pulses
2561
2514
2308
2450
2937
2113
2643
1277
2298
1601
2538
990
1517
1676
1754
1911
Oilseeds
1620
1827
2596
3514
4575
3897
3881
2824
2750
2570
3179
2214
1983
2312
2883
2980
Other grains
64
50
50
51
63
77
75
75
54
64
45
55
56
72
72
70
Total
Production
31568
39984
36138
39299
42876
40452
45395
23061
46673
38728
45552
22600
27923
39195
39310
43575
Wheat
8686
9134
3882
6878
8218
4284
8757
986
16629
3454
11259
2164
6813
6424
6838
11522
Coarse Grain
8619
10627
8086
7295
6083
9104
12114
6486
13156
5576
10487
4875
8906
10360
9412
6989
Pulses
2341
1902
1752
1981
2361
1345
1688
865
1896
1137
2106
580
1027
1043
1105
952
Oilseeds
1493
1338
1945
2470
2542
1639
1787
701
2034
1192
2089
1634
1744
989
1558
1761
51
30
44
40
43
47
59
63
64
59
41
52
55
64
63
62
21190
23032
15710
18664
19246
16518
24406
9102
33778
11417
25982
9306
18545
18880
18976
21286
Other grains
Total
Consumption
Consumption
1995
Production
Grain Crops
Notes: Coarse grains include: Barley, Oats, Triticale, Sorghum, Maize/Corn and Rice; Pulses include: Lupins, Field peas, Chick
peas, Faba/Broad beans, Lentils, Vetches for seed; Oilseeds include: Cottonseed, Linseed, Canola/Rapeseed, Sunflowers,
Peanuts, Safflower and Soybean. Data sources: ABRES 2012, Australian Bureau of Agricultural Resources Economics and
Sciences, Canberra, February, No 161, PP-1-23 and authors compilation.
1142
Proceedings of the Australasian Conference on Business and Social Sciences 2015, Sydney
(in partnership with The Journal of Developing Areas)
ISBN 978-0-9925622-1-2
METHODS
Crops Land Footprint
Unlike conventional methods in which only global averages are used and then multiplied by an equivalence factor4
(EQF), this study used both local and global averages to find the ecological footprint of the grain crops. In addition
to the equivalence factor of the existing method, this study also used the inter-temporal yield factor (IYF)5, currently
employed in the National Footprint Accounts (Kitzes et al. 2008). While yield factors (YFs)6 compare the
productivity of a given land use type, IYFs account for changes in the world-average productivity over time (Brock
et al. 2012). A refined ecological footprint method for the assessment of the crop land footprint is displayed below:
∑ {(
)
(
)
(
)}
Where
denotes the hypothetical land area required for a studied grain crop (c) in a certain year (n). P
indicates production (local or domestic) of the grain in tonnes (t). IM and EX refer to the amount of import and
export respectively. The variables Y represent average yield (local and global). IYF is an inter-temporal yield factor,
whereas EQF refers to an equivalence or conversion factor. Yields were assessed in tonnes per hectare (t/ha) and
year. The total ecological footprint of grain crops in Australia is represented in gha, while ecological footprint per
capita is measured by dividing the total Australia’s population.
Energy land footprint
There are two kinds of land associated with the production of grain – crops land and energy land. Energy land/forest
is defined as the area to sequester (or remove) CO2 produced in the mechanical operations associated with crop
production, planting, harvesting, transporting and processing (Plymouth 2000). Therefore, the energy embodied
during the lifecycle of the studied commodity was converted to CO 2 emissions and then translated into area
demanded using the carbon sequestration factor and the ratio of carbon to CO2 (Kissinger and Gottlieb 2010). So
both the carbon sequestration factor and conversion factor are needed to calculate the ecological footprint of energy
land for grain crops. The simplified equation for the assessment of the energy land footprint and the forest land
required to support grain production is displayed below (Eq. 2):
∑{(
)
(
)
(
)}
Where
denotes the hypothetical energy land area required for a studied grain crop (c) in a certain
year (n). DP indicates domestic production of the grain in tonnes (t). IM and EX refer to the amount of imports and
exports respectively. The variable CSF represents the carbon sequestration factor which needs to be divided by the
carbon to carbon dioxide ratio to achieve the yield factor. IYF is the inter-temporal yield factor whereas EQF refers
to the conversion factor. c=n denotes the number of grain crops accounted for in the calculation and produced in
Australia.
A moderate amount of the literature (see Table 2) revealed the amount of energy needed for the lifecycle of
the studied commodity and converted the energy into CO2e7. For example, Bradbear and Sharon (2011) showed 1
tonne of wheat creates 304 kg CO2e in the atmosphere during the production process. Now we need the YF to
convert this emission amount into carbon intake area. GFN represents the annual carbon uptake of 1 hectare of
world-average forest. It was calculated by the carbon sequestration rate (0.97) divided by the ratio of carbon to
carbon dioxide (0.27). So the YF will be 0.97/0.27 or 3.59 i.e. 1 hectare of world-average forest can absorb 3.59
tonnes of CO2e from the atmosphere annually.
By multiplying the tonnes of CO2 produced by the amount absorbed by each hectare, we find that it would
take (304/1000)/3.59=1.09 hectares of forest to absorb 1 tonne of CO2 produced during wheat production. However,
this 1.09 hectares refers to the required forest area. To create an ecological footprint, the figure needs to be presented
in gha using the conversion factor given by GFN. Using the conversion factor (hectare to global hectare), we find
that 1 hectare of forest is equal to 1.26 gha or world-average productivity.
1143
Proceedings of the Australasian Conference on Business and Social Sciences 2015, Sydney
(in partnership with The Journal of Developing Areas)
ISBN 978-0-9925622-1-2
To find the gha value of 1 tonne of wheat production, we need to multiply the hectares of forest needed
(0.109) by the conversion factor of 1.26 gha. i.e. 1.09 × 1.26 = 1.37 gha. Finally, the inter-temporal yield factor is
used to establish the final results. Now the value of IYF is 1. So the ecological footprint of wheat consumption in
2010 in Australia is 11522186 × 1.37 × 1 = 15785394 gha, and the per capita ecological footprint of wheat is 0.73
gha.
TABLE 2: CO2 EMISSIONS RATE
Study
Collison, Hillier and Davies (2012)
Muir (2013)
Bradbear and Sharon (2011)
Brock et al. (2012)
Leng (2012)
Biswas et al. (2010)
Maraseni, Mushtaq and Maroulis
(2009)
Crop Type
Wheat
Barley
Rapeseed
Wheat
Canola
Chickpea
Wheat
Wheat
Wheat
Cottonseed
Wheat
Corn
Peas
Rice
Grain and CO2e relation
Emission rate (kg CO2e/tonne)
361 kg CO2e/tonne
244 kg CO2e/tonne
539 kg CO2e/tonne
205 kg CO2e/tonne
179 kg CO2e/tonne
153 kg CO2e/tonne
304 kg CO2e/tonne
200 kg CO2e/tonne, on 3.5 t/ha grain yield
150 kg CO2e/tonne, on 5.0 t/ha grain yield
20 GJ energy per tonne
400 kg CO2e/tonne
1.38 tonnes CO2e /tonne
2.54 tonnes CO2e /tonne
180 CO2e /tonne
Crop land biocapacity
Biocapacity reflects the ability of local available land resources. The biocapacity of grain crops for time series data
is calculated as follows:
∑
Where, for any grain crop c, in a given year n, A represents the bioproductive land area available at the
country level, and YF, IYF and EQF are the country-specific yield factor, the world-average inter-temporal yield
factor, and the equivalence factor for grain crops respectively. BC reveals whether existing natural capital is
sufficient to support the current consumption and production pattern (Wackernagel et al. 2004). The EQF represents
the productivity-based scaling factor that converts a specific land type (such as cropland or forest) into a universal
unit of biologically productive area. Whereas the YF refers to the productivity coefficient for different land types in
proportion to the world average. This is specific for each country and each year.
Considering the equations 1, 2 and 3, this analysis involves the following steps: a) documentation of the
overall grain produced; b) identification of the amount of grains exported and imported each year; c) calculation of
the overall grain consumed using the equation production + imports - exports; d) quantification of hypothetical
productive land, known as ecological demand of crops land, using yield, EQF and IYF; e) analysis of the results
using both local and global average yield separately, as a whole and on a per capita basis; f) documenting actual
crops harvested land area in each year; g) weighting of the actual harvested land area using a world standard
conversion factor to establish the ecological supply of crops land; and finally h) comparing the results of steps d and
g through calculation of ecological deficit or ecological remainder.
This study then assesses the sustainability of the grain crops by subtracting ecological supply or
biocapacity (BC), i.e. regeneration of natural resources, from ecological demand (EF), i.e. consumption of natural
resources. When
exceeds BC, an ecological deficit occurs and it represents the resources demand cannot be
achieved locally. When
exceeds BC, ecological overshoot occurs and it represents the rate of resources
exploitation has exceeded its maximum carrying capacity and the local ecosystem is depleting.
1144
Proceedings of the Australasian Conference on Business and Social Sciences 2015, Sydney
(in partnership with The Journal of Developing Areas)
ISBN 978-0-9925622-1-2
DATA SOURCES
The calculation of grain crops’ ecological footprint requires a large amount of information about land use,
production, consumption, exports, imports, agricultural productivity, GHG emissions and socio-economic data.
Australian grain crops-related data are sourced from the Global Footprint Network (2012), the Australian Bureau of
Statistics (ABS 2013), the Australian Crop Report 2012 and 2014 of the Australian Bureau of Agricultural and
Resource Economics and Sciences (ABARES 2014), and the Grain Research and Development Corporation (GRDC
2012). Per tonne grain production CO2e emissions (kg CO2e/tonne) data are collected through the weighting of
several study findings (see Table 2). Although the yield varied from state to state in Australia, we used the national
yield for each year for each grain crop. Some of the yield data were calculated using the production figure divided
by area harvested in a specific year. For ease of presenting the results, we segregated the data into five major types
of crops – wheat, coarse grain, pulses, oilseeds and other grains.
RESULTS
Ecological Footprint of Grain Consumption
On average during the research period, Australia’s grain consumption ecological footprint was
gha
based on local yield and
gha based on global yield. The results indicate the increasing trend of the
ecological footprint from 1995 to 2010 from
to
gha based on local yield and from
to
gha based on global yield. Meanwhile, the per capita grain ecological footprint increased from
0.85 gha to 1.91 gha, which was almost double the average level of Australia in 2010 (GFN, 2010). The largest area
of ecological footprint was used by wheat consumption as
gha (per capita 0.55 gha) out of
gha (per capita 1.34 gha) in 1995 in comparison to
gha (per capita 0.82 gha) out of
gha (per
capita 1.44 gha) in 2010. The second productive land area of ecological footprint was used by barley consumption as
gha (per capita 0.23 gha) in 1995 in comparison to
gha (per capita 0.22 gha) in 2010. The
third-largest productive land area of ecological footprint was used by lupins consumption –
gha (per
capita 0.15 gha) in 1995 and rapeseed consumption was
gha (per capita 0.09 gha) in 2010. Figure 1
presents a summary of Australia’s ecological footprint for major grain crops such as wheat, barley, lupins, rapeseed,
chickpeas and cottonseed. The overall size of the grain footprint was
gha using local yield and
gha using global yield in 2010. While the overall size of the grain consumption footprint in 2010 (
was larger than in 1995 (
the footprint per capita increased slightly from 1.34 to 1.49 gha
because of the larger number of consumers and amount of exports.
FIGURE 1: EF OF MAJOR GRAIN CONSUMPTION BASED ON LOCAL YIELD IN AUSTRALIA
45
Area in Global Hectare (x 106
gha)
40
35
30
25
20
15
10
5
0
Others
Chick peas
Triticle
Sorghum
Cottonseed
Lupins
Oats
Rapeseed
Barley
Wheat
Grain ecological footprint also depicts the ecological appropriation per consumption item in percentage terms,
which is shown in Table 3. The wheat consumption category of grain crops was the largest category with a
1145
Proceedings of the Australasian Conference on Business and Social Sciences 2015, Sydney
(in partnership with The Journal of Developing Areas)
ISBN 978-0-9925622-1-2
percentage increase from 41.06 in 1995 to 55.09 in 2010, with some fluctuations from 1998 to 2004. The
appropriation results indicate that barley consumption covers the second-highest productive land area, even though
the consumption patterns changed greatly. The lupins consumption reveals the third-highest productive land area in
percentage terms, but the percentage declined gradually from 1995 to 2010.
TABLE 3: ECOLOGICAL SPACE APPROPRIATION ( PER CENT OF THE TOTAL ECOLOGICAL FOOTPRINT)
FOR GRAIN CONSUMPTION USING LOCAL YIELD
Grain Types
Wheat
Barley
Lupins
Oats
Rapeseed
Cottonseed
Sorghum
Triticale
Chick peas
Others
Total
1995
41.06
17.16
11.18
9.12
2.70
2.14
5.39
1.88
1.59
7.77
100.00
1998
36.54
13.58
14.31
8.49
7.24
3.97
4.02
3.95
0.39
7.52
100.00
2001
37.10
24.41
10.15
6.58
2.29
2.41
6.55
3.66
0.62
6.23
100.00
2004
29.21
8.54
11.71
10.36
4.26
3.57
9.80
5.42
0.31
16.83
100.00
2007
43.22
24.96
5.15
8.33
7.24
0.44
4.14
2.47
1.03
3.01
100.00
2010
55.09
14.74
4.65
5.65
5.73
3.87
3.69
2.32
1.02
3.24
100.0
Energy Land Footprint
Grain crops covers both the crop land and energy land, because crop land is required to grow the quantity consumed,
and the energy/forest land is required to remove the CO2 emissions from the mechanical operations associated with
production, planting, harvesting, transporting and processing (Plymouth 2000). In calculating the energy land
footprint of grain crops, first, this study converted CO2e emissions into per tonne crops production. Second, we
translated this CO2e emissions into equivalent area demanded in terms of hectares. Third, this hectare measure was
converted into gha using the conversion ratio and finally multiplied by the IYF. Several factors needed to be
considered which affect the size of grain energy land footprint, including the quantities of grain crops consumed; the
area of crop land required for growing grain; the amount of energy inputs; and the CO2e emission level. The
following figure 2 (a, b) segregate the overall grain energy land footprint into various categories of grain
consumption.
FIGURE 2: THE OVERALL GRAIN ENERGY LAND FOOTPRINT DIVIDED INTO VARIOUS
CATEGORIES OF GRAIN CONSUMPTION
Others
Cottonseed (2.84)
(1.15)
12%
5% Sorghum
(1.32)
Lupins 5%
(1.08)
4%
Oats (1.98)
8%
Rapeseed
(0.76)
3%
1995
EF on Energy Land
Global hectare (x 107 gha)
Wheat
(10.70)
45%
Barley
(4.22)
18%
2010
Others
Cottonsee
EF on Energy Land
(1.55)
d (1.28)
Global hectare (x 107 gha)
6%
5%
Sorghum
Lupins
(1.61)
(0.45)
6%
2%
Oats
Wheat
(1.29) Rapeseed
(14.08)
5%
(1.32)
56%
5%
Barley
(3.70)
15%
Figure 2a
Figure 2b
Wheat production accounts for the highest share of energy land footprint, increasing from 44.49 per cent in
1995 to 55.71 per cent in 2010. This was due to large wheat consumption, higher energy inputs used and CO2e
emissions in the atmosphere (361 kg CO2e/tonne) in comparison to other grain crops. Barley production accounts
for the second-highest energy land footprint based on the emission statistics given by Collison et al. (2012) as 244
kg CO2e per tonne of barley production and consumption. Considering these statistics, barley consumption directs
the
gha (per capita 0.23 gha) and
gha (0.17 gha per capita) productive energy land in 1995
1146
Proceedings of the Australasian Conference on Business and Social Sciences 2015, Sydney
(in partnership with The Journal of Developing Areas)
ISBN 978-0-9925622-1-2
and 2010 respectively. The highest CO2e emission, 539 kg/per tonne, by rapeseed production is revealed by Collison
et al. (2012), but the ecological impact through energy land is less than the wheat and barley production because
rapeseed has low production and consumption. The same occurred for cottonseed production, as 1 tonne of
cottonseed needs 20GJ of energy through production to consumption, it has less ecological impact than wheat,
barley and rapeseed.
Biocapacity of Grain Crops
This study calculated the ecological footprint of grain crops using socio-economic statistics. Using actual grain
harvested land use data, this study obtained ecological capacity/biocapacity (BC) of grain crops for 1995 to 2010.
As a whole, the level of ecological capacity was higher than the ecological footprint of grain consumption both for
local and global productivity. As one unit of grain production process requires both the equivalent productive crops
land area and energy land area for GHG emissions, the combined ecological footprint of crops land and energy land
mostly exceeds the biocapacity. For example, in Figure 3, from 1995 to 2010, most of the years’ ecological footprint
of grain consumption were higher than the biocapacity, except 1997, 1998, 1999, 2000 and 2002. The years in
which the ecological footprint of consumption exceeded biocapacity means consumption of natural resources
exceeded the regeneration of natural resources, resulting in ecological deficit. Conversely, when biocapacity exceeds
ecological footprint then ecological surplus occurs. More importantly, for all years from 1995 to 2010, the
ecological footprint of grain production exceeded the biocapacity, meaning ecological overshoot occurred, and this
represents the rate of natural resources exploitation has exceeded its maximum carrying capacity and the local
ecosystem is depleting.
FIGURE 3: ECOLOGICAL FOOTPRINT, BC AND ECOLOGICAL SURPLUS/DEFICIT OF GRAIN
CONSUMPTION IN AUSTRALIA FROM 1995 TO 2010 (GHA, X 107 GHA)
9.0
7.0
5.0
3.0
1.0
-1.0
Ecological Footprint
Biocapacity
2010
2009
2008
2007
2006
2005
2004
2003
2002
2001
2000
1999
1998
1997
1996
1995
-3.0
Ecological Surplus/Deficit
1147
Proceedings of the Australasian Conference on Business and Social Sciences 2015, Sydney
(in partnership with The Journal of Developing Areas)
ISBN 978-0-9925622-1-2
CONCLUSIONS, POLICY IMPLICATIONS AND LIMITATIONS
Grains consumption/production is defined as unsustainable when the ecological footprint of consumption/production
surpasses the ecological supply (Ying et al. 2009). This study found variation in the ecological footprint coming
from grain consumption and production. The increase in the ecological deficit of grain crops in Australia is
primarily a result of the increase in population, type of consumption, degree of CO 2e emissions, grain yields and
energy inputs used (Collins and Fairchild 2007). The ecological footprint result of this study on grain crops is 1.27
gha, which surpassed the national ecological appropriation level of 1.07 gha. This figure also accounts for almost
one-quarter of the overall ecological footprint of 6.5 gha for 2010 in Australia.
These results indicate that Australia’s grain consumption is unsustainable at the national scale, and still
below the world-average ecological appropriation level. The refined method of determining the ecological footprint
has provided us with a new assessment tool to gain insights into the environmental impacts of grain crops
consumption. The study only focused on the figure of whole grain crops instead of processed grain, like pasta,
bread, cereals etc, to avoid double counting. Moreover, the intensity of human-induced changes to land (Lenzen and
Murray 2003) are not considered in this study, which would also change the results to some extent.
Most of the impact on the environment actually comes from human consumption of grains. If we really
want to tackle the impacts on the environment, we must as a society begin to address the impacts of our
consumption patterns. The emissions generated from providing the food we eat and the goods we purchase are
together more than four times the emissions from our own personal use of electricity (ACF 2007). If Australia wants
to shift to a smarter, more sustainable agricultural future, we must strive to shift to lower impact products and
services, to increase the efficiency of the production through reducing energy inputs.
Reducing the ecological footprint of the crop must focus on the efficiency with which inputs are used and
converted to grain crops. If yield can be at least maintained while inputs are reduced, this will reduce carbon
emissions per hectare and save money on input costs and increase profitability per hectare or per tonne. The
outcome of this study would support decision makers and policymakers with information on how much biological
productive area we have and how much we are using to achieve sustainability on grain crops. The case of grain
crops in Australia is just one of many commodities upon which we all depend. The method taken in this paper
enhances the advantages and accuracy of the ecological footprint analysis.
ENDNOTES
*Acknowledgement
This work is financially supported by the Brazil Family Foundation. We would like to express our appreciation and
thanks for their financial support.
1
The global hectare is normalised to the area-weighted average productivity of biologically productive land and
water in a given year. Because different land types have different productivity, a global hectare of, for example,
cropland, would occupy a smaller physical area than the much less biologically productive pasture land, as more
pasture would be needed to provide the same biocapacity as one hectare of cropland. Because world bioproductivity
varies slightly from year to year, the value of a gha may change slightly from year to year.
2
It applies at the national level and traces all the resources a nation consumes and waste it emits. The nation’s
consumption is calculated by adding imports to, and subtracting exports from, the domestic production.
Wackernagel, M, Monfreda, C & Deumling, D 2002, Ecological Footprint of Nations November 2002 Update: How
much nature do they have? How much do they have? Redefining Sustainability Issue Brief, Oakland,
http://www.rprogress.org.
3
Component-based foot printing adds up the footprint of each category of consumption. The approach is more
instructive and more flexible for calculating the footprint of population smaller than a nation. Ibid.
4
The equivalence factor is calculated as the ratio of the average suitability index for a given land type divided by the
average suitability index for all land types. The suitability indexes are available at Global Agro-Ecological Zones,
and the actual areas of various lands are available at FAOSTAT (NFA, 2010)
5
IYFs are calculated for each year and land use type in order to track changes in the world-average bioproductivity
over time of each land type. For a given land type, crop land, producing crops c, in a given year n, with a selected
1148
Proceedings of the Australasian Conference on Business and Social Sciences 2015, Sydney
(in partnership with The Journal of Developing Areas)
ISBN 978-0-9925622-1-2
base year b, a world average Inter-temporal Yield Factor is thus calculated as
amount of a crop harvested and
6
∑
(
⁄
)
(
⁄
)
, where P is the
is the world-average product-specific yield (Borucke et al., 2012)
For major land use types that produce only a single primary product, yield factors (YFs) are calculated using the
equation
where
refers to yield for a given country and land type and
denotes world-average yield
for a given land type (GFN 2008).
7
The estimation of CO2e refers to the carbon dioxide (CO2), Methane (CH4) and Nitrous Oxide (N20) which are
added up into the GHG emissions figure and usually expressed as kilograms of CO 2 equivalent (CO2e) per tonne of
product.
REFERENCES
ABARES (2014). Australian Crop Report, Australian Bureau of Agricultural and Resource Economics and
Sciences, Canberra, February, No.169, pp.1-21.
Australian Bureau of Statistics (2013). Agricultural Commodities, Australia, 2012-2013 (Cat. no. 7121.0), Available
at http://www.abs.gov.au/ausstats (Released on 30/5/2014).
ACF (2007). Consuming Australia:The Environmental Impacts of Household Consumption in Australia, Australian
Conservation Foundation, Sydney. Available at http://acfonline.org
Biswas, W. K., Graham, J., Kelly, K. and John, M. B. ‘Global warming contributions from wheat, sheep meat and
wool production in Victoria, Australia-a life cycle assessment’, Journal of Cleaner Production, Vol. 18,
(2010) pp.1386-92.
Bloom, D. E. and Williamson, J. G. ‘Demographic Transitions and Economic Miracles in Emerging Asia’, World
Bank Economic Review, Vol. 12(3), (1998) pp.419-55.
Borsa, S. and Marchettini, N. ‘Ecological footprint analysis applied to the production of two Italian wines’,
Agriculture, Ecosystems and Environment, Vol. 128, (2008) pp. 162-166.
Bradbear, C. and Sharon, F. ‘Food systems and environmental sustainability: a review of the Australian evidence’,
NCEPH Working Paper, Australian Natioal University, (2011), Canberra.
Brock, P., Madden, P., Schwenke, G., and Herridge, D. ‘Greenhouse gas emissions profile for 1 tonne of wheat
producded in Central Zone (East) New South Wales: a life cycle assessment’, Crop and Pasture Science,
Vol. 63(4), (2012) pp.319-29.
Collins, A. and Fairchild, R. ‘Sustainalbe Food Conumption at a sub-national level: An Ecological Footprint,
Nutritional and Economic Analysis’, Joural of environment policy and planning, Vol. 9(1), (2007) pp.5-30.
Collison, M., Hillier, J. and Davies, N. ‘Understanding Carbon footprinting for Cereals and Oilseeds (2012). UK.
Available at http://www.hgca.com/media
DCCEE (2010). Australia`s Emissoins Projections, 2010, Department of Climate Change and Energy Efficiency,
ACT, Canberra.
Dong, C., Sheng, W., Quan, C. and Qiao, Z. ‘Ecological Footprint analysis of food consumption of rural residents in
China in the last 30 years’, Agriculture and Agricultural Science Procedia, Vol. 1, (2010) pp.106-15.
Edmonds, A. (2004). Directions for Sustainable and Profitable Gains in the Australian Grains Industry, Landmark
AWB, Western Australia.
Environmental Protection Authority (2008). Victoria`s Ecological Footprint, EPA Victoria and the Commissioner
for Environmental Sustainability, EPA, Victoria. Available at http://www.epa.vic.gov.au
Friel, S., Barosh, L.J. and Lawrence, M. ‘Toward healthy and sustainable food consumption: an Australian case
study’, Public Health Nutrition, (2013) p. 11.
Global Footprint Network (2012). Advancing the Science of Sustainability. Available at
http://www.footprintnetwork.org (last accessed 7 April 2014).
GRDC (2010). Australian Grains Focus, 2010, GRAD Corporation, Grains Research Development Corporation,
ACT. Available at http://www.grdc.com.au/Resources
GRDC (2012). Greenhouse Gas Emissions from Grain Producton. Grains Research & Development Corporation,
ACT. Available at http://www.publish.csiro.au/paper
Harvey, J. and Perrett, K. (2011). GRDC Australian Grains Focus 2010-2011, Grains Research & Development
Corporation, ACT.
Khan, S., Khan, M., Hanjra, M. and Mu, J. ‘Pathways to reduce the environmental footprints of water and energy
inputs in food production’, Food Policy, Vol. 34, (2009) pp.141-149.
Kissinger, M., and Gottlieb, D. ‘Place oriented ecological footprint analysis - The case of Israel`s grain supply’,
Ecological Economics, Vol. 2010 (69), (2010) pp.1639-45.
1149
Proceedings of the Australasian Conference on Business and Social Sciences 2015, Sydney
(in partnership with The Journal of Developing Areas)
ISBN 978-0-9925622-1-2
Kissinger, M. and Gottlieb, D. ‘From global to place oriented hectares -The case of Israel`s what ecological
footprint and its applications for sustainable resource supply’, Ecological Indicators, Vol. 16, (2012) pp.
51-55.
Kissinger, M., Fix, J. and Rees, W.E. ‘Wood and non-wood pulp production:Comparative ecological footprinting on
the Canadian prairies’, Ecological economics, Vol. 62, (2007) pp. 552-558.
Kitzes, J., Galli, A. Rizk, S. Reed, A. and Wackernagel, M. ‘Guidebook to the National Footprint Accounts, (2008),
Global Footprint Network, Oakland.
Leng, R.A. (2012). Animal production and the future use of cottonseed, University of New England, Armidalen
NSW 2350. Available at http://www.australiancottonconference.com.au.
Lenzen, M., and Murray, S. A. ‘The Ecological Footprint-Issues and Trends, The University of Sydney’, ISA
Research Paper 01-03, (2003). Available at http://www.isa.org.usyd.edu.au
Maraseni, T. N. Mushtaq, S. and Maroulis, J. ‘Greenhous gas emissions from rice farming inputs: a cross-county
assessment’, Journal of Agricultural Science, Vol. 147, (2009) pp. 117-26.
Muir, S. (2013). Indentifying opportunities to reduce greenhouse gas emissions for climate change mitigation in
grain production systems in North West NSW using Life Cycle Assessment (LCA) approaches in The 8th
Life Cycle Conference: Pathways to Greening Global Markets: proceedings of the The 8th Life Cycle
Conference: Pathways to Greening Global Markets NSW Department of Primary Industries, Sydney, NSW.
Niccolucci, V., Galli, A. Kitzes, J. and Pulselli, R.M. ‘Ecological footprint analysis applied to the production of two
Italian wines’, Agriculture, Ecosystems and Environment, Vol. 128, (2008) pp. 162-166.
Plymouth (2000). Influencing choice and change in a sustainble way, The Environmental & Sustainability
Partnership, Royal Parade, UK. Available at http://www.plymouth.gov.uk
PwC (2011). The Australian Grains Industry; From family farm to International Markets ; The Basics,
PricewaterhouseCoopers. Available at http://www.pwc.com.au
Radio, A. A. (2012). Australia has seventh biggest ecological footprint. Available at ttp://www.radioaustralia.net.au
Vegara, J.M. (2000). Footprint Computation: Three Common Errors in World Meeting: Man and City; Toward a
Human and Sustainable Development: proceedings of theWorld Meeting: Man and City; Toward a Human
and Sustainable Development Metropolitans de Barcelona, Naples, Italy.
VicUrban (2007). How VicUrban Applies the 5 Core Sustainability Objectives at Aurora toward regional
sustainability’, Aurora Case Study, Victoria, Melbourne. Available at http://www.aurora.asn.au/estate-hottopics/fibre-to-the-home/
Wackernagel, M. and Rees, W.E. ‘Our Ecological Footprint-Reducing Human Impact on the Earth (1996), New
Society Publishers, Gabriola, BC.
Wackernagel, M., and Yount, J. ‘The ecological footprint: an indicator of progress toward regional sustainability’,
Environmental Monitoring and Assessment, Vol. 51, (1998). pp.511-529.
Wackernagel, M., Monfreda, C. and Deumling, D. ‘Ecological Footprint of Nations November 2002 Update: How
much nature do they have’? Refefining Sustainability Issue Brief, (2002), Oakland. Available at
http://rprogress.org/ecological_footprint/about_ecological_footprint.htm. (accessed 12 March 2014)
1150


© Copyright 2026