
Document
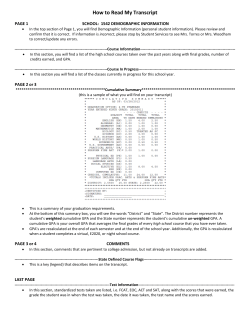
A First-Principles Computational Study of Structural and Elastic Properties of ZnO
Jeevake Attapattu, UNLV, Department of Physics and Astronomy
Dr. Changfeng Chen, Faculty Mentor, UNLV, Department of Physics and Astronomy
Overview
Results & Discussion
c) zinc blende
RS & ZB 0 GPA GGA
RS C11
RS C12
RS C44
ZB C11
ZB C12
ZB C44
RS - W
ZB - W
0.2
W urtzite
Rock Salt
Zinc Blende
8
0
-0.1
160
Cij (GPa)
0.1
180
6
0
140
150
100
100
80
60
0
10
5
20
15
Pressure (GPa)
b
30
25
1
2
3
4
5
50
0
1
% Distortion
0
-0.2
35
200
4
-0.5
b
250
120
2
-0.4
RS C11
RS C12
RS C44
ZB C11
ZB C12
ZB C44
300
Cij (GPa)
200
-0.3
-0.1
0
2/3
(V/V0) -1
c
c
350
10
0.3
-0.2
c
RS & ZB 15 GPa GGA
220
16∆E/9V0 (eV/Primitive cell)
b) rock salt
Transition Pressure & Bulk Modulus
∆E (eV)
The purpose of this study is to determine structural and mechanical
properties of zinc oxide (ZnO) using first-principles computational methods.
The most significant contribution of this study is the simulation of the highpressure phases. These high-pressure simulations are important because the
rock salt phase of ZnO obtained at high pressure can be recovered at
ambient pressure, and this new structural phase possesses different
properties that may be more useful for certain applications.
a) w urtzite
Since the ambient pressure W phase results are in close agreement with
experiments we can proceed with confidence for the RS & ZB phases
shown in figure 4 as well as the high pressure W phase calculations.
0.1
2
3
4
5
% Distortion
0.2
a
b
a
a
Figure 4. Left: The ambient-pressure elastic constants for the RS & ZB ZnO
phases. Right: The high-pressure elastic constants for the RS & ZB ZnO
phases. The distortions used were kept small to keep the change in volume
small. The dashed lines are the results of linear fits. These linear fits are used to
extrapolate the elastic constants for 0% distortion.
Figure 2. Left: The energy-pressure graph. The energies for the RS & ZB
phases are plotted relative to the W phase energy. The crossover indicates a
transition pressure of 11 GPa. At low pressures the W phase is more stable. At
high pressure the RS phase is more stable. The high-pressure RS ZnO
structure can be recovered at ambient pressure. Right: The fitting of
calculated energies to the Birch-Murnaghan EoS. The resulting bulk moduli
are 129, 166, and 129, GPa for the W, RS, and ZB phases, respectively.
Figure 1. The three phases of ZnO. a) The ambient pressure wurtzite phase
and the high pressure b) The rock salt and c) The zinc blende phases.
Introduction
ZnO is a semiconductor widely used in many electronic and optical
applications. ZnO is also economically and environmentally desirable
– first, both the constituent elements are abundant on Earth and
therefore inexpensive for large-scale applications; second, it is nontoxic. The elastic constants can be used as an indicator as to how well
a material can withstand commercial/industrial manufacturing and
usage. The ambient pressure experimental elastic constants for wurtzite
are used to check the validity of the results at high pressure and the
other phases.
Conclusions & Further Study
The transition pressure from figure 2 gives a clear distinction between
high and low pressure calculations. The high pressure calculations were
done at 15 GPa. By using a direct derivative method, we calculated the
bulk modulus for the high pressure ZnO structures. The resulting bulk
moduli are 193, 229, and 192, GPa for the W, RS, and ZB phases,
respectively.
The present work predicts a structural transition from the wurtzite to RS
phase of ZnO at 11 GPa. We therefore performed high-pressure
calculations at 15 GPa. The bulk moduli for the ambient-pressure
structures are within 12% of previously reported results. Our calculations
indicate that the high-pressure bulk moduli of ZnO phases increase
between 38% and 50%. The RS and ZB phases of ZnO show increasing
values of elastic constants C11 and C12 at higher pressure, while the value
of ZB phase C44 decreases at higher pressure. On the other hand, the
wurtzite phase shows all increased elastic constants with increasing
pressure. A comparison was made between the elastic constants of the ZnO
phases and those of silicon. With the exception of C55 and C66 in the
wurtzite phase, the three phases of ZnO exhibit higher values of elastic
constants, indicating their higher strength under structural deformation. An
important topic for future study of ZnO is to explore the electronic band
structure and phonon dispersion, which will determine the properties
crucial in many device applications. The structural results obtained in this
work have laid a key foundation for continued research.
Elastic Constants
Method
W 15 GPa GGA
300
180
C11
C12
C13
C33
C55
160
140
C11
C12
C13
C33
C55
250
200
120
Cij (GPa)
Cij (GPa)
The primary tool used in this paper is the Vienna Ab Initio
Simulation Package (VASP), which is based on the density
functional theory (DFT) to calculate the ground-state property of a
substance. There are three known phases of ZnO, namely wurtzite
(W), rock salt (RS), and zinc blende (ZB). The initial step is to
determine the transition pressure for the structural transformation
between the ZnO phases. This helps set a clear distinction between
the high-pressure and ambient-pressure calculations.
The second step is to obtain the bulk modulus. To calculate the bulk
modulus, each structure is placed under a series of uniform pressure
values. The resulting energy data are then fitted against the BirchMurnaghan Equation of States (EoS). The third step is to calculate
the elastic constants. The W structure is a hexagonal closely packed
lattice. The RS and ZB phases have cubic lattices. To calculate the
elastic constants, distortions are applied to the lattice. By using the
difference in energy between the distorted and undistorted structure,
the elasticity of the structure can be calculated.
W 0 GPa GGA
100
80
150
100
60
Thermal Conductivity
50
40
20
0
1
2
3
% Distortion
4
5
0
0
1
2
3
4
5
% Distortion
Figure 3. Left: The ambient-pressure elastic constants for the W ZnO phase. Right:
The high-pressure elastic constants for the W ZnO phase. The distortions used were
kept small to keep the change in volume small. The dashed lines are the results of
linear fits. These linear fits are used to extrapolate the elastic constants for 0%
distortion.
The elastic constants for the ambient pressure W phase from figure 3 were
within 12% of the experimental results 1. The largest error being for C13,
which compounds errors from the other elastic constants. The distortions
applied and the equations for the resulting energy differences were taken
form previous works2,3.
References
1. Azuhata T, Takesada M, Yagi T, Shinkanai A, Chichibu SF, Torii K, Nakamura N, Sota
T, Cantwell G, Eason DB, Litton CS, Journal of Applied Physics 94, 968, (2003).
2. Jamal M, Cubic-elastic, http://www.WIEN2k.at/reg_user/unsupported/cubic-elast/
(2012).
3. Shein IR, Kiiko VS, Makurin YuN, Gorbunova MA, and Ivanovskii AL, Physics of the
Soldid State, 49, 1067-1073, (2007).
Acknowledgements
This material is based upon work partly supported by the National
Aeronautics and Space Administration under Grant No.
NNX10AN23H issued through the Nevada Space Grant.


© Copyright 2026