
Open the publication - UEF Electronic Publications - Itä
Anna Viitasalo Clustering of Cardio metabolic Risk Factors, Liver Enzymes and PNPLA3 Polymorphism With Special Reference To Children Publications of the University of Eastern Finland Dissertations in Health Sciences ANNA VIITASALO Clustering of Cardiometabolic Risk Factors, Liver Enzymes and PNPLA3 Polymorphism With Special Reference To Children To be presented by permission of the Faculty of Health Sciences, University of Eastern Finland for public examination in Medistudia MS302, Kuopio, on Friday, March 20th 2015, at 12 noon Publications of the University of Eastern Finland Dissertations in Health Sciences Number 271 Physiology/Institute of Biomedicine Faculty of Health Sciences, University of Eastern Finland 2015 Kopio Niini Oy Helsinki, 2015 Series Editors: Professor Veli-Matti Kosma, M.D., Ph.D. Institute of Clinical Medicine, Pathology Faculty of Health Sciences Professor Hannele Turunen, Ph.D. Department of Nursing Science Faculty of Health Sciences Professor Olli Gröhn, Ph.D. A.I. Virtanen Institute for Molecular Sciences Faculty of Health Sciences Professor Kai Kaarniranta, M.D., Ph.D. Institute of Clinical Medicine, Ophthalmology Faculty of Health Sciences Lecturer Veli-Pekka Ranta, Ph.D. (pharmacy) School of Pharmacy Faculty of Health Sciences Distributor: University of Eastern Finland Kuopio Campus Library P.O.Box 1627 FI-70211 Kuopio, Finland http://www.uef.fi/kirjasto ISBN (print): 978-952-61-1711-9 ISBN (pdf): 978-952-61-1712-6 ISSN (print): 1798-5706 ISSN (pdf): 1798-5714 ISSN-L: 1798-5706 III Author’s address: Institute of Biomedicine, physiology/School of Medicine University of Eastern Finland KUOPIO FINLAND Supervisors: Professor Timo Lakka, M.D., Ph.D. Institute of Biomedicine, physiology/School of Medicine University of Eastern Finland KUOPIO FINLAND Docent David Laaksonen, M.D., Ph.D. Institute of Clinical Medicine, Kuopio University Hospital, Kuopio University of Eastern Finland KUOPIO FINLAND Senior researcher Virpi Lindi, Ph.D. Institute of Biomedicine, physiology/School of Medicine University of Eastern Finland KUOPIO FINLAND Reviewers: Emeritus professor Jorma Viikari, M.D, Ph.D. Department of Medicine University of Turku TURKU FINLAND Docent Kirsi Virtanen, MD, Ph.D. Turku PET centre, Turku University Hospital University of Turku TURKU FINLAND Opponent: Associate professor (Docent) Kirsi Pietiläinen, MD, Ph.D., PSc in Nutrition. Obesity Research Unit, Helsinki University Hospital University of Helsinki HELSINKI FINLAND IV V Viitasalo, Anna Clustering of cardiometabolic risk factors, liver enzymes and PNPLA3 polymorphism with special reference to children University of Eastern Finland, Faculty of Health Sciences Publications of the University of Eastern Finland. Dissertations in Health Sciences 271. 2015. 71 p. ISBN (print): 978-952-61-1711-9 ISBN (pdf): 978-952-61-1712-6 ISSN (print): 1798-5706 ISSN (pdf): 1798-5714 ISSN-L: 1798-5706 ABSTRACT Children with clustering of cardiometabolic risk factors have an increased risk of adulthood metabolic syndrome (MetS), type 2 diabetes and cardiovascular disease. MetS has also been associated with liver fat accumulation already in children. Elevated levels of plasma alanine aminotransferase (ALT) and gamma-glutamyltransferase (GGT) have been associated with liver fat accumulation. In addition to excess body fat, also genetic factors, and mainly PNPLA3 I148M polymorphism, have been found to increase the risk of liver fat accumulation not only in adults but also in children. The purpose of this thesis was to expand knowledge on the clustering of cardiometabolic risk factors in children and adults, the associations of cardiometabolic risk factors with plasma levels of ALT and GGT in children and the relationship of the I148M polymorphism in the PNPLA3 gene with plasma ALT and GGT levels in children. Data on children were from the Physical Activity and Nutrition in Children (PANIC) Study, which is an ongoing exercise and diet intervention study in a population sample of children from the city of Kuopio, Finland. Altogether 512 children 6-8 years of age participated in the baseline study and 440 of them also took part in the 2-year follow-up study. Data on adults were from a large follow-up study in middle-aged men and from baseline examinations of a large randomized controlled trial among older individuals. Factor analysis was used to derive the MetS. MetS was represented by a second-order latent variable underlying four latent variables characterized by abdominal obesity, insulin resistance, dyslipidemia and raised blood pressure in different age groups. These secondorder factors were strongly associated with a composite cardiometabolic risk score in all age groups (r=0.84-0.99) and similarly predicted type 2 diabetes, cardiovascular outcomes and mortality in middle-aged men. The risk of type 2 diabetes, myocardial infarction and cardiovascular death increased 3.7-, 1.4-, and 1.6-fold, respectively, for a 1 SD increase in the cardiometabolic risk score. Overweight or obese children had a 2.1-times higher risk of having ALT and a 4.5-times higher risk of having GGT in the highest fifth than normalweight children. Overweight PNPLA3 148M allele carriers had higher ALT levels (23.2 U/l) at baseline than other children (18.2-19.2 U/l) (P=0.024 for interaction). Moreover, they had a larger increase (6.4 U/l) in ALT levels during 2-year follow-up than other children (-0.6−0.3 U/l) (P=0.002 for interaction) The findings show that MetS can be described as a single entity in widely varying age groups and that the cardiometabolic risk score is a valid tool for research evaluating cardiometabolic risk in different age groups. Moreover, cardiometabolic risk score and individual risk factors were associated with high-normal plasma levels of ALT and particularly GGT in children. Furthermore, the carriers of 148M allele of the PNPLA3 rs738409 polymorphism had elevated plasma levels of ALT if they were overweight but not if they were normal weight. National Library of Medicine Classification: QU 141, QU 500, WD 200, WD 210, WK 820 Medical Subject Headings: Metabolic Syndrome X; Risk Factors; Overweight; Obesity, Abdominal; Insulin Resistance; Dyslipidemias; Blood Pressure; Diabetes Mellitus, Type 2; Myocardial Infarction; Alanine Transaminase; gamma-Glutamyltransferase; Genes; Polymorphism, Genetic; Child; Middle Aged; Finland VI VII Viitasalo, Anna Kardiometabolisten riskitekijöiden kasautuminen, maksaentsyymit ja PNPLA3 polymorfismi lapsilla Itä-Suomen yliopisto, terveystieteiden tiedekunta Publications of the University of Eastern Finland. Dissertations in Health Sciences 271. 2015 71 s. ISBN (print): 978-952-61-1711-9 ISBN (pdf): 978-952-61-1712-6 ISSN (print): 1798-5706 ISSN (pdf): 1798-5714 ISSN-L: 1798-5706 TIIVISTELMÄ Lapsuusiässä ilmaantuneet kardiometaboliset riskitekijät säilyvät usein aikuisikään saakka lisäten metabolisen oireyhtymän, tyypin 2 diabeteksen ja ateroskleroottisten valtimotautien riskiä aikuisiässä. Kardiometabolisten riskitekijöiden kasaumaan voi liittyä myös lisääntynyt maksan rasvoittuminen, jonka yhteydessä plasman alaniiniaminotransferaasi (ALAT) ja gamma-glutamyylitransferaasi (GT) arvot nousevat. Geneettisistä tekijöitä erityisesti PNPLA3 I148M genotyyppi on ollut yhteydessä maksan rasvoittumiseen sekä aikuisilla että lapsilla. Tämän tutkimuksen tarkoituksena oli lisätä tietoa metabolisten riskitekijöiden kasautumisesta lapsilla ja aikuisilla ja sen yhteydestä ALAT- ja GT-arvojen tasoihin lapsilla. Lisäksi tavoitteena oli tutkia PNPLA3 I148M polymorfismin yhteyttä ALAT- ja GT-tasoihin lapsilla. Väitöskirja perustuu kolmeen kuopiolaiseen väestöotokseen. Lasten liikunta ja ravitsemus -tutkimus on käynnissä oleva interventiotutkimus 512 6-8vuotiaan lapsen edustavassa väestöotoksessa, jonka 2-vuoden seurantatutkimukseen osallistui 440 lasta. Aikuisväestön aineisto oli peräisin suuresta keski-ikäisillä miehillä toteutetusta seurantatutkimuksesta sekä ikääntyvillä naisilla ja miehillä toteutetusta laajasta kohorttitutkimuksesta. Toisen asteen faktorianalyysimalli muodostettiin neljästä muuttujasta, jotka kuvasivat lisääntynyttä kehon rasvamäärää, insuliiniresistenssiä ja heikentynyttä glukoosinsietoa, dyslipidemiaa ja kohonnutta verenpainetta eri ikäryhmissä. Nämä toisen asteen faktorit korreloivat vahvasti metabolisen summamuuttujan kanssa kaikissa ikäryhmissä (r=0.840.99) ja ennustivat sen kanssa samankaltaisesti tyypin 2 diabetestä. Summamuuttujan arvon noustessa yhden keskihajonnan verran tyypin 2 diabeteksen riski nousi 3.7-kertaiseksi, sydäninfarktin riski 1.4-kertaiseksi ja verenkiertoelinsairauksista johtuvien ennenaikaisten kuolemien riski 1.6-kertaiseksi. Ylipainoisilla ja lihavilla lapsilla oli 2.1-kertainen riski siihen, että ALAT-arvot olivat ylimmässä viidenneksessä ja vastaavasti 4.5-kertainen riski GT-arvojen osalta. ALAT-arvot olivat korkeampia ylipainoisilla PNPLA3 -geenin 148M alleelia kantavilla lapsilla (23.2 U/l) kuin muilla lapsilla (18.2-19.2 U/l) lähtötilanteessa (interaktion p=0.024). Lisäksi 2-vuoden aikana ALAT-arvoissa tapahtui heillä (6.4 U/l) muita (-0.6−0.3 U/l) suurempi ALAT-arvojen nousu (interaktion p=0.002). Tulokset osoittivat metabolisen oireyhtymän osatekijöiden kasautuvan samankaltaisesti lapsilla ja eri-ikäisillä aikuisilla sukupuolesta riippumatta. Aineenvaihdunnallista riskiä kuvaava summamuuttuja osoittautui käyttökelpoiseksi arviointivälineeksi eri ikäluokissa. Metabolisten riskitekijöiden kasautuminen oli yhteydessä lievästi kohonneisiin ALAT- ja erityisesti GT-pitoisuuksiin lapsilla ja PNPLA3 I148M alleelin kantajuuden ja ylipainon yhteisvaikutus oli yhteydessä korkeampiin ALAT-arvoihin lapsilla. Luokitus: QU 141, QU 500, WD 200, WD 210, WK 820 Yleinen suomalainen asiasanasto: metabolinen oireyhtymä; riskitekijät; ylipaino; lihavuus; insuliiniresistenssi; dyslipidemia; verenpaine; aikuistyypin diabetes; sydäninfarkti; maksa; entsyymit; geenit; lapset; aikuiset; keski-ikäiset; Suomi VIII IX Acknowledgements This work was carried out at the Department of Biomedicine, University of Eastern Finland, Kuopio Campus. I would like to express my gratitude to all individuals who have contributed to this thesis in many different ways. In particular, I would like to express my thanks to: my supervisor, Professor Timo Lakka for his excellent guidance, feedback and support. I also want to thank Timo for his expertise in physiology and in writing manuscripts. His dedication, support and sense of humor have been essential for the whole study. docent David Laaksonen, my second supervisor, for his expertise in endocrinology and statistics. I also own David my deepest gratitude for his valuable contribution in analyzing the data, his willingness to address my questions as well as for language editing of this thesis. my third supervisor, senior researcher Virpi Lindi, for invaluable and constructive comments, feedback and contribution especially in the writing of this thesis. She has been very encouraging and always willing to help. emeritus professor Jorma Viikari and Docent Kirsi Virtanen for the skillful review of the thesis and for their constructive comments which have helped me to improve the work. the PANIC Study group for their valuable contribution to the study ass well for their friendship and support. Particularly, I want to thank Kirsi and Tuula-Riitta for taking the laboratory samples as well as Panu and Sanna for data management. all co-authors Jussi Pihlajamäki, Jarmo Jääskeläinen, Mustafa Atalay, Rainer Rauramaa, Kai Savonen, Maija Hassinen, Pirjo Komulainen, Sudhir Kurl, Jari Laukkanen, Sari Väisänen, Tuomo Tompuri, Hanna-Maaria Lakka, Aino-Maija Eloranta, Dorota Kaminska and Raimo Joro for their contribution to this work and for their constructive comments and ideas. I also want to thank the KIHD and DR’EXTRA studies for providing the opportunity to use the data in Study II. Finally, my loving thanks to my parents, sisters, my brother and my friends for always supporting me. Also loving thanks to Juho for your encouragement and support during this journey and to Kasperi for showing me what is really important in life. In appreciation of their financial support for this work, I thank Institute of Dentistry and North Savonia Regional Fund of the Finnish Cultural Foundation. Kuopio, February 2015 Anna Viitasalo X XI List of the original publications This dissertation is based on the following original publications: I Viitasalo A, Laaksonen DE, Lindi V, Eloranta AM, Jääskeläinen J, Tompuri T, Väisänen S, Lakka HM, Lakka TA. Clustering of metabolic risk factors is associated with high-normal levels of liver enzymes among 6- to 8-year-old children: the PANIC study. Metab Syndr Relat Disord. 2012 10:337-43 II Viitasalo A, Lakka TA, Laaksonen DE, Savonen K, Lakka HM, Hassinen M, Komulainen P, Tompuri T, Kurl S, Laukkanen JA, Rauramaa R. Validation of cardiometabolic risk score by confirmatory factor analysis in children and adults and prediction of cardiometabolic outcomes in adults. Diabetologia 2014 57:940-9 III Viitasalo A, Pihlajamäki J, Lindi V, Atalay M, Kaminska D, Joro R, Lakka T. Associations of I148M variant in PNPLA3 gene with plasma ALT levels during 2year follow-up in normal weight and overweight children: The PANIC Study. Pediatric Obesity June 2014 The publications were adapted with the permission of the copyright owners. XII XIII Contents 1 INTRODUCTION ....................................................................................................................... 1 2 REVIEW OF THE LITERATURE ............................................................................................. 2 2.1 Metabolic syndrome......................................................................................................2 2.1.1 Definition of the metabolic syndrome ..............................................................2 2.1.2 Prevalence of metabolic syndrome ...................................................................6 2.2 Causes of metabolic syndrome ....................................................................................7 2.2.1 Genetic factors......................................................................................................7 2.2.2 Low physical activity, sedentary behavior and poor cardiorespiratory fitness ....................................................................................................................7 2.2.3 Dietary factors ......................................................................................................7 2.2.4 Other factors .........................................................................................................7 2.3 The pathophysiology of metabolic syndrome...........................................................8 2.3.1 Excess fat accumulation......................................................................................8 2.3.2 Insulin resistance and hyperglycemia ..............................................................8 2.3.3 Dyslipidemia ........................................................................................................9 2.3.4 Elevated blood pressure .....................................................................................9 2.4 Consequences of metabolic syndrome .......................................................................9 2.4.1 Type 2 diabetes and its complications ..............................................................9 2.4.2 Increased liver fat content ................................................................................10 PNPLA3 gene variant and liver adiposity ..............................................................11 2.4.3 Atherosclerosis and atherosclerotic cardiovascular diseases .....................12 2.4.4 Other manifestations of metabolic syndrome ...............................................13 3 AIMS............................................................................................................................................ 14 4 METHODS ................................................................................................................................. 15 4.1 Study populations and designs .................................................................................15 4.1.1 PANIC Study .....................................................................................................15 4.1.2 KIHD Study ........................................................................................................16 4.1.3 DR’s EXTRA Study ...........................................................................................17 4.3 Assessments .................................................................................................................17 4.3.1 Assessments in the PANIC study ...................................................................17 4.3.2 Assessments in the KIHD study .....................................................................18 4.3.3 Assessments in the DR’s EXTRA study .........................................................19 4.3.4 Cardiometabolic risk score...............................................................................19 4.4 Statistical analyses .......................................................................................................19 5 RESULTS .................................................................................................................................... 22 5.1 Associations of cardiometabolic risk factors with plasma levels of liver enzymes (Study I) .......................................................................................................22 5.2 Validation of cardiometabolic risk score by confirmatory factor analysis in children and adults and the prediction of cardiometabolic outcomes in adults (Study II) ..........................................................................................................28 XIV 5.3 Associations of I148M polymorphism in PNPLA3 gene with plasma ALT levels during 2-year follow-up in normal weight and overweight children (Study III) .................................................................................................................... 38 6 DISCUSSION ............................................................................................................................ 43 6.1 Strengths and limitations ........................................................................................... 43 6.1.1 Study populations and study designs............................................................ 43 6.1.2 Assessments ....................................................................................................... 44 Body composition and adiposity ............................................................................. 44 Liver enzymes and the PNPLA3 gene polymorphism ......................................... 45 Metabolic syndrome and cardiometabolic risk score ........................................... 46 6.2 Interpretation of findings and comparison with previous findings .................... 47 6.2.1 Associations of cardiometabolic risk factors with high-normal plasma levels of liver enzymes (Study I) .................................................................... 47 6.2.2 Validation of cardiometabolic risk score by confirmatory factor analysis in children and adults and prediction of cardiometabolic outcomes in adults (Study II) .......................................................................... 48 6.2.3 Associations of I148M variant in PNPLA3 gene with plasma ALT levels during 2-year follow-up in normal weight and overweight children (Study III) ........................................................................................................... 49 7 CONCLUSIONS ....................................................................................................................... 51 7.1 Clinical implications ................................................................................................... 51 7.2 Future research prospectives ..................................................................................... 51 REFERENCES ............................................................................................................................... 53 XV XVI Abbreviations ALT Alanine aminotransferase MAP Mean arterial pressure BMI Body mass index MRI Magnetic resonance imaging CFA Confirmatory factor analysis NAFLD Non-alcoholic fatty liver CRP C-reactive protein CVD Cardiovascular disease CV Coefficients of variation DEXA Dual energy X-ray absorptiometry DR’ EXTRA The Dose-Responses to Exercise Training disease NASH Non-alcoholic steatohepatitis NCEP The National Cholesterol Education Program PANIC Physical Activity and Nutrition in Children PNPLA3 Patatin-like phospholipase domain-containing protein 3 FFA Free fatty acid GGT Gamma-glutamyl transferase approximation GLM General linear model SDS Standard deviation score HDL High-density lipoprotein VLDL Very low-density lipoprotein HOMA Homeostatic model WHO The World Health Organization assessment hsCRP high-sensitivity C-reactive protein IDF International Diabetes Federation IMT Intima media thickness IOTF The International Obesity Task Force KIHD Kuopio Ischemic Heart Disease Risk Factor Study LDL Low-density lipoprotein MetS Metabolic syndrome RMSEA Root mean square of XVII 1 Introduction The metabolic syndrome (MetS) is a cluster of cardiometabolic risk factors, including central obesity, insulin resistance, glucose intolerance, dyslipidemia and raised blood pressure (1,2). The prevalence of MetS is increasing worldwide due to the epidemic of overweight and obesity (3,4). Children with MetS have an increased risk of adulthood MetS, type 2 diabetes and cardiovascular disease (CVD) (5,6). MetS also predicts type 2 diabetes (7), CVD (8,9), CVD and all-cause mortality (10) in adults. Thus, there is an urgent need to better understand the pathophysiology and determinants of this risk factor clustering already in childhood. It is also important to understand whether the structure of MetS is similar in different stages of life. The definition of MetS is particularly controversial among children and adolescents, because there are no clear thresholds above which the cardiometabolic risk factors start to worsen (2,11,12). Therefore, many of the more recent studies among children have used continuous variables for the components of MetS and have calculated a continuous cardiometabolic risk score instead of using a definition based on dichotomous variables (1315). Factor analysis has also been used to describe the pathophysiological processes related to MetS (16,17). Despite abundant research on MetS using a continuous cardiometabolic risk score or factor analysis, there are no previous studies in which the cardiometabolic risk score would have been validated by confirmatory factor analysis (CFA) in different age groups. Furthermore, few studies have investigated the long-term health consequences of a high cardiometabolic risk score (18). In addition to traditional cardiometabolic risk factors, several other metabolic disorders, such as liver fat accumulation (19), have been associated with MetS already in children. The epidemic of pediatric overweight and obesity has markedly increased the number of children with non-alcoholic fatty liver disease (NAFLD) (19,20). Plasma concentrations of liver enzymes, such as alanine aminotransferase (ALT) and gamma-glutamyl transferase (GGT) may be useful tools in the screening of pediatric NAFLD (21). Little is known about the associations of MetS and its components with high-normal plasma ALT and GGT concentrations and the role of these liver enzymes as features of MetS in children. Not only excess body fat content but also genetic factors have been found to increase the risk of developing NAFLD in children (22,23). Recently the patatin-like phospholipase domain-containing protein 3 (PNPLA3) gene variant I148M (rs738409) was found to be strongly associated with hepatic steatosis in a genome-wide association study in obese adults (24). Thereafter, other studies have provided further evidence that the PNPLA3 gene I148M polymorphism is strongly associated with liver fat content and plasma ALT levels in obese adults and children (25-27). There is only one previous study on the associations of the PNPLA3 148M allele with plasma ALT levels in normal weight and overweight children (28) and no follow-up studies on the subject. The purpose of the present study was to investigate the associations of cardiometabolic risk factors as well as the I148M polymorphism of the PNPLA3 gene with plasma levels of liver enzymes ALT and GGT in prepubertal children. The aim of the present study was also to validate the cardiometabolic risk score in different age groups. 2 2 Review of the literature 2.1 Metabolic syndrome 2.1.1 Definition of the metabolic syndrome Although it has been known for several decades that cardiometabolic risk factors cluster in certain individuals, it was not until 1980’s that the real interest for the clustering of cardiometabolic abnormalities started. The central roles of insulin resistance and abdominal obesity in the pathophysiology of this syndrome became apparent in late 1980’s and early 1990’s (29,30). Gerald Reaven popularized the syndrome in 1988 by proposing that this cluster of abnormalities associated with insulin resistance identifies individuals at increased risk for type 2 diabetes and cardiovascular disease (31). Reaven described this phenomenon as “Syndrome X” and thereafter several different terms including the Reaven’s syndrome, the deadly quartet, the insulin resistance syndrome, the cardiometabolic syndrome, the central obesity syndrome, the atherothrombotic syndrome and of course the metabolic syndrome have been used in medical literature. More recently, several new components including low-grade inflammation, prothrombotic states, liver fat accumulation, endothelial dysfunction, hyperuricemia, hypercortisolemia and oxidative stress have been linked to MetS, but the core factors still remain the same: central obesity, insulin resistance, hyperglycemia, dyslipidemia and raised blood pressure (1,2,12). There appears to be a consensus in the medical field that multiple cardiometabolic risk factors for type 2 diabetes and CVD cluster in certain individuals and the term metabolic syndrome has been generally accepted to describe this condition. There is still controversy, however, about the clinical definition of MetS, and even about the clinical utility of such a definition. Over the past decade, various diagnostic criteria have been proposed by different expert groups (1,32-36). All these groups agree on the core components of the MetS, including obesity, insulin resistance, dyslipidemia and elevated blood pressure, but they provide different clinical criteria for identifying such a cluster, which has brought some confusion to clinicians (1). Even Gerald Raven himself criticizes these definitions, mainly because of including obesity and type 2 diabetes as parts of the definitions, which were not included in the definitions of Syndrome X (37). The first attempt to develop a unifying definition for MetS was made by The World Health Organization (WHO) in 1999 (32). This definition is based on the assumption that insulin resistance is the major underlying risk factor for MetS. Evidence of insulin resistance and at least two other risk factors are required for the diagnosis. The WHO definition has been criticized, because it is difficult to measure insulin resistance by clamp techniques in clinical practice (38). Also, the use of waist-to-hip ratio as a measure of abdominal obesity as well as including microalbuminuria in the definition have been disputed. In the same year 1999 The European Group for The Study of Insulin Resistance further modified the definition of MetS (33). They used measurement of fasting plasma insulin for defining insulin resistance and waist circumference instead of waist-to-hip ratio for defining abdominal obesity. They also took out microalbuminuria from the definition and slightly modified different cut-off points. In 2001 The National Cholesterol Education Program (NCEP) Adult Treatment Panel III published a more clinically ascertainable definition of MetS, which required the presence of three factors out of abdominal obesity as measured by waist circumference, impaired fasting plasma glucose or prevalent type 2 diabetes mellitus, elevated plasma triglycerides, reduced plasma high-density lipoprotein (HDL) cholesterol and elevated blood pressure (34). In 2003 the American Association of Clinical Endocrinology Position Statement provided less strict guidelines containing a list of traditional risk factors and additionally 3 other risk factors to be considered, allowing the diagnosis of “Insulin Resistance Syndrome” to rely on clinical judgment (35). In 2005 The International Diabetes Federation (IDF) attempted to develop a consensus definition that differed from the NCEP definition mainly in that abdominal obesity was made an obligatory component and was set at a lower level than in the The NCEP definition, with ethnic-specific cut-offs. However, The American Heart Association/National Heart, Lung, and Blood Institute (36) published their own definition of the MetS, with only minor differences from The NCEP definition. Thus, there was a need to reconcile these criteria in the form of harmonized Joint Statement by these associations and other major organizations. In this statement it was agreed that there should be no obligatory component for the diagnosis of MetS and that waist circumference would continue to be a preliminary screening tool (1). Three or more abnormal findings out of elevated waist circumference, elevated fasting glucose, elevated plasma triglycerides, reduced plasma HDL cholesterol and elevated blood pressure would qualify a person for the MetS. The categorical cut-off points were provided for all these components except for waist circumference, for which national and regional cut-off points should be used. The statement underlines the importance of using a commonly agreed-upon set of criteria to be used worldwide, with agreed-upon cut-off points for different ethnic groups and genders. A syndrome can be defined as a clustering of factors that occur together more often than by chance alone and for which the cause is often uncertain, which holds true in the case of MetS (1,29). This idea of clustering of metabolic risk factors has been supported by studies using factor analysis, which can be used to reduce intercorrelated variables into a smaller set of factors and is a useful method for understanding patterns underlying the clustering of cardiometabolic risk factors (39). Exploratory factor analysis has traditionally been used to explore the possible underlying factor structure of a set of observed variables without imposing a preconceived structure on the outcome. Several previous studies have used exploratory factor analysis to examine the structure of MetS (40-44). The number of factors identified has ranged from 1 to 5. The results have ben inconsistent partly due different different variables or different numbers of variables being entered into the analyses or the manner of extraction or rotation used in the analyses (45). The promax rotation allows factors to be correlated, as opposed to the more commonly used varimax rotation, which generates uncorrelated factors (46). A previous study among adults by exploratory factor analysis found that second order factor analysis generated a single MetS factor that was loaded heavily by all three factors from the first-order analysis (10). CFA, on the other hand, is a technique testing a certain hypothesis (47). Recent studies using CFA have found a single factor underlying MetS in children (17), adolescents (48) and adults (49,50). The first-order CFA models for MetS used in previous studies are presented in Figure 1. Furthermore, Shen et. al. have used hierarchial a hierarchical CFA model with 10 measured variables in which the latent variables were allowed to covary (49). 4 A B C Figure 1. The metabolic syndrome models used in previous studies using confirmatory factor analysis by Pladevall et.al. (42) (A), Li& Ford (40) (B) and Martinez-Vizcaino et.al. (17) (C). HDL= High-density lipoprotein cholesterol; HOMA-IR=Homeostatic model assessment for insulin resistance; MAP=Mean arterial pressure; MetS=metabolic syndrome; SBP=systolic blood pressure The clinical definitions of MetS are based on the dichotomization of risk factors. The dichotomization of continuous variables can be criticized because it reduces statistical power in the analyses. Moreover, the idea of dichotomization can also be criticized because there is no evidence for a clear threshold in risk factors above which cardiometabolic risk increases (51). A joint statement by the American Diabetes Association and The European Association for the Study of Diabetes has suggested further research in the use of continuous variables for the features of MetS in the definition of MetS (52). Using a continuous cardiometabolic risk score variable for the key features of MetS instead of a dichotomous variable for the syndrome has many advantages, especially for research. The clustering of cardiometabolic risk factors and particularly the utility of the concept of MetS in a clinical context is an even greater matter of debate among children (12,17). Pediatric MetS has been defined using artificial and arbitrary cut-off points for its components based on the definitions of adulthood MetS (2,12). Such definitions are problematic, because the levels of cardiometabolic risk factors above which adverse health consequences start to occur among children are unknown. Difficulty to establish such criteria arouses from the complexity of the pediatric growth pattern and the effects of hormonal changes of puberty on body adiposity, insulin sensitivity and plasma levels of lipids and lipoproteins (11,12). Despite these difficulties concerning the diagnosis of MetS in children, The IDF has revealed guidelines for diagnosing MetS in children (53) based on previous studies (54-58) that used modified adult criteria to investigate the prevalence of MetS in children and adolescents (Table 1). According to the The IDF criteria, MetS should not be diagnosed in children under 10 years, but a strong message for weight reduction should be delivered for those with abdominal obesity (53). For children aged 10 to 16 years, MetS can be diagnosed by the presence of abdominal obesity and two or more other clinical features, including increased plasma glucose, elevated plasma triglycerides, reduced plasma HDL cholesterol or elevated blood pressure. For adolescents older than 16 years, the IDF adult criteria can be used (53). In children, the relatively low prevalence and the absence of a clear definition of the syndrome also support the use of a continuous cardiometabolic risk score (59). Previously used cardiometabolic risk scores calculated as the sum of z-score variables for MetS in children and adolescents are presented in Table 2. Another question is whether pediatric MetS can predict the risk of developing type 2 diabetes or CVD in adulthood. Some epidemiological studies have shown that children with MetS have an increased risk of adulthood MetS, type 2 diabetes and CVD (5,6). However, the results of a recent study suggested that although MetS in youth predicts these chronic diseases it is not a better prognostic tool than simple body mass index (BMI) (60). WC >75th percentile <1.3 mmol/l (<1.17 mmol/l for boys aged 15–19 years) SBP or DBP >90th percentile Fasting plasma glucose ≥6.1 mmol/l 12-19 WC ≥90th percentile ≥1.2 mmol/l ≤1.03 mmol/l SBP or DBP ≥90th percentile Fasting plasma glucose ≥6.1 mmol/l Age group (years) Body adiposity Fasting plasma triglycerides Fasting plasma HDL cholesterol Blood pressure Glucose Impaired glucose tolerance SBP or DBP >90th percentile ≤10th percentile ≥90th percentile WC ≥90th percentile 8-13 Cruz et. al. (55) Impaired glucose tolerance SBP or DBP >95th percentile <5th percentile >95th percentile BMI – z score ≥2.0 4-20 Weiss et. al. (57) Fasting plasma glucose ≥6.1 mmol/l SBP or DBP ≥90th percentile ≤1.03 mmol/l ≥1.2 mmol/l WC ≥90th percentile 12-17 Ford et. al. (58) WC ≥90th percentile 6-10 IDF definition (53) Fasting plasma glucose ≥5.6 mmol/l or known T2DM SBP ≥130 or DBP ≥85 mm Hg <1.03 mmol/l ≥1.7 mmol/l ≥90th percentile or adult cut-off if lower 10-16 IDF definition (53) Fasting plasma glucose ≥5.6 mmol/l or known T2DM SBP ≥130 or DBP ≥85 mm Hg*** <1.03 mmol/l for males and <1.29 mmol/l for females** ≥1.7 mmol/l * WC ≥ 94 cm for males and ≥ 80 cm for females >16 (Adult criteria) IDF definition (53) *or specific treatment for high triglycerides; **or specific treatment for low HDL cholesterol; ***or treatment for previously diagnosed hypertension BMI=body mass index; DBP= diastolic blood pressure; IDF=The International Diabetes Federation; SBP=systolic blood pressure; T2DM=type 2 diabetes mellitus; WC=waist circumference ≥1.1 mmol/l 12-19 Cook et.al.(54) Definition de Ferranti et al. (56) Table 1.Criteria for metabolic syndrome in children and adolescents 5 6 Table 2. Cardiometabolic risk scores calculated as the sum of z-score variables in children and adolescents in previous studies Reference Ekelund et. al. 2007(61) Eisenmann et. al. 2010 (14) Okosun et.al. 2010 (62) Formula of the cardiometabolic risk score waist circumference + ((systolic blood pressure + diastolic blood pressure)/2) + glucose + insulin - HDL cholesterol + triglycerides waist circumference + mean arterial blood pressure + Homeostasis Model Assessment insulin resistance - HDL cholesterol + triglycerides waist circumference + mean arterial blood pressure + glucose – HDL cholesterol + triglycerides 2.1.2 Prevalence of metabolic syndrome The prevalence of MetS is increasing worldwide due to the epidemic of overweight in all age groups (29). The prevalence of MetS is rapidly increasing also in developing countries (63). The prevalence of MetS depends on the definitions used as well as the distribution of sex, age, race and ethnicity of the population studied. According to The National Health and Examination Survey the age-adjusted prevalence of MetS in USA was 27.9% in 1988-1994 and 34.1% in 2003-2006. The prevalence of MetS in 2003-2006 was found to increase with age so that it was 20% in men and 16% in women under 40 years of age, 41% in men and 37% in women between 40 and 59 years of age and 52% in men and 54% in women 60 years and over (64). The same trend of a higher prevalence of MetS with advancing age has been observed in other populations (65). This increase seems to continue only up to sixth or seventh decade probably because individuals most susceptible to obesity-related mortality have likely died by this point (2,29). The difference between sexes in the prevalence of MetS varies across countries: in many countries there is very little difference in the prevalence of MetS between women and men, some countries have noticeably greater numbers of women than men who meet the MetS criteria, whereas others report a greater prevalence in men than in women (29). The prevalence of MetS in USA is also higher in African Americans than in Caucasians. The prevalence of MetS in Scandinavian adult populations has been similar to that of NorthAmericans, which is approximately one-quarter of the populations (30). According to the National FINRISK study among 2049 Finns, MetS was present in 28.8% of men and in 22.2% of women in 2004 (66). In the Young Finns study, the overall prevalence of MetS increased from 1.0% in 1986 to 7.5% in 2001 among adults 24 years of age (67). Also the prevalence of childhood overweight and obesity is increasing globally, but the major problem with identifying the MetS in children and adolescents is that there are no established criteria for MetS in childhood or adolescence. In a recent review on the prevalence of pediatric obesity in 85 different studies during 2003-2013, the median prevalence of MetS was 3.3% in all populations combined, 11.9% in overweight children and 29.2% in obese children (68). The prevalence of MetS was higher in boys than in girls and also in older children than in younger children. Overweight and obesity were found to increase linearly in all sex and age groups from 1977 to 1999 among Finnish adolescents 1218 years of age (69). The age-standardized prevalence of overweight increased from 7.2% to 16.7% in boys and from 4.0% to 9.8% in girls between 1977 and 1999, whereas the prevalence of obesity increased from 1.1% to 2.7% in boys and from 0.4% to 1.4% in girls during the 22-year follow-up. According to another study, 10% of boys and 18% of girls were overweight or obese at the age of 5 years in 2006 (70). At the age of 12 years, 24% of the boys and 19% of the girls were overweight or obese. 7 2.2 Causes of metabolic syndrome 2.2.1 Genetic factors Several genome-wide scans performed in families with clustering of cardiometabolic risk factors have strongly supported an inherited component to MetS (71-73). In a study of 357 children and 378 parents, children who had at least one parent with MetS, defined by The Adult Treatment Panel III criteria, had higher levels of obesity and insulin resistance than children in whom neither parent had MetS (74). Moreover, the Bogalusa Heart Study has shown that offspring of parents with early coronary heart disease were overweight beginning in childhood and developed an adverse cardiovascular risk factor profile at an increased rate (75). Also other family and twin studies have found strong familial aggregation for cardiometabolic risk factors (76-79). 2.2.2 Low physical activity, sedentary behavior and poor cardiorespiratory fitness The current epidemic of overweight and MetS is mainly due to an imbalance between energy intake and energy expenditure. Low levels of physical activity increase the risk of MetS, type 2 diabetes, CVD and all-cause mortality in adults (80,81). The risk of developing these diseases can be reduced by increasing the levels of physical activity and cardiorespiratory fitness measured by maximal oxygen uptake (82-85). Low levels of physical activity and cardiorespiratory fitness have been associated with increased levels of independent and clustered metabolic risk factors also among adolescents and children (61,86-89). Habitual physical activity is progressively decreasing, whereas time spent in sedentary activities, such as watching TV and playing on computer, is increasing also among children in Finland (90). Sedentary lifestyle has resulted in a decline in cardiorespiratory and musculoskeletal fitness. However, the independent role and relative importance of physical activity and sedentary in the development of childhood overweight, MetS and associated adverse health consequences as well as underlying biological mechanisms are still largely unknown. 2.2.3 Dietary factors The role of diet in the development of MetS is not well understood. Western dietary pattern and the consumption of meat and fried foods have been directly related to the risk of MetS, whereas the consumption of whole-grain products, fruit, vegetables and dairy products have been inversely associated with it (91-93). Weight loss has been observed to be effective in the treatment of the components of MetS, including excessive body adiposity, insulin resistance, dyslipidemia and elevated blood pressure (94). The Finnish Diabetes Prevention Study revealed that even a modest weight loss reduced the prevalence of MetS in 522 middle-aged overweight men and women with impaired glucose tolerance (95). The Diabetes Prevention Program in USA showed that an intensive lifestyle intervention reduced the incidence of MetS by 41% in among 3000 adults (96). Also data on the role of dietary factors in the development of overweight and obesity among children are both limited and inconsistent (97,98). However, a high consumption of low-quality food, sugar-sweetened beverages, snacks and sweets, unfavorable meal patterns as well as emotional overeating and food responsiveness have been associated with overweight in children (99-101). Recent results from the Physical Activity and Nutrition in Children (PANIC) Study suggested that promoting a regular consumption of main meals, decreasing the consumptions of sugar-sweetened beverages and low-fat margarine and increasing the consumption of vegetable oils should be emphasized to reduce metabolic risk among children (101,102). 2.2.4 Other factors Other potential risk factors underlying MetS might be epigenetic factors as well as overnutrition of fetus resulting in increased birth weight and low birth weight associated 8 with rapid catch-up growth (103-106). Exposure of the fetus to gestational diabetes of the mother increases the risk of MetS (107). Also cigarette smoking and excess alcohol consumption have been linked to increased cardiometabolic risk (108,109). Moreover, poor socioeconomic state and psychosocial background have been associated with MetS (110,111). Furthermore, health-related policy such as focus on early prevention plays fundamental role in reducing overweight and obesity and related clustering of cardiometabolic risk factors. 2.3 The pathophysiology of metabolic syndrome 2.3.1 Excess fat accumulation Long-term positive energy balance results in increased triglyceride storage in adipose tissue (112). In addition to adipocytes, adipose tissue constitutes of stromal fraction including preadipocytes, fibroblasts, vascular cells and immune cells. Adipose tissue is mainly found in subcutaneous and visceral depots (113). The sites of ectopic fat accumulation include the muscle (114), liver (115), heart (116), pancreas (117) and the adventitia of blood vessels (118). Visceral adipose tissue has been associated with greater cardiometabolic risk compared to subcutaneous adipose tissue in all age groups (119-122). Increased lipolysis in adipose tissue caused by adipose tissue insulin resistance results in increased plasma free fatty acid (FFA) levels which further disrupt lipid metabolism (123). The increased FFA flux impairs liver metabolism, leading to increased hepatic production of glucose and triglyceride-rich lipoproteins (124). Further, the elevated plasma levels of FFA also induce insulin resistance in the skeletal muscle by inhibiting insulin-mediated glucose uptake (125). Ectopic fat accumulation in the pancreas impairs β-cell function and thereby insulin secretion (126). Recently, adipose tissue has emerged as an endocrine organ secreting hormones that regulate metabolism and appetite (127). It secretes a large number of proteins that modulate glucose metabolism and insulin action. Excess fat accumulation results in “bad talk” between adipocytes and immune cells and an increased secretion of numerous proinflammatory mediators like tumor necrosis factor alpha, interleukin-6 and C-reactive protein (CRP). Adipocytokines integrate the endocrine, autocrine and paracrine signals that mediate insulin sensitivity, oxidant stress, energy metabolism, blood coagulation, and inflammatory responses, which are thought to accelerate atherosclerosis, plaque rupture, and atherothrombosis (128). Moreover, metabolically dysfunctional adipose tissue is susceptible to adipocyte necrosis, contains M1-macrophages and impairs vascular function (129). Visceral adipose tissue has higher inflammatory activity compared to subcutaneous adipose tissue. In addition to secretion of inflammatory mediators related to low-grade inflammation, excess fat accumulation results in increased secretion of several other adipokines such as leptin and decreased secretion of adiponectin (130). Leptin is involved in the regulation of satiety and hunger. Adiponectin regulates lipid and glucose metabolism, increases insulin sensitivity, regulates food intake and body weight, protects against a chronic inflammation and has antiatherogenic actions. 2.3.2 Insulin resistance and hyperglycemia Insulin resistance is increased in overweight and obese individuals and is often seen as the core feature of MetS (113,131). The main physiologic effects of insulin include increase in skeletal muscle glucose uptake and suppression of hepatic glucose production and adipose tissue lipolysis (29). Insulin resistance is a general term meaning that insulin does not exert its normal effects in insulin-sensitive target tissues, such as skeletal muscle and adipose tissue (132). As previously discussed, insulin resistance in adipose tissue manifests itself as the inability to suppress lipolysis, which leads to an influx of FFAs to the liver, skeletal muscle 9 and other organs leading to insulin resistance in these tissues (133). Also the large number of adipokines secreted by adipose tissue modulate insulin sensitivity (130). Insulin resistance in the liver increases gluconeogenesis and decreases glycogen synthesis resulting in fasting hyperglycemia (134). Insulin resistance in the liver and adipose tissue also drives the development of dyslipidemia, which is discussed in more detail in chapter 2.3.3. The majority of peripheral glucose uptake and further metabolism takes place in the skeletal muscle. Increased plasma FFA levels disrupt glucose-fatty acid cycle and insulin-mediated glucose uptake in the muscle (133). However, in nondiabetic state, this resistance is compensated by increased insulin secretion from the pancreatic β-cells. If pancreatic insulin secretion fails, insulin resistance in skeletal muscle increases hyperglycemia. The more insulin resistant a person, the more insulin must be secreted to prevent decompensation of glucose tolerance (135). If the compensatory mechanisms fail, the subsequent hyperglycemia and glucotoxicity will further worsen the insulin resistance and islet β-cell insulin secretion. Insulin resistance also further worsens the low-grade inflammatory state, induces endothelial dysfunction in the arteries and elevates blood pressure (132). Moreover, insulin resistance decreases signaling in the hypothalamus which leads to increased food intake and weight gain (136). 2.3.3 Dyslipidemia It is currently unknown whether insulin resistance induces dyslipidemia or whether these risk factors are associated via a common underlying cause (12). Increased hepatic FA intake stimulated by insulin resistance leads to increased production of VLDL-triglycerides and apolipoprotein B. Apolipoprotein B is a marker of triglyceride-rich lipoproteins and retards triglyceride clearance (137). Increased liver fat content is associated with overproduction of VLDL from the liver due to lack of insulin-induced suppression of VLDL production (138). In addition to overproduction of VLDL by the liver, alterations in lipoprotein lipase activity have been associated with MetS (29). Moreover, circulating HDL cholesterol levels fall for sake of its overconsumption and the density of LDL increases in MetS. The small dense LDL is potentially atherogenic owing to its low affinity to the LDL receptor and long retention time in the circulation (29,139). 2.3.4 Elevated blood pressure The role of blood pressure in the pathophysiology of MetS is not fully understood but several mechanisms have been suggested. Obesity has been associated with increased sympathetic tone which raises blood pressure (12). Furthermore, both insulin and leptin appear to increase sympathetic nervous activity. Also, in the setting of insulin resistance, the vasodilatory effect of insulin can be lost resulting in endothelial dysfunction and vasoconstriction (140). Moreover, hyperinsulinemia leads to increased sodium absorption in the kidneys that increases blood volume and thereby blood pressure (29,141). It has also been hypothesized that LDL cholesterol and triglycerides may damage the endothelium, impair nitric oxide release and cause endothelial dysfunction. This suggests that dyslipidemia could cause hypertension by mechanisms only partly related to obesity and insulin resistance (142,143). 2.4 Consequences of metabolic syndrome 2.4.1 Type 2 diabetes and its complications MetS is associated with a marked increase in risk for type 2 diabetes (1,7), which is characterized by chronically elevated blood glucose concentrations resulting from insulin resistance and reduced insulin secretion. A typical situation is relative insulin deficiency due to inability to adequately compensate for insulin resistance. Type 2 diabetes is a heterogeneous disease and its clinical expression requires both genetic and environmental factors (144). Nevertheless, most patients have insulin resistance and MetS before the onset 10 of type 2 diabetes (145). The progression of type 2 diabetes is preceded by overweight, obesity, insulin resistance and dyslipidemia in 75 to 85% of patients (29,144). The risk of CVD events is much higher in patients with type 2 diabetes than in non-diabetic subjects (146-148). Other common complications of type 2 diabetes include retinopathy, nephropathy and neuropathy, which also predict CVD (149-151). In recent years, also the prevalence of type 2 diabetes in children and adolescents has increased (152). Also, childhood MetS is known to predict type 2 diabetes (6). The main causes and consequences of MetS are presented in Figure 2. Genetic factors Physical inactivity Excess energy intake Other factors Abdominal adiposity Dyslipidemia Low-grade inflammation Atherosclerosis Myocardial infarction Ectopic fat accumulation Insulin resistance Non-alcoholic fatty liver disease Elevated liver enzymes Type 2 diabetes Elevated blood pressure Ischemic stroke Figure 2. The main causes and consequences of metabolic syndrome 2.4.2 Increased liver fat content NAFLD, recognized as the hepatic manifestation of the MetS (153,154), is rapidly becoming the most common chronic liver condition in many parts of the world and a major cause of liver-related morbidity and mortality. NAFLD includes histological spectrum of subtypes, ranging from simple steatosis (hepatic steatosis in the absence of histological evidence of hepatocellular damage) to NASH (steatosis with associated inflammation and hepatocyte damage with or without fibrosis). The clinical course of NAFLD depends upon its histological subtype; hepatic steatosis has generally a benign long-term prognosis whereas NASH can progress to cirrhosis with possible progression to end stage liver disease and hepatocellular carcinoma (155,156). The pathophysiology of NAFLD is poorly understood but the “two-hit” hypothesis has been widely accepted (153). The first-hit, caused by insulin resistance leads to increased flux of FA from adipose tissue to the liver causing subsequent accumulation of triglycerides 11 in the hepatocytes. The “second-hit”, oxidative stress, activates inflammatory cytokines and generates reactive oxygen species which can cause cell injury and fibrosis due to formation of lipid peroxidation products. A liver containing excess fat is also insulin resistant and overproduces glucose and VLDL, which leads to hyperglycemia, hypertriglyceridemia, and a low HDL cholesterol concentration (153). In patients with MetS liver fat content has been found to be up to 4-fold higher than in those without MetS (115) and the incidence of NAFLD has been observed to be increased 4-fold in men and 11-fold in women with MetS (157). Also the other way round, NAFLD is a strong predictor of MetS (158). The definitive diagnosis of NAFLD requires liver biopsy with evidence of fat with or without inflammation or fibrosis and minimal or no alcohol intake. Presumptive diagnosis of NAFLD is based on elevated serum or plasma levels of liver enzymes aspartate aminotransferase, ALT and gamma-glutamyltransferase (GGT), or evidence of liver adiposity in ultrasonography, computed tomography or magnetic resonance imaging (MRI), minimal or no alcohol intake and negative results in examinations for viral hepatitis, congenital liver disease, autoimmune disease and other liver and biliary diseases (159). Among adults the prevalence of NAFLD ranges from 3% to 36% in the general population, depending on its screening method. The prevalence of NAFLD is particularly high among individuals with obesity (95%) and type 2 diabetes (50- 70%) (160). African Americans and Hispanics have a higher prevalence of NAFLD than other ethnic groups. Older age, diabetes, and obesity worsen the prognosis of NAFLD. Also genetic factors may play an important role. The prevalence of NAFLD is increasing also in children and adolescents due to increased prevalence of overweight and obesity in these age groups (19). However, the true prevalence of NAFLD among children and adolescents is unknown and there are no established criteria for abnormal plasma ALT levels due to lack of population-based studies in children and adolescents (161). Study from autopsies of 742 children aged 2-19 years reported the prevalence of NAFLD to be 9.6% and in obese children this rate was 38% (162). Two-thirds of children with NAFLD have evidence of NASH on liver biopsy and are at risk for progressive liver disease (163). There is also evidence for a relationship between MetS and NAFLD among children. The presence of MetS was associated with severity of steatosis among Korean adolescents (164). Furthermore, a study among Italian children and adolescents showed that two thirds of those with NAFLD had MetS (165). Few previous studies have also found an association of MetS and its components even with high-normal levels of liver enzymes in children (166,167). Homeostatic model assessment (HOMA) insulin resistance was associated with GGT levels at reference range among overweight and obese Pima Indian children (166). Components of Mets and their clustering were associated with serum ALT levels at reference range among pre-adolescents and adolescents from Louisiana (167). Furthermore, Bogalusa Heart Study among young adults showed that high-normal values of ALT and GGT persisted over time and related to clinically relevant adverse cardiovascular risk profile (168). PNPLA3 gene variant and liver adiposity A genome-wide association study in a population of Hispanic, African American and European American adults showed that those with a cytosine-to-guanine (C→G) substitution (rs738409) that changes codon 148 from isoleucine to methionine in the adiponutrin/patatin-like phospholipase domain-containing 3 (PNPLA3) gene had an increased liver fat content and hepatic inflammation (24). The PNPLA3 gene is expressed in the liver and adipose tissue and the C→G substitution has been suggested to cause a loss of function of the PNPLA3 gene thereby limiting triglyceride hydrolysis in hepatocytes and promoting liver triglyceride accumulation (169,170). Thereafter, other studies have provided further evidence that the PNPLA3 gene I148M polymorphism is strongly associated with liver fat content and plasma ALT levels in obese adults and children (171174). Studies in obese adults and children have also suggested that the PNPLA3 gene I148M 12 variant is related to the severity of hepatic steatosis and the presence of NASH and fibrosis (174,175). The PNPLA3 148M allele has not been generally associated with the components of MetS, such as measures of body adiposity and lipid and and glucose metabolism (28,174,176,177). However, the results of some studies in children have suggested that the 148M allele carriers have lower plasma levels of HDL cholesterol and a lower BMI than the non-carriers (28,176). It has been suggested that the increased amount of body fat may act as a stressor on the PNPLA3 148M carriers thereby influencing the susceptibility to increased circulating liver enzymes (25,177). Studies related to the PNPLA3 gene polymorphism have been mostly carried out in obese patients with NAFLD and mainly in adult populations. Studies in obese children have shown that the PNPLA3 148M allele carriers have higher plasma ALT levels than the noncarriers (177,178). One previous study in a Hispanic population, in which the PNPLA3 risk allele is most common, showed that the 148M allele was associated with increased plasma ALT levels not only in overweight or obese children but also in normal weight children (28). Two studies among children showed associations of the PNPLA3 gene I148M variant with hepatic fat content and the severity of NAFLD but no relationship to plasma ALT levels (174,179). The researchers speculated that lack of association with plasma ALT levels may have been due to small sample sizes. Evidence on the associations of the PNPLA3 gene polymorphism with measures of liver fat accumulation among children in previous studies are presented in Table 3. In general, more studies are needed to gain better understanding on the biological functions and pathogenetic mechanisms of this genetic variant with regard to liver adiposity (23). Table 3. The associations of the PNPLA3 I148M gene polymorphism with measures of liver fat accumulation among children in previous studies Reference Study population Association Larrietta-Carrasco et.al. 2013 (28) 1037 normal weight and overweight or obese Mexican children 1048 obese Italian children or adolescents 475 overweight or obese Italian children and adolescents 85 obese adolescents PNPLA3 148M allele was associated with increased ALT levels Giudice et.al. 2011 (177) Romeo et.al. 2010 (178) Santoro et.al. 2010 (179) Valenti et.al. 2010 (174) PNPLA3 148M allele was associated with increased ALT levels PNPLA3 148M allele was associated with increased ALT levels PNPLA3 148M allele was not associated with ALT levels but was related to higher hepatic fat content 149 Italian children or adolescents with NAFLD PNPLA3 148M allele was not associated with ALT levels but was related to the severity of NAFLD ALT=Alanine-amino transferase; NAFLD= Non-alcoholic fatty liver disease 2.4.3 Atherosclerosis and atherosclerotic cardiovascular diseases In adults MetS has been strongly associated with subclinical atherosclerosis, as estimated by carotid artery intima-media thickness (IMT) (180) and atherosclerotic lesions using noninvasive ultrasonography (181,182). Previous studies have shown that cardiometabolic risk factors in childhood predict increased adult carotid IMT (183) as well as decreased carotid artery elasticity (184). Furthermore, cross-sectional studies have demonstrated that young adults aged around 30 years with MetS have increased IMT and decreased carotid artery elasticity (67). MetS is associated with increased risk for CVD in next 5 to 10-years and the lifetime risk is undoubtedly higher (1). In the Atherosclerosis Risk in Communities study the risk for coronary heart disease over 11 years increased with the number of MetS components present (180). In another study also the amount of coronary calcification increased by the number of MetS risk factors (185). MetS has also been associated with increased risk of 13 acute ischemic stroke or transient ischemic attack. Individuals with MetS but without diabetes had a 1.5 times higher risk of ischemic stroke or transient ischemic attack compared with patients without MetS. This risk was higher in women than in men (186). In the KIHD study, middle-aged men without previous history of CVD were followed up for 11 years, and those with MetS were three to four times more likely to die of coronary heart disease, about three times more likely to die of CVD and about two times more likely to die from all causes (10). Similar results have been found in other previous studies in Finland (187), USA (188), and the Netherlands (189). Despite the predictive value of MetS for type 2 diabetes (7), CVD (8,9) and CVD as well as all-cause mortality (10) in adults, it still remains unclear, whether MetS has prognostic value over its individual components (52,190). Furthermore, the MetS is not an absolute risk indicator, because it does not contain many of the factors that determine absolute risk, for example, age, sex, cigarette smoking and low-density lipoprotein (LDL) cholesterol levels (1). 2.4.4 Other manifestations of metabolic syndrome Other well-known manifestations of MetS include polycystic ovarian syndrome in women and obstructive sleep apnea (29). Polycystic ovarian syndrome is characterized by anovulation, androgen excess and insulin resistance (191). Women with polycystic ovarian syndrome have been found to have increased risk for developing type 2 diabetes and CVD. The pathophysiology of polycystic ovarian syndrome is unclear, but the ovary, hypothalamic-pituitary axis and insulin are likely to play a major role in it (192). Obstructive sleep apnea has been associated with excess body fat content, insulin resistance and other features of MetS (193,194). Moreover, individuals with obstructive sleep apnea are at increased risk for CVD morbidity and mortality (195). Several other disorders and symptoms such as dementia, depression, osteoarthritis, pulmonary embolism, gallbladder disease, asthma and many cancers have been associated with overweight and obesity (196198). 14 3 Aims The specific aims of the study were: 1. to investigate the associations of the clustering of cardiometabolic risk factors as well as individual risk factors with plasma levels of liver enzymes ALT and GGT in prepubertal children (Study I). 2. to validate the cardiometabolic risk score by confirmatory factor analysis in children, middle-aged men, and older women and men and by investigating the relationships of the cardiometabolic risk score to incident type 2 diabetes, myocardial infarction, and premature cardiovascular and overall death in middle-aged men (Study II). 3. to investigate the associations of the I148M polymorphism of the PNPLA3 gene with plasma levels of ALT and GGT in normal weight and overweight children (Study III). 15 4 Methods 4.1 Study populations and designs 4.1.1 PANIC Study The Physical Activity and Nutrition in Children (PANIC) study is an ongoing exercise and diet intervention study in a population sample of children from the city of Kuopio, Finland (NCT01803776). Altogether 736 children 6-8 years of age who started the first grade in primary schools of Kuopio in 2007–2009 were invited to participate in the baseline examinations in 2007- 2009. Of the 736 invited children, 512 (70%) participated at baseline examinations and were divided in intervention and control groups. Families in the intervention group met an exercise specialist and an authorized nutritionist seven times during the first two years. The exercise specialist and the nutritionist gave the children and their parents detailed and individualized instructions on health promoting physical activity and diet at months 0, 1.5, 3, 6, 12, 18, and 24 with a specific topic at each visit. Altogether 440 (86%) children took part also at 2-year follow-up examinations 2009-2011. A less intensive intervention in the intervention group will continue until adulthood. The 8-year follow-up will be performed in 2015-2017 and the 13-year follow-up in 2020-2022. The study protocol was approved by the Research Ethics Committee of the Hospital District of Northern Savonia. Both children and their parents gave their written informed consent. The associations of the cardiometabolic risk score and single cardiometabolic risk factors with plasma levels of ALT and GGT in 492 prepubertal children with complete data on variables needed in the analyses were investigated in Study I (Table 4). Whether MetS represents a single entity in population samples of children, middle-aged men, older women and older men from Finland and whether the cardiometabolic risk score predicts the development of type 2 diabetes, myocardial infarction, ischemic stroke as well as premature CVD and total mortality during a long-term follow-up in middle-aged men were investigated in Study II. Altogether 491 children from PANIC study with complete data on variables needed for the analyses were included in the Study II. The associations of the I148M polymorphism in the PNPLA3 gene with plasma levels of ALT and GGT at baseline and with changes in plasma ALT and GGT levels during 2-year follow-up were studied among normal weight and overweight children in Study III. The final study population included 481 Caucasian children aged 6-8 years examined at baseline and 419 children reexamined after 2-year follow-up with complete data on variables needed for the analyses. 16 Table 4. Study populations and designs Participants Design 492 children cross-sectional The Physical Activity and Nutrition in Children Study Study I (232 girls, 260 boys) Study II 491 children cross-sectional (232 girls, 259 boys) Study III 481 children cross-sectional (227 girls, 254 boys) 407 children prospective 1900 men cross-sectional 790 men prospective (type 2 diabetes) 1209 men prospective (myocardial infarctions, The Kuopio Ischemic Heart Disease Risk Factor Study Study II ischemic strokes, coronary deaths, cardiovascular deaths and deaths in total) The Dose-Responses to Exercise Training Study Study II 1169 individuals (614 women, 555 men) cross-sectional 4.1.2 KIHD Study The Kuopio Ischemic Heart Disease Risk Factor (KIHD) study is an ongoing population study designed to investigate risk factors for CVD and related outcomes. The study population constituted a population sample of men who lived in the town of Kuopio or neighboring rural communities and who were 42, 48, 54, or 60 years of age at baseline 19841989. Potential participants were randomly selected from the national population register. Of 3235 eligible men, 2682 (83%) participated in the study (10). The Research Ethics Committee of the Hospital District of Northern Savonia approved the study protocol. All participants gave their written informed consent. The final study population of Study II included 1900 middle-aged men from the KIHD Study with complete data on variables needed for the analyses after excluding those with a history of type 2 diabetes (Table 4). The follow-up data for type 2 diabetes were available for 790 men who participated in the 11year follow-up and had no type 2 diabetes at baseline. The follow-up data for myocardial infarctions, ischemic strokes, coronary deaths, cardiovascular deaths and deaths were available in total for 1209 men after excluding men with history of type 2 diabetes, coronary heart disease, stroke or cancer. 17 4.1.3 DR’s EXTRA Study The Dose-Responses to Exercise Training (DR’s EXTRA) study is a 4-year randomized controlled trial on the health effects of regular physical exercise and diet (ISRCTN45977199, http://isrctn.org) in a population sample of 1476 men and women who were 57-78 years of age, lived in the city of Kuopio in Finland, participated in the baseline examinations in 2005-2006 and were randomized into one of the six study groups at baseline (84). The study protocol was approved by The Research Ethics Committee of the Hospital District of Northern Savonia. All participants gave their written informed consent. The final study population of Study II included 614 older women and 555 older men from the DR’EXTRA Study with complete data on variables needed for the analyses after excluding those with a history of type 2 diabetes (Table 4). 4.3 Assessments 4.3.1 Assessments in the PANIC study Body fat percentage and body lean mass were assessed by the Lunar® dual energy X-ray absorptiometry (DXA) device (Lunar Prodigy Advance; GE Medical Systems, Madison, Wisconsin, USA) with the child empty-bladdered and lying in light clothing without metal objects. Body weight was assessed twice by the InBody® 720 bioelectrical impedance device (Biospace, Seoul, Korea) to accuracy of 0.1 kg after overnight fasting with the child emptybladdered and standing in light underwear. The mean of these two values of body weight was used in statistical analyses. Body height was assessed three times in the Frankfurt plane without shoes by a wall-mounted stadiometer to accuracy of 0.1 cm. The mean of the nearest two values was used in statistical analyses. BMI was calculated as body weight (kg) divided by body height (m) squared. BMI-SDS was computed by the Finnish references (199). Overweight and obesity were defined using the age- and sex- specific BMI cutoffs of the International Obesity Task Force (IOTF) criteria (200). Waist circumference was assessed three times after expiration at mid-distance between the bottom of the rib cage and the top of the iliac crest with an unstretchable measuring tape to accuracy of 0.1 cm. The mean of the nearest two values was used in statistical analyses. The children were asked to fast for 12 hours before blood sampling. Biochemical analyses were done using Cobas 6000 analyzers (Hitachi High Technology Co, Tokyo, Japan). A hexokinase method was used to analyze plasma glucose (201) (Roche Diagnostics Co, Mannheim, Germany). Within and between day coefficients of variation (CV) for the glucose analyses were 0.7 – 0.9 % and 1.5 – 1.8 %, respectively. Serum insulin was analyzed using electrochemiluminescence immunoassay with sandwich principle (202) (Roche Diagnostics Co). Within and between day CV for the insulin analyses were 1.3%–3.5 % and 1.6%–4.4 %, respectively. A colorimetric enzymatic assay was used to analyze plasma total cholesterol and plasma triglycerides (203) (Roche Diagnostics Co). Within and between day CV for the cholesterol analyses were 1.0%-1.4 % and 1.2%–3.1% and for the triglyceride analyses 0.9%–4.2% and 1.4%–2.4%, respectively. Homogeneous enzymatic colorimetric assays were used to analyze HDL and LDL cholesterol (204,205) (Roche Diagnostics Co). Within and between day CVs for the HDL analyses were 1.1%–1.3% and 0.9%–1.2% and for the LDL cholesterol analyses were 1.3%–4.3 % and 1.7%–2.7%, respectively. Plasma highsensitivity hsCRP was measured using enhanced immuno-turbidimetric assay with CRP (Latex) High Sensitive Assay reagent (206) (Roche Diagnostics Co). The limit of detection was 0.15-0.20 mg/l. A kinetic method according to The International Federation of Clinical Chemistry was used to analyze plasma levels of ALT and GGT (207,208) (Roche Diagnostics GmbH Co). Within and between day CVs for the ALT analyses were 0.6%-1.6% (15 – 125 U/l) and 1.3%–4.4% (42 – 136 U/l), respectively. The within and between day CVs for the GGT analyses were 0.0%–0.4% (15 – 201 U/l) and 1.0%–2.0 % (45 – 231 U/l), respectively. Blood pressure was measured manually by a calibrated aneroid sphygmomanometer (HEINE GAMMA G7, Germany). The measurement protocol included, after a rest of five 18 minutes, three measurements in the sitting position at 2-minute intervals. The mean of all three values was used as the systolic and diastolic blood pressure in statistical analyses. Habitual physical activity during a usual week was assessed by the PANIC Physical Activity Questionnaire administered by the parents at home. The types of physical activity included organized sports, structured exercise, unstructured physical activity, commuting to and from school and physical activity during recess. The frequency of each type of physical activity, expressed in sessions per week, and the duration of a single session of each type of physical activity were asked. The amount of each physical activity type was calculated by multiplying frequency with duration and was expressed in minutes per day. The amount of total physical activity was calculated by summing the amounts of each physical activity type and was expressed in minutes per day. All children in the first grade had 90 minutes of physical education per week that was added to the total physical activity. Habitual sedentary behavior during usual five weekdays and two weekend days was also assessed by the PANIC Physical Activity Questionnaire administered by the parents at home. The types of sedentary behavior included watching TV and videos, using a computer and playing video games and mobile games, listening to music, playing a musical instrument, reading, writing, drawing, doing arts and crafts, playing board games and sitting and lying. The amount of total sedentary behavior was calculated by summing the times spent in each sedentary behavior and was expressed in minutes per day weighted by the number of weekdays and weekend days. The PANIC Physical Activity Questionnaire was validated using the Actiheart monitor combining heart rate and accelerometry measurements (Actiheart, CamNtech, Cambridge, UK) in a subsample of 38 children examined at baseline of the PANIC Study. Total physical activity measured by the questionnaire correlated positively with total physical activity measured by the Actiheart monitor (r=0.37, p=0.033). Dietary intake was assessed by food records of four consecutive days that consisted of two weekdays and two weekend days (99.5% of children), or three weekdays and one weekend day (0.5% of children) (101). The parents were instructed to record all food and drink consumption of their children and to ask their children about their food consumption outside home. The schools and afterschool clubs were asked about the type and preparation of the served food. When the parents returned the records, clinical nutritionists checked the records and filled in missing information with them. The food records were analysed using the Micro Nutrica dietary analysis software (version 2.5, The Social Insurance Institution of Finland, Turku, Finland), with the food composition data from national analyses and international food composition tables (209). Vitamin and mineral supplements were not included in these analyses. Meals were defined by clinical nutritionists according to the recorded time and the type of food individually for each child, taking into account the whole meal pattern of the child. The presence of chronic diseases and acute infections and the use of medications in children were assessed by a questionnaire administered by the parents. The rs738409 polymorphism in the PNPLA3 gene was genotyped by a TaqMan probe (Applied Biosystems, Foster City, CA) according to the manufacturer’s protocol. 4.3.2 Assessments in the KIHD study Waist circumference was calculated as the average of two measurements taken after inspiration and expiration at the midpoint between the lowest rib and iliac crest. BMI was calculated as body weight (kg) divided by body height (m) squared. The participants were asked to fast and to refrain from smoking for 12 hours and to avoid alcohol intake for three days before blood sampling. Blood glucose was measured using a glucose dehydrogenase method after precipitation of proteins by trichloroacetic acid. Fasting serum insulin was measured with a radioimmunoassay (RIA) (Novo Biolabs; Novo Nordisk, Bagsvaerd, Denmark). The between-batch CV was 8.9% at 9.1 mU/l and 17.5% at 30.9 mU/l. At the follow-up, insulin was determined by RIA (Pharmacia 19 Diagnostics, Uppsala, Sweden). The between-batch CV was 6.7% at 14.5 mU/l and 5.4% at 40.3 mUl. LDL and HDL fractions were separated from fresh serum by combined ultracentrifugation and precipitation. The cholesterol contents of serum lipoprotein fractions and triglycerides were measured enzymatically (Boehringer Mannheim, Mannheim, Germany). Blood pressure was measured with a random-zero mercury sphygmomanometer. The mean of six measurements (3 while supine, 1 while standing, and 2 while sitting) of systolic and diastolic blood pressure was used. Incident type 2 diabetes was defined as fasting blood glucose ≥6.1 mmol/liter or a clinical diagnosis of diabetes with either dietary, oral, or insulin treatment. All deaths and incident cardiovascular events were checked against hospital documents, health center wards and death certificates. The use of blood pressure medication, smoking, alcohol consumption and socioeconomic status were assessed by a self-administered questionnaire. 4.3.3 Assessments in the DR’s EXTRA study Waist circumference was calculated as the average of two measurements taken at middistance between the bottom of the rib cage and the top of the iliac crest. BMI was calculated as body weight (kg) divided by body height (m) squared. The participants were asked to fast and to refrain from smoking for 12 hours and to avoid exercise for one day and alcohol intake for three days before blood sampling. Plasma glucose was measured by a hexokinase method (Glucose, Thermo Clinical Labsystems Oy, Finland). Serum insulin was measured using ELISA kit (Mercodia, Uppsala, Sweden). Serum total cholesterol (Cholesterol, Thermo Electron Corporation, Finland) and serum triglycerides (Triglycerides, Thermo Electron Corporation, Finland) were analyzed by enzymatic photometric methods. Serum HDL cholesterol was analyzed using a direct enzymatic photometric method (HDL cholesterol, Thermo Electron Corporation, Finland). Serum LDL cholesterol was analyzed by a direct enzymatic photometric method (LDLCholesterol, Thermo Electron Corporation, Finland). Blood pressure was measured with a calibrated mercury sphygmomanometer or a desk aneroid sphygmomanometer in a sitting position after a 5-minute rest at 1-minute intervals and the mean of two consecutive measurements of systolic and diastolic blood pressure was used in statistical analyses. Incident type 2 diabetes was defined as fasting blood glucose ≥6.1 mmol/liter or a clinical diagnosis of diabetes with either dietary, oral, or insulin treatment. The use of blood pressure medication was assessed by a self-administered questionnaire. 4.3.4 Cardiometabolic risk score A continuous cardiometabolic risk score variable was computed similarly to previously published scores (61) using continuous z-score variables by the following formula: waist circumference + insulin + glucose - HDL cholesterol + triglycerides + the mean of systolic and diastolic blood pressure. A higher score indicates a less favorable cardiometabolic risk profile. 4.4 Statistical analyses Study I Before all statistical analyses variables were logarithmically transformed or square-root transformed to normalize skewed distributions if necessary. Differences in basic characteristics between sexes were compared by the independent samples t-test. Associations between the features of MetS were analyzed by partial correlations adjusted for age, sex and body height. The risk of having ALT and GGT in the highest fifth of their distributions in the sex-specific thirds of MetS and its components were analyzed using 20 binary logistic regression models after adjustment for age and body height. Because acute infections and chronic inflammatory diseases increase circulating hsCRP levels, only plasma hsCRP values below 10 mg/l were included in the analyses. Additional adjustments were also made for other components of MetS, body lean mass, physical activity, time spent on computer or watching TV as well as the intake of saturated and unsaturated fatty acids. We also repeated these analyzes by excluding children with chronic diseases and medications which could increase liver enzymes. The factor analyses were carried out entering waist circumference, fasting insulin, glucose, HDL cholesterol and triglycerides as well as systolic and diastolic blood pressure, which are generally considered the main features of MetS, as well as ALT, GGT and hsCRP, which were of particular interest, in the models. To normalize skewed distributions, natural logarithmic transformation for waist circumference, triglycerides, ALT, GGT and hsCRP and square root transformation for insulin was used. All variables were adjusted by age, sex and height before the factor analyses. The principal factor analysis was used for the extraction of the initial factors. Only factors with eigenvalues over 1.0, were retained in the analysis because these factors have more than one variable in it. The promax rotation that allows the variables to correlate with each other was used to assess possible underlying pathophysiological relationships. For the interpretation of the factors, variables having a correlation coefficient of ≥0.40 were considered to be heavily loaded and those having a correlation coefficient of 0.30–0.39 to be moderately loaded on the factors (10,143). Associations with a P-value of <0.05 were considered statistically significant. The statistical analyses were performed with the SPSS software for Windows, Version 19.0 (IBM SPSS Statistics, Chicago, IL, USA). Study II Before statistical analyses, continuous variables with skewed distributions were logarithmic or square-root transformed as appropriate. Differences in continuous variables between genders were analyzed with the independent samples t-test. The goodness of fit to the observed data was analyzed by χ2 tests, the comparative fit index (CFI), and the root mean square of approximation (RMSEA). CFAs were carried out using continuous z score variables adjusted for age, sex and body height in the PANIC Study, for age group in the KIHD Study, and for age separately in women and men in the DR’s EXTRA Study. Second-order CFAs were also carried out in which the MetS was represented by a second-order latent variable underlying four latent variables characterized by adiposity, insulin resistance and glycaemia, dyslipidemia and raised blood pressure. These four latent variables in turn underlay eight measured variables used in the model: BMI, waist circumference, insulin, glucose, triglycerides, HDL cholesterol, systolic blood pressure and diastolic blood pressure. These second-order CFA models were similar in concept to the hierarchical CFA tested by Shen and coworkers (49). Also first-order CFAs were carried out with models that have been used before (17,48,50). In the first model, proposed by Pladevall et al (50), the MetS was hypothesized to underlie abdominal obesity, insulin resistance, dyslipidemia and high blood pressure as represented by waist circumference, HOMA insulin resistance, the triglycerides to HDL cholesterol ratio and mean arterial pressure (MAP), respectively. In the second model, proposed by Martinez-Vizcaino et al (17), waist circumference, insulin, the triglycerides to HDL cholesterol ratio and MAP were included. In the third model, proposed by Li and Ford (48), waist circumference, insulin, triglycerides and systolic blood pressure were included. The associations of the MetS factor and the cardiometabolic risk score with incident type 2 diabetes during 11 years of follow-up in middle-aged men without diabetes at baseline were assessed with logistic regression models adjusted for age, family history of diabetes, prevalent CVD, smoking, alcohol intake and adult socioeconomic status. The relationships of the MetS factor and the cardiometabolic risk score with incident myocardial infarction, ischemic stroke as well as coronary, cardiovascular and total death in middle-aged men 21 were assessed with Cox proportional hazards regression models adjusted for age, family history of coronary heart disease, serum LDL cholesterol concentration, blood pressure medication, smoking, alcohol intake and adult socioeconomic status. The median follow-up time was 17.6 years for acute myocardial infarctions, 16.9 years for ischemic strokes and 17.9 years for coronary, cardiovascular and total deaths. Associations with a P-value of <0.05 were considered statistically significant. We used the SPSS Amos for Windows, Version 19 (Chicago, IL, USA) to perform the CFA. All other statistical analyses were performed with SPSS for Windows, Version 19.0. Study III Differences in basic characteristics between normal weight and overweight children were compared by the independent samples t-test. The Chi-Square test was used to verify whether the genotypes were in the Hardy-Weinberg equilibrium to find out if the observed genotype frequencies in the study population differ from the frequencies predicted by the equation (210). The associations of body fat percentage with plasma ALT and GGT levels were studied by linear regression analysis. Differences in plasma ALT and GGT levels among the genotypes were evaluated by the general linear models. General linear models were also used to test the determinants of plasma ALT and GGT levels. Data were adjusted for age, sex and body height. Data were additionally adjusted for waist circumference, clinical puberty, diseases and medications that could have effects on plasma ALT and GGT levels, the PANIC study group (intervention group versus control group), eating main meals regularly, the dietary intakes of carbohydrates, sucrose, and total, saturated, monounsaturated and polyunsaturated fat as percentages of energy intake, total physical activity and total sedentary behavior. Associations with a P-value of <0.05 were considered statistically significant. Statistical analyses were performed with the SPSS software for Windows, Version 19.0 (IBM SPSS Statistics, Chicago, IL, USA). 22 5 Results 5.1 Associations of cardiometabolic risk factors with plasma levels of liver enzymes (Study I) Body height, waist circumference, glucose and HDL cholesterol were higher whereas body fat percentage, insulin, triglycerides and LDL cholesterol were lower among boys than girls (Table 5). Altogether 14.2 % of the girls and 10.4% of the boys were overweight or obese. Table 5. Basic characteristics of children of the PANIC Study in Study I Age (years) Body height (cm) Body weight (kg) Body mass index BMI-SDSb Waist circumference (cm) Body fat percentage (% Fasting serum insulin (mU/l) Fasting plasma glucose (mmol/l) Total cholesterol (mmol/l) LDL cholesterol (mmol/l) HDL cholesterol (mmol/l) Triglycerides (mmol/l) SBP (mmHg) DBP (mmHg) ALT (U/l) GGT (U/l) hsCRP (mg/l) All (n=492) 7.6 (0.4) 128.7 (5.7) 26.8 (4.9) 16.1 (2.1) -0.20 (1.1) 56.6 (5.6) 19.6 (8.2) 4.5 (2.5) 4.8 (0.4) 4.3 (0.6) 2.4 (0.5) 1.60 (0.31) 0.59 (0.24) 100.1 (7.3) 61.8 (6.6) 18.5 (6.1) 11.7 (2.7) 0.64 (0.93) Girls (n=232) 7.6 (0.4) 127.7 (5.6) 26.4 (5.0) 16.1 (2.1) -0.18 (1.1) 55.9 (5.8) 22.4 (7.6) 4.8 (.3) 4.8 (0.4) 4.3 (0.6) 2.4 (0.5) 1.56 (0.31) 0.62 (0.25) 99.9 (7.6) 61.6 (6.7) 18.1 (5.3) 11.6 (2.6) 0.67 (0.84) Boys (n=260) 7.7(0.4) 129.6 (5.6) 27.1 (4.8) 16.1 (2.0) -0.22 (1.1) 57.2 (5.3) 17.1 (7.8) 4.3(2.6) 4.9 (0.4) 4.2 (0.6) 2.3 (0.5) 1.64 (0.31) 0.58 (0.23) 100.3 (7.1) 62.0 (6.5) 18.9 (6.7) 11.8 (2.7) 0.62 (0.62) P-valuea 0.217 <0.001 0.068 0.850 0.643 0.006 <0.001 0.010 0.001 0.155 0.033 0.007 0.038 0.507 0.495 0.143 0.397 0.365 Differences in means between girls and boys were analyzed with independent samples t-test. Data are presented as mean (standard deviation). ALT = alanine aminotransferase, GGT = gamma-glutamyltransferase; BMI-SDS = body mass index standard deviation score, based on Finnish reference values; DBP=diastolic blood pressure; LDL=lowdensity lipoprotein; HDL= SBP=systolic blood pressure high-density lipoprotein; hsCRP=high-sensitivity C-reactive protein; 23 The risk of having ALT in the highest fifth of its distribution increased with increasing sexspecific thirds of cardiometabolic risk score, body fat percentage, waist circumference and insulin adjusted for age and body height (Table 6). The risk of having GGT in the highest fifth of its distribution increased with increasing thirds of cardiometabolic risk score, body fat percentage, waist circumference, insulin, glucose and hsCRP adjusted for age and body height (Table 6). The associations of body fat percentage and waist circumference with ALT and GGT generally remained statistically significant after further adjustment for other components of MetS, except that the association of waist circumference with GGT was no longer statistically significant after adjustment for insulin (p=0.067). The relationships of other features of MetS generally were no longer associated with ALT and GGT after additional adjustment for fat percentage and waist circumference except that the association between fasting glucose and GGT remained even after controlling for body adiposity. Further adjustment for other features of MetS, body lean mass, total physical activity, time spent at computer and watching TV or the intake of saturated and unsaturated FA had little or no effect on these associations. Altogether 14.2 % of the girls and 10.4% of the boys were overweight or obese. Overweight or obese children had 2.1 (95% confidence interval 1.2-4.0, P=0.016) times higher risk of having ALT in the highest fifth of its distribution and 4.5 (95% confidence interval 2.4-8.2, p<0.001) times higher risk of having GGT in the highest fifth of its distribution than normal-weight children. 24 Table 6. The risk of having alanine aminotransferase (ALT) and gamma-glutamyltransferase (GGT) in the highest fifth of their distributions in sex-specific thirds of the cardiometabolic risk score and related individual risk factors (n=492) OR (95% CI) of having ALT in the highest fifth Cardiometabo lic risk score Body fat percentage Waist circumference Fasting serum insulin Fasting plasma glucose HDL cholesterol Triglycerides p for trend OR (95% CI) of having GGT in the highest fifth low (girls <-1.5; boys <-1.9) 1.0 (reference) 1.0 (reference) medium (girls -1.50.9; boys -1.9-1.3) 1.0 (0.6-1.9) 1.4 (0.8-2.7) high (girls >0.9; boys >1.3) 1.8 (1.0-3.1) low (girls <18.4; boys <12.3) 1.0 (reference) 1.0 (reference) medium (girls 18.424.2; boys 12.3-18.7) 1.5 (0.8-2.9) 0.7 (0.3-1.3) high (girls >24.2; boys >18.7) 2.9 (1.6-5.5) 2.3 (1.3-4.2) low (girls < 53.3; boys < 54.3) 1.0 (reference) 1.0 (reference) medium (girls 53.356.6; boys 54.3-58.4) 1.1 (0.6-2.0) 0.8 (0.4-1.4) high (girls >56.6; boys > 58.4) 2.2 (1.2-4.1) low (girls < 3.7; boys <2.9) 1.0 (reference) 1.0 (reference) medium (girls 3.8-5.5; boys 2.9-4.9) 0.8 (0.5-1.5) 1.7 (0.9-3.2) high (girls >5.5; boys > 4.9) 1.8 (1.0-3.0) low (girls < 4.7; boys<4.8) 1.0 (reference) 1.0 (reference) medium (girls 4.7-4.8; boys 4.8-5.0) 1.0 (0.6-1.7) 1.9 (1.0-3.6) high (girls ≥ 4.9; boys ≥ 5.1) 0.8 (0.5-1.5) high (girls > 1.65; boys > 1.73) 1.0 (reference) 1.0 (reference) medium (girls 1.451.65; boys 1.49-1.73) 1.0 (1.0-1.0) 1.25 (0.7-2.0) low (girls < 1.45; boys < 1.49) 1.7 (0.9-2.5) low (girls < 0.47; boys < 0.46) 1.0 (reference) 1.0 (reference) medium (girls 0.470.64; boys 0.46-0.59) 0.7 (0.4-1.2) 0.6 (0.3-1.1) 0.048 0.008 0.038 0.558 0.085 2.6 (1.4-4.8) 1.9 (1.0-3.5) 2.4 (1.3-4.4) 2.5 (1.4-4.5) 1.4 (0.8-2.5) p for trend 0.002 0.004 0.029 0.006 0.003 0.287 25 Table 6.continues SBP hsCRP high (girls > 0.64; boys > 0.59) 0.8 (0.5-1.4) 0.890 low (girls < 96.1; boys <96.7) 1.0 (reference) 1.0 (reference) medium (girls 96.1102.0; boys 96.7102.0) 1.4 (0.8-2.6) 0.9 (0.5-1.7) high (girls > 102.0; boys >102.0) 1.7 (1.0-3.1) low (girls < 0.30; boys < 0.30) 1.0 (reference) 1.0 (reference) medium (girls 0.300.92; boys 0.30-0.95) 1.3 (0.8-2.2) 1.4 (0.8-2.4) high (girls 0.93-6.60; boys 0.96-9.47) 1.0 (0.5-2.0) 0.064 0.711 1.3 (0.8-2.2) 1.5 (0.8-2.6) 2.5 (1.4-4.6) 0.303 0.156 0.004 Data were analyzed by logistic regression models adjusted for age and body height. OR = odds ratio; 95% CI = 95% confidence interval; ALT = alanine aminotransferase, GGT = gammaglutamyltransferase; HDL = high-density lipoprotein; hsCRP= high-sensitivity C-reactive protein; SBP= systolic blood pressure The features of MetS were generally intercorrelated. The first-order factor analysis with the promax rotation yielded three factors (Table 7). The first factor that explained the highest variance (24.9%) was heavily loaded by insulin, glucose and triglycerides. The second factor explaining 16.1% of the variance was highly loaded by waist circumference and insulin and moderately loaded by GGT and hsCRP. The third factor explaining 12.7 % of the variance was heavily loaded by HDL cholesterol and triglycerides and moderately by waist circumference and insulin. These three factors were intercorrelated (r=0.31-0.36, P<0.001). Factor analyses were also carried out using unadjusted variables and separately in boys and girls. The resulting factors had similar variances and loadings as those shown in Table 7. We therefore considered the sex differences negligible and performed the analyses in the entire cohort. 26 Table 7. Structure matrix and factor intercorrelations for the factor analysis of the traditional features of the metabolic syndrome as well as alanine aminotransferase, gamma-glutamyltransferase and high-sensitivity C-reactive protein using the promax rotation (n=492) Insulin resistance factor Abdominal and liver adiposity factor Dyslipidemia Waist circumference 0.23 0.80 0.35 Fasting insulin 0.80 0.43 0.35 Fasting glucose 0.67 0.06 0.14 HDL cholesterol -0.17 -0.16 -0.61 Triglycerides 0.50 0.16 0.47 Mean of SBP and DBP 0.19 0.26 -0.03 ALT -0.03 0.28 -0.13 GGT 0.17 0.34 0.08 hsCRP 0.07 0.38 0.16 factor All variables were adjusted for age, sex and body height before factor analysis with log transformation or square root transformation, if necessary. ALT = alanine aminotransferase, GGT = gamma-glutamyltransferase DBP=diastolic blood pressure; HDL= high-density lipoprotein; hsCRP=high-sensitivity C-reactive protein; SBP=systolic blood pressure The second-order factor analysis that used the three factors generated from the first-order factor analysis yielded a MetS factor (Table 8). All three factors from the first-order factor analysis had high loadings on the MetS factor that explained 64.1% of the variance. This MetS factor was almost the equivalent of the composite cardiometabolic risk score that was calculated as the sum of the individual standardized variables (r=0.91). 27 Table 8. Correlations of the MetS factor from the second- order factor analysis with the three factors from the first-order factor analysis shown in Table 7 and the cardiometabolic risk score MetS factor Insulin resistance factor 0.66 Abdominal and liver adiposity factor 0.61 Dyslipidemia factor 0.77 Cardiometabolic risk score 0.91 Also the first-order factor analysis with traditional features of Mets without ALT, GGT and hsCRP with a promax rotation yielded three factors (Table 9). The first factor explaining the highest proportion of the variance (35.0%) was heavily loaded by insulin, glucose and triglycerides. The second factor (18.3%) had high loadings by HDL cholesterol, triglycerides and a moderate loading by waist circumference. The third factor (17.0%) had high loadings by waist circumference and insulin. Table 9. Structure matrix and factor intercorrelations for the factor analysis of the traditional features of the metabolic syndrome using the promax rotation (n=492) Insulin Dyslipidemia resistance factor factor Abdominal adiposity factor Waist 0.23 0.31 0.72 Insulin 0.81 0.28 0.54 Glucose 0.67 0.08 0.16 HDL cholesterol -0.17 - 0.75 -0.25 Triglycerides 0.49 0.40 0.27 (SBP + DBP)/2 0.20 - 0.01 0.25 All variables were adjusted for age, sex and body height before factor analysis with log transformation or square root transformation, if necessary. DBP= diastolic blood pressure; HDL= high-density lipoprotein; SBP=systolic blood pressure; TG=triglycerides All factors had high loadings on the second-order MetS factor (Table 10). Also, the secondorder MetS factor was essentially the equivalent of the cardiometabolic risk score (r=0.87). 28 Table 10. Correlations of the MetS factor from the second-order factor analysis with the three factors from the first-order factor analysis shown in Table 9 and the cardiometabolic risk score (n=492) MetS factor Insulin resistance factor 0.65 Dyslipidemia factor 0.58 Abdominal adiposity factor 0.90 Cardiometabolic risk score 0.87 5.2 Validation of cardiometabolic risk score by confirmatory factor analysis in children and adults and the prediction of cardiometabolic outcomes in adults (Study II) The basic characteristics of participants in PANIC, KIHD and DR’s EXTRA studies in Study II are presented in Table 11. Table 11. Basic characteristics of participants in the PANIC, KIHD and DR’s EXTRA studies in Study II Age (years) Height (cm) Body weight (kg) BMI Waist circumference (cm) Fasting insulin (mUl/l) Fasting glucose (mmol/l) Total cholesterol (mmol/l) LDL-cholesterol (mmol/l) HDL cholesterol (mmol/l) Triglycerides (mmol/l) SBP (mmHg) DBP (mmHg) PANIC Girls Boys (n=232) (n=259) p-value 0.206 <0.001 0.107 0.791 0.015 KIHD Middle-aged men (n=1900) 52.7 (5.7) 173.0 (6.2) 80.2 (11.7) 26.8 (3.4) 90.7 (9.6) Older women (n=614) 66.5 (5.3) 160.0 (5.9) 69.6 (12.3) 27.2 (4.6) 87.6 (12.0) DR’EXTRA Older men (n=555) p value 7.6 (0.4) 127.7 (5.6) 26.4 (5.0) 16.1 (2.1) 55.9 (5.8) 7.7 (0.4) 129.6 (5.6) 27.1 (4.8) 16.1 (2.0) 57.2 (5.3) 66.3 (5.5) 173.7 (6.1) 82.4 (12.6) 27.3 (3.5) 97.8 (10.1) 0.487 <0.001 <0.001 0.833 <0.001 4.8 (2.3) 4.3 (2.6) 0.021 11.1 (6.5) 6.9 (4.5) 7.3 (5.0) 0.180 4.8 80.4) 4.9 (0.4) 0.001 4.6 (0.5) 5.5 (0.5) 5.8 (0.5) <0.001 4.3 (0.6) 4.2 (0.6) 0.147 5.8 (1.0) 5.3 (0.9) 5.0 (0.9) <0.001 2.4 (0.5) 2.3 (0.5) 0.013 4.0 (1.0) 3.3 (0.8) 3.2 (0.8) 0.490 1.56 (0.31) 1.64 (0.31) 0.007 0.86 (0.29) 1.88 (0.47) 1.54 (0.41) <0.001 0.62 (0.25) 0.58 (0.23) 0.064 1.31 (0.78) 1.27 (0.62) 1.36 (0.74) 0.029 99.9 (7.6) 61.6 (6.7) 100.2 (7.1) 62.0 (6.5) 0.565 0.536 132.5 (16.3) 88.2 (10.4) 149.8 (20.8) 82.5 (9.1) 144.8 (18.4) 84.5 (8.9) <0.001 <0.001 Differences in means between genders were analysed with independent samples t test. Data are presented as mean (standard deviation). DBP=diastolic blood pressure; HDL= High-density lipoprotein; SBP=systolic blood pressure The features of MetS were generally intercorrelated in girls and boys, in middle-aged men and in older women and men (Tables 12-15). All features of MetS showed moderate to strong correlations with the composite cardiometabolic risk score (r=0.30–0.76) and the MetS factor variable derived from the second-order CFA (r=0.24–0.88) described below. 29 Table 12. Intercorrelations of features of MetS in 491 children 6-8 years of age Correlation Waist Insulin Glucose HDL cholesterol TG TG/HDL cholesterol SBP DBP MAP MetS score MetS factor (second-order CFAa) MetS factor (firstorder CFAb) MetS factor (firstorder CFAc) MetS factor (firstorder CFAd) BMI Waist Insulin Glucose HDL 0.92 0.34 0.05 -0.16 0.13 0.18 0.15 0.16 0.19 0.52 0.31 0.33 0.05 -0.21 0.14 0.21 0.11 0.15 0.16 0.55 0.31 0.52 -0.17 0.40 0.39 0.13 0.15 0.17 0.76 0.84 -0.04 0.29 0.24 0.07 0.11 0.11 0.59 0.57 -0.29 -0.65 0.03 0.03 0.04 -0.50 -0.28 0.50 0.52 0.93 0.54 0.52 0.53 0.94 0.42 0.43 0.98 TG TG/HDL SBP DBP MAP 0.92 0.12 0.08 0.11 0.66 0.81 0.08 0.05 0.08 0.74 0.76 0.28 0.64 0.30 0.25 0.92 0.32 0.24 0.38 0.29 -0.34 0.60 0.62 0.21 0.25 0.29 0.47 -0.34 0.58 0.60 0.21 0.25 0.28 0.51 -0.21 0.52 0.50 0.19 0.17 0.28 For r >[0.08], p <0.05; for r >[0.12], p<0.01; for r >[0.15], p<0.001. All variables have been adjusted by age, sex and height before analysis. DBP=diastolic blood pressure; TG=triglycerides; SBP=systolic blood pressure; Waist=waist circumference a MetS as a second-order latent variable underlying the first-order latent factors adiposity, insulin resistance and glycaemia, dyslipidaemia and raised blood pressure, with BMI, waist, insulin, glucose, HDL cholesterol, TG, SBP and DBP as measured variables (our model, Figure 3) b CFA carried out with waist, HOMA-IR, TG/HDL cholesterol ratio and MAP as measured variables (model proposed by Pladevall et. al) (50) c CFA carried out with waist, insulin, TG/HDL cholesterol ratio and MAP as measured variables (model proposed by Martinez-Vizcaino et. al.) (17) d CFA carried out with waist, insulin, TG and SBP as measured variables (model proposed by Li and Ford) (48) 30 Table 13. Intercorrelations of features of MetS in 1900 men 42-60 years of age Correlation Waist Insulin Glucose HDL cholesterol TG TG/HDL cholesterol SBP DBP MAP MetS score MetS factor (secondorder CFAa) MetS factor (firstorder CFAb) MetS factor (firstorder CFAc) MetS factor (firstorder CFAd) BMI Waist Insulin Glucose HDL 0.89 0.56 0.27 -0.23 0.30 0.32 0.27 0.35 0.33 0.70 0.88 0.56 0.27 -0.24 0.29 0.32 0.26 0.35 0.33 0.73 0.88 0.32 -0.27 0.36 0.39 0.19 0.23 0.23 0.75 0.83 -0.05 0.13 0.12 0.12 0.14 0.14 0.52 0.39 -0.37 -0.66 0.03 -0.03 0.00 -0.53 -0.35 0.82 0.87 0.86 0.41 0.81 0.87 0.87 0.78 0.83 0.90 TG TG/HDL SBP DBP MAP 0.94 0.11 0.13 0.12 0.62 0.48 0.08 0.11 0.10 0.69 0.51 0.76 0.92 0.44 0.34 0.95 0.50 0.44 0.50 0.42 -0.35 0.49 0.52 0.35 0.43 0.42 0.33 -0.37 0.50 0.54 0.34 0.42 0.41 0.33 -0.32 0.51 0.53 0.33 0.38 0.38 For r >[0.04], p<0.05; for r>[0.05], p<0.01; for r>[0.07], p<0.001. All variables have been adjusted by age before analysis. DBP=diastolic blood pressure; TG=triglycerides; SBP=systolic blood pressure; Waist=waist circumference a Mets as a second-order latent variable underlying the first-order latent factors adiposity, insulin resistance and glycaemia, dyslipidaemia and raised blood pressure, with BMI, waist, insulin, glucose, HDL cholesterol, TG, SBP and DBP as measured variables (our model, Figure 3) b CFA carried out with waist, HOMA-IR, TG/HDL cholesterol ratio and MAP as measured variables (model proposed by Pladevall et. al) (50) c CFA carried out with waist, insulin, TG/HDL cholesterol ratio and MAP as measured variables (model proposed by Martinez-Vizcaino et. al.) (17) d CFA carried out with waist, insulin, TG and SBP as measured variables (model proposed by Li and Ford) (48) 31 Table 14. Intercorrelations of features MetS in 614 women 57-78 years of age Correlation Waist Insulin Glucose HDL cholesterol TG TG/HDL cholesterol SBP DBP MAP MetS score MetS factor (secondorder CFAa) MetS factor (firstorder CFAb) MetS factor (firstorder CFAc) MetS factor (firstorder CFAd) BMI Waist Insulin Glucose HDL 0.90 0.50 0.33 -0.30 0.29 0.33 0.18 0.25 0.23 0.69 0.88 0.51 0.34 -0.37 0.36 0.41 0.16 0.24 0.22 0.71 0.88 0.38 -0.31 0.37 0.40 0.03 0.06 0.05 0.71 0.83 -0.18 0.20 0.22 0.08 0.04 0.06 0.49 0.39 -0.48 -0.77 -0.02 -0.07 -0.05 -0.65 -0.35 0.81 0.89 0.86 0.44 0.81 0.90 0.87 0.80 0.88 0.90 TG TG/HDL SBP DBP MAP 0.93 0.07 0.12 0.11 0.66 0.48 0.06 0.12 0.10 0.73 0.51 0.62 0.91 0.30 0.34 0.89 0.41 0.44 0.40 0.42 -0.52 0.59 0.65 0.18 0.25 0.24 0.40 -0.53 0.59 0.65 0.18 0.25 0.24 0.41 -0.46 0.60 0.62 0.17 0.22 0.21 For r>[0.09], p<0.05; for r>[0.11], p<0.01; for r>[0.13], p<0.001. All variables have been adjusted by age before analysis. DBP=diastolic blood pressure; TG=triglycerides; SBP=systolic blood pressure; Waist=waist circumference a Mets as a second-order latent factor underlying the first-order latent factors adiposity, insulin resistance and glucose metabolism, dyslipidemia, and blood pressure, with BMI, waist, insulin, glucose, HDL cholesterol, TG, SBP and DBP as measured variables (our model, Figure 3) b CFA carried out with waist, HOMA-IR, TG/HDL cholesterol ratio and MAP as measured variables (model proposed by Pladevall et. al) (50) c CFA carried out with waist, insulin, TG/HDL cholesterol ratio and MAP as measured variables (model proposed by Martinez-Vizcaino et. al.) (17) d CFA carried out with waist, insulin, TG and SBP as measured variables (model proposed by Li and Ford) (48) 32 Table 15. Intercorrelations of features of MetS in 555 men 57-78 years of age Correlation Waist Insulin Glucose HDL cholesterol TG TG/HDL cholesterol SBP DBP MAP MetS score MetS factor (secondorder CFAa) MetS factor (firstorder CFAb) MetS factor (firstorder CFAc) MetS factor (firstorder CFAd) BMI Waist Insulin Glucose HDL 0.90 0.45 0.26 -0.34 0.33 0.38 0.11 0.24 0.20 0.68 0.88 0.46 0.25 -0.33 0.33 0.37 0.10 0.26 0.20 0.75 0.88 0.31 -0.33 0.34 0.39 0.06 0.14 0.11 0.70 0.83 -0.11 0.07 0.10 0.05 0.02 0.04 0.58 0.39 -0.55 -0.80 0.03 -0.05 -0.01 -0.64 -0.35 0.78 0.83 0.82 0.34 0.78 0.82 0.82 0.77 0.82 0.84 TG TG/HDL SBP DBP MAP 0.94 0.04 0.12 0.09 0.67 0.48 0.01 0.10 0.06 0.76 0.51 0.57 0.89 0.34 0.34 0.88 0.38 0.44 0.40 0.42 -0.55 0.60 0.65 0.16 0.29 0.25 0.30 -0.55 0.60 0.66 0.15 0.29 0.25 0.30 -0.48 0.60 0.63 0.14 0.26 0.22 For r>[0.09], p<0.05; for r>[0.11], p<0.01; for r>[0.15], p<0.001. All variables have been adjusted by age before analysis. DBP=diastolic blood pressure; TG=triglycerides; SBP=systolic blood pressure; Waist=waist circumference a Mets as a second-order latent factor underlying the first-order latent factors adiposity, insulin resistance and glucose metabolism, dyslipidemia, and blood pressure, with BMI, waist, insulin, glucose, HDL cholesterol, TG, SBP and DBP as measured variables (our model, Figure 3) b CFA carried out with waist, HOMA-IR, TG/HDL cholesterol ratio and MAP as measured variables (model proposed by Pladevall et. al) (50) c CFA carried out with waist, insulin, TG/HDL cholesterol ratio and MAP as measured variables (model proposed by Martinez-Vizcaino et. al.) (17) d CFA carried out with waist, insulin, TG and SBP as measured variables (model proposed by Li and Ford) (48) Figure 3 presents the second-order CFA models in which a latent MetS variable underlies four latent variables—abdominal obesity, insulin resistance, dyslipidemia and raised blood pressure—which are in turn manifested by eight measured features of MetS in different age groups. These results indicate that MetS can be described as a single entity in the four age groups. The second-order CFAs with the latent variables generally fitted the data well in all cohorts. In children, the model resulted in loading >1 for BMI on the latent adiposity variable, and the model was modified by allowing the latent adiposity variable to also load on insulin. In older men, the analysis resulted in loading >1 for diastolic blood pressure on the latent raised blood pressure variable, and the model was modified by using MAP and blood pressure medication instead of systolic blood pressure and diastolic blood pressure. In older men without antihypertensive medication, the model could be presented without these modifications (Figure 4). 33 Figure 3. Second-order confirmatory analysis models in 491 children, 1900 middle-aged men, 614 older women and 555 older men. BMI=body mass index; BP med= blood pressure medication: CFI=comparative fit index; DBP=diastolic blood pressure; IRG=insulin resistance and glycemia; MAP= mean arterial pressure, MetS=metabolic syndrome; SBP=systolic blood pressure; TG=triglycerides; RMSEA=root mean square of approximation 34 BMI 0.93 Waist Insulin Glucose TG 0.96 Adiposity 0.84 0.81 IRG 0.39 0.74 MetS Lipids 0.62 HDL -0.73 SBP 0.73 Blood 0.58 pressure 0.30 DBP 0.97 Figure 4. Second-order confirmatory factor analysis model in 349 older men without antihypertensive medication. Goodness of fit: χ2=321.1, p=0.17, comparative fitness index (CFI)=1.00, root mean of approximation (RMSEA)=0.030. DBP= diastolic blood pressure; IRG=insulin resistance and glycaemia; MetS=metabolic syndrome; SBP=systolic blood pressure; TG=triglycerides Tables 16–18 present comparisons of three previously proposed first-order CFA models hypothesizing that a latent MetS underlies four variables: abdominal obesity, insulin resistance, dyslipidemia and raised blood pressure. A first-order CFA using the model proposed by Pladevall et al yielded a MetS factor with loadings on waist circumference of 0.43, 0.76, 0.77 and 0.69, on HOMA measured insulin resistance of 0.76, 0.75, 0.69 and 0.69, on the triglycerides to HDL cholesterol ratio of 0.51, 0.46, 0.56 and 0.54, and on MAP of 0.24, 0.36, 0.21 and 0.21 in children, middle-aged men, older women and older men, respectively (Table 16). The CFA model proposed by Martinez-Vizcaino et al yielded a MetS factor essentially identical with that using HOMA-measured insulin resistance instead of insulin, with almost identical loadings in all four cohorts (Table 17). The CFA model proposed by Li and Ford also yielded a similar MetS factor, with slightly less loading on waist circumference (0.38), dyslipidemia (0.46) and blood pressure (0.17) and more loading on insulin (0.87) in children, and less loading on blood pressure in middle-aged men (0.29), older women (0.14) and older men (0.11) (Table 18). As estimated by CFI, all three models fitted the data well in all four cohorts (0.97–0.97). As judged by the RMSEA, however, fit was not good in middle-aged men and older women (0.104–0.110) in the two models using the triglycerides to HDL cholesterol ratio and MAP as measures of dyslipidemia and high blood pressure. 35 Table 16. The results of the first-order confirmatory factor analysis model of Pladevall et al (50) using four variables describing the central features of metabolic syndrome in children, middle-aged men, older women and older men Variable MetS factor, children (n=491) Waist circumference HOMA-insulin resistance Triglycerides to HDL cholesterol ratio Mean arterial pressure 0.43 0.76 0.51 0.24 Goodness Goodness Goodness Goodness of of of of fit fit fit fit for for for for the the the the model model model model in in in in MetS factor, middle-aged men (n=1900) 0.76 0.75 0.46 0.36 MetS factor, older women (n=614) MetS factor, older men (n=555) 0.77 0.69 0.56 0.21 0.69 0.69 0.54 0.21 children: χ2=4.40, p=0.110, CFI=0.99, RMSEA=0.049 middle-aged men: χ2=43.1, p<0.001, CFI=0.97, RMSEA=0.104 older women: χ2=15.6, p<0.001, CFI=0.97, RMSEA=0.105 older men: χ2=6.05, p=0.049, CFI=0.99, RMSEA=0.060 Table 17. The results of the first-order confirmatory factor analysis model of Martinez-Vizcaino et al (17) using four variables describing the central features of metabolic syndrome in children, middle-aged men, older women and older men Variable Waist circumference Fasting insulin Triglycerides to HDL cholesterol ratio Mean arterial pressure Goodness Goodness Goodness Goodness of of of of fit fit fit fit for for for for the the the the model model model model in in in in MetS factor, children (n=491) 0.44 0.77 0.50 0.24 MetS factor, middle-aged men (n=1900) 0.75 0.75 0.46 0.36 MetS factor, older women (n=614) MetS factor, older men (n=555) 0.77 0.67 0.56 0.21 0.69 0.68 0.55 0.21 children: χ2=4.00, p=0.140, CFI=0.99, RMSEA=0.049 middle-aged men: χ2=50.2, p<0.001, CFI=0.96, RMSEA=0.110 older women: χ2=16.7, p<0.001, CFI=0.96, RMSEA=0.109 older men: χ2=6.42, p=0.040, CFI=0.98, RMSEA=0.063 Table 18. The results of the first-order confirmatory factor analysis model of Li and Ford (48) using four variables describing the central features of metabolic syndrome in children, middleaged men, older women and older men MetS factor, children (n=491) 0.38 0.87 0.46 0.17 Variable Waist circumference Fasting insulin Triglycerides Systolic blood pressure Goodness Goodness Goodness Goodness of of of of fit fit fit fit for for for for the the the the model model model model in in in in MetS factor, middle-aged men (n=1900) 0.72 0.78 0.44 0.29 MetS factor, older women (n=614) MetS factor, older men (n=555) 0.74 0.69 0.51 0.14 0.67 0.69 0.49 0.11 children: χ2=3.62, p=0.160, CFI=0.99, RMSEA=0.041 middle-aged men: χ2=25.2, p<0.001, CFI=0.98, RMSEA=0.078 older women: χ2=11.2, p=0.004, CFI=0.98, RMSEA=0.087 older men: χ2=0.93, p=0.630, CFI=1.00, RMSEA=0.00 Correlations of the cardiometabolic risk score with MetS factors derived from the second-order CFA and first-order CFAs including the triglycerides to HDL cholesterol ratio and MAP were very similar (r=0.90–0.93 depending on the cohort), but the correlation with that derived from the first-order CFA using systolic blood pressure was slightly weaker in children (r=0.84) (Table 19). 36 Table 19. The correlations of cardiometabolic risk score and metabolic syndrome factors derived from confirmatory factor analyses of previous studies Cardiometabolic risk score MetS factor (secondorder CFA)a MetS factor (first-order CFA) b Waist– HOMA– TG/HDL–MAP Children (n=491) MetS factor (first-order CFA) b Waist–HOMA–TG/HDL–MAP 0.94 0.94 c Waist–Ins–TG/HDL–MAP 0.92 0.92 1.00 d Waist–Ins–TG–SBP 0.84 0.90 0.97 Cardiometabolic risk score 0.91 0.94 Middle-aged men (n=900) MetS factor (first-order CFA) b Waist–HOMA–TG/HDL–MAP 0.93 0.99 c Waist–Ins–TG/HDL–MAP 0.91 0.99 1.00 d Waist–Ins–TG–SBP 0.90 0.98 1.00 Cardiometabolic risk score 0.92 0.93 Older women (n=614) MetS factor (first-order CFA) b Waist–HOMA–TG/HDL–MAP 0.93 0.98 c Waist–Ins–TG/HDL–MAP 0.93 0.98 1.00 d Waist–Ins–TG–SBP 0.90 0.96 0.99 Cardiometabolic risk score 0.93 0.93 Older men (n=555) MetS factor (first-order CFA) b Waist–HOMA–TG/HDL–MAP 0.93 0.95 c Waist–Ins–TG/HDL–MAP 0.93 0.96 1.00 d Waist–Ins–TG–SBP 0.90 0.94 0.99 Cardiometabolic risk score 0.92 0.93 a Our second-order CFA-model as presented in Fig.4 b Model proposed by Pladevall et al (50) c Model proposed by Martinez-Vizcaino et al (17) d Model proposed by Li and Ford (48) CFA= confirmatory factor analysis; HDL= high-density lipoprotein cholesterol; HOMA= homeostatic model assessment for insulin resistance; Ins= fasting insulin; MAP= mean arterial pressure; MetS= metabolic syndrome; SBP= systolic blood pressure; TG= triglycerides; waist= waist circumference There were 81 cases of type 2 diabetes during 11 years of follow-up in 790 middle-aged men. There were 126 acute myocardial infarctions during a median follow-up of 17.6 years, 57 ischemic strokes during a median follow-up of 16.9 years, and 54 cases of coronary death, 88 cases of cardiovascular death and 215 cases of death in total during a median follow-up of 17.9 years in 1209 middle-aged men. The risk of type 2 diabetes increased 3.7fold with 1 SD increase in the cardiometabolic risk score (Table 20). The risk of myocardial infarction increased 1.4-fold and the risk of premature death due to coronary heart disease increased 1.8-fold with 1 SD increase in the cardiometabolic risk score. Also the risk of premature cardiovascular death increased 1.6-fold and the risk of premature overall death increased 1.4-fold with 1 SD increase in cardiometabolic risk score. The cardiometabolic risk score was not statistically significantly associated with the risk of ischemic stroke. The relations of the second-order confirmatory MetS factor variable and first-order confirmatory MetS factors with incident type 2 diabetes were slightly weaker (OR 3.0–3.3) than that of the cardiometabolic risk score (OR 3.7). The associations of the confirmatory MetS factors with myocardial infarction, ischemic stroke and premature coronary, cardiovascular and overall death were essentially equivalent to those of the cardiometabolic risk score. 3.67 (2.72−4.94) 1.38 (1.18−1.59) 1.18 (0.91−1.54) 1.79 (1.39−2.34) 1.56 (1.27−1.93) 1.44 (1.26−1.65) Cardiometabo lic risk score 3.10 (2.36−4.06) 1.38 (1.18−1.59) 1.26 (0.97−1.62) 1.64 (1.28−2.11) 1.50 (1.23−1.83) 1.39 (1.22−1.58) MetS factor (2nd-order CFA) MetS factor (1st-order CFA, waist– HOMA-IR– TG/HDL chol–MAP) 3.30 (2.50−4.37) 1.37 (1.18−1.58) 1.22 (0.95−1.58) 1.71 (1.33−2.20) 1.52 (1.24−1.86) 1.43 (1.25−1.62) 3.02 (2.29−3.97) 1.37 (1.18−1.58) 1.21 (0.94−1.57) 1.69 (1.31−2.18) 1.51 (1.24−1.85) 1.42 (1.25−1.61) MetS factor (1st-order CFA, waist–ins– TG/HDL chol– MAP) 3.04 (2.31−3.99) 1.36 (1.18, 1.58) 1.21 (0.93, 1.56) 1.71 (1.33, 2.20) 1.52 (1.24, 1.85) 1.43 (1.25, 1.62) MetS factor (1st-order CFA, waist– ins–TG–SBP) MAP= mean arterial pressure; MetS= metabolic syndrome; SBP= systolic blood pressure; TG= triglycerides; waist= waist circumference CFA= confirmatory factor analysis; HDL chol= high-density lipoprotein cholesterol; HOMA-IR= homeostatic model assessment insulin resistance; Ins= fasting insulin; socioeconomic status Covariates in the model: age group, family history of CHD, serum LDL cholesterol concentration, blood pressure medication, smoking, alcohol intake and adult b Covariates in the model: age group, family history of diabetes, prevalent cardiovascular disease, smoking, alcohol intake and adult socioeconomic status a The standardized z scores of the cardiometabolic risk score and MetS factors derived from exploratory and confirmatory factor analysis were used in the analyses. Data are presented as relative risks (95% confidence interavals) for one standard deviation increase in cardiometabolic risk score. Type 2 diabetesa Acute myocardial infarctionb Ischemic strokeb Coronary mortalityb Cardiovascular mortalityb Total mortalityb Variable Table 20. The associations of cardiometabolic risk score and metabolic syndrome factors derived from the confirmatory factor analyses with incident type 2 diabetes, acute myocardial infarction, ischemic stroke and premature coronary, cardiovascular and total mortality in middle-aged men 37 38 5.3 Associations of I148M polymorphism in PNPLA3 gene with plasma ALT levels during 2-year follow-up in normal weight and overweight children (Study III) Altogether 58 (12%) of all 481 children examined at baseline and 71 (17%) of all children reexamined after 2-year follow-up were overweight (Table 15). Of the 481 children examined at baseline, 283 (58.8%) were 148I homozygotes, 173 (36.0%) were I148M heterozygotes and 25 (5.2%) were 148M homozygotes. Of the 419 children re-examined after 2-year follow-up, 244 (58.2%) were 148I homozygotes, 153 (36.5%) were heterozygotes and 22 (5.3%) were 148M homozygotes. There were no statistically significant differences in the genotype distributions of the rs738409 polymorphism between normal weight children (58.4%, 35.9%, 5.7%) and overweight children (62.1%, 36.2%, 1.7%). Body height, body weight, BMI-SDS, waist circumference, body fat percentage, insulin, LDL cholesterol, triglycerides and GGT were higher and HDL cholesterol was lower in overweight children than in normal weight children at baseline (Table 21). Increases in body weight, waist circumference and ALT during the 2-year follow-up were larger in overweight children than in normal weight children. BMI-SDS increased slightly during the 2-year follow-up in normal weight children, while it decreased slightly in overweight children. There were no statistically significant differences in cardiometabolic risk factors at baseline among the three PNPLA3 rs738409 genotypes (data not shown) or between the carriers and non-carriers of the 148M allele (Table 22). Systolic blood pressure increased in the PNPLA3 148M carriers, whereas it decreased in the PNPLA3 148M non-carriers. 423 (88%) 7.6 (0.4) 128.2 (5.6) 25.6 (3.6) 15.5 (1.3) -0.44 (0.87) 55.1 (3.6) 17.5 (6.0) 4.2 (2.2) 4.8 (0.4) 18.3 (5.7) 11.5 (2.5) 4.3 (0.6) 2.3 (0.5) 1.63 (0.31) 0.58 (0.23) 99.8 (7.1) 61.5 (6.6) 58 (12%) 7.7 (0.4) 131.8 (5.1) 35.4 (4.4) 20.3 (1.6) 1.62 (0.44) 67.1 (5.8) 34.4 (5.5) 6.6 (2.9) 4.9 (0.3) 20.7 (8.1) 13.5 (2.8) 4.3 (0.7) 2.5 (0.6) 1.42 (0.29) 0.70 (0.32) 101.7 (8.2) 63.8 (6.7) Baseline Overweight 0.194 <0.001 <0.001 <0.001 <0.001 <0.001 <0.001 <0.001 0.100 0.004 <0.001 0.971 0.028 <0.001 0.001 0.061 0.012 p value 357 (88%) 2.1 (0.1) 11.6 (1.6) 6.9 (2.6) 1.0 (1.0) 0.08 (0.44) 4.3 (3.4) 4.4 (4.1) 1.3 (3.2) 0.5 (0.0) -0.5 (5.7) 0.5 (2.1) 0.0 (0.5) 0.0 (0.4) 0.04 (0.29) 0.03 (0.30) 0.3 (7.0) -1.3 (9.9) 50 (12%) 2.1 (0.1) 12.0 (1.6) 10.4 (3.6) 1.8 (1.4) -0.15 (0.29) 6.3 (4.5) 5.0 (3.5) 2.0 (4.2) 0.4 (0.1) 2.5 (7.6) 0.5 (3.2) 0.0 (0.5) 0.0 (0.4) 0.00 (0.26) 0.04 (0.40) -1.1 (8.2) -1.1 (10.3) LDL = low-density lipoprotein; HDL = high-density lipoprotein The boundary of statistical significance with Bonferroni correction is 0.003. 0.506 0.110 <0.001 <0.001 <0.001 <0.001 0.345 0.203 0.022 0.001 0.853 0.807 0.796 0.432 0.680 0.211 0.863 2-year change Normal Overweight p value weight BMI-SDS = body mass index standard deviation score, based on Finnish reference values (199). Values are means (standard deviations) from independent samples t-test. N (%) Age (years) Body height (cm) Body weight (kg) Body mass index BMI-SDS Waist circumference (cm) Body fat percentage (%) Fasting serum insulin (mU/l) Fasting plasma glucose (mmol/l) Alanine aminotransferase (U/l) Gamma-glutamyltransferase (U/l) Total cholesterol (mmol/l) LDL cholesterol (mmol/l) HDL cholesterol (mmol/l) Triglycerides (mmol/l) Systolic blood pressure (mmHg) Diastolic blood pressure (mmHg) Normal weight Table 21. The measures of body size, body adiposity and glucose and lipid metabolism at baseline and changes in these factors during the 2-year follow-up in normal weight and overweight children 39 283 (59%) 7.6 (0.4) 128.4 (5.9) 26.7 (4.8) 16.1 (2.0) -0.17 (1.08) 56.6 (5.4) 19.7 (8.1) 4.6 (2.5) 4.8 (0.4) 18.4 (5.5) 11.8 (2.8) 4.3 (0.6) 2.4 (0.5) 1.62 (0.31) 0.59 (0.25) 100.3 (7.2) 61.8 (6.5) 198 (41%) 7.6 (0.4) 129.1 (5.3) 26.9 (4.8) 16.0 (2.1) -0.22 (1.06) 56.6 (5.7) 19.4 (8.0) 4.4 (2.4) 4.8 (0.4) 18.8 (6.8) 11.6 (2.4) 4.3 (0.7) 2.3 (0.5) 1.59 (0.31) 0.60 (0.24) 99.7 (7.3) 61.8 (6.8) Baseline PNPLA3 I148M/ M148M 0.611 0.169 0.693 0.730 0.616 0.969 0.678 0.309 0.091 0.578 0.625 0.807 0.847 0.449 0.591 0.364 0.997 Pvalue 238 (58%) 2.1 (0.1) 11.6 (1.5) 7.4 (3.0) 1.1 (1.1) 0.04 (0.43) 4.4 (3.8) 4.6 (4.1) 1.3 (3.3) 0.2 (0.5) -0.5 (5.6) 0.5 (2.2) 0.1 (0.5) 0.0 (0.4) 0.01 (0.25) 0.03 (0.30) -0.9 (7.4) -2.0 (10.4) 169 (42%) 2.1 (0.2) 11.7(1.7) 7.3 (3.0) 1.1 (1.1) 0.07 (0.45) 4.7 (3.3) 4.1 (4.0) 1.8 (3.4) 0.2 (0.5) 0.4 (6.5) 0.4 (2.4) 0.0 (0.5) -0.1 (0.4) 0.06 (0.33) 0.03 (0.28) 1.7 (6.6) -0.3 (9.3) 2-year change PNPLA3 PNPLA3 I148I I148M/ M148M The boundary of statistical significance with Bonferroni correction is 0.003. LDL = low-density lipoprotein; HDL = high- density lipoprotein. BMI-SDS = body mass index standard deviation score, based on Finnish reference values (199). Values are means (standard deviations) from independent samples t-test. N (%) Age (years) Body height (cm) Body weight (kg) Body mass index BMI-SDS Waist circumference (cm) Body fat percentage (%) Fasting serum insulin (mU/l) Fasting plasma glucose (mmol/l) Alanine aminotransferase (U/l) Gamma-glutamyltransferase (U/l) Total cholesterol (mmol/l) LDL cholesterol (mmol/l) HDL cholesterol (mmol/l) Triglycerides (mmol/l) Systolic blood pressure (mmHg) Diastolic blood pressure (mmHg) PNPLA3 I148I and changes in these factors during the 2-year follow-up in the PNPLA3 I148M genotypes Table 22. The measures of body size, body adiposity and glucose and lipid metabolism at baseline 0.939 0.888 0.912 0.977 0.477 0.428 0.554 0.037 0.093 0.144 0.500 0.590 0.157 0.215 0.977 <0.001 0.088 Pvalue 40 41 Overweight children had higher plasma ALT levels at baseline (P=0.009) and a larger increase in plasma ALT levels during the 2-year follow-up (P<0.001) than normal weight children adjusted for age, sex, body height, carrying the PNPLA3 148M allele and change in BMI-SDS during the 2-year follow-up. The carriers of the PNPLA3 148M allele had higher plasma ALT levels at baseline than the non-carriers (18.3-19.2 U/l) only if they had overweight (23.2 U/l) but not if they had a normal body weight (18.2 U/l) at baseline (P=0.024 for interaction) (Table 23, Figure 5). The carriers of the PNPLA3 148M allele also had a larger increase in plasma ALT levels during the 2-year follow-up than the non-carriers (-0.6−0.3 U/l) only if they had overweight (6.4 U/l) but not if they had a normal body weight (-0.3 U/l) at baseline (P=0.002 for interaction) (Table 23, Figure 5). Additional adjustments at baseline or for changes in these factors during 2year follow-up had little or no effect on these associations or interactions. There were no statistically significant differences in plasma GGT levels at baseline or after 2-year follow-up or changes in plasma GGT levels during 2-year follow-up between the PNPLA3 148M allele carriers and the non-carriers or between overweight children and normal weight children (data not shown). Table 23. The determinants of plasma alanine aminotransferase in all children Baseline Partial Eta P-value Squared 2-year change Partial Eta P-value Squared Sex/female 0.002 0.280 0.000 0.951 Age 0.001 0.424 0.005 0.146 Body height 0.004 0.191 0.001 0.742 0.013 0.023 Change in BMI-SDS during 2-year follow-up Overweight 0.020 0.002 0.050 <0.001 PNPLA3 gene variant (I148I or I148M/M148M) 0.010 0.033 0.026 0.001 0.011 0.024 0.023 0.002 Interaction between overweight and PNPLA3 gene variant Data are from general linear models including all these variables. BMI-SDS = body mass index standard deviation score, based on Finnish reference values (199). 42 A Plasma ALT levels at baseline U/l 35 30 18.3 (17.6−19.1) n=247 25 20 18.2 (17.4−19.1) n=176 19.2 (16.5−21.8) n=36 23.2 (19.8−26.6) n=22 15 10 5 0 Normal weight I148I Overweight/obese I148M and M148M B Changes in plasma ALT levels during 2-year follow-up U/l 10 6.4 (3.1−9.8) n=18 8 6 4 2 0 -0.6 (-1.4−0.2) n=200 -2 -0.3 (-1.2−0.6) n=151 Normal weight I148I 0.3 (-2.2−2.8) n=32 Overweight/obese I148M and M148M Figure 5. Means (95% confidence intervals) of plasma alanine aminotransferase (ALT) according to the PNPLA3 I148M polymorphism in normal weight and overweight or obese children. P-values for interaction between overweight/obesity and PNPLA3 gene variant (I148I or I148M/M148M): at baseline (P=0.024) (A) and for 2year change (P=0.002) (B). 43 6 Discussion 6.1 Strengths and limitations 6.1.1 Study populations and study designs The study population in Studies I-III consisted of children who participated in baseline examinations of the PANIC study when they were 6-8 years old and in 2-year follow-up examinations at the age of 8-10 years. Study II also included middle-aged men who participated in the baseline examinations of the KIHD study when they were 42-60 years old and older men and women who attended in the baseline examinations of the DR’s EXTRA study at the age of 57-78 years. The final study population of 512 children in the PANIC study represented about 70% of 736 children 6-8 years of age who were originally invited in the study from the schools of the city of Kuopio. Altogether 86% of the 512 children participated in the 2-year follow-up study. Such a high participation rate in the 2-year follow-up study shows that the compliance of the participants was good. Furthermore, the participants of the baseline study did not differ in terms of age, height-SDS, weight-SDS or BMI-SDS from other children living in the city of Kuopio who had been examined by school nurses before the first grade. However, the nonparticipant were not asked for their reasons for non-participating. Therefore, a possible selection bias must be taken into consideration. The participating families might have been more motivated and have healthier life style habits than non-participating families. The study population was rather homogenous in age, ethnicity and place of residence, mainly prepubertal, had not been exposed to smoking or alcohol consumption, excluding the possibility of the confounding effects of these factors. Moreover, the analyses were adjusted for several important confounding factors such as dietary factors, physical activity and sedentary behavior. Due to the cross-sectional nature of Study I and Study III considering other than middle-aged men, the directions of causality of observed associations cannot be determined. The KIHD study provided a unique opportunity to investigate the associations of the clustering of cardiometabolic risk factors with the future risk of type 2 diabetes, myocardial infarction, ischemic stroke and premature CVD and total mortality in a population-based sample of 2682 men aged 42-60 years from the city of Kuopio who were at increased risk of coronary heart disease and who were followed-up for about 18 years. The 2682 participants of the KIHD study represented 83% of the 3235 men eligible for the study. The large representative population-based sample of middle-aged men makes it possible to generalize the findings to other male populations. However, the results cannot be extrapolated to other age groups or ethnic populations or to women. The participants of the DR’s EXTRA study were a representative population-based sample of men and women 57-78 years of age from the city of Kuopio. About two thirds of the invited 3000 individuals were initially willing to participate in the study. About three fourths of the individuals who were willing to attend finally participated in the baseline examinations. Because of the age range and the relatively long run-in period, it is understandable that some of those who had expressed their willingness to attend were not finally able to participate. The strengths of the study DR’s EXTRA study are the representative population-based sample, the inclusion of both men and women and the focus on older individuals. 44 6.1.2 Assessments Body composition and adiposity The prevalence of overweight and obesity was defined by the International Obesity Task Force (IOTF) criteria that use the age- and gender-specific BMI cutoffs (200). The IOTF criteria were used for the definition of overweight and obesity because it provides internationally comparable prevalence rates of overweight and obesity in children. The data for the IOTF criteria for overweight and obesity were obtained from cross-sectional surveys on growth in representative samples of children and adolescents aged 6-18 years from Brazil, Great Britain, Hong Kong, the Netherlands, and the United States. BMI is a widely used but crude measure of general body adiposity. Body weight and height are simple, inexpensive, safe and practical measurements (211), and it is easy to calculate BMI from body weight and height. However, a limitation of BMI is that it does not distinguish fat mass from muscle mass or bone mass. In elderly people, BMI may underestimate the level of body adiposity due to loss of skeletal muscle mass associated with aging. For an equivalent BMI, women have a much higher body fat percentage than men. In children BMI-SDS is more accurate compared to BMI because it takes into account the age and gender. We also computed the BMI-SDS values for children using previously published Finnish references (199). BMI also does not take body fat distribution into account. Despite these limitations, overweight and obesity in adults are generally classified according to the criteria of The WHO based on BMI (212). In a sample of over 4000 participants, a lower BMI in childhood was associated with a better cardiovascular health in adulthood (108). Moreover, data from the Bogalusa Heart Study and the Cardiovascular Risk in Young Finns Study showed that screening BMI offers an equally accurate alternative for MetS to identify youth at risk of developing adult MetS, subclinical atherosclerosis and type 2 diabetes (60). The cut-off points of the IOTF and the Centers for Disease Control identify children with a BMI higher than eighty-fifth percentile as “at risk of overweight” and children with a BMI higher than ninety-fifth percentile as “overweight” (200). Body fat content among children in the PANIC study was also assessed using dual-energy xray absorptiometry (DXA). The strength of DXA is that it is a more precise and valid method for assessing body fat percentage than other more commonly used measures of body composition (213). It also has a lower radiation risk than computed tomography. The PANIC study is one of the few population-based studies in children in which body fat content has been assessed using DXA. Abdominal fat accumulation was estimated using waist circumference. Waist circumference is a cheap and easily available methods for assessing abdominal fat accumulation but it is subject to a relatively large measurement error due to inter-observed variability and differing anatomical sites of measurement (214). Waist circumference has been recognized as a simple and relatively good clinical measure of visceral fat accumulation (215). Elevated waist circumference is a useful preliminary screening tool for MetS and a key component in the definitions of MetS in adults. Variability in waist circumference between genders and ethnic groups means that a single universal cut-off point cannot be used. Further research is required to find a commonly agreed-upon set of gender-specific cut-off points for different ethnic groups (1). The prediction of health risks associated with overweight and obesity in youth has been found to be improved by assessing not only BMI but also waist circumference (216,217). The amount of visceral and subcutaneous fat can be accurately visualized and quantified using MRI or computer tomography (218). However, these methods are too expensive to be used in large population-based studies. Another limitation of computed tomography is that it exposes to radiation. The determinants of visceral and subcutaneous fat and their associations with other risk factors have not been comprehensively studied in population samples of children and adolescents. Population-based studies among children and adolescents are needed to obtain information on lifestyle factors associated with decreased or increased risk of visceral 45 fat accumulation, to identify anthropometric measures which would help estimating the amount of visceral fat as well as draw up norms specifying the amount of visceral fat among healthy children (121,218). Liver enzymes and the PNPLA3 gene polymorphism Elevated plasma levels of liver enzymes ALT and GGT have been associated with increased liver fat accumulation in children and adults (153,161). NAFLD is the most common reason for elevated plasma ALT levels (219), although normal ALT does not exclude steatosis (153). Other common reasons for elevated plasma levels of liver enzymes are excess alcohol consumption, viral hepatitis and hemochromatosis (153). A study in over 15 000 U.S. adults showed that the prevalence of elevated plasma levels of liver enzymes was 7.9% (219). Only 31% of the elevated levels were explained by excess alcohol consumption, viral hepatitis or hemochromatosis. In the remaining 69%, various features of MetS were strongly associated with an otherwise unexplained elevation of liver enzymes. Other studies have also shown a strong relationship between the features of MetS and the increased prevalence of NAFLD in adults and children (153,154). All children in the PANIC Study population had concentrations within the normal range for ALT (10-45 U/l in women and 10-70 U/l in men) and for GGT (10-45 U/l in women and 10-80 U/l in men), as defined by the Nordic Reference Interval Project (NORIP) Study (220). There is no single standard cut-off point for abnormal high ALT or GGT levels in children, but the most commonly used limit for ALT is 40 U/l (21), which was exceeded by only five children. In the present population study we were not able to measure liver fat content with MRI imaging or liver biopsy, which would have provided more detailed and accurate information about liver fat accumulation than plasma levels of ALT and GGT. However, in obese children increased serum ALT levels have been independently associated with the increased prevalence of NAFLD and excess hepatic fat content, as assessed by MRI, although ALT alone was not accurate enough to be employed as a marker of NAFLD (221,222). According to the questionnaire administered by the parents none of the children in the PANIC cohort had type 1 diabetes, celiac disease, hepatitis, mononucleosis, toxic diseases or other rare hepatological or pancreatic diseases that could have increased liver enzyme levels. Also some medicines could increase liver enzyme levels. Altogether nine children used such medication regularly, and two of them had rheumatoid arthritis and one inflammatory bowel disease. However, the results remained similar even after exclusion of these children. We were unable to evaluate the effect of irregular use of pain or allergy medicines. The consumption of alcohol and energy drinks could also increase liver enzyme levels, but even surreptitious use is unlikely at the age of 6-8 years, and according to the 4-day food records administered by the parents children did not consume them yet at this age. In addition, because plasma levels of liver enzymes fluctuate from day to day, one measurement of ALT and GGT may somewhat underestimate the true associations. The prevalence of NAFLD among children and adolescents is unknown, and there are no established criteria for abnormal serum ALT levels due to lack of population-based studies in these age groups (161). The few previous population-based studies related to pediatric or adolescence NAFLD have included only limited and relatively insensitive measurements of liver fat accumulation such as serum ALT levels (223,224) or ultrasound examination (225). There are no population-based studies on hepatic fat accumulation assessed by MRI or liver biopsy, the relation of hepatic fat accumulation to other cardiometabolic risk factors or the predictors of hepatic fat accumulation among children or adolescents. Such studies are needed to find proper cut-off points for serum or plasma ALT levels to be used in clinical practice and research. However, such studies would be expensive and taking invasive liver biopsies for research purposes would also be unethical. Genotyping the rs738409 polymorphism in the PNPLA3 gene was performed with standard methodology. The genotype distribution of the rs738409 polymorphism was within HardyWeinberg equilibrium. A weakness of the PNPLA3 study is the relatively small study sample for a genetic study. Due to small sample size we also had to compare plasma ALT levels in the 46 148M allele carriers and the non-carriers. However, not only the M148M genotype but also the I148M genotype has been associated with increased levels of plasma ALT although the ALT levels have been higher among the homozygotes (26,226,227). Metabolic syndrome and cardiometabolic risk score The definition of MetS is particularly controversial among children and adolescents, because there are no clear thresholds above which the cardiometabolic risk factors start to worsen (2,11,12). Therefore, many of the more recent studies among children have used continuous variables for the components of MetS and have calculated a continuous cardiometabolic risk score instead of using a definition based on dichotomous variables (13-15). Using a continuous cardiometabolic risk score variable for the key features of MetS instead of a dichotomous variable for the syndrome is reasonable because there is no evidence for a clear threshold above which cardiometabolic risk increases (51). Another reason for using a continuous variable instead of a dichotomous variable is that continuous variables better describe the true pathophysiological processes and increase statistical power in analyses. In the PANIC study a continuous cardiometabolic risk score variable was calculated using continuous z-score variables for the components of MetS, as employed previously (61) The cardiometabolic risk score was calculated as waist circumference + insulin + glucose - HDL cholesterol + triglycerides + the mean of systolic and diastolic blood pressure a higher score indicating a less favorable cardiometabolic risk profile. The cardiometabolic risk score was validated in children, in middle-aged men as well as in older men and women. However, a weakness of the cardiometabolic risk score is that it can currently be used only in research, because further investigation is needed to define cut-off points for risk estimation in clinical practice. Also, the results dealing with clinical outcomes can be generalized only to men because of the study sample used. Fasting insulin has not been included in most definitions of MetS in which dichotomous variables have been used, because methods for the measurement of fasting insulin are not commonly used in clinical practice and because there is wide variation in fasting insulin values among assays available. However, systematic differences in insulin assays, other biochemical analyses or measurement of blood pressure between children, middle-aged men and older men and women are unlikely to have major effects on the conclusions of this thesis. Factor analysis Factor analysis has also been used to describe the pathophysiological processes related to MetS (16,17). Exploratory factor analysis has traditionally been used to explore the possible underlying factor structure of a set of observed variables without imposing a preconceived structure on the outcome. In previous literature the number of factors identified has ranged from 1 to 5 (41). Studies with higher number of starting components have produced larger number of factors. Also the specific variables included and rotation method applied in the analysis have influenced the results. The results of individual factor analyses should therefore be considered suggestive of underlying biological relationships. The actual underlying mechanisms, which are only partly understood, are certainly more complex. In Study I, exploratory factor analysis with promax rotation was used. The promax rotation allows factors to be correlated, as opposed to the more commonly used varimax rotation, which generates uncorrelated factors. Uncorrelated factors may simplify interpretation of the factors, but may not be biologically relevant (46). CFA, on the other hand, can be used to test the hypothesis that the MetS can be represented as a single entity (47). We carried out second-order CFAs in which the MetS was represented by a second-order latent variable underlying four latent variables characterized by abdominal obesity, insulin resistance, dyslipidemia and raised blood pressure in different age groups. Previous studies using CFA model to represent MetS (17,48,50) have performed first order factor analyses with slight differences in the variables used. Shen et al. (2003) used a hierarchical CFA model with 10 measured variables in which the latent obesity, insulin resistance, lipid and blood pressure variables were allowed to covary (49). The analysis 47 indicated that all four latent variables loaded on each other, and the model fit the data well in the entire cohort and in various age groups. The second-order factor analysis in Study II is conceptually similar to this hierarchical analysis, differing mainly in that the MetS was described as a second-order latent factor instead of implicitly through the covariance of the latent first-order variables. 6.2 Interpretation of findings and comparison with previous findings 6.2.1 Associations of cardiometabolic risk factors with high-normal plasma levels of liver enzymes (Study I) Study I showed that the features of MetS cluster among prepubertal children. Factor analyses revealed a MetS factor characterized by a larger waist circumference, higher levels of fasting insulin, fasting glucose, triglycerides, hsCRP, and GGT and lower levels of HDL cholesterol. Children in the highest gender-specific third of cardiometabolic risk score, body fat percentage, waist circumference and insulin had a 2-3–times higher risk of being in the highest fifth of ALT and GGT adjusting for age and body height. Moreover, children in the highest third of glucose and hsCRP had a 2.5-fold risk of being in the highest fifth of GGT. While the associations of body fat percentage and waist circumference with ALT and GGT generally remained after further adjustment for other features of MetS and confounding factors, the relationships of other features of MetS generally were no longer associated with ALT and GGT after additional adjustment for fat percentage and waist circumference. These findings suggest that the features of MetS and especially total and abdominal adiposity increase the likelihood of having highnormal levels of ALT and GGT. The few previous studies on the associations of MetS and its components with high-normal levels of liver enzymes in children have found associations of the features of MetS with higher levels of ALT, and most of these studies have been carried out among obese children (166,167,228). The Bogalusa Heart Study showed that MetS and all of its major components were associated with higher serum levels of ALT within the normal range among apparently healthy preadolescents and adolescents (167). Other smaller studies among overweight or obese children have provided further evidence for the associations of MetS and its components with higher serum levels of liver enzymes within the reference range (166,228). Previous studies in adults suggest that even high-normal levels of liver enzymes are associated with an increased risk of developing type 2 diabetes and CVD (168,229) and that even small changes in liver enzymes could indicate a potential dysmetabolic state (230). Together with these studies, the present findings suggest that GGT and ALT could be used as continuous biomarkers of metabolic risk not only in adults but also in prepubertal children and that the adult cut-off points may be too high for children. In the present study, GGT generally correlated more strongly with the features of MetS than ALT. Hence, GGT might be a more specific indicator of metabolic dysfunction, particularly abnormal insulin and glucose metabolism and systemic inflammation, as assessed by hsCRP, than ALT in children. Moreover, the association between fasting glucose and GGT remained even after controlling for body adiposity as reported previously in mainly overweight and obese Pima Indian children (166). The association between MetS and elevated liver enzymes might be related to increased central adiposity and insulin resistance (168,231,232). Increased metabolic activity and excess fat accumulation in the liver appear to increase gluconeogenesis, lipogenesis and triglyceride secretion (19,233). Other mechanisms by which fat accumulation in the liver may worsen insulin resistance and dyslipidemia include exacerbation of inflammation and oxidative stress (19). Also some studies in adults suggest that elevated serum levels of ALT and GGT are independent markers of systemic low-grade inflammation and oxidative stress, irrespective of their association with MetS, and have been related to higher CRP concentrations (234,235). Our results suggest that overweight and related cardiometabolic risk factors elevate liver enzymes in otherwise healthy children. Therefore, it is crucial to pay attention to the presence of 48 cardiometabolic risk factors in children with elevated or high-normal values of liver enzymes. The currently used cut-off points for elevated ALT and GGT in children might be too high. 6.2.2 Validation of cardiometabolic risk score by confirmatory factor analysis in children and adults and prediction of cardiometabolic outcomes in adults (Study II) There are three main findings in Study II. First, the MetS factors derived from the first- and second-order CFAs were strongly associated with a composite cardiometabolic risk score in children, middle-aged men, and older women and men. This suggests that the continuous cardiometabolic risk score variable can be used in different age groups to represent the clustering of the components of MetS. Second, MetS could be reasonably well described as a single entity in boys and girls, middle-aged men, and older men and women in the first- and second-order CFAs. However, the results suggest that waist circumference is a less prominent feature of MetS in children than in adults and that blood pressure is a more important feature of MetS in middle-aged men than in children or older adults. Third, the MetS factors derived from the first- and second-order CFAs and the cardiometabolic risk score similarly predicted incident type 2 diabetes, myocardial infarction, ischemic stroke, and mortality from coronary heart disease, CVD and any cause in middle-aged men. These findings indicate that the cardiometabolic risk score could be a useful tool in research for the evaluation of cardiometabolic risk in children and adults. A couple of previous studies have also used a cardiometabolic risk score in the assessment of risk for clinical outcomes. A recent study in Indian children demonstrated that a continuous cardiometabolic risk score had a stronger direct association with subclinical atherosclerosis than individual components of MetS (15). A higher cardiometabolic risk score has also been associated with a markedly increased risk of developing type 2 diabetes and CVD in adults (18). Study II provides further evidence for the usefulness of the cardiometabolic risk score to represent the clustering of cardiometabolic risk factors in different age groups and for the ability of the cardiometabolic risk score to predict incident type 2 diabetes, CVD and premature mortality in adults. Recent studies using CFA have found a single factor underlying MetS in children (17), adolescents (48) and adults (50). These studies have used parsimonious models with four variables to represent the features of the MetS. These models also fit the data in our four cohorts, although for the models using the triglycerides to HDL cholesterol ratio and MAP (17,50) instead of triglycerides and systolic blood pressure (48) the RMSEA was unacceptably high in middle-aged men and older women. The pathophysiology of the MetS is not well understood, but multiple genetic and lifestyle factors certainly interact in its development (12,236). Even though the MetS does not have a single cause, findings from our study and other studies suggest that the MetS can be described as a single entity in cohorts ranging from children to older adults, and in men and women (17,48-50,237). However, this does not confirm the significance of MetS as a diagnostic category, which is much disputed (37). In a recent study among women, a number of combinations of risk factors were entered in the CFA and the factors identified predicted type 2 diabetes and CVD (238). However, there is little evidence on whether the factorial structure of MetS works in the same way in different stages of life. In a recent study among Estonian and Swedish young people a single factor describing MetS was stable across puberty (237). We identified a similar MetS factor in children, middleaged men and older men and women by CFA, although waist circumference was a less prominent determinant in children than in adults, and blood pressure loaded more heavily in middle-aged men than in children or older adults. The accumulation of fat, particularly in the abdominal or visceral region, is considered a key feature of MetS (29). The present CFA suggests that clustering of cardiometabolic risk factors seems to exist among children in a corresponding manner as among middle-aged and older 49 adults, although waist circumference seemed to be a more crucial factor in adults than in children. This may partly be due to the lesser number of overweight or obese individuals and a shorter exposure to the adverse cardiometabolic consequences of overweight among children than among adults. Another reason for our finding may be that fat is more evenly distributed in the body of children (239,240). Abdominal adiposity, assessed by waist circumference in our study, may therefore provide less information beyond overall adiposity in predicting cardiometabolic risk in children than in adults. Also, the variation of body adiposity is relatively small in our study population of children. Central adiposity was less prominent in our study population of children than in previous studies in children (17,237). Only a few children were obese (3.9%) and also the prevalence of overweight, defined by the IOTF criteria (200), was relatively low (8.4%), which may have reduced factor loading for waist circumference. Insulin resistance is also an important feature of MetS (2,12,29). Excess fat accumulation in the liver has been observed to increase hepatic gluconeogenesis, lipogenesis and triglyceride secretion (19,233). Consistent with these findings, we observed that fasting serum insulin and plasma triglycerides were key components of MetS in all age groups and in both genders. As in other studies (17,48-50,237) elevated blood pressure was a less prominent feature of the MetS than other core features. Blood pressure loaded more strongly on the MetS factor in middle-aged men than in the other cohorts. In older men and women, the reason for this is partly, but not entirely, that antihypertensive medication confounds the association between blood pressure and cardiometabolic risk. Blood pressure medication was associated with more pronounced features of the MetS, but antihypertensive medication lowers blood pressure, thus attenuating the relationship of blood pressure to the MetS. The use of blood pressure medication was especially prevalent in older men and women (almost 40%). In the first-order CFAs, the loading of blood pressure was higher (0.24 – 0.31 in women and 0.18 – 0.26 in men) in older men and women not using antihypertensive medications than in all older men and women. This obviously does not explain the lower loading of blood pressure in children. It may be that blood pressure is more adversely affected by risk factors after a longer exposure. Blood pressure also generally loaded more weakly on the MetS factor in the first-order CFA model using systolic blood pressure instead of MAP. This is probably because systolic blood pressure was slightly less strongly associated with features of the MetS than diastolic blood pressure or MAP. The substitution of diastolic blood pressure or MAP for systolic blood pressure gave higher loadings. 6.2.3 Associations of I148M variant in PNPLA3 gene with plasma ALT levels during 2-year follow-up in normal weight and overweight children (Study III) Study III showed that plasma ALT levels were higher at baseline and after the 2-year follow-up and that plasma ALT levels increased more during the 2-year follow-up in the PNPLA3 148M allele carriers than in the non-carriers if they were overweight but not if they had a normal body weight. These differences were independent of a number of possible confounding factors. Other studies in Caucasian populations have included only obese children and have shown that the PNPLA3 148M allele carriers have higher plasma ALT levels than the non-carriers (177,178). However, studies in Hispanic children, who have a higher proportion of the 148M allele carriers than most other populations, have reported higher plasma ALT levels in the 148M allele carriers than in the non-carriers not only among overweight or obese children but also among normal weight children (28,176). The results of Study III are in line with those of previous studies which suggest that the association of the I148M allele with hepatic fat accumulation or higher plasma ALT levels is evident in the presence of adiposity-related risk factors, such as severe obesity (25) and visceral adiposity (177). There were no associations of the PNPLA3 rs738409 polymorphism with plasma GGT levels, measures of body fat content or markers of glucose and lipid metabolism, including BMI-SDS, body fat percentage, waist 50 circumference, insulin, glucose, triglycerides, LDL cholesterol and HDL cholesterol. There are no previous reports on the associations of the PNPLA3 rs738409 polymorphism with plasma levels of GGT in children. Some previous studies in adults have not shown an association between PNPLA3 rs738409 polymorphism and GGT (174), but one recent study found such an association (241). Other previous studies among children have not reported an association of the PNPLA3 I148M polymorphism with measures of glucose metabolism, either (28,174,176,177). The results of some studies in children suggest that the 148M allele carriers have lower plasma levels of HDL cholesterol and a lower BMI than the non-carriers (28,176), but some other studies in children have not confirmed these findings (174,177). 51 7 Conclusions 1. MetS can be represented as a single entity in children, middle-aged men, and older women and men by confirmatory factor analysis. The cardiometabolic risk score consisting of common features of MetS can be used to assess the clustering of cardiometabolic risk factors not only in children, but also in different stages of adulthood. Moreover, the cardiometabolic risk score predicts incident type 2 diabetes, myocardial infarction, and premature CVD and overall mortality similarly to MetS factors derived from first- and second-order CFAs. Thus the cardiometabolic risk score is a useful tool for research evaluating cardiometabolic risk in different age groups. 2. The clustering of cardiometabolic risk factors, particularly excess body fat content, was associated with high-normal plasma levels of ALT and particularly GGT in children. Liver fat accumulation may play an important role in the pathogenesis of MetS and its consequences beginning already in childhood. 3. Healthy children who carry the 148M allele of the PNPLA3 rs738409 polymorphism had high-normal plasma levels of ALT if they were overweight but not if they had a normal body weight. On the other hand, overweight children had higher plasma ALT levels than normal weight children even without the risk allele. These findings suggest that the early prevention of overweight particularly among children carrying the PNPLA3 148M allele may help avoid liver fat accumulation and the development of NAFLD. 7.1 Clinical implications The findings of the present study suggest that plasma GGT and ALT could be used as continuous biomarkers of cardiometabolic risk not only in adults but also in prepubertal children and that the adult cut-off points may be too high for children. When evaluating the risk of type 2 diabetes and CVD in clinical practice, attention should be paid to the levels of all major cardiometabolic risk factors. The findings of this study also emphasize the early prevention of overweight among children and particularly among those carrying the PNPLA3 148M allele to avoid liver fat accumulation and the development of NAFLD. 7.2 Future research prospectives Based on the present study, future research is needed to find clinically useful cut-off points for plasma ALT and GGT as well as other cardiometabolic risk factors among children. Studies on the associations of cardiometabolic risk factors with liver fat accumulation assessed using MRI and the effects of lifestyle interventions on hepatic fat accumulation in population samples of healthy children would be scientifically interesting and important. Plasma levels of liver enzymes should be measured more actively among obese and even overweight children. Moreover, the role of PNPLA3 gene variant in the accumulation of liver fat as assessed by MRI should be studied in normal weight and overweight children. Furthermore, to use the cardiometabolic risk score in clinical practice, further research is needed to define the population-specific cut-off points for the identification of high-risk individuals. The early 52 detection of children at increased risk of MetS and lifestyle interventions targeted to these children are important to prevent or at least delay the onset of MetS and related disorders. 53 References (1) Alberti KG, Eckel RH, Grundy SM, Zimmet PZ, Cleeman JI, Donato KA, et al. Harmonizing the metabolic syndrome: a joint interim statement of the International Diabetes Federation Task Force on Epidemiology and Prevention; National Heart, Lung, and Blood Institute; American Heart Association; World Heart Federation; International Atherosclerosis Society; and International Association for the Study of Obesity. Circulation 2009 Oct 20;120(16):1640-1645. (2) Kassi E, Pervanidou P, Kaltsas G, Chrousos G. Metabolic syndrome: definitions and controversies. BMC Med 2011 May 5;9:48. (3) Grundy SM. Metabolic syndrome pandemic. Arterioscler Thromb Vasc Biol 2008 Apr;28(4):629-636. (4) Flegal KM, Carroll MD, Kit BK, Ogden CL. Prevalence of obesity and trends in the distribution of body mass index among US adults, 1999-2010. JAMA 2012 Feb 1;307(5):491-497. (5) Morrison JA, Friedman LA, Gray-McGuire C. Metabolic syndrome in childhood predicts adult cardiovascular disease 25 years later: the Princeton Lipid Research Clinics Follow-up Study. Pediatrics 2007 Aug;120(2):340-345. (6) Morrison JA, Friedman LA, Wang P, Glueck CJ. Metabolic syndrome in childhood predicts adult metabolic syndrome and type 2 diabetes mellitus 25 to 30 years later. J Pediatr 2008 Feb;152(2):201-206. (7) Laaksonen DE, Lakka HM, Niskanen LK, Kaplan GA, Salonen JT, Lakka TA. Metabolic syndrome and development of diabetes mellitus: application and validation of recently suggested definitions of the metabolic syndrome in a prospective cohort study. Am J Epidemiol 2002 Dec 1;156(11):1070-1077. (8) Alexander CM, Landsman PB, Teutsch SM, Haffner SM, Third National Health and Nutrition Examination Survey (NHANES III), National Cholesterol Education Program (NCEP). NCEP-defined metabolic syndrome, diabetes, and prevalence of coronary heart disease among NHANES III participants age 50 years and older. Diabetes 2003 May;52(5):1210-1214. (9) McNeill AM, Rosamond WD, Girman CJ, Golden SH, Schmidt MI, East HE, et al. The metabolic syndrome and 11-year risk of incident cardiovascular disease in the atherosclerosis risk in communities study. Diabetes Care 2005 Feb;28(2):385-390. (10) Lakka HM, Laaksonen DE, Lakka TA, Niskanen LK, Kumpusalo E, Tuomilehto J, et al. The metabolic syndrome and total and cardiovascular disease mortality in middle-aged men. JAMA 2002 Dec 4;288(21):2709-2716. (11) Brambilla P, Lissau I, Flodmark CE, Moreno LA, Widhalm K, Wabitsch M, et al. Metabolic risk-factor clustering estimation in children: to draw a line across pediatric metabolic syndrome. Int J Obes (Lond) 2007 Apr;31(4):591-600. 54 (12) Steinberger J, Daniels SR, Eckel RH, Hayman L, Lustig RH, McCrindle B, et al. Progress and challenges in metabolic syndrome in children and adolescents: a scientific statement from the American Heart Association Atherosclerosis, Hypertension, and Obesity in the Young Committee of the Council on Cardiovascular Disease in the Young; Council on Cardiovascular Nursing; and Council on Nutrition, Physical Activity, and Metabolism. Circulation 2009 Feb 3;119(4):628-647. (13) Andersen LB, Harro M, Sardinha LB, Froberg K, Ekelund U, Brage S, et al. Physical activity and clustered cardiovascular risk in children: a cross-sectional study (The European Youth Heart Study). Lancet 2006 Jul 22;368(9532):299-304. (14) Eisenmann JC, Laurson KR, DuBose KD, Smith BK, Donnelly JE. Construct validity of a continuous metabolic syndrome score in children. Diabetol Metab Syndr 2010 Jan 28;2:8. (15) Pandit D, Chiplonkar S, Khadilkar A, Kinare A, Khadilkar V. Efficacy of a continuous metabolic syndrome score in Indian children for detecting subclinical atherosclerotic risk. Int J Obes (Lond) 2011 Oct;35(10):1318-1324. (16) Hanley AJ, Karter AJ, Festa A, D'Agostino R,Jr, Wagenknecht LE, Savage P, et al. Factor analysis of metabolic syndrome using directly measured insulin sensitivity: The Insulin Resistance Atherosclerosis Study. Diabetes 2002 Aug;51(8):2642-2647. (17) Martinez-Vizcaino V, Martinez MS, Aguilar FS, Martinez SS, Gutierrez RF, Lopez MS, et al. Validity of a single-factor model underlying the metabolic syndrome in children: a confirmatory factor analysis. Diabetes Care 2010 Jun;33(6):1370-1372. (18) Hillier TA, Rousseau A, Lange C, Lepinay P, Cailleau M, Novak M, et al. Practical way to assess metabolic syndrome using a continuous score obtained from principal components analysis. Diabetologia 2006 Jul;49(7):1528-1535. (19) Widhalm K, Ghods E. Nonalcoholic fatty liver disease: a challenge for pediatricians. Int J Obes (Lond) 2010 Oct;34(10):1451-1467. (20) Giorgio V, Prono F, Graziano F, Nobili V. Pediatric non alcoholic fatty liver disease: old and new concepts on development, progression, metabolic insight and potential treatment targets. BMC Pediatr 2013 Mar 25;13:40-2431-13-40. (21) Rodriguez G, Gallego S, Breidenassel C, Moreno LA, Gottrand F. Is liver transaminases assessment an appropriate tool for the screening of non-alcoholic fatty liver disease in at risk obese children and adolescents? Nutr Hosp 2010 Sep-Oct;25(5):712-717. (22) Goran MI, Walker R, Allayee H. Genetic-related and carbohydrate-related factors affecting liver fat accumulation. Curr Opin Clin Nutr Metab Care 2012 Jul;15(4):392-396. (23) Li YY. Genetic and epigenetic variants influencing the development of nonalcoholic fatty liver disease. World J Gastroenterol 2012 Dec 7;18(45):6546-6551. 55 (24) Romeo S, Kozlitina J, Xing C, Pertsemlidis A, Cox D, Pennacchio LA, et al. Genetic variation in PNPLA3 confers susceptibility to nonalcoholic fatty liver disease. Nat Genet 2008 Dec;40(12):1461-1465. (25) Romeo S, Sentinelli F, Dash S, Yeo GS, Savage DB, Leonetti F, et al. Morbid obesity exposes the association between PNPLA3 I148M (rs738409) and indices of hepatic injury in individuals of European descent. Int J Obes (Lond) 2010 Jan;34(1):190-194. (26) Sookoian S, Pirola CJ. Meta-analysis of the influence of I148M variant of patatin-like phospholipase domain containing 3 gene (PNPLA3) on the susceptibility and histological severity of nonalcoholic fatty liver disease. Hepatology 2011 Jun;53(6):1883-1894. (27) Li Q, Qu HQ, Rentfro AR, Grove ML, Mirza S, Lu Y, et al. PNPLA3 polymorphisms and liver aminotransferase levels in a Mexican American population. Clin Invest Med 2012 Aug 4;35(4):E237-45. (28) Larrieta-Carrasco E, Leon-Mimila P, Villarreal-Molina T, Villamil-Ramirez H, RomeroHidalgo S, Jacobo-Albavera L, et al. Association of the I148M/PNPLA3 variant with elevated alanine transaminase levels in normal-weight and overweight/obese Mexican children. Gene 2013 May 15;520(2):185-188. (29) Cornier MA, Dabelea D, Hernandez TL, Lindstrom RC, Steig AJ, Stob NR, et al. The metabolic syndrome. Endocr Rev 2008 Dec;29(7):777-822. (30) Qiao Q, Laatikainen T, Zethelius B, Stegmayr B, Eliasson M, Jousilahti P, et al. Comparison of definitions of metabolic syndrome in relation to the risk of developing stroke and coronary heart disease in Finnish and Swedish cohorts. Stroke 2009 Feb;40(2):337-343. (31) Reaven GM. Banting lecture 1988. Role of insulin resistance in human disease. Diabetes 1988 Dec;37(12):1595-1607. (32) Alberti KG, Zimmet PZ. Definition, diagnosis and classification of diabetes mellitus and its complications. Part 1: diagnosis and classification of diabetes mellitus provisional report of a WHO consultation. Diabet Med 1998 Jul;15(7):539-553. (33) Balkau B, Charles MA. Comment on the provisional report from the WHO consultation. European Group for the Study of Insulin Resistance (EGIR). Diabet Med 1999 May;16(5):442443. (34) Expert Panel on Detection, Evaluation, and Treatment of High Blood Cholesterol in Adults. Executive Summary of The Third Report of The National Cholesterol Education Program (NCEP) Expert Panel on Detection, Evaluation, And Treatment of High Blood Cholesterol In Adults (Adult Treatment Panel III). JAMA 2001 May 16;285(19):2486-2497. (35) Bloomgarden ZT. American Association of Clinical Endocrinologists (AACE) consensus conference on the insulin resistance syndrome: 25-26 August 2002, Washington, DC. Diabetes Care 2003 Apr;26(4):1297-1303. 56 (36) Lorenzo C, Williams K, Hunt KJ, Haffner SM. The National Cholesterol Education Program - Adult Treatment Panel III, International Diabetes Federation, and World Health Organization definitions of the metabolic syndrome as predictors of incident cardiovascular disease and diabetes. Diabetes Care 2007 Jan;30(1):8-13. (37) Reaven GM. The metabolic syndrome: time to get off the merry-go-round? J Intern Med 2011 Feb;269(2):127-136. (38) Kim SH, Reaven GM. The metabolic syndrome: one step forward, two steps back. Diab Vasc Dis Res 2004 Oct;1(2):68-75. (39) Meigs JB. Invited commentary: insulin resistance syndrome? Syndrome X? Multiple metabolic syndrome? A syndrome at all? Factor analysis reveals patterns in the fabric of correlated metabolic risk factors. Am J Epidemiol 2000 Nov 15;152(10):908-11; discussion 912. (40) Mannucci E, Monami M, Rotella CM. How many components for the metabolic syndrome? Results of exploratory factor analysis in the FIBAR study. Nutr Metab Cardiovasc Dis 2007 Dec;17(10):719-726. (41) Ford ES, Li C. Defining the metabolic syndrome in children and adolescents: will the real definition please stand up? J Pediatr 2008 Feb;152(2):160-164. (42) Lafortuna CL, Adorni F, Agosti F, De Col A, Zennaro R, Caranti D, et al. Factor analysis of metabolic syndrome components in severely obese girls and boys. J Endocrinol Invest 2009 Jun;32(6):552-558. (43) Khader YS, Batieha A, Jaddou H, Batieha Z, El-Khateeb M, Ajlouni K. Factor analysis of cardiometabolic risk factors clustering in children and adolescents. Metab Syndr Relat Disord 2011 Apr;9(2):151-156. (44) Ayubi E, Khalili D, Delpisheh A, Hadaegh F, Azizi F. A factor analysis of the metabolic syndrome components and predicting type 2 diabetes: Result of 10 year follow-up in a Middle East population. J Diabetes 2014 Dec 10. (45) Shen BJ, Goldberg RB, Llabre MM, Schneiderman N. Is the factor structure of the metabolic syndrome comparable between men and women and across three ethnic groups: the Miami Community Health Study. Ann Epidemiol 2006 Feb;16(2):131-137. (46) Hu FB. Re: "Clustering of procoagulation, inflammation, and fibrinolysis variables with metabolic factors in insulin resistance syndrome". Am J Epidemiol 2001 Apr 1;153(7):717-718. (47) Child D. The Essentials of factor analysis. 2nd ed. London: Cassell; 1990. (48) Li C, Ford ES. Is there a single underlying factor for the metabolic syndrome in adolescents? A confirmatory factor analysis. Diabetes Care 2007 Jun;30(6):1556-1561. (49) Shen BJ, Todaro JF, Niaura R, McCaffery JM, Zhang J, Spiro A,3rd, et al. Are metabolic risk factors one unified syndrome? Modeling the structure of the metabolic syndrome X. Am J Epidemiol 2003 Apr 15;157(8):701-711. 57 (50) Pladevall M, Singal B, Williams LK, Brotons C, Guyer H, Sadurni J, et al. A single factor underlies the metabolic syndrome: a confirmatory factor analysis. Diabetes Care 2006 Jan;29(1):113-122. (51) Wijndaele K, Beunen G, Duvigneaud N, Matton L, Duquet W, Thomis M, et al. A continuous metabolic syndrome risk score: utility for epidemiological analyses. Diabetes Care 2006 Oct;29(10):2329. (52) Kahn R, Buse J, Ferrannini E, Stern M. The metabolic syndrome: time for a critical appraisal. Joint statement from the American Diabetes Association and the European Association for the Study of Diabetes. Diabetologia 2005 Sep;48(9):1684-1699. (53) Zimmet P, Alberti KG, Kaufman F, Tajima N, Silink M, Arslanian S, et al. The metabolic syndrome in children and adolescents - an IDF consensus report. Pediatr Diabetes 2007 Oct;8(5):299-306. (54) Cook S, Weitzman M, Auinger P, Nguyen M, Dietz WH. Prevalence of a metabolic syndrome phenotype in adolescents: findings from the third National Health and Nutrition Examination Survey, 1988-1994. Arch Pediatr Adolesc Med 2003 Aug;157(8):821-827. (55) Cruz ML, Weigensberg MJ, Huang TT, Ball G, Shaibi GQ, Goran MI. The metabolic syndrome in overweight Hispanic youth and the role of insulin sensitivity. J Clin Endocrinol Metab 2004 Jan;89(1):108-113. (56) de Ferranti SD, Gauvreau K, Ludwig DS, Neufeld EJ, Newburger JW, Rifai N. Prevalence of the metabolic syndrome in American adolescents: findings from the Third National Health and Nutrition Examination Survey. Circulation 2004 Oct 19;110(16):2494-2497. (57) Weiss R, Dziura J, Burgert TS, Tamborlane WV, Taksali SE, Yeckel CW, et al. Obesity and the metabolic syndrome in children and adolescents. N Engl J Med 2004 Jun 3;350(23):23622374. (58) Ford ES, Ajani UA, Mokdad AH, National Health and Nutrition Examination. The metabolic syndrome and concentrations of C-reactive protein among U.S. youth. Diabetes Care 2005 Apr;28(4):878-881. (59) Eisenmann JC. On the use of a continuous metabolic syndrome score in pediatric research. Cardiovasc Diabetol 2008 Jun 5;7:17. (60) Magnussen CG, Koskinen J, Chen W, Thomson R, Schmidt MD, Srinivasan SR, et al. Pediatric metabolic syndrome predicts adulthood metabolic syndrome, subclinical atherosclerosis, and type 2 diabetes mellitus but is no better than body mass index alone: the Bogalusa Heart Study and the Cardiovascular Risk in Young Finns Study. Circulation 2010 Oct 19;122(16):1604-1611. (61) Ekelund U, Anderssen SA, Froberg K, Sardinha LB, Andersen LB, Brage S, et al. Independent associations of physical activity and cardiorespiratory fitness with metabolic risk factors in children: the European youth heart study. Diabetologia 2007 Sep;50(9):1832-1840. 58 (62) Okosun IS, Lyn R, Davis-Smith M, Eriksen M, Seale P. Validity of a continuous metabolic risk score as an index for modeling metabolic syndrome in adolescents. Ann Epidemiol 2010 Nov;20(11):843-851. (63) Misra A, Khurana L. Obesity and the metabolic syndrome in developing countries. J Clin Endocrinol Metab 2008 Nov;93(11 Suppl 1):S9-30. (64) Ervin RB. Prevalence of metabolic syndrome among adults 20 years of age and over, by sex, age, race and ethnicity, and body mass index: United States, 2003-2006. Natl Health Stat Report 2009 May 5;(13)(13):1-7. (65) Cameron AJ, Shaw JE, Zimmet PZ. The metabolic syndrome: prevalence in worldwide populations. Endocrinol Metab Clin North Am 2004 Jun;33(2):351-75, table of contents. (66) Ilanne-Parikka P, Eriksson JG, Lindström J, Hämäläinen H, Keinänen-Kiukaanniemi S, Laakso M, et al. Prevalence of the metabolic syndrome and its components: findings from a Finnish general population sample and the Diabetes Prevention Study cohort. Diabetes Care 2004 Sep;27(9):2135-2140. (67) Mattsson N, Ronnemaa T, Juonala M, Viikari JS, Raitakari OT. Childhood predictors of the metabolic syndrome in adulthood. The Cardiovascular Risk in Young Finns Study. Ann Med 2008;40(7):542-552. (68) Friend A, Craig L, Turner S. The prevalence of metabolic syndrome in children: a systematic review of the literature. Metab Syndr Relat Disord 2013 Apr;11(2):71-80. (69) Kautiainen S, Rimpelä A, Vikat A, Virtanen SM. Secular trends in overweight and obesity among Finnish adolescents in 1977-1999. Int J Obes Relat Metab Disord 2002 Apr;26(4):544-552. (70) Vuorela N, Saha MT, Salo M. Prevalence of overweight and obesity in 5- and 12-year-old Finnish children in 1986 and 2006. Acta Paediatr 2009 Mar;98(3):507-512. (71) Pollex RL, Hegele RA. Genetic determinants of the metabolic syndrome. Nat Clin Pract Cardiovasc Med 2006 Sep;3(9):482-489. (72) Sale MM, Woods J, Freedman BI. Genetic determinants of the metabolic syndrome. Curr Hypertens Rep 2006 Apr;8(1):16-22. (73) Teran-Garcia M, Bouchard C. Genetics of the metabolic syndrome. Appl Physiol Nutr Metab 2007 Feb;32(1):89-114. (74) Pankow JS, Jacobs DR,Jr, Steinberger J, Moran A, Sinaiko AR. Insulin resistance and cardiovascular disease risk factors in children of parents with the insulin resistance (metabolic) syndrome. Diabetes Care 2004 Mar;27(3):775-780. (75) Bao W, Srinivasan SR, Valdez R, Greenlund KJ, Wattigney WA, Berenson GS. Longitudinal changes in cardiovascular risk from childhood to young adulthood in offspring of parents with coronary artery disease: the Bogalusa Heart Study. JAMA 1997 Dec 3;278(21):1749-1754. 59 (76) Mitchell BD, Kammerer CM, Mahaney MC, Blangero J, Comuzzie AG, Atwood LD, et al. Genetic analysis of the IRS. Pleiotropic effects of genes influencing insulin levels on lipoprotein and obesity measures. Arterioscler Thromb Vasc Biol 1996 Feb;16(2):281-288. (77) Edwards KL, Newman B, Mayer E, Selby JV, Krauss RM, Austin MA. Heritability of factors of the insulin resistance syndrome in women twins. Genet Epidemiol 1997;14(3):241-253. (78) Hong Y, Pedersen NL, Brismar K, de Faire U. Genetic and environmental architecture of the features of the insulin-resistance syndrome. Am J Hum Genet 1997 Jan;60(1):143-152. (79) Pietiläinen KH, Bergholm R, Rissanen A, Kaprio J, Häkkinen AM, Sattar N, et al. Effects of acquired obesity on endothelial function in monozygotic twins. Obesity (Silver Spring) 2006 May;14(5):826-837. (80) Lakka TA, Laaksonen DE, Lakka HM, Männikko N, Niskanen LK, Rauramaa R, et al. Sedentary lifestyle, poor cardiorespiratory fitness, and the metabolic syndrome. Med Sci Sports Exerc 2003 Aug;35(8):1279-1286. (81) Nocon M, Hiemann T, Muller-Riemenschneider F, Thalau F, Roll S, Willich SN. Association of physical activity with all-cause and cardiovascular mortality: a systematic review and metaanalysis. Eur J Cardiovasc Prev Rehabil 2008 Jun;15(3):239-246. (82) Tuomilehto J, Lindström J, Eriksson JG, Valle TT, Hämäläinen H, Ilanne-Parikka P, et al. Prevention of type 2 diabetes mellitus by changes in lifestyle among subjects with impaired glucose tolerance. N Engl J Med 2001 May 3;344(18):1343-1350. (83) LaMonte MJ, Barlow CE, Jurca R, Kampert JB, Church TS, Blair SN. Cardiorespiratory fitness is inversely associated with the incidence of metabolic syndrome: a prospective study of men and women. Circulation 2005 Jul 26;112(4):505-512. (84) Hassinen M, Lakka TA, Savonen K, Litmanen H, Kiviaho L, Laaksonen DE, et al. Cardiorespiratory fitness as a feature of metabolic syndrome in older men and women: the Dose-Responses to Exercise Training study (DR's EXTRA). Diabetes Care 2008 Jun;31(6):12421247. (85) Pereira S, Pereira D. Metabolic syndrome and physical activity. Acta Med Port 2011 SepOct;24(5):785-790. (86) Pietiläinen KH, Kaprio J, Borg P, Plasqui G, Yki-Järvinen H, Kujala UM, et al. Physical inactivity and obesity: a vicious circle. Obesity (Silver Spring) 2008 Feb;16(2):409-414. (87) Owen CG, Nightingale CM, Rudnicka AR, Sattar N, Cook DG, Ekelund U, et al. Physical activity, obesity and cardiometabolic risk factors in 9- to 10-year-old UK children of white European, South Asian and black African-Caribbean origin: the Child Heart And health Study in England (CHASE). Diabetologia 2010 Aug;53(8):1620-1630. (88) Rauner A, Mess F, Woll A. The relationship between physical activity, physical fitness and overweight in adolescents: a systematic review of studies published in or after 2000. BMC Pediatr 2013 Feb 1;13:19-2431-13-19. 60 (89) Väisto J, Eloranta AM, Viitasalo A, Tompuri T, Lintu N, Karjalainen P, et al. Physical activity and sedentary behaviour in relation to cardiometabolic risk in children: cross-sectional findings from the Physical Activity and Nutrition in Children (PANIC) Study. Int J Behav Nutr Phys Act 2014 Apr 26;11:55-5868-11-55. (90) Recommendations for the physical activity of school-aged children. Ministry of Education of Finland and Young Finland. Helsinki 2008. 2008. (91) Esmaillzadeh A, Kimiagar M, Mehrabi Y, Azadbakht L, Hu FB, Willett WC. Fruit and vegetable intakes, C-reactive protein, and the metabolic syndrome. Am J Clin Nutr 2006 Dec;84(6):1489-1497. (92) Sahyoun NR, Jacques PF, Zhang XL, Juan W, McKeown NM. Whole-grain intake is inversely associated with the metabolic syndrome and mortality in older adults. Am J Clin Nutr 2006 Jan;83(1):124-131. (93) Lutsey PL, Steffen LM, Stevens J. Dietary intake and the development of the metabolic syndrome: the Atherosclerosis Risk in Communities study. Circulation 2008 Feb 12;117(6):754761. (94) Pasanisi F, Contaldo F, de Simone G, Mancini M. Benefits of sustained moderate weight loss in obesity. Nutr Metab Cardiovasc Dis 2001 Dec;11(6):401-406. (95) Ilanne-Parikka P, Eriksson JG, Lindström J, Peltonen M, Aunola S, Hämäläinen H, et al. Effect of lifestyle intervention on the occurrence of metabolic syndrome and its components in the Finnish Diabetes Prevention Study. Diabetes Care 2008 Apr;31(4):805-807. (96) Orchard TJ, Temprosa M, Goldberg R, Haffner S, Ratner R, Marcovina S, et al. The effect of metformin and intensive lifestyle intervention on the metabolic syndrome: the Diabetes Prevention Program randomized trial. Ann Intern Med 2005 Apr 19;142(8):611-619. (97) Rodriguez G, Moreno LA. Is dietary intake able to explain differences in body fatness in children and adolescents? Nutr Metab Cardiovasc Dis 2006 May;16(4):294-301. (98) Moreno LA, Rodriguez G. Dietary risk factors for development of childhood obesity. Curr Opin Clin Nutr Metab Care 2007 May;10(3):336-341. (99) Toschke AM, Thorsteinsdottir KH, von Kries R, GME Study Group. Meal frequency, breakfast consumption and childhood obesity. Int J Pediatr Obes 2009;4(4):242-248. (100) Webber L, Hill C, Saxton J, Van Jaarsveld CH, Wardle J. Eating behaviour and weight in children. Int J Obes (Lond) 2009 Jan;33(1):21-28. (101) Eloranta AM, Lindi V, Schwab U, Tompuri T, Kiiskinen S, Lakka HM, et al. Dietary factors associated with overweight and body adiposity in Finnish children aged 6-8 years: the PANIC Study. Int J Obes (Lond) 2012 Jul;36(7):950-955. (102) Eloranta AM, Lindi V, Schwab U, Kiiskinen S, Venäläinen T, Lakka HM, et al. Dietary factors associated with metabolic risk score in Finnish children aged 6-8 years: the PANIC study. Eur J Nutr 2013 Dec 30. 61 (103) Barker DJ. Maternal nutrition and cardiovascular disease. Nutr Health 1993;9(2):99-106. (104) Barker DJ, Gluckman PD, Godfrey KM, Harding JE, Owens JA, Robinson JS. Fetal nutrition and cardiovascular disease in adult life. Lancet 1993 Apr 10;341(8850):938-941. (105) Bavdekar A, Yajnik CS, Fall CH, Bapat S, Pandit AN, Deshpande V, et al. Insulin resistance syndrome in 8-year-old Indian children: small at birth, big at 8 years, or both? Diabetes 1999 Dec;48(12):2422-2429. (106) Sookoian S, Pirola CJ. Epigenetics of insulin resistance: an emerging field in translational medicine. Curr Diab Rep 2013 Apr;13(2):229-237. (107) Burguet A. Long-term outcome in children of mothers with gestational diabetes. Diabetes Metab 2010 Dec;36(6 Pt 2):682-694. (108) Laitinen TT, Pahkala K, Venn A, Woo JG, Oikonen M, Dwyer T, et al. Childhood lifestyle and clinical determinants of adult ideal cardiovascular health: The Cardiovascular Risk in Young Finns Study, the Childhood Determinants of Adult Health Study, the Princeton Followup Study. Int J Cardiol 2013 Oct 30;169(2):126-132. (109) Yu M, Xu CX, Zhu HH, Hu RY, Zhang J, Wang H, et al. Associations of Cigarette Smoking and Alcohol Consumption With Metabolic Syndrome in a Male Chinese Population: A CrossSectional Study. J Epidemiol 2014 Jun 7. (110) Gundersen C, Mahatmya D, Garasky S, Lohman B. Linking psychosocial stressors and childhood obesity. Obes Rev 2011 May;12(5):e54-63. (111) Tamashiro KL. Metabolic syndrome: links to social stress and socioeconomic status. Ann N Y Acad Sci 2011 Aug;1231:46-55. (112) Halberg N, Wernstedt-Asterholm I, Scherer PE. The adipocyte as an endocrine cell. Endocrinol Metab Clin North Am 2008 Sep;37(3):753-68, x-xi. (113) Weiss R, Bremer AA, Lustig RH. What is metabolic syndrome, and why are children getting it? Ann N Y Acad Sci 2013 Apr;1281:123-140. (114) Taira S, Shimabukuro M, Higa M, Yabiku K, Kozuka C, Ueda R, et al. Lipid deposition in various sites of the skeletal muscles and liver exhibits a positive correlation with visceral fat accumulation in middle-aged Japanese men with metabolic syndrome. Intern Med 2013;52(14):1561-1571. (115) Kotronen A, Westerbacka J, Bergholm R, Pietiläinen KH, Yki-Järvinen H. Liver fat in the metabolic syndrome. J Clin Endocrinol Metab 2007 Sep;92(9):3490-3497. (116) Nyman K, Graner M, Pentikainen MO, Lundbom J, Hakkarainen A, Siren R, et al. Cardiac steatosis and left ventricular function in men with metabolic syndrome. J Cardiovasc Magn Reson 2013 Nov 14;15:103-429X-15-103. 62 (117) Hannukainen JC, Borra R, Linderborg K, Kallio H, Kiss J, Lepomäki V, et al. Liver and pancreatic fat content and metabolism in healthy monozygotic twins with discordant physical activity. J Hepatol 2011 Mar;54(3):545-552. (118) Koskinen J, Kähonen M, Viikari JS, Taittonen L, Laitinen T, Rönnemaa T, et al. Conventional cardiovascular risk factors and metabolic syndrome in predicting carotid intimamedia thickness progression in young adults: the cardiovascular risk in young Finns study. Circulation 2009 Jul 21;120(3):229-236. (119) Fox CS, Massaro JM, Hoffmann U, Pou KM, Maurovich-Horvat P, Liu CY, et al. Abdominal visceral and subcutaneous adipose tissue compartments: association with metabolic risk factors in the Framingham Heart Study. Circulation 2007 Jul 3;116(1):39-48. (120) Demerath EW, Reed D, Rogers N, Sun SS, Lee M, Choh AC, et al. Visceral adiposity and its anatomical distribution as predictors of the metabolic syndrome and cardiometabolic risk factor levels. Am J Clin Nutr 2008 Nov;88(5):1263-1271. (121) Suliga E. Visceral adipose tissue in children and adolescents: a review. Nutr Res Rev 2009 Dec;22(2):137-147. (122) Katzmarzyk PT, Shen W, Baxter-Jones A, Bell JD, Butte NF, Demerath EW, et al. Adiposity in children and adolescents: correlates and clinical consequences of fat stored in specific body depots. Pediatr Obes 2012 Oct;7(5):e42-61. (123) Large V, Arner P. Regulation of lipolysis in humans. Pathophysiological modulation in obesity, diabetes, and hyperlipidaemia. Diabetes Metab 1998 Nov;24(5):409-418. (124) Adiels M, Olofsson SO, Taskinen MR, Boren J. Overproduction of very low-density lipoproteins is the hallmark of the dyslipidemia in the metabolic syndrome. Arterioscler Thromb Vasc Biol 2008 Jul;28(7):1225-1236. (125) Boden G, Chen X, Capulong E, Mozzoli M. Effects of free fatty acids on gluconeogenesis and autoregulation of glucose production in type 2 diabetes. Diabetes 2001 Apr;50(4):810-816. (126) Tushuizen ME, Bunck MC, Pouwels PJ, Bontemps S, van Waesberghe JH, Schindhelm RK, et al. Pancreatic fat content and beta-cell function in men with and without type 2 diabetes. Diabetes Care 2007 Nov;30(11):2916-2921. (127) de Ferranti S, Mozaffarian D. The perfect storm: obesity, adipocyte dysfunction, and metabolic consequences. Clin Chem 2008 Jun;54(6):945-955. (128) Kaur J. A comprehensive review on metabolic syndrome. Cardiol Res Pract 2014;2014:943162. (129) Esser N, Legrand-Poels S, Piette J, Scheen AJ, Paquot N. Inflammation as a link between obesity, metabolic syndrome and type 2 diabetes. Diabetes Res Clin Pract 2014 Aug;105(2):141150. 63 (130) Bastard JP, Maachi M, Lagathu C, Kim MJ, Caron M, Vidal H, et al. Recent advances in the relationship between obesity, inflammation, and insulin resistance. Eur Cytokine Netw 2006 Mar;17(1):4-12. (131) Abbasi F, Brown BW,Jr, Lamendola C, McLaughlin T, Reaven GM. Relationship between obesity, insulin resistance, and coronary heart disease risk. J Am Coll Cardiol 2002 Sep 4;40(5):937-943. (132) Laakso M, Kuusisto J. Insulin resistance and hyperglycaemia in cardiovascular disease development. Nat Rev Endocrinol 2014 May;10(5):293-302. (133) DeFronzo RA, Tripathy D. Skeletal muscle insulin resistance is the primary defect in type 2 diabetes. Diabetes Care 2009 Nov;32 Suppl 2:S157-63. (134) Michael MD, Kulkarni RN, Postic C, Previs SF, Shulman GI, Magnuson MA, et al. Loss of insulin signaling in hepatocytes leads to severe insulin resistance and progressive hepatic dysfunction. Mol Cell 2000 Jul;6(1):87-97. (135) Yki-Järvinen H. Glucose toxicity. Endocr Rev 1992 Aug;13(3):415-431. (136) Begg DP, Woods SC. The endocrinology of food intake. Nat Rev Endocrinol 2013 Oct;9(10):584-597. (137) Olivieri O, Bassi A, Stranieri C, Trabetti E, Martinelli N, Pizzolo F, et al. Apolipoprotein CIII, metabolic syndrome, and risk of coronary artery disease. J Lipid Res 2003 Dec;44(12):23742381. (138) Boren J, Taskinen MR, Olofsson SO, Levin M. Ectopic lipid storage and insulin resistance: a harmful relationship. J Intern Med 2013 Jul;274(1):25-40. (139) Packard CJ, Demant T, Stewart JP, Bedford D, Caslake MJ, Schwertfeger G, et al. Apolipoprotein B metabolism and the distribution of VLDL and LDL subfractions. J Lipid Res 2000 Feb;41(2):305-318. (140) Tooke JE, Hannemann MM. Adverse endothelial function and the insulin resistance syndrome. J Intern Med 2000 Apr;247(4):425-431. (141) Salonen JT, Lakka TA, Lakka HM, Valkonen VP, Everson SA, Kaplan GA. Hyperinsulinemia is associated with the incidence of hypertension and dyslipidemia in middleaged men. Diabetes 1998 Feb;47(2):270-275. (142) Vogel RA. Cholesterol lowering and endothelial function. Am J Med 1999 Nov;107(5):479487. (143) Laaksonen DE, Niskanen L, Nyyssonen K, Lakka TA, Laukkanen JA, Salonen JT. Dyslipidaemia as a predictor of hypertension in middle-aged men. Eur Heart J 2008 Oct;29(20):2561-2568. (144) Lebovitz HE. Type 2 diabetes: an overview. Clin Chem 1999 Aug;45(8 Pt 2):1339-1345. 64 (145) Reaven GM. Insulin resistance, the insulin resistance syndrome, and cardiovascular disease. Panminerva Med 2005 Dec;47(4):201-210. (146) Laakso M. Cardiovascular disease in type 2 diabetes: challenge for treatment and prevention. J Intern Med 2001 Mar;249(3):225-235. (147) Juutilainen A, Kortelainen S, Lehto S, Rönnemaa T, Pyörälä K, Laakso M. Gender difference in the impact of type 2 diabetes on coronary heart disease risk. Diabetes Care 2004 Dec;27(12):2898-2904. (148) Juutilainen A, Lehto S, Rönnemaa T, Pyörälä K, Laakso M. Type 2 diabetes as a "coronary heart disease equivalent": an 18-year prospective population-based study in Finnish subjects. Diabetes Care 2005 Dec;28(12):2901-2907. (149) Dinneen SF, Gerstein HC. The association of microalbuminuria and mortality in noninsulin-dependent diabetes mellitus. A systematic overview of the literature. Arch Intern Med 1997 Jul 14;157(13):1413-1418. (150) Juutilainen A, Lehto S, Rönnemaa T, Pyörälä K, Laakso M. Proteinuria and metabolic syndrome as predictors of cardiovascular death in non-diabetic and type 2 diabetic men and women. Diabetologia 2006 Jan;49(1):56-65. (151) Juutilainen A, Lehto S, Rönnemaa T, Pyörälä K, Laakso M. Retinopathy predicts cardiovascular mortality in type 2 diabetic men and women. Diabetes Care 2007 Feb;30(2):292299. (152) Reinehr T. Type 2 diabetes mellitus in children and adolescents. World J Diabetes 2013 Dec 15;4(6):270-281. (153) Kotronen A, Yki-Järvinen H. Fatty liver: a novel component of the metabolic syndrome. Arterioscler Thromb Vasc Biol 2008 Jan;28(1):27-38. (154) Pacifico L, Nobili V, Anania C, Verdecchia P, Chiesa C. Pediatric nonalcoholic fatty liver disease, metabolic syndrome and cardiovascular risk. World J Gastroenterol 2011 Jul 14;17(26):3082-3091. (155) Adams LA, Lindor KD. Nonalcoholic fatty liver disease. Ann Epidemiol 2007 Nov;17(11):863-869. (156) Hjelkrem MC, Torres DM, Harrison SA. Nonalcoholic fatty liver disease. Minerva Med 2008 Dec;99(6):583-593. (157) Hamaguchi M, Kojima T, Takeda N, Nakagawa T, Taniguchi H, Fujii K, et al. The metabolic syndrome as a predictor of nonalcoholic fatty liver disease. Ann Intern Med 2005 Nov 15;143(10):722-728. (158) Kim HJ, Kim HJ, Lee KE, Kim DJ, Kim SK, Ahn CW, et al. Metabolic significance of nonalcoholic fatty liver disease in nonobese, nondiabetic adults. Arch Intern Med 2004 Oct 25;164(19):2169-2175. 65 (159) Clark JM, Diehl AM. Nonalcoholic fatty liver disease: an underrecognized cause of cryptogenic cirrhosis. JAMA 2003 Jun 11;289(22):3000-3004. (160) Bloomgarden ZT. Second World Congress on the Insulin Resistance Syndrome: insulin resistance syndrome and nonalcoholic fatty liver disease. Diabetes Care 2005 Jun;28(6):15181523. (161) Pacifico L, Poggiogalle E, Cantisani V, Menichini G, Ricci P, Ferraro F, et al. Pediatric nonalcoholic fatty liver disease: A clinical and laboratory challenge. World J Hepatol 2010 Jul 27;2(7):275-288. (162) Schwimmer JB, Deutsch R, Kahen T, Lavine JE, Stanley C, Behling C. Prevalence of fatty liver in children and adolescents. Pediatrics 2006 Oct;118(4):1388-1393. (163) Schwimmer JB, Behling C, Newbury R, Deutsch R, Nievergelt C, Schork NJ, et al. Histopathology of pediatric nonalcoholic fatty liver disease. Hepatology 2005 Sep;42(3):641-649. (164) Patton HM, Yates K, Unalp-Arida A, Behling CA, Huang TT, Rosenthal P, et al. Association between metabolic syndrome and liver histology among children with nonalcoholic Fatty liver disease. Am J Gastroenterol 2010 Sep;105(9):2093-2102. (165) Manco M, Marcellini M, Devito R, Comparcola D, Sartorelli MR, Nobili V. Metabolic syndrome and liver histology in paediatric non-alcoholic steatohepatitis. Int J Obes (Lond) 2008 Feb;32(2):381-387. (166) Ortega E, Koska J, Salbe AD, Tataranni PA, Bunt JC. Serum gamma-glutamyl transpeptidase is a determinant of insulin resistance independently of adiposity in Pima Indian children. J Clin Endocrinol Metab 2006 Apr;91(4):1419-1422. (167) Patel DA, Srinivasan SR, Chen W, Berenson GS. Serum alanine aminotransferase and its association with metabolic syndrome in children: the bogalusa heart study. Metab Syndr Relat Disord 2011 Jun;9(3):211-216. (168) Patel D, Srinivasan SR, Xu J, Chen W, Berenson GS. Persistent elevation of liver function enzymes within the reference range is associated with increased cardiovascular risk in young adults: the Bogalusa Heart Study. Metabolism 2007;56:792-798. (169) He S, McPhaul C, Li JZ, Garuti R, Kinch L, Grishin NV, et al. A sequence variation (I148M) in PNPLA3 associated with nonalcoholic fatty liver disease disrupts triglyceride hydrolysis. J Biol Chem 2010 Feb 26;285(9):6706-6715. (170) Huang Y, Cohen JC, Hobbs HH. Expression and characterization of a PNPLA3 protein isoform (I148M) associated with nonalcoholic fatty liver disease. J Biol Chem 2011 Oct 28;286(43):37085-37093. (171) Kantartzis K, Peter A, Machicao F, Machann J, Wagner S, Konigsrainer I, et al. Dissociation between fatty liver and insulin resistance in humans carrying a variant of the patatin-like phospholipase 3 gene. Diabetes 2009 Nov;58(11):2616-2623. 66 (172) Kotronen A, Johansson LE, Johansson LM, Roos C, Westerbacka J, Hamsten A, et al. A common variant in PNPLA3, which encodes adiponutrin, is associated with liver fat content in humans. Diabetologia 2009 Jun;52(6):1056-1060. (173) Sookoian S, Castano GO, Burgueno AL, Gianotti TF, Rosselli MS, Pirola CJ. A nonsynonymous gene variant in the adiponutrin gene is associated with nonalcoholic fatty liver disease severity. J Lipid Res 2009 Oct;50(10):2111-2116. (174) Valenti L, Alisi A, Galmozzi E, Bartuli A, Del Menico B, Alterio A, et al. I148M patatin-like phospholipase domain-containing 3 gene variant and severity of pediatric nonalcoholic fatty liver disease. Hepatology 2010 Oct;52(4):1274-1280. (175) Valenti L, Al-Serri A, Daly AK, Galmozzi E, Rametta R, Dongiovanni P, et al. Homozygosity for the patatin-like phospholipase-3/adiponutrin I148M polymorphism influences liver fibrosis in patients with nonalcoholic fatty liver disease. Hepatology 2010 Apr;51(4):1209-1217. (176) Goran MI, Walker R, Le KA, Mahurkar S, Vikman S, Davis JN, et al. Effects of PNPLA3 on liver fat and metabolic profile in Hispanic children and adolescents. Diabetes 2010 Dec;59(12):3127-3130. (177) Giudice EM, Grandone A, Cirillo G, Santoro N, Amato A, Brienza C, et al. The association of PNPLA3 variants with liver enzymes in childhood obesity is driven by the interaction with abdominal fat. PLoS One 2011;6(11):e27933. (178) Romeo S, Sentinelli F, Cambuli VM, Incani M, Congiu T, Matta V, et al. The 148M allele of the PNPLA3 gene is associated with indices of liver damage early in life. J Hepatol 2010 Aug;53(2):335-338. (179) Santoro N, Kursawe R, D'Adamo E, Dykas DJ, Zhang CK, Bale AE, et al. A common variant in the patatin-like phospholipase 3 gene (PNPLA3) is associated with fatty liver disease in obese children and adolescents. Hepatology 2010 Oct;52(4):1281-1290. (180) McNeill AM, Rosamond WD, Girman CJ, Heiss G, Golden SH, Duncan BB, et al. Prevalence of coronary heart disease and carotid arterial thickening in patients with the metabolic syndrome (The ARIC Study). Am J Cardiol 2004 Nov 15;94(10):1249-1254. (181) Bonora E, Kiechl S, Willeit J, Oberhollenzer F, Egger G, Bonadonna RC, et al. Carotid atherosclerosis and coronary heart disease in the metabolic syndrome: prospective data from the Bruneck study. Diabetes Care 2003 Apr;26(4):1251-1257. (182) Ash-Bernal R, Peterson LR. The cardiometabolic syndrome and cardiovascular disease. J Cardiometab Syndr 2006 Winter;1(1):25-28. (183) Raitakari OT, Juonala M, Kähönen M, Taittonen L, Laitinen T, Mäki-Torkko N, et al. Cardiovascular risk factors in childhood and carotid artery intima-media thickness in adulthood: the Cardiovascular Risk in Young Finns Study. JAMA 2003 Nov 5;290(17):2277-2283. 67 (184) Juonala M, Järvisalo MJ, Mäki-Torkko N, Kähönen M, Viikari JS, Raitakari OT. Risk factors identified in childhood and decreased carotid artery elasticity in adulthood: the Cardiovascular Risk in Young Finns Study. Circulation 2005 Sep 6;112(10):1486-1493. (185) Wong ND, Sciammarella MG, Polk D, Gallagher A, Miranda-Peats L, Whitcomb B, et al. The metabolic syndrome, diabetes, and subclinical atherosclerosis assessed by coronary calcium. J Am Coll Cardiol 2003 May 7;41(9):1547-1553. (186) Koren-Morag N, Goldbourt U, Tanne D. Relation between the metabolic syndrome and ischemic stroke or transient ischemic attack: a prospective cohort study in patients with atherosclerotic cardiovascular disease. Stroke 2005 Jul;36(7):1366-1371. (187) Isomaa B, Almgren P, Tuomi T, Forsen B, Lahti K, Nissen M, et al. Cardiovascular morbidity and mortality associated with the metabolic syndrome. Diabetes Care 2001 Apr;24(4):683-689. (188) Malik S, Wong ND, Franklin SS, Kamath TV, L'Italien GJ, Pio JR, et al. Impact of the metabolic syndrome on mortality from coronary heart disease, cardiovascular disease, and all causes in United States adults. Circulation 2004 Sep 7;110(10):1245-1250. (189) Dekker JM, Girman C, Rhodes T, Nijpels G, Stehouwer CD, Bouter LM, et al. Metabolic syndrome and 10-year cardiovascular disease risk in the Hoorn Study. Circulation 2005 Aug 2;112(5):666-673. (190) Grundy SM. Metabolic syndrome: connecting and reconciling cardiovascular and diabetes worlds. J Am Coll Cardiol 2006 Mar 21;47(6):1093-1100. (191) Legro RS, Arslanian SA, Ehrmann DA, Hoeger KM, Murad MH, Pasquali R, et al. Diagnosis and treatment of polycystic ovary syndrome: an endocrine society clinical practice guideline. J Clin Endocrinol Metab 2013 Dec;98(12):4565-4592. (192) Legro RS. A 27-year-old woman with a diagnosis of polycystic ovary syndrome. JAMA 2007 Feb 7;297(5):509-519. (193) Drager LF, Togeiro SM, Polotsky VY, Lorenzi-Filho G. Obstructive sleep apnea: a cardiometabolic risk in obesity and the metabolic syndrome. J Am Coll Cardiol 2013 Aug 13;62(7):569-576. (194) Schulz R, Eisele HJ, Reichenberger F, Seeger W. Obstructive sleep apnoea and metabolic syndrome. Pneumologie 2008 Feb;62(2):88-91. (195) Hamilton GS, Solin P, Naughton MT. Obstructive sleep apnoea and cardiovascular disease. Intern Med J 2004 Jul;34(7):420-426. (196) Onyike CU, Crum RM, Lee HB, Lyketsos CG, Eaton WW. Is obesity associated with major depression? Results from the Third National Health and Nutrition Examination Survey. Am J Epidemiol 2003 Dec 15;158(12):1139-1147. 68 (197) Kivipelto M, Ngandu T, Fratiglioni L, Viitanen M, Kareholt I, Winblad B, et al. Obesity and vascular risk factors at midlife and the risk of dementia and Alzheimer disease. Arch Neurol 2005 Oct;62(10):1556-1560. (198) Guh DP, Zhang W, Bansback N, Amarsi Z, Birmingham CL, Anis AH. The incidence of comorbidities related to obesity and overweight: a systematic review and meta-analysis. BMC Public Health 2009 Mar 25;9:88-2458-9-88. (199) Saari A, Sankilampi U, Hannila ML, Kiviniemi V, Kesseli K, Dunkel L. New Finnish growth references for children and adolescents aged 0 to 20 years: Length/height-for-age, weight-for-length/height, and body mass index-for-age. Ann Med 2011 May;43(3):235-248. (200) Cole TJ, Bellizzi MC, Flegal KM, Dietz WH. Establishing a standard definition for child overweight and obesity worldwide: international survey. BMJ 2000 May 6;320(7244):1240-1243. (201) Tietz N editor. Clinical Guide to Laboratory Test, 4th ed. Philadelphia: WB Saunders Co. ; 2006. (202) Sapin R. Insulin assays: previously known and new analytical features. Clin Lab 2003;49(34):113-121. (203) Siedel J, Schmuck R, Staepels J, Town M. Long term stable, liquid ready-to-use monoreagent for the enzymatic assay of serum or plasma triglycerides (GPO-PAP method). AACC Meeting Abstract 34. Clin Chem. 1993;39:1127. (204) Rifai N, Warnick GR, McNamara JR, Belcher JD, Grinstead GF, Frantz ID,Jr. Measurement of low-density-lipoprotein cholesterol in serum: a status report. Clin Chem 1992 Jan;38(1):150160. (205) Sugiuchi H, Uji Y, Okabe H, Irie T, Uekama K, Kayahara N, et al. Direct measurement of high-density lipoprotein cholesterol in serum with polyethylene glycol-modified enzymes and sulfated alpha-cyclodextrin. Clin Chem 1995 May;41(5):717-723. (206) Price CP, Trull AK, Berry D, Gorman EG. Development and validation of a particleenhanced turbidimetric immunoassay for C-reactive protein. J Immunol Methods 1987 May 20;99(2):205-211. (207) Szasz G. New substrates for measuring gamma-glutamyl transpeptidase activity. Z Klin Chem Klin Biochem 1974 May;12(5):228. (208) Bergmeyer HU, Horder M, Rej R. International Federation of Clinical Chemistry (IFCC) Scientific Committee, Analytical Section: approved recommendation (1985) on IFCC methods for the measurement of catalytic concentration of enzymes. Part 3. IFCC method for alanine aminotransferase (L-alanine: 2-oxoglutarate aminotransferase, EC 2.6.1.2). J Clin Chem Clin Biochem 1986 Jul;24(7):481-495. (209) Rastas M, Seppanen R, Knuts L, Karvetti R, Varo P. Nutrient Composition of Foods. Publications of the Social Insurance Institution: Helsinki. 1993. 69 (210) Mayo O. A century of Hardy-Weinberg equilibrium. Twin Res Hum Genet 2008 Jun;11(3):249-256. (211) Gallagher D, Visser M, Sepulveda D, Pierson RN, Harris T, Heymsfield SB. How useful is body mass index for comparison of body fatness across age, sex, and ethnic groups? Am J Epidemiol 1996 Feb 1;143(3):228-239. (212) Obesity: preventing and managing the global epidemic. Report of a WHO consultation. World Health Organ Tech Rep Ser 2000;894:i-xii, 1-253. (213) Toombs RJ, Ducher G, Shepherd JA, De Souza MJ. The impact of recent technological advances on the trueness and precision of DXA to assess body composition. Obesity (Silver Spring) 2012 Jan;20(1):30-39. (214) Williams SR, Jones E, Bell W, Davies B, Bourne MW. Body habitus and coronary heart disease in men. A review with reference to methods of body habitus assessment. Eur Heart J 1997 Mar;18(3):376-393. (215) Pouliot MC, Despres JP, Lemieux S, Moorjani S, Bouchard C, Tremblay A, et al. Waist circumference and abdominal sagittal diameter: best simple anthropometric indexes of abdominal visceral adipose tissue accumulation and related cardiovascular risk in men and women. Am J Cardiol 1994 Mar 1;73(7):460-468. (216) Lee S, Bacha F, Arslanian SA. Waist circumference, blood pressure, and lipid components of the metabolic syndrome. J Pediatr 2006 Dec;149(6):809-816. (217) Lee S, Bacha F, Gungor N, Arslanian SA. Waist circumference is an independent predictor of insulin resistance in black and white youths. J Pediatr 2006 Feb;148(2):188-194. (218) Samara A, Ventura EE, Alfadda AA, Goran MI. Use of MRI and CT for fat imaging in children and youth: what have we learned about obesity, fat distribution and metabolic disease risk? Obes Rev 2012 Aug;13(8):723-732. (219) Sattar N, Forrest E, Preiss D. Non-alcoholic fatty liver disease. BMJ 2014 Jul 29;349:g4596. (220) Strömme JH, Rustad P, Steensland H, Theodorsen L, Urdal P. Reference intervals for eight enzymes in blood of adult females and males measured in accordance with the International Federation of Clinical Chemistry reference system at 37 degrees C: part of the Nordic Reference Interval Project. Scand J Clin Lab Invest 2004;64(4):371-384. (221) Pozzato C, Radaelli G, Dall'Asta C, Verduci E, Villa A, Villa C, et al. MRI in identifying hepatic steatosis in obese children and relation to ultrasonography and metabolic findings. J Pediatr Gastroenterol Nutr 2008 Oct;47(4):493-499. (222) Sartorio A, Del Col A, Agosti F, Mazzilli G, Bellentani S, Tiribelli C, et al. Predictors of non-alcoholic fatty liver disease in obese children. Eur J Clin Nutr 2007 Jul;61(7):877-883. (223) Park HS, Han JH, Choi KM, Kim SM. Relation between elevated serum alanine aminotransferase and metabolic syndrome in Korean adolescents. Am J Clin Nutr 2005 Nov;82(5):1046-1051. 70 (224) Strauss RS, Barlow SE, Dietz WH. Prevalence of abnormal serum aminotransferase values in overweight and obese adolescents. J Pediatr 2000 Jun;136(6):727-733. (225) Tominaga K, Fujimoto E, Suzuki K, Hayashi M, Ichikawa M, Inaba Y. Prevalence of nonalcoholic fatty liver disease in children and relationship to metabolic syndrome, insulin resistance, and waist circumference. Environ Health Prev Med 2009 Mar;14(2):142-149. (226) Lin YC, Chang PF, Hu FC, Yang WS, Chang MH, Ni YH. A common variant in the PNPLA3 gene is a risk factor for non-alcoholic fatty liver disease in obese Taiwanese children. J Pediatr 2011 May;158(5):740-744. (227) Wang CW, Lin HY, Shin SJ, Yu ML, Lin ZY, Dai CY, et al. The PNPLA3 I148M polymorphism is associated with insulin resistance and nonalcoholic fatty liver disease in a normoglycaemic population. Liver Int 2011 Oct;31(9):1326-1331. (228) Calcaterra V, Muratori T, Klersy C, Albertini R, Caramagna C, Brizzi V, et al. Early-onset metabolic syndrome in prepubertal obese children and the possible role of alanine aminotransferase as marker of metabolic syndrome. Ann Nutr Metab 2011;58(4):307-314. (229) Goessling W, Massaro JM, Vasan RS, D'Agostino RB S, Ellison RC, Fox CS. Aminotransferase levels and 20-year risk of metabolic syndrome, diabetes, and cardiovascular disease. Gastroenterology 2008 Dec;135(6):1935-44, 1944.e1. (230) Steinvil A, Shapira I, Ben-Bassat OK, Cohen M, Vered Y, Berliner S, et al. The association of higher levels of within-normal-limits liver enzymes and the prevalence of the metabolic syndrome. Cardiovasc Diabetol 2010 Jul 15;9:30. (231) Larson-Meyer DE, Newcomer BR, Ravussin E, Volaufova J, Bennett B, Chalew S, et al. Intrahepatic and intramyocellular lipids are determinants of insulin resistance in prepubertal children. Diabetologia 2011 Apr;54(4):869-875. (232) Nguyen QM, Srinivasan SR, Xu JH, Chen W, Hassig S, Rice J, et al. Elevated Liver Function Enzymes Are Related to the Development of Prediabetes and Type 2 Diabetes in Younger Adults: The Bogalusa Heart Study. Diabetes Care 2011 Sep 27. (233) Bennett B, Larson-Meyer DE, Ravussin E, Volaufova J, Soros A, Cefalu WT, et al. Impaired Insulin Sensitivity and Elevated Ectopic Fat in Healthy Obese vs. Nonobese Prepubertal Children. Obesity (Silver Spring) 2011 Aug 25. (234) Kerner A, Avizohar O, Sella R, Bartha P, Zinder O, Markiewicz W, et al. Association between elevated liver enzymes and C-reactive protein: possible hepatic contribution to systemic inflammation in the metabolic syndrome. Arterioscler Thromb Vasc Biol 2005 Jan;25(1):193-197. (235) Yamada J, Tomiyama H, Yambe M, Koji Y, Motobe K, Shiina K, et al. Elevated serum levels of alanine aminotransferase and gamma glutamyltransferase are markers of inflammation and oxidative stress independent of the metabolic syndrome. Atherosclerosis 2006 Nov;189(1):198-205. 71 (236) Laaksonen DE, Niskanen L, Lakka HM, Lakka TA, Uusitupa M. Epidemiology and treatment of the metabolic syndrome. Ann Med 2004;36(5):332-346. (237) Martinez-Vizcaino V, Ortega FB, Solera-Martinez M, Ruiz JR, Labayen I, Eensoo D, et al. Stability of the factorial structure of metabolic syndrome from childhood to adolescence: a 6year follow-up study. Cardiovasc Diabetol 2011 Sep 21;10:81. (238) Povel C, Beulens J, van der Schouw Y, Dollé M, Spijkerman A, Verschuren W, et al. Metabolic Syndrome Model Definitions Predicting Type 2 Diabetes and Cardiovascular Disease. Diabetes Care 2012;Aug. 29. (239) Siegel MJ, Hildebolt CF, Bae KT, Hong C, White NH. Total and intraabdominal fat distribution in preadolescents and adolescents: measurement with MR imaging. Radiology 2007 Mar;242(3):846-856. (240) Benfield LL, Fox KR, Peters DM, Blake H, Rogers I, Grant C, et al. Magnetic resonance imaging of abdominal adiposity in a large cohort of British children. Int J Obes (Lond) 2008 Jan;32(1):91-99. (241) Xu J, Xin YN, Lu WH, Lin ZH, Zhang DD, Zhang M, et al. Polymorphism rs738409 in PNPLA3 is associated with inherited susceptibility to non-alcoholic fatty liver disease. Zhonghua Gan Zang Bing Za Zhi 2013 Aug;21(8):619-623. Anna Viitasalo Clustering of Cardiometabolic Risk Factors, Liver Enzymes and PNPLA3 Polymorphism With Special Reference To Children This doctoral thesis focused on the clustering of cardiometabolic risk factors in children and adults and associations of cardiometabolic risk factors and I148M polymorphism in the PNPLA3 gene with liver enzymes in children. Data were from the PANIC, KIHD and DR’s EXTRA studies. The results showed that metabolic syndrome can be described as a single entity in different age groups and that cardiometabolic risk score is a valid tool for research. Children with cardiometabolic risk factors and especially overweight children carrying PNPLA3 risk allele had high-normal liver enzymes. Publications of the University of Eastern Finland Dissertations in Health Sciences isbn 978-952-61-1712-6


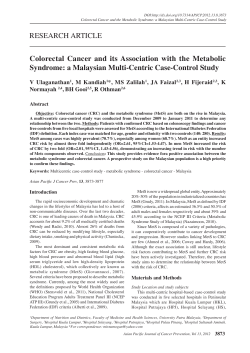


© Copyright 2026