
Document
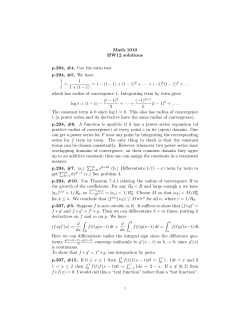
ePubWU Institutional Repository Sascha Sardadvar Regional Economic Growth and Steady States with Free Factor Movement: Theory and Evidence from Europe Paper Original Citation: Sardadvar, Sascha (2015) Regional Economic Growth and Steady States with Free Factor Movement: Theory and Evidence from Europe. Working Papers in Regional Science, 2015/02. Published by Ass.Prof.Mag.Dr. Petra Staufer-Steinnocher und o.Univ.Prof. Dr. Manfred M. Fischer, Vienna. This version is available at: http://epub.wu.ac.at/4548/ Available in ePubWU : May 2015 ePubWU , the institutional repository of the WU Vienna University of Economics and Business, is provided by the University Library and the IT-Services. The aim is to enable open access to the scholarly output of the WU. http://epub.wu.ac.at/ Regional Economic Growth and Steady States with Free Factor Movement: Theory and Evidence from Europe SASCHA SARDADVAR1 1 Institute for Economic Geography and GIScience, WU Vienna, Welthandelsplatz 1/D4, 1020 Vienna, Austria. Email: [email protected]. Abstract This paper develops a spatial theoretical growth model in order to study the impact of physical and human capital relocations on the growth of open economies. Analytical and simulation results show how the respective neighbours determine an economy’s development, why convergence and divergence may alternate in the medium-run, and that interregional migration as a consequence of wage inequalities causes disparities to prevail in the long-run. The empirical part applies spatial econometric specifications for European regions on the NUTS2 level for the observation period 20002010. The estimations underline the importance of human capital endowments and its relation with spatial location. Keywords - Neoclassical growth theory, human capital, migration, regional development, divergence. JEL Classification - F43, R11, C21 1 1. Introduction Studies released in the 1990s and 2000s generally display a trend of interregional convergence in Europe (Sala-i-Martin 1996, Paci and Pigliaru 2002, Fischer and Stirböck 2006, Pfaffermayr 2009), although some point out that this process not consistent but changing over time (Neven and Gouymte 1995, Tondl 2001). This issue is of particular importance for the European Union, where differences in levels of gross regional product (GRP) per capita reach up to 30fold, which is extreme by any standard. If the famous two per cent rule of β-convergence speed applies, then interregional disparities would halve in around 35 years.1 Although this may be considered as rather slow, β-convergence and σ-convergence were considered as robust empirical results (see Islam, 2003) – at least until recently. In addition to the well-known problems with growth equations,2 some problems regarding the empirics of interregional development in Europe continue to exist. By considering only medium-run observation periods, empirical results are often biased because of disequilibria and/or shocks which appear shortly before or during the observation period. In particular, recessions and subsequent recoveries, such as the transitions of formerly centrally-planned economies or financial crises, may lead to interpretations which depend mostly on the observation period considered. In the European context, the two decades before the current crisis were characterised by high growth-rates in the cohesion-countries (Greece, Ireland, Portugal, Spain) as well as in the former centrally-planned economies which accessed the EU during the 2000s. However, the cohesioncountries simultaneously have enjoyed substantial financial support from the EU’s structural funds since the late 1980s, which probably supported their high growth numbers during the 1990s. In addition, the introduction of the euro led to unprecedented low interest rates which in turn led to unsustainable private debt and, consequently, high growth during the 2000s until the start of the Great Recession in 2008. At the same time, most empirical studies which include former members of the Council for Mutual Economic Assistance (Comecon) start only at 1995. During the early 1990s, these countries suffered severe recessions due to the transition process, and the high growth numbers afterwards at least partly reflect merely catch-up processes to their long-run growth paths. Taking on a long-run perspective, the maps in Figures 1a, 1b and 2a display gross domestic product (GDP) for European countries at purchasing power parities (PPP) in percentage to the European mean for 1900, 1960 and 2008, respectively. In particular, when comparing 1900 to 1960, a period during which countless economic transitions took place, it is remarkable how little has changed. Apart from an apparent catch-up process in Northern European countries, which matters visually due to the area size but not so much economically, a core-periphery pattern is persistent over the decades: Central Western European countries are the most advanced, while the Southern, Eastern and far Western European countries lag behind. The picture hints at club-convergence, as discussed in Baumol (1986). According to his study, the western market economies as well as the eastern centrally- 2 Figure 1: GDP at PPP per inhabitant relative to the European mean, 1900 ¬ <50% 50% - <75% 75% - <100% 100% - <125% 125% - 150% >150% Notes: Data source: World Economics (www.worldeconomics.com, accessed on 5-November-2013) 3 Figure 2: GDP at PPP per inhabitant relative to the European mean, 1960 ¬ <50% 50% - <75% 75% - <100% 100% - <125% 125% - 150% >150% Notes: see Figure 1 4 Figure 3: GDP at PPP per inhabitant relative to the European mean, 2008 ¬ <50% 50% - <75% 75% - <100% 100% - <125% 125% - 150% >150% Notes: see Figure 1 5 Figure 4: GRP per inhabitant relative to the EU’s mean, 2010 ¬ <50% 50% - <75% 75% - <100% 100% - <125% 125% - 150% >150% Notes: Data corresponds to GRP at current market prices; data source: Eurostat (epp.eurostat.ec.europa.eu, accessed on 5-November-2013) 6 planned economies would not converge towards each other but rather form two clubs, differing substantially from each other. Shortly after Baumol’s study, the Eastern European economies opened themselves to migration, investment and trade-flows from and to the west. In this context, it seems interesting to note that Alexiadis (2013) finds comparable geographical patterns of club-convergence within the EU now that economic systems are more similar than ever before. Indeed, the picture of 2008 differs insofar as the divide between the west and the east is even more pronounced from 1900 and 1960. As of today, more than two thirds of the European population live in member states of the European Union, where capital, people, goods and services are free to move. Figure 2b displays GRP per inhabitant at market prices relative to the EU’s mean on the regional NUTS2 level. It can be seen that within Italy and Spain, those regions which lie geographically close to the core are also the most advanced. In contrast, the peripheral regions within these countries are lagging behind. Hence it may be stated that 200 years after the industrialisation of continental Europe commenced, almost 60 years after of the foundation of the European Union, and 25 years after the transition of the former Comecon, the European core’s advance appears to be as robust as ever – economically as well as geographically. A recent report by the European Bank for Reconstruction and Development (2013) casts doubts on whether the countries and regions which lag behind economically will ever converge to their peers. The report notes that the transition economies of Central and Eastern Europe3 achieved impressive growth-rates from the mid-1990s until the outbreak of the crisis in 2008. According to the report, the high growth-rates were fuelled by a rapid catch-up with respect to productivity in the wake of opening their economies to Western technology – a process which has now come to an end, with long-run growth-problems on prospects of future convergence dynamics. In addition, brain drain has proven to be an obstacle for socio-economic development, and the EU’s new member states’ brain drain has even accelerated after their accessions in 2004 and 2007. The report (p. 63) argues that for transition economies to converge towards their mature economy peers, human capital’s returns within transition economies need to be comparable to or even greater than theirs. As discussed by many authors (North, 1990, Landes, 1998, Acemoglu and Robinson, 2012), improving institutions is a means of improving economic performance. Whether the report’s proposed solution of improving the institutional environment in these countries is enough to stop human capital outflows and to enforce convergence is, however, questionable. It seems too simple to regard an improvement of institutional settings as a cure-all, as it is implausible that if institutional environments within two given economies are identical, then the dynamics between these economies would come to a halt. Rather, dynamics between two economies with similar institutions may be to the advantage of one as it is to the disadvantage to the other if productivity levels differ. To illustrate the case, it is hard to believe that the population decrease of 15.5 per cent within the territory of the former German 7 Democratic Republic since German unification,4 of which most migrated within Germany, is solely caused by inferior institutional environments. The aim of this paper is to develop a neoclassical growth model for a system of regional economic growth which takes into account that physical as well as human capital relocations tend to decrease with geographical distance.5 The quality of institutions and access to technology are assumed to be identical. It is shown that under these conditions, steady-state levels depend on geographical location as well as initial conditions. Furthermore, medium-run developments can be quite turbulent and do not necessarily allow for conclusions regarding long-run development, which may show a completely different pattern. Finally, the model’s results are confronted with interregional development of the EU during the 2000s. By means of spatial econometrics, the model’s predictions are discussed. The paper is set up as follows. The theoretical model is set up in the next section. After that, the model’s dynamics are described by means of differential equations and simulations. The spatial econometric specifications, data and regions as well as the results are discussed in the fourth section. The final section concludes. 2. The Model Theoretical background In the neoclassical growth model as developed by Solow (1956) and Swan (1956), different steadystates result from variations in the determinants of growth within the economy, e.g. the saving rate. Since then, the notion that growth is also shaped by relations to other economies has been incorporated by a number of theoretical models, which is of particular relevance for issues related to globalisation as well as regional economies. Models in the tradition of the Solow model have incorporated the effects of labour migration (Borts and Stein, 1964), trade (Thirlwall 1979), knowledge spillovers (Ertur and Koch, 2007), investment flows (Sardadvar, 2012), or agglomeration effects (De Dominicis, 2014). On the one hand, these models differ with respect to transition period behaviour, as the economies under consideration may at least temporarily diverge. On the other hand, they result in long-run equilibria in which economies have converged in terms of gross domestic product (though not necessarily gross national income). In addition, human capital is acknowledged as a key driver of economic growth at least since the release of Mankiw, Romer and Weil’s (1992) influential essay. However, because human capital is embodied in workers, the integration of human capital relocations and its interplay with other factors becomes more complex. Maybe for this reason, theoretical models which integrate human capital 8 relocations show no clear results regarding economic disparities. For instance, in a model of national economies by Barro and Sala-i-Martin (1995, 2004), immigration of human capital suppliers to highly productive economies leads to physical capital dilution and hence accelerates the convergence processes. In contrast, Docquier and Rapoport (2012) consider the benefits of sending and receiving countries. Since it is usually the wealthy economies that attract human capital, the authors’ main concern is the extent to which sending countries suffer from negative effects due to brain drain. In a model of regional development by Gennaioli et al. (2013), human capital suppliers migrate from unproductive to productive regions, where the latter may become even more productive as a matter of human capital externalities. In equilibrium, regional economies fall either into the productive or unproductive category, where the former benefits from migration from the latter. As a result, disparities persist also in equilibrium. Against this background, the aim of this paper is to provide a theoretical model that is able to explain the persistence of economic and geographic disparities within the enlarged European Union. The issue of space and mutual influence into growth modelling has been developed by Ertur and Koch (2007), where national economies benefit from knowledge spillovers which are embodied in physical capital. The model results in individual steady states, but the economies are not open in the strict sense of the word as factor relocations are not allowed for. In contrast, Sardadvar (2012) considers regional economies allows for physical capital relocations which depend on human capital stocks relative to neighbouring regions, with possible divergence in the medium-run but convergence to identical steady-states in the long-run. Sardadvar (2013) shows at the example of two economies that the introduction of human capital relocations may further strengthen economies which are already richly endowed with human capital. The so far unanswered key question is: If an economic system with free factor movement is integrated to an extent where institutional environments across its regional economies are comparable, which long-run pattern of economic development will emerge? In what follows, the model shows how factor relocations may lead to convergence in the short-run and medium-run despite persisting disparities in the long-run. The Production Function Consider a neoclassical growth model in the spirit of Mankiw, Romer and Weil (1992) for a finite set of regional economies i 1, 2,..., N , over continuous time t . Output per unit of effective labour qi ,t is assumed to be produced via a Harrod-neutral production function with constant returns to scale qi ,t f (ki ,t , hi ,t ) (1) 9 where the inputs are physical capital per unit of effective labour ki ,t , and human capital per unit of effective labour hi ,t . It is assumed in each regional economy the population sizes and technology levels are identical, that is Li ,t L j ,t i, j, t and Ai ,t Aj ,t i, j , t , respectively. Hence at any t , the total stocks of factors equal Ki ,t ki ,t Ai ,t Li ,t , H i ,t hi ,t Ai ,t Li ,t and thus Qi ,t f ( Ki ,t , H i ,t , Ai , t Li ,t ) . Since constant returns are assumed, it follows that Qi ,t qi ,t Ai ,t Li ,t . In addition, the basic assumptions of the Solow model (continuity, differentiability, positive and diminishing marginal products) apply. The regions are part of a superordinate economy, whose output is simply the sum of the N regional economies, N i 1 Qi ,t . Since population sizes are assumed to be identical in each region, the superordinate economy’s output per unit of effective labour equals the arithmetic mean of the individual regional economies’ output values, or simply: qi ,t N i 1 Qi ,t NAi ,t Li ,t N q i 1 i , t (2) N Evolutions of Stocks of Factors Factor mobility takes place between neighbouring regions and depends on individual choices based on future expectations. Connectivity between any two regions is captured by a connectivity term wij , measuring interdependence between two regions i and j . If any two regions i j are considered to be neighbours, then wij 0 . Expected future profits from investments in physical capital equal their marginal productivity and depend on geographical proximity. The evolution of the physical capital stock takes the form q ki ,t ki ,t sk k ,t qi ,t i ,t i j q j ,t k j ,t N wij (n g d )ki ,t (3) where the dot over k denotes its derivation with respect to time. sk is the saving rate (for physical capital), n is the population growth-rate, g is the technology growth-rate, and d is the rate of depreciation, all of which are exogenously given and assumed to be identical for each region. It can be seen how differences in marginal productivity determine investment flows between the two regions i and j . The size of net investment flows is influenced by , a measure of the degree of integration, and the respective value of wij . k , t is a variable that ensures that the sum of investment outflows equals inflows within the superordinate economy at any t . 10 In contrast to physical capital investments, expected profits on human capital investments are embodied in the wage a human capital supplier receives. Therefore, the evolution of the human capital stock takes the form v hi ,t sh h,t f (ki ,t , hi ,t ) h,i ,t i j vh , j , t N wij (n g d )hi ,t (4) where vh ,i ,t is the wage of human capital suppliers in i at t . sh is the education expenditure rate (or saving rate for human capital), which is also assumed to be identical for all regions, and h , t ensures that the sum of regional outflows of human capital within the superordinate economy equals the sum of inflows at any t . From the assumptions of identical technology and population sizes it follows that Ki ,t ki ,t Ai ,t Li ,t and H i ,t hi ,t Ai ,t Li ,t . For simplicity, the superordinate economy is assumed an open economy which constantly runs a balanced current account, or simply a closed economy. In that case, the actual superordinate economy’s net investment at t including the intraregional flows must equal the sum of all net investments of all regions at t : N N i 1 i 1 sk Qi,t dKi,t k ,t Ki,t (5) where dividing both sides by Ai ,t Li ,t Aj ,t L j ,t i, j and expressing by k , t yields N k ,t q i 1 i ,t N qi ,t ki ,t q i ,t q k i 1 j ,t i j j ,t N wij 0 (6) Likewise, for simplicity it is assumed that net human capital migration beyond the superordinate economy’s borders equals zero, so that N s Q i 1 h i ,t N dH i ,t h,t H i ,t (7) i 1 11 and consequently N h,t q i ,t i 1 N vh ,i ,t q i ,t v i 1 i j h, j ,t N wij 0 (8) From eqs. (6) and (8) it can be seen that k , t and h , t will always be greater than zero, since all terms and hence both the nominator and the denominator must be positive. The Cobb-Douglas Case Output per unit of effective labour with a Cobb-Douglas production function equals qi ,t kia,t hib,t (9) from which it follows that kia,t1hib,t a b ki ,t sk k ,t ki ,t hi ,t a 1 b i j k j ,t h j ,t N wij ki ,t (10) where n g d to save space. Human capital is usually defined as ‘the total contribution of workers of different skill levels to production’ (Romer 2005, p. 134). Therefore, H is to be distinguished from raw labour L as it represents acquired skills. Thus two types of workers exist: those who supply only raw labour, and those who additionally supply the skills which are considered to be human capital as defined above. The latter are supposed to earn a higher wage which consists of compensation for raw labour plus a premium for their human capital supply. The difference between the wages equals the profits of human capital investments. Put differently, although human capital represents a form of capital, its revenues take the form of wages. In terms of national accounts, the share of income earned by the owners of physical capital in equilibrium takes the following form 12 VK ,i ,t Ki ,t Qi ,t (11) Ki ,t where V symbolises a factor’s total compensation, with the first subscript referring to the respective factor. In the Cobb-Douglas case, eq. (11) simply equals aQi , t . It follows that the share of income that is found on the payrolls is the sum of compensations for raw labour plus human capital VL,i ,t VH ,i ,t Li ,t Qi ,t Li ,t H i ,t Qi ,t (12) H i ,t which in the Cobb-Douglas case equals (1 a)Qi ,t . Assume that xi , t measures the share of workers who represent one unit of human capital. Under this scenario, those workers who qualify as human capital receive a premium in addition to marginal product of labour, which equals the marginal product of the human capital they supply. In contrast, those workers who do not qualify as human capital just receive compensation for raw labour. In the Cobb-Douglas case we thus have VL,i ,t Qi ,t 1 xi ,t 1 a b (13) VH ,i ,t Qi ,t xi ,t 1 a b b (14) To save space, let c 1 a b and for simplicity, consider xi ,t hi ,t . Then the total compensation for one unit of human capital equals vh,i ,t qi ,t (hi ,t c b) , and hence q (hi ,t c b) hi ,t sh h ,t kia,t hib,t i ,t q ( h j ,t c b ) i j j ,t N wij hi ,t (15) 13 3. Dynamics Economic Growth The total differential of the production function with respect to time equals dqi ,t dt qi ,t dki ,t ki ,t dt qi ,t dhi ,t (16) hi ,t dt By setting k ,t h,t 1 for simplicity, output growth at t may be expressed as q ask i ,t k qi ,t i ,t qi ,t where i 1i N i 1 k j ,t i j q j ,t N wij bsh qi ,t vhi,i ,t hi ,t 1 i j vh , j , t N wij ( a b) (17) wij . Note that this variable becomes higher, the more centrally located a region is, i.e. the more neighbours it has. Hence the more centrally located a region, the greater the effects of other regions’ attributes will be. To avoid extreme fluctuations or the explosion of the model, the integration of i within the system is constrained so that i 1 . It follows that for any j j (qi , t qi ,t ) h j ,t b wij qi ,t h j ,t w qi,t k j , t ij hbj ,t as k k 1 k a hb 1 wij i ,t j ,t j ,t k j , t j i q j , t N wij b 2 c 1 b h j , t 1 sh w hi ,t b ch j ,t vh, jij,t j i vh , j ,t N wij (18) which is unambiguously negative since all variables must be positive. Therefore an increase in human capital endowment in neighbouring regions has a decreasing effect on output growth of region i . This is because the latter becomes less attractive for both types of capital. Equation (18) also shows that this effect is stronger, the stronger the connectivity between the two regions is, i.e. the higher wij . 14 The effect of a change in the human capital stock within i has a contrasting effect: (qi ,t qi ,t ) hi ,t b qi ,t hi2,t wij N k qi,it j ,t ask 1 i 1 ki ,t i hi ,t i j q j ,t vhi,i ,t 1 b ci hi ,t 1 b 2 1 i chi ,t sh b chi ,t 1 i j vh , j ,t N wij (19) The equation shows how an increase in a region’s own human capital stock benefits its further development: If a region’s own stock of human capital is high, it will attract further human capital as well as physical capital, and an increase in i ’s human capital stock will also increase i ’s output growth.6 However, the actual magnitude of this effect depends on the interplay of the stocks of factors in the various regions plus the connectivity of i . Considering i ’s current output level, an increase may have a positive or negative effect on growth: (qi ,t qi ,t ) qi ,t (1 i ) hib,t(1i ) sk (1 a) q1 (1 a )i i ,t 1 a N k j ,t j i q j ,t wij 1 bsh hi ,t j i vh, j , t vhi,i ,t N wij (20) On the one hand, i benefits from its increased attractiveness on foreign factors, which will in turn immigrate. On the other hand, an increase above steady-state must decrease i ’s output as a matter of depreciation. However, plausible parameters imply that 1 a b , thus a tendency for negative levels of eq. (20) exists.7 An output-increase in a particular region j affects i ’s growth depending on the relative sizes of factors in both regions, with the total effect remaining ambiguous: (qi , t qi ,t ) q j , t wij qi ,t b q j ,t h a 1i i ,t a 1 b sk 1 1 b i qi ,t q h 1 b j ,t a j ,t wij 1 b N q1 b j , t j i h aj , t j j wij b 1 b 2 sh w hi ,t vh , jij,t j i vh, j , t j j 15 vhi,i ,t N wij (21) The interpretation is analogous to eq. (20), but this time the tendency for positive levels exists, as 1 b b2 . To summarise, an increase of human capital endowments in neighbouring regions will reduce economic growth of region i , while an increase within its own borders will increase growth. The effect of output in region i or its neighbours depends on the interplay of human capital, physical capital and neighbourship. Therefore, it is possible that regions with low initial output level will not converge to the mean in an unfavourable neighbourship, in particular if its human capital endowment is low. Furthermore, the effect of neighbouring regions is stronger, the more centrally located a region is, i.e. the more neighbours it has. Steady-States In equilibrium, it must be that ki ,t hi ,t 0 i . Because physical capital relocations depend on relative marginal productivity, the condition ki ,t 0 i implies that in equilibrium qi ,t ki ,t q j ,t k j ,t i, j . It follows that in equilibrium, the nominator and denominator of eq. (6) are identical, and therefore k 1 . In contrast, in the case of human capital the condition hi ,t 0 i allows for vh,i ,t vh, j ,t which is due to the incentive to migrate based on wages. This means that a particular level of human capital can be upheld even under permanent emigration, as human capital is simultaneously reproduced while depreciating. In other words, in order to keep a relatively high level of human capital, a region must permanently attract human capital from neighbouring regions, so that both terms on the right hand side of eq. (15) have the same values. Simultaneously, a region with a relatively low human capital level permanently produces and loses human capital to its neighbours, but needs less gross investments to uphold its relatively low equilibrium level. By solving both eqs. (10) and (15) for , it follows that in equilibrium q*1i (hi*c b)i sh h* i hi* 1 *a *b i j k j h j ( h j c b) N wij 1 h*b a sk *1i a qi (22) where stars indicate the individual steady-state levels. Solving eq. (22) for qi yields steady-state output as s a h*a b * i qi k * sh h (b chi* )ai 1 1 ai * * a wij q j (b ch j ) i j N 16 (23) From eq. (23) a number of conclusions can be drawn. Firstly, each region’s eventual levels of factors depend on their neighbours’ values. The higher the individual neighbours’ steady-state levels, the higher i ’s steady-state output is. From this it follows that all regions approach individual levels of factor endowments and thus output in the longrun. Secondly, equilibrium is dependent on the parameter of integration , the connectivities wij , and the values of sk , sh , a and b . Therefore the system evolves towards an equilibrium that is determined by these factors. Considering that , sk and sh result from political decision-making, equilibrium can be influenced and changed. Thirdly, equilibrium is also dependent on starting levels as displayed by the inclusion of hi* on the right hand side of eq. (23). Fourthly, from eqs. (18) to (21) it follows that development in the medium-run may be quite turbulent, depending on connectivities, the degree of integration and initial factor endowments. Until equilibrium is reached, regions may surpass each other with respect to output, possibly displaying trends of β- and σ-convergence and -divergence subsequently or even simultaneously. * In addition, it can be shown that steady-state output of i is an increasing function of hi * qi* hi ac 1 i b b a b hi* 1 ai s a 1 k * *1 a1 b i sh h hi (b chi* )1 2 ai (24) 1 1 ai * * a wij q ( b ch ) j j i j N which is unambiguously positive. In contrast to the effect on medium-run growth, the steady-state of i * is positively influenced by h j qi* a wij * b q c 1 b j h*j 1 ai h*j a hia b 1 sk a * s i * h h b chi q j b ch*j 1 1 ai N a w q*j (b ch*j ) ij 1 a i wij i j 17 (25) * Finally, qi* is positively influenced by q j a a w *a b a wij sk (b ch*j ) ij q h i q 1 ai sh h* (b chi* )ai q*1 a i wij j * i * j 1 1 ai a wij * * q j (b ch j ) i j N (26) From eqs. (24), (25) and (26) it follows that neighbouring regions’ steady-state levels are expected to be similar. This positive influence of the neighbours’ steady-state output despite its negative effect on economic growth is due to feedback effects which emerge in the long-run. In the medium-run, high human capital endowments attract investments and hence a region may grow at its neighbours’ expense. At some point, however, marginal productivity becomes so low that its neighbouring regions start to benefit. Therefore, in the long-run all regions converge to their individual steady-state output levels, which are more similar among neighbouring regions. Simulation Results In order to illustrate the model, in this section three simulations are run. The first scenario shows how the model behaves if the initial factor endowments are arbitrarily given. The second scenario considers identical initial endowments among regions, but at some point an exogenous shock leads to a small increase of human capital endowment in one particular region, leading to a collapse of the old equilibrium. In the third scenario, one region starts out with much more human capital than the others, and despite some σ-convergence, due to its initial advantage the respective region remains the most productive region in the long-run. Consider those variables which are identical across regions to equal a 0.3 , b 0.2 , 0.08 , sk 0.25 , sh 0.15 , and 0.1 . The superordinate economy consists of 12 regions A, B, …, L, whose borders are displayed by the accompanying spatial weight matrix: 0 1 0 1 0 0 W 1 0 1 0 0 0 1 0 1 1 1 0 1 0 0 0 0 0 0 1 0 0 1 1 1 0 0 0 0 0 1 1 0 0 1 0 0 0 1 1 0 0 0 1 1 1 0 1 0 0 0 1 0 0 0 0 1 0 1 0 1 0 0 0 0 0 1 1 1 0 0 1 0 1 0 0 0 0 0 0 0 0 0 0 1 0 1 0 0 0 0 0 0 1 0 0 0 1 0 1 1 0 1 0 0 1 1 0 0 0 1 0 1 0 0 0 0 0 0 0 0 0 1 1 0 1 0 0 0 0 0 0 0 0 0 0 1 0 (27) 18 For the first simulation, the initial factor endowments are arbitrarily given, with the corresponding vectors of the values of ki ,0 and hi ,0 equalling: k '0 10 9 5 8 9 7.5 8.5 7 8 7.5 5 4 h'0 7 6 5 4.5 5.5 4 5 3.5 5 4 3 1.5 As can be seen from Figure 3a, disparities regarding output reduce during the first 60 periods. Although overall σ-convergence applies during these first 60 periods, a closer look also reveals that some regions do not converge to the mean but rather diverge: E and I move upwards, while D moves downwards. From t 61 onwards, variance increases. Put differently, the observation of σconvergence during the first 60 periods is deceptive for two reasons: Firstly, some regions diverge during this period. Secondly, others are caught in a downward spiral, i.e. their continuous shrinking (in efficiency units) leads to a decreasing variance in the first 60 periods, while others rise, which leads to σ-divergence in the medium-run. Figure 3b displays the development for the same scenario over 2,000 periods. It can be seen that after many position changes and periods of σ-convergence as well as σ-divergence, all regions eventually converge to their individual balanced growth paths. Three regions are found clearly above the mean, while the others are below, some of which display similar output levels. Therefore in the long-run, growth-rates converge, but output levels differ substantially. In addition, during certain periods some groups of regions may converge, while others diverge. This issue of simultaneous convergence and divergence may, as in Figures 3b and 3c, depend on the current output level, an issue which has recently been taken up by Monastiriotis (2014). However, occurrences of convergence of some regions do not lead to convergence clubs of the same regions, as they may overpass each other in the long-run. In the second simulation, displayed in Figure 3c, all regions start out with identical initial factor endowments of k0 5 and hi ,0 3 . With factor endowments and hence output and wages being identical in each region, there is no incentive for factor relocations, and each region converges to the levels that would prevail in the case of closed economies.8 However, this is an unstable equilibrium: At t 200 , region B exogenously receives 0.1 extra units of h , which has a devastating effect to the system. This small deviation initiates large factor relocations, from which region B benefits the most. At t 876 , region B has accumulated a human capital stock of hB,876 11.29 , which is four times higher than the mean h876 2.82 . Five periods later, B’s output level has reached its maximum qB,881 3.27 . After that, B’s level shrinks slightly but remains way above the other regions. 19 Figure 5: First simulation of the model, 200 periods 3.25 3.00 2.75 2.50 2.25 2.00 1.75 1.50 1.25 1.00 0.75 0.50 0.25 0.00 0 25 50 75 100 125 150 175 200 A B C D E F G H I J K L Figure 6: First simulation of the model, 2,000 periods 3.25 3.00 2.75 2.50 2.25 2.00 1.75 1.50 1.25 1.00 0.75 0.50 0.25 0.00 0 200 400 600 800 1000 1200 1400 1600 1800 2000 A B C D E F G H I J K L 20 Figure 7: Second simulation of the model, 2,000 periods 3.25 3.00 2.75 2.50 2.25 2.00 1.75 1.50 1.25 1.00 0.75 0.50 0.25 0.00 0 200 400 600 800 1000 1200 1400 1600 1800 2000 A B C D E F G H I J K L Figure 8: Third simulation of the model, 2,000 periods 3.25 3.00 2.75 2.50 2.25 2.00 1.75 1.50 1.25 1.00 0.75 0.50 0.25 0.00 0 200 400 600 800 1000 1200 1400 1600 1800 2000 A B C D E F G H I J K L 21 Figure 3d illustrates a third simulation, representing a scenario in which region B starts out with more human capital than the sum of all other regions, while other values are relatively small and similar across the regions: k '0 2 3 4 1.5 0.5 3 2 1 1 0.75 0.25 0.5 h'0 1 20 1.5 2 1.5 0.5 1 1.5 1 1 0.75 1 In this case, B’s human capital level immediately starts to fall due to depreciation. However, the high human capital level attracts physical capital investments, and its output increases until B has reached its highest level with qB ,124 3.18 . 15 periods later, B’s physical capital endowment has reached its peak with kB ,139 9.97 . Although both decline slightly afterwards, B remains the most productive region by far and in that sense the economy’s core. In Figure 3d, it is also interesting to note that during the first 50 periods of high growth-rates, variance decreases, i.e. times of prosperity coincide with σ-convergence. 4. Empirics Spatial Econometric Specifications, Regions and Data From eqs. (18) to (21) it is follows that human capital within region i has a positive effect on i ’s economic growth, while human capital levels in regions which are neighbours to i have a negative effect. Regarding output levels, it follows from eqs. (18) to (21) that the effect of the current output level in region i on its neighbours depends on how far away these levels are from steady-states, in addition to the interplay with other factors. In order to test these medium-run predictions, a specification is needed which includes spatial effects of the explanatory variables: qT q0 = ι 1q0 + 2h0 + 1Wq0 + 2 Wh0 + u (28) where q and h are N 1 vectors which contain the natural logarithms of output and human capital levels per labour unit, respectively, with 0 symbolising the first, and T symbolising the last period of the observation period. W is an N N matrix that captures connectivities between all regions via its elements wij , and ι is an N 1 vector of ones. u is an N 1 vector of error terms. 22 From eqs. (18) and (19) it is expected that 2 0 and 2 0 , while 1 depends on the state of the system, and 1 should also be positive as discussed above. In addition, the error terms may be thought of as disturbances, some of which are spatially lagged, and hence can be expressed as u Wε φ (29) where ε and φ are two n1 vectors, is a spatial autocorrelation coefficient of error terms and ε 2 is a vector of i.i.d. errors with variance . Equation (28) is referred to in the literature as a spatial lag of X model (SLXM). If eq. (29) is introduced to eq. (28), the specification resembles a spatial Durbin error model (SDEM) (LeSage and Fischer, 2008). Concerning the model’s long-run predictions, from eq. (23) it follows that region i ’s steadystate output level is dependent on the respective levels in neighbouring regions as well as human capital levels in i and in i ’s neighbouring regions. From eqs. (24), (25) and (26) it is expected that all of these effects are positive. Therefore, the econometric specification where the dependent variable is output level has the form qt = Wqt ι ht + Wht + u (30) An econometric specification as in eq. (28) is referred to in the literature as a spatial Durbin model (SDM) (LeSage and Fischer, 2008). In contrast to the SLXM and the SDEM, the SDM’s coefficients are not identical to the partial derivatives of the dependent variable. Rather, a change in the explanatory variable for a single region can potentially affect the dependent variable in all other regions (in the case of eq. (30) through Wq t and Wh t ). The interpretation of the parameters therefore differs and becomes more complicated. LeSage and Pace (2009) suggest estimating direct, indirect and total impacts. By following this interpretation, (i) the average direct impacts capture the effect of a change in hi , t on qi , t , (ii) the average indirect impacts capture the effect of a change in h j , t by the same amount across all regions on qi , t and (iii) the average total impacts capture the effect of a change of ht in the j th region over all qi , t . The model is tested for 250 European Union’s regions on the NUTS29 level for the years 2000 to 2010. Output per labour unit is measured by GRP at current market prices in euros per inhabitant.10 Human capital is estimated by the percentage of inhabitants with tertiary education to the number of gainfully active persons. The source of all data is Eurostat. Distances between regions are taken by car 23 travel times between NUTS2 regions as calculated by Schürmann and Talaat (2000). Results in this paper are based on the concept of two regions as being considered as neighbours if the distance between them lies below a critical cut-off value, with wij* 0 if i j * * wij 1 if ij * * wij 0 if ij where ij equals the distance between two regions i and j in time units and * is a pre-defined critical cut-off distance. The i th row and j th column of W consists of the element wij i 1 j 1 wij* , i.e. the spatial weight matrix is standardised so that both the average row and the * average column sum equal one. If a region happens to have no neighbour for whom ij applies, N N then the closest region is considered to be the sole neighbour. Results The econometric estimations which correspond to eqs. (28) and (29) are labelled ‘SLXM’ and ‘SDEM’ in Tables 1 and 2 for * 2 h and * 4 h , respectively. In order to account for the horizontal economic integration of the EU as well as the crisis, the observation period is split into 2000-2008, 2000-2010 and 2008-2010. The influence of regions i ’s initial output level on growth, as displayed by 1 , is negative for the period before the crisis, but positive afterwards. These results recall tests on conditional convergence, although the interpretation is different due to the interplay of factors. A negative coefficient implies a corresponding effect of high initial output on growth, but not necessarily convergence, as a region might compensate this effect through high human capital levels and a corresponding influx of both types of capital. This is underlined by the unambiguously positive effects of human capital endowments, as displayed by 2 , and output in neighbouring regions, as displayed by 1 . While these coefficients keep their signs for each period, 1 turns positive for the period 20082010. This result indicates that already wealthy regions benefit from their advantage. As can be seen from Fig. 4, the variance of GDP per capita levels has increased over that period. 2 is negative and significant in each regression and therefore confirms the negative influence of human capital endowments in neighbouring regions on output growth. This result confirms eq. (18) and has also been found in a number of empirical studies (Olejnik, 2008, Ramos et al., 2010, Fischer et al., 2010). In addition, the spatial autocorrelation coefficient is positive and highly significant in each SDEM regression. 24 Table 1: SLXM and SDEM estimations with 2 hours travel time as threshold distance 2000-2008 2000-2010 2008-2010 SLXM SDEM SLXM SDEM SLXM SDEM α 3.376 (0.000) 3.275 (0.000) 3.203 (0.000) 3.092 (0.000) -0.225 (0.000) -0.226 (0.000) β1 -0.344 (0.000) -0.334 (0.000) -0.333 (0.000) -0.321 (0.000) 0.018 (0.003) 0.019 (0.001) β2 0.091 (0.001) 0.102 (0.000) 0.105 (0.000) 0.113 (0.000) 0.003 (0.766) 0.001 (0.868) γ1 0.079 (0.000) 0.070 (0.000) 0.096 (0.000) 0.077 (0.000) 0.018 (0.000) 0.010 (0.074) γ2 -0.249 (0.000) -0.229 (0.000) -0.300 (0.000) -0.250 (0.000) -0.055 (0.001) -0.030 (0.080) ρ 0.252 (0.000) 2 σ 0.254 (0.000) 0.260 (0.000) 0.019 0.000 0.021 0.000 0.002 0.001 LIK 142.134 163.876 131.217 159.046 444.045 474.444 BP 38.869 (0.000) 42.409 (0.000) 30.835 (0.000) 39.159 (0.000) 14.382 (0.006) 12.126 (0.016) F stat 208.500 (0.000) Wald 175.200 (0.000) 308.601 (0.000) 9.733 (0.000) 378.446 (0.000) 812.146 (0.000) Notes: Econometric specifications and symbols are as given in the text, the calculations have been carried out with R using the spdep package. p-values are in parentheses, σ2 is the residual variance. LIK refers to the value of the maximised log-likelihood, BP is the spatially adjusted version of the Breusch-Pagan test for heteroskedasticity, using studentised values (see Anselin 1988). F stat and Wald are the F statistics and Wald statistics, respectively. 25 Table 2: Estimations with 4 hours travel time as threshold distance 2000-2008 2000-2010 2008-2010 SLXM SDEM SLXM SDEM SLXM SDEM α 3.354 (0.000) 3.225 (0.000) 3.215 (0.000) 3.053 (0.000) -0.164 (0.001) -0.195 (0.000) β1 -0.363 (0.000) -0.340 (0.000) -0.362 (0.000) -0.331 (0.000) 0.005 (0.402) 0.013 (0.035) β2 0.166 (0.000) 0.144 (0.000) 0.197 (0.000) 0.161 (0.000) 0.023 (0.023) 0.010 (0.292) γ1 0.127 (0.000) 0.088 (0.000) 0.160 (0.000) 0.101 (0.000) 0.038 (0.000) 0.017 (0.033) γ2 -0.410 (0.000) -0.302 (0.000) -0.514 (0.000) -0.342 (0.000) -0.115 (0.000) -0.049 (0.045) ρ 0.382 (0.000) 2 σ 0.386 (0.000) 0.388 (0.000) 0.017 0.000 0.018 0.000 0.002 0.000 LIK 154.007 170.161 149.679 170.671 460.716 477.815 BP 40.180 (0.000) 40.132 (0.000) 36.214 (0.000) 39.716 (0.000) 13.474 (0.009) 15.330 (0.004) F stat 235.400 (0.000) Wald 212.900 (0.000) 310.059 (0.000) 19.860 (0.000) 429.209 (0.000) Notes: See Table 1. 26 800.107 (0.000) Figure 9: Variance of the natural logarithms of GRP per inhabitant 0.9 0.8 0.7 0.6 0.5 0.4 0.3 0.2 0.1 0 The SDM estimations which correspond to eq. (30) are found in Tables 3 and 4 for * 2 h and * 4 h , respectively. Results are given for each year of the observation period. , , and are the coefficients for the intercept, human capital in i , human capital in i ’s neighbours as well as output in i ’s neighbours, respectively. ‘Direct’, ‘indirect’ and ‘total’ are the respective effects of human capital in i ’s neighbours. These direct, indirect and total effects on output levels are positive for each year in each case, i.e. an increase in the human capital stock in any region has a positive effect on output levels. In addition, the intercept is non-significant, and output in neighbouring regions (as displayed by ) has a positive effect on i ’s output. Therefore, all of these results confirm the predictions of eqs. (24), (25) and (26). That said, the indirect effect of human capital becomes non-significant at the end of the decade. The model includes vertical integration (as captured by ) as well as horizontal integration (as captured by the wij s). If these variables change, then the system inevitably moves towards a new steady-state. Although steady-states are a theoretical concept and cannot be measured in the real world, two of the empirical results indicate that equilibrium may have changed during the observation period. In particular, the influence of domestic output on output growth switches from negative to positive. In addition, the influence of human capital in neighbouring regions on output level becomes non-significant. Depending on the applied weight matrix, these changes start either in the middle of the decade, or in the year 2008, i.e. coinciding with either the EU’s Eastern enlargements, the crisis, or both. 27 Table 3: SDM estimations with 2 hours travel time as threshold distance 2000 2001 2002 2003 2004 2005 2006 2007 2008 2009 2010 α 1.025 (0.000) 1.088 (0.000) 1.125 (0.000) 1.027 (0.000) 0.971 (0.000) -0.023 (0.000) 1.099 (0.000) 1.446 (0.000) 1.695 (0.000) 1.593 (0.000) 1.587 (0.000) β 0.619 (0.000) 0.626 (0.000) 0.660 (0.000) 0.689 (0.000) 0.726 (0.000) 0.771 (0.000) 0.771 (0.000) 0.774 (0.000) 0.804 (0.000) 0.819 (0.000) 0.837 (0.000) γ -0.383 (0.000) -0.391 (0.000) -0.424 (0.000) -0.459 (0.000) -0.471 (0.000) -0.528 (0.000) -0.527 (0.000) -0.531 (0.000) -0.568 (0.000) -0.601 (0.000) -0.616 (0.000) Direct 0.719 (0.000) 0.717 (0.000) 0.743 (0.000) 0.776 (0.000) 0.824 (0.000) 0.843 (0.000) 0.845 (0.000) 0.820 (0.000) 0.824 (0.000) 0.836 (0.000) 0.853 (0.000) Indirect 0.594 (0.004) 0.545 (0.004) 0.501 (0.007) 0.518 (0.008) 0.588 (0.002) 0.436 (0.019) 0.444 (0.016) 0.278 (0.092) 0.132 (0.404) 0.103 (0.538) 0.101 (0.553) Total 1.312 (0.000) 1.262 (0.000) 1.243 (0.000) 1.294 (0.000) 1.412 (0.000) 1.278 (0.000) 1.290 (0.000) 1.097 (0.000) 0.956 (0.000) 0.939 (0.000) 0.954 (0.000) ρ 0.820 (0.000) 0.814 (0.000) 0.811 (0.000) 0.822 (0.000) 0.820 (0.000) 0.811 (0.000) 0.811 (0.000) 0.778 (0.000) 0.755 (0.000) 0.768 (0.000) 0.768 (0.000) σ2 0.072 0.072 0.070 0.060 0.055 0.053 0.053 0.054 0.057 0.059 0.058 LIK -71.786 -71.387 -66.429 -49.547 -38.546 -31.067 -31.090 -29.394 -32.966 -38.935 -36.095 BP 10.699 (0.005) 11.839 (0.003) 11.163 (0.004) 7.911 (0.019) 6.789 (0.034) 4.077 (0.130) 4.078 (0.130) 5.209 (0.074) 6.767 (0.034) 8.343 (0.015) 7.600 (0.022) 2008.441 1866.755 1780.052 2070.696 2012.407 1788.104 1787.532 1211.953 951.454 1086.795 1090.139 Wald Notes: “Direct”, “indirect” and “total” refer to the influence of an increase of the spatially lagged variable as discussed by LeSage and Pace (2009), other symbols and abbreviations are as given in the notes to Table , p-values are based on 1,000 sampled raw parameter estimates. 28 Table 4: SDM estimations with 4 hours travel time as threshold distance 2000 2001 2002 2003 2004 2005 2006 2007 2008 2009 2010 α 0.467 (0.003) 0.471 (0.003) 0.507 (0.002) 0.469 (0.004) 0.432 (0.008) 0.597 (0.001) 0.627 (0.001) 0.813 (0.000) 1.007 (0.000) 0.904 (0.000) 0.882 (0.000) β 0.556 (0.000) 0.545 (0.000) 0.565 (0.000) 0.600 (0.000) 0.636 (0.000) 0.692 (0.000) 0.659 (0.000) 0.667 (0.000) 0.716 (0.000) 0.740 (0.000) 0.754 (0.000) γ -0.389 (0.000) -0.377 (0.000) -0.409 (0.000) -0.449 (0.000) -0.473 (0.000) -0.553 (0.000) -0.498 (0.000) -0.512 (0.000) -0.575 (0.000) -0.630 (0.000) -0.631 (0.000) Direct 0.625 (0.000) 0.615 (0.000) 0.626 (0.000) 0.662 (0.000) 0.703 (0.000) 0.732 (0.000) 0.706 (0.000) 0.700 (0.000) 0.734 (0.000) 0.748 (0.000) 0.767 (0.000) Indirect 1.037 (0.013) 1.045 (0.012) 0.921 (0.028) 0.917 (0.040) 0.998 (0.029) 0.595 (0.166) 0.701 (0.088) 0.486 (0.176) 0.235 (0.489) 0.117 (0.764) 0.182 (0.635) Total 1.662 (0.000) 1.660 (0.000) 1.547 (0.001) 1.579 (0.001) 1.700 (0.001) 1.327 (0.005) 1.407 (0.002) 1.186 (0.003) 0.969 (0.009) 0.865 (0.042) 0.949 (0.024) ρ 0.899 (0.000) 0.899 (0.000) 0.899 (0.000) 0.904 (0.000) 0.904 (0.000) 0.895 (0.000) 0.885 (0.000) 0.869 (0.000) 0.854 (0.000) 0.872 (0.000) 0.871 (0.000) σ2 0.066 0.065 0.062 0.056 0.052 0.050 0.051 0.053 0.055 0.054 0.054 LIK -47.950 -44.412 -39.072 -26.628 -17.251 -11.945 -12.636 -15.088 -18.751 -19.513 -18.019 BP 6.516 (0.038) 6.309 (0.043) 5.146 (0.076) 3.192 (0.203) 2.001 (0.368) 0.912 (0.634) 0.650 (0.723) 0.781 (0.677) 1.364 (0.506) 2.768 (0.251) 2.463 (0.292) 2552.801 2525.919 2529.828 2813.282 2807.679 2330.545 1950.598 1481.636 1172.470 1548.279 1513.518 Wald Notes: See Table 3. 29 5. Conclusions and Outlook Only a handful of neoclassical growth models have so far studied interdependencies of regional economies by simultaneously considering the effects of space and time. In addition, neoclassical growth models have usually little to tell about the roles of historical coincidence, alternation of convergence and divergence trends, persisting core-periphery patterns, and human capital migration. Models of economic geography have been successful in explaining these phenomena in an environment with increasing returns to scale, of which the most influential model is Krugman’s (1991a, 1991b) core-periphery model. However, this as well as its succeeding models are most often restricted to two regions, and growth is not modelled as such. The main objective of this paper was to incorporate the effects of factor relocations into a neoclassical growth model which is able to explain alternating convergence and divergence trends as well as persisting core-periphery patterns in a scenario with free factor movement, where the regional economies under consideration have access to the same technology and are big enough to display constant returns to scale. In other words, the model is designed to explain interregional developments within the European Union. The theoretical model assumes that human capital migration decisions depend on expected wages for human capital suppliers, while physical capital relocations depend on expected profits. Both types of movement are spatially bounded, and more centrally located regions are subject to greater dependence on circumstances in other regions. The model explains why regions with high initial levels of human capital are attractive for both human capital suppliers as well as investment flows. Furthermore, in the long-run, the levels of wages for human capital suppliers are region-specific and consequently, the physical capital levels approach differing levels, too. Each region’s steady-state level is positively dependent on its neighbours’ levels as well as on its own initial levels. Simulation results illustrate that in the medium-run, convergence and divergence may alternate until each region has reached its own steady-state growth path. In the long-run, therefore, disparities prevail, with similar levels across regions which are spatially close. It should also be stressed that during transition periods some groups of regions may converge, while others diverge. Spatial lag of X as well as spatial Durbin error model specifications for 250 regions are applied to confront the model with European data. The study area comprises the regions of the European Union on the NUTS2 level, the observation periods are 2000 to 2008, 2000 to 2010 and 2008 to 2010. The results confirm both the model’s predictions regarding human capital, with positive effects within one region’s borders, and negative effects in neighbouring regions. In contrast, initial output in neighbouring regions has a positive effect. Perhaps most importantly, the effect of initial output levels within regions is negative until 2008, but turns positive for the period 2008 to 2010. An accompanying display of the evolution of variance of output levels illustrates this trend-reversal. 30 Spatial Durbin model specifications are applied for each year during the observation period 2000 to 2010. As predicted by the model, the results show that human capital endowments both within a region and in neighbouring regions, as well as output levels of neighbouring regions, each have a positive effect on output in one particular region. Therefore, neighbouring regions influence each other positively and therefore have similar values in the long-run. In addition, the tests indicate that in the wake of horizontal integration, the regions of the EU possibly move towards new steady-states. The empirical record of interregional disparities within Europe over the past 120 years is one of persistent disparities, with strong spatial autocorrelation. The same economies which were highly developed back then are the most advanced today, and most of them are neighbours to each other. Within these economies, those which lie geographically closer to the economic core-regions are also more advanced. There is little evidence that the interlude, during which some European economies were centrally-planned, had any effect on long-run growth. Rather, it seems as if the years of high growth-rates that followed the transition-induced recession were just a temporary phenomenon. Only very few national economies have managed to catch-up to the highest developed economies so far. It is remarkable that Asian economies such as Japan or the Republic of Korea were considerably regulated and closed during their catch-up processes, and with respect to investment and migration flows to a large extent still are. Within the European Union, the crisis has hit the cohesioncountries hardest, and the gap has widened again. For instance, Germany attracts immigrants from other member states, who are relatively highly qualified (Gathmann et al., 2014). Hence, peripheral countries and regions are losing human capital to the core, which may alleviate the burden of unemployment in the short-run, but hinder development in the long-run. Taking on a long-run perspective, European economic history since industrialisation provides little evidence of convergence. Rather, historical coincidence and neighbourhood relations shape the spatial distribution of productivity and wealth. This paper’s theoretical model has incorporated these issues by showing how investment flows and the migration of skilled workers have the potential to stabilise or deepen existing disparities. Temporary σ-convergence of some regions or the whole system may occur as the system moves towards a new equilibrium, e.g. in the wake of external shocks. The empirical section shows how important human capital endowments and neighbourhood relations are, and how β-convergence has turned into divergence during the crisis. Nevertheless, lack of data prevents an empirical investigation in full detail. Reliable data on the interregional migration of skilled workers, interregional investment flows as well as regional levels of fixed capital within the European Union would have the potential to further improve our understanding regarding the dynamics of Europe as a system of regional economies. This study’s main contribution lies in providing a theoretical framework for how such dynamics function, and by showing that the available data confirm the model’s predictions. 31 References Acemoğlu, D. and Robinson, J. A. (2012): Why Nations Fail - The Origins of Power, Prosperity, and Poverty, Crown Business, New York. Alexiadis, S. (2013) Convergence Clubs and Spatial Externalities: Models and Applications of Regional Convergence in Europe, Berlin and Heidelberg, Springer. Barro, R., Mankiw, G., Sala-i-Martin, X.X. (1995) Capital mobility in neoclassical models of growth, American Economic Review, 85, 103-115. Barro, R.J. and Sala-i-Martin, X.X. (2004) Economic Growth [2nd ed.], New York, McGraw-Hill. Baumol, W. J. (1986): Productivity growth, convergence, and welfare: What the long run data show, American Economic Review, 76, 1072-1085. Blonigen, B. A., Davies, R. B., Waddell, G. R. and Naughton H. T. (2007) FDI in space: Spatial autoregressive relationships in foreign direct investment, European Economic Review, 51, 1303-1325. Borts, G. H. and Stein, J. L. (1964): Economic Growth in a Free Market [Reprint 1966], New York, Columbia University Press. De Dominicis, L. (2014) Inequality and Growth in European Regions: Towards a Place-based Approach, Spatial Economic Analysis, 9, 120-141. Docquier, F. and Rapoport, H. (2012) Globalization, brain drain, and development, Journal of Economic Literature, 50, 681-730. Ertur, C. and Koch, W. (2007): Growth, technological interdependence and spatial externalities: Theory and evidence, Journal of Applied Econometrics, 22, 1033-1062. European Bank for Reconstruction and Development (2013) Transition Report 2013: Stuck in Transition? Available at http://www.ebrd.com/pages/research/publications/flagships/transition.shtml, accessed 21 November 2013. Fischer, M. M., Bartkowska, M., Riedl, A., Sardadvar, S., Kunnert, A. (2009) The impact of human capital on regional labour productivity in Europe, in Fischer, MM & Getis, A (eds.) Handbook of Applied Spatial Analysis, Berlin, Heidelberg and New York, Springer, 583-597. Fischer, M. M., Stirböck, C. (2006): Pan-European regional income growth and club-convergence – Insights from a spatial econometric perspective, Annals of Regional Science 40, 1-29. 32 Gathmann, C., Keller, N., Monscheuer, O., Straubhaar, T., Schäfer, H., Zimmermann, K.F. and Brücker, H. (2014) Zuwanderung nach Deutschland – Problem und Chance für den Arbeitsmarkt, Wirtschaftsdienst, 94, 59-179. Gennaioli, N., La Porta, R., Lopez-de-Silanes, F. and Shleifer, A. (2013) Human capital and regional development, The Quarterly Journal of Economics, 128, 105-164. Islam, N. (2003) What have we learnt from the convergence debate?, Journal of Economic Surveys, 17, 309-362. Krugman, P. (1991a). Increasing returns and economic geography, Journal of Political Economy, 99, 483-499. Krugman, P. (1991b). Geography and Trade [Reprint 1992], Leuven and Cambridge [MA], Leuven University Press and MIT Press. Landes, D. S. (1998): The Wealth and Poverty of Nations: Why Some Are so Rich and Some so Poor, W. W. Norton, New York. Le Gallo, J., Ertur, C. and Baumont, C. (2003): A spatial econometric analysis of convergence across European regions, 1980-1995, in B. Fingleton (ed.), European Regional Growth, Berlin, Heidelberg and New York, Springer. LeSage, J. and Fischer, M. M. (2008) Spatial Growth Regressions: Model Specification, Estimation and Interpretation, Spatial Economic Analysis, 3, 275-304. LeSage, J. and Pace, R. K. (2009) Introduction to Spatial Econometrics, CRC Press, Boca Raton, London and New York. Mankiw, N. G., Romer, D., Weil, D. N. (1992) A contribution to the empirics of economic growth, Quarterly Journal of Economics, 107, 407-437. Maya, A. M. (2012) International migration: A panel data analysis of the determinants of bilateral flows, Journal of Population Economics, 23, 1249-1274. Monastiriotis, V. (2014) Regional growth and national development: Transition in Central and Eastern Europe and the regional Kuznets curve in the East and the West, Spatial Economic Analysis, 9, 142-161. Neven, D. and Gouymte, C. (1995), Regional Convergence in the European Community, Journal of Common Market Studies 33, 47-65 North, D. C. (1990): Institutions, Institutional Change, and Economic Performance, Cambridge University Press, New York. 33 Olejnik, A. (2008) Using the spatial autoregressively distributed lag model in assessing the regional convergence of per-capita income in the EU25, Papers in Regional Science, 87, 371-385. Paci, R., Pigliaru, F. (2002) Technological diffusion, spatial spillovers and regional convergence in Europe, in Cuadrado-Roura, J. R. and Parellada, M. (eds.) Regional Convergence in the European Union, Berlin and Heidelberg, Springer Pfaffermayr, M. (2009) Conditional β- and σ-convergence in space: A maximum likelihood approach, Regional Science and Urban Economics 39, 63-78 Ramos, R., Suriñach, J., Artís, M. (2010) Human capital spillovers, productivity and regional convergence in Spain, Papers in Regional Science, 89, 435-447. Romer, D. (2005) Advanced Macroeconomics [third edition]. New York, McGraw-Hill/Irwin Sala-i-Martin, X. X. (1996b): Regional cohesion: Evidence and theories of regional growth and convergence, European Economic Review, 40, 1325-1352. Sardadvar, S. (2012) Growth and disparities in Europe: Insights from a spatial growth model, Papers in Regional Science, 91, 257-274. Schürmann, C. and Talaat, A. (2000) Towards a European peripherality index: Final report, Berichte aus dem Institut für Raumplanung, 53. Solow, R. M. (1956) A contribution to the theory of economic growth, Quarterly Journal of Economics, 70, 65-94. Swan, T. W. (1956): Economic growth and capital accumulation, Economic Record, 32, 334-361. Thirlwall, A. P. (1979), The balance of payments constraint as an explanation of international growth rate differences, Banca Nazionale del Lavoro Quarterly Review, 32, 45-53. Tondl, G. (2001) Convergence After Divergence? Regional Growth in Europe, Vienna, Heidelberg and New York, Springer 34 1 The concept of σ-convergence refers to a declining variance of GDP per capita levels within a sample of economies, while β-convergence refers to faster future economic growth of economies with currently low GDP per capita levels relative to the sample mean (for a detailed discussion see Barro and Sala-i-Martin 2004). 2 Acemoglu (2009) mentions three major problems, namely (i) endogeneity of explanatory variable and growth, (ii) ambiguity regarding an explanatory variable’s magnitude of impact and (iii) ignoring the openness of considered economies and their interactions. 3 The ‘transition region’ as defined by the study also includes non-European countries from the former Soviet Union, North Africa and the Middle East, which are not further considered in this paper. 4 The number excludes Berlin; data source: Eurostat as of 5-December-2013. 5 For discussions on the incidence of geographical distance on physical and human capital relocations, see also Blonigen et al. (2007), and Maya (2010), respectively. 6 The first term in brackets is unambiguously positive, the second term is positive if hi ,t 1 b b2 (1 i ) c 1 i 1 b , which, with plausible values for the parameters, takes on values around one. Considering the positive value of the first term, it is unlikely yet possible for regions with very low human capital endowments that eq. (19) becomes negative. 7 Note that a negative impact of initial output would resemble convergence, although the interpretation in this paper is different. 8 The corresponding steady-states are idential to the ones in the model by Mankiw et al. (1992). 9 The study covers the European territory of the EU on the NUTS2 level. Due to lack of data, the classification used in this study deviates from the official classification as of December 2011 in the following cases: Cyprus, Estonia, Latvia, Lithuania, Luxemburg, and Malta are not included; the NUTS2 regions Brandenburg-Nordost and Brandenburg-Südwest as well as the NUTS2 regions of Danmark and Slovenia have been merged to one region, respectively. By focussing on Europe, the study excludes the French regions Guadeloupe, Martinique, Guyana and Réunion, the Portuguese regions Região Autónoma dos Açores and Região Autónoma da Madeira, and the Spanish regions Ciudad Autónoma de Ceuta, Ciudad Autónoma de Melilla and Canarias. 10 It does no harm to rely on nominal values as relative growth rates are studied. 35


© Copyright 2026