
Male pregnancy in the seahorse (Hippocampus abdominalis):
Zurich Open Repository and
Archive
University of Zurich
Main Library
Winterthurerstrasse 190
CH-8057 Zurich
www.zora.uzh.ch
Year: 2010
Male pregnancy in the seahorse (Hippocampus abdominalis):
investigating the genetic regulation of a complex
reproductive trait
K N Stölting
Posted at the Zurich Open Repository and Archive, University of Zurich
http://dx.doi.org/10.5167/uzh-43648
Originally published at:
Stölting, K N. Male pregnancy in the seahorse (Hippocampus abdominalis): investigating the genetic
regulation of a complex reproductive trait. 2010, University of Zurich, Faculty of Science.
Male Pregnancy in the Seahorse (Hippocampus abdominalis):
Investigating the Genetic Regulation of a Complex Reproductive Trait
Dissertation
zur
Erlangung der naturwissenschaftlichen Doktorwürde
(Dr. sc. nat.)
vorgelegt der
Mathematisch-naturwissenschaftlichen Fakultät
der
Universität Zürich
von
Kai Nikolas Stölting
aus
Deutschland
Promotionskomitee
Prof. Dr. Anthony B. Wilson (Vorsitz und Leitung der Promotion)
Prof. Dr. Andreas Wagner
Prof. Dr. Tadeusz Kawecki
Zürich, 2010
2
TABLE OF CONTENTS
SUMMARY
4
ZUSAMMENFASSUNG
7
GENERAL INTRODUCTION
CHAPTER I:
Male Pregnancy in Seahorses and Pipefish: Beyond the
Mammalian Model
CHAPTER II: Cost-Effective Fluorescent Amplified Fragment Length
Polymorphism Analyses
11
20
52
CHAPTER III: Eukaryotic Transcriptomics in silico: Optimizing cDNA-AFLP
Efficiency
68
CHAPTER IV: Comparative Transcriptomics of the Male Pregnant Seahorse
Hippocampus abdominalis
111
ACKNOWLEDGEMENTS
158
CURRICULUM VITAE
160
3
SUMMARY
SUMMARY
Seahorses and pipefish are characterized by different forms of male
pregnancy, a complex morphological and physiological process akin a mammalian
pregnancy. The genetic regulation of this complex trait, however, is unknown,
complicating our efforts to understand how this trait has evolved. To permit such
studies, the processes of male pregnancy have been reviewed, and the genes of
male pregnancy have been identified using cDNA-AFLP based differential displays
and next generation sequencing technology. Initial efforts to identify gene
expression differences during male pregnancy using a novel cDNA-AFLP
endlabelling protocol proved unsuccessful, and an extensive eukaryote-wide
computer-based optimization study was undertaken to optimize the cDNA-AFLP
methodology for species in which genome data are unavailable. Next generation
sequencing was ultimately used to identify the genes of male pregnancy. More
than 38,000 cDNA fragments have been sequenced and annotated wherever
possible. Hundreds of genes up- and downregulated during male pregnancy were
identified, and major gene functions have been associated with these genes. As a
result, a more circumspect picture of both processes and the genes involved in
male pregnancy in the seahorse is available.
This thesis is structured into four chapters. Chapters I and III have been
published in peer reviewed international journals. Chapters II and IV are being
prepared for submission.
Chapter I
We reviewed the processes of mammalian pregnancy and the male
pregnancy of seahorses and pipefish (syngnathid fishes) as a basis for further
studies on the evolution of male pregnancy. During male pregnancy, syngnathid
males incubate developing embryos in a specialized brooding structure, the brood
pouch, in which they are aerated, osmoregulated, protected and likely also
provisioned during development. Direct comparisons of the syngnathid male
pregnancy with other forms of viviparity strongly suggests parallels in physiology,
morphology and genetic changes, and a review of recent advances on syngnathid
pregnancy highlights similarities and
differences between seahorse and
4
SUMMARY
mammalian pregnancy. This comparison is the foundation to further studies on the
evolution of a complex trait, the male pregnancy.
Chapter II
Amplified fragment length polymorphisms (AFLP) are a widely used
fingerprinting tool, which can be used in high-throughput AFLP protocols which
require the incorporation of fluorescently-labelled oligonucleotides. Large numbers
of fragments can thus be rapidly screened on automated DNA sequencing
machines. The per-marker costs are comparably low for AFLPs, but the key
element
for
high-throughput
approaches,
the
fluorescently-labelled
oligonucleotide, remain costly. In reducing this fraction of the experimental setup
by implementing fluorescent endlabelling of AFLPs, this tool will be even more
accessible for laboratories with reduced budgets. The endlabelling alternative
presented here benefits from statistical analyses which indicate that the standard
fluorescent AFLPs and the novel endlabelled alternatives produce comparable
results. However, given the differences in the size and numbers of fragments
generated with the two methods, we do not recommend to combine partial data
generated with both approaches. Given the considerably reduced setup costs and
comparable performance, we suggest that researchers commencing a new AFLP
project use endlabelled AFLPs instead of traditional fluorescent AFLPs.
Chapter III
Differentially expressed genes
can be detected using the AFLP
methodology on complementary DNA through the correlation of trait expression
with cDNA expression profiles. However, given the methodological complexity of
the AFLP approach and the taxonomic diversity of organisms typically studied with
AFLPs, the optimal design of such approaches can vary from species to species.
In modeling and optimizing the cDNA-AFLP assay design for all eukaryotic
species, we identify factors which can substantially increase the quality of cDNAAFLP experiments in any eukaryotic species. Factors revealed by in silico
simulations on 92 species covering most major eukaryotic group include the
choice of individual restriction enzymes substantially affecting screen quality.
While some evidence of phylogenetic signal in the cDNA-pool coverage is present,
this signal is largely mediated by organismal GC content, a second key factor
5
SUMMARY
affecting the quality of a screen. In optimizing cDNA-AFLP on a broad sample, a
strict linear relationship between the number of fragments screened per selective
AFLP-PCR reaction and the size of the underlying cDNA pool is detected. This
allows to estimate the number of genes expressed in a target tissue, an
application that should be invaluable as next-generation sequencing technologies
are adapted for differential display.
Chapter IV
Studies on the evolution of reproductive complexity have been complicated
by an absence of transitional forms. Syngnathid fishes are an ideal model for such
investigations, as extant species exhibit a wide diversity of rudimentary and more
complex form of male pregnancy. Unfortunately, little is known about the genetic
regulation of male pregnancy in syngnathid fishes, and knowledge on the genes
associated with pregnancy is key to undertaking comparative evolutionary studies
investigating the origins of this mode of reproduction. We assembled the first
reference transcriptome for the seahorse, consisting of 38,419 contigs
representing more than 30,000 different cDNAs. Functional annotations of
approximately 27% of these contigs allow the first comprehensive view of
seahorse gene functions, biological processes and cellular localizations during the
pregnancy process. In a comparative transcriptome screen of pregnant and nonpregnant individuals, hundreds of genes were identified and annotated which are
differentially expressed during male pregnancy. None of the different annotation
classes however, indicate significant differences in the representation of genes
from pregnant and non-pregnant brood pouch tissues. Our study also quantified
the effects of cDNA normalization on gene discovery, and shows clearly that
normalization is essential in studies that aim for a full representation of the
transcriptome. The assembly of the seahorse transcriptome will be used in the
construction of a microarray for the comparative analysis of gene expression
during pregnancy in other syngnathids and represents a critical first key step
towards understanding the evolution of this complex trait.
6
ZUSAMMENFASSUNG
ZUSAMMENFASSUNG
Alle
Seepferdchen
und
Seenadeln
besitzen
verschiedene
Formen
männlicher Schwangerschaft. Männliche Schwangerschaft ist ein komplexer
morphologischer und physiologischer Prozess ähnlich der Schwangerschaft bei
Säugetieren. Die genetische Kodierung dieses komplexen Merkmals aber ist
praktisch unbekannt, was detaillierte Studien zur Evolution dieses Merkmales
beträchtlich behindert. Um künftig solche Studien zu ermöglichen, wurde bereits
bekanntes Wissen über die beteiligten Prozesse in Form eines Reviews
zusammengetragen. Ausserdem wurden die an der Schwangerschaft beteiligten
Gene mittels differentieller cDNA-AFLP-Analysen und neuer Sequenziermethoden
ermittelt. Anfängliche Versuche, Unterschiede in der Genexpression während der
männlichen Schwangerschaft mittels eines neuen cDNA-AFLP-Ansatzes zu
identifizieren, schlugen fehl. Eine umfassende computerbasierte Optimierung
wurde unternommen, um cDNA-AFLPs für sämtliche Eukaryoten zu optimieren,
für die genomische Daten nicht verfügbar sind. Neue Sequenziermethoden
wurden schliesslich eingesetzt, um die an der männlichen Schwangerschaft
beteiligten Gene zu identifizieren. Mehr als 38.000 cDNA- Fragmente konnten
sequenziert werden und wurden soweit möglich auch annotiert. Hunderte von
während der Schwangerschaft herauf- oder herabregulierten Genen wurden
identifiziert. Mit Hilfe der vorliegenden Arbeit entstand ein umfassenderes Bild
sowohl von den Prozessen der männlichen Schwangerschaft als auch den an der
Schwangerschaft der Seepferdchen beteiligten Gene.
Die vorliegende Arbeit ist in vier Kapitel unterteilt. Kapitel I und III wurden
bereits in der internationalen, kritisch begutachteten Fachpresse publiziert. Die
Kapitel II und IV sind in Vorbereitung zur Publikation.
Kapitel I
Als Grundlage für weitergehende Studien zur Evolution der männlichen
Schwangerschaft wurden die Vorgänge bei männlicher Schwangerschaft der
Seepferdchen
und
Seenadeln
(syngnathide
Fische)
mit
denen
der
Schwangerschaft der Säugetiere zusammengetragen und verglichen. Bei den
syngnathiden Fischen trägt das Männchen die sich entwickelnden Jungtiere in
7
ZUSAMMENFASSUNG
spezialisierten Brutstrukturen aus, in denen die Jungtiere geschützt, osmoreguliert
und mit Sauerstoff versorgt werden. Es ist wahrscheinlich, dass das Männchen die
Jungtiere während ihrer Entwicklung auch mit Nährstoffen versorgt. Direkte
Vergleiche von männlicher Schwangerschaft bei syngnathiden Fischen mit
anderen Formen der Lebendgeburt zeigen Parallelen in der Physiologie, der
Morphologie und auch in den Veränderungen in exprimierten Genen. Unsere
Zusammenfassung
jüngster
Forschungsergebnisse
zeigt
darüber
hinaus
Ähnlichkeiten wie auch Unterschiede zwischen syngnathider und SäugetierSchwangerschaft auf. Dieser Vergleich dient als Grundlage für weitergehende
Studien
zur
Evolution
eines
komplexen
Merkmals,
der
männlichen
Schwangerschaft.
Kapitel II
Polymorphismen in amplifizierten Fragmentlängen (AFLP) werden häufig
als universelles DNA-fingerprinting-Werkzeug gebraucht und lassen sich in
hocheffektive automatisierte Abläufe einbinden, wenn fluoreszenzmarkierte
Oligonukleotide eingesetzt werden. Damit können dann sehr grosse Mengen an
Fragmenten auf automatisierten Sequenziermaschinen getestet werden. AFLPs
sind relativ günstig, wenn die Kosten auf die Anzahl getesteter Marker
umgerechnet
werden.
Die
zentrale
Komponente
von
AFLPs,
die
fluoreszenzmarkierten Oligos, bleibt teuer. Indem man diesen Anteil der
experimentellen Kosten durch die Verwendung der sogenannten EndlabellingMethode reduziert, sollten AFLPs als Werkzeug auch für Laboratorien mit
geringem Budget erschwinglich werden. Die vorgestellte Alternative entspricht
hinsichtlich statistischer Vergleiche der traditionellen AFLP-Methode und erzeugt
vergleichbare Ergebnisse. Unterschiede in der Grösse und Anzahl von erzeugten
Fragmenten lassen jedoch nicht zu, dass partielle Datensätze, die mittels beider
Methoden erzeugt wurden, miteinander verbunden werden können. Durch die
deutlich reduzierten Gestehungskosten und vergleichbare Qualität bietet sich
jedoch die neue AFLP-Methode als echte Alternative zu traditionellen fluoreszenzmarkierten AFLP-Experimenten an.
8
ZUSAMMENFASSUNG
Kapitel III
Differentiell exprimierte Gene können mittels der cDNA-AFLP-Methodologie
detektiert
werden,
indem
man
Merkmale
des
Organismus
mit
cDNA-
Expressionsprofilen korreliert. Dieser Ansatz ist jedoch nicht trivial, da AFLPs
methodologisch komplex sind und durch die taxonomische Divergenz der zu
analysierenden Arten sich das AFLP-Design von Art zu Art deutlich ändern kann.
Wir
haben
mit
Hilfe
von
Modellierung
cDNA-AFLPs
optimiert
und
Schlüsselfaktoren identifiziert, die die Qualität von cDNA-AFLP-Experimenten
massiv beeinflussen. In- silico-Simulationen an 92 eukaryotischen Arten fast aller
grossen taxonomischen Gruppen zeigen, dass die Wahl der verwendeten
Restriktionsenzyme die Qualität eines Screens deutlich beeinflusst. Die von uns
analysierten Daten zeigen einen gewissen Einfluss der Stammesgeschichte,
wobei sich erweist, dass dieser Einfluss vor allem in den Veränderungen des GCGehaltes begründet liegt. Dieser ist ein zweiter Schlüsselfaktor, der die Qualität
eines Screens beeinflusst. Während wir cDNA-AFLPs für eine grosse Menge von
Organismen optimierten, zeigte sich auch ein strikt linearer Zusammenhang
zwischen der Anzahl der pro Reaktion erhaltenen Fragmente und der Grösse des
analysierten cDNA-Pools. Dieser Zusammenhang erlaubt es nun, die Anzahl der
Gene in einem Gewebe zu schätzen, eine Anwendung, die um so wichtiger wird,
je mehr neue Sequenziermethoden eingesetzt werden, um differentiell exprimierte
Gene zu identifizieren
Kapitel IV
Untersuchungen zum Verständnis der Evolution von komplexen Formen der
Reproduktion wurden bisher durch das Fehlen von Zwischenformen erschwert.
Syngnathide Fische sind ein ideales Modellsystem für solche Untersuchungen, da
rezente Formen eine grosse Diversität an rudimentären und komplexeren Formen
der männlichen Schwangerschaft aufweisen. Unglücklicherweise ist über die
genetische Regulation der männlichen Schwangerschaft dagegen nur wenig
bekannt.
Kenntnis
der
bei
syngnathiden
Fischen
an
der
männlichen
Schwangerschaft beteiligten Gene ist essentiell für vergleichende evolutionäre
Studien, die den Ursprung dieser Art der Fortpflanzung zu klären suchen. Wir
haben
hier
das
erste
Referenz-Transkriptom
des
Seepferdchens
zusammengestellt, welches aus 38.419 Contigs besteht und mehr als 30.000
9
ZUSAMMENFASSUNG
unterschiedliche cDNAs darstellt. Funktionelle Annotationen für ca. 27% dieser
Contigs erlauben einen ersten, umfassenden Blick auf Genfunktionen, biologische
Prozesse
und
die
zelluläre
Lokalisation
der
Contigs
während
der
Schwangerschaft. Mittels einer vergleichenden Analyse von schwangeren und
nicht-schwangeren Individuen wurden Hunderte von Genen identifiziert und auch
annotiert, die während der männlichen Schwangerschaft differentiell exprimiert
sind. Keine der verschiedenen Klassen der Annotation zeigt jedoch signifikante
Unterschiede in der Anzahl von Genen aus schwangeren und nicht-schwangeren
Geweben auf. Im Rahmen unserer Studie wurden auch die Auswirkungen der
Normalisierung auf die Entdeckung noch unbekannter Gene quantifiziert, es wurde
ebenso klar aufgezeigt, dass die Normalisierung bedeutend ist für Studien, deren
Ziel es ist, ein möglichst komplettes Transkriptom zu erhalten. Dieses
Transkriptom eines Seepferdchens wird auch zur Herstellung eines Microarrays
verwendet und für die vergleichende Analyse von Genexpression während der
männlichen Schwangerschaft in anderen Syngnathiden eingesetzt. Es ist damit
ein erster, essentieller Schritt zum Verständnis der Evolution dieses komplexen
Merkmals.
10
GENERAL INTRODUCTION
GENERAL INTRODUCTION
Modes of reproduction in fishes
Fishes exhibit a tremendous diversity of forms of reproduction (Breder and
Rosen 1966). These modes range from the broadcast spawning of millions of
small eggs to elaborate forms of male, female and bi-parental care, and several
groups of fish have developed internal fertilization and/or forms of viviparity (livebearing; Breder and Rosen 1966). Outstanding among viviparous groups are
male-pregnant seahorses and pipefish (order Syngnathiformes), in which males
heavily invest into reproduction (Kuiter 2000) and the traditional sex-roles are
frequently reversed (Berglund and Rosenqvist 2003, Wilson et al. 2003, Jones et
al 2005).
Male pregnancy in syngnathid fishes
Male pregnancy is an extreme form of paternal care unique to syngnathid
fishes (Breder and Rosen 1966; Kuiter 2000) analogous to female pregnancy in
mammals. Eggs transferred from females competing for access to males (sex role
reversal), are fertilized and incubated in a pouch or pouch-like structure on the
male abdomen or tail. The eggs are osmoregulated and aerated during their
development (Leiner, 1934, Linton and Soloff, 1964) and genes expressed during
incubation have been shown to have an in vitro antibacterial effect (Melamed et al.
2005). Though a marked maternal contribution still exists as a consequence of egg
production, the male may also provide nutrients to the embryos (Ahnesjö 1992;
Ripley and Foran 2006). Juveniles are released at birth through the partial
(seahorses) or complete (pipefishes) opening of the pouch, or through hatching
from individual egg compartments (Carcupino et al. 2002; Teske et al. 2003;
Ripley and Foran 2006). At the same time, placenta-like structures are also
expelled in only some of all species which have been studied (Ripley and Foran
2006).
Five morphologically distinct types of male brood pouch on either the
abdomen (Gastrophori) or the tail (Urophori) can be identified across the
Syngnathidae (Breder and Rosen 1966). The discrimination of morphotypes is
based upon increasing morphological complexity (Duncker 1915; Wilson et al.
11
GENERAL INTRODUCTION
2003). In the simplest type of this form of reproduction (i), eggs are externally
attached to the ventral surface of the pregnant male, while more elaborate forms
include (ii) the containment of individual eggs in membranous compartments, (iii)
the protection of eggs with plates of body armour or with skin folds, (iv) bilateral
pouch folds growing together to form a closed pouch and ultimately (v) the
derived, complex and enclosed pouch of seahorse. Representatives of each
pouch form can be observed in both Gastrophori and Urophori syngnathid
lineages, (Figure 1; Wilson et al. 2001, Wilson et al. 2003).
As the male prepares
to receive a new clutch of
eggs, a series of processes
leads
the
formation
of
brooding structures, such as
ventral
gluing
pouches.
completion
areas
Upon
of
or
the
the
development of the broody
organ, males become able
to carry a clutch of fertilized
embryos during pregnancy.
Figure 1: Simplified phylogenetic relationships of
syngnathid fishes. Figure modified from Wilson et al. (2001,
2003). Consensus bootstrap values are indicated for all
branches with bootstrap support>80%. Gastrophori =
abdominal brooder, Urophori=tail brooder.
Males can only receive embryos after they reach reproductive maturity, which is
accompanied by a lengthy period that leads to alterations in expression levels of
paternal immune genes (Melamed et al. 2005), and involves changes in the
osmotic regulation of the eggs in their brooding structures. In addition, oxygen is
supplied to the eggs, and antibacterial activity in the pouch can be observed
(Carcupino et al. 2002; Melamed et al. 2005). Nutrient transfer to the embryos
occurs during this period, either directly through paternal transfer possibly via the
degradation of unfertilized eggs (Ahnesjö 1992; Ripley and Foran 2006). Male
pregnancy ends in a period of labor and birth of juveniles, at times accompanied
by expulsion of placenta-like structures. The pregnancy cycle can be repeated
multiple times during the breeding season. Pouch structures remain present in a
reduced form in sexually inactive males.
12
GENERAL INTRODUCTION
Evolution of Male Pregnancy
Male pregnancy is one of the key innovations of the Syngnathidae family
and evolved from fish without paternal care outside of the group (Nelson 1994)
more than 50 million years ago (MYA), as suggested by fossil record (Patterson
1993; Teske et al. 2003). Phylogenetic relationships within the Gastrophori are
well resolved (Fig. 1) (Wilson et al. 2001, Wilson et al. 2003). The basal lineage of
Gastrophori (Nerophis spp.) has a simple brooding structure, an open gluing area
for eggs at the abdomen (Duncker 1915; Kuiter 2000). From this, complex
structures with skin or pouch-like folds covering attached eggs appear to have
evolved (Duncker 1915; Kuiter 2000). It remains unclear what time spans were
involved, as no fossil data exist for this lineage. In parallel to the Gastrophori, a set
of morphologically more complex pouch types evolved in a rapid diversification
among the Urophori between 20 and 52 MYA (Patterson 1993; Teske et al. 2003).
The exact sequence of the evolution of male pregnancy in this group is unclear as
the phylogeny of Urophori remains largely unresolved (Figure 1).
Close similarities in the form of male pregnancy of the two syngnathid
lineages, suggest that similar genetic mechanisms may be responsible for
generating these structures. As limited genetic data exist for syngnathid fishes, the
investigation of this hypothesis requires the initial characterization of genome-level
data for the group. A good candidate species for such characterization should also
share features of established model species: relatively short generation time,
established culture in the lab, and sufficiently high reproductive rates to allow
statistical testing. A good candidate species would also be large enough to provide
sufficient amounts of tissues and would be of interest to a wider audience. The
seahorse Hippocampus abdominalis (Figure 2) is a good candidate species which
combines many of the listed features. This species is accommodated to
subtropical marine waters and can be kept and bred under laboratory conditions
(Woods 2000). Reaching up to 35cm in length, this is the largest seahorse species
and produces hundreds of offspring per clutch (Kuiter 2000).
Evolution of complex traits
Key innovations such as male pregnancy are often complex traits and are
of particular interest in the evolution of species diversity (e.g. pharyngeal jaws in
cichlid fishes; Skúlason and Smith 1995). Complex traits can evolve from simpler
13
GENERAL INTRODUCTION
components
through
the
recruitment
of
unrelated parts of independent functional units
(Steeg et al. 1988), or may result from the de
novo subfunctionalization of genes generated
during large-scale duplication (Force et al.
1999). This complementation of gene functions
occurs when the two resulting gene copies
carry different mutations, such that both
copies together produce the same amount of
mRNA
as
that
produced
before
the
Figure 2. Two male potbelly seahorses
Hippocampus abdominalis, presenting their
inflated brood pouches. Picture taken from
http://de.wikipedia.org/wiki/Seepferdchen.
duplication event. The presence of excess gene copies after the duplication may
be detrimental to the organism, and this excess needs to be down-regulated to
avoid abnormalities in growth and development (Force et al. 1999). While a good
part of the literature on the evolution of complexity addresses questions such as
the rise of multicellular organisms and accompanying increasing genomic
complexity (Lynch and Conery 2003) or the origin of brain complexity in humans
(Bradbury 2005), nothing is known about the de novo evolution of the complex
male pregnancy trait and its genetic control.
The genetic basis of complex traits: differential displays
Fundamental to studies on the evolution of complex traits such as male
pregnancy is a detailed knowledge on both genetic and morphological makeup of
the trait. Comparative genomic studies offers a power means to identify the
genetic basis of functional innovation via the comparison of correlations between
genetic and morphological changes. Unfortunately, the closest sequenced relative
of syngnathid fishes, the stickleback Gasterosteus aculeatus, is a species which
does not exhibit male pregnancy and diverged at least 50 million years ago from
the syngnathids (Stölting and Wilson 2007). Both the evolutionary divergence time
as well as the novelty of the character under study means that comparative
genomic studies using sequences from existing model organisms are unlikely to
provide any insights into the evolution of this trait in the syngnathids.
Dissecting the genetics of male pregnancy hence requires de novo
sequencing methods. cDNA sequencing approaches such as EST projects can
provide snapshot-information of many expressed genes in a tissue of interest, but
14
GENERAL INTRODUCTION
this type of data alone can provide only little information on the underlying
genetics. Differential display approaches offer a mean to identify differences in
patterns of gene expression in target tissues, and recent years have seen an
increase in available methods for the identification of such genes whose
expression patterns are significantly correlated with traits of interest (Liang and
Pardee 1992). The identification of differentially expressed genes is particularly
challenging in non-model organisms for which extensive genomic resources are
unavailable, as methods have to be used which function independently of the
unknown cDNA sequences. In such cases, the differential analysis of expressed
genes can be achieved by means of cDNA-AFLPs, which allow the detection of
presence/absence differences in gene expression (Breyne et al. 2003, Stölting et
al. 2009). The cDNA-AFLP technique involves the digestion of cDNA preparations
with two restriction enzymes. To analyze the produced fragments, adaptors are
ligated to each restriction fragment, which then serve as oligonucleotide-binding
sites for two subsequent rounds of PCR. By adding a few selective base pairs to
these primer sequences, the amplified fragment pool is reduced in complexity
such that a suitable number of fragments can be visualized (Vos et al. 1995,
Meudt and Clarke 2007). By comparing the presence or absence of individual
fragments in individual cDNA libraries after size separation, one can identify genes
correlated to the trait of interest.
Detect candidate genes associated with the traits offers a particular
powerful method to next generation sequencing techniques (Braverman et al.
2005, Morozova and Marra 2008). Massive parallel sequencing approaches can
provide several hundred million base pairs of sequence information per run,
providing the means to identify a large number of expressed genes per
transcriptome. This method is also unbiased, though modifications to standard
protocols are necessary to minimize the representation of highly expressed
transcripts in next generation sequencing. As this method allows the identification
of differences in gene expression and provides the raw data necessary for the
identification of the genes themselves, next generation sequencing has
revolutionized the study of gene expression data in non-model systems. Entire
transcriptomes can now be sequenced completely, but analysis methods struggle
to cope with the available wealth of sequence information and the need to
assemble
and
annotate
produced
contigs.
15
GENERAL INTRODUCTION
Objectives
The present study aims to describe the morphological and physiological
processes of male pregnancy in the seahorse Hippocampus abdominalis, and
applies cDNA-AFLPs differential displays and next-generation sequencing to
identify and describe the genetic basis involved in male pregnancy.
In Chapter I, physiological and morphological processes during male
pregnancy in syngnathids are summarized and compared to other forms of
viviparity. Many of the changes which occur during viviparity are superficially
similar even in distant related organisms, suggesting that common suite of gene
functions might be required. A circumspect foundation for further studies on male
pregnancy is provided, which reviews the male pregnancy literature with a focus
on the evolution of a complex trait.
Differential displays approaches can be used to identify genes required for
a particular trait. Chapter II optimizes one such approach, cDNA-AFLP, by
fluorescently end-labelling AFLP fragments. In replacing individual fluorescentlylabelled oligonucleotides with a single universal labelled primer, setup costs of the
AFLP experiments can be significantly reduced. Several alternative universal
primers are compared.
Initial efforts to screen the seahorse transcriptome using cDNA-AFLP were
unsuccessful (data not shown). Chapter III investigated the assay design of
cDNA-AFLP experiments using an extensive eukaryote-wide in silico simulation
experiment. Key factors to successful assay design were identified here, novel
versatility were added to the cDNA-AFLP technique, and consistent eukaryotewide patterning of cDNA-AFLP selective PCRs was identified.
Next-generation sequencing technology is used in Chapter IV to provide
reference transcriptomes of the seahorse Hippocampus abdominalis, and to
identify genes correlated to the male pregnancy. Five transcriptome-wide cDNA
libraries have been sequenced, annotated and compared, and several thousand
potential male pregnancy candidates are identified.
16
GENERAL INTRODUCTION
References
Ahnesjö I. 1992. Consequences of male brood care: weight and number of
newborn in a sex-role reversed pipefish. Functional Ecology 6:274-281.
Berglund A, Rosenqvist G. 2003. Sex role reversal in pipefish. Advances in the
Study of Behavior, 32, 32:131-167.
Bradbury J. 2005. Molecular insights into human brain evolution. PLoS Biology
3:e50.
Breder CM., Rosen DE. 1966. Modes of reproduction in fishes. Natural History
Press, New York.
Breyne P, Dreesen R, Cannoot B, Rombaut D, Vandepoele K, Rombauts S,
Vanderhaeghen R, Inze D, Zabeau M. 2003. Quantitative cDNA-AFLP
analysis for genome-wide expression studies. Molecular Genetics and
Genomics 269:173-179.
Carcupino M, Baldacci A, Mazzini M, Franzoi P. 2002. Functional significance of
the male brood pouch in the reproductive strategies of pipefishes and
seahorses: a morphological and ultrastructural comparative study on three
anatomically different pouches. Journal of Fish Biology 61:1465-1480.
Duncker G. 1915. Revision der Syngnathidae. Jahrbuch der Hamburgischen
Wissenschaftlichen Anstalten 32:9-120.
Force A, Lynch M, Pickett FB, Amores A, Yan Y-I, Postlethwait J. 1999.
Preservation
of
duplicate
genes
by
complementary,
degenerative
mutations. Genetics 151:1531-1545.
Götz S, Garcia-Gomez JM, Terol J, Williams TD, Neda MJ, Robles M, Talon M,
Dopazo J, Conesa A: High-throughput functional annotation and data
mining with the Blast2GO suite. Nucleic Acids Research 2008, 36:34203435
Jones AG, Rosenqvist G, Berglund A, Avise JC. 2005. The measurement of
sexual selection using Bateman's principles: An experimental test in the
sex-role-reversed pipefish Syngnathus typhle. Integrative and Comparative
Biology 45:874-884
Kuiter RH. 2000. Seahorses, pipefish and their relatives: Syngnathiformes.
Zoonetics, Seaford, Australia.
17
GENERAL INTRODUCTION
Leiner VM. 1934. Der osmotische Druck in den Bruttaschen der Syngnathiden.
Zoologischer Anzeiger 108: 273-289
Liang P, Pardee AB: Differential display of eukaryotic messenger-RNA by means
of the polymerase chain-reaction. Science 1992, 257:967-971.
Linton JR, Soloff BL. 1964. The physiology of the brood pouch of the male sea
horse Hippocampus erectus. Bulletin of Marine Science of the Gulf and
Carribbean 14(1): 45-61
Lynch M, Conery JS. 2003. The origins of genome complexity. Science 302:14011404.
Margulies M, Egholm M, Altman WE, Attiya S, Bader JS, Bemben LA, Berka J,
Braverman MS, Chen YJ, Chen Z, Dewell SB, Du L, Fierro JM, Gomes XV,
Godwin BC, He W, Helgesen S, Ho CH, Irzyk GP, Jando SC, Alenquer ML,
Jarvie TP, Jirage KB, Kim JB, Knight JR, Lanza JR, Leamon JH, Lefkowitz
SM, Lei M, Li J et al. 2005. Genome sequencing in microfabricated highdensity picolitre reactors. Nature 437:376-380
Melamed P, Xue Y, Poon JFD, Wu Y, Xie H, Yeo J, Foo TWJ, Chua HK. 2005.
The male seahorse synthesizes and secretes a novel C-type lectin into the
brood pouch during early pregnancy. FEBS Letters 272:1221-1235.
Meudt HM, Clarke AC: Almost forgotten or latest practice? AFLP applications,
analyses and advances. Trends in Plant Science 2007, 12:106-117.
Morozova O, Marra MA: Applications of next-generation sequencing technologies
in functional genomics. Genomics 2008, 92:255-264
Nelson JS. 1994. Fishes of the world. John Wiley & Sons, Inc., New York.
Patterson C. 1993. Chapter 36. Osteichthyes: Teleostei. Pp. 1–145 in M. J.
Brenton, ed. The Fossil Record. Chapman & Hall, London, England.
Ripley JL, Foran CM. 2006. Differential parental nutrient allocation in two
congeneric pipefish species (Syngnathidae: Syngnathus spp.). The Journal
of Experimental Biology 209:1112-1121.
Skúlason S, Smith TB. 1995. Resource polymorphisms in vertebrates. Trends in
Ecology and Evolution 10:366-370.
Steeg PS., Bevilacqua G, Kopper L, Thorgeirsson UP, Talmadge JE, Liotta LA,
Sobel ME. 1988. Evidence for a novel gene associated with low tumor
metastatic potential. Journal of the National Cancer Institute 80:200-204.
18
GENERAL INTRODUCTION
Stölting KN, Gort G, Wüst C, Wilson AB. 2009. Eukaryotic transcriptomics in silico:
Optimizing cDNA-AFLP efficiency. BMC Genomics 10, 565.
Stölting KN, Wilson AB. 2007. Male pregnancy in seahorses and pipefish: beyond
the mammalian model. Bioessays 29:884-896.
Teske PR, Cherry MI, Matthee CA. 2003. The evolutionary history of seahorses
(Syngnathidae: Hippocampus): molecular data suggest a West Pacific
origin and two invasions of the Atlantic Ocean. Molecular Phylogenetics and
Evolution 30:273-286.
Vos P, Hogers R, Bleeker M, Reijans M, Vandelee T, Hornes M, Frijters A, Pot J,
Peleman J, Kuiper M, Zabeau M. 1995. AFLP - A new technique for DNAfingerprinting. Nucleic Acids Research 23:4407-4414.
Wilson AB, Ahnesjö I, Vincent A, Meyer A. 2003. The dynamics of male brooding,
mating patterns, and sex roles in pipefishes and seahorses (family
Syngnathidae). Evolution 57:1374-1386.
Wilson AB, Vincent A, Ahnesjö I, Meyer A. 2001. Male pregnancy in seahorses
and pipefishes (family Syngnathidae): rapid diversification of paternal brood
pouch morphology inferred from a molecular phylogeny. The Journal of
Heredity 92:159-166.
Woods CMC: Preliminary observations on breeding and rearing the seahorse
Hippocampus abdominalis (Teleostei: Syngnathidae) in captivity. NZ J Mar
Freshwater Res 2000, 34:475-485
19
CHAPTER I Male Pregnancy Review
CHAPTER I: Male Pregnancy in Seahorses and Pipefish:
Beyond the Mammalian Model
Kai N. Stölting and Anthony B. Wilson
Published in: BioEssays 2007, 29:884-896
Summary
Pregnancy has been traditionally defined as the period during which
developing embryos are incubated in the body after egg-sperm union. Despite
strong similarities between viviparity in mammals and other vertebrate groups,
researchers have historically been reluctant to use the term pregnancy for nonmammals in recognition of the highly developed form of viviparity in eutherians.
Syngnathid fishes (seahorses and pipefishes) have a unique reproductive system,
where the male incubates developing embryos in a specialized brooding structure
in which they are aerated, osmoregulated, protected and likely provisioned during
their development. Recent insights into physiological, morphological and genetic
changes associated with syngnathid reproduction provide compelling evidence
that male incubation in these species is a highly specialized form of reproduction
akin to other forms of viviparity. Here, we review these recent advances,
highlighting similarities and differences between seahorse and mammalian
pregnancy. Understanding the changes associated with the parallel evolution of
male pregnancy in the two major syngnathid lineages will help to identify key
innovations that facilitated the development of this unique form of reproduction
and, through comparison with other forms of live bearing, may allow the
identification of a common set of characteristics shared by all viviparous
organisms.
20
CHAPTER I Male Pregnancy Review
Introduction
Pregnancy is defined as the gestational period lasting from the implantation
of a fertilized zygote to the release of developed embryos at parturition (Knobil and
Neill 1998). While viviparity has also been traditionally used to describe the
condition of giving birth to active free-living young (Wake 1992, Froese and Pauli
2006), some researchers have used more-stringent definitions of the term,
incorporating
internal
fertilization
and
development
within
the
maternal
reproductive system (Wourms and Lombardi 1992). The use of the term in this
way by definition excludes the possibility of male viviparity. Male internal
incubation can however be highly developed and may include complex
physiological and morphological adaptations for the protection and provisioning of
embryos during their development. Given parallels in the reproductive changes
associated with internal incubation of embryos in males and females, we use the
more inclusive definition of viviparity. For detailed definitions of the terms used
here, please refer to Table 1.
Although viviparity is found in all vertebrate groups except birds (Rothchild
2003), male viviparity is extremely rare. One of the few instances of male viviparity
is found in the amphibian genus Rhinoderma, where males incubate eggs in
modified vocal sacs after a period of extra-corporal development, providing
nutrients and respiratory care for larvae until metamorphosis is completed
(Goicoechea et al. 1986). In this group, fertilization is external and embryos
develop for more than 20 days outside the body until muscular activity by the
embryo triggers internalization by the male (Goicoechea et al. 1986).
An even more remarkable case of male viviparity can be found in
syngnathid fishes (seahorses and pipefish), a group of organisms in which males
incubate developing embryos in a specialized brooding patch or pouch on their
body surface (Kuiter 2000, Rothchild 2003). While syngnathid viviparity is clearly
an independently derived system, gestation in male seahorses and pipefish
requires a complex series of morphological and physiological modifications of
paternal tissues analogous to those found in viviparous females. In order to better
understand the key characteristics of pregnancy and the applicability of this term
to viviparous males, we first turn to the mammals, the group for which viviparity
has been most thoroughly studied.
21
CHAPTER I Male Pregnancy Review
Pregnancy in mammals: evolution and diversity
Despite the ubiquitous use of the term pregnancy in mammals, mammalian
reproduction is diverse and maternal investments of both time and energy vary
widely among species. Although the mammalian lineage is thought to date back
only about 210 million years (Pough et al. 1999), a diversity of reproductive modes
have been realized in this group. While basal lineages were most likely oviparous,
early Eutheria (higher placental mammals) and Metatheria (marsupials) both
possessed forms of viviparity (Pough et al. 1999). The extant therian group is at
least 145 million years old and contains more than 4400 species in 125 families
(Pough et al. 1999).
During the evolution of higher mammals, egg-yolk-producing vitellogenin
genes were lost and compensatory trophic structures evolved in maternal tissues
(Rothchild 2003). The placenta is the primary trophic structure of mammalian
pregnancy, a highly specialized organ that is derived from both maternal and fetal
tissues (Gude et al. 2004). Despite the relative recency of its evolution in therian
mammals, placental structure is more diverse than that of any other mammalian
organ (Stulc 1997). In the epitheliochorial placenta of artiodactyls, the trophoblast
is separated from the maternal blood supply by several layers of thelial cells while,
in the endotheliochorial placenta of carnivores, the trophoblast is only restricted
from the maternal blood supply by a single layer of maternal endothelium (Stulc
1997). One of the most-common types of placenta is the hemochorial placenta of
primates and rodents, in which maternal blood is in direct contact with the
embryonic chorion (Beck1976, Stulc 1997).
All therian mammals possess a placenta, but there are several major
differences between eutherian and metatherian reproduction, which may reflect
the independent evolution of viviparity in these two groups (Zeller 1999). Eutherian
gestation time is positively correlated with body size, and the lactation period is
usually shorter than the gestation time (Pough et al. 1999). In marsupials,
however, gestation is short, while lactation can be extended, and there is no
correlation between gestational duration and body size (Hayssen et al. 1985).
While a vestigial remnant of an oviparous ancestor remains in marsupials (eggshell membranes), these features have been lost in placental mammals (Pough et
al. 1999). Marsupial reproduction has been suggested to be an adaptation to
unstable arid environments, but there appears to be little evidence that
22
CHAPTER I Male Pregnancy Review
environments of ancestral eutherians and metatherians were categorically different
(Hayssen et al. 1985). Instead, recent work suggests that the short gestation/long
lactation of metatherians and the long gestation/short lactation of eutherians may
simply be alternate means of achieving the same reproductive outcome (Pough et
al. 1999).
Major differences in the form, complexity and duration of gestation in
mammals make it difficult to identify a set of defining characteristics for pregnancy
of use in other vertebrate groups (Rothchild 2003). Nonetheless, while the
particulars of mammalian pregnancy vary substantially among species, several
processes are common to all eutherians. Early stages of blastocyst growth during
eutherian pregnancy occur without a direct embryonic-maternal connection (Cross
et al. 1994). The implantation of the zygote occurs after trophoblast formation and
involves intensified cell proliferation around the blastocyst (Cross et al. 1994).
Following the formation of the primary placenta, placental growth continues during
pregnancy to meet the increasing requirements of the developing embryo
(Schneider 1996). The establishment of a fully functional placenta enables efficient
exchange of nutrients and waste products between fetal and maternal blood
supplies (Gude et al. 2004). The placenta also produces estrogen, progesterone
and growth hormone, endocrine compounds that promote physiological and
morphological changes in both the mother and the embryo (Gude et al. 2004). At
parturition, the connection between placenta and fetus is severed and placental
structures are expelled along with the fetus (Cross et al. 1994). Pregnancy in all
mammals is followed by an extended period of postparturition care to allow the
completion of juvenile development (Clutton-Brock 1994). Table 2 details
characteristics of the pregnancy process in the domestic mouse (Mus musculus),
a particularly valuable model species for the study of the hemochorial placenta
and human pregnancy. The reader is directed to several excellent reviews of
mammalian pregnancy for further details on the processes briefly outlined here
(Cross et al. 1994, Rothchild 2003, Gude et al. 2004).
While mammalian viviparity is highly complex, recent studies clearly
demonstrate that viviparity in non-eutherians can be equally elaborate (Rothchild
2003, Blackburn 2005). As mammalian viviparity is highly derived, comparative
studies in other vertebrate groups may provide insights into the morphological and
physiological changes associated with the evolution of viviparity. Although the
23
CHAPTER I Male Pregnancy Review
sequence of events leading to the evolution of viviparity is clearly different
between mammals, reptiles and fishes (Blackburn 2005), comparative approaches
across groups may allow the identification of common features of pregnancy
shared by all viviparous organisms (Blackburn 2005).
The evolution of viviparity: different pathways yield similar outcomes
The ancestor of all vertebrates was most likely oviparous (egg laying;
Pough et al. 1999) and viviparity is believed to have originated as many as 140
times in the vertebrate lineage (Crespi and Semeniuk 2004). Oviparity remains the
prominent mode of reproduction in all vertebrates with the exception of mammals,
and occurs in >85% of reptiles, >90% of amphibians, and 100% of birds (Dulvy
and Reynolds 1997, Pough et al. 1999). While viviparity has repeatedly evolved in
vertebrates, there are very few instances of subsequent reversals from viviparity to
oviparity (Reynolds et al. 2002). This may be due to the accelerated development
of viviparity after the evolution of egg retention and internal fertilization, which is
thought to be caused by intensified parent-offspring conflict for resources (Crespi
and Semeniuk 2004). Alternatively, the paucity of transitions from viviparity to
oviparity may simply reflect the relative recency of viviparity in comparison to the
ancestral mode of oviparous reproduction (Reynolds et al. 2002).
Viviparity has significant energetic costs for the mother and increases
predation reproductive risks, which may considerably reduce her total lifetime
output (Goodwin et al. 2002). Although viviparous organisms often have reduced
clutch size, fitness benefits associated with viviparity may be achieved via
increased offspring survival. Juvenile survival benefits are largely due to increased
size of viviparous offspring, which can be achieved via developmental
independence from environmental fluctuations in temperature and/or oxygen
supply, as well as reduced predation pressures for the embryo during its internal
development (Goodwin et al. 2002). In order to accommodate internally
developing offspring, viviparous organisms have evolved increased body size to
meet space and energy constraints (Goodwin et al. 2002).
Viviparity and oviparity are often presented as dichotomous modes of
reproduction, but it should not be forgotten that viviparity itself is a continuum from
incubation of yolk-rich eggs in the female (lecithotrophic viviparity) via yolk
supplementation to placental or placental-analogous structures (Reynolds et al.
24
CHAPTER I Male Pregnancy Review
2002). Although these three phases have characterized the evolution of viviparity
in all vertebrates, pregnancy has evolved along very different pathways in different
taxonomic groups. Phylogenetic reconstructions suggest that mammalian
pregnancy is derived from a group of oviparous ancestors who actively
supplemented eggs with nutrients during their development (a form of matrotrophic
oviparity), while egg retention and placentation simultaneously evolved during the
development of squamate viviparity (Blackburn 2006). Despite variation in the
processes involved in the evolution of viviparity in different groups, considerable
morphological and functional similarities can be found in highly derived forms. The
evolution of viviparity in fishes most closely fits the traditional model and viviparous
fishes appear to have evolved from oviparous ancestors via successive steps of
egg retention, eggshell reduction and placentation (Blackburn 2006).
Modes of reproduction in fishes
Fishes are a large and diverse group of vertebrates, including species of the
ray-finned
(Actinopterygii),
lobe-finned
(Sarcopterygii)
and
cartilaginous
(Chondrichthyes) fishes (Froese and Pauli 2006). With a total of approximately
30,000 described species (Froese and Pauli 2006), fish exhibit a wide variety of
reproductive modes ranging from simple broadcast spawning (a form of oviparity)
to advanced forms of viviparity (Breder and Rosen 1966).
Viviparity has been realized in as many as 54 fish families, and is thought to
have independently evolved from egg laying at least thirty times (Crespi and
Semeniuk 2004, Blackburn 2005). Thirteen of these origins have been identified in
actinopterygian fishes, including the independent origin of male viviparity in the
Syngnathidae (Crespi and Semeniuk 2004, Blackburn 2005). In sarcopterygians, a
single origin of viviparity has been inferred for the two coelacanth species, while
the six recognized lungfish species are egg laying (Froese and Pauly 2006). The
remaining 16 origins of viviparity in fishes occurred during the evolution of sharks,
rays and skates (chondrichthyans).
Oviparity is thought to be the ancestral reproductive mode of ray-finned
fishes and is found in about 97-98% of most species (Dulvy and Reynolds 1997).
As all actinopterygians lack a uterus, gestation in viviparous species occurs in
either the follicle or ovarian cavity (Schindler and Hamlett 1993). The highest
frequency of independent origins of viviparity among ray-finned fishes is found in
25
CHAPTER I Male Pregnancy Review
the Atherinomorpha, a large clade of 1500 fish species including the Beloniformes,
Cyprinodontiformes and Atheriniformes (Mank and Avise 2006). Four origins of
viviparity have been identified in atherinomorph fishes and have led to such
specialized reproductive strategies as sperm storage and superfetation, the
simultaneous development of multiple broods (Turner 1937, Wourms 1981). The
repeated origins of viviparity in the atherinomorphs has been attributed to the high
frequency of internal fertilization in this group (Mank and Avise 2006). As the
reproductive biology of many species of ray-finned fishes is still poorly studied,
further independent origins of viviparity may ultimately be inferred in this group
(Blackburn 2005).
Chondrichthyans are also considered ancestrally oviparous species, but
viviparity has evolved in between 40-55% of all extant forms (Wourms 1981, Dulvy
and Reynolds 1997). All chondrichthyan species have internal fertilization
(Blackburn 2005), and both aplacental and placental styles of embryo
supplementation have evolved in this group (Hamlett and Hysell 1998). Among
aplacental forms, embryos are supplied via the yolk sac or trophonemata,
alternatively feeding on siblings or nurse eggs. In higher placental forms,
additional nutrients are supplied to developing offspring upon depletion of yolk
stores. Viviparity in elasmobranchs involves osmoregulation, increased uterine
surface
areas
for
respiratory
and
metabolic
exchange,
and
intensified
vascularization of the uterine wall (Hamlett and Hysell 1998).
A set of reproductive modifications accompanies viviparity in fish: (a) a
decrease in egg number, (b) internal fertilization, (c) absorption of maternally
secreted nutrients through the yolk sac, and (d) a period of intracorporal gestation
varying in length until a large proportion of embryonic development is completed
(Wourms 1981). Gestation in fish includes changes in the fetal-maternal
relationships
in
developmental,
morphological,
trophic,
osmoregulatory,
respiratory, endocrinological and immunological systems (Wourms 1981, Wourms
and Lombardi 1992, Wourms 1994). Embryos are incubated in the ovarian cavity,
in the follicle, in specialized compartments such as the pouch of male seahorses,
or other internal structures (Schindler and Hamlett 1993, Dulvy and Reynolds
1997).
Various forms of embryonic nutrition have been identified in viviparous fish,
including strict lecithotrophy (yolk feeding), adelphophagy (sibling feeding),
26
CHAPTER I Male Pregnancy Review
oophagy (egg feeding) as well as maternal provisioning (Schindler and Hamlett
1993). The latter includes nourishment via a variety of placental analogs such as
trophonemata, epithelia (gill, epidermis, fin), trophotaeniae (hypertrophied
intestinal
projections),
branchial
or
yolk
sac
placenta
and
follicular
pseudoplacentas derived from maternal tissues (Wourms 1981). Due to major
differences in the level of maternal provisioning, fetal weight change during
development can vary substantially among species (Wourms 1981).
Although substantial variation in viviparous reproduction can be found in
fishes, male viviparity has evolved only once during the evolution of this group, in
seahorses and pipefishes (family Syngnathidae) (Crespi and Semeniuk 2004).
Despite the unique morphological and physiological challenges associated with
the evolution of male viviparity, recent studies of syngnathid fishes have
highlighted a diversity of different forms of live bearing in this group and identified
a range of complex specializations associated with the evolution of male
pregnancy (Herald 1959, Carcupino et al. 2002).
Male pregnancy in seahorses and pipefishes: new insights reveal a
complex phenomenon
Syngnathid fishes are a group of 232 species (Nelson 2006), that exhibit a
wide diversity of brooding types and structures varying in their complexity and
location on the male body (Wilson et al. 2001, Kuiter 2000). Two syngnathid
subfamilies are identified based on the relative position of the brood pouch:
abdominal brooders (Hippocampus) (Gastrophori) and tail brooders including the
seahorse (Urophori) (Fig. 1). Male brood pouches have independently increased in
complexity during the evolution of both lineages (Wilson et al. 2005). Seahorses
(with 33 recognized species; Foster and Vincent 2004) have the most-complex
pouch structure and also undergo the most significant physiological changes
during embryo incubation. Despite the general trend towards more complex
brooding structures in the evolution of syngnathids, considerable variability may
also exist among congeneric members of the same general pouch type (Ripley
and Foran 2006).
Although the fossil record for this group is incomplete, the oldest syngnathid
fossils date to approximately 50 million years (Benton 1993). Despite considerable
diversification in this group, there remain extant representatives of almost all major
27
CHAPTER I Male Pregnancy Review
pouch types, offering the possibility to use comparative methods to study pouch
evolution and diversification (Wilson et al. 2001, Wilson et al. 2003). In mammals,
while many different forms of incubation exist, it has been difficult to reconstruct
the process of evolution of pregnancy due to the relative paucity of transitory forms
(Rothchild 2003). Male pregnancy in syngnathid fishes evolved from a group with
a diversity of reproductive modes, ranging from free spawners (Pegasus spp.) to
species with female incubation (Solenostomus spp.) (Wilson and Orr, unpublished
data). While Solenostomus is closely related to syngnathid fishes, it is unlikely that
pelvic fin bearing in Solenostomus is homologous with syngnathid male parental
care due to fundamental differences in pouch morphology and function (Wetzel
and Wourms 1995).
In all species of syngnathid fishes, the female transfers her yolk-rich eggs
(Foster and Vincent 2004) to the male’s pouch, a brooding structure located below
the male’s gonopore, such that intra-pouch fertilization is achieved during egg
transfer (Watanabe et al. 2000, Van Look et al. 2007). Sperm cells are shed above
the pouch and enter the pouch lumen (Watanabe et al. 2000), so that sperm-egg
union in syngnathids occurs without the necessity of extended sperm movement
and/or lengthy zygotic migrations to the site of implantation. Polyspermia, a
potential problem for the oocyte during fertilization, is avoided in syngnathid fishes
by a massive reduction in sperm (as few as 150 sperm per testis in seahorses;
Van Look et al. 2007), the lowest sperm production of any fish species (Stockley et
al. 1997). While more basal syngnathids have been suggested to have a form of
external fertilization, testes of these species are also reduced (Kvarnemo and
Simmons 2004) and experimental work on one of these species (Nerophis
ophidion) has demonstrated that sperm activation requires the presence of ovarian
fluid (Ah-King et al. 2006), indicating that sperm must be released during egg
transfer. The evolution of reduced sperm number in syngnathid fishes has likely
occurred as consequence of reduced sperm competition in these species
(Stockley et al. 1997; see below).
Upon fertilization, syngnathid zygotes implant quickly (Boisseau 1969) and
cell differentiation occurs in brooding tissues as epithelial structures enclose the
embryos (Fig. 2b). Vascularization of the inner connective layers of the seahorse
male’s pouch increases considerably after implantation and even more so after the
eggs hatch (Laksanawimol et al. 2006) (Figs. 2d and 3). Changes in pouch
28
CHAPTER I Male Pregnancy Review
morphology during incubation (Figs. 2 and 3) clearly indicate that the role of the
seahorse pouch is far more than simple protection, and there is evidence for
osmoregulatory, aerative, nutritive and possible immunoprotective roles of the
male brood pouch (Leiner 1934, Linton and Soloff 1964, Carcupino et al. 2002,
Melamed et al. 2005, Dzyuba et al. 2006, Laksanawimol et al. 2006).
In marine seahorses and pipefish, the osmolality of pouch fluid changes
substantially during incubation, increasing from that of paternal blood at
fertilization to that of the surrounding marine environment later in development
(Leiner 1934, Linton and Soloff 1934). In estuarine species, osmolality of pouch
fluid remains similar to paternal blood, buffering developing embryos against
potentially major fluctuations in environmental salinity (Quast and Howe 1980,
Watanabe et al. 1999). Recent work has identified mitochondrial-rich cells (MRCs)
lining the brood pouch of several pipefish species (Watanabe et al. 1999,
Carcupino et al. 2002). MRCs are typically found in gill tissue of teleost fishes and
play an important role in adult osmoregulation, suggesting that they may play a
similar role in regulating osmolality of the pouch environment during incubation
(Watanabe et al. 1999, Carcupino et al. 2002). Although brood pouch osmolality is
also actively regulated during seahorse incubation (Leiner 1934, Linton and Soloff
1964), MRCs have not been identified in the seahorse brood pouch (Carcupino et
al. 2002), indicating that other mechanisms of ion transport must be responsible
for osmoregulation in these species.
While the pouch epithelium of pipefish species with rudimentary brooding
structures (ex: Nerophis spp., Fig. 1) is similar to normal skin tissue, fundamental
changes occur prior to and during incubation in species with more complex
pouches (Carcupino et al. 2002). In species with complex brooding structures,
brood pouch tissue is heavily vascularized throughout incubation (Fig. 2), a
morphological change which is believed to be important for gas exchange between
the developing embryo and the paternal blood supply (Carcupino et al. 2002).
Microridges lining the brood pouch surface of both seahorses and pipefishes (Fig.
3) increase the surface area across which diffusion of inorganic and organic
compounds can take place (Carcupino et al. 2002). While the eggs of most
syngnathid species are spherical, the oocytes of seahorses are pear-shaped, an
adaptation that further maximizes embryonic surface area for ionic and gas
29
CHAPTER I Male Pregnancy Review
exchange in the completely enclosed brood pouches of these species (Boisseau
1967).
The importance of patrotrophy during syngnathid incubation remains
unclear and, while the presence of considerable yolk indicates that much of the
energy required for embryonic development is maternally derived, various studies
have suggested active nutrient supplementation by the father during development
in both Hippocampus and Syngnathus (Boisseau 1967, Haresign and Shumway
1981). Seahorse brood pouch fluid is thought to be derived from paternal blood
serum and is extremely protein-rich at the time of fertilization (Boisseau 1967). The
seahorse brood pouch is also lined with modified secretory flame-cone cells (Fig.
3; Carcupino et al. 2002), which may play a role in digesting maternally derived
proteins into amino acids within the pouch (Boisseau 1967). As the embryonic
chorion is semi-permeable (Ripley and Foran 2006), diffusive transport of pouch
nutrients to developing embryos is likely possible, but evidence of a significant
paternal energetic contribution to seahorse embryos is equivocal. An experimental
approach used intraperitoneal injection of a radiolabelled amino acid to
demonstrate that pipefish embryos are capable of absorbing paternally derived
nutrients (Haresign and Shumway 1981). As active nutrient supplementation by
the parent is a defining character of the mostdeveloped forms of viviparity, the
clarification of the role of patrotrophy in syngnathid pregnancy is essential.
Recent genetic work indicates that C-type lectins (CTLs), a family of
proteins that exhibit antibacterial activity in vitro, are secreted in abundance by
brood pouch tissues during seahorse incubation (Melamed et al. 2005). High
levels of CTLs are present during early incubation and protein production
decreases through subsequent stages of development (Melamed et al. 2005),
suggesting that these compounds may play an important protective role prior to
the development of the innate immune system of the embryos themselves.
Determining whether these compounds are also produced in species with more
rudimentary brooding structures will help to clarify the timing of the development of
immune function in syngnathid incubation. The gestation time of syngnathid
embryos is tightly linked to the temperature of the external environment and
incubation times can range between 9 and 69 days depending on ambient
temperatures (Woods 2000, Foster and Vincent 2004). Once gestation is
completed at parturition, a pseudoplacenta may be expelled along with released
30
CHAPTER I Male Pregnancy Review
juveniles (Ripley and Foran 2006). The male’s pouch undergoes further
morphological changes as it reverts to its non-reproductive state (Laksanawimol et
al. 2006). After parturition, juvenile syngnathids are free-living and no further
parental care is provided.
Hormonal regulation strongly influences gestation in all viviparous species.
One of the key endocrine hormones involved in seahorse pregnancy is prolactin
(PRL). Over 300 separate functions of PRL have been identified in vertebrates,
more than that of all other pituitary hormones combined (Bole-Feysot et al. 1998).
In addition to its importance in osmoregulation, growth and immunoregulation,
PRL plays a critical role in parental behavior and increased expression of PRL is
associated with paternal care behavior in birds, mammals and fishes (Schradin
and Anzenberger 1999). In seahorses, interruption of PRL synthesis by
hypophysectomy leads to the disruption of brooding tissues and spontaneous
abortions during pregnancy (Boisseau 1967, Boisseau 1969). Natural growth and
development of embryos and maintenance of male brood pouch activity is
recovered in hypophysectomized seahorses by treatment with exogenous PRL
(Boisseau 1967). Interestingly, while the knockout of prolactin receptor (PRLR) in
female mice causes major reproductive defects, reproductive function of males is
only modestly affected by its disruption (Bachelot and Binart 2007). While the
normal function of the male’s brood pouch in hypophysectomized seahorses is not
rescued by estradiol (O) treatment, treatment with testosterone (T) at an early
stage of pregnancy recovers pouch function (Boisseau 1967), indicating that brood
pouch production is at least partially under testicular control. Similarly,
progesterone (PR) treatment of hypophysectomised seahorses fully rescues the
normal function of the brood pouch (Boisseau 1967). This result indicates that PRL
production is essential for the secretion of T and PR in seahorses. Exogenous PR
treatment also recovers natural embryonic development and implantation in
PRLR-deficient female mice (Binart et al. 2000). Investigations of other vertebrate
groups indicate that, while the major components of the hypothalamic- pituitarygonadal axis are present in both oviparous and viviparous species, major shifts in
the timing, duration and levels of hormone production are associated with the
evolution of viviparity (Callard et al. 1992). The highest levels of PR production in
oviparous species occur prior to ovulation, while PR production in viviparous
species occurs after ovulation is complete (Callard et al. 1992), a shift that is
31
CHAPTER I Male Pregnancy Review
thought to be critical for the development of egg retention and yolk loss in
viviparous species. Although efforts have been made to measure the levels of
circulating hormones during syngnathid incubation, the noninvasive determination
of hormone levels is difficult in these species due to the restricted amounts of
blood obtainable from each individual (Mayer et al. 1993). In spite of this limitation,
pooled plasma analyses of brooding and non-brooding pipefish species (genus
Syngnathus) indicate that levels of circulating androgens change during male
incubation, approaching those detected in female pipefish (Mayer et al. 1993).
While efforts were also made to measure circulating PR in this study, levels of this
hormone were below the detection limit of the radioactive immunoassay method
used. As a temporal shift in PR production is associated with the evolution of
viviparity in both elasmobranchs and reptiles, the quantification of fluctuations in
circulating PR during syngnathid pregnancy will be invaluable to determine
whether the evolution of viviparity in syngnathid males shows a similar pattern of
hormone production during pregnancy.
While the genetic study of syngnathid pregnancy is still in its infancy, three
recent studies have identified candidate genes that are differentially expressed in
the male seahorse or pipefish brood pouch during pregnancy (Zhang et al. 2003,
Melamed et al. 2005, Harlin-Cognato et al. 2006). Putative functions of candidate
genes involved in pregnancy include haematopoiesis, innate and acquired immune
system responses and osmoregulation as well as modifications in cytoskeletal
organization (cell proliferation, cell growth) and extracellular matrices (Zhang et al.
2003, Melamed et al. 2005). As many of these functions are also pivotal during
mammalian pregnancy (e.g. endometrical remodeling, lectin production and
hormonal fluctuations), it is tempting to speculate that at least some of these
structures and/or portions of the underlying genetic regulatory networks are
homologous (Abouheif 1999) in syngnathids and mammals. Such comparisons,
although compelling, await functional characterization of gene function during
syngnathid pregnancy.
Table 2 summarizes the major characteristics of male pregnancy in
syngnathid fishes. As morphological and physiological traits outlined here are
often derived from studies of single species, considerable variation of most traits
likely exists within the family, and it is premature to derive general conclusions for
this group. If we hope to gain a comprehensive understanding of the development
32
CHAPTER I Male Pregnancy Review
and diversification of male pregnancy in this group, future research must develop
particular model species that vary in their brooding structures, supplementing
detailed studies of target species with comparative work on other specialized
species in the family.
Outlook and suggestions for future research
There remains much to do in uncovering the genetic and phenotypic
changes that occur during seahorse reproduction, work that will undoubtedly lead
to new insights into the process of male pregnancy. At the same time, a greater
understanding of syngnathid reproduction will open the system for the study of
critical research questions in a diversity of disciplines (see below). Seahorses are
some of the few marine fish species that can be readily cultured under laboratory
conditions. With a short generation time (3-12 months), high fecundity for
viviparous species (50-2000 offspring per brood; Foster and Vincent 2004), and a
small haploid genome size (500-1000 Mb; Hardie and Hebert 2004), syngnathid
fishes offer a tractable model for the study of morphological, reproductive and
behavioral variation under controlled laboratory conditions.
Seahorses and pipefish as models for sexual selection
Syngnathid fishes are already important model organisms in the study of
the role of relative parental investment on the direction and intensity of sexual
selection (Berglund and Rosenqvist 2003, Wilson et al. 2003, Jones et al. 2005).
The bulk of traditional sexual selection theory has been derived from, and tested
on, species where females invest highly in reproduction and males contribute little
more than their gametes (Darwin 1871, Bateman 1948). Seahorses and pipefish
have offered an opportunity to test this theory in a system where males make a
substantial contribution to reproduction. True to the expectations of the parental
investment theory of sexual selection (Trivers 1972), the majority of syngnathid
fishes are sex-role reversed (i.e. females compete most intensely for access to
mates) (Vincent et al. 1992, Wilson et al. 2003). There are, however, several
exceptions to this rule, and research in this area seeks to determine the potential
explanations for these exceptions (Wilson and Martin-Smith, 2007), with an aim to
further refining a general theory of sexual selection.
33
CHAPTER I Male Pregnancy Review
Although research into pre-mating sexual selection is well established in
syngnathid fishes, the unique mode of reproduction in seahorses and pipefishes
raises the intriguing possibility that post-copulatory sexual selection also plays an
important role in this group. The study of sperm competition and cryptic female
choice in polyandrous animals is an active area of research. Many species mate
repeatedly and relatively indiscriminately (Arnqvist and Rowe 2005). As a single
copulation is often more than adequate for the fertilization of all eggs carried by a
female, researchers have long been puzzled as to why animals mate multiply,
when mating increases the risk of predation and reduces foraging time. Parker
(1970) was the first to recognize that sperm must compete with one another after
copulation to successfully fertilize each egg. Further research has found that this
phenomenon is relatively widespread and that cryptic female choice may play an
important role in selecting particular sperm for fertilization (Ward 2000, Arnqvist
and Rowe 2005).
As fertilization takes place internally in syngnathid fishes, seahorse and
pipefish males have complete confidence in paternity (Jones and Avise 2001,
Wilson and Martin-Smith 2007) and sperm competition among males is not
possible, a phenomenon that may explain the reduced testes size and sperm:egg
ratio (2.5:1) in these species (Kvarnemo and Simmons 2004, Van Look et al.
2007). Egg competition is, however, possible and mechanisms of selective
fertilization of eggs in polygynous syngnathids may offer males the ability to
cryptically choose which eggs to fertilize. As outlined in Table 2, up to 50%of eggs
transferred to a male’s pouch fail to develop to term (Ahnesjö 1996). While this
may simply be due to sperm-egg incompatibilities, it may also be the result of
selective fertilization. Pipefish embryos have a semi-permeable chorion (Ripley
and Foran 2006) and, as yolk-rich eggs are a rich energy source, unfertilized eggs
may be reabsorbed, either by the male himself, or by neighboring embryos, acting
as nuptial gifts and/or nurse eggs to maximize growth and thus survival of fertilized
embryos (Ahnesjö 1996).
Intrapouch position and its potential effect on embryo development
Intrauterine position (IUP) has long been recognized to play an important
role in the development of mammalian embryos (Ryan and Vandenbergh 2002).
Depending on the location of embryos in the uterus and their relative position to
34
CHAPTER I Male Pregnancy Review
one another, the availability of food, oxygen and essential minerals can vary
substantially (Ryan and Vandenbergh 2002). At the same time, embryos can
influence the development of their neighbors via amniotic transfer of hormones
and IUP has been shown to have a significant effect on morphology, physiology
and behavior of offspring of most litter-bearing mammals (Ryan and Vandenbergh
2002). Brood sizes of syngnathid fishes can reach up to 2000 embryos, creating
ample opportunity for hormonal communication and potentially antagonistic
interactions among developing embryos for optimal implantation sites. As
indicated above, pipefish embryos lack a rigid chorion (Ripley and Foran 2006),
and if this phenomenon is widespread in syngnathid fishes, hormonal
communication via the pouch fluid may play a critical role in the development of
morphology and physiology of seahorse and pipefish offspring. Despite
considerable efforts, research has yet to determine the mechanisms of sex
determination in syngnathid fishes. If sex is largely environmentally determined,
intrapouch hormone fluctuations and/or gradients may play a critical role in
determining offspring sex ratios.)
Conclusions
Mammalian pregnancy and seahorse reproduction exhibit compelling
morphological and functional similarities (Table 2), which are being further
illuminated by recent investigations of the genetic regulation of syngnathid
reproduction. Considering these parallels and the historic use of the term, it seems
logical to term syngnathid reproduction an evolving form of male pregnancy. All
syngnathid species exhibit lecithotrophic viviparity and the presence of specialized
trophic cells in the seahorse brood pouch (Carcupino et al. 2002) suggests an
even-more-significant paternal contribution to embryonic development in these
species.
Although we have a relatively comprehensive understanding of mammalian
pregnancy, our knowledge of syngnathid reproduction is still very basic by
comparison. As more researchers discover the syngnathid system and recognize
particularities relevant for their own research, experience gained in the study of
mammalian pregnancy is likely to inform research in this area and to suggest
unexpected and fruitful research directions. While the underlying physiological
processes of pregnancy in syngnathids and mammals are likely very different, the
35
CHAPTER I Male Pregnancy Review
fundamental questions and problems are similar and should be approached in
similar ways. With a greater understanding of the genetic, morphological and
physiological changes associated with male pregnancy in syngnathid fishes, this
system promises a unique comparative model for researchers working on other
forms of viviparity. Syngnathid pregnancy has evolved in males, an exceptional
development that provides the opportunity to explore how the diversification of this
system has been influenced and constrained by a male background. Two
morphologically distinct lineages of male pregnancy have evolved in parallel in the
Gastrophori and Urophori (Fig. 1). Are the genetic networks involved in syngnathid
pregnancy identical in these two lineages and similar to those operating in other
vertebrates? How does hormonal control of male pregnancy in syngnathids
compare to mammalian reproduction, and how ‘female’ does a male have to be to
become pregnant? Given large structural differences in brooding structures
between closely related syngnathid species, how do modes of incubation differ
and how have higherlevel structures evolved? With a clearer understanding of the
functional similarities and differences in pregnancy in viviparous organisms, the
answers to these questions will likely influence the way that we study pregnancy
and its evolution in the coming decades.
Acknowledgments
Many thanks to H. Greven (University of Düsseldorf) and J. Wetzel
(Presbyterian College) for constructive feedbackon the manuscript. Thanks to P.
Damrongphol (Mahidol University) for providing pouch section photographs and to
P. Brauchli for assistance in figure preparation.
36
CHAPTER I Male Pregnancy Review
References
Abouheif E. 1999. Establishing homology criteria for regulatory gene networks:
prospects and challenges. Novartis Found Symp 222:207- 221.
Ah-King M, Elofsson H, Kvarnemo C, Rosenqvist G, Berglund A. 2006. Why is
there no sperm competition in a pipefish with externally brooding males?
Insights from sperm activation and morphology. J Fish Biol 68:958-962.
Ahnesjö I. 1996. Apparent resource competition among embryos in the brood
pouch of a male pipefish. Behav Ecol Sociobiol 38:167-172.
Arnqvist G, Rowe L. 2005. Sexual conflict. Princeton, NJ: Princeton University
Press.
Azzarello MY. 1991. Some questions concerning the Syngnathidae brood pouch.
Bull Mar Sci 49:741-747.
Bachelot A, Binart N. 2007. Reproductive role of prolactin. Reproduction 133:361369.
Bateman AJ. 1948. Intra-sexual selection in Drosophila. Heredity 2:349- 368.
Beck F. 1976. Comparative placental morphology and function. Env Health Persp
18:5-12.
Benton MJ. 1993. The fossil record 2. London: Chapman & Hall.
Berglund A, Rosenqvist G, Svensson I. 1986. Reversed sex-roles and parental
energy investment in zygotes of two pipefish (Syngnathidae) species. Mar
Ecol Prog Ser 29:209-215.
Berglund A, Rosenqvist G. 2003. Sex role reversal in pipefish. Adv Stud Behav
32:131-167.
Binart N, Helloco C, Ormandy CJ, Barra J, Clement-Lacroix P, et al. 2000. Rescue
of preimplantatory egg development and embryo implantation in prolactin
receptor-deficient mice after progesterone administration. Endocrinology
141:2691-2697.
Blackburn DG. 2005. Amniote perspectives on the evolutionary origins of viviparity
and placentation. In: Uribe MC, Grier HJ, editors. Viviparous Fishes.
Homestead: New Life Publications. p 319- 340.
Blackburn DG. 2005. Evolutionary origins of viviparity in fishes. In: Uribe MC, Grier
HJ, editors. Viviparous Fishes. Homestead: New Life Publications. p 303317.
37
CHAPTER I Male Pregnancy Review
Blackburn DG. 2006. Squamate reptiles as model organisms for the evolution of
viviparity. Herpetol Monogr 131-146.
Boisseau JP. 1967. Les re´gulations hormonales de l’incubation chez un vertebré
mâle: Recherches sur la reproduction de l’hippocampe. Universite de
Bordeaux, 379 p.
Boisseau JP. 1969. Prolactin et l’incubation chez l’hippocampe. Compt Rend Acad
Sci Paris, Colloq Int 177:205-215.
Bole-Feysot C, Goffin V, Edery M, Binart N, Kelly PA. 1998. Prolactin (PRL) and
its receptor: Actions, signal transduction pathways and phenotypes
observed in PRL receptor knockout mice. Endocr Rev 19:225-268.
Breder CM, Rosen DE. 1966. Modes of reproduction in fishes. New York: Natural
History Press.
Callard IP, Fileti LA, Perez LE, Sorbera LA, Giannoukos G, et al. 1992. Role of the
corpus-luteum and progesterone in the evolution of vertebrate viviparity. Am
Zool 32:264-275.
Carcupino M, Baldacci A, Mazzini M, Franzoi P. 2002. Functional significance of
the male brood pouch in the reproductive strategies of pipefishes and
seahorses: a morphological and ultrastructural comparative study on three
anatomically different pouches. J Fish Biol 61:1465-1480.
Chan RS, Gargett CE. 2006. Identification of label-retaining cells in mouse
epithelium. Stem Cells 24:1529-1538.
Clutton-Brock TH. 1991. The evolution of parental care. Princeton, New Jersey:
Princeton University Press.
Crespi B, Semeniuk C. 2004. Parent-offspring conflict in the evolution of vertebrate
reproductive mode. Am Nat 163:635-653.
Cross JC, Werb Z, Fisher SJ. 1994. Implantation and the placenta: Key pieces of
the development puzzle. Science 266:1508-1518.
Darmani H, Al Hiyasat AS. 2005. The resin monomer triethylene glycol
dimethacrylate exhibits reproductive toxicity in male mice. Reprod Fertil Dev
17:401-406.
Darwin C. 1871. The descent of man, and selection in relation to sex. London,
England: J. Murray.
38
CHAPTER I Male Pregnancy Review
Dulvy NK, Reynolds JD. 1997. Evolutionary transitions among egg- Laying, livebearing and maternal inputs in sharks and rays. Proc R Soc B 264:13091315.
Dzyuba B, Van Look KJW, Cliffe A, Koldewey HJ, Holt WV. 2006. Effect of
parental age and associated size on fecundity, growth and survival in the
yellow seahorse Hippocampus kuda. J Exp Biol 209:3055- 3061.
Foster SJ, Vincent A. 2004. Life history and ecology of seahorses: implications for
conservation and management. J Fish Biol 65:1- 61.
Froese R, Pauly D. 2006. FishBase. World Wide Web electronic publication
www.fishbase.org.
Goicoechea O, Garrido O, Jorquera B. 1986. Evidence for a trophic paternal-larval
relationship in the frog Rhinoderma darwinii. J Herpetology 20:168-178.
Goodwin NB, Dulvy NK, Reynolds JD. 2002. Life history correlates of the evolution
of live bearing in fishes. Phil Trans R Soc B 357:259- 267.
Gude NM, Roberts CT, Kalionis B, King RG. 2004. Growth and function of the
normal human placenta. Throm Res 114:397-407.
Haas O, Simpson GG. 1946. Analysis of some phylogenetic terms, with attempts
at redefinition. Proc Am Philosophical Soc 90:319-349.
Hamlett WC, Hysell MK. 1998. Uterine specializations in elasmobranchs. J Exp
Zool 282:438-459.
Hardie DC, Hebert PDN. 2004. Genome-size evolution in fishes. Can J Fish Aquat
Sci 61:1636-1646.
Haresign TW, Shumway SE. 1981. Permeability of the marsupium of the pipefish
Syngnathus fuscus to 14C-alpha amino isobutyric acid. Comp Biochem
Physiol 69a:603-604.
Harlin-Cognatio A, Hoffman EA, Jones AG. 2006. Gene cooption without
duplication during the evolution of a male-pregnancy gene in pipefish. Proc
Natl Acad Sci USA 103:19407-19412.
Hayssen V, Lacy RC, Parker PJ. 1985. Metatherian reproduction- Transitional or
transcending. Am Nat 126:617-632.
Herald ES. 1959. From pipefish to seahorse-a study of phylogenetic relationships.
Proc Cal Acad Sci 29:465-473.
39
CHAPTER I Male Pregnancy Review
Jones AG, Avise JC. 2001. Mating systems and sexual selection in male-pregnant
pipefishes and seahorses: Insights from microsatellite-based studies of
maternity. J Hered 92:150-158.
Jones AG, Rosenqvist G, Berglund A, Avise JC. 2005. The measurement of
sexual selection using Bateman’s principles: An experimental test in the
sex-role-reversed pipefish Syngnathus typhle. Integr Comp Biol 45:874884.
Knobil E, Neill JD, editors. 1998. Encyclopedia of reproduction. San Diego:
Academic Press.
Kornienko ES. 2001. Reproduction and development in some genera of pipefish
and seahorses of the Family Syngnathidae. Russ J Mar Biol 27: S15-S26.
Kuiter RH. 2000. Seahorses, pipefish and their relatives: Syngnathiformes.
Seaford, Australia: Zoonetics. 242 p.
Kvarnemo C, Simmons LW. 2004. Testes investment and spawning mode in
pipefishes and seahorses (Syngnathidae). Biol J Linn Soc 83: 369-376.
Laksanawimol P, Damrongphol P, Kruatrachue M. 2006. Alteration of the brood
pouch morphology during gestation of male seahorses, Hippocampus kuda.
Mar Freshw Res 57:497-502.
Leiner VM. 1934. Der osmotische Druck in den Bruttaschen der Syngnathiden.
Zool Anz 108:273-289.
Linton JR, Soloff BL. 1964. The physiology of the brood pouch of the male sea
horse Hippocampus erectus. Bull Mar Sci Gulf Carib 14:45- 61.
Linzer DIH, Fisher SJ. 1999. The placenta and the prolactin family of hormones:
Regulation of the physiology of pregnancy. Mol Endocrinol 13:837-840.
Mank JE, Avise JC. 2006. Supertree analyses of the roles of viviparity and habitat
in the evolution of atherinomorph fishes. J Evol Biol 19:734- 740.
Mayer I, Rosenqvist G, Borg B, Ahnesjö I, Berglund A, et al. 1993. Plasma levels
of sex steroids in three species of pipefish (Syngnathidae). Can J Zool
71:1903-1907.
Mclaren A, Michie D. 1956. Studies on the transfer of fertilized mouse eggs to
uterine foster-mothers. 1. Factors affecting the implantation and survival of
native and transferred eggs. J Exp Biol 33:394-416.
40
CHAPTER I Male Pregnancy Review
Melamed P, Xue Y, Poon JFD, Wu Q, Xie H, et al. 2005. The male seahorse
synthesizes and secretes a novel C-type lectin into the brood pouch during
early pregnancy. FEBS Letters 272:1221- 1235.
Nelson JS. 2006. Fishes of the World. Hoboken, New Jersey: John Wiley & Sons.
Norwitz ER, Schust DJ, Fisher SJ. 2001. Mechanisms of disease - Implantation
and the survival of early pregnancy. N Engl J Med 345: 1400-1408.
Parker GA. 1970. Sperm competition and its evolutionary consequences in
insects. Biol Rev Camb Philos Soc 45:525.
Peters H. 1970. Migration of gonocytes into mammalian gonad and their
differentiation. Phil Trans R Soc B 259:91-101.
Plusa B, Hadjantonakis A-K, Gray D, Piotrowska-Nitsche K, Jedrusik A, et al.
2005. The first cleavage of the mouse zygote predicts the blastocyst axis.
Nature 434:391-395.
Poortenaar CW, Woods CMC, James PJ, Giambartolomei FM, Lokman PM. 2004.
Reproductive biology of female big-bellied seahorses. J Fish Biol 64:717725.
Pough FH, Janis CM, Heiser JB. 1999. Vertebrate Life. Upper Saddle River, New
Jersey: Simon & Schuster.
Quast WD, Howe NR. 1980. The osmotic role of the brood pouch in the pipefish
Syngnathus scovelli. Comp Biochem Physiol A 67:675- 678.
Reynolds JD, Goodwin NB, Freckleton RP. 2002. Evolutionary transitions in
parental care and live bearing in vertebrates. Phil Trans R Soc B 357:269281.
Rinkenberger J, Werb Z. 2000. The labyrinthine placenta. Nat Gen 25: 248-250.
Ripley JL, Foran CM. 2006. Differential parental nutrient allocation in two
congeneric pipefish species (Syngnathidae: Syngnathus spp.). J Exp Biol
209:1112-1121.
Rothchild I. 2003. The yolkless egg and the evolution of eutherian viviparity. Biol
Reprod 68:337-357.
Ryan BC, Vandenbergh JG. 2002. Intrauterine position effects. Neurosci Biobehav
Rev 26:665-678.
Schindler JF, Hamlett WC. 1993. Maternal-embryonic relations in viviparous
teleosts. J Exp Zool 168:378-393.
41
CHAPTER I Male Pregnancy Review
Schneider H. 1996. Ontogenic changes in the nutritive function of the placenta.
Placenta 17:15-26.
Schradin C, Anzenberger G. 1999. Prolactin, the hormone of paternity. News
Physiol Sci 14:223-231.
Soares MJ, Alam SMK, Konno T, Ho-Chen JK, Ain R. 2006. The prolactin family
and pregnancy-dependent adaptations. Anim Sci J 77: 1-9.
Stockley P, Gage MJG, Parker GA, Moller AP. 1997. Sperm competition in fishes:
The evolution of testis size and ejaculate characteristics. Am Nat 149:933954.
Stulc J. 1997. Placental transfer of inorganic ions and water. Physiol Rev 77:805836.
Tang M, Xu Y, Julian J, Carson D, Tabibzadeh S. 2005. Lefty is expressed in
mouse endometrium in estrous cycle and peri-implantation period. Hum
Reprod 20:872-880.
Travis J. 1993. Immunology-Tracing the immune systems evolutionary history.
Science 261:164-165.
Trivers RL. 1972. Parental investment and sexual selection. In: Campbell B, editor.
Sexual selection and the descent of man. London, England: Heinemann. p
136-179.
Turner CL. 1937. Reproductive cycles and superfetation in poeciliid fishes. Biol
Bull 72:145-164.
Van Look KJW, Dzyuba B, Cliffe A, Koldewey HJ, Holt WV. 2007. Dimorphic
sperm and the unlikely route to fertilisation in the yellow seahorse. J Exp
Biol 210:432-437.
Vincent A, Ahnesjö I, Berglund A, Rosenqvist G. 1992. Pipefishes and seahorses:
Are they all sex role reversed? Trends Ecol Evol 7:237-241.
Wake MH. 1992. Evolutionary scenarios, homology and convergence of structural
specializations for vertebrate viviparity. Am Zool 32:256-263.
Walker VR, Korach KS. 2004. Estrogen receptor knockout mice as a model for
endocrine research. ILAR Journal 45:455-461.
Wang MW, Heap RB, Taussig MJ. 1989. Blocking of pregnancy in mice by
immunization
with
anti-idiotype
directed
against
monoclonal
anti-
progesterone antibody. Proc Natl Acad Sci USA 86:7098- 7102.
42
CHAPTER I Male Pregnancy Review
Ward PI. 2000. Cryptic female choice in the yellow dung fly Scathophaga
stercoraria (L.). Evolution 54:1680-1686.
Warner CM, Exley GE, McElhinny AS, Tang CY. 1998. Genetic regulation of
preimplantation mouse embryo survival. J Exp Zool 282:272-279.
Wassarman PM, Jovine L, Litscher ES. 2001. A profile of fertilization in mammals.
Nat Cell Biol 3:E59-E64.
Watanabe S, Hara M, Watanabe K. 2000. Male internal fertilization and
introsperm-like sperm of the seaweed pipefish (Syngnathus schlegeli). Zool
Sci (Tokyo) 17:759-767.
Watanabe S, Kaneko T, Watanabe K. 1999. Immunocytochemical detection of
mitochondria-rich cells in the brood pouch epithelium of the pipefish,
Syngnathus schlegeli: structural comparison with mitochondria- rich cells in
the gills and larval epidermis. Cell Tissue Res 295:141- 149.
Wetzel J, Wourms JP. 1995. Adaptations for reproduction and development in the
skin-brooding ghost pipefishes, Solenostomus. Env Biol Fish 44:363-384.
Wilson AB, Ahnesjö I, Vincent A, Meyer A. 2003. The dynamics of male brooding,
mating patterns, and sex roles in pipefishes and seahorses (Family
Syngnathidae). Evolution 57:1374-1386.
Wilson AB, Martin-Smith KM. 2007. Genetic monogamy despite social promiscuity
in the pot-bellied seahorse (Hippocampus abdominalis). Mol Ecol 16:23452352.
Wilson AB, Vincent A, Ahnesjö I, Meyer A. 2001. Male pregnancy in seahorses
and pipefishes (Family Syngnathidae): Rapid diversification of paternal
brood pouch morphology inferred from a molecular phylogeny. J Heredity
92:159-166.
Woods CMC. 2000. Preliminary observations on breeding and rearing the
seahorse Hippocampus abdominalis (Teleostei: Syngnathidae) in captivity.
NZ J Mar Freshwater Res 34:475-485.
Wourms JP, Lombardi J. 1992. Reflections on the evolution of piscine viviparity.
Am Zool 32:276-293.
Wourms JP. 1981. Viviparity: The maternal-fetal relationship in fishes. Am Zool
21:473-515.
Wourms JP. 1994. The challenges of piscine viviparity. Isr J Zool 40:551- 568.
43
CHAPTER I Male Pregnancy Review
Zeller U. 1999. Mammalian reproduction: Origin and evolutionary transformations.
Zool Anz 238:117-130.
Zhang N, Xu B, Mou C, Yang W, Wei J, et al. 2003. Molecular profile of the unique
species of traditional Chinese medicine, Chinese seahorse (Hippocampus
kuda Bleeker). FEBS Letters 550:124-134.
44
CHAPTER I Male Pregnancy Review
Table 1 Glossary
Term
Adelphophagy
Analogy
Definition
Embryonic cannibalism of siblings (Schindler and Hamlett 1993)
Identity of structure or function in different lineages due to convergent
evolution (Haas and Simpson 1946)
Blastocyst
Early bi-layered developmental stage during embryogenesis in which the
embryo consists of an some ectodermal component and an inner cell mass
enveloping a liquid filled cavity
Histotrophe
Uterine milk - Usually fluid supplemental nutritive substances supplied to the
embryosof matrotrophic fishes
Homology
Identity of structure or function resulting from common ancestry (Haas and
Simpson 1946)
Hypophysectomy
Ablation of the pituitary gland
Lecithotrophy
Provisioning of the developing embryo by yolk-derived nutrients during
development
Matrophagy
Provision of maternal nutrients other than yolk (Schindler and Hamlett 1993)
Matrotrophy
Direct embryonic provisioning by the mother
Oophagy
In utero feeding of embryos on eggs
Oviparity
A reproductive mode in which females lay unfertilized or undeveloped eggs
Patrotrophy
Direct embryonic provisioning by the father
Placenta
Ephemeral organ during gestation expelled at birth, responsible for filtration,
nutrient transfer and metabolic and endocrine processes and consisting of a
fetal and a parental component
Pseudoplacenta
Ephemeral organs of unknown tissue origin and/or function expelled at
parturition
Trophoblast
External cell layer of developing embryo responsible for implantation and the
formation of the placenta; functions include pregnancy hormone production,
fetal immune protection, increased maternal vascular blood flow and delivery
Trophonemata
Extensions from the uterine mucosa for nutrient delivery and respiration
Trophotaeniae
Perianal embryonic appendages for nutrient uptake and gas exchange
Viviparity
Live bearing - Extended embryonic development inside the parent
Standard definitions taken from Encyclopedia of Reproduction (Knobil and Neill 1998) unless
otherwise indicated.
45
CHAPTER I Male Pregnancy Review
Table 2 Comparison between characteristics of mammalian and syngnathid pregnancy. The domestic mouse (Mus
domesticus) is used here as the mammalian model.
Stage of Pregnancy
Mouse (Mammalian) Characteristic
Similar/
Different/
Unknown
(=/≠/?)
Syngnathid Characteristic
Egg production
Atresia of standing oocytes (Peters 1970, Rothchild 2003)
≠
Continuous egg production (Kornienko 2001, Poortenaar et al. 2004)
Fertilization
Sperm transfer from the male to the female (Wassarman
et al. 2001)
Internal fertilization in the oviduct (Wassarman et al.
2001)
<20 eggs fertilized per mating (Mclaren and Michie 1956)
6
6x10 sperm / testis (Darmani and Al Hiyasat 2005)
≠
=
≠
≠
≠
Egg transfer from female to male (Herald 1959)
Implantation
Morphological adaptation
Aeration
Ion Exchange
Embryonic nutrient supply
6 mg testes/g body weight (Darmani and Al Hiyasat 2005)
6-10 days post-fertilization (Nowritz et al. 2001)
Extensive endometrical remodeling during gestation
(Tang et al. 2005)
Embryonic-placental interface highly vascularized
(Rinkenberger and Werb 2000)
+
+
Passive exchange of Na and Cl / Active transport of K ,
2+
2+
Mg , Ca and Pi (Stulc 1997)
Small eggs with little or no yolk (80 m) (Rothchild 2003,
Plusa et al. 2005)
Matrotrophy: Energy supply via the placenta (Rothchild
2003)
Immune responses
=
Up to 2000 fertilized eggs per mating (Foster and Vincent 2004)
Highly reduced sperm number (as few as 150 sperm / testis;Watanabe et al. 2000,
Van Look et al. 2007)
1 mg testes/g body weight (Kvarnemo and Simmons 2004)
Immediate implantation in pouch epithelium after fertilization (Boisseau 1969)
Extensive alteration of the brood pouch inner tissue layers (Laksanawimol et al.
2006)
Internal surface of brood pouch highly vascularized (Carcupino et al. 2002)
=
Paternal osmoregulation of pouch salinity (Leiner 1934, Linton and Soloff 1964)
≠
Mitochondrial-rich cells which line the brood pouch in pipefish likely serve an
osmoregulatory role (Carcupino et al. 2002)
Large yolk-rich eggs (900-2000 m; Kornienko 2001, Foster and Vincent 2004)
≠
=
≠
=
?
?
=
Changes in innate and adaptive immune system (Travis
1993)
Intrapouch fertilization (Watanabe et al. 2000, Van Look et al. 2007)
Lecithotrophy: Embryos are almost exclusively dependent on yolk for nutrients
(Berglund et al. 1986, Azzarello 1991)
Semi-permeable chorion (Ripley and Foran 2006)
Minor paternal nutrient contributions likely (Boisseau 1967, Haresign and Shumway
1981, Azzarello 1991, Laksanawimol et al. 2006)
Putative trophic role of specialized secretory cells in seahorses (Carcupino et al.
2002)
Lectin production associated with antibacterial activity in vitro (Melamed et al.
2005)
46
CHAPTER I Male Pregnancy Review
Table 2 continued
Birth
=
Post-natal care
Via parturition, including explusion of placenta (Cross et
al. 1994)
followed by remodeling of epithelia (Chan and Gargett
2006)
Highly developed parental care (Clutton-Brock 1991)
≠
Expulsion of pseudoplacenta in pipefish with release of free-living juveniles
(Watanabe et al. 1999)
and/or embryo release and renewal of inner pouch epithelia (Laksanawimol et al.
2006)
No parental care (Foster and Vincent 2004)
Duration of pregnancy
20-21 days (Cross et al. 1994)
≠
Temperature-dependent (9-69 days; Woods 2000, Foster and Vincent 2004)
Embryo survival
15-50% mortality prior to implantation (Warner et al.
1998)
Increased circulating prolactin (PRL) during early
pregnancy (Linzer and Fisher 1999, Soares et al. 2006)
=
20-50% embryos inviable (Ahnesjö 1996)
=
PRL critical for pouch maintenance and embryo development (Boisseau 1967)
Progesterone (PR; Wang et al. 1989)
=
Exogenous PR treatment rescues brood pouch function in hypophysectomised
seahorses (Boisseau 1967)
Estrogen (ER; Walker and Korach, 2004)
≠
No fluctuation in circulating ER during incubation (Mayer et al. 1993)
Hormonal regulation
47
CHAPTER I Male Pregnancy Review
Figure 1 Phylogenetic relationships of syngnathid fishes
Phylogenetic relationships of syngnathid fishes (Wilson et al. 2001, Wilson et al.
2003). Pouch morphology is depicted by schematic pouch cross sections;
coloured triangles indicate increasing complexity. Phylogenetic analyses suggests
that independent increases in pouch complexity have occurred in both major
pouch lineages (Wilson et al. 2003). Morphological and molecular phylogenetic
analyses indicate that Solenostomus spp. are the closest living relatives of
syngnathid fishes (Wilson and Orr, unpublished data). Note: Only one genus per
pouch type is shown here. Gastrophori=Abdominal brooder; Urophori=tail brooder.
48
CHAPTER I Male Pregnancy Review
Figure 2 Morphological and histological changes during seahorse pregnancy
49
CHAPTER I Male Pregnancy Review
Major morphological and histological changes occur during seahorse pregnancy:
A: Cross-section of a seahorse brood pouch prior to incubation; B: Cross-section
of an incubating seahorse brood pouch; C: Haematoxylin/eosin (HE)-stained
section of a nonincubating male brood pouch; D: HE-stained section of incubating
male pouch. A folded inner epithelial layer and smooth outer epithelial layer cover
the brood-pouch tissues. Inner tissue layer, middle tissue layer with smooth
muscle fibres and outer tissue layer indicated; muscle fibres are likely involved in
the process of parturition (Laksanawimol et al. 2006). Note increased density of
large blood vessels around the embedded embryo during incubation. Images C &
D: Reproduced with permission from Marine and Freshwater Research 57:497502, Figure 1 (P Laksanawimol, P Damrongphol & M Kruatrachue).
50
CHAPTER I Male Pregnancy Review
Figure 3 Brood pouch cellular specialization and differentiation during male
pregnancy
Brood pouch cellular specialization and differentiation occurs during male
pregnancy of seahorses (Boisseau 1967, Carcupino et al. 2002, Laksanawimol et
al. 2006). Note stratification of the pseudo-columnar inner epithelium into a bilayered epithelium during incubation, accompanied with changes in inner layer
thickness and increased vascularisation of pouch tissue surrounding the embryo.
51
CHAPTER II Endlabelled cDNA-AFLPs
CHAPTER II: Cost-Effective Fluorescent Amplified
Fragment Length Polymorphism Analyses
Kai N. Stölting, Wolf U. Blankenhorn, and Anthony B. Wilson
For publication in: Molecular Ecology Resources
Abstract
Amplified fragment length polymorphisms (AFLP) are a widely used multipurpose DNA fingerprinting tool. The ability to size-separate fluorescently-labelled
AFLP fragments on an automated DNA sequencer has provided a means for highthroughput genome screening, an approach particularly useful in non-model
organisms. While the ‘per-band-generated’ costs for each AFLP marker are low,
fluorescently-labelled oligonucleotides remain costly. We present a cost-effective
method for fluorescently endlabelling AFLPs that should make this tool more
readily accessible for laboratories with reduced budgets. Standard fluorescent
AFLPs and its endlabelled alternatives are repeatable and produce similar
numbers of fragments, though, given the differences in the AFLP profiles
generated with the two methods, it is not recommended to combine data
generated using both approaches. For researchers commencing a new AFLP
project, the AFLP-endlabelling method outlined here is easy to implement, as it
does not require major changes to PCR protocols and should significantly reduce
the costs of AFLP experiments.
52
CHAPTER II Endlabelled cDNA-AFLPs
Background
Amplified fragment length polymorphism (AFLP) analyses are some of the
most widely used DNA fingerprinting techniques (Vos et al. 1995, Meudt et al.
2007). The AFLP method can be used on all types of double-stranded nucleic
acids, and has been used to rapidly fingerprint both genomic DNA (henceforth:
DNA) and complementary DNA produced from messenger-RNA (henceforth:
cDNA). The AFLP method involves the double-digestion of (c)DNA with two
restriction enzymes (typically: EcoRI and MseI). Digests are followed by two
rounds of preselective and selective PCR-amplification. Selective amplifications
use up to three selective base pairs to reduce the absolute number of fragments
screened per PCR. PCR products are then separated by size on a traditional
agarose or acrylamide gel apparatus. The length of size-separated fragments is
recorded, and the presence or absence of a fragment of a given size is compared
across samples. The use of high-throughput fluorescent sequencing machines
permits the rapid screening of large numbers of fragments in many samples, and
has now become standard for AFLPs.
AFLP analyses (Vos et al. 1995) are commonly used in population genetic
and parentage studies and have been used for phylogenetic inference and genetic
mapping in both model and non-model organisms (Meudt et al. 2007). AFLPs are
also a powerful tool for the identification of both candidate genes (Bachem et al.
1996, Stölting et al. 2009) and genomic markers (Terauchi et al. 1999). The nearly
3000 (as of December 2009, ISI Web of Knowledge search, using “AFLP” or
“amplified fragment length polymorphism” as topic) AFLP studies published since
the initial description of the method in 1995 highlight the impact this method has
had on population genomics. Given that AFLPs do not require previous knowledge
of the underlying DNA sequence, this method is particularly attractive for genomelevel studies of non-model organisms.
While the per-marker-generated costs of AFLP are relatively low, start-up
costs can be high, and a significant portion of the costs associated with highthroughput AFLP approaches is due to the need for individually fluorescentlylabelled oligonucleotides. These labelled oligonucleotides are required for the
automated detection of fragments generated by each combination of selective
primers, and a single probe can cost upwards of US$100 (Applied Biosystems).
For high throughput screens, the price of fluorescently-labelled selective
53
CHAPTER II Endlabelled cDNA-AFLPs
oligonucleotides (oligos) can constitute a large fraction of experimental costs.
Often, labelled oligonucleotides will be purchased for a single study and, as
fluorescently-labelled oligos are light-sensitive and deteriorate over time, a
substantial fraction of this financial investment is ultimately wasted. These costs
can be prohibitive in studies where the number of selective PCRs undertaken is
critical for the screening success. This is especially the case with cDNA-AFLP
screens, which require the execution of many selective PCRs per sample (Stölting
et al. 2009).
Despite these costs, high throughput AFLP analyses may still be costeffective when expenses are considered on a “per-marker” basis. One obvious
approach to minimize the costs of an AFLP experiment is to maximize the number
of fragments screened per PCR reaction. If this were feasible, the total number of
amplifications required could be greatly reduced. Considerably fewer fluorescentlylabelled AFLPs would be needed, and the overall costs of the screen could be
minimized. Gort and colleagues (2006) illustrated the potential problems
associated with this approach, demonstrating that high-throughput screening may
increase the risk of obtaining size-homoplasious DNA fragments with similar
electrophoretic motility. A decrease in the number of fragments screened per
reaction can significantly increase the quality of the screen (Gort et al. 2006).
There is thus a trade-off between data quantity and quality, negating the potential
benefits of screening large numbers of fragments in a single AFLP reaction.
Here, we provide a cost-effective alternative for large scale high-throughput
AFLP screening, adapting the microsatellite-endlabelling method of Schuelke
(2000) for fluorescently-labelled AFLPs. In brief, Schuelke’s M13-endlabelling
method uses a single fluorescently-labelled oligonucleotide containing a standard
M13 (-21) sequence. By including this M13 sequence at the 5’-end of one of the
two unlabelled selective PCR primers, standard PCR can incorporate the
fluorescent label. The use of a high annealing temperature during the first cycles
of a PCR reaction generates large numbers of unlabelled products with the
selective primers. After several cycles of product-specific PCR, the annealing
temperature is reduced, allowing the incorporation of the fluorescently-labelled
M13 probe into the complementary PCR product. Labelled PCR products can thus
be generated which are extended by the length of the fluorescent adaptor but are
otherwise homologous to those produced in a standard fluorescent PCR. In spite
54
CHAPTER II Endlabelled cDNA-AFLPs
of the frequent use of the M13 adaptor in microsatellite endlabelling, in silico PCR
software suggests that this adaptor sequence may not be ideally suited as PCR
primer (Kalendar et al. 2009). We designed two additional endlabelling alternatives
with improved base composition (Table 1). We term these additional endlabelled
alternatives ELA1 and ELA2 and test their function together with the M13 label in
vitro.
Our aims are here to apply the endlabelling technique to fluorescent AFLPs
and to provide a concise, easy-to-implement protocol for this method. We compare
endlabelled AFLP products to those generated by standard fluorescent methods
and test methods for improving the performance of endlabelled AFLP alternatives.
We also test whether data produced with standard and endlabelled AFLPs can be
directly combined. As one of the major advantages of fluorescently-labelled AFLPs
is the opportunity for automated scoring, we compare the relative performance of
endlabelled and standard AFLPs both with automated scoring and the more
traditional (and more time consuming) manual detection.
55
CHAPTER II Endlabelled cDNA-AFLPs
Results
Endlabelled and standard fluorescent AFLPs produce similar numbers of
fragments per reaction (205-219 fragments per reaction, Table 1). While the
internal repeatability of manually-scored standard AFLPs is high (>92%, Table 1),
the repeatability of manually-scored endlabelled AFLPs (ELA1 data shown here)
averages ~80% (Table 1). A direct comparison of the repeatability of standard and
endlabelled methods should be based on common fragments produced by both
methods. 148 homologous fragments could be identified for the AFLP reaction
carried out here, and the repeatability estimates for this reduced dataset are
similar to those reported for the full datasets (Table 1), indicating that the reduced
internal repeatability of endlabelled AFLPs is not due to spurious products
generated with this method. The internal repeatabilities of both endlabelled and
standard AFLPs are much lower when fragments are scored using the automated
fragment calling routines implemented in GENEMAPPER (Table 1). Standard
labelled AFLPs are ~76% repeatable when using automated scoring, while only
~70% of endlabelled AFLPs fragments can be reliably recovered.
We tested alternative endlabelling primers to evaluate which method
recovers the greatest number of fragments generated with standard AFLP (Table
2). 62 – 72% of the reference standard fragments can be recovered using
manually-scored endlabelling methods, values that reduce by ~6% when using
automated scoring (Table 2). Among the three fluorescently-endlabelled
alternatives, the ELA1 adaptor is best at recovering the reference standard
(148/205 bands recovered=72.2% recovery, Table 2). Considering that up to 45%
of the fragments generated in the reference standard are not recovered using
endlabelled primers, it is not advisable to combine data generated using standard
and endlabelled AFLP.
Purging of unreliable fragments can increase fragment recovery rates
(Table 2, compare lines A and B), especially when using automated scoring (up to
10% improvement over unpurged data, compare A and B, Table 2). In case of
manual scoring these unreliable fragments seem to have little effect on the overall
recovery of reference standard fragments and such a quality control does not
appear to be warranted when data are manually screened (Table 2). It is
noteworthy that manual scoring of standard AFLP data produces 178 fragments
which are 100% repeatable out of 205 fragments scored in total, substantially
56
CHAPTER II Endlabelled cDNA-AFLPs
more than the 79 out of 212 fragments which are repeatable when automatic
scoring routines are used. When all unreliable fragments are removed from
analyses, the recovery rate of automatic scoring is similar to that of the manual
scoring method (compare purged data B, Table 2, average recovery across
endlabelling methods = 68%, manual=67%).
57
CHAPTER II Endlabelled cDNA-AFLPs
Discussion and Conclusions
We
have
implemented
Schuelke’s
(2000)
method
of
fluorescent
endlabelling for AFLP data. Endlabelled AFLPs offer a cost-effective means for
fluorescently scoring AFLPs, and only minor changes are required to existing
AFLP protocols. While the endlabelling method is less repeatable than standard
AFLP when data are manually scored, the repeatabilities of endlabelled and
traditional fluorescent AFLPs are comparable when using automated scoring
(Table 1).
We have tested several alternative adaptor sequences for endlabelled
AFLPs which vary in their predicted quality. In contrast to our expectations, primer
quality does not explain differences in the performance of these endlabelled
methods. Major differences in the repeatabilities of manually-scored endlabelled
and standard AFLP fragments remain observable, as well as differences in the
lengths and numbers of fragments produced, differences that argue against the
combination of endlabelling and traditional fluorescent AFLP data in the same
study.
While time-consuming, the manual scoring of fluorescently-labelled AFLP
products far outperforms the automated scoring methods implemented in standard
software. The performance of automated scoring can be improved by excluding
unreliable products, but the determination of product reliability is only possible
after extensive screening of replicated PCR reactions. As this screening largely
negates the time benefits obtained by automated screening, it is recommended to
manually screen AFLP products whenever the reliability of individual products is
critical, and particularly in small scale projects. This is particularly important in
genetic mapping projects and for experiments in which cDNA-AFLP screening is
used to detect differences in the expression of individual genes. In such cases,
individual errors can compromise a wider analysis and the time required for
manual scoring is justified by its higher repeatability. When conducting large scale
screens requiring the AFLP-profiling of many individuals, an initial repeatability
screen for each AFLP primer combination can help to increase the quality of the
data by providing a means to remove poorly performing AFLP markers from
subsequent analyses, a step that can also be used to develop more stringent
parameters for automated AFLP scoring, which can improve the reliability of this
method (Holland et al. 2008).
58
CHAPTER II Endlabelled cDNA-AFLPs
Methods
Sampling
We compared the performance of endlabelled and standard fluorescent
AFLPs using genomic DNA of eight individual seahorses (Hippocampus
abdominalis). We used the same eight individuals throughout our analyses to
allow for direct comparisons, and each sample was replicated six times to allow for
a robust test of repeatability. We generated AFLP fragments with a single selective
primer combination – EcoRI-ACA and MseI-CAA – and compared both manual
and automated fragment scoring with standard fluorescent AFLPs and its
endlabelled AFLP alternatives.
Laboratory protocols
Only minor modifications to the standard fluorescent AFLP protocols are
necessary when using our endlabelling approach. Both methods generate
fragments from as little as 100ng double-stranded DNA digested with 10 units of
restriction enzymes EcoRI (G^AATTC) and MseI (T^TAA; New England Biolabs
[NEB], Ipswich, MA, USA) each at 37°C for 2 hours. The double-digest is
performed in 1x of the EcoRI-buffer and 1x BSA and is followed by 15 minute
enzyme-inactivation at 65°C.
Ligation reactions in 20µL final reaction volume combine 50 pMol MseI- and
5 pMol EcoRI-adaptors (final concentrations of 2.5µMol and 0.25µMol,
respectively, Table 3) with sticky DNA ends at 37°C for 3 hours using one unit of
T4 DNA ligase (NEB) in 1x ligation buffer (NEB). The difference in the relative
concentration of adaptors is motivated by the super-abundance of MseI–restriction
sites compared to those produced by EcoRI. The ligation of adaptors is followed
by preselective amplifications performed in 20µL reaction volumes. These
preselective amplifications contain 1M betaine (Sigma, St. Louis, MO, USA),
0.25mM dNTPs (Roche Diagnostics, Mannheim, Germany), 0.5µM of each EcoRI
and MseI preselective primers (Table 3) and 1 U of Taq polymerase (NEB) in 1x
Taq-reaction buffer (NEB). The mixture is cycled in a Tetrad DNA Engine 2
thermal cycler (BioRad, Hercules, CA, USA) limited to a maximum ramping speed
59
CHAPTER II Endlabelled cDNA-AFLPs
of 1°C per second. The protocol consists of 20 PCR cycles at 94°C for 30sec,
56°C for 60 seconds and 72°C for 60 seconds.
Selective amplification reactions in 5µL total reaction volume provide
sufficient amounts of AFLP products for fluorescent sequencing and contain
0.25mM dNTPs, 4.625mM MgCl2 (Sigma, St. Louis, MO, USA), 1x Taq reaction
buffer (NEB) and 1 U Taq (NEB). While final concentrations of 0.5µM of both
fluorescently-labelled EcoRI- and unlabelled MseI-selective primers are used in
standard AFLP reactions, the endlabelled alternatives contain only 0.125µM of the
5’-tailed unlabelled selective EcoRI primer. The DNA sequence of these unlabelled
selective EcoRI primers consists of the standard EcoRI-primer sequence and a 5’tailing sequence (Table 3). For the endlabelled reactions the selective PCR also
contains 0.5µM of the universal labelled oligonucleotide. Here, we test three
alternative oligos which differ slightly in their nucleotide composition and in their
overall primer quality scores (M13 = 85, ELA1 = 88, ELA2 = 93, predicted by
FASTPCR; Kalendar et al. 2009). OneµL of 1:10 diluted preselective PCR product
is used in the selective amplification reactions. Selective amplification temperature
profiles are identical for both standard and endlabelled AFLPs. An initial
denaturing step separates DNA strands for 2 min at 94°C and is followed by 10
touchdown PCR cycles run at 94°C for 30 seconds, 65°C for 30 seconds
(decreasing by 1°C per cycle) and 72°C for 60 seconds. This touchdown is
followed by 30 additional PCR cycles which are run at a constant 56°C annealing
temperature. All other parameters for these 30 PCR cycles are identical to the
touchdown steps stated above. Fragment completion is achieved via a 30 minute
final elongation step at 72°C.
After amplification, 1µL of the undiluted selective PCR product is mixed with
0.125µL Genescan-500 LIZ Size Standard (Applied Biosystems, Warrington, UK)
in a mixture of 10µL formamide (Sigma, St. Louis, MO, USA) and 10µL MilliQwater for size detection on a 48-capillary automated ABi 3730 sequencer (Applied
Biosystems, Warrington, UK).
Fragment Analyses
Automated fragment analysis used the manufacturer’s default settings for
AFLP projects as implemented in GENEMAPPER 4.0 (Applied Biosystems), while
manual scoring was performed on hardcopies of electropherograms generated by
60
CHAPTER II Endlabelled cDNA-AFLPs
GENEMAPPER. While automated fragment scoring in GENEMAPPER is fast, this
method can be susceptible to peak-detection errors (Holland et al. 2008). These
errors occur during the fragment calling step, in which the shape of each peak in
the electropherogram as well as the absolute strength of its signal are considered
by the calling algorithm. We compared the repeatability of the endlabelling AFLP
alternative and the standard fluorescent AFLP genotyping using a measure of
repeatability calculated from between and within group variances provided by
ARLEQUIN 3.11 (Schneider et al. 2000) for each dataset according to the
recommendations of Becker (1992). In addition, the average number of pair-wise
fragment differences between samples was recorded.
Manual and automated scoring procedures are not necessarily calling
identical fragments, and the two datasets may differ substantially in the number
and length of fragments scored. To facilitate the direct comparison of these two
analysis methods, we analyzed internal repeatabilities independently for each
method, and also generated a dataset of homologous fragments present in both
methods, which was used to calculate repeatabilities across methods for this
subset of the data.
The ligation of the fluorescent endlabel elongates AFLP fragments by the
sequence length of the adaptor (Table 3), and this length difference must be taken
into account when homologizing fragments by size. Throughout all analyses
reported here we analyzed fragments in the range of 100-450bp length (standard
AFLPs) and their size-homologous counterparts in the endlabelled AFLP variants.
Endlabelled AFLP fragments are 18-20bp longer than standard AFLP fragments
(Table 3), and for the endlabelled alternatives this elongation results in an
analyzed size range of 118-468bp length (ELA1) and 120-470bp length (ELA2).
In comparing fragment sets generated with the traditional fluorescent AFLP
method to those generated with its endlabelling alternatives, all fragments are
treated as being equally informative and of comparable quality. However, in
standard AFLPs some fragments are less repeatable than are others and these
unreliable fragments might be expected to contribute disproportionately to the
observed differences between endlabelled and traditional AFLP methods. In order
to avoid a negative bias in our comparisons, the reference standard dataset was
checked for these potentially ambiguous bands. We compared the overall, unpurged dataset (see A in Table 2), with a dataset from which all bands with less
61
CHAPTER II Endlabelled cDNA-AFLPs
than 100% internal repeatability were removed (B). If all these highly repeatable
AFLP products were recovered with both standard and end-labelled AFLP
screens, it would be possible to combine data from these two methods. To
evaluate which of the endlabelling oligos tested here performs better under the
conditions used for the amplification of standard AFLPs, we compared the rates
with which reference standard fragments are recovered in endlabelled AFLPs.
Acknowledgements
Constructive comments from Luc F. Bussière improved the MS. Financial
support from the Forschungskredit der Universität Zürich to KNS is and from the
University of Zurich to ABW and WUB is gratefully acknowledged.
62
CHAPTER II Endlabelled cDNA-AFLPs
References:
Bachem CWB, van der Hoeven RS, de Bruijn SM, Vreugdenhil D, Zabeau M,
Visser RGF. 1996. Visualization of differential gene expression using a
novel method of RNA fingerprinting based on AFLP: Analysis of gene
expression during potato tuber development. Plant Journal 9:745-753.
Becker WA. 1992. Manual of quantitative genetics. Pullman, WA. Students Book
Corporation.
Gort G, Koopman WJM, Stein A. 2006. Fragment length distributions and collision
probabilities for AFLP markers. Biometrics 62:1107-1115.
Holland BR, Clarke AC, Meudt HM 2008: Optimizing automated AFLP scoring
parameters to improve phylogenetic resolution. Systematic Biology 57:347366.
Kalendar R, Lee D, Schulman AH. 2009. FastPCR Software for PCR Primer and
Probe Design and Repeat Search. Genes, Genomes and Genomics. 3.
Meudt HM, Clarke AC. 2007. Almost forgotten or latest practice? AFLP
applications, analyses and advances. Trends in Plant Science 12:106-117.
Schneider S, Roessli D, Excoffier L. Arlequin 2000. A software for population
genetics data analysis. Ver 2.000. Genetics and Biometry Lab, Dept. of
Anthropology, University of Geneva.
Schuelke M 2000. An economic method for the fluorescent labeling of PCR
fragments. Nature Biotechnology 18:233-234.
Stölting KN, Gort G, Wüst C, Wilson AB 2009. Eukaryotic transcriptomics in silico:
Optimizing cDNA-AFLP efficiency. BMC Genomics 10:565.
Terauchi R, Kahl G 1999. Mapping of the Dioscorea tokoro genome: AFLP
markers linked to sex. Genome 42:752-762.
Vos P, Hogers R, Bleeker M, Reijans M, Vandelee T, Hornes M, Frijters A, Pot J,
Peleman J, Kuiper M, Zabeau M 1995. AFLP - A new technique for DNAfingerprinting. Nucleic Acids Research 23:4407-4414.
63
CHAPTER II Endlabelled cDNA-AFLPs
Table 1 Comparison of the repeatability of manual and automated scoring
Comparison of the repeatability of manual (man) and automated (auto) scoring of
AFLP fragments derived from a single selective primer combination (EcoRI-ACA
and MseI-CAA) using two methods of fluorescent labelling (standard AFLP,
ELA1). Repeatability estimates have been derived from six replicate runs of 8
Hippocampus abdominalis individuals and reflect intra-individual repeatability of
AFLP fragments. Results are presented for the total dataset (complete) as well as
the subset of fragments that were recovered with standard and endlabelled AFLP
(matching). The total number of scorable fragments (N (Frag.)), the number of
variable fragments (Variable frag.), the number of fragments which are repeatable
in all individuals (100% rep. frag.) and the average number of pair-wise fragment
differences (Avg diff) is reported for each method. An asterisks indicates datasets
which are used as reference in the estimation of recovery success of endlabelled
AFLP methods (Table 2). Repeatability estimates are indicated together with
approximate standard errors (SE) sensu Becker (1992).
Method
Dataset
Scoring
Method
N
(Frag.)
Variable
frag.
100%
rep. frag.
Avg diff
Repeatability ± 1SE
Standard
AFLP
Complete
Man
205*
27
178*
1.758
94.57%
(91.53%-97.61%)
Standard
AFLP
Matching
manually-scored
ELA1
Man
148
21
127
1.483
92.15%
(87.85%-96.45%)
Standard
AFLP
Complete
Auto
212*
133
79*
13.175
75.89%
(64.61%-87.17%)
Standard
AFLP
Matching
automaticallyscored ELA1
Auto
144
87
57
8.725
76.28%
(65.14%-87.42%)
ELA1
Complete
Man
219
57
162
4.992
80.04%
(70.29%-89.79%)
ELA1
Matching
manually-scored
standard AFLP
Man
148
30
118
2.433
81.70%
(72.62%-90.78%)
ELA1
Complete
Auto
213
151
62
16.842
69.72%
(56.46%-82.98%)
ELA1
Matching
automaticallyscored standard
AFLP
Auto
144
90
54
10.55
69.90%
(56.7%-83.1%)
64
CHAPTER II Endlabelled cDNA-AFLPs
Table 2 Recovery success of standard AFLP fragments
The absolute number and fraction of fragments generated by traditional AFLPs
that are also recovered using endlabelled fluorescent AFLP alternatives.
Endlabelled AFLP alternatives have been compared to reference standard
fragments generated with traditional fluorescent AFLP using EcoRI-ACA and
MseI-CAA (Std.). Recovery success is reported for three endlabelled AFLP
alternatives (M13, ELA2, ELA1) tested on eight Hippocampus abdominalis
individuals. Here, A) reports the comparison for the complete dataset of fragments
generated by standard AFLPs, while the dataset reported in B) includes only those
fragments which are 100% repeatable in all six replicates of 8 individuals using the
standard methods. For each comparison, the absolute number of fragments
recovered and the recovery rate of reference standard fragments (Std.) are
indicated. The best-performing method for each comparison is highlighted in bold.
Dataset
Manual scoring
Std.
A
205
B
178
Automated scoring
M13
ELA1
ELA2
141
68.78%
122
68.54%
148
72.20%
127
71.35%
127
61.95%
111
62.36%
Std.
212
79
M13
ELA1
ELA2
133
62.74%
57
72.15%
144
67.92%
57
72.15%
118
55.66%
48
60.76%
65
CHAPTER II Endlabelled cDNA-AFLPs
Table 3 Required oligonucleotides for standard and endlabelled AFLPs
PCR primers (Primer) used for standard (Std) and endlabelled (End) AFLP
applications. Base pair sequences (Sequence) are indicated in the 5’ to 3’
orientation, as are the lengths of oligonucleotides in base pairs (length) and the
estimated
annealing
temperatures
(TM).
The
typically
used
per-reaction
concentrations each oligonucleotide are indicated (Conc.). Note that EcoRI and
MseI adaptors I and II must be combined before use (see protocol). Ns indicated
in primer sequences should be replaced by selective base pairs.
Primer
Sequence (5' -3')
Length
TM
Application
Conc.
EcoRI-Adaptor I
CTCGTAGACTGCGTACC
17
51.4°C
Std, End
EcoRI-Adaptor II
AATTGGTACGCAGTCTAC
18
49.0°C
Std, End
MseI-Adaptor I
GACGATGAGTCCTGAG
16
48.1°C
Std, End
MseI-Adaptor II
TACTCAGGACTCAT
14
39.8°C
Std, End
EcoRI-PS
GACTGCGTACCAATTCA
17
49.2°C
Std, End
0.5 µMol
MseI-PC
GATGAGTCCTGAGTAAC
17
47.1°C
Std, End
0.5 µMol
EcoRI-Sel
GACTGCGTACCAATTCANN
19
51.8°C
Std
0.5 µMol
MseI-Sel
GATGAGTCCTGAGTAACNN
19
49.8°C
Std, End
0.5 µMol
M13
TGTAAAACGACGGCCAGT
18
53.9°C
End
0.5 µMol
ELA1
GACCAAGTCCAGAAGACC
18
52.2°C
End
0.5 µMol
ELA2
GACGTTGTAAAACGACGGCC
20
56.8°C
End
0.5 µMol
37
66.5°C
End
0.125 µMol
37
66.5°C
End
0.125 µMol
39
67.8°C
End
0.125 µMol
0.25 µMol
2.5 µMol
EcoRI-M13 Sel
EcoRI-ELA1 Sel
EcoRI-ELA2 Sel
TGTAAAACGACGGCCAGTGACTGCGTACCAATTCANN
GACCAAGTCCAGAAGACCGACTGCGTACCAATTCANN
GACGTTGTAAAACGACGGCCGACTGCGTACCAATTCANN
66
CHAPTER II Endlabelled cDNA-AFLPs
Figure 1 Comparison of traditional and endlabelled fluorescent AFLP
Electropherograms of traditional fluorescently-labelled AFLP (Standard AFLP,
top) and the endlabelled AFLP alternatives M13, ELA1 and ELA2. This figure
depicts partial, 22 base pair long electropherograms from the same Hippocampus
abdominalis individual. Note: Electropherograms have been offset to incorporate
increases in the size of endlabelled AFLP products (M13:18bp, ELA1: 18bp,
ELA2:20bp).
67
CHAPTER III Eukaryotic transcriptomics in silico
CHAPTER
III:
Eukaryotic
Transcriptomics
in
silico:
Optimizing cDNA-AFLP Efficiency
Kai N Stölting, Gerrit Gort, Christian Wüst and Anthony B Wilson
Published in: BMC Genomics 2009, 10, 565
Abstract
Background:
Complementary-DNA
based
amplified
fragment
length
polymorphism (cDNA-AFLP) is a commonly used tool for assessing the genetic
regulation of traits through the correlation of trait expression with cDNA expression
profiles. In spite of the frequent application of this method, studies on the
optimization of the cDNA-AFLP assay design are rare and have typically been
taxonomically restricted. Here, we model cDNA-AFLPs on all 92 eukaryotic
species for which cDNA pools are currently available, using all combinations of
eight restriction enzymes standard in cDNA-AFLP screens.
Results: In silco simulations reveal that cDNA pool coverage is largely determined
by the choice of individual restriction enzymes and that, through the choice of
optimal enzyme combinations, coverage can be increased from <40% to 75%
without changing the underlying experimental design. We find evidence of
phylogenetic signal in the coverage data, which is largely mediated by organismal
GC content. There is nonetheless a high degree of consistency in cDNA pool
coverage for particular enzyme combinations, indicating that our recommendations
should be applicable to most eukaryotic systems. We also explore the relationship
between the average observed fragment number per selective AFLP-PCR reaction
and the size of the underlying cDNA pool, and show how AFLP experiments can
be used to estimate the number of genes expressed in a target tissue.
Conclusion: The insights gained from in silico screening of cDNA-AFLPs from a
broad sampling of eukaryotes provide a set of guidelines that should help to
substantially increase the efficiency of future cDNA-AFLP experiments in
eukaryotes. In silico simulations also suggest a novel use of cDNA-AFLP screens
to determine the number of transcripts expressed in a target tissue, an application
that should be invaluable as next-generation sequencing technologies are adapted
for differential display.
68
CHAPTER III Eukaryotic transcriptomics in silico
Background
Researchers interested in studying the genetic regulation of particular processes
or traits must first identify the genes contributing to the phenotype, a step which
can be particularly challenging in organisms for which genomic data are not yet
available. Differential display methods have been commonly used to compare
levels of gene expression in target tissues at various stages, allowing the
identification of sets of genes whose expression patterns are significantly
correlated with traits of interest (Liang and Pardee 1992).
Among the available differential display methods, one increasingly popular
tool is cDNA-amplified fragment length polymorphism (cDNA-AFLP; Breyne et al.
2003). This method allows the identification of differences in the expression of
genes that are correlated to a trait of interest and has proven particularly useful in
non-model organisms, as it does not require previous sequence knowledge. The
cDNA-AFLP technique involves the digestion of cDNA preparations produced from
RNA extractions with two restriction enzymes. To analyze the produced fragments,
adaptors are ligated to each restriction fragment, which then serve as
oligonucleotide-binding sites for two subsequent rounds of PCR. By adding a few
(typically <4), selective base pairs (bp) to these primer sequences, the amplified
fragment pool is reduced in complexity such that a suitable number of fragments
can be visualized (Vos et al. 1995, Meudt and Clarke 2007). By comparing the
presence or absence of individual fragments in individual cDNA libraries after size
separation, one can identify genes correlated to the trait of interest. While the use
of traditional gels (agarose, acrylamide, spreadex, etc.) is required for the recovery
of fragments for further characterization, separation on fluorescent sequencers
allows for high throughput and has become standard (Meudt and Clarke 2007).
A well-designed differential display experiment should aim to sample all
transcripts present in a target tissue in order to avoid biasing downstream
analyses. Optimizing coverage (here defined as the fraction of sequences that
appear at least once as fragments of resolvable size (50-500 bp) in an exhaustive
cDNA-AFLP screen) is at the heart of designing a successful experiment.
Insufficient coverage of the cDNA pool can prevent the detection of genes
correlated to the trait of interest, even if gene expression differences underlie trait
production. Although complete pool coverage may often not be possible in any
69
CHAPTER III Eukaryotic transcriptomics in silico
differential display screen, the recent literature indicates that dozens to hundreds
of transcript-derived fragments (TDF) correlated to traits of interest can be
obtained from the successful application of cDNA-AFLP screens (Table 1). A
variety of modified cDNA-AFLP protocols have been proposed to optimize pool
screening (Koopman and Gort 2004, Kivioja et al. 2005, Weiberg et al. 2008).
The absolute number of TDFs that are screened per selective amplification
is determined by several factors. An increase in the number of selective base pairs
will reduce the number of fragments screened per PCR, and the choice of
appropriate restriction enzymes can also systematically and substantially affect the
quality of a screen, due to functional or evolutionary constraints on the triplets of
amino-acid coding cDNA. The total number of fragments obtained is also directly
linked to the total cDNA pool size, because the presence of more (different)
cDNAs provides more restriction sites, and thus a larger pool is expected to
produce more fragments per PCR. It is intuitively appealing to simply maximize the
number of fragments screened per PCR to minimize the workload, and in fact the
first AFLP studies (Vos et al. 1995) suggested that up to 100 AFLP fragments
could be reliably separated. However, subsequent studies have shown that when
the number of fragments visualized exceeds ~20 per PCR, there is a significant
risk of co-migrating fragments that can confound the reliability of an AFLP screen
(Gort et al. 2006). The risk of co-migration is further complicated by the fact that
sequences of different lengths may migrate together for a variety of reasons,
including physical damage to the DNA molecule, differences in base pair
composition and/or methylation (Gunnarsson et al. 2004). For all of these reasons,
studies in which the accuracy of AFLP-scoring is critical need to be particularly
sensitive to the risks of high-throughput analysis.
Complementary DNA-AFLP optimization problems can be addressed by
computational (in silico) analysis. These in silico approaches are becoming
increasingly feasible as genetic databases increase in taxonomic breadth,
analytical tools are developed, and computational resources increase in power. As
AFLP searches are essentially searches for particular sequence motifs, the
implementation of cDNA-AFLP in silico is computationally straightforward. Each of
these screened sequence motifs is composed of the recognition site of the
restriction enzyme and three or fewer selective base pairs, such that analyses are
70
CHAPTER III Eukaryotic transcriptomics in silico
restricted to searches for up to 43 × 43 = 4096 sequence motifs for a threeselective base pair experiment involving two enzymes.
The first quantitative cDNA-AFLP in silico studies approached this
optimization problem in individual taxa, identifying several factors that can improve
experimental design. Kivioja et al. (2005; Kivioja, unpublished data) suggested that
the use of restriction enzymes with 6-bp restriction sites is likely to be
disadvantageous in cDNA-AFLP studies due to the fact that such enzymes
significantly reduce pool coverage. Again, simply maximizing the number of
fragments screened per selective PCR by using restriction enzymes that cut
frequently is not necessarily optimal, as this increases the risk of obtaining sizehomoplasious fragments (henceforth: collisions) within each selective amplification
(Gort et al. 2006). There is thus a tradeoff between data quantity and quality in
cDNA-AFLP experiments. Methods have been proposed which would minimize the
number of amplifications required per enzyme combination (Kivioja et al. 2005)
when the cDNA pool has been previously characterized, but it is unclear whether
these approaches have more widespread applicability.
These first in silico approaches to the study of cDNA-AFLPs suffer from two
significant limitations. First, these studies used cDNA data from a small number of
(often closely related) taxa (Koopman and Gort 2004, Kivioja et al. 2005, Gort et
al. 2006, Weiberg et al. 2008), an approach that could restrict the wider
applicability of their conclusions, as codon usage is known to vary widely across
taxonomic groups (Subramanian 2008). As one of the major benefits of AFLPs is
their ready applicability to new taxa, this may be a particularly important issue. A
second potential limitation of these earlier studies stems from the fact that
previous in silico analyses of cDNA-AFLPs used RefSeq sequences from curated
resources, which are typically biased towards larger and more complete
sequences. As this quality of data is rarely available in real-world datasets,
insights gained from simulations based on these data may not be relevant for
typical research projects. The effects of the raw data themselves on the outcome
of the in silico optimizations have not yet been unexplored.
To overcome the limitations of previous in silico studies, we use a
taxonomically diverse eukaryotic dataset to investigate traditional cDNA-AFLP
experiments sensu Bachem (1996). Briefly, cDNA is digested with two restriction
enzymes, from which subsets of fragments are amplified and then separated by
71
CHAPTER III Eukaryotic transcriptomics in silico
electrophoresis. Depending on the frequency of restriction enzyme cleavage,
multiple fragments may be generated for each cDNA. We maximize cDNA pool
coverage and optimize the number of TDFs produced per selective PCR using
simulated cDNA-AFLPs on a wide taxonomic sampling of 92 eukaryotic species
representing most major groups (See additional file 1: "General information for
each species" and additional file 2 "Species composition of included taxonomic
groups"). Making use of data from two different repositories, we also investigate
whether systematic differences exist between datasets obtained from different
databases. After quantifying these effects, we test all 28 combinations of eight
commonly used restriction enzymes on all 92 species and assess the relative
performance of individual enzymes on cDNA-AFLP screens. By including
information on the taxonomic grouping of each species, we are able to investigate
whether there is significant phylogenetic signal in the data, a finding which could
indicate that different cDNA-AFLP protocols might be necessary for particular
taxonomic groups. This quantitative dataset is then used to compare and identify
optimal enzyme combinations, both at the species-level and across all eukaryotes.
The cDNA pool-coverages obtained in these global analyses are based on
the execution of all possible selective PCRs, but such extensive screens are often
infeasible in the laboratory. To investigate potential differences in TDF recovery
during selective PCR, we simulate all possible combinations of selective PCRs for
each enzyme combination and species and extract information on the number of
fragments produced per selective PCR. Because the maximum number of
selective amplifications is frequently limited and the selective base pairs used in
amplifications are not necessarily independent of each other, we use graphical
representations to identify general patterns in the performance of selective
amplifications. As a comparison, we perform in silico AFLP on simulated DNA and
cDNA datasets to address whether cDNA-AFLP patterning in real data differs from
neutral expectations.
Our comprehensive in silico approach provides a realistic quantitative
framework for the design of future cDNAAFLP experiments. In addition to
removing the guesswork from the design of such screens for non-model
organisms, our in silico approach offers a powerful means for identifying general
patterns in the transcriptomes of both model- and non-model species.
72
CHAPTER III Eukaryotic transcriptomics in silico
Results
Consistent results from curated datasets
NCBI and ENSEMBL databases provided a total of 113 pools of cDNA for
this study. Twenty-one species were present in both databases, providing an
opportunity to investigate the potential effects of database origin on pool coverage.
While the data from NCBI and ENSEMBL differed significantly in many
characteristics (See additional file 3: "Duplicate species from ENSEMBL and NCBI
databases"), the source of the data did not explain a significant proportion of the
variation in cDNA pool coverage after controlling for total pool size, average
sequence length, GC content and the proportion of ambiguous nucleotides (See
additional file 3 and additional file 4: "Influence of database origin on pool
coverage"). Duplicated species from the NCBI database were therefore removed
to avoid pseudo-replication in subsequent analyses (see Methods).
Sources of variability in cDNA pool coverage
Considerable variability exists in the observed cDNA pool coverage both
within and across species (Table 2; see also additional files 1 and 3). Two major
sources of variability in coverage can be identified. Sequence characteristics such
as average cDNA length and the total pool size explain a significant proportion of
the variation in the pool coverage. Of these technical effects, average sequence
length explains 38% of the variation in cDNA pool coverage. Less important is the
effect of total pool size (14.3% of the variation in coverage explained), while the
effect of ambiguous bases on pool coverage is non-significant (Table 2).
A larger portion of the variation in coverage can be explained by biological
factors (Table 2), of which the combination of restriction enzymes is most
important, explaining 68.9% of the observed variation in coverage. The GC
content of the target species explains 28.7% of cDNA pool coverage, and a
significant two-way interaction exists between enzyme combination and the GC
content of the pool, explaining 55.6% of the variation in coverage. This significant
interaction term indicates that optimal enzyme combinations differ among species
(see also additional file 1) and suggests that GC content should be considered
when choosing optimal restriction enzymes for a cDNA-AFLP screen. Taken
73
CHAPTER III Eukaryotic transcriptomics in silico
together, our mixed model explains 78% of variation in cDNA pool coverage
(Table 2).
The choice of the most appropriate restriction enzymes substantially
increases the coverage of a given cDNA pool from less than 40% to more than
75% (Table 3). The effects of restriction enzymes are essentially additive
(compare Table 3 and Table 4), indicating that the performance of individual
restriction enzymes is not strongly influenced by the second enzyme used in the
double digest.
Effects of evolutionary history on cDNA-pool coverage
Analyzing sequence data from a group of organisms with an evolutionary
history as old and diverse as that of eukaryotes allows the quantification of the
effects of taxonomic substructure on cDNA pool coverage. 68 of the 92 study
species could be assigned to eight major taxonomic groups (see also additional
file 2) with at least three members per group. This additional predictor (taxonomic
group) improves the fit of our model by 16.1% (Table 5). Taxonomic grouping itself
explains 62.2% of the variation in pool coverage. Once again, the choice of
enzyme combination explains the highest proportion of coverage in this model
(79.6%), and the influence of technical effects is less significant. Of these
sequence characteristics, the average sequence length has again the strongest
influence and explains 54.0% of the variation in cDNA pool coverage, while the
total pool size accounts for only 8.2% and the proportion of ambiguous nucleotides
does not significantly affect coverage. There is a strong interaction between
taxonomic group and enzyme combination (p < 0.001) indicating that the optimal
enzyme combination varies across groups (see also additional file 2). This
difference is mediated in large part by differences in GC content among the taxa
included here (70.7% variation explained; Table 5).
A positive relationship between cDNA-AFLP fragment number and pool size
We were interested to see whether a relationship exists between the
average number of fragments produced per selective PCR and any of the
additional information we collected for each cDNA pool. We found a strong
positive correlation between the average fragment number per selective PCR and
the size of the cDNA pool in base pairs (Figure 1, Table 3). With an r2 of 0.63 74
CHAPTER III Eukaryotic transcriptomics in silico
0.98, the average fragment counts generated per PCR provide a reasonable
estimate of the size of the underlying cDNA pool.
cDNA length averaged 1113 ± 489 bp across the pools included in the
present study (see additional file 1), similar to the recently published estimate of
1346 bp derived from gene predictions in the eukaryotic genome (Xu et al. 2006).
Using these estimates, it is possible to convert the estimated total pool sizes in
base pairs into absolute numbers of cDNAs. The linear relationship between total
cDNA pool size and average fragment number per selective PCR can help
minimize the possibility of collisions when optimizing cDNA-AFLP experimental
design. In case of a selective PCR regime which employs a two-by-three selective
base pair design, the threshold of 20 fragments per PCR reaction to minimize the
chance of collisions will rarely be reached in tissues with fewer than 15000
sequences, assuming an average cDNA length of 1346 bp. However, the
frequently used two-by-two selective base pair design will yield more than 20
fragments per selective PCR in a pool of only 7500 cDNAs and nearly 100
fragments in a pool of 15000 cDNAs (Figure 1), suggesting that a two-by-two
selective base pair design is likely to introduce a significant source of error via
collisions in a typical cDNA screen (Gort et al. 2006).
Non-random patterning in cDNA-AFLP arrays
Selective PCRs generally use up to three selective base pairs, and hence a
maximum of 43 × 43 = 4096 different selective amplifications are theoretically
possible when using two restriction enzymes. According to neutral expectations,
each of these selective primer combinations would be expected to produce on
average a similar number of fragments. We used array plotting to visualize the
relative fragment numbers produced by each potential selective PCR in the typical
three-by-three selective base pair design and found considerable structure in
empirical data that is not found in simulated cDNA and genomic DNA pools
(Figure 2). Such structure is observable for all enzyme combinations (e.g. Homo
sapiens; Figure 3). As is apparent from Figure 3, restriction-enzyme specific
patterning for individual enzymes is highly conserved even when enzymes are
used in different combinations, suggesting that the difference between the
fragment numbers per selective PCR is largely the result of the individual
restriction enzymes (see above). Particular selective PCRs fail to generate any
75
CHAPTER III Eukaryotic transcriptomics in silico
products and are thus entirely uninformative in cDNA-AFLP screens. In these
cases, one or both restriction enzymes cut closely together, producing AFLP
products too small to be visualized in the screen (see Discussion). This restrictionenzyme patterning is consist- ent even in distantly related taxa (Figure 4),
indicating the strong signal of evolutionary history in the underlying datasets.
76
CHAPTER III Eukaryotic transcriptomics in silico
Discussion
Complementary DNA-AFLPs are an increasingly popular tool to study
differential gene expression, particularly in non-model organisms for which
genome data are unavailable (Table 1). The main benefits of the cDNA-AFLP
approach are the relative ease of its implementation and its low per-marker costs
(Vuylsteke et al. 2006). In addition to the traditional use of cDNA-AFLPs to identify
dominant (i.e. presence-absence) markers correlating to traits of interest, recent
methods have shown that cDNA-AFLPs can also provide quantitative data
(Reijans et al. 2003). Regardless of the goals of a cDNA-AFLP experiment, a
successful screen requires high coverage of the underlying cDNA pool. While
significant advances have been made in technical aspects of the AFLP
methodology, theoretical studies investigating methods for optimizing the cDNAAFLP screens remain relatively rare, and large scale empirical data - as provided
here for eukaryotes - have not yet been used for this purpose (Kivioja et al. 2005,
Gort et al. 2006, Weiberg et al. 2008 ).
Recent years have seen an explosion in cDNA datasets. ENSEMBL and
NCBI are two of the most important repositories for cDNA data, and the taxonomic
coverage and quality of data in these archives will continue to grow with the
development of next-generation sequencing technologies. Given the vast amount
of available data - in the present study a total of more than 1.7 million sequences
and 2.2 Gbp of cDNA were screened - in silico studies offer the potential to
address novel research questions and to optimize experimental protocols before
undertaking large experimental studies. The cDNA pools included in the present
study cover most major extant eukaryotic groups, providing an opportunity to
identify broadly applicable conclusions on the most important factors affecting the
quality of cDNA-AFLP screens. These cDNA pools range from a few hundred to
more than 57,000 sequences (see additional file 1), covering the range of
experiments likely to be undertaken in both model- and non-model organisms.
Using previously published and pre-filtered data has the potential to
introduce technical artifacts into in silico analyses. The database origin of cDNA
pools does not affect our coverage optimization after controlling for differences in
sequence length, total pool size, GC content and the proportion of ambiguous
nucleotides (see additional file 4: "Influence of database origin on pool coverage").
77
CHAPTER III Eukaryotic transcriptomics in silico
When comparing data derived from different databases, non- ACGT content was
found to explain a significant component of pool coverage (see additional file 4).
This result is due to an abnormally high proportion of ambiguous nucleotides in the
Gasterosteus aculeatus cDNA pool obtained from the NCBI repository (1.26%,
versus 6 × 10- 6% in the ENSEMBL dataset; see also additional file 3). This effect of
non-ACGT nucleotides on coverage disappears when this species is removed
from the analysis (data not shown).
cDNA pool coverage in the complete dataset of 92 species (see additional
file 1) is significantly affected by both total pool size and average sequence length,
which explain 14% and 38% percent of coverage, respectively (Table 2). Because
the cDNA-AFLP method requires the presence of at least two restriction sites in
proximity to screen each transcript, cDNA sequence length can have a large
effect, and a significant reduction in coverage is expected when using short cDNA
sequences. While the quality of the cDNA preparation can influence cDNA length,
differences in cDNA length between species may also reflect biological reality.
Species included in our study differ substantially in average cDNA sequence
length (see additional file 1). This difference is most pronounced between plants
(coniferopsids, liliopsids and streptophytes), which have an average cDNA length
of approximately 800 bp, and mammals, which have an average cDNA sequence
length of 1600 bp (see additional file 2). This difference, though more modest, is
also evident in the results of recent full-length cDNA sequencing projects. An
average cDNA length of ~1.5 kb has been reported in plants (e.g. Ogihara et al.
2004, Alexandrov et al. 2006, Umezawa et al. 2008, Sato et al. 2009), whereas
mammals have on average longer full length cDNAs of ~1.7 kb (e.g. Okazaki et al.
2002, Gerhard et al. 2004, Ota et al. 2004, Harhay et al. 2005, Sakate et al. 2007).
While these studies indicate cDNA length may vary among taxonomic groups, the
biological implications and evolutionary consequences of this variation remain
unclear.
Technical issues have an important effect on the outcome of cDNA-AFLP
experiments, but the restriction enzymes employed explain the majority of the
variation in pool coverage (Table 2, Table 5). Here, three factors are relevant.
First, the use of restriction enzymes with 6-bp recognition sites is not
recommended for cDNA pools (Kivioja et al. 2005; Kivioja, unpublished data), as it
greatly reduces the number of fragments generated per PCR reaction. Second,
78
CHAPTER III Eukaryotic transcriptomics in silico
among the restriction enzymes tested here, some are far better suited for cDNAAFLPs than are others. Estimates of the effects of individual enzymes on coverage
(Table 4) or their combined effect (Table 3) clearly indicate that the efficiency of
the pool coverage can be nearly doubled by choosing the optimal enzyme
combination. Of the restriction enzymes included here, CviAII, MseI and CviQI
outperform the other enzymes and are as such good candidates for cDNA-AFLP
screens in eukaryotes (Table 3, Table 4). Finally, several basic rules should be
kept in mind when choosing restriction enzymes. A strong interaction between
optimal restriction enzymes and organismal GC content is apparent in all analyses
(see also additional file 2). Clearly, restriction enzymes with GC-rich recognition
sites are likely to cut more frequently in GC rich genomes than in those with
reduced GC content. Similarly, the use of restriction enzymes with recognition
sites frequently found in cDNAs could likewise aid in obtaining in-depth pool
coverage. As most previous studies have used a six-cutter restriction enzyme
together with a four-cutter and have focused on a small number of primer
combinations (Table 1), the number of genes correlated to traits of interest has
likely been frequently underestimated.
Complementary DNA-AFLPs have been applied to a wide range of
eukaryotic taxa, and the ease of implementing this method in new systems is one
of its particular strengths. While previous studies proposed suitable enzyme
combinations for species for which sequence data are already available (Kivioja et
al. 2005), the restricted taxonomic focus of these earlier studies limited the
applicability of inferences across a wider array of organisms. As can be seen from
Table 5, significant effects of taxonomic grouping exist, and a strong interaction
between the taxonomic grouping and the GC content is apparent (compare Table
2 with Table 5). While this indicates that the optimal choice of restriction enzymes
differs among taxonomic groups, it also indicates that a large portion of this
difference in optimal enzyme choice can be explained by organismal GC content
(see additional file 2). By considering GC content prior to undertaking a cDNAAFLP experiment, researchers should be able to optimize the quality of their
screens.
Our in silico experiment revealed that cDNA-AFLP performance differs
markedly from neutral expectations (Figure 2) and that the observed patterning is
highly consistent across taxa (Figure 4). Clearly, cDNA pool coverage could be
79
CHAPTER III Eukaryotic transcriptomics in silico
even further enhanced through a more explicit incorporation of the results
presented here. By selecting only the best performing selective base pair
combinations for several independent enzyme pairs, one should be able to
maximize pool coverage in a reasonably- sized cDNA-AFLP experiment. We refer
the reader to additional file 5: "Arrays of all selective PCRs for all species and
enzyme combinations", which provides complete cDNA-AFLP arrays for all
species investigated here. Figure 3 indicates that most of this patterning results
from the effects of the individual restriction enzymes. This is especially apparent
for areas of uninformative selective primer combinations in which particular primerenzyme combinations fail to generate any cDNA-AFLP products at all. This pattern
is a result of the AFLP methodology, where restriction enzymes are used to digest
double-stranded DNA and adaptors are ligated directly to the digested cDNA ends.
During selective amplifications, the selective base pairs of each primer extend
directly 3' from the recognition site. As a consequence, an AFLP screen using
four-cutter enzymes and three selective base pairs is equivalent to a motif search
for DNA stretches of 7-bp length. When restriction enzymes overlap in one or
more base pairs, this motif may contain multiple restriction enzyme recognition
sites, producing cDNA fragments shorter than the 50 bp required for visualization.
These classes of selective PCRs will thus not produce any fragments of mixed
type. The selective amplification of HinP1I-generated fragments with the selective
base pairs GCN is one such example (Figure 4). When a given DNA sequence
contains the motif GCGCGCN, HinP1I will cleave the sequence at two positions
(G^CGC^GCN). Due to this double digest, the use of HinP1I will fail to generate
any AFLP fragments containing the GCGCGCN motif. Even when this overlap in
recognition sites is only partial, the number of fragments generated by a particular
pair of selective primers can be reduced, which might explain a portion of the
observed patterning. However, the absence of patterning in the simulated data
relative to Homo sapiens (Figure 2) suggests that technical aspects of the cDNAAFLP method are insufficient to explain the higher level of complexity found in real
data. As this structure is remarkably consistent across taxa (Figure 4), factors
highly conserved across evolution (such as codon usage) must contribute to this
pattern.
During AFLP screens, selective PCRs are used to reduce the complexity of
produced fragment pools. The average number of fragments produced during
80
CHAPTER III Eukaryotic transcriptomics in silico
each selective PCR is positively correlated with the size of the cDNA pool (Figure
1, Table 3). For the restriction enzyme combinations investigated here, the
average number of fragments obtained from selective PCRs can be converted into
an estimate of the - typically unknown - size of the underlying cDNA pool. This
novel versatility of the AFLP methodology - estimating cDNA pool size - should be
particularly useful for any study in which knowledge of the underlying
transcriptome size is critical. This is especially the case when performing large
scale sequencing of the transcriptome, where a preliminary cDNA-AFLP screen
may offer a cost-effective means to estimate the number of genes expressed in a
tissue of interest.
The linear relationship between average fragment number and total cDNA
pool size can also provide guidance when deciding on how many selective base
pairs to use. From Figure 1 it is apparent that a two-by-two selective base pair
design will often result in fragment numbers that far exceed that optimal for reliable
fragment separation (<100 fragments per amplification) or to avoid significant
homoplasy (<20 fragments per PCR). A three-by-three selective base pair design
is, however, too conservative, in that too few fragments will be screened per PCR
reaction (less than 10 fragments per PCR will be generated for datasets containing
the equivalent of up to 15000 cDNAs - about 20 Mbp of cDNA sequence). Using a
two-by-three selective base pair design appears to be the best option for most
cDNA screens, producing 10-20 fragments per amplification (Figure 1; Gort et al.
2006) in cDNA pools of up to 15000 sequences or 20 Mbp, pool sizes expected in
vitro in typical mammalian tissues (Carter et al. 2005).
81
CHAPTER III Eukaryotic transcriptomics in silico
Conclusion
Optimizing the quality of cDNA-AFLP screens
Our in silico approach to cDNA-AFLP optimization suggests several key
improvements to existing methods of cDNA-AFLP experiments and highlights
restriction enzymes likely to be particularly well suited for screening eukaryotes
(Table 4, see additional file 1). Matching the GC content of the restriction enzymes
with that of the target cDNA is a relatively simple step to optimize experimental
design. Consideration of the restriction enzyme recognition sites is particularly
important, especially when resources limit the number of selective PCRs that can
be performed. Following these recommendations will significantly improve the
efficiency of future cDNA-AFLP experiments.
A new application of the cDNA-AFLP methodology
In addition to our methodological suggestions, the comparative approach
taken here identified a positive linear relationship between the average fragment
numbers per selective PCR and the size of the underlying cDNA pool. This
provides a novel method to estimate the number of transcripts present in a cDNA
pool via a simple series of cDNA-AFLP screens, an application which will be
invaluable as next generation sequencing technologies are adapted for differential
display.
82
CHAPTER III Eukaryotic transcriptomics in silico
Methods
Sampling scheme
An in silico routine for AFLPs (Koopman and Gort 2004) was modified here
to simulate the AFLP procedure on cDNA datasets. We included the 39 eukaryotic
species
available
from
the
http://www.ensembl.org/info/data/ftp/index.html
ENSEMBL
as
well
as
repository
all
87
NCBI
ftp://ftp.ncbi.nih.gov/repository/UniGene/ cDNA datasets available as of January
2008, providing a taxonomic sample covering all available eukaryotic species. We
chose these databases because the frequently used RefSeq databases (Kivioja et
al. 2005, Weiberg et al. 2008) lack alternative splice variants, incomplete genes
and pseudogenes, sources of cDNA variation commonly present in real world
data. As such, our in silico optimization of the cDNA-AFLP routine is a much more
realistic approximation of experimental (in vitro) conditions. As we wish to help the
experimenter in designing experiments for their own target species, our data are
based on whole organism cDNA equivalents rather than tissue-specific datasets,
for which available data are much more restricted. In the course of this paper we
refer to "cDNAs" as those transcript- derived sequences obtained from the above
indicated repositories.
cDNA-AFLP simulations
We simulated cDNA-AFLPs for all 28 combinations of eight different
restriction enzymes for 126 pools of eukaryotic cDNA (105 species). The eight
restriction enzymes used here are commonly used in AFLP screens and were
used in a previous simulation study (Kivioja et al. 2005), allowing direct
comparison with this earlier work. Enzyme details can be found in Table 4. Only
restriction enzymes with 4-bp recognition sites were selected, as 6-bp restriction
enzymes have been found to be ill-suited for cDNA-AFLP screens (Kivioja et al.
2005; Kivioja, unpublished data). We also collected information on the number of
sequences and the sum of base pairs for each cDNA dataset and recorded
nucleotide composition to estimate GC content and the proportion of non-ACGT
base pairs (an indication of the overall quality of a dataset). The coverage of each
cDNA pool was calculated as the percentage of cDNA transcripts which generated
at least one fragment in the standard cDNA-AFLP size range (50 to 500 bp as
83
CHAPTER III Eukaryotic transcriptomics in silico
commonly used on fluorescent sequencers) in an exhaustive PCR screen of all
combinations of three selective base pairs. We termed this fraction "dataset
coverage" and used it as our response variable.
Initial analyses revealed that a small number of cDNA datasets contained
an unusually high proportion of non- ACGT nucleotides (>10%, data not shown).
These datasets consisted of cDNA predictions based on early drafts of genome
sequences for 13 mammalian species. Owing to the preliminary nature of these
genome projects, many of the predicted cDNA sequences contained extended
stretches of ambiguous base pairs ("Ns"). As a consequence, these sequences
are effectively composed of two much shorter pieces of unambiguous sequence
data. Because the probability of the presence of a particular restriction site is
related to the length of a sequence, this reduction of the effective average
sequence length can strongly influence the predicted cDNA pool coverage. As the
peculiar nature of these poor quality datasets had a strong influence on
preliminary GLMs, these species were excluded from further analyses. The
remaining 113 datasets included here are listed in additional files 1 and 2.
Our simulations returned information for each dataset and enzyme
combination in separate results files. This information was collated into summary
files using EXCEL macros and a JAVA routine and imported into SAS 9.1.3. The in
silico cDNA-AFLP routine, EXCEL macros, JAVA tool, and raw data sets are
available upon request from the corresponding authors.
Patterning of selective PCRs
Most AFLP studies use two or three selective base pairs in their selective
PCRs. We produced the most inclusive arrays of selective in silico PCRs by
counting fragment numbers produced for all possible combinations of selective
PCRs with three selective base pairs for each dataset and restriction enzyme
combination. Three selective base pairs for each selective primer allow for a
maximum of 64 × 64 different primer combinations for two enzymes, and thus this
most inclusive data array contains 4096 cells. Arrays for all species tested here
are available in additional file 5. As some AFLP experiments use fewer selective
base pairs, two-by-three and two-by-two selective base pair arrays were produced
from the three-by-three array by summation. This summation is possible because
the fragment numbers produced by amplifications with two selective base pairs are
84
CHAPTER III Eukaryotic transcriptomics in silico
identical to those produced by all four selective amplifications obtained with three
selective base pairs (ex: AAN for N = A, C, G, T), given that the first two selective
base pairs are identical to those of the two base pair selective amplification. The
two-by-three selective base pair arrays and the two-by-two selective base pair
arrays contained 1024 and 256 cells, respectively.
We investigated the relative information content of all 4096 selective PCR
reactions using graphical representations for a subset of PCR arrays. We also
simulated DNA and cDNA datasets of 10000 sequences of 1290 bp using the
SEQUENCE MANIPULATION SUITE (Stothard 2000). Random DNA datasets were
generated assuming equal base pair frequencies, while random cDNA datasets
were generated using codon triplets based on the standard eukaryotic genetic
code, starting with a start codon and ending with a stop codon. We compared
these results with in silico cDNA-AFLP data derived from Homo sapiens (Figs. 2,
3). The same procedure was applied to the selective PCR arrays for six different
species (Figure 4) to investigate systematic differences in cDNA-AFLP patterns
across taxonomic groups. Data were visualized with the SAS/Graph bundle and
the R library "Fields" (Fields Development Team 2006).
Partitioning variation in cDNA-pool coverage
Mixed model analyses (Proc MIXED) were used to study the relative
importance of sequence characteristics and enzyme combinations in explaining
cDNA pool coverage (an arcsine-square root transformed value unless otherwise
indicated). All covariates were standardized by mean-centering and dividing by
two standard deviations to control for the influence of different scaling factors in
our predictor variables, and analyses were weighted by total pool size (in bp) to
control for potential differences in variance estimates. We calculated partial Rsquare coefficients (Edwards et al. 2008), which provide an indication of the
strength of the influence of individual covariates on the response variable. Due to
correlations between explanatory variables, these values do not necessarily sum
to 100%. Complementary DNA pool coverage is expected to vary with the
sequence characteristics of the underlying dataset, and average sequence length,
GC content, the proportion of ambiguous nucleotides (non-ACGT) and total pool
size were thus all included as covariates in our models.
85
CHAPTER III Eukaryotic transcriptomics in silico
Pools of complementary DNA were obtained from NCBI and ENSEMBL,
two sequence repositories that use different methods for the organization and
curation of their genetic data. As these differences could introduce an additional
source of variation in our analyses, we investigated the importance of database
origin, using the 21 taxa for which data were available from both repositories (see
additional file 3). We modeled variation in cDNA pool coverage according to
database origin, enzyme combination and the interactions of database origin and
GC content with the enzyme combination (see additional file 4) in addition to the
main effects of the covariates listed above. As coverage estimates for all 28
enzyme combinations were based on the same underlying cDNA pool for each
species in each database, we controlled for species origin by incorporating a
species (database) random effect. Because database origin did not explain a
significant proportion of the variation in cDNA pool coverage after controlling for
other covariates (see additional file 4), we removed duplicate species from the
NCBI repository from further analyses to eliminate potential biases due to pseudoreplication.
Effects of taxonomic grouping
Testing for the effect of taxonomic grouping (Table 5) was also possible, as
68 of the 92 available species could be assigned to eight taxonomic groups with
three or more taxa using the NCBI Taxonomy browser (Wheeler et al. 2000).
Similar mixed models were used to investigate the effects of enzyme combination
(Table 2; see additional file 1) and taxonomic grouping (Table 5; see additional file
2) on the cDNA pool coverage. These factors entered either analysis in addition to
the covariates indicated above and the significant two-way interactions between
GC content and enzyme combination/taxonomic group were retained in the final
model. Here, we accounted for the nested nature of our data by including species
as a random factor.
Because our mixed models estimate the combined effects of the two
restriction enzymes, we isolated the individual effects of each restriction enzyme
by regressing the untransformed cDNA pool coverage against individual restriction
enzymes in a separate model (Table 4). Here, each of the eight restriction
enzymes entered the model as dummy variables explaining variation in the cDNA
pool coverage. In addition to the individual enzymes, we also included enzyme
86
CHAPTER III Eukaryotic transcriptomics in silico
combination in the model to determine how much additional variation in coverage
could be explained by enzyme interactions. As such, we were able to identify the
separate effects of individual enzymes and their interactions on pool coverage.
Parameter estimates from this linear regression are reported in Table 4, together
with information on each restriction enzyme.
Estimating underlying cDNA pool sizes by AFLP fragment number
Finally, we performed simple linear regression of the average fragment
numbers per species and enzyme combination obtained during each selective
PCR against the total size of the cDNA pool to explore whether the average
number of fragments obtained per selective PCR provides information on the size
of the underlying cDNA pool. This total pool size estimate can be directly
transformed into an estimate of the total number of different cDNAs present in the
studied pool by assuming an average sequence length of 1300-1400 bp (Xu et al.
2006). By performing linear regressions of the average fragment numbers per
selective PCR and enzyme combination for the 2×2, 2×3 and 3×3 arrays against
the total cDNA pool size, we were able to determine the optimal number of
selective base pairs for a given total pool size in order to minimize collisions (20
fragments per PCR; Gort et al. 2006), to optimize separation (50- 100 fragments,
Vos et al. 1995) or to maximize the total number of fragments produced per
selective PCR (up to 450 fragments can be scored over a typical AFLP screen of
50 to 500 bp). Figure 1 summarizes our findings and Table 3 reports regression
coefficients and equations.
Acknowledgements
The authors thank Stefanie Bauerfeind, Marco Demont, Tadeusz Kawecki,
Wim Koopman, Peter Wandeler, Andreas Wagner and members of the Wilson
Laboratory for critical discussion of results. Yves Choffat provided technical
assistance during the experiment, and Lukas Keller helped with SAS programming
questions. Special thanks are due to Martin A. Schäfer, Erik Postma, Wolf
Blanckenhorn and David Berger for statistical advice.
Financial support from the Forschungskredit der Universität Zürich (KNS),
the Swiss National Science Foundation (ABW), the University of Zurich (ABW,
CW),
and
Wageningen
University
(GG)
is
gratefully
acknowledged.
87
CHAPTER III Eukaryotic transcriptomics in silico
References
Alexandrov NN, Troukhan ME, Brover VV, Tatarinova T, Flavell RB, Feldmann KA.
2006. Features of Arabidopsis genes and genome discovered using fulllength cDNAs. Plant Mol Biol 60:69-85.
Aquea F, Arce-Johnson P. 2008. Identification of genes expressed during early
somatic embryogenesis in Pinus radiata. Plant Physiol Bioch 46:559-568.
Bachem CWB, van der Hoeven RS, de Bruijn SM, Vreugdenhil D, Zabeau M,
Visser RGF. 1996. Visualization of differential gene expression using a
novel method of RNA fingerprinting based on AFLP: Analysis of gene
expression during potato tuber development. Plant J 9:745-753.
Breyne P, Dreesen R, Cannoot B, Rombaut D, Vandepoele K, Rombauts S,
Vanderhaeghen R, Inze D, Zabeau M. 2003. Quantitative cDNA-AFLP
analysis for genome-wide expression studies. Mol Genet Genomics,
269:173-179.
Carter MG, Sharov AA, VanBuren V, Dudekula DB, Carmack CE, Nelson C, Ko
MS. 2005. Transcript copy number estimation using a mouse wholegenome oligonucleotide microarray. Genome Biol 6:R61.
Edwards LJ, Muller KE, Wolfinger RD, Qaqish BF, Schabenberger O. 2008. An R2
statistic for fixed effects in the linear mixed model. Statistics in Medicine
27:6137-6157.
Fields
Development
Team:
Fields:
Tools
for
[http://www.image.ucar.edu/GSP/Software/Fields/].
spatial
National
data.
Center
2006
for
Atmospheric Research, Boulder, CO
Gerhard DS, Wagner L, Feingold EA, Shenmen CM, Grouse LH, Schuler G, Klein
SL, Old S, Rasooly R, Good P, Guyer M, Peck AM, Derge JG, Lipman D,
Collins FS. 2004. The status, quality, and expansion of the NIH full-length
cDNA project: The Mammalian Gene Collection (MGC). Genome Res
14:2121-2127.
Gort G, Koopman WJM, Stein A. 2006. Fragment length distributions and collision
probabilities for AFLP markers. Biometrics 62:1107-1115.
Gunnarsson GH, Thormar HG, Gudmundsson B, Akesson L, Jonsson JJ. 2004.
Two-dimensional conformation-dependent electrophoresis (2D-CDE) to
88
CHAPTER III Eukaryotic transcriptomics in silico
separate DNA fragments containing unmatched bulge from complex DNA
samples. Nucleic Acids Res 32:e23.
Harhay GP, Sonstegard TS, Keele JW, Heaton MP, Clawson ML, Snelling WM,
Wiedmann RT, Van Tassell CP, Smith TP. 2005. Characterization of 954
bovine full-CDS cDNA sequences. BMC Genomics 6:166.
Hsu TW, Tsai WC, Wang DP, Lin S, Hsiao YY, Chen WH, Chen HH. 2008.
Differential gene expression analysis by cDNA-AFLP between flower buds
of Phalaenopsis Hsiang Fei cv. H. F. and its somaclonal variant. Plant Sci
175:415-422.
Huang YC, Chang YL, Hsu JJ, Chuang HW. 2008. Transcriptome analysis of
auxin-regulated genes of Arabidopsis thaliana. Gene 420:118-124.
Kivioja T, Arvas M, Saloheimo M, Penttila M, Ukkonen E. 2005. Optimization of
cDNA-AFLP experiments using genomic sequence data. Bioinformatics
21:2573-2579.
Koopman WJM, Gort G. 2004. Significance tests and weighted values for AFLP
similarities, based on Arabidopsis in silico AFLP fragment length
distributions. Genetics 167:1915-1928.
Liang P, Pardee AB. 1992 Differential display of eukaryotic messenger- RNA by
means of the polymerase chain-reaction. Science 257:967-971.
Meudt HM, Clarke AC. 2007. Almost forgotten or latest practice? AFLP
applications, analyses and advances. Trends Plant Sci 12:106-117.
Miao L, Shou S, Zhu Z, Jiang F, Zai W, Yang Y. 2008. Isolation of a novel tomato
caffeoyl CoA 3-O-methyltransferase gene following infection with the
bacterium Ralstonia solanacearum. J Phytopathol 156:588-596.
Muller LA, Craciun AR, Ruytinx J, Lambaerts M, Verbruggen N, Vangronsveld J,
Colpaert JV. 2007. Gene expression profiling of a Zn-tolerant and a Znsensitive Suillus luteus isolate exposed to increased external zinc
concentrations. Mycorrhiza 17:571-580.
Neveu C, Charvet C, Fauvin A, Cortet J, Castagnone-Sereno P, Cabaret J. 2007.
Identification of levamisole resistance markers in the parasitic nematode
Haemonchus contortus using a cDNA-AFLP approach. Parasitology
134:1105-1110.
Ogihara Y, Mochida K, Kawaura K, Murai K, Seki M, Kamiya A, Shinozaki K,
Carninci P, Hayashizaki Y, Shin I, Kohara Y, Yamazaki Y. 2004.
89
CHAPTER III Eukaryotic transcriptomics in silico
Construction of a full-length cDNA library from young spikelets of hexaploid
wheat and its characterization by large-scale sequencing of expressed
sequence tags. Genes Genet Syst 79:227-232.
Okazaki Y, Furuno M, Kasukawa T, Adachi J, Bono H, Kondo S, Nikaido I, Osato
N, Saito R, Suzuki H, Yamanaka I, Kiyosawa H, Yagi K, Tomaru Y,
Hasegawa Y, Nogami A, Schonbach C, Gojobori T, Baldarelli R, Hill DP,
Bult C, Hume DA, Quackenbush J, Schriml LM, Kanapin A, Matsuda H,
Batalov S, Beisel KW, Blake JA, Bradt D, et al. 2002. Analysis of the mouse
transcriptome based on functional annotation of 60,770 full-length cDNAs.
Nature 420:563-573.
Ota T, Suzuki Y, Nishikawa T, Otsuki T, Sugiyama T, Irie R, Wakamatsu A,
Hayashi K, Sato H, Nagai K, Kimura K, Makita H, Sekine M, Obayashi M,
Nishi T, Shibahara T, Tanaka T, Ishii S, Yamamoto J, Saito K, Kawai Y,
Isono Y, Nakamura Y, Nagahari K, Murakami K, Yasuda T, Iwayanagi T,
Wagatsuma M, Shiratori A, Sudo H, et al. 2004. Complete sequencing and
characterization of 21,243 full-length human cDNAs. Nature Genet 36: 4045.
Pathan AAK, Devi KU, Vogel H, Reineke A. 2007. Analysis of differential gene
expression in the generalist entomopathogenic fungus Beauveria bassiana
(Bals.) Vuillemin grown on different insect cuticular extracts and synthetic
medium through cDNA-AFLPs. Fungal Genet Biol 44:1231-1241.
Pellny TK, Van Aken O, Dutilleul C, Wolff T, Groten K, Bor M, De Paepe R, Reyss
A, Van Breusegem F, Noctor G, Foyer CH. 2008. Mitochondrial respiratory
pathways modulate nitrate sensing and nitrogen-dependent regulation of
plant architecture in Nicotiana sylvestris. Plant J 54:976-992.
Polesani M, Desario F, Ferrarini A, Zamboni A, Pezzotti M, Kortekamp A, Polverari
A. 2008. cDNA-AFLP analysis of plant and pathogen genes expressed in
grapevine infected with Plasmopara viticola. BMC Genomics 9:142.
Reijans M, Lascaris R, Groeneger AO, Wittenberg A, Wesselink E, van Oeveren J,
de Wit E, Boorsma A, Voetdijk B, Spek H van der, Grivell LA, Simons G.
2003. Quantitative comparison of cDNA-AFLP, microarrays, and GeneChip
expression data in Saccharomyces cerevisiae. Genomics 82:606-618.
Sakate R, Suto Y, Imanishi T, Tanoue T, Hida M, Hayasaka I, Kusuda J, Gojobori
T, Hashimoto K, Hirai M. 2007. Mapping of chimpanzee full-length cDNAs
90
CHAPTER III Eukaryotic transcriptomics in silico
onto the human genome unveils large potential divergence of the
transcriptome. Gene 399:1-10.
Sato K, Shin I, Seki M, Shinozaki K, Yoshida T, Takeda K, Conte M, Kohara Y.
2009. Development of 5006 full-length cDNAs in barley: a tool for accessing
cereal genomics resources. DNA Res 16:81-89.
Stothard P. 2000. The sequence manipulation suite: JavaScript programs for
analyzing and formatting protein and DNA sequences. Biotechniques
28:1102.
Subramanian S. 2008. Nearly neutrality and the evolution of codon usage bias in
eukaryotic genomes. Genetics 178:2429-2432.
Umezawa T, Sakurai T, Totoki Y, Toyoda A, Seki M, Ishiwata A, Akiyama K,
Kurotani A, Yoshida T, Mochida K, Kasuga M, Todaka D, Maruyama K,
Nakashima K, Enju A, Mizukado S, Ahmed S, Yoshiwara K, Harada K,
Tsubokura Y, Hayashi M, Sato S, Anai T, Ishimoto M, Funatsuki H, Teraishi
M, Osaki M, Shinano T, Akashi R, Sakaki Y, et al. 2008. Sequencing and
analysis of approximately 4000 soybean cDNA clones from a full-lengthenriched cDNA library. DNA Res 15:333-346.
Vos P, Hogers R, Bleeker M, Reijans M, Vandelee T, Hornes M, Frijters A, Pot J,
Peleman J, Kuiper M, Zabeau M. 1995. AFLP - A new technique for DNAfingerprinting. Nucleic Acids Res 23:4407-4414.
Vuylsteke M, Daele H Van Den, Vercauteren A, Zabeau M, Kuiper M. 2006.
Genetic dissection of transcriptional regulation by cDNA-AFLP. Plant J
45:439-446.
Wee CW, Lee SF, Robin C, Heckel DG. 2008. Identification of candidate genes for
fenvalerate resistance in Helicoverpa armigera using cDNA-AFLP. Insect
Mol Biol 17:351-360.
Weiberg A, Pöhler D, Morris J, Karlovsky P 2008. Improved coverage of cDNAAFLP by sequential digestion of immobilized cDNA. BMC Genomics 9:480.
Wheeler DL, Chappey C, Lash AE, Leipe DD, Madden TL, Schuler GD, Tatusova
TA, Rapp BA. 2000. Database resources of the National Center for
Biotechnology Information. Nucleic Acids Res 28:10-14.
Xu L, Chen H, Hu XH, Zhang RM, Zhang Z, Luo ZW. 2006. Average gene length
is highly conserved in prokaryotes and eukaryotes and diverges only
between the two kingdoms. Mol Biol Evol 23:1107-1108.
91
CHAPTER III Eukaryotic transcriptomics in silico
92
CHAPTER III Eukaryotic transcriptomics in silico
Table 1 Results of cDNA-AFLP screens from ten recent publications
TDFs are the number of transcript-derived fragments produced in each screen,
while PC indicates the number of primer combinations tested in each study. Mean
TDF indicates the average numbers of fragments generated per primer
combination, while Corr TDF identifies the number of transcript-derived fragments
that were found to be correlated to the trait under investigation. Restriction
enzymes (RE) listed in column RE1 are characterized by recognition sites of 6 bp,
while RE2 (here: MseI) is a 4 bp-cutter.
RE1
RE2
PC
TDFs
BstYI
BstYI
BstYI
BstYI
BstYI
EcoRI
EcoRI
EcoRI
HindIII
PstI
MseI
MseI
MseI
MseI
MseI
MseI
MseI
MseI
MseI
MseI
60
64
128
128
256
64
128
256
32
80
119.6
104.0
4000
3793
10440
7000
5900
3220
2269
12500
4320
1200
5464.2
4160.0
Average
Median
Mean
TDF
66.67
59.27
81.56
54.69
23.05
50.31
17.73
48.83
135.00
15.00
55.2
52.5
Corr.
TDF
63
213
223
1196
378
34
25
525
26
46
272.9
138.0
Reference
(Aquea et al. 2008)
(Muller et al. 2007)
(Pellny et al. 2008)
(Polesani et al. 2008)
(Huang et al. 2008)
(Miao et al. 2008)
(Hsu et al. 2008)
(Wee et al. 2008)
(Neveu et al. 2007)
(Pathan et al. 2007)
93
CHAPTER III Eukaryotic transcriptomics in silico
Table 2 The relative contribution of enzyme combinations to cDNA pool
coverage
Variance partitioning addressing the contribution of enzyme combination (28
combinations) on pool coverage for 92 eukaryotic species (see additional file 1).
Species was included as a random factor in a mixed model analysis which aimed
to determine the influence of individual factors or interactions (Source). cDNA pool
coverage was weighted by the number of sequences per species to account for
variation in available sequence data. The numerator and denominator (KenwardRoger corrected) degrees of freedom (Num df/Den df) are provided. F statistics (F)
and the significance (Sig.) of the overall model, factors and interactions are
reported. The proportion of the variation in cDNA pool coverage which is explained
by each factor/interaction is indicated as Partial R-square values (Edwards et al.
2008)
Source
Model
Total pool size (bp)
Average sequence length
GC content
Non-ACGT content
Enzyme combination
Enzyme combination*GC content
Num df
58
1
1
1
1
27
27
Den df
2248.56
85.40
86.29
86.60
84.49
2428.48
2428.48
F
134.76
14.25
52.87
34.89
0.05
199.26
112.38
Sig.
<0.001
<0.001
<0.001
<0.001
0.823
<0.001
<0.001
Partial R2
77.66
14.30
37.99
28.72
<0.01
68.90
55.55
94
CHAPTER III Eukaryotic transcriptomics in silico
Table 3 Average cDNA pool coverages by enzyme combination across 92
eukaryotes
Descriptive statistics on the average cDNA pool coverage obtained for each
enzyme combination across all 92 species (see additional file 1), sorted by
decreasing mean coverage. The average coverage by enzyme combination and
standard deviation (Coverage ± SD) are indicated, as are the minimum and
maximum cDNA pool coverages for individual enzyme combinations (Min-Max
Coverage). R-Square indicates the correlation coefficient for the relationship of
total cDNA pool size (Nbp) and the average number of fragments produced per
selective PCR (AF). The linear regression equation for this relationship is
indicated.
R2
Regression Equation
76.13 ± 10.51
Min-Max
Coverage
42.07 - 91.97
0.94
Nbp=1849399*AF+294835
72.55 ± 10.32
69.56 ± 13.62
66.63 ± 10.32
64.16 ± 13.93
63.20 ± 11.42
62.69 ± 14.23
62.00 ± 18.32
61.26 ± 14.41
58.28 ± 12.22
57.15 ± 12.86
55.70 ± 15.43
54.91 ± 11.08
54.86 ± 17.23
54.39 ± 14.73
54.14 ± 18.34
53.57 ± 19.96
53.54 ± 19.47
52.26 ± 13.47
49.93 ± 19.70
47.88 ± 19.79
47.76 ± 12.04
47.32 ± 20.70
46.22 ± 15.07
45.75 ± 15.11
45.05 ± 22.78
44.15 ± 20.69
39.00 ± 15.30
46.44 - 93.68
32.19 - 96.94
36.63 - 86.15
33.34 - 91.88
21.81 - 85.13
28.35 - 90.91
9.45 - 93.30
25.91 - 94.55
27.61 - 79.49
29.81 - 84.18
23.57 - 88.18
21.14 - 81.68
19.16 - 92.44
12.13 - 87.81
9.05 - 91.74
5.08 - 95.05
8.04 - 93.28
17.71 - 85.30
5.49 - 89.29
5.27 - 89.77
15.32 - 78.81
4.26 - 91.43
6.86 - 87.60
4.16 - 80.64
1.36 - 94.75
4.08 - 89.75
2.53 - 77.47
0.98
0.85
0.94
0.91
0.90
0.72
0.94
0.76
0.84
0.85
0.85
0.91
0.64
0.92
0.88
0.85
0.72
0.80
0.79
0.79
0.93
0.63
0.84
0.92
0.78
0.71
0.89
Nbp=1924913*AF+1067365
Nbp=2152800*AF+933639
Nbp=2731950*AF-862614
Nbp=2309466*AF+1759142
Nbp=2306663*AF+3307692
Nbp=2995858*AF+626737
Nbp=1890564*AF+3666024
Nbp=2726475*AF+2079328
Nbp=2852998*AF+2622539
Nbp=3630319*AF-565133
Nbp=3156237*AF+1906975
Nbp=3400108*AF+2063017
Nbp=2762584*AF+4754785
Nbp=3607697*AF+484514
Nbp=2623528*AF+3657451
Nbp=2260683*AF+4996193
Nbp=2433331*AF+5040020
Nbp=4183276*AF+518528
Nbp=2690086*AF+4940474
Nbp=2909507*AF+5271739
Nbp=4923589*AF-278386
Nbp=2600056*AF+7269281
Nbp=4211767*AF+2594577
Nbp=4048888*AF+3106105
Nbp=2272295*AF+6925901
Nbp=2937393*AF+6703632
Nbp=5159080*AF+3260514
Enzyme
Combination
MseI & CviAII
Coverage ± SD
CviAII & CviQI
CviAII & TaqI
MseI & CviQI
CviAII & MaeII
MaeI & CviAII
MseI & TaqI
HpaII & CviAII
TaqI & CviQI
MseI & MaeI
MseI & MaeII
MaeII & CviQI
MaeI & CviQI
TaqI & MaeII
HpaII & MseI
HpaII & CviQI
HinP1I & CviAII
HpaII & TaqI
MaeI & TaqI
HpaII & MaeII
HinP1I & CviQI
MaeI & MaeII
HinP1I & TaqI
HinP1I & MseI
HpaII & MaeI
HinP1I & HpaII
HinP1I & MaeII
HinP1I & MaeI
95
CHAPTER III Eukaryotic transcriptomics in silico
Table 4 Effects of individual restriction enzymes on cDNA-pool coverage
The effects of individual restriction enzymes on cDNA-pool coverage, based on all
92 species (Table 3; see additional file 1). The percentage of total cDNA pool
coverage explained by each enzyme has been estimated. The degrees of freedom
(df) of each factor included in the model (source) are indicated. Enzymes are
sorted by decreasing coverage, and restriction sites of each restriction enzyme are
listed. Details on the significance of each factor (Sig.) in this analysis and
corresponding F-statistics are given (see Methods).
Source (Restriction Site)
df
SS I
F
Sig.
CviAII (C^ATG)
MseI (T^TAA)
CviQI (G^TAC)
TaqI (T^CGA)
MaeI (C^TAG)
MaeII (A^CGT)
HpaII (C^CGG)
HinP1I (G^CGC)
Enzyme combination
1
1
1
1
1
1
1
1
20
121.08
153.42
69.09
52.69
63.15
86.56
136.20
137.28
0.78
4806.32
6090.19
2742.53
2091.52
2506.75
3436.05
5406.74
5449.32
1.55
<0.001
<0.001
<0.001
<0.001
<0.001
<0.001
<0.001
<0.001
0.056
Coverage
Estimate
43.63
32.49
31.06
30.20
25.79
24.66
23.34
17.12
n/a
96
CHAPTER III Eukaryotic transcriptomics in silico
Table 5 Effects of taxonomic grouping and enzyme combination on pool
coverage
Variance partitioning addressing the influence of enzyme combination (28
combinations) and taxonomic grouping on pool coverage for 68 species (see
additional file 2). Species was included as a random factor and cDNA pool
coverage was weighted by the number of sequences per species to account for
variation in available sequence data. Denominator degrees of freedom were
Kenward-Roger corrected. Partial R-square indicates the proportion of the
variation in cDNA pool coverage which is explained by each factor/interaction
(Edwards et al. 2008).
Source
Model
Taxonomic group
Total pool size (bp)
Average sequence length
GC content
Non-ACGT content
Enzyme combination
Enzyme combination * GC content
Enzyme combination * Taxonomic group
Num df
254
7
1
1
1
1
27
27
189
Den df
1485.02
57.37
55.88
56.31
56.56
56.59
1593.69
1593.69
1593.69
F
87.57
13.48
5.00
66.16
12.12
0.75
230.17
142.71
21.05
Sig.
<0.001
<0.001
0.029
<0.001
0.001
0.389
<0.001
<0.001
<0.001
Partial
R2
93.74
62.19
8.22
54.02
17.65
1.31
79.59
70.74
71.40
97
CHAPTER III Eukaryotic transcriptomics in silico
Figure 1 A positive relationship between cDNA pool size and the number of
fragments per PCR.
Linear regressions of average fragment numbers produced during in silico
selective cDNA-AFLP PCRs against the absolute cDNA pool size in bp. Symbols
indicate the average fragment numbers produced per enzyme combination and
species for selective amplifications using 2 × 2 (diamonds), 2 × 3 (crosses) and 3
× 3 (pluses) selective base pairs, respectively. Duplicate species have been
removed from this analysis. The numbers of selective base pairs used for each
primer in the selective PCR are indicated, and regression lines have been added
for each of the three amplification types. The correlation coefficient for each of the
three datasets is 0.74. The production of fewer than 20 fragments per PCR
minimizes the possibility of collisions (Gort et al. 2006), while up to 100 fragments
per reaction are often desired when performing AFLP on genomic DNA (Vos et al.
1995). A maximum of 450 fragments can be separated in the typical size range of
AFLP screens (50-500 bp). Vertical reference lines indicate the total cDNA pool
size range expected in a typical tissue expressing between 7500 and 15000
different cDNAs (Carter et al. 2005) assuming an average cDNA length of 1346 bp
(Xu et al. 2006).
98
CHAPTER III Eukaryotic transcriptomics in silico
Figure 2 Empirical cDNA-AFLP data are highly structured.
Patterning of cDNA-AFLP data. A and B: Patterning of complete arrays of
selective PCR amplifications using CviAII and MseI restriction enzymes for (A)
simulated random DNA, (B) simulated cDNA (following the standard eukaryotic
codon table; Stothard 2000), and (C) Homo sapiens cDNA. 10000 sequences of
1290 bp were simulated for both the DNA and cDNA datasets. Pixel intensity
reflects the relative proportion of products obtained during selective in silico PCR.
Pixels are ordered by selective base pairs: AAA (left, top) to TTT (bottom, right).
White pixels indicate that no fragments were generated for this combination of
selective base pairs.
99
CHAPTER III Eukaryotic transcriptomics in silico
Figure 3 Characteristic cDNA-AFLP patterns are generated by individual
restriction enzymes.
Overview of the Homo sapiens selective cDNA-AFLP PCR arrays for all enzyme
combinations tested here. The layout of arrays follows Figure 2. Note the
consistent patterning of arrays, with characteristic ridges and trenches for enzyme
combinations which contain the same enzyme. Arrays above the diagonal are
mirror images of those below the diagonal. Selective primer combinations yielding
no amplifications are highlighted in white. The pixel intensity indicates the relative
proportion of fragments amplified in a given selective PCR combination.
100
CHAPTER III Eukaryotic transcriptomics in silico
Figure 4 cDNA-AFLP patterning is consistent across all eukaryotes.
Arrays of all possible cDNA-AFLP selective PCR combinations for the best (A-F)
and worst (G-L) restriction enzyme combinations. Six species per enzyme
combination are included. A-F restriction enzymes CviAII and MseI, G-L restriction
enzymes
HinP1I
and
MaeI.
A/G
Arabidopsis
thaliana,
B/H
Drosophila
melanogaster, C/I Gallus gallus, D/J Gasterosteus aculeatus, E/K Homo sapiens,
F/L Xenopus laevis. Arrowheads pointing to white areas in the arrays indicate
primer combinations with GCN-selective base pair motifs, which fail to produce
any fragments in a cDNA-AFLP screen with these enzymes (see Discussion).
101
CHAPTER III Eukaryotic transcriptomics in silico
Additional file 1 - General information for each species
General information for each of the 92 eukaryotic species included in the present study. Source identifies the database from which
sequence pools were derived. The number of sequences included in each pool (N Seq) and the total pool size in base pairs (bp) are
indicated. Avg Seq Lgt reports on the average sequence length, % GC indicates the percentage of GC nucleotides and Non-ACGT
states the proportion of ambiguous nucleotides in each pool. Coverage ± SD reports the average percent coverage obtained across
all 28 combinations of 8 tested restriction enzymes. The enzyme combination that provided the deepest cDNA pool coverage is
indicated for each species.
Species
Source
N Seq
Total pool
size (bp)
Avg Seq
Lgt
% GC
NonACGT
Coverage ± SD
Min-Max
coverage
Best
Combination
Acrythosiphon pisum
NCBI
6557
4044893
616.88
33.09
0.02
38.73 ± 15.71
16.03 - 70.95
MseI - CviQI
Aedes aegypti
Anopheles gambiae
ENSEMBL
ENSEMBL
18061
13133
27616123
20879537
1529.05
1589.85
47.98
55.26
0.02
0
74.92 ± 7.17
78.05 ± 12.71
59.49 - 85.72
49.41 - 92.32
HpaII - TaqI
TaqI - CviQI
Apis mellifera
NCBI
9791
13386956
1367.27
37.15
0.02
54.04 ± 15.89
28.75 - 79.91
MseI - TaqI
Aquilegia formosa x pubescens
NCBI
8065
7359417
912.51
41
0
51.88 ± 21.58
17.15 - 91.97
MseI - CviAII
Arabidopsis thaliana
Bombyx mori
Bos taurus
Branchiostoma floridae
Brassica napus
Caenorhabditis elegans
Canis familiaris
Chlamydomonas reinhardtii
Ciona intestinalis
Ciona savignyi
Citrus clementina
Citrus sinensis
Coccidioides posadasii
Danio rerio
NCBI
29974
9939
28958
11507
26287
28981
27301
11276
19858
20359
6107
9699
3994
31841
43315662
7662004
49808680
8085133
20322912
40353676
42169482
16939170
29064597
32691732
6788422
7370218
3776554
51017126
1445.11
770.9
1720.03
702.63
773.12
1392.42
1544.61
1502.23
1463.62
1605.76
1111.58
759.89
945.56
1602.25
42.16
39.02
52.5
41.81
44.99
42.34
51.89
63.71
41.6
44.98
44.43
41.84
49.82
48.09
0.02
0.1
0.01
0.25
0.17
0
0
0.02
0
0
0.06
0.06
0
0
67.76 ± 14.26
56.14 ± 11.90
61.64 ± 7.63
45.71 ± 17.69
59.90 ± 11.75
63.29 ± 13.18
59.50 ± 8.84
73.22 ± 16.24
64.88 ± 13.73
71.86 ± 10.99
63.58 ± 11.26
48.11 ± 14.69
76.32 ± 8.47
67.11 ± 8.90
41.39 - 88.45
35.87 - 77.49
49.56 - 79.20
23.53 - 84.70
38.83 - 80.12
34.74 - 84.00
46.10 - 80.16
40.40 - 95.05
39.04 - 90.20
48.09 - 88.73
44.20 - 88.83
25.29 - 82.75
60.49 - 93.54
50.64 - 84.63
MseI - CviAII
MseI - CviQI
CviAII - CviQI
CviAII - CviQI
MseI - CviAII
CviAII - TaqI
CviAII - CviQI
HinP1I - CviAII
MseI - CviAII
MseI - CviAII
MseI - CviAII
MseI - CviAII
CviAII - TaqI
MseI - CviAII
NCBI
ENSEMBL
NCBI
NCBI
ENSEMBL
ENSEMBL
NCBI
ENSEMBL
ENSEMBL
NCBI
NCBI
NCBI
ENSEMBL
102
CHAPTER III Eukaryotic transcriptomics in silico
Dictyostelium discoideum
Drosophila melanogaster
Equus caballus
Felis catus
Filobasidiella neoformans
Fundulus heteroclitus
Gadus morhua
Gallus gallus
Gasterosteus aculeatus
Gibberella moniliformis
Glycine max
Gossypium hirsutum
Gossypium raimondii
Helianthus annuus
Homo sapiens
Hordeum vulgare
Hydra magnipapillata
Lactuca sativa
Lotus japonicus
NCBI
Macaca fascicularis
Macaca mulatta
Malus x domestica
Medicago truncatula
Meleagris gallopavo
Molgula tectiformis
Monodelphis domestica
NCBI
Mus musculus
Neurospora crassa
Nicotiana tabacum
Oncorhynchus mykiss
Ornithorhynchus anatinus
Oryctolagus cuniculus
Oryza sativa
Oryzias latipes
Ovis aries
Pan troglodytes
Paracentrotus lividus
Paramecium tetraurelia
ENSEMBL
ENSEMBL
ENSEMBL
ENSEMBL
NCBI
NCBI
NCBI
ENSEMBL
ENSEMBL
NCBI
NCBI
NCBI
NCBI
NCBI
ENSEMBL
NCBI
NCBI
NCBI
NCBI
ENSEMBL
NCBI
NCBI
NCBI
NCBI
ENSEMBL
NCBI
NCBI
NCBI
ENSEMBL
NCBI
NCBI
ENSEMBL
NCBI
ENSEMBL
NCBI
NCBI
5960
20909
27192
15993
3559
4573
10792
22291
27629
5259
24518
16404
3295
7969
48803
22853
10923
7848
13659
4195845
48315668
46568281
20792059
7052090
3367792
7919862
39792561
45847847
4752592
17344657
12887278
2698120
5407728
125500000
20147314
7092578
6566967
7282469
704
2310.76
1712.57
1300.07
1981.48
736.45
733.86
1785.14
1659.41
903.71
707.43
785.62
818.85
678.6
2571.64
881.6
649.33
836.77
533.16
29.36
49.91
50.03
53.89
50.33
47.39
43.2
48.61
55.02
51.71
41.21
42.98
43.93
42.8
49.68
51.19
32.88
42.92
42.23
0.29
0
0
0
0
0.55
0.04
0
0
0
0.43
0.05
0.02
0.07
0
0.22
0.05
0.05
0.11
22.42 ± 19.10
84.67 ± 6.18
56.74 ± 8.04
54.92 ± 9.45
86.26 ± 6.26
48.34 ± 12.03
52.86 ± 13.68
61.38 ± 9.22
70.69 ± 15.89
68.29 ± 13.27
40.93 ± 16.26
51.70 ± 16.22
53.46 ± 17.15
50.47 ± 13.71
71.73 ± 6.9
63.14 ± 7.96
35.29 ± 17.12
54.32 ± 16.68
33.12 ± 13.89
1.36 - 65.32
71.79 - 92.33
42.77 - 75.27
39.87 - 74.44
70.86 - 96.94
25.39 - 72.12
30.47 - 84.51
43.79 - 81.48
39.48 - 89.39
41.51 - 93.61
17.90 - 80.96
24.66 - 85.10
23.70 - 87.95
27.42 - 79.57
61.95 - 85.59
49.55 - 79.50
9.79 - 75.38
27.13 - 86.96
14.84 - 71.72
MseI - CviAII
CviAII - TaqI
CviAII - CviQI
HpaII - CviAII
CviAII - TaqI
MseI - CviAII
MseI - CviAII
CviAII - CviQI
HpaII - CviAII
CviAII - TaqI
MseI - CviAII
MseI - CviAII
MseI - CviAII
MseI - CviAII
CviAII - CviQI
CviAII - TaqI
MseI - CviAII
MseI - CviAII
MseI - CviAII
10799
38146
16913
17785
960
8534
33279
17252467
70430633
10632914
12924130
679555
6725171
57497869
1597.6
1846.34
628.68
726.69
707.87
788.04
1727.75
45.93
50.36
44.88
39.72
47.42
35.42
48.1
0.04
0.01
0.07
0.39
0.08
0.32
0
64.36 ± 11.38
62.24 ± 7.45
46.35 ± 11.43
43.07 ± 17.13
38.07 ± 12.05
47.35 ± 17.86
58.51 ± 11.68
46.16 - 88.40
52.42 - 78.74
27.74 - 70.45
17.03 - 83.13
17.71 - 69.48
21.69 - 88.73
38.49 - 83.06
MseI - CviAII
CviAII - CviQI
MseI - CviAII
MseI - CviAII
CviAII - CviQI
MseI - CviAII
CviAII - CviQI
40959
2209
13207
25264
27383
6517
40742
24662
12195
34009
8664
14325
99678366
1269530
10073670
21635734
37194655
5377786
62731750
38325234
9682040
78022597
7473899
18863127
2433.61
574.71
762.75
856.39
1358.31
825.19
1539.73
1554.02
793.94
2294.17
862.64
1316.8
49.98
51.57
41.46
45.1
53.33
49.96
50.75
52.36
50.36
49.5
43.09
31.58
0
0.13
0.28
0.6
0.01
0.02
0.09
0.01
0.01
0.01
0.31
0.13
71.96 ± 7.36
48.56 ± 11.72
46.96 ± 15.63
50.12 ± 14.27
59.13 ± 10.3
39.71 ± 8.82
72.75 ± 6.63
65.66 ± 12.19
46.76 ± 9.72
68.47 ± 7.09
54.75 ± 15.93
34.66 ± 27.14
60.58 - 87.00
27.61 - 71.48
21.71 - 80.91
28.64 - 82.10
40.07 - 79.33
26.21 - 61.49
60.58 - 86.03
44.21 - 82.86
32.96 - 67.61
59.02 - 83.68
25.67 - 83.55
1.85 - 84.64
CviAII - CviQI
CviAII - TaqI
MseI - CviAII
MseI - CviAII
HpaII - CviAII
MseI - CviAII
CviAII - TaqI
HpaII - CviAII
CviAII - CviQI
CviAII - CviQI
CviAII - CviQI
MseI - CviAII
103
CHAPTER III Eukaryotic transcriptomics in silico
Petromyzon marinus
Phaeodactylum tricornutum
Physcomitrella patens
Phytophtora infestans
Picea glauca
Picea sitchensis
Pimephales promelas
NCBI
Pinus taeda
Pongo pygmaeus
Populus balsamifera
Populus tremula x tremuloides
Populus trichocarpa
Prunus persica
Rattus norvegicus
Saccharomyces cerevisiae
Saccharum officinarum
Salmo salar
Schistosoma japonicum
Schistosoma mansoni
Solanum lycopersicum
Solanum tuberosum
Sorghum bicolor
NCBI
Strongylocentrus purpuratus
Sus scrofa
Taeniopygia guttata
NCBI
Takifugu rubripes
Tetraodon nigroviridis
Toxoplasma gondii
ENSEMBL
Tribolium castaneum
Trichosurus vulpecula
Triticum aestivum
NCBI
Vitis vinifera
Xenopus laevis
Xenopus tropicalis
NCBI
Zea mays
8512
6772
17973
7270
17812
15699
22442
5620756
6808242
14198438
4996923
13565571
11905367
17900531
660.33
1005.35
789.99
687.33
761.6
758.35
797.64
47.53
50.42
47.78
52.75
40.63
42.55
44.3
0.01
0.08
0.1
0.39
0.64
0
0.04
55.32 ± 11.29
77.59 ± 12.06
63.70 ± 8.68
70.99 ± 9.98
45.90 ± 16.11
48.28 ± 13.53
51.01 ± 12.26
33.13 - 74.02
49.79 - 92.76
50.87 - 85.28
51.38 - 85.24
23.70 - 85.03
29.91 - 80.79
31.59 - 83.62
MseI - CviAII
HpaII - TaqI
CviAII - TaqI
CviAII - TaqI
MseI – CviAII
MseI - CviAII
MseI - CviAII
18938
24431
11310
7853
14059
7062
34704
6698
15592
29722
9107
9172
17849
19671
13984
15068523
43871572
8229010
4925686
10473626
4677442
60508280
9056373
12706205
22077976
8309606
5822751
15412230
15691567
9709132
795.68
1795.73
727.59
627.24
744.98
662.34
1743.55
1352.1
814.92
742.82
912.44
634.84
863.48
797.7
694.3
43.97
50.25
41.07
42.47
40.93
42.5
51.1
39.61
50.56
43.34
35.01
36.94
40.55
40.98
51.83
0.14
0.01
0
0.04
0
0.12
0.01
0
0.36
0.01
0.09
0.2
0.27
0.02
0.02
52.19 ± 12.79
58.88 ± 7.50
44.05 ± 16.84
41.13 ± 15.09
44.54 ± 17.14
41.86 ± 13.31
62.60 ± 7.74
64.49 ± 11.14
61.23 ± 8.57
44.02 ± 16.83
55.09 ± 21.10
45.46 ± 19.22
47.90 ± 16.61
48.51 ± 16.99
55.05 ± 9.62
33.39 - 82.41
47.64 - 75.85
19.09 - 83.79
17.80 - 76.91
18.67 - 84.12
21.81 - 74.45
51.83 - 81.13
38.85 - 80.01
44.90 - 77.28
21.51 - 82.16
18.79 - 87.44
14.11 - 75.24
20.62 - 81.69
21.89 - 83.79
37.25 - 74.96
MseI - CviAII
CviAII - CviQI
MseI - CviAII
MseI - CviAII
MseI - CviAII
MseI - CviAII
CviAII - CviQI
MseI - CviAII
CviAII - TaqI
MseI - CviAII
MseI - CviAII
MseI - CviAII
MseI - CviAII
MseI - CviAII
CviAII - TaqI
19625
51706
11227
28042628
42874695
8347852
1428.92
829.2
743.55
43.49
47.29
44.55
0.25
0.09
0.31
62.47 ± 13.54
45.12 ± 10.95
34.33 ± 15.64
39.96 - 88.61
31.94 - 73.95
17.67 - 77.69
MseI - CviAII
MseI - CviAII
MseI - CviAII
48027
27991
6623
91791931
37821073
4448416
1911.26
1351.19
671.66
53.96
55.1
52.16
0
0.43
0.16
72.10 ± 14.78
55.53 ± 13.30
52.63 ± 13.45
43.41 - 88.88
30.89 - 73.81
27.92 - 74.47
HpaII - CviAII
HpaII - CviAII
HinP1I - TaqI
9013
11757
41358
12745306
9654352
31737158
1414.1
821.16
767.38
44.63
40.68
50.47
0.62
0.73
0.86
69.83 ± 7.73
36.91 ± 22.28
60.12 ± 7.92
52.41 - 82.41
11.89 - 86.68
46.51 - 76.64
HpaII - MseI
MseI - CviAII
CviAII - TaqI
ENSEMBL
23129
35518
27711
17999693
45020703
45111427
778.23
1267.55
1627.92
42.64
42.92
46.38
0.14
0.54
0
45.08 ± 14.72
54.19 ± 13.31
62.21 ± 9.92
22.05 - 80.78
34.31 - 86.97
47.74 - 84.39
MseI - CviAII
MseI - CviAII
CviAII - CviQI
NCBI
57495
32228704
560.55
50.58
0.52
38.74 ± 4.90
29.81 - 48.70
CviAII - TaqI
NCBI
NCBI
NCBI
NCBI
NCBI
NCBI
ENSEMBL
NCBI
NCBI
NCBI
NCBI
ENSEMBL
ENSEMBL
NCBI
NCBI
NCBI
NCBI
NCBI
NCBI
NCBI
NCBI
NCBI
ENSEMBL
NCBI
NCBI
NCBI
NCBI
104
CHAPTER III Eukaryotic transcriptomics in silico
Additional file 2 - Species composition of taxonomic groups
Taxonomic groupings for the 68 eukaryotic species derived from eight taxonomic groups with three or more representatives. Tax
group indicates the taxonomic group (according to NCBI Taxonomy browser). The number of sequences (N Seq), the total pool size
(in base pairs), average sequence length (Avg Seq Lgt) and GC content (% GC) are shown. Average coverage ( SD), minimum
and maximum coverage, along with the enzyme combination resulting in the deepest cDNA pool coverage for each species are
indicated.
Tax Group
Species
Source
N
Seq
Total pool
size (bp)
%
GC
Coverage ± SD
Min-Max Cov.
Best
Combination
51017126
Avg
Seq
Lgt
1602.25
Actinopterygii
Danio rerio
ENSEMBL
31841
48.09
67.11 ± 8.90
50.64 - 84.63
MseI - CviAII
Actinopterygii
Fundulus heteroclitus
NCBI
4573
3367792
736.45
47.39
48.34 ± 12.03
25.39 - 72.12
MseI - CviAII
Actinopterygii
Gadus morhua
NCBI
10792
7919862
733.86
43.2
52.86 ± 13.69
30.47 - 84.51
MseI - CviAII
Actinopterygii
Gasterosteus aculeatus
ENSEMBL
27629
45847847
1659.41
55.02
70.69 ± 15.89
39.48 - 89.39
HpaII - CviAII
Actinopterygii
Oncorhynchus mykiss
NCBI
25264
21635734
856.39
45.1
50.12 ± 14.27
28.64 - 82.10
MseI - CviAII
Actinopterygii
Oryzias latipes
ENSEMBL
24662
38325234
1554.02
52.36
65.66 ± 12.19
44.21 - 82.86
HpaII - CviAII
Actinopterygii
Pimephales promelas
NCBI
22442
17900531
797.64
44.3
51.01 ± 12.26
31.59 - 83.62
MseI - CviAII
Actinopterygii
Salmo salar
NCBI
29722
22077976
742.82
43.34
44.02 ± 16.83
21.51 - 82.16
MseI - CviAII
Actinopterygii
Takifugu rubripes
ENSEMBL
48027
91791931
1911.26
53.96
72.10 ± 14.78
43.41 - 88.88
HpaII - CviAII
Actinopterygii
Tetraodon nigroviridis
ENSEMBL
27991
37821073
1351.19
55.1
55.53 ± 13.30
30.89 - 73.81
HpaII - CviAII
25294
33770511
1194.53
48.79
57.74 ± 16.50
21.51 - 89.39
Avg. Actinopterygii (N=10)
Ascidiaceae
Ciona intestinalis
ENSEMBL
19858
29064597
1463.62
41.6
64.88 ± 13.73
39.04 - 90.20
MseI - CviAII
Ascidiaceae
Ciona savignyi
ENSEMBL
20359
32691732
1605.76
44.98
71.86 ± 10.99
48.09 - 88.73
MseI - CviAII
Ascidiaceae
Molgula tectiformis
NCBI
8534
6725171
788.04
35.42
47.35 ± 17.86
21.69 - 88.73
MseI - CviAII
16250
22827167
1285.81
40.67
61.36 ± 17.66
21.69 - 90.20
22291
39792561
1785.14
48.61
61.38 ± 9.22
43.79 - 81.48
Avg. Ascidiaceae (N=3)
Aves
Gallus gallus
ENSEMBL
CviAII - CviQI
105
CHAPTER III Eukaryotic transcriptomics in silico
Aves
Meleagris gallopavo
NCBI
960
679555
707.87
47.42
38.07 ± 12.05
17.71 - 69.48
CviAII - CviQI
Aves
Taeniopygia guttata
NCBI
11227
8347852
743.55
44.55
34.33 ± 15.64
17.67 - 77.69
MseI - CviAII
11493
16273323
1078.85
46.86
44.59 ± 17.31
17.67 - 81.48
Avg. Aves (N=3)
Coniferopsida
Picea glauca
NCBI
17812
13565571
761.6
40.63
45.90 ± 16.11
23.70 - 85.03
MseI - CviAII
Coniferopsida
Picea sitchensis
NCBI
15699
11905367
758.35
42.55
48.28 ± 13.53
29.91 - 80.79
MseI - CviAII
Coniferopsida
Pinus taeda
NCBI
18938
15068523
795.68
43.97
52.19 ± 12.79
33.39 - 82.41
MseI - CviAII
17483
13513154
771.88
42.38
48.79 ± 14.29
23.70 - 85.03
Avg. Coniferopsida (N=3)
Insecta
Acrythosiphon pisum
NCBI
6557
4044893
616.88
33.09
38.73 ± 15.71
16.03 - 70.95
MseI - CviQI
Insecta
Aedes aegypti
ENSEMBL
18061
27616123
1529.05
47.98
74.92 ± 7.17
59.49 - 85.72
HpaII - TaqI
Insecta
Anopheles gambiae
ENSEMBL
13133
20879537
1589.85
55.26
78.05 ± 12.71
49.41 - 92.32
TaqI - CviQI
Insecta
Apis mellifera
NCBI
9791
13386956
1367.27
37.15
54.04 ± 15.89
28.75 - 79.91
MseI - TaqI
Insecta
Bombyx mori
NCBI
9939
7662004
770.9
39.02
56.14 ± 11.90
35.87 - 77.49
MseI - CviQI
Insecta
Drosophila melanogaster
ENSEMBL
20909
48315668
2310.76
49.91
84.67 ± 6.18
71.79 - 92.33
CviAII - TaqI
Insecta
Tribolium castaneum
NCBI
9013
12745306
1414.1
44.63
69.83 ± 7.73
52.41 - 82.41
HpaII - MseI
12486
19235784
1371.26
43.86
65.20 ± 18.89
16.03 - 92.33
Avg. Insecta (N=7)
Liliopsida
Hordeum vulgare
NCBI
22853
20147314
881.6
51.19
63.14 ± 7.96
49.55 - 79.50
CviAII - TaqI
Liliopsida
Oryza sativa
NCBI
40742
62731750
1539.73
50.75
72.75 ± 6.63
60.58 - 86.03
CviAII - TaqI
Liliopsida
Saccharum officinarum
NCBI
15592
12706205
814.92
50.56
61.23 ± 8.57
44.90 - 77.28
CviAII - TaqI
Liliopsida
Sorghum bicolor
NCBI
13984
9709132
694.3
51.83
55.05 ± 9.62
37.25 - 74.96
CviAII - TaqI
Liliopsida
Triticum aestivum
NCBI
41358
31737158
767.38
50.47
60.12 ± 7.92
46.51 - 76.64
CviAII - TaqI
Liliopsida
Zea mays
NCBI
57495
32228704
560.55
50.58
38.74 ± 4.90
29.81 - 48.70
CviAII - TaqI
32004
28210044
876.41
50.9
58.51 ± 12.85
29.81 - 86.03
Avg. Liliopsida (N=6)
Mammalia
Bos taurus
ENSEMBL
28958
49808680
1720.03
52.5
61.64 ± 7.63
49.56 - 79.20
CviAII - CviQI
Mammalia
Canis familiaris
ENSEMBL
27301
42169482
1544.61
51.89
59.50 ± 8.84
46.10 - 80.16
CviAII - CviQI
Mammalia
Equus caballus
ENSEMBL
27192
46568281
1712.57
50.03
56.74 ± 8.04
42.77 - 75.27
CviAII - CviQI
Mammalia
Felis catus
ENSEMBL
15993
20792059
1300.07
53.89
54.92 ± 9.45
39.87 - 74.44
HpaII - CviAII
106
CHAPTER III Eukaryotic transcriptomics in silico
Mammalia
Homo sapiens
ENSEMBL
48803
125500000
2571.64
49.68
71.73 ± 6.90
61.95 - 85.59
CviAII - CviQI
Mammalia
Macaca fascicularis
NCBI
10799
17252467
1597.6
45.93
64.36 ± 11.38
46.16 - 88.40
MseI - CviAII
Mammalia
Macaca mulatta
ENSEMBL
38146
70430633
1846.34
50.36
62.24 ± 7.45
52.42 - 78.74
CviAII - CviQI
Mammalia
Monodelphis domestica
ENSEMBL
33279
57497869
1727.75
48.1
58.51 ± 11.68
38.49 - 83.06
CviAII - CviQI
Mammalia
Mus musculus
ENSEMBL
40959
99678366
2433.61
49.98
71.96 ± 7.36
60.58 – 87.00
CviAII - CviQI
Mammalia
Ornithorhynchus anatinus
ENSEMBL
27383
37194655
1358.31
53.33
59.13 ± 10.30
40.07 - 79.33
HpaII - CviAII
Mammalia
Oryctolagus cuniculus
NCBI
6517
5377786
825.19
49.96
39.71 ± 8.82
26.21 - 61.49
MseI - CviAII
Mammalia
Ovis aries
NCBI
12195
9682040
793.94
50.36
46.76 ± 9.72
32.96 - 67.61
CviAII - CviQI
Mammalia
Pan troglodytes
ENSEMBL
34009
78022597
2294.17
49.5
68.47 ± 7.09
59.02 - 83.68
CviAII - CviQI
Mammalia
Pongo pygmaeus
ENSEMBL
24431
43871572
1795.73
50.25
58.88 ± 7.50
47.64 - 75.85
CviAII - CviQI
Mammalia
Rattus norvegicus
ENSEMBL
34704
60508280
1743.55
51.1
62.60 ± 7.74
51.83 - 81.13
CviAII - CviQI
Mammalia
Sus scrofa
NCBI
51706
42874695
829.2
47.29
45.12 ± 10.95
31.94 - 73.95
MseI - CviAII
Mammalia
Trichosurus vulpecula
NCBI
11757
9654352
821.16
40.68
36.91 ± 22.28
11.89 - 86.68
MseI - CviAII
27890
48051989
1583.26
49.7
57.60 ± 14.12
11.89 - 88.40
Avg. Mammalia (N=17)
Streptophyta
Arabidopsis thaliana
NCBI
29974
43315662
1445.11
42.16
67.76 ± 14.26
41.39 - 88.45
MseI - CviAII
Streptophyta
Brassica napus
NCBI
26287
20322912
773.12
44.99
59.90 ± 11.75
38.83 - 80.12
MseI - CviAII
Streptophyta
Citrus clementina
NCBI
6107
6788422
1111.58
44.43
63.58 ± 11.26
44.20 - 88.83
MseI - CviAII
Streptophyta
Citrus sinensis
NCBI
9699
7370218
759.89
41.84
48.11 ± 14.69
25.29 - 82.75
MseI - CviAII
Streptophyta
Glycine max
NCBI
24518
17344657
707.43
41.21
40.94 ± 16.26
17.90 - 80.96
MseI - CviAII
Streptophyta
Gossypium hirsutum
NCBI
16404
12887278
785.62
42.98
51.70 ± 16.22
24.66 - 85.10
MseI - CviAII
Streptophyta
Gossypium raimondii
NCBI
3295
2698120
818.85
43.93
53.46 ± 17.15
23.70 - 87.95
MseI - CviAII
Streptophyta
Helianthus annuus
NCBI
7969
5407728
678.6
42.8
50.47 ± 13.71
27.42 - 79.57
MseI - CviAII
Streptophyta
Lactuca sativa
NCBI
7848
6566967
836.77
42.92
54.32 ± 16.68
27.13 - 86.96
MseI - CviAII
Streptophyta
Lotus japonicus
NCBI
13659
7282469
533.16
42.23
33.12 ± 13.89
14.84 - 71.72
MseI - CviAII
Streptophyta
Malus x domestica
NCBI
16913
10632914
628.68
44.88
46.35 ± 11.43
27.74 - 70.45
MseI - CviAII
Streptophyta
Medicago truncatula
NCBI
17785
12924130
726.69
39.72
43.07 ± 17.13
17.03 - 83.13
MseI - CviAII
107
CHAPTER III Eukaryotic transcriptomics in silico
Streptophyta
Nicotiana tabacum
NCBI
13207
10073670
762.75
41.46
46.96 ± 15.63
21.71 - 80.91
MseI - CviAII
Streptophyta
Populus balsamifera
NCBI
11310
8229010
727.59
41.07
44.05 ± 16.84
19.09 - 83.79
MseI - CviAII
Streptophyta
Populus
tremuloides
NCBI
7853
4925686
627.24
42.47
41.13 ± 15.10
17.80 - 76.91
MseI - CviAII
Streptophyta
Populus trichocarpa
NCBI
14059
10473626
744.98
40.93
44.54 ± 17.14
18.67 - 84.12
MseI - CviAII
Streptophyta
Prunus persica
NCBI
7062
4677442
662.34
42.5
41.86 ± 13.31
21.81 - 74.45
MseI - CviAII
Streptophyta
Solanum lycopersicum
NCBI
17849
15412230
863.48
40.55
47.90 ± 16.61
20.62 - 81.69
MseI - CviAII
Streptophyta
Solanum tuberosum
NCBI
19671
15691567
797.7
40.98
48.51 ± 16.99
21.89 - 83.79
MseI - CviAII
14288
11738143
789.03
42.32
48.83 ± 17.01
14.84 - 88.83
Avg. Streptophyta (N=19)
tremula
x
108
CHAPTER III Eukaryotic transcriptomics in silico
Additional file 3 - Duplicate species from ENSEMBL and NCBI databases
Duplicate species from the ENSEMBL and NCBI databases. Average sequence length (Avg Seq Lgt), organismal GC-content (%
GC) and the percentage of ambiguous base pairs (% non-ACGT) are indicated. The average pool coverage per enzyme
combination, along with maximum and minimum coverage values, are shown.
Database
ENSEMBL
NCBI
Species
N Seq
Total pool
size (bp)
Avg
Seq
Lgt
% GC
%c
NonACGT
Coverage ±
SD
Min-Max
Cov.
N Seq
Total pool
size (bp)
Avg
Seq
Lgt
% GC
%
NonACGT
Coverage ±
SD
Min-Max
Cov.
Aedes aegypti
18061
27616123
1529.1
48.0
0.02
74.9 ± 7.2
59.5 - 85.7
19204
25218464
1313.2
46.4
0.07
72.1 ± 6.5
56.8 - 83.2
Anopheles gambiae
13133
20879537
1589.9
55.3
0.19
78.1 ± 12.7
49.4 - 92.3
21379
15129263
707.7
52.9
0.19
64.6 ± 15.8
35.3 - 84.3
Bos taurus
28958
49808680
1720
52.5
0.01
61.6 ± 7.6
49.6 - 79.2
44106
61853260
1402.4
48.9
0.02
51.5 ± 11.0
37.3 - 79.4
Caenorhabditis elegans
28981
40353676
1392.4
42.3
<0.01
63.3 ± 13.2
34.7 – 84.0
21658
28571833
1319.2
41.7
0.02
62.3 ± 13.8
33.7 – 84.0
Canis familiaris
27301
42169482
1544.6
51.9
<0.01
59.5 ± 8.8
46.1 - 80.2
27781
39172416
1410
49.8
0.21
55.6 ± 9.7
42.2 - 78.5
Ciona intestinalis
19858
29064597
1463.6
41.6
<0.01
64.9 ± 13.7
39.0 - 90.2
3494
2996310
857.6
39.5
0.28
49.6 ± 14.3
25.8 - 80.6
Ciona savignyi
20359
32691732
1605.8
45.0
<0.01
71.9 ± 11.0
48.1 - 88.7
7678
4396714
572.6
39.9
0.21
43.8 ± 14.2
20.4 - 75.0
Danio rerio
31841
51017126
1602.3
48.1
0.07
67.1 ± 8.9
50.6 - 84.6
56561
75435852
1333.7
44.5
0.07
55.9 ± 10.8
40.7 - 86.6
Drosophila melanogaster
20909
48315668
2310.8
49.9
<0.01
84.7 ± 6.2
71.8 - 92.3
17143
31940522
1863.2
48.9
<0.01
76.7 ± 6.6
63.9 - 87.3
Equus caballus
27192
46568281
1712.6
50.0
<0.01
56.7 ± 8.0
42.8 - 75.3
8113
11844488
1459.9
48.9
0.01
56.6 ± 7.9
46.1 - 75.5
Gallus gallus
22291
39792561
1785.1
48.6
<0.01
61.4 ± 9.2
43.8 - 81.5
33589
53084019
1580.4
47.3
0.38
59.0 ± 11.5
41.1 - 83.8
Gasterosteus aculeatus
27629
45847847
1659.4
55.0
<0.01
70.7 ± 15.9
39.5 - 89.4
18965
26081100
1375.2
47.4
1.26
74.4 ± 12.8
47.9 - 92.5
Homo sapiens
48803
125500000
2571.6
49.7
<0.01
71.7 ± 6.9
62.0 - 85.6
123808
147280000
1189.6
46.1
0.11
40.5 ± 13.4
24.3 - 76.8
Macaca mulatta
38146
70430633
1846.3
50.4
0.01
62.2 ± 7.5
52.4 - 78.7
15307
40059048
2617
47.8
0.05
72.0 ± 7.8
59.7 - 87.7
Monodelphis domestica
33279
57497869
1727.8
48.1
<0.01
58.5 ± 11.7
38.5 - 83.1
959
1914395
1996.2
45.5
<0.01
57.4 ± 14.7
35.9 - 84.9
Mus musculus
40959
99678366
2433.6
50.0
<0.01
72.0 ± 7.4
60.6 – 87.0
79607
113180000
1421.8
46.7
0.17
46.3 ± 13.0
29.1 - 78.4
Ornithorhynchus anatinus
27383
37194655
1358.3
53.3
0.01
59.2 ± 10.3
40.1 - 79.3
1688
2073163
1228.2
51.4
0.02
60.2 ± 9.2
41.8 - 77.9
Oryzias latipes
24662
38325234
1554
52.4
0.01
65.7 ± 12.2
44.2 - 82.9
17373
12850714
739.7
47.6
0.21
46.8 ± 12.2
Rattus norvegicus
34704
60508280
1743.6
51.1
0.01
62.6 ± 7.7
51.8 - 81.1
64373
70355651
1092.9
48.2
0.18
43.6 ± 12.8
27.4 - 75.8
25.6 - 74.7
Takifugu rubripes
48027
91791931
1911.3
54.0
<0.01
72.1 ± 14.8
43.4 - 88.9
3757
2475886
659
48.9
0.02
41.4 ± 11.9
19.6 - 66.0
Xenopus tropicalis
27711
45111427
1627.9
46.4
<0.01
62.2 ± 9.9
47.7 - 84.4
42522
45667114
1074
42.6
0.06
46.6 ± 15.5
25.1 - 85.0
Average
29057
52388748
1747
49.7
<0.01
66.7
34.7 - 92.3
29955
38646677
1296
46.7
0.17
56.0
19.6 - 92.5
109
CHAPTER II In silico cDNA-AFLPs
Additional file 4 - Influence of database origin on pool coverage
The influence of database origin and enzyme choice on cDNA pool coverage for
the 21 species present in both databases. We accounted for variability in coverage
resulting from the nesting of species within database and weighted cDNA pool
coverage by the number of sequences per pool to account for variation in available
sequence data. Denominator degrees of freedom were Kenward-Roger corrected.
Partial R-square indicates the proportion of the variation in cDNA pool coverage
which is explained by each factor/interaction (Edwards et al. 2007).
Source
Model
Database origin
Total pool size (bp)
Average sequence length
GC content
Non-AGCT content
Species
Enzyme combination
Database origin * Enzyme combination
Enzyme combination * GC content
Num
df
106
1
1
1
1
1
20
27
27
27
Den df
F
Sig.
129.31
17.62
22.66
12.46
14.68
14.36
11.34
1055.40
1055.40
1055.40
34.44
0.00
1.49
197.49
9.31
26.70
21.57
61.44
5.68
9.95
<0.001
0.964
0.234
<0.001
0.008
<0.001
<0.001
<.0001
<0.001
<0.001
Partial Rsquare
96.58
0.01
6.18
94.06
38.81
65.03
97.44
61.12
12.69
20.29
110
CHAPTER IV Comparative Seahorse Transcriptomics
CHAPTER IV: Comparative Transcriptomics of the Male
Pregnant Seahorse Hippocampus abdominalis
Kai N. Stölting, Marie-Emilie Gauthier, Rémy Bruggmann, Weihong Qi and
Anthony B. Wilson
For submission to BMC Genomics
Abstract
Background: Male pregnancy is a highly specialized form of reproduction unique
to syngnathid fishes. The complexity of this form of reproduction varies across the
group, ranging from the simple attachment of eggs to the external surface of the
male’s body to the completely enclosed pouch of the seahorse, offering an
exceptional opportunity to study the evolution of reproductive complexity in a
comparative evolutionary framework. Critical to these efforts is the availability of a
reference transcriptome for the group. Novel massive parallel sequencing
approaches allow for the rapid and cost-effective sequencing of multiple
transcriptomes, a method that we applied to the seahorse Hippocampus
abdominalis, screening gene expression in the transcriptomes of pregnant and
non-pregnant individuals.
Results: Our transcriptome sequencing efforts recovered 38,419 cDNA contigs
representing more than 30,000 seahorse genes. Functional annotations were
obtained for 10,309 contigs (approx 27% of all contigs), 3,500 of which are
exclusive to the male brood pouch. After imposing a >5 read cutoff and a minimum
2-fold expression difference, the number of annotated pouch genes is 269, 88 of
which are upregulated during pregnancy and 181 of which are downregulated.
Annotated genes do not differ substantially among cDNA libraries in their major
molecular functions, biological processes or cellular localizations. A comparison of
the sequencing depth of normalized and unnormalized cDNA libraries reveals that
the normalization of cDNA libraries is essential in studies that aim for a full
representation of the transcriptome.
111
CHAPTER IV Comparative Seahorse Transcriptomics
Conclusions: A comprehensive, annotated transcriptome resource has been
assembled for the seahorse. Comparative cDNA library sequencing of pregnant
and non-pregnant male seahorses has identified hundreds of genes with
quantitative expression differences during male pregnancy. The availability of the
seahorse transcriptome opens the door for comparative studies investigating the
diversification of male pregnancy during the evolution of syngnathid fishes.
112
CHAPTER IV Comparative Seahorse Transcriptomics
Background
Modes of reproduction in fish are highly diverse and range from external
fertilization to more derived forms of parental care including mouth-brooding and
viviparity (Breder and Rosen 1966). One of the most exceptional forms of
reproduction in fish is found in seahorses (syngnathid fishes). Syngnathids
reproduce exclusively by male pregnancy and males contribute substantially to the
energetic costs of reproduction while carrying the developing offspring (Stölting
and Wilson 2007).
Syngnathid fishes are a large family of >250 species, all of which exhibit
various forms of morphological specializations for male pregnancy. Two
phylogenetically
supported
subfamilies
are
recognized
in
the
group,
distinguishable by the location of the brooding on the male’s body (Wilson et al.
2001, 2003). Brooding structures have increased in complexity in both the
Gastrophori (abdominal brooders) and the Urophori (tail brooders, including
seahorses) during their evolution, and extant representatives are found for most
pouch types (Wilson et al. 2001, 2003). It is thus possible to study the evolution of
male pregnancy in a comparative evolutionary framework, identifying the genetic
changes associated with functional innovations which have occurred during the
evolution of this group.
The brood pouch changes radically in its morphology and function during an
extended period of male pregnancy (Carcupino et al. 2002, Laksanawimol et al.
2006). Most apparent are increases in the vascularization of the inner pouch
tissues (Carcupino et al. 2002), the osmoregulation of the pouch fluid (Linton and
Soloff 1964), and the production of compounds associated with the immune
response (Melamed et al. 2005). Hormonal changes also accompany male
pregnancy (Boisseau 1967), and there is evidence that the male also provides
nutrients to the developing juveniles, at least in species with highly developed
brooding structures (Boisseau 1967, Haresign and Shumway 1981).
Seahorses exhibit one of the most derived brood pouch morphologies
(Wilson et al. 2001, 2003), and have been the focus of a series of recent studies
investigating morphological, physiological and genetic changes during male
pregnancy (Melamed et al. 2005, Laksanawimol et al. 2006, Van Look et al. 2007,
reviewed in Stölting and Wilson 2007).
113
CHAPTER IV Comparative Seahorse Transcriptomics
The first studies investigating the genetic regulation of male pregnancy
(Zhang et al. 2003, Melamed et al. 2005, Harlin-Cognatio et al. 2006) studied gene
expression in pouch tissues using EST screens (Zhang et al. 2003, Melamed et al.
2005) and/or methods of differential display (Harlin-Cognatio et al. 2006). While
limited in their scope, these earlier studies provided evidence that the genes
associated with male pregnancy are highly diverse, ranging from cytoskeletal
organization and osmoregulation to immune functions (Zhang et al. 2003,
Melamed et al. 2005), and several of these genes also play an important role in
mammalian pregnancy (Stölting and Wilson 2007). Detailed knowledge on the
transcriptome of male pregnant syngnathids is an essential prerequisite for
comparative evolutionary studies, which aim to further our understanding of how
changes in the genetic regulation of male pregnancy are associated with functional
innovations during its evolution.
Differential display techniques provide a means to identify genes whose
expression levels correlate with traits of interest (Liang and Pardee 1992).
Subtractive hybridization (Chien et al. 1984) and cDNA-AFLP (Breyne et al. 2003)
methods can identify dozens or hundreds of candidate genes associated with
phenotypic change (Stölting et al. 2009), but are limited in that usually only a small
fraction of the transcriptome is typically covered (Stölting et al. 2009). Microarrays
(Schena et al. 1995) are a powerful tool to investigate transcriptome activity, but
their application is limited to species for which extensive sequence data are
already available. Next generation sequencing approaches have revolutionized the
way such questions can be addressed (Margulies et al. 2005, Morozova and
Marra 2008), offering the possibility to cost-effectively decipher and compare
global transcriptome activity without requiring previous sequence knowledge
(Droege and Hill 2008, Morozova and Marra 2008).
While 10,000 or more genes may be active in a given cell, their relative
abundance can vary significantly, complicating efforts to obtain the full
transcriptome of an organism (Kuznetsov et al. 2002). 10-20 superabundant genes
may constitute up to 20% of the total cell mRNA (Zhulidov et al. 2004), while 4060% of all RNA transcripts in a given cell type are derived from several hundred
genes of medium abundance, and the remaining 20-40% of the mRNA consists of
rarely expressed genes, each with a low number of transcript copies per cell. Up to
70% of all protein-coding genes may be expressed at low levels, and without for
114
CHAPTER IV Comparative Seahorse Transcriptomics
controlling for differences in expression levels, sequencing efforts aiming at gene
discovery are likely to reveal only a relatively small fraction of the transcriptome.
Fortunately, the differences in relative transcript abundance in cDNA preparations
can be reduced through normalization, and a more comprehensive transcriptome
can be generated with the same sequencing effort. Duplex-specific nuclease
action (Zhulidov et al. 2004) can be used to reduce excessive transcript copies,
and various methods have been proposed to improve the quality of cDNA
normalization (Shagin et al. 2002). High throughput parallel sequencing can
produce up to a million reads per run, and given the massive scale of this
approach, it has been suggested that cDNA normalization may not be necessary,
as both high and low expressed genes may be recovered with such a massive
sequencing effort (Hale et al 2009).
Given its strengths in quickly providing substantial amounts of data, highthroughput sequencing is now being widely used in many non-model species to
characterize transcriptomes and to identify genes involved in traits of interest (e.g.
Vera et al. 2008, Alagna et al. 2009, Meyer et al. 2009, Wang et al. 2009,
Zagrobelny et al. 2009). Most published studies have used standard 454
sequencing runs, which provide between 300,000 and 600,000 200bp long reads.
In most of these studies, between 20–45,000 contigs have been identified. 35–
70% of these contigs can be functionally annotated, and annotation success
seems to depend on the availability of a high quality reference transcriptome from
a closely related species (Vera et al. 2008, Alagna et al. 2009, Meyer et al. 2009,
Wang et al. 2009, Zagrobelny et al. 2009).
We report here on the first de novo sequenced transcriptomes of the
seahorse Hippocampus abdominalis and use a comparative sequencing approach
to identify and characterize suites of genes correlated to male pregnancy. We
analyze and compare the transcriptomes of the male pregnant brood pouch, the
non-pregnant brood pouch, and a seahorse reference transcriptome (Figure 1),
and identify pouch-specific genes differentially expressed during pregnancy. Our
experimental design also allows us to test the impact of normalization on the rate
of gene discovery in transcriptome sequencing, a question we investigate through
the comparison of normalized and unnormalized cDNA libraries prepared from
pregnant and non-pregnant tissues.
115
CHAPTER IV Comparative Seahorse Transcriptomics
Results
Assembly
One plate of 454 titanium sequencing produced more than one million reads
(Table 1). After the removal of adaptor and chimera sequences, 854,000 qualitycontrolled sequences (average length 227 ± 113 base pairs, Table 1) were
included in the assembly. Contiguous cDNA sequences (contigs) were assembled
in two stages, in order to control for the presence of highly expressed transcripts in
the unnormalized data. The first pass used stringent assembly parameters, while
the second used settings typical for data produced by Sanger sequencing. 705894
reads (83%) were assembled into 36706 contigs in the first assembly. This dataset
provided significant blastx hits (at an e-value cutoff of e-3) for 11,889 of the contigs
(32%, Table 1), of which 8,444 (71%) are non-redundant. The secondary
assembly successfully assembled 38,419 contigs from 783,592 reads (92% of the
complete dataset). Of these secondary contigs, 11,741 provided blastx results
(31%), 9,319 of which are non-redundant (79%). The secondary assembly
produced more, on average longer (361bp vs. 328bp for the primary assembly)
and fewer redundant contigs than the primary assembly (Table 1), and subsequent
analyses are based on this assembly. Given the degree of redundancy in the
annotated contigs present in our 38,419 contig dataset (21%), our dataset is
estimated to contain more than 30,000 different cDNAs.
Annotation
Our dataset of 38419 contigs was functionally annotated using Blast2Go
(b2g, Cones et al. 2005, Götz et al. 2008). 10309 (approx. 27%, Figure 2A) contigs
were annotated using this approach, allowing the identification of prominent gene
functions, biological processes and cellular localization. The number of reads
contributing to each contig is highly variable across cDNA libraries (Table 2), and
as many of our contigs are represented by only two sequences, many poorly
represented transcripts may not have been recovered here. Success of functional
annotation is positively correlated with both the number of contributing reads and
the contig length (Table 3, Figure 3). A stringent cutoff of a minimum of five
contributing reads per contig (methods) was imposed when quantifying expression
differences in order to minimize the effects of false positives, resulting in a set of
116
CHAPTER IV Comparative Seahorse Transcriptomics
15300 high-quality contigs, 33% of which (5178, Figure 2B) have functional
annotations.
Identification of male pregnancy genes
High-throughput sequencing provides both qualitative (presence/absence)
and quantitative expression data. As outlined below, quantitative comparisons are
here restricted to the unnormalized libraries, while both normalized and
unnormalized data provide presence/absence information. 872 of the 10309
annotated contigs are present in the pregnant tissues but are absent from any
other tissue source, while 713 of the annotated contigs are restricted to the nonpregnant brood pouch (Figure 2A). Among the 1915 annotated contigs which are
shared among brood pouch libraries, 1196 contigs contain sequencing reads from
both unnormalized cDNA libraries and can thus be used for quantitative inference
(MID4 and MID5). 623 of these contigs contain at least 5 reads from the
unnormalized libraries (n. b. these contigs may contain additional reads from other
libraries). When imposing a 2-fold cutoff for the detection of expression
differences, 70 of these annotated contigs are upregulated in pregnant tissues,
while 141 show reduced levels of expression in pregnant tissues compared to the
non-pregnant library.
A similar approach can be taken when analyzing the high-reliability
annotated contigs containing a minimum of five reads. 73 of the 5178 annotated
high-reliability contigs are specific to the male-pregnant brood pouch (Figure 2B).
An additional 55 contigs of this dataset are restricted to the non-pregnant brood
pouch, and 754 contigs are found in both brood pouch libraries. 244 of these 754
contigs are found in unnormalized libraries and can thus be analyzed for
quantitative information. 15 of these contigs are upregulated by at least 2-fold in
the pregnant brood pouch library, while 126 contigs are down regulated in the
pregnant library (Figure 2B).
Functional annotation of male pregnancy genes
Functional annotations for both the full dataset and the high-reliability
dataset were determined using Blast2go (Table 4), allowing us to associate
contigs with their dominant molecular functions, biological processes and their cell
localization. The relative representation of annotation categories within each class
117
CHAPTER IV Comparative Seahorse Transcriptomics
(i.e. process, function or cellular component) is largely identical in the two
analyses (Table 4). Figure 4 reveals that cellular and metabolic processes
dominate the genes differentially expressed in the brood pouch, followed by
biological regulation, developmental processes and localization. Few differences
exist in the proportion of up- and down-regulated genes contributing to each
category of biological process, with the exception of anatomical structure
formation, where a larger than expected proportion of transcripts are upregulated
(8 upregulated vs. 3 downregulated, Figure 4A, Table 4). The main molecular
functions associated with differentially expressed genes are dominated by binding
and catalytic activity followed by molecular transducer, transporter and
transcription regulation activity (Figure 4B). Dominant among the cellular
components are localizations of annotated genes to the cell, its organelles and
macromolecular complexes (Figure 4C). However, after controlling for differences
in the number of contigs recovered per tissue type, no significant differences are
found in the representation of genes of different annotation classes (data not
shown).
Reference tissues share 3568 of the 5178 (69%) annotated high-reliability
contigs with the brood pouch tissues (Figure 2). This large fraction of shared
annotated contigs accounts for numerical similarities in gene functions of contigs
shared among brood pouch and reference libraries (Table 4). The only exception
from this is – after correction for the number of contigs per tissue type - the
presence of more genes which are associated with localization in the synapse in
the reference libraries, an observation with is in line with the inclusion of brain
tissues in the reference library. Observations for the high-reliability dataset closely
match those made for of the full dataset (Table 4).
Effects of normalization
We prepared both normalized and unnormalized cDNA preparations from
pregnant and non-pregnant brood pouch tissues, providing an opportunity to
directly compare sequence discovery using these two approaches (Table 5).
Normalization of a cDNA library significantly increases contig recovery (2-4x more
contigs were recovered with the normalized libraries, MID2, 3, Table 5) and a
substantial portion of these contigs were not recovered at all in the unnormalized
dataset (Table 5, compare private contigs from normalized and unnormalized
118
CHAPTER IV Comparative Seahorse Transcriptomics
libraries). Somewhat counter-intuitively, a large number of unique contigs are
restricted to the unnormalized libraries, suggesting that a portion of the
transcriptome would also be underrepresented in a fully normalized study of a
similar size (Table 5). While some of the differences in recovery success can be
attributed to the lower number of sequences generated from the unnormalized
pregnant brood pouch library, the normalized library contains proportionately more
private contigs (Table 5).
Normalization also affects the length of contigs, with contigs assembled
from normalized cDNA libraries being on average 120bp shorter than those
produced from unnormalized tissue sources (Table 4). A portion of this difference
may be due to the shorter length of reads in the normalized dataset (average of
40-70bp shorter than the unnormalized data)
While
unnormalized
libraries
contain
quantitative
information,
this
information is lost during the normalization step. The effect of the normalization on
the relative reads recovered can be compared by correlating numbers of
contributing reads per contig across our four brood pouch cDNA libraries (MID2-5).
These four libraries share a total of 2719 contigs. While the correlation between
normalized and unnormalized libraries is low (r2=0.25-0.35, Table 6), there is
however a high correlation in gene expression (measured here as the number of
reads contributing to each contig from each library) within the methods: the
number of reads recovered in normalized libraries (MID2, 3) is highly correlated
(0.866), a pattern similar to that found when comparing unnormalized libraries
(MID4, 5, 0.745). Given the lack of correlation between relative gene copy number
in normalized and unnormalized libraries, we restrict our quantitative comparisons
to the unnormalized dataset.
119
CHAPTER IV Comparative Seahorse Transcriptomics
Discussion
Studies on the physiological, morphological and behavioral changes during
male pregnancy have advanced our understanding of the structural modifications
that occur during male pregnancy of syngnathid fishes (reviewed in Stölting and
Wilson 2007). While the genetic regulation of male pregnancy is a relatively recent
area of study, several candidate pregnancy genes have already been identified
(e.g. Zhang et al. 2003, Melamed et al 2005, Harlin-Cognatio et al 2006).
Investigating the genetic regulation of male pregnancy in a comparative
evolutionary context is complicated by the absence of genetic and genomic
resources and the relatively deep divergence of syngnathids from other model
teleosts. The stickleback Gasterosteus aculeatus, likely the most closest related
model organism to syngnathids, is separated by more than 50 million years from
seahorses and pipefish (Benton 1993).
Our de novo transcriptome sequencing efforts have provided a detailed
snapshot of the seahorse transcriptome, providing sequence data for more than
30,000 distinct RNA-derived transcripts (based on redundancy in the annotated
dataset). Our dataset produced more than 38,000 contigs, of which approximately
31% obtained significant blastx hits and 27% obtained GO annotations. These
results are similar to those reported for other recent transcriptome studies (Vera et
al. 2008, Alagna et al. 2009, Meyer et al. 2009, Wang et al. 2009, Zagrobelny et al.
2009, but see Kristiansson et al. 2009). Given that our average contig lengths are
shorter than those reported in some other studies (e.g. 361bp, Table 1, vs.
~400bp, Kristiansson et al. 2009), and the positive correlation between contig
length and annotation success (Table 3), our transcriptome sequencing effort has
likely underestimated the number of contigs which will ultimatey be annotated.
We have assembled our adaptor-trimmed and chimera-cleaned sequencing
reads in two rounds of assembly, an approach explicitly incorporated into some
assembly algorithms (Chevreux et al. 2004). Manual inspection of the primary
assembly, including blast-searches of remaining singlets against contigs revealed
significant redundancy in the dataset. A secondary assembly of the first assembly
contigs with the remaining singletons reduced overall redundancy (Table 1), and
92% of all reads could be assembled as contigs. This fraction of assembled reads
in a transcriptome study is highly dependent on the number of reads produced:
120
CHAPTER IV Comparative Seahorse Transcriptomics
smaller studies with fewer reads contain many more unassembled singlets
(Alagna et al 2009, Wang et al. 2009) than studies where the size of the screen is
larger (data presented here, Vera et al. 2008, Meyer et al. 2009).
Several previous studies have highlighted suites of genes potentially
involved in male pregnancy. Melamed and colleagues (2005) identified 165 ESTs
from the brood pouch lining of Hippocampus comes species. Among those ESTs
are three types of lectins with in vitro antibacterial activity. Our assembly of the
seahorse transcriptome recovered most (88%) of these ESTs (data not shown),
including contigs identified as lectins. While Melamed et al. (2005) detected the
presence of lectins in the pouch lining of a pregnant H. comes, we detected lectin
genes in both the non-pregnant and pregnant brood pouch. Interestingly, five
lectin-like genes are upregulated in the non-pregnant pouch relative to the
pregnant pouch (additional files 1 and 2), corroborating that lectins might indeed
be key players in male pregnancy. Melamed et al. (2005) show that expression
levels of a lectin compound decrease during male pregnancy in the brood pouch
fluid, but have not addressed questions of expression levels within the pouch lining
of non-pregnant tissues. The upregulation of lectin genes in non-pregnant pouch
tissues detected here might be explained by our sampling of receptive brood
pouch lining, a tissue stage not tested by Melamed et al. (2005), which could
already express lectins as part of the preparations for pregnancy without releasing
these compounds into the pouch fluid.
While many of the previously known male pregnancy associated sequences
have been recovered in the present study, a metalloprotease upregulated during
male pregnancy in Syngnathus scovelli (Harlin-Cognatio et al. 2006) has not been
recovered here and 20 of the 165 H. comes sequences identified by Melamed et
al. (2005) were also not recovered in the present study. While these differences
could be caused by species-specific differences differences in gene expression,
they may also indicate that our transcriptome survey is incomplete. Despite these
differences, interspecific variation in levels of gene expression during male
pregnancy may be responsible for structural and physiological differences in male
pregnancy across species, and such comparisons are likely a fruitful area for
future research (see below).
Our analysis of the seahorse transcriptome focused on gene expression in
late–stage pregnancy tissues and the brood pouch of a sexually receptive non121
CHAPTER IV Comparative Seahorse Transcriptomics
pregnant individual. Pregnancy involves a series of coordinated changes to male
tissues across 3-6 weeks (Laksanawimol et al. 2006), and the restricted nature of
our study can only provide a snapshot of a complex process. As different stages of
the pregnancy likely involve the expression of different suites of genes, temporal
analyses of gene expression differences during seahorse pregnancy may help to
better understand the major functional changes which occur during gestation. We
have focused our sequencing efforts primarily on brood pouch tissues – the organ
of male pregnancy. It is nonetheless quite likely that other tissues (e.g. the
pituitary, testes, interrrenal gland, Boisseau 1967) are also involved in the
regulation of this process. Furthermore, we have focused here on pouch-specific
genes differentially expressed during pregnancy, but it is likely that slight changes
in many constitutively expressed genes in both pouch and other tissues may also
play a critical role in the pregnancy process. The development of a microarray
based on the data generated here will provide an important tool for studying
changes in the spatial and temporal expression of genes associated with male
pregnancy.
As part of our efforts for gene discovery in the seahorse transcriptome, we
normalized our cDNA preparations to remove excessive differences in relative
transcript abundance. Given the availability of both normalized and unnormalized
data in our study, we are able to explicitly determine the effects of normalization
on gene discovery. While Hale and colleagues (2009) argued that the
normalization of cDNA libraries should not be required when large numbers of
sequences are obtained from a tissue sample, our study suggests that normalized
libraries contain more rare transcripts than do unnormalized libraries, stressing the
value of normalization in studies aimed at gene discovery. As unnormalized
libraries also contain contigs which have not been detected in other cDNA
libraries, normalization may produce a biased subset of the transcriptome. One
indication for a normalization-related bias are the observed differences in the
average read- and contig lengths of unnormalized and normalized cDNA libraries
(Table 4). Here, normalized contigs are built from shorter sequencing reads and
are on average shorter than normalized contigs. This observation contradicts
results provided by the developers of the normalization method (Zhulidov et al.
2004), who showed that normalization should not affect contig length. An
alternative explanation may be that the depth of our transcriptome screen is stil
122
CHAPTER IV Comparative Seahorse Transcriptomics
quite low and that differences between gene discovery in normalized and
unnormalized libraries may reflect stochastic sampling issues associated with an
incomplete dataset. As the scale of next-generation sequencing projects
increases, normalization may become less necessary, but our data strongly
support the use of this approach for moderately-sized screens.
Conclusion
The first transcriptome of the seahorse has been assembled based on the
brood pouch of pregnant and non-pregnant individuals and a suite of reference
tissues. Comparative cDNA library sequencing of pregnant and non-pregnant male
seahorses has identified hundreds of genes with quantitative expression
differences during male pregnancy. A list of male-pregnancy related genes is
provided in the appendix. The characterization of the seahorse transcriptome
should provide a resource for future comparative studies investigating the
evolution of male pregnancy in syngnathid fishes.
Outlook
We have provided the first detailed studies of the pregnant male seahorse
transcriptome and have identified and functionally annotated a large suite of genes
that are differentially expressed during pregnancy. As the coverage of many
transcripts was low, these contigs have been excluded from quantitative analysis,
suggesting that a much larger suite of genes are likely involved in the pregnancy
process. The data generated here will be used in the construction of a syngnathid
microarray, a tool which will provide a means to screen a broader range of tissue
types and individuals. Ultimately this resource will be used for the investigation of
gene expression differences during male pregnancy in a comparative evolutionary
framework.
123
CHAPTER IV Comparative Seahorse Transcriptomics
Methods
Sampling
Pregnant and non-pregnant seahorses were obtained from aquaculture
stocks (Seahorse Australia, Tasmania, Australia). Animals were sacrificed under
ethical guidelines (permit 180/2006 Federal Veterinary Office, Switzerland). A
single pregnant and non-pregnant male provided tissues for the identification of
pregnancy genes. The pregnant individual was sampled during late stage
pregnancy (equivalent to stage 7 of Ripley and Foran 2006). The non-pregnant
individual was reproductively receptive, with a highly vascularized brood pouch
lining. Tissues were extracted from RNA-later preserved samples under a
dissection microscope and stored separately in RNA-later at -20°C prior to RNA
extraction. All embryonic tissues were removed from the pouch wall of the
pregnant male, as were the muscular tissues forming the wall of the brood pouch.
Underlying muscle tissues were also removed from the non-pregnant individuals.
A reference library consisting of gill tissue, brain, testis, liver and kidney from the
pregnant individual was prepared, providing a snapshot view of non-pouch-related
mRNA products during pregnancy. Total RNA was extracted from each of these
tissues separately and the final reference library was produced from equal
amounts of cDNA from each tissue after cDNA synthesis.
RNA extraction and purification
All tissues were homogenized prior to RNA extraction in extraction buffer
using Eppendorf pestles (Eppendorf, Hamburg, Germany). RNA was extracted
using a modified RNA extraction protocol using equilibrated phenol (Chomczynski
and Sacchi 1987). Changes to the original protocol involve RNA extraction at
neutral pH and the use of lithium chloride to increase the stability of the RNA
preparation and the quality of the cDNA synthesis, steps recommended prior to
normalization (Evrogen, Moscow, Russia).
RNA preparations were quantified spectrophotometrically (NanoDrop), and
2µg of total RNA was DNA-digested using RQ1-RNAse free DNAse (Promega)
according to the instructions of the manufacturer. DNA-digested RNA was repurified using the RNA extraction protocol. This second extraction step included
only a single phenol-chloroform-isoamyl step, while all other steps were identical.
124
CHAPTER IV Comparative Seahorse Transcriptomics
cDNA synthesis
We synthesized cDNA in 40µL reaction volumes using approx. 1µg of DNAdigested and purified RNA preparations and 2µl ImPromII reverse transcriptase
(Promega). This reverse transcriptase has properties similar to MMLV reverse
transcriptase and can be used for SMART cDNA synthesis (Zhu et al. 2001). The
reaction mixture for the cDNA synthesis contained two modified oligos
(IIAFwModMmeI and IIAT20ModMmeI, see Table 1) similar to standard SMART
cDNA synthesis oligos at a concentration of 2µM each. Here, IIAFwModMmeI was
used as the 5’ adaptor, while IIAT20ModMmeI served as the 3’-poly-A specific
cDNA adaptor. Reactions additionally contained 1x ImPromII reaction buffer, 2µL
of 10mM dNTPs and 4.8µL of 25mM MgCl2 in double-distilled water. Using this
system - essentially a modified SMART cDNA-synthesis system – full length
cDNAs can be produced which contain both adaptor sequences. After annealing
oligos to approx. 1µg total RNA, ImPromII was added to the reaction and cDNA
synthesis followed the suggestion of the manufacturer. We added to each cDNA
reaction 1µL of RNasin Ribonuclease inhibitor (Promega) to reduce RNA
degradation during cDNA synthesis. RT-PCR was performed in a Tetrad DNA
Engine 2 thermal cycler (BioRad, Hercules, CA, USA) at 42°C for 1 hour, 45°C for
30min, 50°C for 10min and 70°C for 10min. Synthesized cDNA was purified using
MilliPore PCR purification plates (MilliPore) and eluted in 40µL double-distilled
water. The concentration of the purified cDNA was estimated to be 100ng –
250ng/µL (Nanodrop).
cDNA-amplification and removal of poly-A-tails
Double-stranded cDNA was prepared using the 5’-oligonucleotide used for
cDNA
synthesis
(IIAFwModMmeI)
together
with
a
modified
3’
primer
(IIAT20_Mod_Reamp, Table 7). This modified 3’ primer included several
mismatches in its poly-T tail, an approach which helps to interrupt the long polyTtail of the cDNA products, which are known to negatively affect 454 sequencing
(Jarvie and Harkins 2008). We amplified cDNA preparations after an initial
denaturation step (95°C for 1min) for 20-35 cycles at 95°C for 15 seconds, 65°C
for seconds and 68°C for 6min to allow fragment completion.
Synthesized and re-amplified cDNA was quality checked by both
electrophoresis and PCR tests. Beta-actin, as well as three lectin genes previously
125
CHAPTER IV Comparative Seahorse Transcriptomics
suggested to be important for in male pregnancy (Type I, II and III, Melamed et al.
2005) were amplified for each cDNA-preparation, and cDNA preparations
amplifying all four control genes were used in subsequent steps. Amplifications
contained 1M betaine (Sigma, St. Louis, MO, USA), 0.25mM dNTPs (Roche
Diagnostics, Mannheim, Germany), 0.5µM of each oligonucleotide (Table 7) and 1
U of Taq polymerase (NEB) in 1x Taq-reaction buffer (NEB). Amplification
conditions for all genes tested were identical and consisted of an initial 1 minute
long denaturation step at 95°C followed by 40 PCR cycles at 95°C for 1min, 60°C
for 1min and 72°C for 2min. Amplified fragments were completed in a 10minute
long final extension step at 72°C.
Integration of 5’ and 3’ adapters during cDNA synthesis was assayed by
rapid amplification of cDNA ends (RACE, Frohman et al. 1988) to test for adaptor
integration. Reaction conditions for RACE amplifications were identical to those of
the control-amplifications listed above (see also Table 7).
Library combination, normalization and sequencing
Our reference cDNA library (MID1) consists of equal quantities of cDNA
extracted from gill tissue, brain, testis, liver and kidney. Libraries II and IV contain
non-pregnant brood pouch tissue (MID2 and MID4), while libraries III and V
contain pregnant brood pouch tissues (MID3 and MID5).
The relative concentrations of individual gene transcripts can vary
substantially within each tissue. To avoid systematic bias towards abundantly
expressed genes, libraries MID1, MID2 and MID3 were normalized prior to
sequencing. Our normalization used the Trimmer Kit (Evrogen) according to the
suggestions of the manufacturer. In brief, 1µg cDNA from each library was
normalized with 1µL duplex-specific nuclease at 68°C for 25 minutes, heatinactivated and PCR-amplified. Reagents used in amplification are identical to
those described above, with the following changes: Taq-polymerase was replaced
by a Taq/Pfu polymerase mixture (10:1) with reduced error rates, and amplified for
20 cycles at 95°C for 7 seconds, 66°C for 20 seconds and 72°C for 4 minutes
using the same oligonucleotides as used for reamplification of cDNA
(IIAFwModMmeI and IIAT20_Mod_Reamp, see above). Approximately 5µg of both
normalized and unnormalized cDNA-libraries were MID-tagged and submitted to
pyrosequencing according to the suggestions of the manufacturer.
126
CHAPTER IV Comparative Seahorse Transcriptomics
Contig assembly
A primary contig assembly joined chimera-cleaned and adaptor-trimmed
sequence reads using tgicl (http://compbio.dfci.harvard.edu/tgi/software/, Pertea et
al. 2003). Sequence reads greater than 40bp were clustered with overlaps of at
least 98% identity, and at least 1bp overlap distance from the sequence end.
These settings force the assembler to combine only those reads from which all
vector or linker information has been removed (Table 1). Blastx-searches of
contigs produced during the first assembly identified substantial redundancy. A
less stringent secondary assembly was therefore used to reassemble firstassembly contigs and singlets using the default settings of the assembly software,
a sequence identity cutoff of 90% for sequences longer than 40bp and a minimum
overhang of 20bp.
Annotation
Contigs were GO-annotated in Blast2GO (b2g) using default settings and
the results of blastx-searches against local copies of the protein nr database
(NCBI). These settings are recommended to maximize the quality of the
annotations (Conesa et al. 2005, Götz et al 2008), which we augmented by using
the “Annex” annotation augmentation function as suggested for b2g (Götz et al.
2008). We executed blastx searches against a local mirror of the NCBI protein-nr
database (as of December 2009). Given the size limitation of b2g for the import of
blast results, batches of 500 sequences were submitted for blastx searching and
later combined into a single project file for annotation. Table 2 reports on the
number of annotated contigs for each library and both assemblies. The analysis of
the assembly and annotation results was performed in SAS 9.1.3 (SAS Institute
Inc, Cary, USA).
Analyses
Univariate assembly statistics including average sequence length, read
counts per contig and per library and median contig length were calculated for
both assemblies (Table 1). We also extracted detailed information on contig length
and the number of sequences contributing to each contig for the combined
secondary assembly (Table 2).
127
CHAPTER IV Comparative Seahorse Transcriptomics
In order to identify whether normalized and unnormalized cDNA libraries
can be combined to identify quantitative differences in gene expression, we
identified the set of contigs shared in the four brood pouch cDNA-libraries and
tested for pairwise correlations in gene number. Poor correlations between the
number of contributing reads per contig in normalized and unnormalized libraries
indicate that quantitative information has been altered in normalized libraries, and
that only unnormalized libraries can be used to extract quantitative data.
A stepwise process was used to identify pregnancy genes. All five libraries
were first mined for the presence or absence of each contig. For this analysis,
normalized and unnormalized libraries from the same tissue were pooled, and thus
only three comparisons (reference tissues vs. pouch-pregnant tissues vs. pouch
non-pregnant tissues) were made here (Figure 1). An initial quantitative screen
identified genes which were exclusively present in a single tissue type.
Quantitative information (>2-fold expression differences) were also obtained
from the two unnormalized cDNA libraries via comparison to the reference library.
Here, our analysis was restricted to these genes expressed exclusively in brood
pouch tissues. We measured expression levels as the number of reads from each
of the unnormalized libraries contributing to each contig. For those sequences with
contributing reads from both unnormalized libraries, fold-differences were obtained
by calculating the ratio of contributing reads from the non-pregnant library to the
pregnant library (downregulated genes, additional file 1) and vice versa for the
upregulated genes (additional file 2).
These two approaches provide sets of male pregnancy-related genes for
which b2g annotations can be compared. Since read-coverage of contigs in our
dataset is highly variable and generally low, we analyzed both the full dataset and
a restricted dataset, where each contig was represented by a minimum of five
reads. Details on the experimental design are illustrated in Figure 1.
The molecular functions of annotated, differentially expressed pouch genes
were collated using b2g. We compared top-level annotations (graph level 2) for the
combined quantitative and qualitative datasets split into the classes of reference
genes, as well as those upregulated or downregulated in the male pregnant brood
pouch (Table 4). Information has been extracted for all annotation classes of
differentially expressed genes (Figure 4, Table 4).
128
CHAPTER IV Comparative Seahorse Transcriptomics
Acknowledgements
The authors wish to thank Sirisha Aluri for library-quantification and
Marzanna Künzli for the execution of the next generation sequencing run. Funding
from the Forschungskredit and the Zoological Museum of the University of Zurich
(KNS) and the Stiftung für wissenschaftliche Forschung (ABW) is gratefully
acknowledged.
129
CHAPTER IV Comparative Seahorse Transcriptomics
References
Abouheif E. 1999. Establishing homology criteria for regulatory gene networks:
prospects and challenges. Novartis Found Symp 222:207-221.
Alagna F, D’Agostino N, Torchia L, Servili M, Rao R, Pietrella M, Giuliano G,
Chiusano
ML,
Baldoni
L,
Perrotta
G.
2009.
Comparative
454
pyrosequencing of transcripts from two olive genotypes during fruit
development. BMC Genomics 10:399.
Benton MJ 1993. The fossil record 2. London: Chapman & Hall.
Boisseau JP. 1967. Les régulations hormonales de l'incubation chez un vertebré
mâle: Recherches sur la reproduction de l'Hippocampe. PhD Thesis.
Universite de Bordeaux.
Breder CM, Rosen DE. 1966. Modes of reproduction in fishes. New York: Natural
History Press.
Breyne P, Dreesen R, Cannoot B, Rombaut D, Vandepoele K, Rombauts S,
Vanderhaeghen R, Inze D, Zabeau M. 2003.: Quantitative cDNA-AFLP
analysis for genome-wide expression studies. Molecular Genetics and
Genomics 269:173-179.
Carcupino M, Baldacci A, Mazzini M, Franzoi P. 2002. Functional significance of
the male brood pouch in the reproductive strategies of pipefishes and
seahorses: a morphological and ultrastructural comparative study on three
anatomically different pouches. J Fish Biol 61:1465-1480.
Chevreux B, Pfisterer T, Drescher B, Driesel AJ, Müller WEG, Wetter T, Suhai S.
2004. Using the miraEST assembler for reliable and automated mRNA
transcript assembly and SNP detection in sequenced ESTs. Genome
Research 14:1147-1159.
Chien Y, Becker DM, Lindsten T, Okamura M, Cohen DI, Davis MM. 1984. A third
type of murine T-cell receptor gene. Nature 312:31-35.
Chomczynski P, Sacchi N. 1987. Single-step method of RNA isolation by acid
guanidinium
thiocyanate-phenol-chloroform
extraction.
Anal
Biochem
162:156-159.
Conesa A, Götz S, Garcia-Gomez JM, Terol J, Talon M, Robles M. 2005.
Blast2GO: a universal tool for annotation, visualization and analysis in
functional genomics research. Bioinformatics 21:3674-3676.
130
CHAPTER IV Comparative Seahorse Transcriptomics
Droege M, Hill B. 2008. The genome sequencer FLX system-longer reads, more
applications, straight forward bioinformatics and more complete data sets. J
Biotechnol 136:3-10.
Foster SJ, Vincent A. 2004. Life history and ecology of seahorses: implications for
conservation and management. J Fish Biol 65:1-61.
Frohman MA, Dush MK, Martin GR. 1988. Rapid production of full-length cDNAs
from rare transcripts - amplification using a single gene-specific
oligonucleotide primer. Proc Natl Acad Sci USA 85:8998-9002.
Götz S, Garcia-Gomez JM, Terol J, Williams TD, Neda MJ, Robles M, Talon M,
Dopazo J, Conesa A. 2008. High-throughput functional annotation and data
mining with the Blast2GO suite. Nucleic Acids Research 36:3420-3435.
Hale MC, McCormick CR, Jackson JR, DeWoody JA. 2009. Next-generation
pyrosequencing of gonad transcriptomes in the polyploid lake sturgeon
(Acipenser fulvescens): the relative merits of normalization and rarefaction
in gene discovery. BMC Genomics 10, 203.
Haresign TW, Shumway SE. 1981. Permeability of the marsupium of the pipefish
Syngnathus fuscus to
14
C-alpha amino isobutyric acid. Comp Biochem
Physiol 69a:603-604.
Harlin-Cognatio A, Hoffman EA, Jones AG. 2006. Gene cooption without
duplication during the evolution of a male-pregnancy gene in pipefish. Proc
Natl Acad Sci USA 103:19407-19412.
Jarvie T, Harkins T. 2008. Transcriptome sequencing with the genome sequencer
FLX system. Nature Methods 2008, 5:vi-viii.
Kristiansson E, Asker N, Förlin L, Larsson DGJ. 2009. Characterization of the
Zoarces viviparus liver transcriptome using massively parallel
pyrosequencing. BMC Genomics 10:345.
Kuznetsov VA, Knott GD, Bonner RF. 2002. General statistics of stochastic
process of gene expression in eukaryotic cells. Genetics 161:1321-1332.
Lee JS. 2000. The internally self-fertilizing hermaphroditic teleost Rivulus
marmoratus (Cyprinodontiformes, Rivulidae) beta-actin gene: Amplification
and sequence analysis with conserved primers. Marine Biotechnology 2:161166.
131
CHAPTER IV Comparative Seahorse Transcriptomics
Laksanawimol P, Damrongphol P, Kruatrachue M. 2006. Alteration of the brood
pouch morphology during gestation of male seahorses, Hippocampus kuda.
Marine and Freshwater Research 57:497-502.
Liang P, Pardee AB. 1992. Differential display of eukaryotic messenger-RNA by
means of the polymerase chain-reaction. Science 257:967-971.
Linton JR, Soloff BL. 1964. The physiology of the brood pouch of the male sea
horse Hippocampus erectus. Bull Mar Sci Gulf Carib 14:45-61.
Margulies M, Egholm M, Altman WE, Attiya S, Bader JS, Bemben LA, Berka J,
Braverman MS, Chen YJ, Chen Z, Dewell SB, Du L, Fierro JM, Gomes XV,
Godwin BC, He W, Helgesen S, Ho CH, Irzyk GP, Jando SC, Alenquer ML,
Jarvie TP, Jirage KB, Kim JB, Knight JR, Lanza JR, Leamon JH, Lefkowitz
SM, Lei M, Li J et al. 2005. Genome sequencing in microfabricated highdensity picolitre reactors. Nature 437:376-380.
Melamed P, Xue Y, Poon JFD, Wu Q, Xie HM, Yeo J, Foo TWJ, Chua HK. 2005.
The male seahorse synthesizes and secretes a novel C-type lectin into the
brood pouch during early pregnancy. FEBS Journal 272:1221-1235.
Meyer E, Aglyamova GV, Wang S, Buchanan-Carter J, Abrego D, Colbourne JK,
Willis BL, Matz MV. 2009. Sequencing and de novo analysis of a coral
transcriptome using 454GSFlx. BMC Genomics 10:219.
Morozova O, Marra MA. 2008. Applications of next-generation sequencing
technologies in functional genomics. Genomics 92:255-264.
Pertea G, Huang XQ, Liang F, Antonescu V, Sultana R, Karamycheva S, Lee Y,
White J, Cheung F, Parvizi B, Tsai J, Quackenbush J. 2003. TIGR Gene
Indices clustering tools (TGICL): a software system for fast clustering of
large EST datasets. Bioinformatics 19:651-652.
Ripley JL, Foran CM. 2006. Differential parental nutrient allocation in two
congeneric pipefish species (Syngnathidae: Syngnathus spp.). J Exp Biol
209:1112-1121.
Schena M, Shalon D, Davis RW, Brown PO. 1995. Quantitative monitoring of gene
expression patterns with a complementary DNA microarray. Science
270:467-470.
Shagin DA, Rebrikov DV, Kozhemyako VB, Altshuler IM, Shcheglov AS, Zhulidov
PA, Bogdanova EA, Staroverov DB, Rasskazov VA, Lukyanov S. 2002. A
132
CHAPTER IV Comparative Seahorse Transcriptomics
novel method for SNP detection using a new duplex-specific nuclease from
crab hepatopancreas. Genome Research 12:1935-1942.
Stölting KN, Gort G, Wüst C, Wilson AB. 2009. Eukaryotic transcriptomics in silico:
Optimizing cDNA-AFLP efficiency. BMC Genomics 10, 565.
Stölting KN, Wilson AB. 2007. Male pregnancy in seahorses and pipefish: beyond
the mammalian model. Bioessays 29:884-896.
Van Look KJW, Dzyuba B, Cliffe A, Koldewey HJ, Holt WV. 2007. Dimorphic
sperm and the unlikely route to fertilisation in the yellow seahorse. J Exp
Biol 10:432-437
Vera JC, Wheat CW, Fescemyer HW, Frilande MJ, Crawford DL, Hanski I, Marder
JH. 2008. Rapid transcriptome characterization for a nonmodel organism
using 454 pyrosequencing. Molecular Ecology 17: 1636-1647.
Wang W, Wang Y, Zhang Q, Qi Y, Guo D. 2009. Global characterization of
Artemisia
annua
glandular
trichome
transcriptome
using
454
pyrosequencing. BMC Genomics 10: 465.
Wilson AB, Ahnesjo I, Vincent ACJ, Meyer A. 2003. The dynamics of male
brooding, mating patterns, and sex roles in pipefishes and seahorses
(family Syngnathidae). Evolution 57:1374-1386.
Wilson AB, Vincent A, Ahnesjo I, Meyer A. 2001. Male pregnancy in seahorses
and pipefishes (Family Syngnathidae): Rapid diversification of paternal
brood pouch morphology inferred from a molecular phylogeny. Journal of
Heredity 92:159-166.
Woods CMC. 2000. Preliminary observations on breeding and rearing the
seahorse Hippocampus abdominalis (Teleostei: Syngnathidae) in captivity.
NZ J Mar Freshwater Res 34:475-485.
Zagrobelny M, Scheibye-Alsing K, Jensen NB, Lindberg Moller B, Gorodkin J, Bak
S. 2009. 454 pyrosequencing based transcriptome analysis of Zygaena
filipendulae with focus on genes involved in biosynthesis of cyanogenic
glucosides. BMC Genomics 10:574.
Zhang N, Xu B, Mou CY, Yang WL, Wei JW, Lu L, Zhu JJ, Du JC, Wu XK, Ye LT,
Fu ZY, Lu Y, Lin JH, Sun ZZ, Su J, Dong ML, Xu AL. 2003. Molecular
profile of the unique species of traditional Chinese medicine, Chinese
seahorse (Hippocampus kuda Bleeker). FEBS Letters 550:124-134.
133
CHAPTER IV Comparative Seahorse Transcriptomics
Zhu YY, Machleder EM, Chenchik A, Li R, Siebert PD. 2001. Reverse
transcriptase template switching: A SMART (TM) approach for full-length
cDNA library construction. Biotechniques 30:892-897.
Zhulidov PA, Bogdanova EA, Shcheglov AS, Vagner LL, Khaspekov GL,
Kozhemyako VB, Matz MV, Meleshkevitch E, Moroz LL, Lukyanov SA,
Shagin DA. 2004. Simple cDNA normalization using kamchatka crab
duplex-specific nuclease. Nucleic Acids Research 32 (3), e37.
134
CHAPTER IV Comparative Seahorse Transcriptomics
Table 1 Comparison of primary and secondary assembly
Descriptive statistics for the primary and secondary assembly. Avg = average; SD
= standard deviation; max = maximum, min = minimum, bp = base pairs;
Redundancy is estimated as the fraction of genes with the same top hit in a blastx
search (December 2009, local mirror of NCBI protein nr database).
uncorrected reads
reads passing assembly
average read length
reads assembled into contigs
singlets remaining
Singlet length ± SD (bp)
contigs produced
avg. reads/contig ± SD
max reads/contig
total length contigs (bp)
avg contig length ± SD (bp)
max contig length (bp)
min contig length (bp)
Contigs with blastx results (nr)
Non-redundant blastx results (nr)
GO annotated contigs
redundancy
redundancy-corrected estimate of genes
Primary
assembly
1023026
853879
227.13 ± 112.92
705894
148164
209.26 ± 126.21
36706
19.23 ± 253.39
20626
12041814
328.06 ± 185.66
2453
54
11889
8444
10580
29%
>26000
Secondary
assembly
1023026
853879
227.13 ± 112.92
783592
70287
177.15 ± 131.76
38419
20.40 ± 263.90
23478
13853626
360.59 ± 207.81
2846
45
11741
9319
10309
21%
>30000
135
CHAPTER IV Comparative Seahorse Transcriptomics
Table 2 Descriptive statistics for the secondary assembly
Descriptive statistics for the secondary assembly, separated by cDNA library.
Avg.= average; SD = Standard deviation; private contigs = contigs unique to a
single library
MID1
MID2
MID3
MID4
MID5
yes
no
yes
no
yes
reference
pouch
pouch
pouch
pouch
Total reads
228082
159579
223094
153899
89255
853879
assembled reads
202627
144134
205910
145721
85200
783592
Avg read length per read
± SD
Avg read length per
assembled read ± SD
contigs
189.23 ±
104.82
191.96 ±
101.68
24884
199.78
± 94.50
203.94
± 90.58
20871
235.09 ±
103.71
238.44 ±
100.07
23776
272.08 ±
119.44
276.30 ±
115.87
10986
275.51 ±
124.39
279.87 ±
121.24
6709
227.13 ±
112.92
231.62 ±
109.97
38419
8.14 ±
66.39
4112
6.91 ±
49.09
3721
8.66 ±
66.57
5029
13.26 ±
222.34
13519
12.69 ±
210.00
11428
20.4 ±
263.90
23478
5149
2577
2846
706
210
11488
pregnant
tissue
avg. reads per contig ±
SD
max reads / contig and
library
private contigs
SUM
Table 3 T-tests comparing the influence of read number and contig length on
annotated and non-annotated sequences.
T-tests comparing 38419 annotated and non-annotated secondary assembly
contigs. N = number of contigs; SD = standard deviation of the average; Sig. = pvalue for the null-hypothesis of variance equality.
T-tests
Contributing reads
Contig length (bp)
Annotated
No
Yes
No
Yes
N
28110
10309
28110
10309
Average ± SD
14.50 ± 215.79
36.47 ± 363.62
303.44 ± 162.19
516.43 ± 236.67
Sig.
p<0.0001
p<0.0001
136
CHAPTER IV Comparative Seahorse Transcriptomics
Table 4 Annotation results for the full dataset and contigs >4 reads
Top-level annotations for annotated contigs of the complete dataset (38419
contigs) and subsets of individual libraries. Data are also presented for 15300
high-reliability contigs built from five or more contributing reads. Numbers of
observations for each top-level annotation are indicated for biological processes,
molecular functions and cellular components (see also Figure 4). Note: Multiple
annotations are possible for each contig.
137
CHAPTER IV Comparative Seahorse Transcriptomics
38419 contig dataset
38419
contigs
Reference
Library
MID1-5
MID1
MID2/4
MID3/5
MID1-5
MID1
MID2/4
MID3/5
Contigs per dataset
38419
24884
24842
25299
15300
12761
12931
13310
Private contigs
11488
5149
4076
3545
1093
704
320
262
10309
6809
7341
7951
5178
4296
4576
4784
2046
855
713
872
214
140
55
73
793
540
531
599
396
345
330
357
Annotated contigs (total
dataset)
Annnotated contigs (private
dataset)
Molecular Function
Biological Process
anatomical structure formation
Cellular Component
15300 contigs >4 reads
Pouch
nonpregnant
Pouch
pregnant
15300
contigs
Reference
Pouch
nonpregnant
Pouch
pregnant
biological adhesion
401
264
279
301
192
161
165
175
biological regulation
3803
2534
2703
2944
1933
1610
1714
1792
cellular process
6340
4251
4533
4934
3272
2751
2885
3030
developmental process
2184
1453
1517
1680
1082
903
951
1000
growth
259
176
183
216
138
115
125
131
immune system process
395
270
283
308
204
166
178
191
localization
1996
1351
1386
1524
1009
850
873
926
locomotion
350
220
245
280
175
145
147
162
metabolic process
4524
3059
3297
3575
2386
2025
2137
2230
multicellular organismal
process
1995
1356
1337
1494
981
816
851
893
multi-organism process
245
161
175
201
130
108
118
121
pigmentation
60
36
42
48
26
21
25
25
reproduction
301
193
225
233
155
124
142
139
response to stimulus
1362
940
972
1041
700
590
617
644
rhythmic process
73
44
54
49
33
23
30
27
viral reproduction
53
37
38
46
29
26
27
28
antioxidant activity
33
24
22
22
15
14
14
12
auxiliary transport protein
activity
35
27
23
23
16
13
14
14
binding
6390
4272
4551
4920
3241
2736
2847
2995
catalytic activity
3267
2172
2341
2539
1652
1398
1457
1524
chemorepellent activity
2
1
1
1
2
1
1
1
electron carrier activity
109
76
68
81
50
41
44
45
enzyme regulator activity
522
339
379
394
241
203
209
223
metallochaperone activity
1
0
1
0
1
0
1
0
molecular transducer activity
703
449
500
524
344
283
301
317
proteasome regulator activity
2
1
1
1
2
1
1
1
structural molecule activity
457
335
332
349
266
236
234
243
transcription regulator activity
682
458
503
536
362
297
325
340
translation regulator activity
138
97
108
120
90
79
85
86
transporter activity
562
398
363
397
285
237
240
258
cell
6832
4603
4880
5291
3503
2949
3097
3252
envelope
388
282
284
309
213
185
188
197
extracellular region
487
320
310
355
234
187
183
202
1251
macromolecular complex
2441
1679
1761
1949
1339
1145
1201
membrane-enclosed lumen
1305
867
940
1026
661
551
597
619
organelle
4601
3122
3331
3606
2413
2054
2136
2248
synapse
211
150
115
126
86
77
65
71
virion
5
1
2
2
5
1
2
2
138
CHAPTER IV Comparative Seahorse Transcriptomics
Table 5 Effects of normalization
Comparison of normalized and unnormalized cDNA libraries derived from cDNA
preparations of non-pregnant (MID2 and 4) and pregnant (MID3 and 5) male brood
pouch tissues. The number of assembled sequencing reads within each library,
the number of resulting contigs, the number of annotated contigs and the number
of private contigs is reported together with basic descriptive statistics (average
read number per contig and its standard deviation together with average contig
lengths and corresponding standard deviations) for each library. Note that private
contigs here refer to those contigs restricted to either the normalized or
unnormalized libraries from a given tissue (i.e. these contigs may be present in
libraries from the other tissues). Summary information for each tissue is indicated
(Combined).
Non-pregnant brood pouch
Pregnant brood pouch
Normalized
Unnormalized
Combined
Normalized
Unnormalized
Combined
MID2
MID4
MID2&MID4
MID3
MID5
MID3&MID5
assembled reads
144134
145721
289855
205910
85200
291110
Avg length/read ±
SD
203.94 ±
90.58
276.30 ±
115.87
240.30 ±
110.17
238.44 ±
100.07
279.87 ±
121.24
250.57 ±
108.35
Library
# contigs
20871
10986
24842
23776
6709
25299
Private contigs
13856
3971
17827
18590
1523
20113
avg. Reads/contig
± SD
6.91 ±
49.09
13.26 ±
222.34
11.67 ±
165.33
8.66 ± 66.57
12.70 ±
210.00
11.51 ±
144.34
Max reads/contig
3721
13519
14007
5029
11428
12130
Avg contig length
± SD
Avg length of
private contig ±
SD
Avg reads/private
contig ± SD
Max reads/private
contig
378.83 ±
228.37
492.69 ±
262.02
389.98 ±
228.10
401.54 ±
220.13
529.84 ±
289.00
402.65 ±
219.91
308.55 ±
154.45
448.61 ±
217.48
339.75 ±
180.20
356.76 ±
166.52
420.00 ±
215.67
361.54 ±
171.55
2.77 ± 3.79
2.63 ±
10.54
2.74 ± 5.99
3.51 ± 6.52
1.69 ± 1.86
3.37 ± 6.02
91
454
454
216
33
216
139
CHAPTER IV Comparative Seahorse Transcriptomics
Table 6 Pairwise correlations between numbers of contributing reads per
contig in each library
Normalization may result in the loss of quantitative information. For the set of 2719
contigs with contributing reads from all four pouch libraries (MID2-MID5), pairwise
correlations have been calculated to estimate how well the normalized datasets
reflect expression levels in their unnormalized counterparts. Normalized (MID2, 3)
and unnormalized (MID4, 5) cDNA libraries derived from the same cDNA
preparations of non-pregnant (MID2, 4) and pregnant (MID3, 5) male brood pouch
tissues are compared, and the significance of each comparison is identified. Below
diagonal: correlation coefficients; above: associated confidence limits for Pearson
correlation statistics (Fisher’s z transformation). All correlations are highly
significant at p<0.0001.
MID2
MID3
MID4
MID5
MID2
0.866
0.245
0.170
MID3
0.856 - 0.875
0.453
0.347
MID4
0.210 - 0.280
0.423 - 0.482
0.745
MID5
0.134 - 0.206
0.314 - 0.379
0.745 - 0.961
-
140
CHAPTER IV Comparative Seahorse Transcriptomics
Table 7 Oligonucleotides used for cDNA synthesis and quality assays
Oligonucleotides used in cDNA synthesis and test –amplifications. Oligos are indicated with name, base pair sequence in 5’-3’
orientation and associated melting temperatures (TM). The function of each oligonucleotide is indicated, as are reactionconcentrations (Conc.) and authors responsible for each primer (Author).
Name
IIAFwModMmeI
Seqeunce(5’-3’)
TCCAACAAGCAGTGGTATCAACGCAGAGTGCGGGH
TM
69.0
IIAT20ModMmeI
AAGCAGTGGTATCAACGCAGAGTTCCGACTTTTTTTTTTTTTTTTTTTTVN
63.7
IIAT20_Mod_Reamp
Type II Lectin F1
AAGCAGTGGTATCAACGCAGAGTTCCGACTTTTGTCTTTTGTTCTGTTTVN
CTCCTTTGCGGGATCAGTGG
67.0
65.2
Type II Lectin R1
TCCTTCATTTGCTGGAGAGATGC
65.0
Type I Lectin F1
ACTGCAAAGATGGCATTCGCT
64.3
Type I Lectin R1
CCGTTGCAACAACAGGGTGGCAG
72.7
Type III Lectin F1
TCCTTTGTGGGATCAGCGGACTG
69.7
Type III Lectin R1
TGACAAGCAAACCCCGTTGC
66.5
Type II Lectin F2
Type II Lectin R2
Type I Lectin R2
Type I Lectin F2
Type III Lectin R2
Type III Lectin F2
Bactin 5F’
CTTCAGTCACAATGAAGCTCA
TTTCCAGGTCACTGTGGATGG
ATCACGTTGGAAGATGTAACA
TATGGACCGATGGCACAGTTA
CAGACACTCTCGGCATCTGCA
ATGATTGCGTGGAGCTTCGTC
ATGGATGATGAAATTGCCG
60.6
67.1
59.5
65.0
69.1
68.5
50.9
Bactin 3R1
AGGTAGTCTGTGAGGTCTCG
54.8
Function
First strand cDNA
synthesis
Second strand cDNA
synthesis
Poly-T suppression
control
amplifications, RACE
control
amplifications, RACE
control
amplifications, RACE
control
amplifications, RACE
control
amplifications, RACE
control
amplifications, RACE
RACE
RACE
RACE
RACE
RACE
RACE
control
amplifications, RACE
control
amplifications, RACE
Author
KNS
KNS
KNS
KNS
KNS
KNS
KNS
KNS
KNS
KNS
KNS
KNS
KNS
KNS
KNS
Lee
2000
Lee
2000
141
CHAPTER IV Seahorse Transcriptomics
Figure 1 Identification of male pregnancy genes
cDNA libraries shown as three pools: Reference genes (green pool), genes from
the pregnant pouch (yellow) and genes from the non-pregnant pouch (blue). A,
genes present in pregnant pouch and pregnant reference tissues, B, genes shared
by all pools, C genes shared between non-pregnant and pregnant pouch tissues
and pregnant reference tissues, D, genes shared between the non-pregnant
pouch and the reference tissues. For unnormalized cDNA libraries, pouch-specific
genes are obtained by determining the yellow (non-shared) pouch pregnancy
genes, the blue (non-shared) pouch non-pregnancy genes and by extracting
quantitative information for the fraction of shared pouch-specific genes for which
these data are available. Since quantitative information is not available from
normalized libraries (see Table 6), these libraries are used solely for qualitative
analyses.
142
CHAPTER IV Seahorse Transcriptomics
Figure 2: Venn diagrams – distribution of annotated contigs
Venn diagrams depicting the number of contigs per cDNA-pool split into shared
and non-shared (private) pool fractions. A Summary information for all 10309
annotated contigs in the full dataset. B Summary information for the 5178
annotated contigs in the dataset of 15300 contigs built from five or more
sequencing reads.
143
CHAPTER IV Seahorse Transcriptomics
Figure 3 Histograms contig-length of annotated and complete datasets
Histogram for secondary assembly contigs, plotting the observed number of
contigs against the contig length in base pairs. Dark blue: Full set of 38419
secondary assembly contigs; Yellow: annotated contigs (10309). Arrowheads
indicate the average contig length for the full dataset (dark blue) and the subset of
annotated contigs (yellow, see also Table 3).
144
CHAPTER IV Seahorse Transcriptomics
Figure 4 Annotation of pouch-specific pregnancy genes
Annotation of pouch-specific pregnancy genes with five or more contributing
reads. Blue: downregulated genes, yellow: upregulated genes. A Top level
biological processes for all annotated genes, B Major molecular functions for all
annotated genes, C predominant localization of all annotated genes (Table 6 and
Methods).
145
CHAPTER IV Seahorse Transcriptomics
Additional file 1 181 annotated genes which are downregulated or entirely absent from the pregnant brood pouch.
Overview of annotated contigs absent from the pregnant brood pouch or more than two-fold downregulated in the pregnant brood
pouch. Contigs are indicated together with their lengths in base pairs and the numbers of contributing reads from the normalized
and unnormalized cDNA libraries. Norm= normalized cDNA library, Unnorm= unnormalized cDNA library. PP=pregnant brood
pouch tissue, NP=non-pregnant brood pouch tissue. Fold difference reflects expression differences between the unnormalized nonpregnant and pregnant tissues. E-values and sequence descriptions are indicated for the top-blastx hit for each contig together with
corresponding GenBank accession numbers. GO annotations are indicated wherever available and the remaining annotations were
inferred by blast2go (b2g inferred).
Contig
length
(bp)
MID2
Norm/
NP
MID3
Norm/
PP
MID4
Unnorm/
NP
MID5
Unnorm/
PP
Fold
difference
evalue
Sequence description
GenBank
Accession No.
annotation
Contig8690
793
0
0
5
1
5
4.97E-28
guanine nucleotide binding alpha 11
gi|125850059
GO:0001508
Contig25156
1267
0
1
5
2
2.5
4.63E-79
envoplakin
gi|47214954
GO:0001533
Contig3326
273
6
0
0
0
-
3.96E-33
unc-93 homolog b1 ( elegans)
gi|189515413
GO:0002224
CL546Contig3
275
5
0
0
0
-
1.98E-11
sf3b2 protein
gi|194390138
GO:0003676
Contig27446
915
1
1
4
2
2
2.50E-73
regulatory factor 2 (influences hla class ii expression)
gi|47222197
GO:0003677
CL1Contig5434
509
0
1
11
2
5.5
9.62E-76
eukaryotic translation initiation factor
gi|189532710
GO:0003743
CL3723Contig1
412
4
4
5
1
5
4.20E-59
elongation factor 2
gi|28278942
GO:0003746
Contig8455
965
0
9
33
3
11
9.11E-146
a disintegrin-like and metallopeptidase (reprolysin type)
gi|47222514
GO:0004222
Contig6632
483
5
0
3
0
-
1.05E-37
malic enzyme nad(+)- mitochondrial
gi|237681177
GO:0004471
Contig1265
880
2
6
8
4
2
2.08E-94
udp-n-acetyl-alpha-d-galactosamine:polypeptide nacetylgalacto...
gi|125839743
GO:0004653
CL3455Contig2
658
0
0
4
1
4
1.40E-99
rna guanylyltransferase and 5 -phosphata...
gi|47224366
GO:0004725
CL5253Contig1
1109
1
0
7
0
-
9.62E-90
signal transducer and activator of trans...
gi|224613364
GO:0004871
Contig9207
351
5
0
0
0
-
3.74E-31
hypoxia inducible factor alpha subunit...
gi|56785781
GO:0004871
CL4735Contig1
557
1
4
4
2
2
4.20E-71
tumor necrosis factor receptor member 19
gi|225707736
GO:0004872
Contig27543
850
9
1
6
2
3
1.16E-79
g protein-coupled receptor kinase 5
gi|47228574
GO:0005080
146
CHAPTER IV Seahorse Transcriptomics
Contig
length
(bp)
MID2
Norm/
NP
MID3
Norm/
PP
MID4
Unnorm/
NP
Contig25605
973
1
4
11
Contig4207
1903
3
9
37
CL8414Contig1
697
0
0
5
CL9583Contig1
565
3
0
MID5
Unnorm/
PP
Fold
difference
evalue
Sequence description
GenBank
Accession No.
annotation
5
2.2
12
3.08
9.79E-95
rho gtpase activating protein 12
gi|187607956
GO:0005096
0
membrane calcium atpase family member (mca-3)
gi|73984630
GO:0005388
0
-
4.95E-32
gag-pro-pol polyprotein
gi|83722645
GO:0005488
2
0
-
8.21E-43
zinc finger protein
gi|47216468
GO:0005488
Contig2281
927
1
0
5
0
-
2.10E-89
muscleblind-like 2
gi|239735526
GO:0005488
Contig25992
561
1
0
4
1
4
2.11E-27
gi|123703665
GO:0005488
Contig3139
1267
1
3
8
1
8
1.24E-129
ras-gtpase activating protein sh3 domain-binding
protein 2
ankyrin repeat and btb domain containing 2...
gi|47215237
GO:0005488
CL9103Contig1
313
5
0
0
0
-
6.24E-53
eukaryotic translation initiation factor
gi|223648062
GO:0005515
Contig10583
427
1
0
4
0
-
1.79E-25
hiv-1 induced protein hin-1
gi|47209320
GO:0005515
Contig1070
1085
1
0
18
2
9
2.27E-58
eukaryotic translation initiation factor 3 subunit 6
gi|47209929
GO:0005515
Contig8472
1031
0
3
28
5
5.6
8.30E-92
zinc finger protein 503
gi|82238283
GO:0005515
Contig9732
819
0
0
8
1
8
4.24E-18
solute carrier family 39 (zinc transporter) member 7
gi|146147383
GO:0005515
Contig812
304
1
1
5
2
2.5
3.72E-15
lectin protein type i
gi|34013698
GO:0005529
Contig880
399
1
1
20
3
6.67
2.36E-17
lectin protein type i
gi|34013698
GO:0005529
Contig25542
552
0
0
4
1
4
3.92E-10
senescence-associated
gi|6715146
GO:0005576
Contig10084
740
3
1
12
1
12
2.47E-32
small gtpase ras-dva-3
gi|82617940
GO:0005622
Contig2143
332
1
2
6
1
6
4.67E-42
integral membrane protein 1
gi|148226196
GO:0005624
Contig25785
656
0
0
4
1
4
3.51E-26
transaldolase 1
gi|225706208
GO:0005625
Contig27518
920
2
1
8
3
2.67
2.53E-41
transaldolase 1
gi|226443406
GO:0005625
CL7925Contig1
559
1
0
4
0
-
5.03E-12
phd finger protein 10
gi|225714712
GO:0005634
Contig19735
468
5
0
1
0
-
8.33E-31
c-maf-inducing protein
gi|125843248
GO:0005634
CL9003Contig1
503
0
0
4
1
4
3.05E-71
uba and wwe domain containing 1
gi|189536057
GO:0005730
CL5010Contig1
442
0
2
7
1
7
7.54E-74
lim domain containing preferred transloc...
gi|58801524
GO:0005737
CL6534Contig1
913
1
0
5
1
5
1.58E-98
tumor protein p53 binding 2
gi|47223292
GO:0005737
Contig20232
376
5
0
0
0
-
9.50E-36
rho gdp dissociation inhibitor alpha
gi|47219625
GO:0005737
Contig20356
487
8
0
1
0
-
1.26E-10
copper chaperone for superoxide dismutase
gi|47212233
GO:0005737
147
CHAPTER IV Seahorse Transcriptomics
Contig
length
(bp)
MID2
Norm/
NP
MID3
Norm/
PP
MID4
Unnorm/
NP
MID5
Unnorm/
PP
Fold
difference
evalue
Sequence description
GenBank
Accession No.
annotation
Contig2385
704
0
0
4
1
4
4.78E-71
casein kinase 1 epsilon
gi|7798595
GO:0005737
Contig26624
436
3
0
2
0
-
1.19E-13
kinesin family member 13b
gi|125841549
GO:0005737
Contig26753
619
1
1
6
2
3
2.95E-53
sh3 and px domains 2b
gi|60649481
GO:0005737
Contig26892
684
0
0
7
1
7
4.47E-89
triple functional domain (ptprf interacting)
gi|47224099
GO:0005737
Contig3254
675
1
3
4
1
4
2.44E-53
asparaginyl-trna synthetase
gi|148231213
GO:0005737
Contig4593
701
1
1
4
1
4
3.17E-18
pleckstrin homology domain family a (phosphoinositide
binding
gi|47087415
GO:0005737
Contig4762
637
1
2
4
1
4
2.05E-38
protein cxorf17 homolog
gi|189535889
GO:0005737
Contig7679
648
1
0
5
0
-
5.61E-61
myeloid lymphoid or mixed-lineage leukemia (trithorax
drosophi...
gi|55925532
GO:0005737
Contig977
486
0
0
7
2
3.5
1.86E-30
beta-actin
gi|94537157
GO:0005737
Contig929
806
0
1
18
2
9
2.55E-69
nadh dehydrogenase subunit 5
gi|25057953
GO:0005743
Contig26079
892
0
0
4
2
2
3.99E-44
cathepsin f
gi|37903252
GO:0005764
CL1Contig4825
993
0
0
5
1
5
8.39E-36
carboxylesterase 2 ( liver)
gi|47219812
GO:0005783
Contig8611
653
2
5
4
1
4
4.04E-75
ergic and golgi 3
gi|157820783
GO:0005789
Contig26544
880
1
5
4
1
4
3.85E-147
eukaryotic translation initiation factor subunit d...
gi|47217933
GO:0005852
Contig25653
645
0
0
5
2
2.5
1.96E-66
beta-actin
gi|157278351
GO:0005856
CL2520Contig2
847
1
0
9
1
9
3.36E-61
claudin 1
gi|49333479
GO:0005887
CL9509Contig1
639
2
0
3
0
-
7.27E-45
solute carrier family (neutral amino aci...
gi|47220869
GO:0005887
Contig1553
433
6
4
23
1
23
3.75E-34
rh type b glycoprotein
gi|123909597
GO:0005887
Contig4760
516
0
3
4
1
4
3.05E-29
rh type c glycoprotein
gi|123886327
GO:0005887
Contig6276
638
1
0
5
0
-
2.04E-44
isocitrate dehydrogenase 1
gi|148232240
GO:0005975
Contig26993
1441
0
1
11
5
2.2
5.02E-110
6-phosphofructo-2-kinase fructose- -biphosphatase 2
gi|41055967
GO:0006007
CL4254Contig3
186
7
0
0
0
-
2.40E-20
spastic ataxia of charlevoix-saguenay
gi|47226310
GO:0006457
Contig6910
982
0
0
7
0
-
8.85E-12
subfamily member 11
gi|77735491
GO:0006457
Contig26046
486
0
1
4
1
4
5.45E-14
vesicle-associated membrane protein 8
gi|209155888
GO:0006461
CL1Contig4615
670
0
0
5
0
-
1.98E-67
methionine adenosyltransferase alpha
gi|47226445
GO:0006556
148
CHAPTER IV Seahorse Transcriptomics
Contig
length
(bp)
MID2
Norm/
NP
MID3
Norm/
PP
MID4
Unnorm/
NP
MID5
Unnorm/
PP
Fold
difference
evalue
Sequence description
GenBank
Accession No.
annotation
Contig1096
838
0
0
18
0
-
5.53E-13
methionine adenosyltransferase alpha
gi|90076722
GO:0006556
CL1Contig4455
818
0
1
6
3
2
2.21E-22
partial
gi|84579145
GO:0006814
Contig620
401
13
0
0
0
-
3.30E-11
rer1 protein
gi|41053411
GO:0006890
CL1Contig3843
478
0
0
4
1
4
3.04E-20
plastin 3 (t isoform)
gi|224097921
GO:0007015
CL6554Contig1
410
3
0
4
0
-
6.89E-50
eph receptor a2
gi|189536014
GO:0007169
CL3322Contig1
481
0
0
13
3
4.33
9.93E-64
cnksr family member 3
gi|126311220
GO:0007243
Contig7359
669
0
3
7
2
3.5
2.52E-91
plexin b2
gi|47224387
GO:0007275
Contig2834
1049
4
27
19
4
4.75
5.96E-133
hyaluronoglucosaminidase 5
gi|29470175
GO:0007341
Contig22686
495
0
2
4
1
4
1.18E-53
solute carrier family 9 (sodium hydrogen exchanger)
member 2
gi|70722630
GO:0008104
Contig26935
640
0
1
5
2
2.5
4.50E-43
protein
gi|13359451
GO:0008134
Contig9835
752
5
0
3
0
-
9.86E-42
kallikrein-related peptidase 15
gi|47212679
GO:0008233
Contig9839
878
19
19
16
2
8
3.01E-81
loc561562 protein
gi|225716632
GO:0008233
Contig2237
323
5
0
0
0
-
2.53E-11
serine arginine repetitive matrix 1
gi|47219559
GO:0008380
Contig2723
977
0
0
8
1
8
5.50E-29
pg1 protein
gi|238855136
GO:0009536
Contig8803
1059
0
0
6
3
2
8.98E-30
clock homolog 3
gi|251747935
GO:0009648
Contig9936
989
0
2
4
1
4
9.35E-85
notch homolog translocation-associated
gi|148725836
GO:0009653
Contig961
890
1
2
48
3
16
2.05E-12
methionine adenosyltransferase alpha
gi|149036421
GO:0009725
Contig18825
927
1
7
5
1
5
1.01E-120
eukaryotic translation initiation factor subunit 2 39kda
gi|126282310
GO:0009749
Contig1041
1539
0
3
98
30
3.27
4.77E-88
gi|122114590
GO:0009952
CL7097Contig1
448
1
0
5
0
-
4.25E-62
ubiquitously transcribed tetratricopeptide x
chromosome
adam metallopeptidase with thrombospondi...
gi|47226569
GO:0009986
CL7640Contig1
984
1
0
5
0
-
1.21E-111
transducin -like 3
gi|47218051
GO:0009987
Contig1646
950
1
6
12
2
6
3.16E-48
delta protein
gi|189527777
GO:0009987
Contig17993
1180
1
0
8
1
8
2.74E-90
myeloid lymphoid or mixed-lineage leukemia 2
gi|3540281
GO:0009987
CL3818Contig2
323
5
0
0
0
-
4.94E-18
sec31 homolog a
gi|41054764
GO:0015031
Contig7468
361
10
0
2
0
-
1.23E-18
member ras oncogene family
gi|47211718
GO:0015031
Contig988
866
0
0
6
2
3
1.28E-84
exocyst complex component 5
gi|47230177
GO:0015031
149
CHAPTER IV Seahorse Transcriptomics
Contig
length
(bp)
MID2
Norm/
NP
MID3
Norm/
PP
MID4
Unnorm/
NP
MID5
Unnorm/
PP
Fold
difference
evalue
Sequence description
GenBank
Accession No.
annotation
CL218Contig7
279
16
0
0
Contig9256
485
0
0
5
0
-
3.58E-29
rhamnose-binding lectin
gi|58465408
GO:0016020
1
5
7.55E-52
cnksr family member 3
gi|47219526
GO:0016020
Contig1151
1669
6
7
35
6
5.83
1.34E-133
solute carrier family member 1
gi|41053617
GO:0016021
Contig17186
418
3
0
2
0
-
5.43E-46
transmembrane channel-like 2
gi|189519780
GO:0016021
Contig4621
1122
0
Contig1038
847
2
4
6
3
2
2.01E-137
dispatched homolog 1
gi|118087850
GO:0016021
6
14
6
2.33
8.74E-46
eukaryotic translation initiation factor 4 2
gi|47230440
GO:0016281
Contig25996
518
0
1
6
1
6
2.31E-42
atg3 autophagy related 3 homolog ( cerevisiae)
gi|41053345
GO:0016567
Contig19339
479
5
0
0
0
-
1.72E-12
myotubularin related protein 14
gi|189520682
GO:0016791
Contig26386
762
0
0
22
3
7.33
6.39E-47
atp-binding sub-family c (cftr mrp) member 5
gi|47226181
GO:0017111
CL3541Contig1
845
1
0
10
3
3.33
2.73E-79
arsenic (+3 oxidation state) methyltrans...
gi|47220315
GO:0018872
Contig10231
1114
2
5
8
1
8
8.07E-46
solute carrier family 23 (nucleobase transporters)
member 2
gi|189546543
GO:0022891
Contig9911
471
0
3
4
1
4
3.25E-43
adp-ribosylation factor interacting protein 2b
gi|62955267
GO:0030036
CL6282Contig1
645
0
1
4
2
2
8.59E-113
eukaryotic translation initiation factor
gi|164498968
GO:0030154
Contig2165
715
0
0
5
2
2.5
1.60E-116
isoform cra_a
gi|47226311
GO:0030170
Contig2884
823
9
17
8
2
4
2.56E-41
stromal interaction molecule 1
gi|47227834
GO:0030176
Contig9264
327
5
0
0
0
-
5.76E-24
potassium inwardly-rectifying subfamily member 11
gi|89886327
GO:0030315
Contig10375
752
0
2
6
1
6
2.66E-94
atp-binding sub-family a member 1
gi|47212013
GO:0030349
Contig6147
877
6
0
2
0
-
2.92E-92
homolog 1 ( coli)
gi|47214710
GO:0031167
Contig2197
785
1
0
4
1
4
1.42E-129
gi|169786808
GO:0031821
Contig6373
512
0
1
4
1
4
3.76E-48
guanine nucleotide binding protein (g protein) alpha
inhibitin
phospholipase gamma 2
gi|47221900
GO:0032959
Contig1755
960
2
2
11
1
11
1.16E-105
transferrin receptor
gi|47227995
GO:0035162
Contig21216
804
1
4
4
1
4
5.87E-65
anion exchanger
gi|189525811
GO:0035162
Contig3283
1169
1
3
4
2
2
1.92E-70
tensin like c1 domain containing phosphatase (tensin 2)
gi|189535788
GO:0035264
CL7852Contig1
396
5
0
0
0
-
2.00E-51
enhancer of polycomb homolog 1
gi|47221116
GO:0040008
CL8236Contig1
470
0
0
5
0
-
5.36E-65
tripartite motif-containing 39
gi|47223678
GO:0042802
Contig2231
774
1
0
4
2
2
1.19E-39
dom-3 homolog z
gi|47218017
GO:0042802
150
CHAPTER IV Seahorse Transcriptomics
Contig
length
(bp)
MID2
Norm/
NP
MID3
Norm/
PP
MID4
Unnorm/
NP
MID5
Unnorm/
PP
Fold
difference
evalue
Sequence description
GenBank
Accession No.
annotation
CL2271Contig2
844
0
2
4
Contig3174
1310
0
3
7
1
4
2
3.5
6.59E-53
supervillin
gi|189525875
GO:0043034
2.51E-65
svil protein
gi|47225200
GO:0043229
Contig6187
881
1
3
8
4
2
4.52E-28
sterol regulatory element binding transcription factor 2
gi|47217021
GO:0043231
Contig2222
580
0
0
5
1
5
1.42E-48
ubiquitin carboxyl-terminal hydrolase l5
gi|47217741
GO:0043234
Contig7307
487
1
8
4
1
4
3.89E-20
nuclear receptor co-repressor 1
gi|158517898
GO:0043565
CL10Contig6
494
3
4
4
2
2
8.32E-29
novel protein
gi|160333557
GO:0044238
CL1Contig3822
583
0
5
58
29
2
5.71E-55
beta-actin
gi|109492380
GO:0044424
Contig26279
484
3
0
4
0
-
5.10E-28
phosphatidylinositol-5-phosphate 4- type alpha
gi|47223480
GO:0046488
CL7566Contig1
244
6
0
0
0
-
2.76E-16
neutral protease
gi|115373991
GO:0046872
Contig8488
608
6
15
10
2
5
9.34E-41
ring finger protein 183
gi|115497842
GO:0046872
Contig9943
993
0
5
17
6
2.83
9.42E-58
establishment of cohesion 1 homolog 1
gi|149411306
GO:0046872
Contig26649
883
1
4
34
10
3.4
7.32E-36
tumor necrosis factor receptor member 26
gi|28875517
GO:0046914
CL8625Contig1
280
5
0
0
0
-
7.18E-38
gdp dissociation inhibitor 1
gi|47229667
GO:0046933
Contig878
1274
3
5
17
4
4.25
2.44E-156
inositol -triphosphate 5 6 kinase
gi|189531088
GO:0047325
Contig566
347
6
0
0
0
-
1.81E-25
dedicator of cytokinesis 7
gi|158253447
GO:0048365
CL8649Contig1
385
2
0
3
0
-
2.24E-54
ring finger protein 14
gi|224613426
GO:0050681
Contig1136
989
6
10
19
6
3.17
4.22E-61
keratin 8
gi|39645432
GO:0050896
CL1Contig3952
524
0
0
5
2
2.5
2.48E-58
rna binding motif protein 47
gi|47209668
b2g inferred
CL1Contig4094
291
0
0
6
1
6
9E-09
lectin protein type i
gi|34013698
b2g inferred
CL1Contig4187
819
0
0
6
1
6
3.08E-24
protein
gi|60687936
b2g inferred
CL1Contig4262
734
0
0
6
1
6
1.38E-22
protein
gi|60687936
b2g inferred
CL1Contig4386
315
0
0
7
3
2.33
7.43E-14
zgc:158463 protein
gi|148357120
b2g inferred
CL1Contig4738
610
0
0
5
1
5
0.0002489
af095770_1pth-responsive osteosarcoma d1
gi|4588085
b2g inferred
CL1Contig5000
921
0
1
4
1
4
2.18E-11
chromosome 17 open reading frame 37
gi|152013691
b2g inferred
CL1Contig5135
479
0
0
4
1
4
2.39E-41
zgc:158463 protein
gi|68226711
b2g inferred
CL3253Contig1
650
0
0
4
2
2
1.49E-17
novel protein vertebrate elongation of v...
gi|115495643
b2g inferred
CL7161Contig1
868
0
0
6
0
-
2.07E-77
solute carrier family member 4
gi|47229374
b2g inferred
151
CHAPTER IV Seahorse Transcriptomics
Contig
length
(bp)
MID2
Norm/
NP
MID3
Norm/
PP
MID4
Unnorm/
NP
MID5
Unnorm/
PP
Fold
difference
evalue
CL7887Contig1
502
0
1
4
1
4
3.36E-33
CL7944Contig1
952
1
0
4
1
4
8.64E-39
CL8149Contig1
252
5
0
0
0
-
0.0003143
CL8277Contig1
458
1
0
4
0
-
Contig1004
374
0
0
5
1
Contig1017
443
0
0
5
0
Contig1024
467
0
2
8
Contig10241
480
2
3
Contig1068
345
0
Contig1085
549
0
Contig1103
573
Contig1110
Sequence description
GenBank
Accession No.
annotation
novel protein
gi|47224118
b2g inferred
ankyrin repeat domain 12
gi|220672679
b2g inferred
novel protein vertebrate lps-responsive...
gi|220941667
b2g inferred
7.265E-06
btb domain containing isoform cra_c
gi|119593510
b2g inferred
5
1.47E-22
zgc:158463 protein
gi|148357120
b2g inferred
-
7.24E-36
zgc:158463 protein
gi|16930529
b2g inferred
4
2
9.60E-19
kiaa1839 protein
gi|16930529
b2g inferred
4
1
4
7.01E-29
mgc80389 protein
gi|194332566
b2g inferred
0
20
5
4
0.0001034
lectin protein type i
gi|34013698
b2g inferred
1
6
1
6
1.88E-30
zgc:158463 protein
gi|68226711
b2g inferred
0
2
37
19
2
2.62E-07
rrna intron-encoded endonuclease
gi|47155411
b2g inferred
162
0
0
4
2
2
2.698E-05
zgc:158463 protein
gi|148357120
b2g inferred
Contig1175
735
0
0
4
2
2
1.35E-22
protein
gi|60687936
b2g inferred
Contig1188
433
1
0
4
2
2
2.11E-10
zgc:158463 protein
gi|90081018
b2g inferred
Contig1212
1155
0
1
32
15
2.13
1.10E-13
protein
gi|226453528
b2g inferred
Contig1892
948
0
2
5
2
2.5
1.50E-84
family with sequence similarity member h...
gi|113682418
b2g inferred
Contig20291
607
4
0
1
0
-
2.99E-19
lymphocyte antigen 75 precursor
gi|237769789
b2g inferred
Contig25915
465
0
0
4
1
4
4.184E-06
zgc:158463 protein
gi|148357120
b2g inferred
Contig26048
530
9
0
1
0
-
1.19E-11
chromosome 20 open reading frame 116
gi|224050323
b2g inferred
Contig26199
240
0
1
8
2
4
3.168E-06
cell wall glucanase
gi|156357429
b2g inferred
Contig26709
569
1
0
4
0
-
1.26E-06
leukocyte receptor cluster member 8
gi|148236347
b2g inferred
Contig3048
487
4
10
7
2
3.5
3.18E-30
kinesin-like protein
gi|47221202
b2g inferred
Contig4252
635
10
5
29
2
14.5
2.82E-22
nattectin precursor
gi|34013702
b2g inferred
Contig4547
257
5
0
0
0
-
7.187E-06
golgi-associated plant pathogenesis-related protein 1
gi|189519176
b2g inferred
Contig4959
362
4
0
1
0
-
1.415E-06
glutathione s-transferase theta-1
gi|68366260
b2g inferred
Contig594
344
1
0
5
1
5
4.659E-05
6-phosphofructo-2-kinase fructose- -biphosphatase 4
gi|213511877
b2g inferred
Contig6028
1048
1
2
7
1
7
9.89E-122
novel protein
gi|94733339
b2g inferred
152
CHAPTER IV Seahorse Transcriptomics
Contig
length
(bp)
MID2
Norm/
NP
MID3
Norm/
PP
MID4
Unnorm/
NP
MID5
Unnorm/
PP
Fold
difference
evalue
Contig6384
462
2
Contig7051
546
3
Contig7624
507
Contig7704
392
Contig7778
Sequence description
GenBank
Accession No.
annotation
0
3
8
10
0
-
1
10
4.78E-18
semaphorin 7a
gi|189542521
b2g inferred
2.28E-23
gi|47213151
b2g inferred
2.56E-25
carcinoembryonic antigen-related cell adhesion
molecule 1
tpa_inf: twist3a
7
0
8
0
0
0
-
0
0
-
gi|156630558
b2g inferred
2.031E-05
zgc:172136 protein
gi|162287308
b2g inferred
416
6
0
0
0
-
4.08E-07
transcobalamin-2 precursor
gi|47226456
b2g inferred
Contig8426
580
1
0
6
3
2
2.17E-22
tpa: nadph oxidase organizer 1
gi|47218052
b2g inferred
Contig8913
Contig9774
1226
0
2
1106
3
8
10
3
3.33
4.73E-111
sec16 homolog a ( cerevisiae)
gi|47209224
b2g inferred
69
20
3.45
3.09E-137
cg31028- isoform partial
gi|47207885
b2g inferred
Contig9777
792
1
1
11
3
3.67
7.75E-14
tumor necrosis factor receptor member 26
gi|28875517
b2g inferred
153
CHAPTER IV Seahorse Transcriptomics
Additional file 2 88 annotated genes which are upregulated in pregnant brood pouch tissues and/or entirely absent from
the non-pregnant pregnant brood pouch libraries.
Overview of annotated contigs absent from the non-pregnant brood pouch or more than two-fold upregulated in the pregnant brood
pouch. Contigs are indicated together with their lengths in base pairs and the numbers of contributing reads from the normalized
and unnormalized cDNA libraries. Norm= normalized cDNA library, Unnorm= unnormalized cDNA library. PP=pregnant brood
pouch tissue, NP=non-pregnant brood pouch tissue. Fold difference reflects expression differences between the unnormalized nonpregnant and pregnant tissues. E-values and sequence descriptions are indicated for the top-blastx hit for each contig together with
corresponding GenBank accession numbers. GO annotations are indicated wherever available and theremaining annotations were
inferred by blast2go (b2g inferred).
Contig
length
(bp)
MID2
Norm/NP
MID3
Norm/PP
MID4
Unnorm/
NP
MID5
Unnorm/
PP
Fold
difference
evalue
Sequence description
GenBank
Accession
No.
annotation
CL1Contig3916
777
0
0
2
5
2.5
CL1Contig4846
219
0
0
2
4
2
5.35E-34
keratin 8
gi|159155987
GO:0005198
2.1E-08
zgc:158463 protein
gi|148357120
b2g inferred
CL1Contig4934
596
0
1
2
6
3
2.77E-28
senescence-associated protein
gi|118392259
GO:0008134
CL2922Contig1
445
0
4
0
1
-
2.99E-57
signal transducing adaptor molecule (sh3...
gi|148725569
GO:0005070
CL3319Contig1
372
0
14
0
CL3805Contig2
471
0
3
2
2
-
2.73E-16
ctage member 5
gi|41053471
b2g inferred
5
2.5
2.49E-46
bcl2 adenovirus e1b 19kda interacting pr
gi|47206353
GO:0008634
CL3960Contig1
344
0
7
0
0
-
8.39E-58
serine threonine kinase ste20 sps1 homol
gi|118093669
GO:0005737
CL5598Contig1
266
0
7
0
0
-
8.14E-13
unnamed protein product [Tetraodon nigro...
gi|47223103
GO:0004714
CL6455Contig1
351
CL6617Contig1
538
0
6
0
1
-
3.38E-59
pre-mrna processing factor 8
gi|169646741
GO:0005682
0
6
0
1
-
4.94E-44
mga protein
gi|5931585
GO:0030528
CL6755Contig1
278
0
6
0
0
-
3.23E-38
lipocalin-interacting membrane receptor
gi|38564425
GO:0016021
CL6784Contig1
549
0
3
0
4
-
6.90E-15
ahnak nucleoprotein isoform 1
gi|189525028
b2g inferred
CL6845Contig1
251
0
6
0
0
-
4.22E-22
riken cdna 1110020p15 variant 1
gi|229366812
GO:0005743
CL7033Contig1
486
0
4
0
1
-
7.07E-57
vesicle transport through interaction wi...
gi|118093013
GO:0005484
154
CHAPTER IV Seahorse Transcriptomics
Contig
length
(bp)
MID2
Norm/NP
MID3
Norm/PP
MID4
Unnorm/
NP
MID5
Unnorm/
PP
Fold
difference
evalue
Sequence description
GenBank
Accession
No.
annotation
CL7521Contig1
299
0
6
0
0
-
5.40E-33
kit ligand
gi|159149094
GO:0016020
CL7760Contig1
327
0
5
0
0
-
2.78E-13
phosphatidic acid phosphatase type 2 dom...
gi|165971070
GO:0016787
CL8009Contig1
407
0
0
2
4
2
1.57E-32
zinc finger
gi|47221021
GO:0005488
CL8028Contig1
427
0
2
0
3
-
2.52E-62
phosphorylase kinase alpha 1
gi|189521695
GO:0005516
CL8211Contig1
462
0
5
0
0
-
1.04E-12
inositol -1(or 4)-monophosphatase 1
gi|62079620
GO:0004437
CL8459Contig1
263
0
5
0
0
-
4E-09
eef1a1 protein
gi|47122516
GO:0003746
CL8760Contig1
265
0
5
0
0
-
1.18E-11
ninein-like protein
gi|189527320
GO:0015630
CL8782Contig1
356
0
5
0
0
-
2.87E-26
caspase recruitment domain member 14
gi|125819589
GO:0001934
CL8982Contig1
434
0
4
0
1
-
4.95E-41
dynamin binding protein
gi|74002322
GO:0035023
CL9119Contig1
453
0
5
0
0
-
3.3E-08
unnamed protein product [Tetraodon nigro...
gi|47214857
GO:0005488
guanine nucleotide binding protein (g pr...
gi|47218963
GO:0004871
CL9197Contig1
787
0
3
0
2
-
2.63E118
CL9269Contig1
348
0
5
0
0
-
2.80E-13
40s ribosomal protein s12
gi|14903288
GO:0003735
tyrosine 3-monooxygenase tryptophan 5-mo...
gi|148225538
GO:0001764
CL9568Contig1
766
0
4
0
1
-
1.73E103
CL9588Contig1
313
0
5
0
0
-
1.78E-20
novel protein
gi|189516664
GO:0005488
Contig10181
505
0
6
0
5
-
1.06E-54
glyoxalase 1
gi|197631899
GO:0009438
Contig10416
424
0
0
0
6
-
4.5E-08
glycoprotein a repetitions predominant precursor
gi|47214662
b2g inferred
gp25l2 [Homo sapiens]
gi|996057
b2g inferred
Contig10568
513
0
5
0
0
-
2.787E06
Contig1057
719
0
0
3
6
2
6.78E-18
protein
gi|60687936
GO:0043565
Contig10679
639
0
5
0
0
-
4.68E-25
novel protein vertebrate nipped-b homolog
gi|47181598
GO:0005634
Contig10686
489
0
5
0
0
-
4.12E-29
heat repeat containing 1
gi|47213370
GO:0005515
Contig10696
439
0
1
0
4
-
1.81E-33
xlfli protein
gi|126327441
GO:0004871
Contig1851
878
1
3
2
4
2
1.34E-81
rho gtpase activating protein 23
gi|189525879
b2g inferred
Contig1871
584
0
2
2
6
3
3.50E-59
tripartite motif-containing 16
gi|47217647
GO:0005737
motor neuron and pancreas homeobox 1
gi|57770400
b2g inferred
huntingtin interacting protein 1 related
gi|134133242
GO:0005856
Contig1916
261
0
11
0
0
-
2.712E05
Contig2059
520
0
1
1
6
6
8.48E-27
155
CHAPTER IV Seahorse Transcriptomics
Contig
length
(bp)
MID2
Norm/NP
MID3
Norm/PP
MID4
Unnorm/
NP
MID5
Unnorm/
PP
Fold
difference
evalue
Sequence description
GenBank
Accession
No.
annotation
Contig2104
545
0
6
0
0
-
2.18E-10
translocase of inner mitochondrial membrane 50
homolog
gi|45709908
GO:0006915
Contig21307
397
0
5
0
0
-
9.30E-36
type alpha 2
gi|47222238
GO:0005581
Contig2141
472
0
5
0
0
-
1.92E-19
zinc finger protein 512
gi|189535838
GO:0046872
Contig2192
437
0
4
0
2
-
1.04E-33
voltage-gated sodium channel
gi|123913391
GO:0005272
Contig22254
528
0
5
0
0
-
3.59E-60
mitogen-activated protein kinase 1
gi|126324784
GO:0050853
Contig22473
307
0
5
0
0
-
2E-08
glutamine synthetase
gi|25992551
GO:0004356
Contig2262
547
0
5
0
0
-
8.04E-45
ras and rab interactor 1
gi|68397693
GO:0044464
Contig22699
646
0
5
0
0
-
4.64E-90
xrcc6 binding protein 1
gi|209732478
GO:0006303
Contig2278
554
0
5
0
0
-
5.35E-44
microspherule protein 1
gi|47220687
GO:0005737
Contig22925
382
0
5
0
0
-
1.29E-19
centrosomal protein 290kda
gi|47220555
GO:0005829
Contig23174
473
0
4
0
1
-
1.78E-50
chromosome 1 open reading frame 58
gi|47222464
GO:0016020
Contig23737
661
0
5
0
0
-
6.59E-37
hiv-1 rev binding protein 2
gi|224094097
GO:0005732
PREDICTED: similar to papilin [Acyrthosiphon pisum]
gi|193699971
b2g inferred
Contig23773
405
0
7
0
0
-
3.173E06
Contig2393
393
0
4
0
1
-
4.06E-17
beta-adrenergic receptor kinase 2
gi|197927112
GO:0047696
Contig24238
359
0
5
0
0
-
6E-09
secretory carrier membrane protein 1
gi|56797759
GO:0016021
Contig24249
556
0
5
0
0
-
1.10E-34
procollagen- 2-oxoglutarate 4-dioxygenase (proline 4hydroxylase)
gi|109089334
GO:0005488
Contig24448
249
0
5
0
0
-
1.55E-13
thyroid hormone receptor associated protein complex
component
gi|15020810
GO:0004872
Contig24646
476
0
3
0
2
-
1E-09
orphan 1
gi|51011003
b2g inferred
Contig25082
426
0
6
0
1
-
3.50E-29
centrin-1
gi|189540405
GO:0008026
Contig25216
461
0
2
0
3
-
1.83E-22
laminin isoform a
gi|47209921
b2g inferred
Contig25375
783
0
7
0
0
-
4.93E-39
envoplakin
gi|47214954
GO:0030154
Contig26975
411
0
0
0
5
-
2.32E-25
ring finger protein 38
gi|189514564
GO:0007286
Contig27102
487
0
0
1
4
4
5.82E-16
casein kinase delta
gi|224074484
GO:0009987
Contig27234
997
0
0
2
5
2.5
5.86E-18
senescence-associated protein
gi|13359451
b2g inferred
156
CHAPTER IV Seahorse Transcriptomics
Contig
length
(bp)
MID2
Norm/NP
MID3
Norm/PP
MID4
Unnorm/
NP
MID5
Unnorm/
PP
Fold
difference
evalue
Sequence description
GenBank
Accession
No.
annotation
Contig2908
531
0
31
0
2
-
7.32E-16
ferric-chelate reductase 1
gi|189538290
b2g inferred
Contig3063
611
0
20
0
0
-
1.02E-10
dumpy cg33196-pb
gi|47228008
b2g inferred
Contig3482
558
0
6
0
0
-
7.63E-21
heterogeneous nuclear ribonucleoprotein h3
gi|148233462
GO:0008380
Contig3602
620
0
5
0
0
-
1.20E-54
agrin
gi|47222749
GO:0005604
Contig3664
508
0
4
0
1
-
2.66E-14
aryl hydrocarbon receptor 1b
gi|68299588
GO:0004871
Contig3733
354
0
7
0
0
-
7.04E-22
nuclear oncoprotein skia
gi|6048269
GO:0005488
Contig3753
256
0
5
0
0
-
5.49E-14
thyroid hormone receptor associated protein complex
component
gi|15020810
GO:0004872
Contig3938
548
0
6
0
0
-
3.13E-37
slc9a3r2 protein
gi|189529308
GO:0065007
Contig3970
533
0
4
0
1
-
3.67E-23
bai1-associated protein 2-like 1
gi|62955633
GO:0003779
Contig4654
645
0
8
0
1
-
2.97E-22
zinc finger protein 598
gi|213624689
GO:0046872
Contig4797
588
0
8
0
1
-
3.57E-18
high choriolytic enzyme 1 precursor
gi|62122709
GO:0004222
Contig5124
425
0
4
0
1
-
3.62E-34
tuberous sclerosis 1
gi|47212214
GO:0032862
Contig6123
1141
0
4
2
6
3
2.41E-13
solute carrier family 39 (zinc transporter) member 6
gi|47199137
GO:0001837
Contig6149
492
0
5
0
0
-
8.89E-17
growth factor receptor-bound protein 7
gi|47217632
b2g inferred
Contig6199
857
1
1
1
5
5
2E-09
sterol regulatory element binding transcription factor 2
gi|47217021
GO:0030528
Contig6215
734
0
4
0
2
-
5.08E-14
laminin b2
gi|189515983
GO:0043256
Contig6242
269
0
7
0
0
-
1.57E-21
hyaluronoglucosaminidase 4
gi|189537618
GO:0006027
Contig6376
805
0
3
0
3
-
5.49E103
protocadherin 15
gi|47223231
GO:0001750
Contig6618
751
0
13
0
1
-
1.94E-56
tripartite motif-containing 23
gi|47228454
GO:0008047
Contig7735
378
0
5
0
0
-
3.75E-51
myotubularin related protein 6
gi|47210742
GO:0005737
Contig7751
581
0
5
0
0
-
2.88E-25
dna helicase hel308
gi|189533893
GO:0005488
Contig7752
490
0
5
0
0
-
1.09E-30
all-1 related protein
gi|3540281
GO:0005488
Contig7948
498
0
5
0
0
-
6.89E-27
integrin beta
gi|47217145
GO:0005178
Contig8909
470
0
6
2
4
2
1.46E-51
insulin receptor b
gi|18150106
GO:0006468
Contig956
317
0
1
1
5
5
6.48E-15
calmodulin 2
gi|119577831
GO:0005829
157
ACKNOWLEDGEMENTS
ACKNOWLEDGEMENTS
I am very much indebted to the many that have helped me so much in the
past few years. Without your help, support, supervision, care and “being-there” this
thesis would never have been possible.
I cordially thank Prof. Anthony B. Wilson for thesis supervision and
constant support throughout the past four years and my thesis committee
members Prof. Andreas Wagner and Prof. Tadeusz Kawecki for very helpful
suggestions and advice over the past years. Special thanks go to Prof. Sebastian
Bonnhoeffer, who, with his pointed suggestion during the 2005 course of
evolutionary biology in Guarda/Switzerland, gave me critical career incentives.
My very deep thanks go to Sabine Marty and Rosemarie Keller-Gruber.
Being constantly helpful and always providing caring support for me and my wife,
you made work in the Zoological Museum a pleasure. Yves Choffat provided
great support from the IT (and coffee- ) ends of research, and Thomas Bucher
helped with the sequencing duties – thanks a million for that!
Work and life in the laboratory would not have been the same without my
dear colleagues. My deep thanks go to you (and note the alphabetical order!),
Alexandra Wegman, Angela Fechner, Beat Mattle, Iris Eigenmann, Jasmin
Winkler, Lisa Palme, Marie-Emilie Gauthier, Morana Mihaljevic, Pascal
Hablützel, Stephan Zehnder, Valeria Fiorella Rispoli for all the great laughs we
had, for the good times and the support when work was piling up. You made the
difference!
With research projects ever growing in scale and difficulty, the present work
would not have been possible without the help of great colleagues and friends.
Thank you for putting up with me, for helping out when it was needed, and for the
right suggestions to get projects sorted. My thanks go to Dr. Christian Wüst, Dr.
David Berger, Dr. Erik Postma, Prof. Gerrit Gort, Prof. Luc Bussiere, Prof.
Lukas Keller, Marco Demont, Dr. Martin Schäfer, Dr. Peter Wandeler Dr.
Stephanie Bauerfeind, Prof Wolf Blanckenhorn. Of outstanding support were
also Dr. Marzanna Künzli, Dr. Ralph Schlapbach, Dr. Rémy Bruggmann, Dr.
Sirisha Aluri and Dr. Weihong Qi from the functional genomics centre in Zurich.
Thanks a lot for all your support on the 454 sequencing and associated issues.
Without the right supervisors early on in my studies I would, very likely, not
have chosen to follow the bumpy but satisfying road into evolutionary biology. It is
due to Prof. Tomas Hrbek and Prof. Izeni Farias that I did, and I enjoy it a lot.
And without Prof. Michael Arnold I would not be where I am - Thank you so much
for all your support!
Special thanks for their kind friendship, their support and help are due to
(almost) twelve fine young men: Lukas Schreiber, Cedric Laghi, Daniel Wyss,
Mehi Satgunarajah, Tobias Bhend, Travis Hood and Giuseppe Damiano.
158
ACKNOWLEDGEMENTS
I would have never reached the place I am at now without my parents, Ingrid and
Dr. Siegfried Stölting. Thank you so much for all you did!
My deepest thanks will as always go to my wife Meline Nogueira Lucena
Stölting. Thank you for leaving everything behind and being here with me, for
your deep care, kind support, your love and understanding.
Lastly, I wish to gratefully acknowledge financial support from the
Forschungskredit der Universität Zürich, without which the present work would
not have been possible.
159
CURRICULUM VITAE
CURRICULUM VITAE
Name
Vorname
Geburtsdatum
Heimatort
Ausbildung
1991-1998
1998
1998-1999
1999-2003
2003
2004
2005
2006-2010
Stölting
Kai Nikolas
12. April1979
Bad Kreuznach/Deutschland
Niedersächsisches Internatsgymnasium Bad Bederkesa (NIG)
Abitur (Allgemeine Hochschulreife) am NIG
Wehrdienst
Biologiestudium an der Universtät Konstanz,
Vertiefungskurse in Evolutionsbiologie, Neurobiologie,
Limnologie, Fischökölogie
Diplomprüfung :Tierphysiologie und Limnologie
Diplomarbeit in Evolutionsbiologie bei Prof. Axel Meyer
Titel: The Midas Cichlid Species Flock: Incipient Sympatric
Speciation?
Forschungsassistent Labor Prof. Axel Meyer, Konstanz
Dissertation am Zoologischen Museum der Universität Zürich
unter der Leitung von Prof. Anthony B. Wilson
Titel der Dissertation: Male Pregnancy in the Seahorse
(Hippocampus abdominalis): Investigating the Genetic
Regulation of a Complex Reproductive Trait
Publikationen
1.
Stölting KN, Gort G, Wüst C, Wilson AB. 2009. Eukaryotic transcriptomics
in silico: Optimizing cDNA-AFLP efficiency. BMC Genomics, 10, 565.
2.
Bussiere LF, Hunt J, Stölting KN, Jennions MD, Brooks R (2008) - Mate
choice for genetic quality when environments vary: suggestions for
empirical progress. Genetica, 134(1), 69-78.
3.
Michel C, Hicks BJ, Stölting KN, Clarke AC, Stevens MI, Tana R, Meyer A,
van den Heuvel MR. 2008. Distinct migratory and non-migratory ecotypes
of an endemic New Zealand eleotrid (Gobiomorphus cotidianus) implications for incipient speciation in island freshwater fish species. BMC
Evolutionary Biology, 8, Article 49.
4.
Bleher H, Stölting KN, Salzburger W, Meyer A. 2007. Revision of the
Genus Symphysodon Heckel, 1840 (Teleostei: Perciformes: Cichlidae)
based on molecular and morphological characters. Aqua 12(4), 133-174.
5.
Stölting KN, Wilson AB. 2007. Male pregnancy in seahorses and pipefish:
Beyond the mammalian model. BioEssays, 29, 884-896.
6.
Van den Heuvel M, Michel C, Stevens MI, Clarke AC, Stölting KN, Hicks
BJ, Tremblay LA. 2007. Monitoring the effects of pulp and paper effluents is
restricted in genetically distinct populations of common bully
(Gobiomorphus cotidianus). Environmental Science & Technology 41 (7),
2602-2608.
7.
Luo J, Lang M, Salzburger W, Siegel N, Stölting KN, Meyer A. 2006. A
BAC library for the goldfish Carassius auratus auratus (Cyprinidae,
160
CURRICULUM VITAE
8.
9.
10.
11.
Cypriniformes). Journal of Experimental Zoology B Mol. Dev. Evol. 306(6),
567-574.
Barluenga M, Stölting KN, Salzburger W, Muschick M, Meyer A. 2006.
Evolutionary biology: Evidence for sympatric speciation? (Reply). Nature,
444, E13.
Barluenga M*, Stölting KN*, Salzburger W*, Muschick M, Meyer A. 2006.
Sympatric speciation in Nicaraguan crater lake cichlid fish. Nature 439, 719723.*equal contribution
Hrbek T, Stölting KN, Bardacki F, Kücück F, Wildekamp RH, Meyer A.
2004. Plate tectonics and biogeographical patterns of the Pseudophoxinus
(Pisces: Cypriniformes) species complex of central Anatolia, Turkey.
Molecular Phylogenetics and Evolution 32, 297-308.
Hrbek T, Kücück F, Frickey T, Stölting KN, Wildekamp R and Meyer A.
2002. Molecular phylogeny and historical biogeography of the Aphanius
(Pisces, Cyprinodontifomes) species complex of central Anatolia, Turkey.
Molecular Phylogenetics and Evolution 25, 125-137.
Eingeworbene Fördermittel
1. Forschungskredit der Universität Zürich: ~90,000CHF
2. Internal Grants des Zoologischen Museums der Universität Zürich:
7,500CHF
161


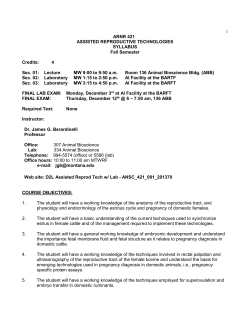


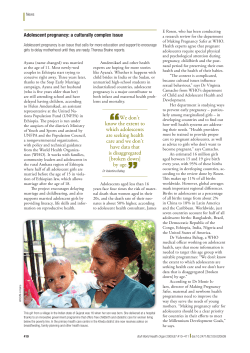


© Copyright 2026