
Going Global with Google
Going Global with Google
18th March 2015
João Nunes,
Online Business Consultant
Google Confidential and Proprietary
Cost
Time
Uncertainty
Common growth barriers...
Today with the Internet
Less cost, less time, less uncertainty
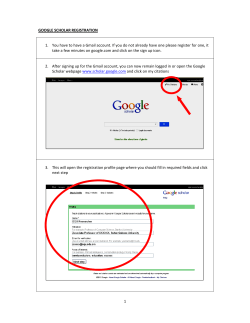
Consider growth outside your domestic market
New potential
with Export
Growth in Domestic
Market
April ‘13
May ‘13
June ‘13
July ‘13
Augustl ‘13
September ‘13
October ‘13
November ‘13
December ‘13
Export is the solution to grow when your
growth in the domestic market has slowed down
January ‘13
February ‘13
March ‘13
1. Capture
International
Demand
2. Recognize
Value
3. Scale &
Automate
Share of Voice
Profits & CLV
Share of Automation
Free Google Export Resources
1
2
Consumer Barometer
Our Mobile Planet
Google Trends
thinkwithgoogle.com/mobileplanet
www.consumerbarometer.com
4
3
5
Export Strategists with
Industry Insights
www.google.com/trends/hottrends
6
Country insights /
business maps
Global Market Finder
translate.google.com/globalmarketfinder
www.thinkwithgoogle.com/intl/en-gb/collection/export-tools/
Seasonal calendar based on category
demand to optimize campaign timing
Jan
Feb
Mar
Apr
May
Jun
Jul
Aug
Sep
Oct
Proposed content fight
Nov
Dec
Communicate In Any Language
Google Translate Plug-in, App translation,
Translate Toolkit etc.
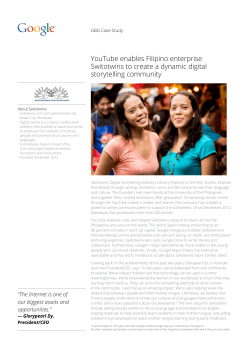
Reach New Customers
in New Markets with Global Market Evaluator
Operational Considerations, Countries Rated by Ease
Market Size ($bn)
Netherlands
Norway
USA
Ease of Payment
Processing
English
Proficiency
avg CPC’s
5.9
1.6
160.2
Australia
4.4
Germany
29.3
Singapore
0.7
Greece
0.5
Philippines
0.3
Turkey
1.6
South Africa
1.0
China
44.0
Egypt
0.2
Russia
12.0
Morocco
0.2
India
1.4
Quick charts & tables showing
opportunities
The Natives and Player are countries
with a high digital readiness for companies
e-Intensity Score
upcoming
Natives
Natives
Player
Straggler
Aspirant
Per-Capita-Income (Tsd.$)
Source: The Boston Consulting Group: “The Internet Economy in the G-20: The 4.2 Trillion Opportunity”, 2013
e-Intensity Score: Broadband Penetration, Surf-Geschwindigkeit, Internetnutzung, Online-Umsatz und -Werbung
Develop local relevant strategies
Electronic
payments
Shipping and
Logistics
Custom, Taxes
and Duties
Insurance
Legal
Customer
Support (24/7)
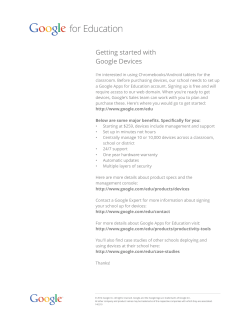
e.g. Payment options need to be flexible by geo
Online Payment Preferences by Country
Denmark, France, UK and USA all
predominantly use cards to pay online....
...other geographies use a much broader set
of payment options
e-Wallets are only
really gaining
traction in the
Nordics
iDeal system in
Netherlands is
very popular
Offering
invoices / bank
transfer options
in Germany is
important
PayPal is strong in
France, UK and
USA
e-Wallets
Cash on Delivery
Invoices / Offline Transfer
PayPal
Online Bank Transfer
Cards (Credit & Debit)
France
UK
USA
Source: ibid, Innopay, OC&C analysis
Norway
Germany
Sweden
Finland
Netherlands
27
_v1
Denmark
2. Recognize
Value
Make better investments by measuring
the full customer journey
On high level
OUR GUIDANCE ON HOW TO MEASURE WHAT MATTERS MOST
1. Attribute value across entire customer journey
2. Measure customers, not just transactions
3. Focus on true business objectives
Each media reaches user in different stages
Take Attribution into account for your Marketing activities
SOCIA
L
SE
O
S O C IA L
SE
O
DISPLAY
DISPLAY
YOUTUBE
YOUTUBE
SEM
SE
O
AFFILIATES
DISPLAY
YT
SEM
EMAIL
SEE
THINK
SEM
EMAI
L
DO
Get to know your best (and worst) customers
1. Who are they?
2. Where did they come from?
3. How long do they stay?
4. How much do they spend?
5. How much do they cost?
The customer journey
has grown more complex ...
New types of conversions
In-store visits
App download
& in-app
purchases
mCommerce
Click to Call
Crossdevice
Measure
everything
Set-up measurement in order to maximize consumer insights
Customer journey span the web, crossing platforms and devices as consumers interact online
Cost per view In-Store visits Transactions
Frequency Assisted Conversio
Shares, +1 Openings rates
CPC
New
Users
CPM
Click-Through Rates
Cost per Lead
Bounce rate
Brand lift
Reach
Unique Users
ROAS
Average Order value
ROI Signups
Life-time value
Subscriber
Brand Recall
Click Impressions
Visits
Pageviews
s
CPA
Average revenue per Us
s
Interactio
Views
Install Call
in-App Purchases
ns
Profits
s
GRPs
s
Align your metrics with your core business goals
If your company’s biggest goal is to increase profits, then your marketing metrics
should show how your campaign contributed to profits.
Which advertiser is doing better?
CPA
1
€50
ROI
20:1
2
€100
10:1
Lets take an AdWords example
CPC
Actual
Potential
Cost
CPA
CVR
Bid Change
Revenue
ROI
Profit
€0.40
€5,552.32
€16.23
2.48%
-50.00%
€92,340.00
16.63
€22,149.68
€0.55
€13,132.80
€22.72
2.43%
-25.00%
€156,060.00
11.88
€33,685.20
€0.62
€19,744.35
€26.68
2.34%
-10.00%
€199,800.00
10.12
€40,195.65
€0.67
€26,565.18
€29.62
2.27%
0.00%
€242,190.00
9.12
€46,091.82
€0.71
€33,148.23
€31.87
2.23%
10.00%
€280,800.00
8.47
€51,091.77
€0.75
€42,666.97
€34.41
2.18%
25.00%
€334,800.00
7.85
€57,773.03
€0.79
€55,640.50
€36.37
2.18%
50.00%
€413,100.00
7.42
€68,289.50
€0.86
€80,910.44
€40.46
2.14%
100.00%
€540,000.00
6.67
€81,089.56
€0.99
€130,152.85
€48.03
2.07%
200.00%
€731,700.00
5.62
€89,357.15
€1.10
€175,502.43
€54.84
2.01%
300.00%
€864,000.00
4.92
€83,697.57
avg.
Performance
Max
Profit
$10 Margin per Buyer PROFIT Total Profit vs. Ad Spend Efficiency* -‐$4 * Measured in ROI of ad spend, aka ROAS $8 $7 $7 $7 $6 $5 $3 CPA $2 $3 $3 $3 $4 $5 $7 $9 11 14 1st 2nd 3rd 4th 5th 6th 7th 8th 9th 10th 11th Bid strategy A: Max CPA = $2 High ROI: 400% Small Total Profit: $16 Bid strategy B: Max CPA = $10 OR Low ROI: 40% Large Total Profit: $53 ?
“The higher your ROI is the more
profit you are probably losing”
Same applies also for Internationalization
CPA
Conversions
Margin per
Conversion
Gross Margin
SEM Investment
ROI
Profits
Domestic
$50
$50
10
$1,000
$10,000
$500
20
20 :: 11
$9,500
New
market
$100
30
$1,000
$30,000
$3,000
10 : 1
$27,000
$27,000
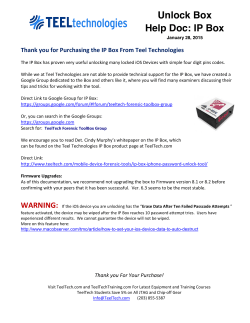
Key idea: Increase your profits from internationalization
Measure Margin per-buyer (CLV)
not per-order (AOV)
$41 Conv. Value (Revenue) $1 $ 40 $ 30 Profit Margin $ 42 $9
1 $ 80 Day of user’s Day 5 aWer First Conv. First Conv. Month 2 aWer First Conv. Here: CLV (30 days) = $1 + $30 = $31 CLV (3 months) = $40 $ 12 $8 Month 4 aWer First Conv. CLV (1 year) = $52 Year 1 aWer First Conv. Performance KPI evolution
Customer Equity -‐ CLV Profit Clicks / Impressions Conversions (CPA) ROAS / ROI IDEAL SCENARIO IDEAL SCENARIO Align metrics with your business goals
Profit
With this data...
Conversions
Clicks
Revenue
Top-line
revenue driver
Bottom-line
profit driver
Cost
center
Spending
money
...you can optimize
to these goals
Always put Data into context
Google Analytics :
1. Compare campaign performance against each other, compare with site averages (bounce rate..)
2. Understand seasonality & compare Performance over time, per market
Other useful Google Tools
1. Use Google Trends to monitor Brand awareness against peers
2. Use Display Benchmark tool to assess your Brand campaign Performance
Find all of these tools at thinkwithgoogle.com
Make sure your teams are all aligned
Shared
Objective :
Digital Marketing
CRM marketing
Search marketing
Brand marketing
Mobile marketing
Social marketing
}
Profits
Profits
Shared Data :
1 single
source of truth
e.g. Analytics
Profits
Traditional Marketing
{
TV marketing
Radio marketing
Outdoor marketing
Press marketing
in-store marketing
Pure E-Commerce Model
857,566 visits
Google ad
€900K
17,151
customers
website with pure
ecommerce only
€50
12
average
order value
purchases
in 3 years
paying
customer
2% conversion rate
17,151 customers
25%
margins
1.3
referral
rate
€195
per customer
= €3.3M gross margin - €0.9M investment = €2.4M profit
Multi-channel E-Com Model
857,566 visits
Google ad
€900K
85,755
customers
website with pure
ecommerce only
€50
12
average
order value
purchases
in 3 years
online
paying customer
2% conversion rate
17,151 customers
25%
margins
1.3
referral
rate
in store
paying customer
4X offline multiplier
68,604 customers
€195
per customer
= €16.7M gross margin - €0.9M investment = €15.8M profit
Google uses Profit model as well
Revenue per
Unit
$35
Cost to
produce
($30)
Play Store
Transactions
$10/yr
Loyalty /
Upsell
(1.6x)
3. Scale
Scale and automate to achieve
your business objectives
Automation
● Real-Time Bidding
Performance ● Powerful auction signals
& Time Savings ● Do more with Less
Control & Flexibility
● Customization & Reporting
● Scaled Ad Formats
● Move from Labor intensive to Value
intensive
Auto bidding Tools - small steps
lead to big results over time
CPA
-10%
-10%
30€
-10%
-10%
-10%
18€
0€
Week 1
Week 2
Week 3
Week 4
Week 5
Week 6
€
3 Key Principles for success
Principle #1 | Adopt a growth mindset
Customers per week
6x growth in
4 months!
Average CPA per week
Don’t panic
“The way to grow is to think about growth first, efficiency second
and be patient with tests to give them time to work.”
RICHARD COHENE
Director of Marketing| Beyond the Rack
Principle #2 | Optimize holistically, not granularly
OPTIMIZING ENTIRE ACCOUNT
TO €50 CPA
OPTIMIZING EVERY TACTIC
TO €50 CPA
display
€90
€50
mobile search
€90
€50
generic desktop search
€80
€50
brand desktop search
€20
€20
Overall CPA
€50
€40
# conversions
100
70
€5000
€4200
KEYWORD
Profits (€100 per conversion)
“I used to obsess over the results of each tactic we used with Google. Now, I look at the
overall results and trust my team to hit our overall goal. It’s helped the team test new
things”
RICHARD COHENE
Director of Marketing| Beyond the Rack
Principle #3 | Think quarterly
Advertiser optimizing to €50 CPA daily
Advertiser optimizing to €50 CPA quarterly
Testing
Optimizing
Result: lower growth
Result: higher growth
Split your marketing into a performance budget that has to
hit specific metrics + a test budget to look for new growth
THANK YOU!
[email protected]
Google confidential


© Copyright 2026